Article

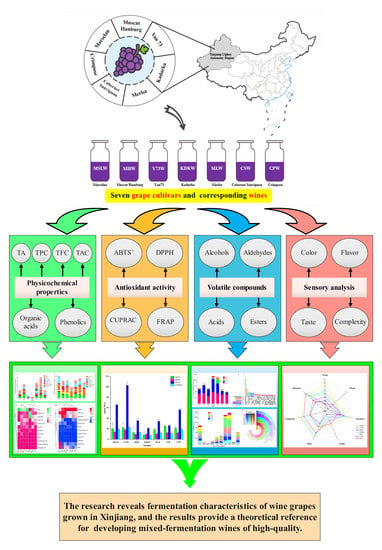
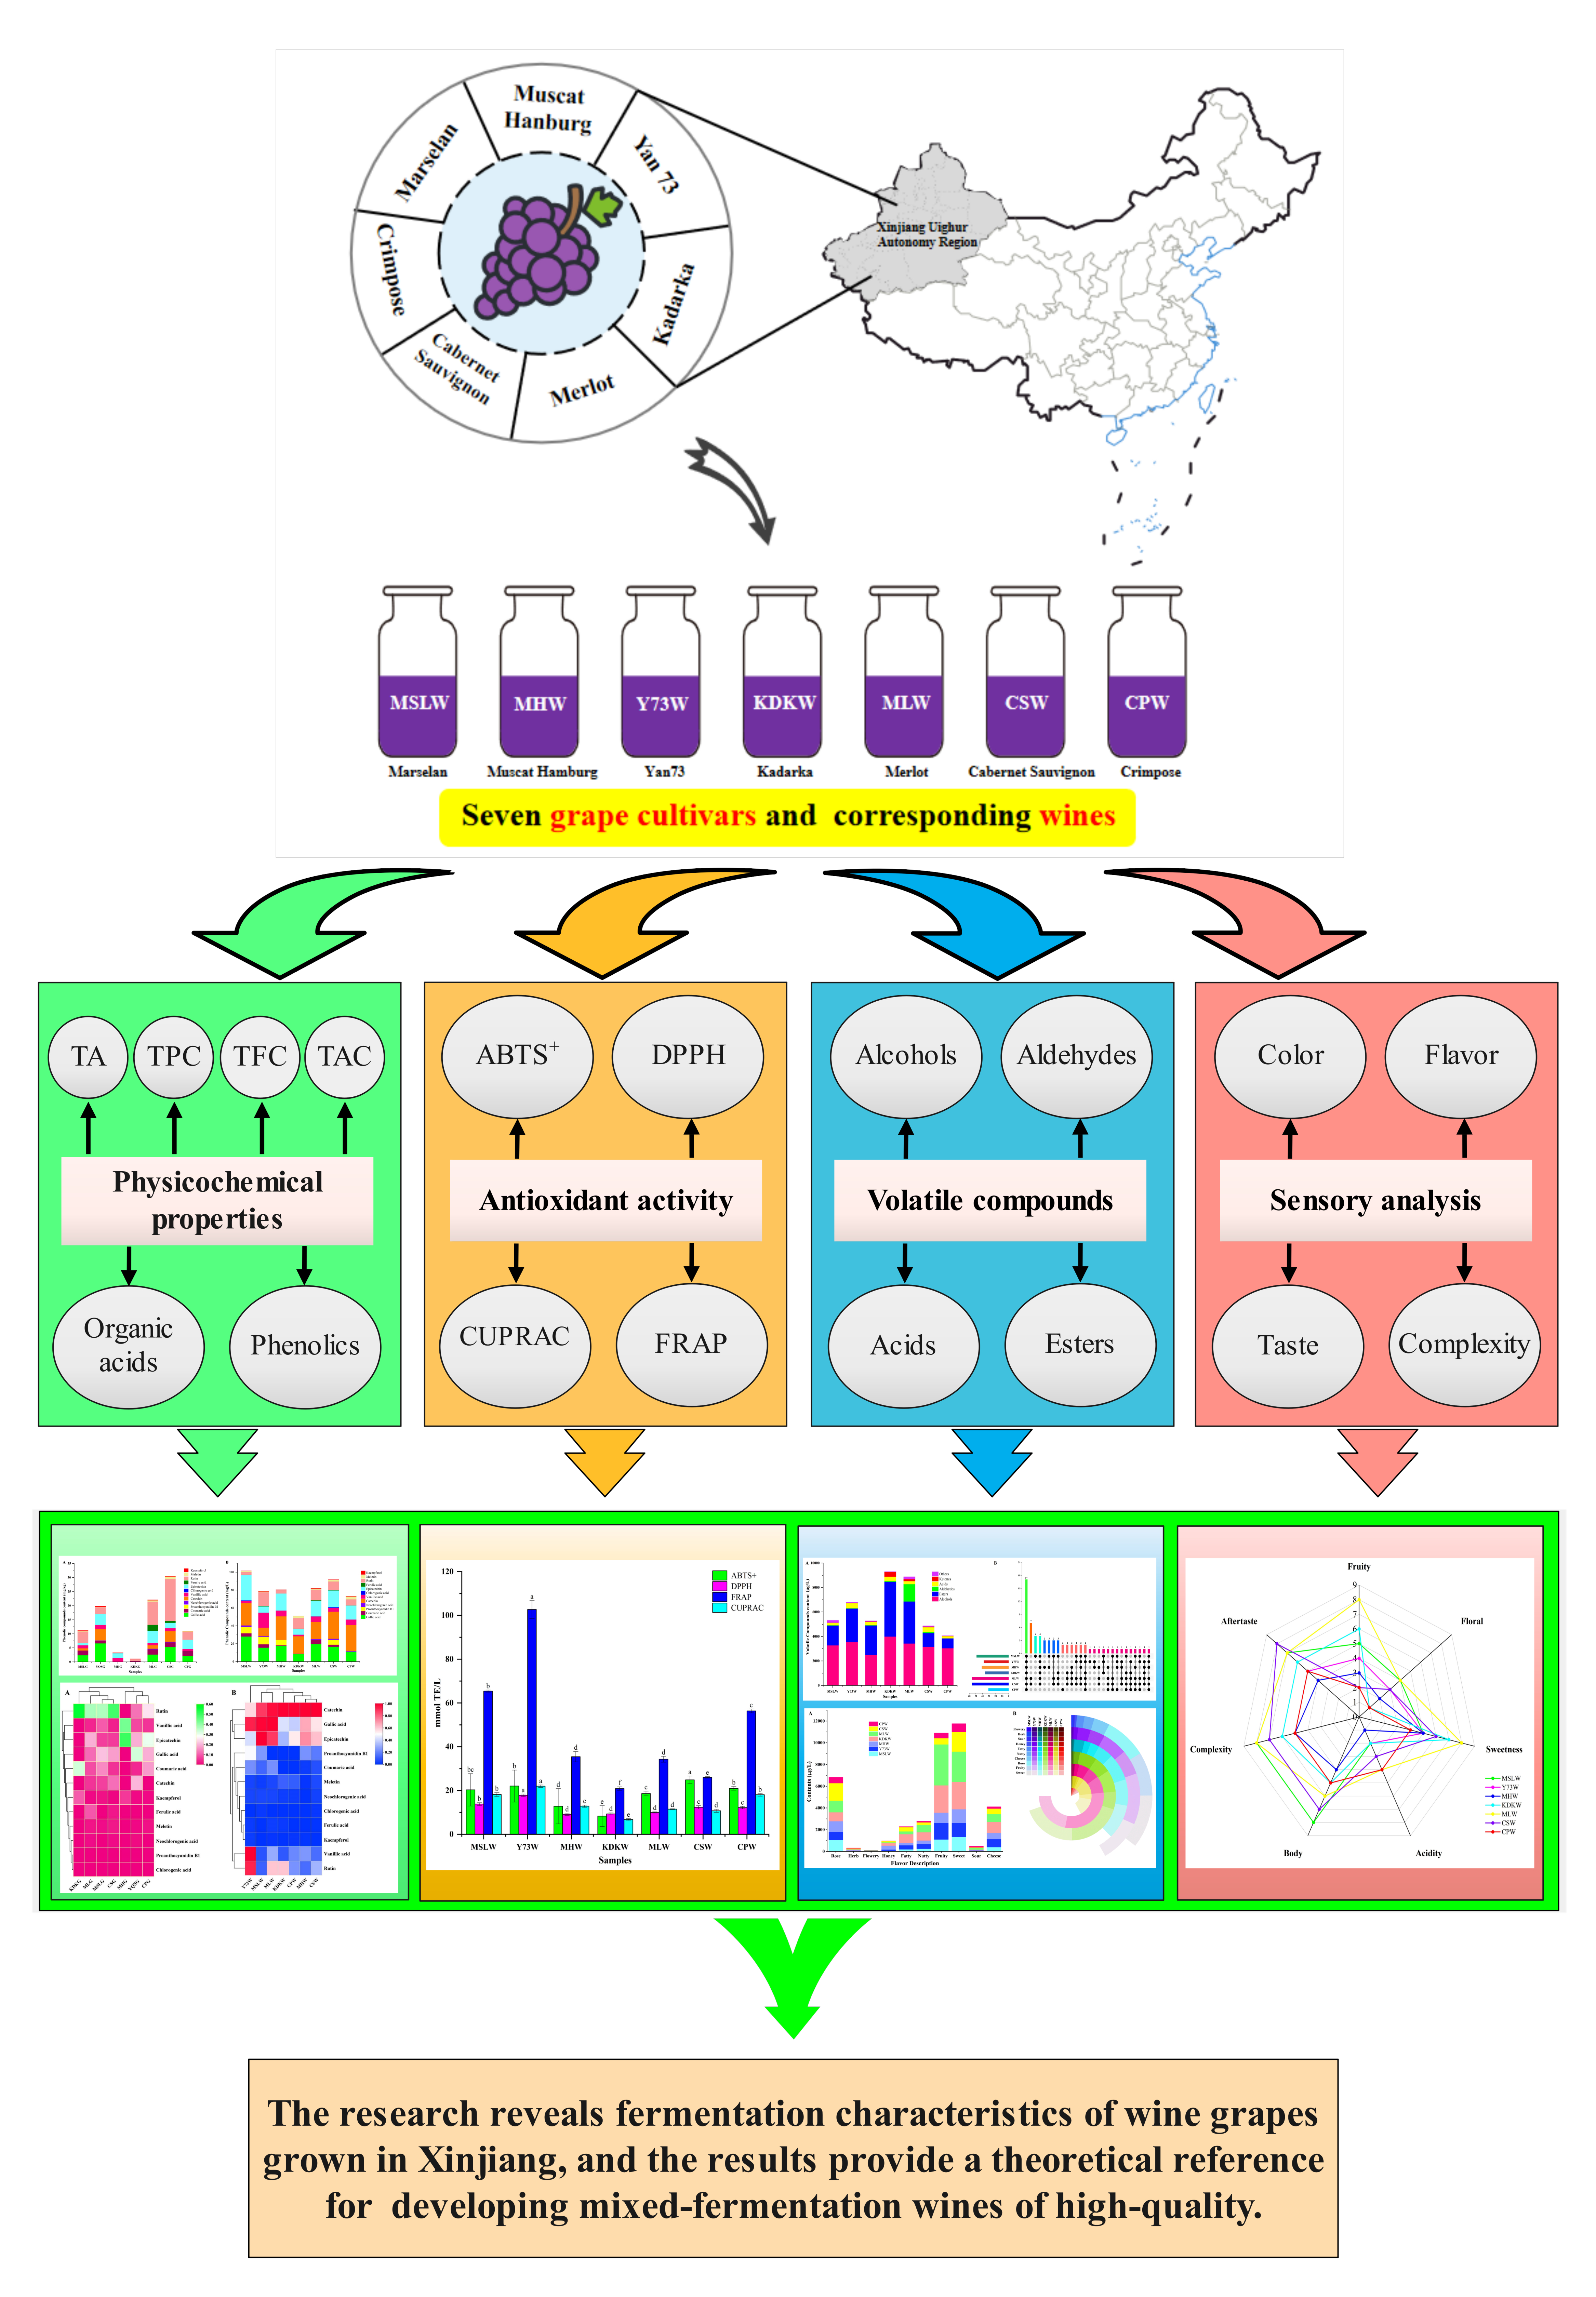
Chemical and Sensory Characteristics of Different Red Grapes Grown in Xinjiang, China: Insights into Wines Composition

1
Food College, Shihezi University, Shihezi 832000, China
2
Wuwei Occupational College, Wuwei 733000, China
*
Authors to whom correspondence should be addressed.
These authors contributed equally to this work.
Fermentation 2022, 8(12), 689; https://doi.org/10.3390/fermentation8120689
Submission received: 4 November 2022 / Revised: 21 November 2022 / Accepted: 23 November 2022 / Published: 29 November 2022
(This article belongs to the Special Issue Perspectives on Microbiota of Fermented Foods)

Abstract

:
Globally, the red wine market experienced a rapid growth in the last decade, due to the superior colour, taste, and nutritional quality. The red grapes used for vinification have individual characteristics varying within the regional environment. In this study, the quality of seven grape cultivars, including Marselan, Yan 73, Muscat Hamburg, Kadarka, Merlot, Cabernet Sauvignon, and Crimpose, and their corresponding wines, were investigated based on high-performance liquid chromatography and headspace solid-phase microextraction coupled to gas chromatography–mass spectrometry. These techniques were performed to analyze the chemical compositions and volatile compounds of the tested samples, respectively. The results showed that tartaric acid (29.96% to 73.45%) and rutin (12.53% to 56.54%) were the dominant organic acid and phenolic compounds in grapes, respectively. Higher concentrations of organic acids and phenolic compounds, and the types of volatile compounds, were observed to be highest in the Cabernet Sauvignon grape. The antioxidant activity of wines ranged from 6.74 to 102.68 mmol TE/L, and Yan 73 wine had the highest antioxidant activity. A total of 69 volatile compounds consisting of 17 alcohols, 26 esters, 5 aldehydes, 9 acids, 7 ketones, and 5 other volatile compounds were identified in all tested wines, and 11 important aroma active substances (odor activity value > 1) were selected, consisting of β-ionone, phenethyl acetate, geranyl acetate, ethyl 9-decenoate, ethyl caprate, ethyl pelargonate, decanal, ethyl caprylate, 6-methyl-5-hepten-2-one, methyl 2-hexenoate, and ethyl hexanoate, which endow wines with a unique aroma. This work clearly describes the chemical and sensory characteristics of seven red grape cultivars in Xinjiang of China and provides diversity options for cultivars for winemaking.

Graphical Abstract

1. Introduction

Wine is a popular beverage produced from the complete or partial alcoholic fermentation of fresh grape berries or grape juice [1]. Wine can be classified into red, white, and rose wine based on its colour [2]. The process of red wine inoculated fermentation involves the following four stages: impregnation, alcoholic fermentation, malolactic fermentation, and aging [3]. The unique components originating from red grape skins and seeds, such as anthocyanins and tannins, are integrated into the fermentation broth during impregnation process [4], and have been reported as vital for the colour of red wine and closely correlated with its commercial value [5]. Sugar and acid in grapes determine the alcohol level and main flavor of wine [6]. The species and concentration of organic acids has connected closely with the style and quality of wine, such as in regulating acid-base balance and, consequently, impacting on the sensory, color, flavor, microbiological, and physicochemical stability [7]. Polyphenols are important constituents in wine, contributing the sensory properties and antioxidant activity of wine [8]. As some research showed, wine grape characteristics can be highly specific to grape cultivar [9], and though the fermentation process has a crucial effect on wine quality [10], the effects were weakened by using similar equipment, starter, and process flow [11]. Furthermore, Huang et al. [12] found that wine grape quality also depend on geographical factors, and it is greatly impacted by climate [13], soil [14], water quality [15], and microbes [16].
In the wine industry, Cabernet Sauvignon grape is widely used in winemaking process due to its characteristics of easy planting, higher tannin content, deeper color, complex flavour, and abundant style. The homogeneity phenomenon of the wine style was gradually exposed due to the same grape cultivar and fermentation process. Nowadays, red wine brewers have gradually focused on the innovation and complexity of red wines. Therefore, using good red grape cultivars and improving brewing techniques has become an important issue in international brewing. Some grape cultivars may be rich in some beneficial ingredients, such as anthocyanins and polyphenols, while others may be defective, so some varieties may need to be mixed with others for vinification to make up for their deficiencies. Additionally, as Izquierdo-Llopart et al. [17] found, red wine made by blending different cultivars had more balanced flavors and stronger antioxidant activities.
China cannot be ignored as one of the main red wine producing countries in the world [18]. The Xinjiang Uygur Autonomous Region is a historic and principal wine-making region in China with a total annual grape output of 1.1 million tons from an 80,000 hm2 vineyard [19]. Four major wine-production areas in Xinjiang, named Tianshanbeilu, Yili, Yanqi, and Hami, have been developed and certified, and Cabernet Sauvignon is the major wine grape variety [20]. Therefore, in order to improve the quality of red wine, this study selected seven local red grape cultivars in Xinjiang (China), namely Marselan (MSL), Yan 73 (Y73), Muscat Hamburg (MH), Kadarka (KDK), Merlot (ML), Cabernet Sauvignon (CS), and Crimpose (CP), and used high-performance liquid chromatography (HPLC) and headspace solid-phase microextraction coupled with gas chromatography–mass spectrometry (HS-SPME/GC-MS) technologies to determine various indexes of seven red grape cultivars and corresponding red wines, including classic physiochemical indexes, antioxidant indicators, color, and volatile compounds. Thus, this study aims to evaluate the chemical and sensory properties of different red grapes and wines, by comparing their levels of different indexes, and the results may provide a good experimental basis for the blending fermentation of different varieties of red grape.

2. Materials and Methods

2.1. Wine Samples

Grape samples of seven cultivars, namely Marselan (MSL), Yan 73 (Y73), Muscat Hamburg (MH), Kadarka (KDK), Merlot (ML), Cabernet Sauvignon (CS), and Crimpose (CP), were collected at optimum maturity (≧20 degrees Brix) [21] from Xinjiang Zhongxin Guoan Grape Wine Co. Ltd. at the Manasi County of Xinjiang Province in China in October, 2021. After sampling, some basic indicators of grape berries were determined immediately, including the pH, total sugar, and total acidity [22]. For each grape cultivar, 5000 g fresh grapes were destemmed, crushed, and then added into a 10 L glass fermenter from Sichuan Huatong World Trade Co., Ltd. (Chengdu, China) for vinification. After destemming and crushing, 20 mg/L pectinase and 45 mg/L free SO2 were added into the fermenter, in order to play the important roles of increasing the grape juice extraction rate and sterilizing miscellaneous bacteria, respectively. The grape mash was macerated at 8–10 °C for 48 h, followed by the addition of 200 mg/kg commercial Saccharomyces cerevisiae RC212 for the alcoholic fermentation. All fermentations were performed at 25 °C under static conditions. Finally, all wine samples were sealed into 500 mL glass bottles and stored at −80℃ until further analysis. Each grape variety sample was fermented in triplicates. Additionally, all grape samples were named as “Fruit Name Abbreviation + G”, and all wine samples were named as “Fruit Name Abbreviation + W”. For example, “MSLG” represents “MSL grape”, while “MSLW” represents ”MSL wine”. The alcoholic fermentation was considered to be completed when residual sugar content was <4 g/L and, at this time, the relative density of wine was below 0.995. After alcoholic fermentation, skin residue separation was performed, and all samples were protected with 50 mg/L free SO2 before bottling.

2.2. Analytical Determinations

2.2.1. Determination of Classic Physicochemical Indexes

The pH value of wines was determined by a calibrated pH meter (model PHSJ-3CF; Shanghai Jingke, Shanghai, China). Total acidity and ethanol content were evaluated using the OIV methods (International Organisation of Vine and Wine methods, 2012). Total sugar was measured by the dinitrosalicylic acid (DNS) method [23], and the samples’ absorbance were analyzed by spectrophotometer (Labo) with the visible detector at the 520 nm wavelength (y = 0.5866x − 0.0096, R2 = 0.9992). Organic acids of all samples were analyzed by high-performance liquid chromatography (HPLC) according to Murtaza’s methods [24] with some modifications. All organic acid standards were dissolved in deionized water, diluted to different concentrations gradient, and different standard curves were drawn, as follows: tartaric acid (y = 1 × 10⁶x − 209.52, R2 = 0.9994), malic acid (y = 570,878x − 2974.6, R2 = 0.9997), lactic acid (y = 421,430x − 325.29, R2 = 0.9982), quininic acid (y = 405,419x − 464.73, R2 = 0.9977), oxalic acid (y = 5 × 10⁶x − 24,147, R2 = 0.9991), citric acid (y = 579,209x + 861.07, R2 = 0.9996), and succinic acid (y = 290,500x + 2219, R2 = 0.999). Each sample was centrifuged and then filtered through a 0.22 μm nylon membrane, and organic acids were identified through HPLC equipped with an Agilent ZORBAX SB-C18 column (4.6 × 150 mm i.d., 5 μm, Dima Technologies, Shanghai, China). The column oven temperature was maintained at 20 °C. The injected sample volume was 10 μL, and the mobile phase was a mixture of 1 mmol/L K2HPO4 (pH 2.0) and 3% methanol, with the flow rate of 1 mL/min. A UV detector (Diamonsil Plus, China) was used to accomplished peak detection at 210 nm. All sample were measured in triplicate.

2.2.2. Determination of Total Phenolic, Total Flavonoid and Total Anthocyanin Content

Total phenolic content (TPC) was measured by the Folin–Ciocalteu method, which is based on Andlauer’s described procedure [25] with some modifications. The TPC of the samples were calculated using the standard curve of gallic acid (y = 0.0009x + 0.0112, R2 = 0.9992), with gradient concentrations (0, 200, 400, 600, 800, 1000 mg/L) as the independent variable and corresponding absorbances as the dependent variable. The results were expressed by gallic acid equivalents (GAE, mg/L). Absorbances were measured at 765 nm with water as a blank. Total flavonoid content (TFC) was determined by the previous method [26] with some modifications. The TFC of the samples were calculated using the standard curve of rutin (y = 0.0021x − 0.0007, R2 = 0.9997), with gradient concentrations (0, 50, 100, 150, 200, 250, and 300 mg/L) as the independent variable and corresponding absorbances as the dependent variable. The results were expressed as rutin equivalents (RE, mg/L). The absorbance was determined at 510 nm with a spectrophotometer, and ultrapure water was used as a background control instead of a wine sample. Total anthocyanin content (TAC) was estimated by the pH differential absorbance method [27]. Briefly, 0.5 mL sample was added to 20 mL glass test tube and diluted 20 times with hydrochloric acid/sodium chloride buffer (pH 1.0) and acetic acid/sodium acetate buffer (pH 4.5), respectively. Then, the absorbance of the two diluents was measured at 510 nm and 700 nm, respectively, with a spectrophotometer. All determinations were carried out in triplicate. The final absorbance of the wine samples was calculated as follows:
A = (A510nm − A700 nm)pH 1.0 − (A510nm − A700nm)pH 4.5
Total anthocyanin content depended on the absorbance value, and the content was expressed by cyanidin-3-O-glucoside equivalents (CGE, mg/L). The TAC was calculated by using the following equation:
CGE (mg/L) = (A × MW × DF × 1000)/(ε × 1)
where CGE is cyanidin-3-O-glucoside equivalents, A is the final absorbance, MW is relative molecular mass of cyanidin-3-O-glucoside (449), DF is dilution ratio, and ε is the molar extinction coefficient.

2.2.3. Determination of Phenolic Compounds

Procedures used for the extraction of phenolic compounds in grape berries or red wines were described in detail by Briz et al. [28]. After extraction, polyphenols were identified and quantified by the HPLC method. An analytical column, namely a Dikma C18 column (5 μm, 150 × 3 mm i.d.; Diamonsil Plus Technology, China), with a ground column, namely a Pelliguard LC-18 (40 mm, 50 × 4.6 mm i.d.; Supelco, Bellefonte, PA, USA), was used for separation of phenolic acids, anthocyanins, and flavonols. Binary gradient elution was used as follows: mobile phase A, methanol; mobile phase B, ultra-pure water (pH 2.6). Elution procedures were as follows: gradient, 5% A at 0 to 20 min, 25% A at 20 to 35 min, 40% A at 35 to 55 min, 95% A at 55 to 60 min, 5% A at 60 to 65 min; flow rate, 0.8 mL/min; column temperature, 30 °C; injection volume, 20 μL; and UV detector wavelength, 280 nm.
Phenolic compounds were identified according to retention times (RI) and chromatographic spectra of samples with gallic acid (y = 27,204x − 47,454, R2 = 0.9983), coumaric acid (y = 15,974x − 500.35, R2 = 0.9988), proanthocyanidin B1 (y = 5915.2x − 480.33, R2 = 0.9992), neochlorogenic acid (y = 23,615x − 423.15, R2 = 0.9986), catechin (y = 6565.5x − 320.98, R2 = 0.9986), vanillic acid (y = 16,920x − 258.16, R2 = 0.9959), chlorogenic acid (y = 20,127x + 317.66, R2 = 0.9959), epicatechin (y = 6562.3x − 126.95, R2 = 0.9973), ferulic acid (y = 48,080x − 802.96, R2 = 0.9977), rutin (y = 14,368x + 183.97, R2 = 0.999), quercetin (y = 27,355x − 497.69, R2 = 0.9925), and kaempferol (y = 32,419x − 177.7, R2 = 0.997) standards. Phenolic compounds were quantified using calibration curves by standards. All determinations were performed in triplicate.

2.2.4. Determination of Antioxidant Activity

The DPPH radical scavenging activity of all tested samples was measured according to the method described by Stopka et al. [29] with some slight modifications. Here, 25 μL of sample was mixed with 975 μL of DPPH solution in a test tube and left in the dark for 30 min before measuring the absorbance at 517 nm. Here, EtOH was used as a blank sample. The ABTS+ radical scavenging activity of all samples was evaluated based on a previous study [30]. For the CUPRAC analysis, the procedures were described in detail according to research by Apak et al. [31]. The absorption was measured at 450 nm, using water as a blank sample. The FRAP method described by Di et al. [32] was used with slight modifications. Red wine was diluted at the ratio of 1:10 (v/v) with dH2O, and 0.15 mL of diluted wine sample was mixed with 2.85 mL FRAP reagent for 30 min in the dark. Then, the absorbance was determined at 593 nm. All antioxidant activity indexes were expressed as Trolox equivalents (μmol TE/L). All analyses were carried out in triplicate.

2.2.5. Determination of Chromatic Characteristics

The color measurement of all wines was carried out under same experimental conditions, spectrophotometric parameters, chromatic Sudraud’s indexes and CIELab parameters. The chromatic Sudraud’s indexes were determined according to a method by Savino et al. [33] with some modifications. Color intensity (CI), the total amount of color, was calculated as the sum of the absorbance at 420 nm, 520 nm, and 620 nm. Color composition indicates the contribution of each components (yellow, red, and blue) to the overall color. Tonality (To) indicates the relationship of the yellow-orange pigments (420 nm) over the red ones (520 nm). These indexes were calculated as follows:
CI = A420 + A520 + A620, To = A420/A520
%Yellow = A420/CI × 100, %Red = A520/CI × 100, %blue = A620/CI × 100
The official methods to determine the color was set up by the “Commission Internationale de 1′Eclairage” (CIE) based on the tristimulus values, which define a three-dimensional space called the CIE-xy space [34]. The indexes that define the CIELab space are as follows: L*, a measure of lightness; a*/−a*, a measure of redness/greenness; b*/−b*, a measure of yellowness/blueness; C*, chroma; and h*, the hue angle. All CIELab parameters were determined by a SC-80C automatic colorimeter (Beijing Kangguang instrument Co., Ltd., Beijing, China) following the recommendations of OIV-MA-AS2-11: R2006). All parameters were measured in triplicate.

2.2.6. Determination of Volatile Compounds

Headspace solid-phase microextraction (HS-SPME)/gas chromatography–mass spectrometry (GC-MS) were used for the analysis of volatile compounds in the samples. The 2 cm SPME fiber coated with a 50/30 μm DVB/CAR/PDMS phase (Supelco, Bellefonte, PA, USA) was conditioned in a stream of helium for 1 h at 250℃ before analysis. A single fiber was used for the entire study. After the analysis, the SPME fiber was inserted into GC injector (Agilent, Santa Clara, CA, USA) for blank run in order to ensure that no residual compounds were polluting the fiber or the column. Grape berry and wine samples were prepared according to methods by Cellamare et al. [35] with some modifications. In brief, 1 g NaCl and 5 mL sample were mixed in a 20 mL HS vial (Agilent, America), and then 1 μL of 3-octanol (165 mg/mL) (Merck, Shanghai, China) as the internal standard was added into the mixture. The vial was immediately sealed with a polytetrafluoroethene (PTFE) silicone diaphragm (Agilent, Santa Clara, CA, USA) and equilibrated at 40 °C for 10 min. Then, an SPME fiber was inserted into the sealed vial and exposed to the HS the of glass vial for resolution at 40 °C for 40 min, without contact with the sample in vial. After extraction, the fiber was inserted into the GC injection port equipped with glass insert at 250 °C for 5 min for volatiles fiber desorption. Each volatile compound was analyzed using a HP INNOWAX column (30 m × 0.25 mm, Agilent, Santa Clara, CA, USA). Helium was the carrier gas with a rate of 1 mL/min. The detector was maintained at 230 ℃, and the electron ionization energy was maintained at 70 eV. The temperature programs were as follows: 5 min at 50 °C, 50 to 86 °C at 3 °C/min, 86 to 90 °C at 1 °C/min, 90 to 180 °C at 3 °C/min, 180 °C for 3 min, then at 15 °C/min, up to 230 °C, with the final holding time of 5 min. Total ion chromatographs (TICs) were performed in a scanning rage of 35–350 m/z at a rate of 5 scans/s.
The volatile compounds of all samples were putatively identified by matching their retention indexes (RI) with those in mass spectral library (NIST 17). The content of volatile compounds were calculated by the internal standard method using the following equation:
RCVC (μg/L) = (PAVC/PAIS) × CIS (μg/L)
where RCVC represent the relative concentration of volatile components in wine, PAVC/PAIS represent the ratio of the peak area for both volatile component and the internal standard, and CIS represent the concentration of the internal standard.

2.2.7. Sensory Analysis

Sensory evaluation was finished using the method described by Granato et al. [36] with some modifications. Here, 10 trained panelists (6 women and 4 men) aged from 25 to 28 were selected from Shihezi University to evaluate all wine samples. To equilibrate any probable order effects, the order of wine samples was randomly presented for each taster. Assessors were seated in separate compartments with uniform lighting and were kept away from the noise and interfering stimuli of the laboratory. The panelists evaluated each sample in a clear tasting glass for about 15 s. Then, they began to assess the intensity of each attribute. The following parameters were analyzed: fruity, floral, sweetness, acidity, body, complexity, aftertaste. The intensity of each description were scored from 0 (weak) to 10 (intense).

2.2.8. Statistical Analysis

All data were expressed as mean ± standard deviation from triplicates. The variation of each indexes among different samples was analyzed using SPSS (version 20; IBM, Chicago, IL, USA) with Duncan’s multiple range tests, with the significance level at 5% (p ≤ 0.05). Here, R 4.0.4 (RStudio, Boston, MA, USA) was used to make a heatmap for analysis of the content differences of certain indicators. Origin Pro 2022 (OriginLab, Northampton, MA, USA) was used to produce stacking histograms, overlays, and radar charts. Principal component analysis (PCA) was performed using the SIMCA 14.1 software (Umetrics, Malmö, Sweden).

3. Results and Discussion

3.1. Basic Physicochemical Properties

The total sugar (TS), pH, total acidity (TA), and alcohol content (AC) of samples are listed in Table 1. The TS content of all grapes ranged from 166.11 g/L in CSG to 229.56 g/L in MSLG. Through fermentation, the TS content in all grapes reduced rapidly, and the final TS content of all wines ranged from 1.64 g/L in CPW to 3.12 g/L in KDKW, indicating that all wines were fermented into dry red wine. The alcohol content (AC) of all wines ranged from 8.52 to 13.47%, of which MSLW had a maximum AC of 13.47%. Obviously, the results showed a positive correlation between TS content in grapes and AC in wines, which be consistent with the previous study [37]. The TA content of all grapes ranged from 5.52 to 7.23 g/L, and that of all wines fluctuated from 6.13 to 8.11 g/L, which showed an upward trend through fermentation. The TA content peaked in CSW, which was 8.11 g/L. High levels of TA content can contribute to the microbial stability and freshness of the wine [38]. The pH of all grapes ranged from 3.63 to 4.89; after fermentation, the pH dropped and the value of all wines ranged from 3.47 to 3.97, which may be attributed to the increase in total acidity content, but both are not in direct proportion. Overall, both the TA content and pH value are slightly higher than in some studies, which may be caused by fermentation without a descending acid treatment.

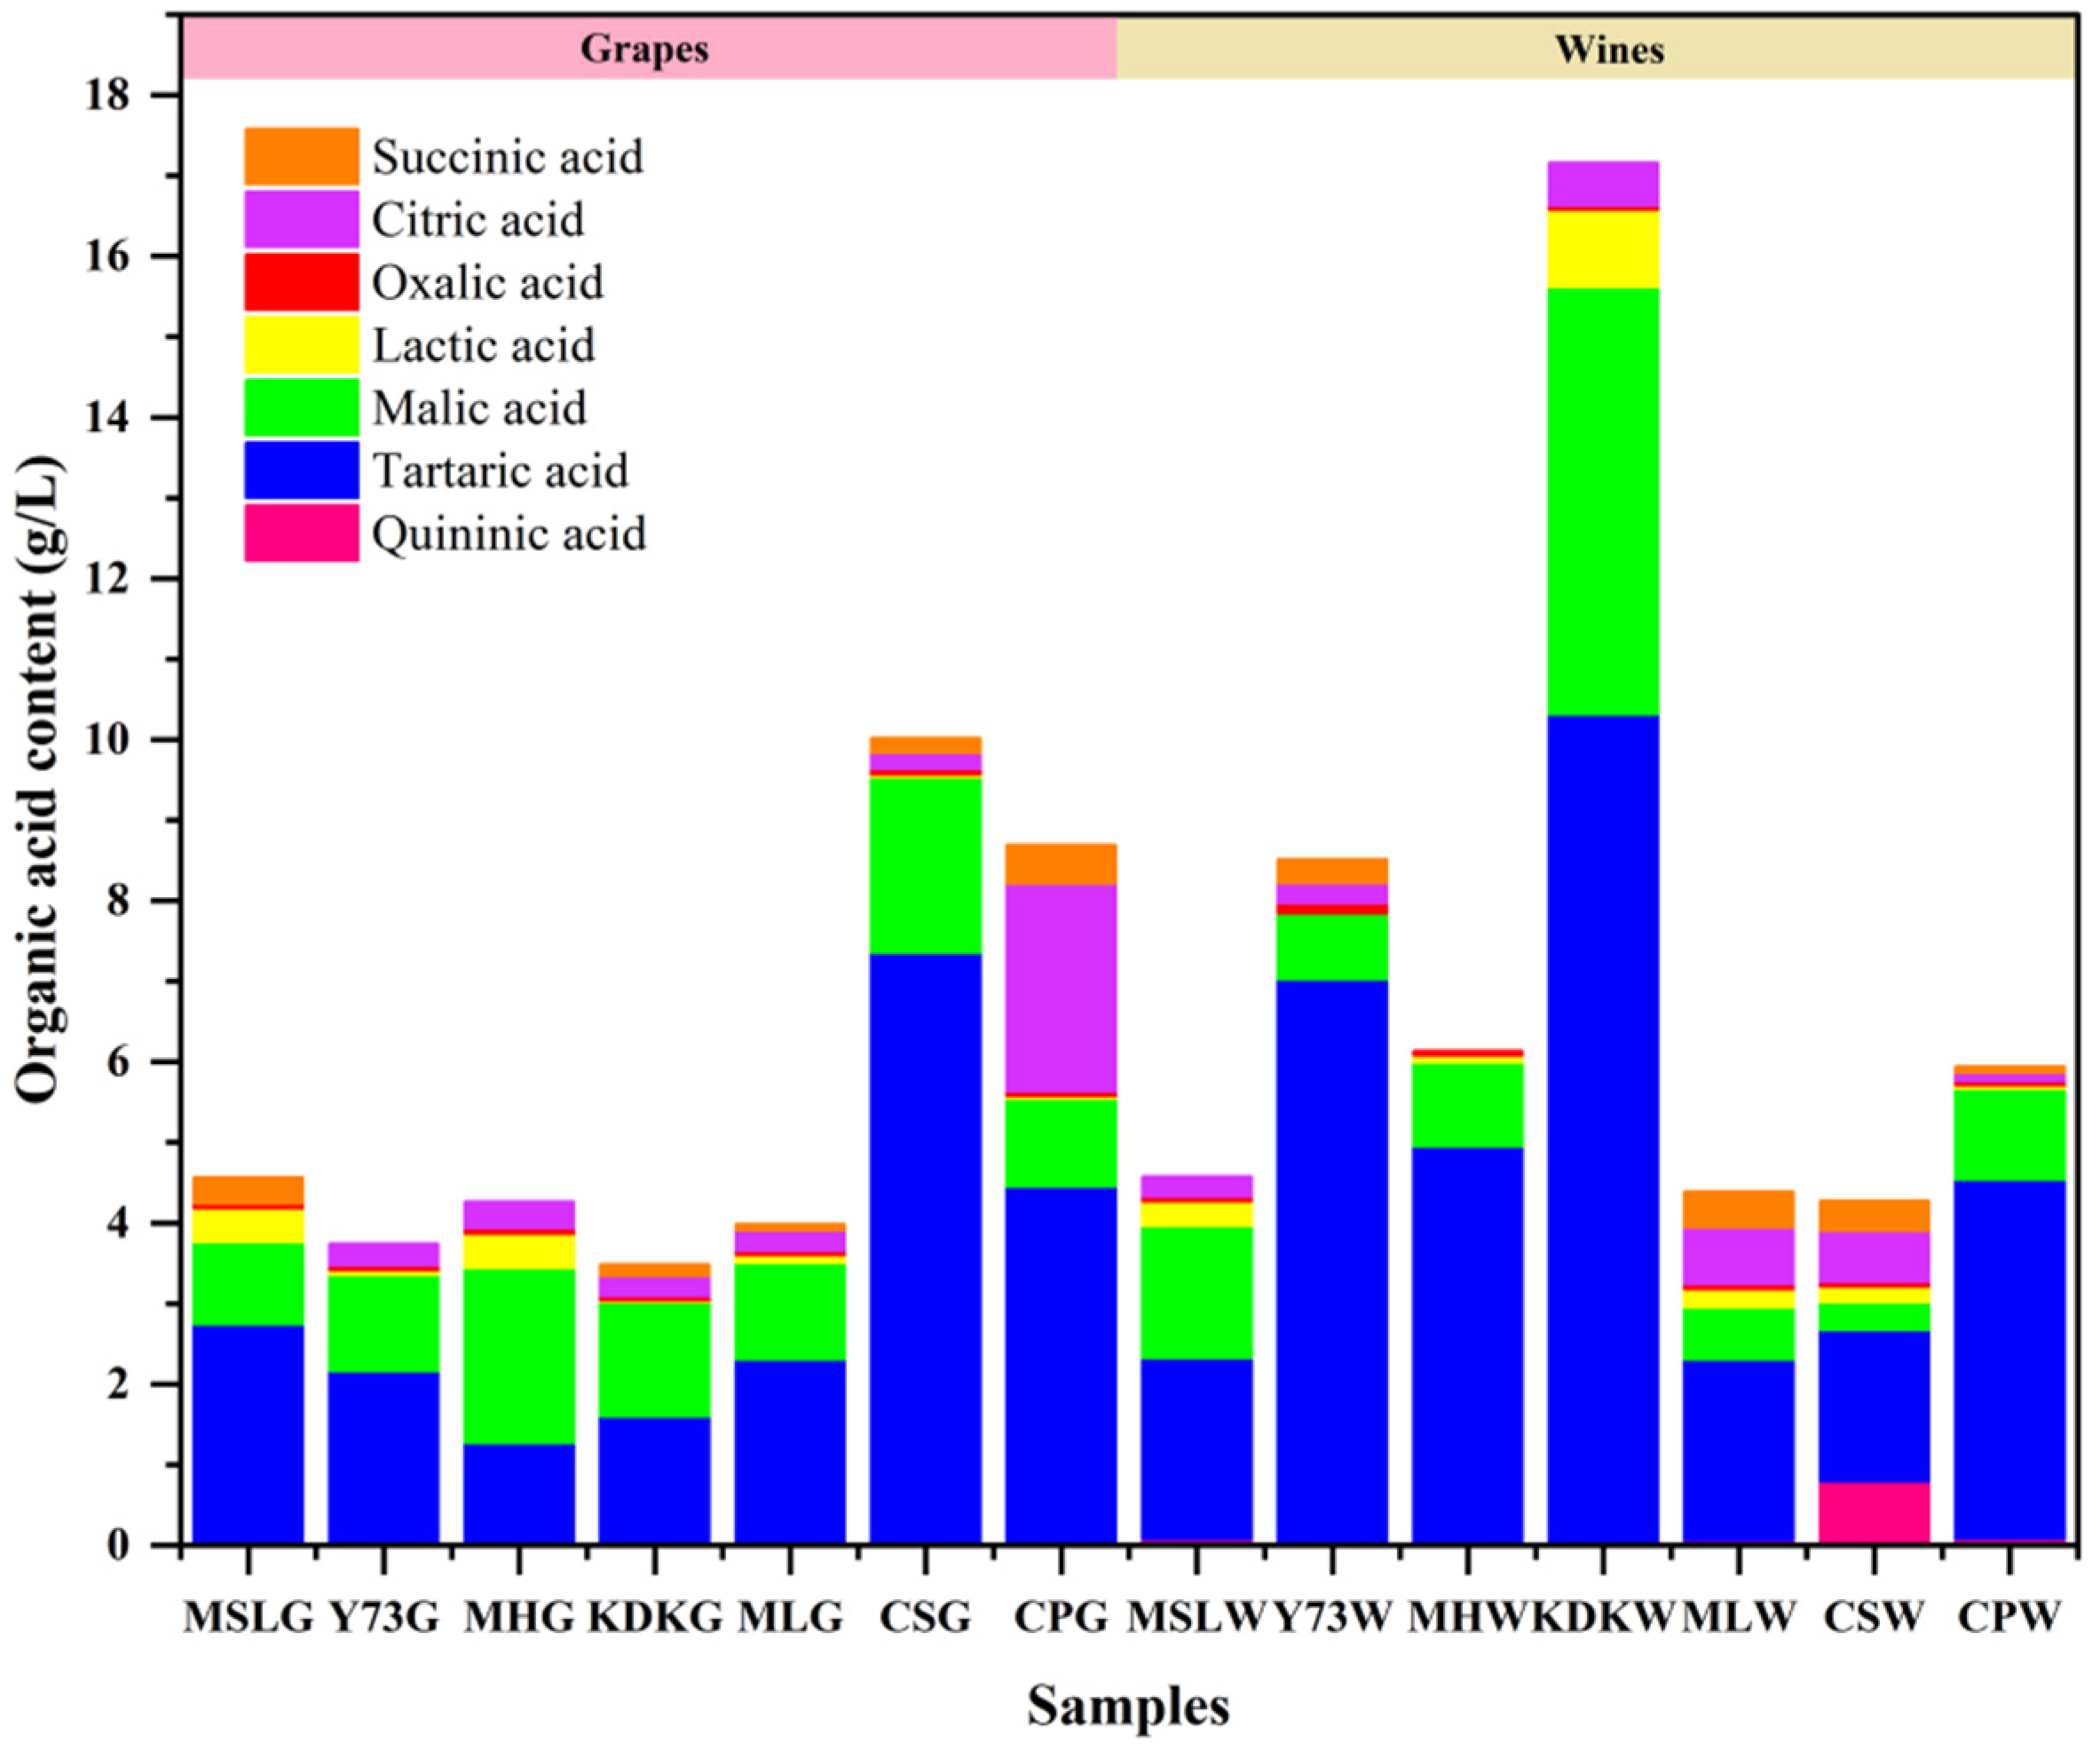
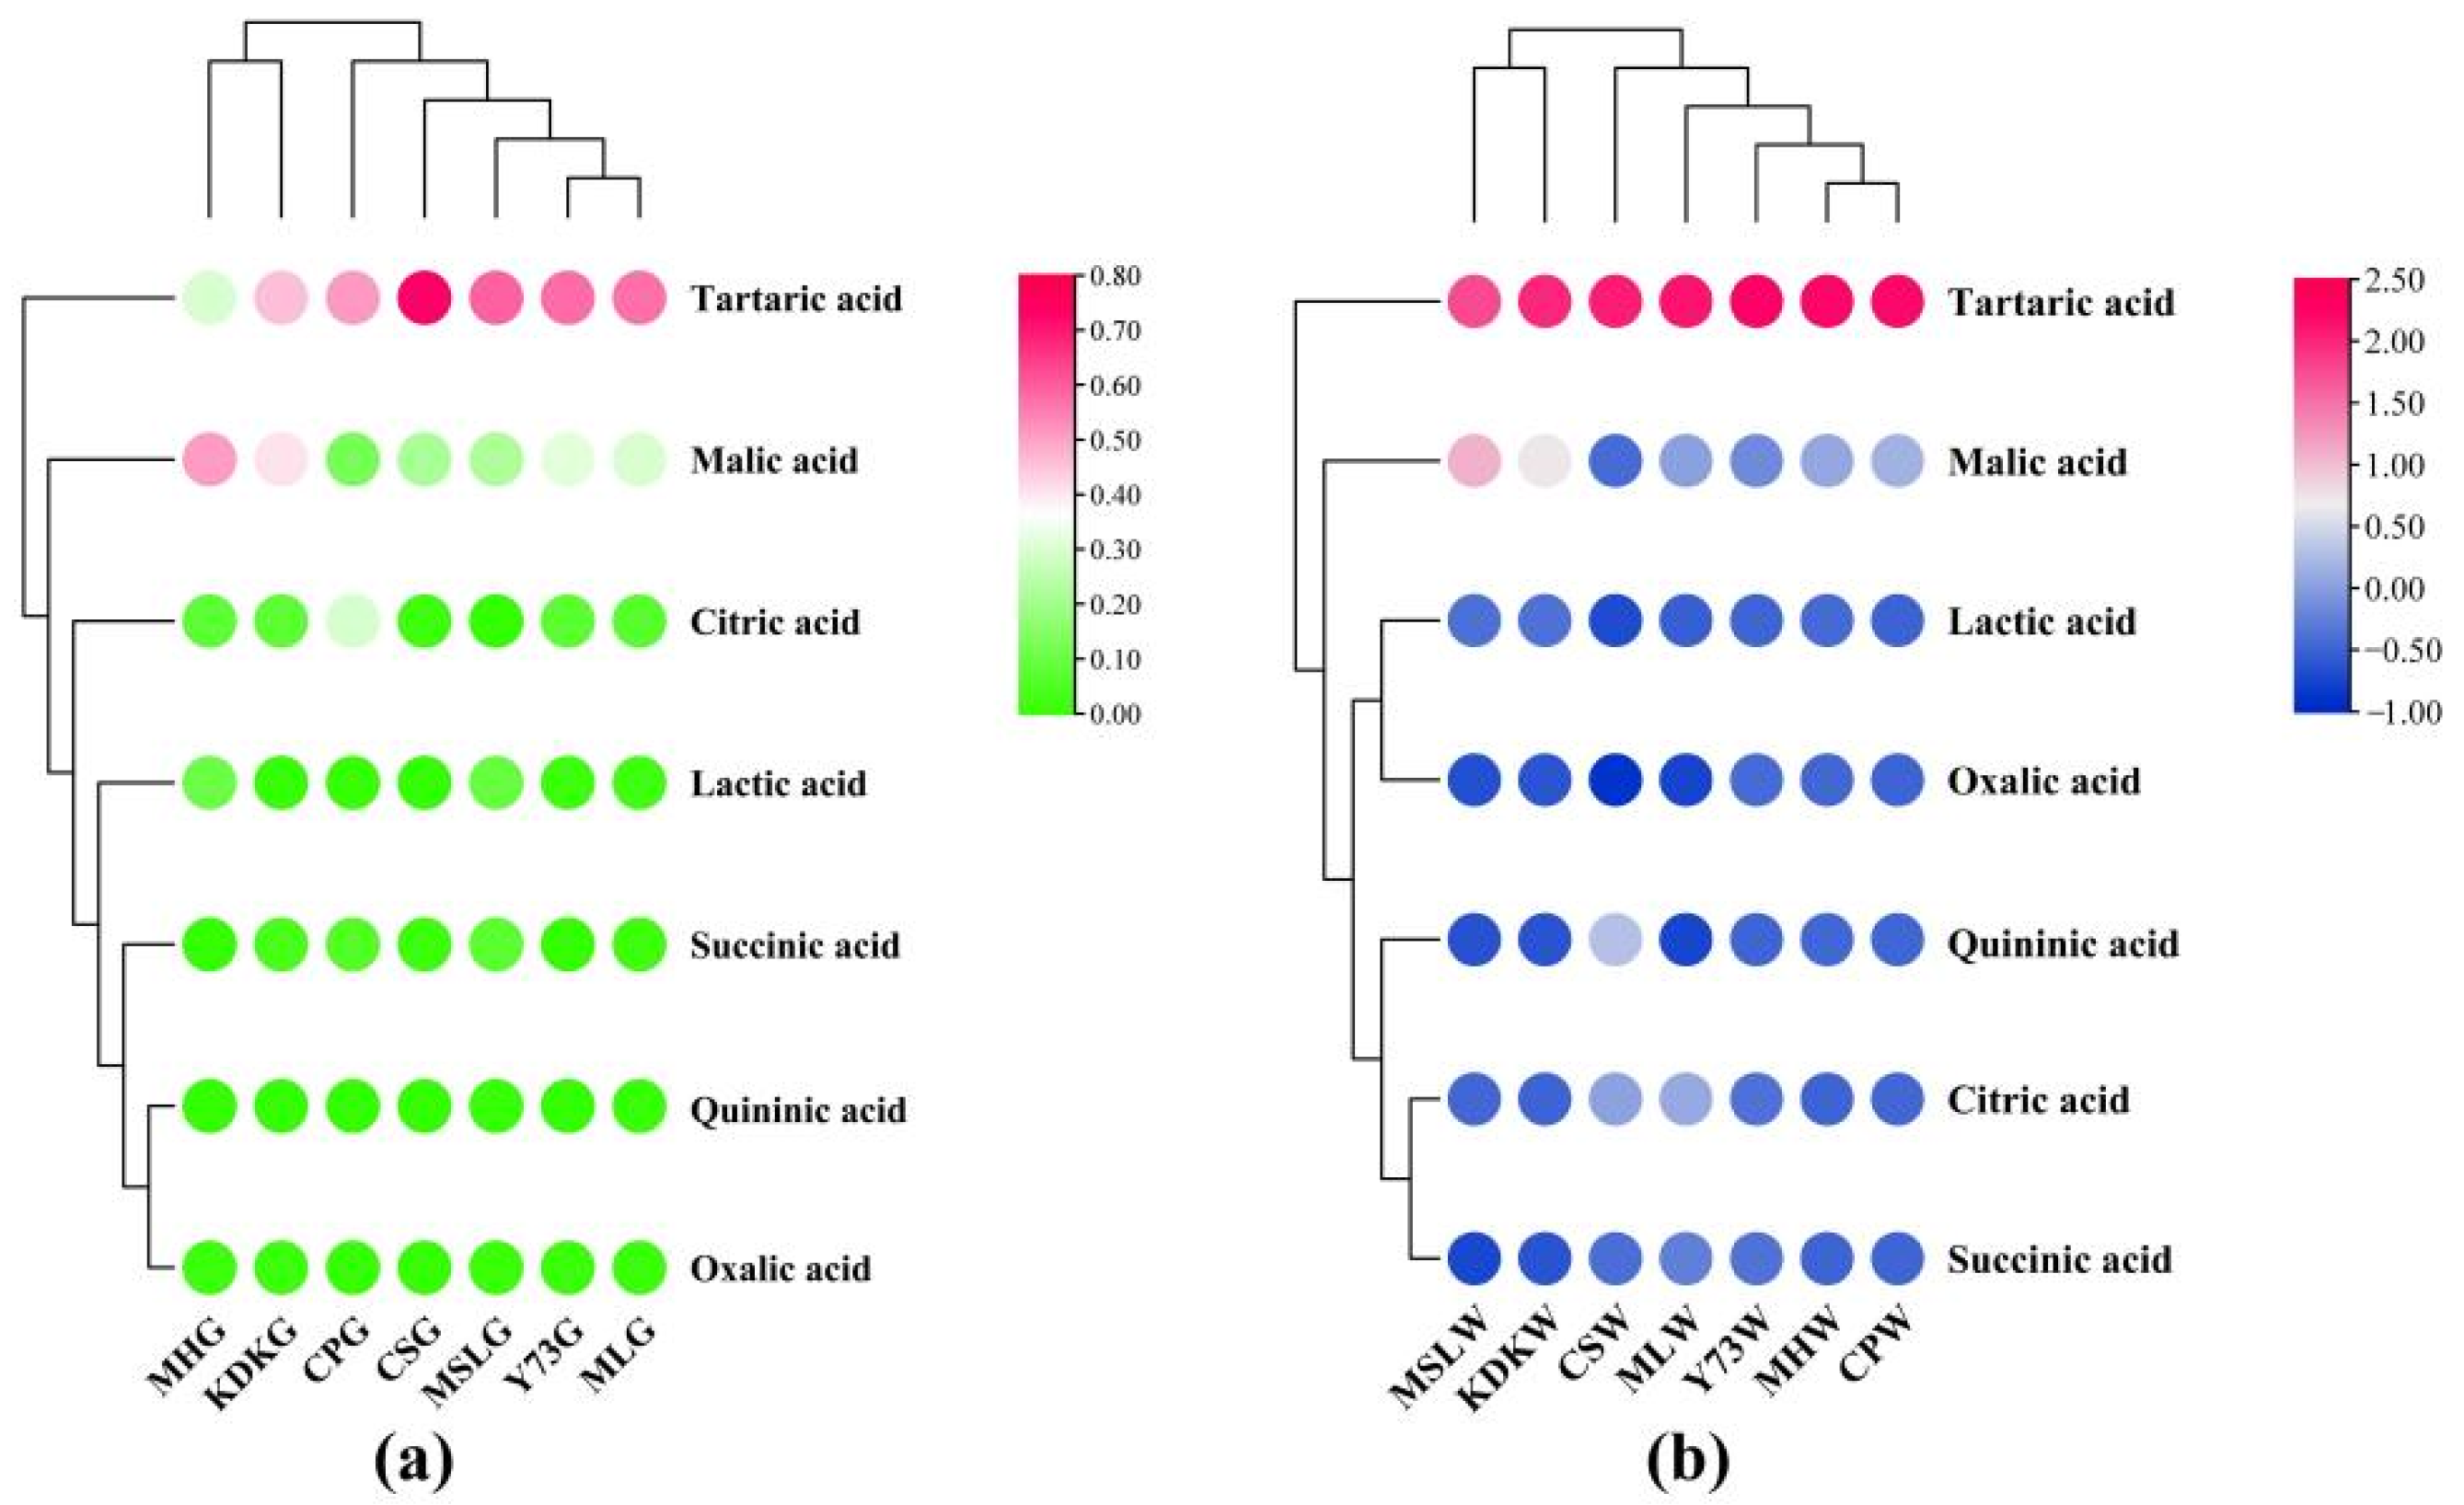
3.2. Cluster Analysis of Organic Acids

Organic acids construct one of the main taste groups of red wine, that of sourness [39]. The evaluation of grade and quality of wines is deeply affected by the variety and concentration of organic acids that can regulate the acid-base balance and affect the mouthfeel, color, and biological stability of wine [40]. Seven organic acids were identified by HPLC analysis in all grapes and wines, including tartaric acid, malic acid, lactic acid, quininic acid, oxalic acid, citric acid, and succinic acid. According to the literature, tartaric acid, malic acid, and citric acid originated from the grape berry, while the other four organic acids originate from alcoholic fermentation and bacterial activity [41]. As shown in Figure 1, variability was found in the levels of organic acids among the grape cultivars and wines (p < 0.05). The total organic acid content was found to be highest in CSG, but for wine, it was determined to be highest in KDKW, while in MLW and CSW it differed by only 0.09 ± 0.02 g/L. Tartaric acid and malic acid were found to be the main components of both grapes and wines, as their sum content accounted for over 60% of the total organic acids in all samples, of which the maximum sum content was measured in CSG, up to 95.22%. Except for in MHG, tartaric acid was the most abundant organic acid in the grapes, ranging from 1.27 g/L in MHG to 7.36 g/L in CSG, accounting for 29.96 to 73.45% of total organic acids. In KDKW, malic acid accounted for 30.91% of total organic acid content, and the content was up to 5.30 g/L, which was 4- to 9-fold higher than in other wine samples. Malic acid provides a strong and sharp taste, although excess malic acid content can cause a pungent taste [42].
Clustering analysis of the seven organic acid in various grapes and wines was carried out in Figure 2. We clearly found, both in grapes and wines, that the seven organic acids were classified into three groups; tartaric acid and malic acid were separately divided into one group, while the other organic acids were grouped together. Among those, malic acid distinguished all tested grapes and wines well, citric acid can distinguish CPG from other grapes, and quininic acid can be used as a criterion to distinguish CSW from other wines. Obviously, the results showed that the variety and concentration of organic acids in all samples had significant disparity, and which further indicated that organic acid content may depend on grape cultivars.

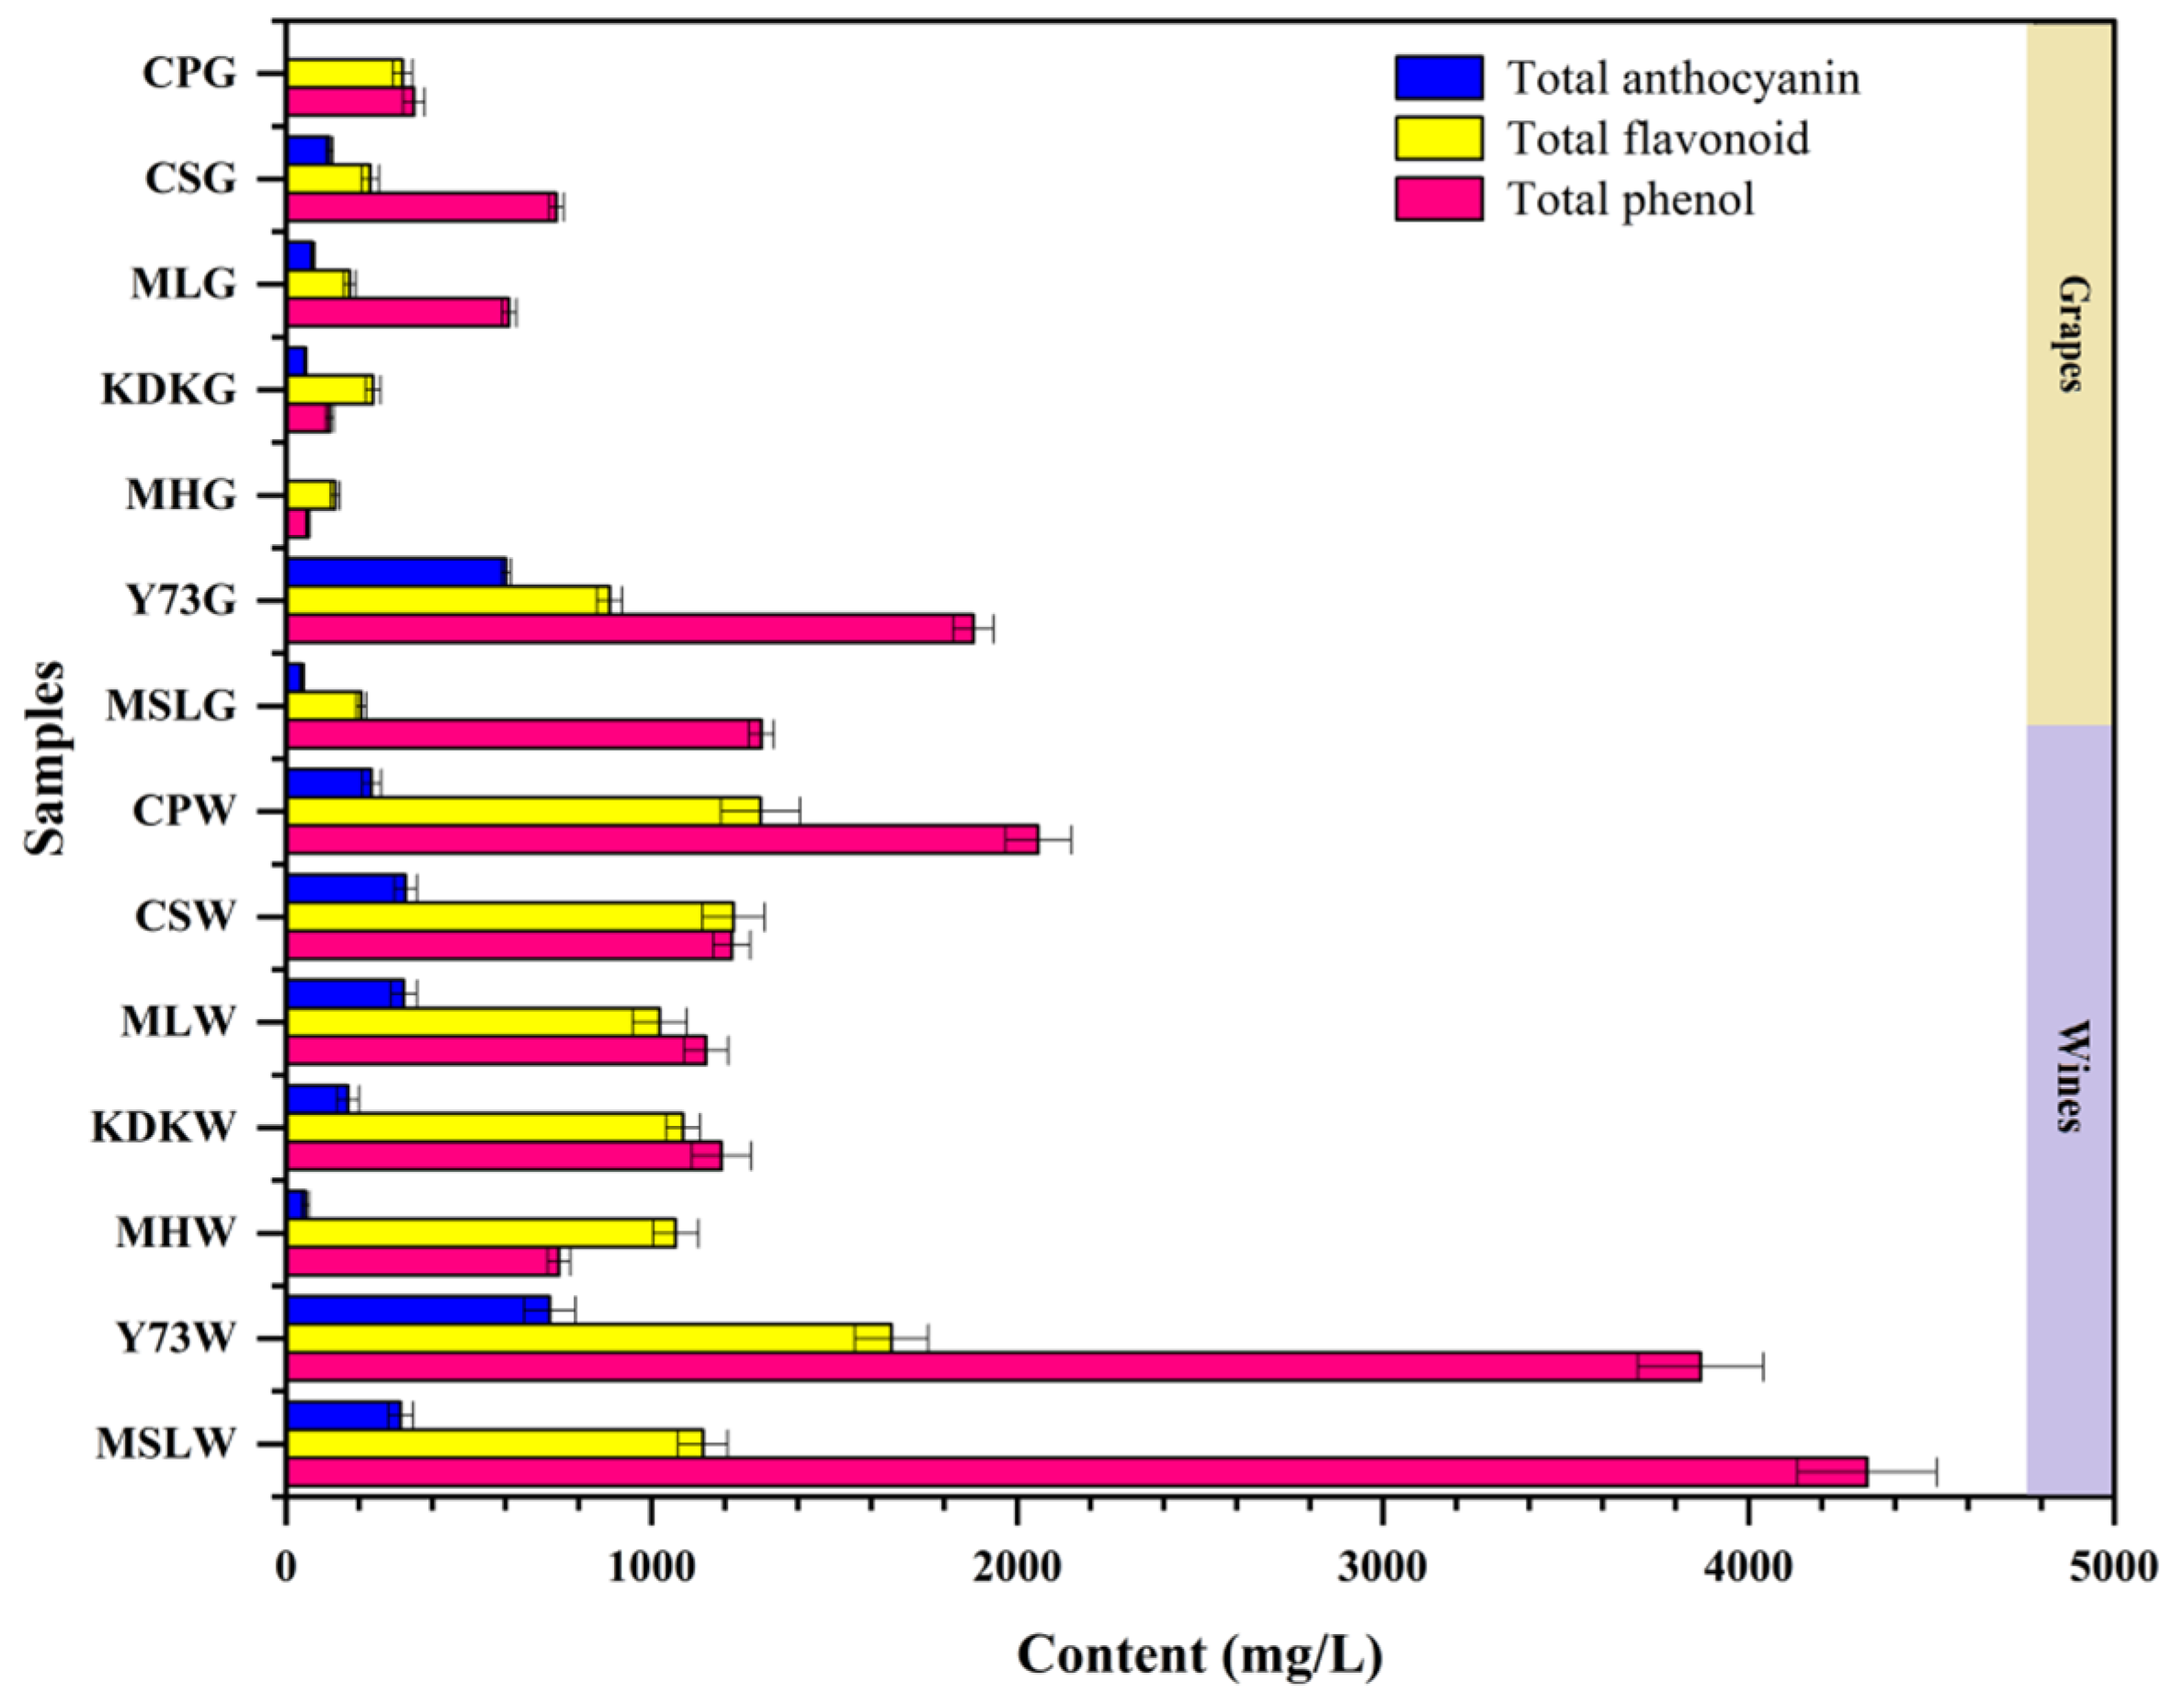
3.3. Content of Total Phenol, Total Flavonoid and Total Anthocyanin

The total phenolic content (TPC) and total flavonoid content (TFC), as well as total anthocyanin content (TAC), of different grapes and corresponding wines were measured in Figure 3 (p < 0.05). Phenolic compounds are associated with the antioxidant activity of grapes and wine, which can reduce the risk of cardiovascular disease and cancer [43]. The total content of these three parameters ranged from 195.76 to 3367.51 mg/kg and 1866.56 to 6245.72 mg/L, respectively, in the grapes and wines. The sum content of three measured indexes in Yan 73 grapes and wine was significantly higher than that in other samples. Additionally, among all samples, the content of phenolic components decreased in the following order: TPC > TFC > TAC. The TPCs of wines decreased in the following order: MSLW > Y73W > CPW > CSW > KDKW > MLW > MHW; among these, the TPCs showed little difference among KDKW, MLW, and CSW. The TACs varied significantly in the different wines, and decreased in the following order: Y73W > CSW > MLW > MSLW > CPW > KDKW > MHW; among these, the TAC in Y73W was 13.6 times greater than in MHW. Likewise, the TFCs showed a peaked abundance in both Yan 73 grapes and wine. According to these results, it may be inferred that Y73W has the highest antioxidant activity.
The relative abundance of TPC, TFC, and TAC in various grapes and wines was presented in Figure S1. The relative abundance of TP and TF accounted for more than 80% in all samples. Moreover, the relative abundance of TPC, TFC, and TAC was distributed similarly in CSG and MLG, and was also similar in CSW and MLW, which indicates that the antioxidant capacity of both wines may be similar. To sum up, the significant differences in the content of phenolic compounds were exhibited among different grapes and wines.

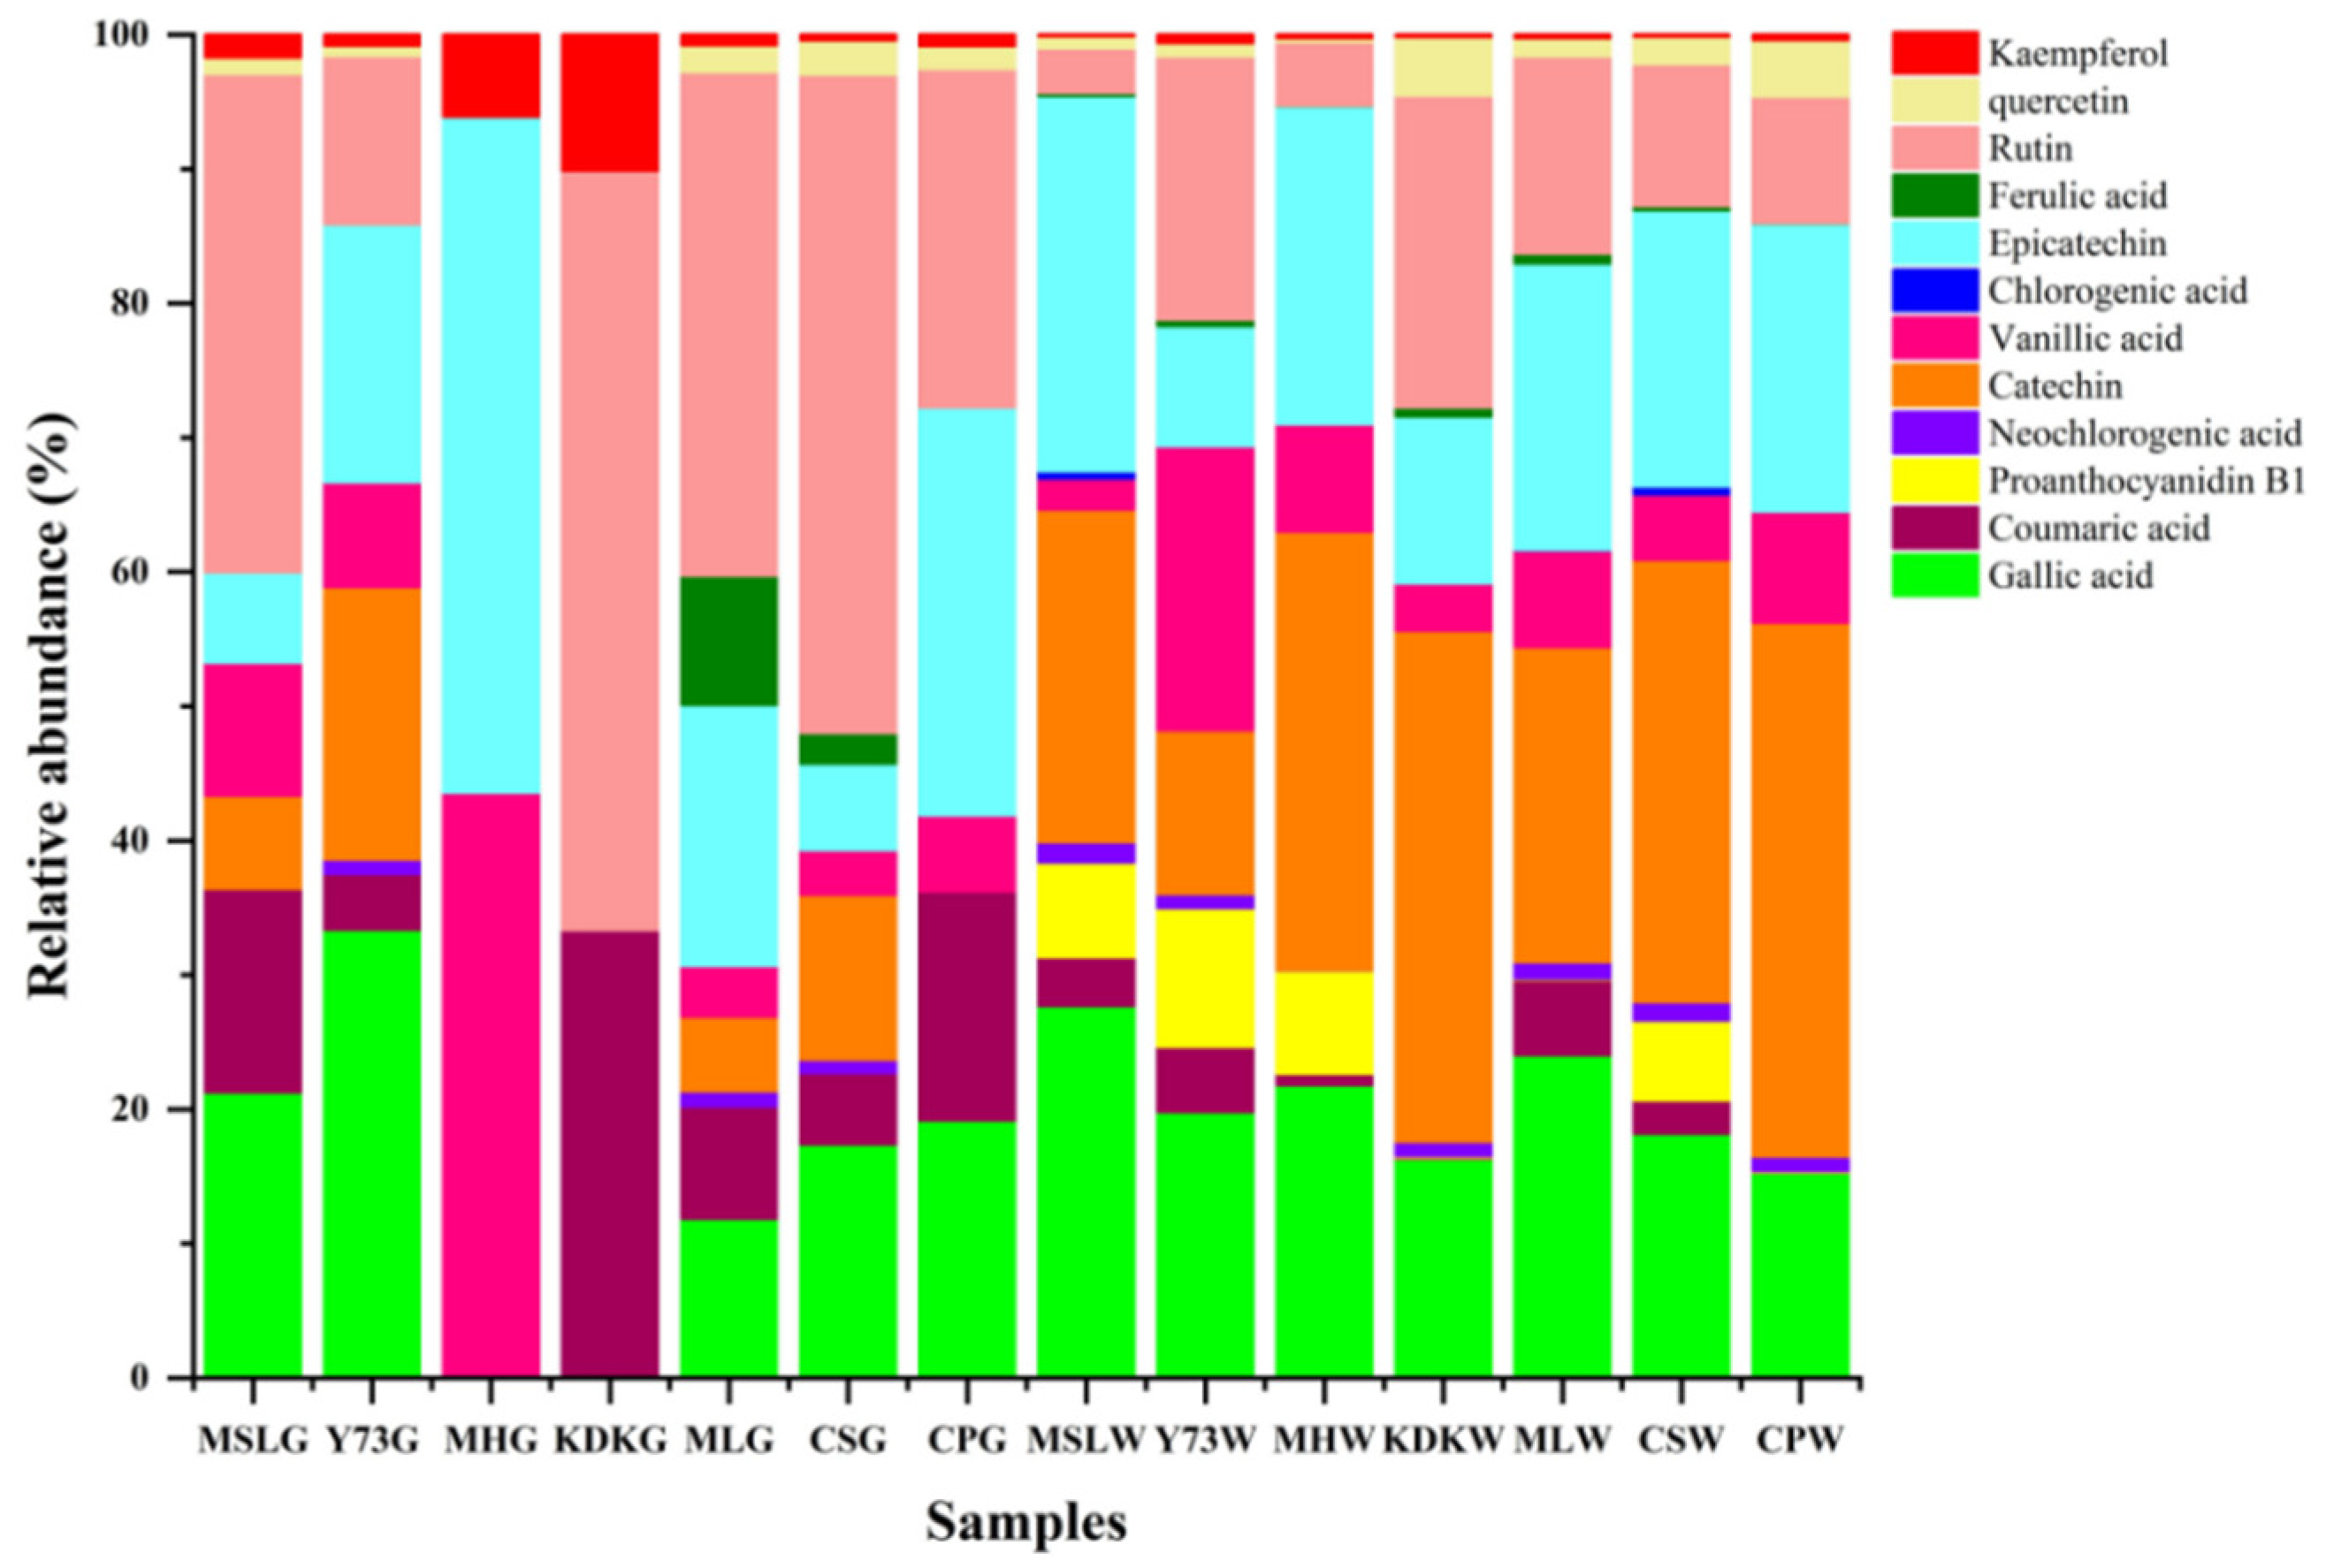
3.4. Composition of Phenolic Compounds

Twelve phenolic compounds, including gallic acid, coumaric acid, proanthocyanidin B1, neochlorogenic acid, catechin, vanillic acid, chlorogenic acid, epicatechin, ferulic acid, rutin, quercetin, and kaempferol, were identified in the grapes and wines (Figure 4). Rutin, gallic acid, and epicatechin were the dominant phenolic compounds which occurred in all grapes, and their sum contents accounted for 50.31 to 74.75% of the total phenolic compounds, while among wines, gallic acid, catechin, and epicatechin were the dominant phenolic compounds, and their sum content ranged from 32.27 to 81.48 mg/L, accounting for 40.91 to 80.35% of the total phenolic compounds. Catechin was the major phenolic compound in all wines. Much of the research focused on the effects of catechin content in red wine on the health of humans [44], especially its antioxidant properties [45]. The catechin content in CSW was up to 30.14 mg/L, approximately three times than that of Y73W. Rutin was also often studied as an antioxidant [46]. Here, Y73W had the highest level of rutin (15.47 mg/L), in which content was five times than in MSLW.
Furthermore, clustering analysis of 12 phenolic compounds in various grapes and wines was carried out in Figure S2. For grapes, 12 phenolic compounds were clustered into three groups, as follows: rutin was grouped individually, vanillic acid and epicatechin were grouped together, and the other phenolic compounds were grouped together. For wines, 12 phenolic compounds were clustered into 4 groups, catechin was divided as a separate group, gallic acid and epicatechin were clustered as a group, vanillic acid and rutin were divided as a group, and the other phenolic compounds were grouped together. Additionally, Y73W was clustered as a separate group, MLW and MSLW were clustered together, and the other wines were clustered together. Significant differences were found between these three categories. Polyphenols in red wine are mainly derived from grape berries, and the grape skin is an essential component, containing polyphenols. The impregnation stage before fermentation is an important path via which polyphenols enter into wine [47]. Above all, the results showed that the amount and concentration of these potentially beneficial phenolic compounds varies and depends on the variety of grapes.

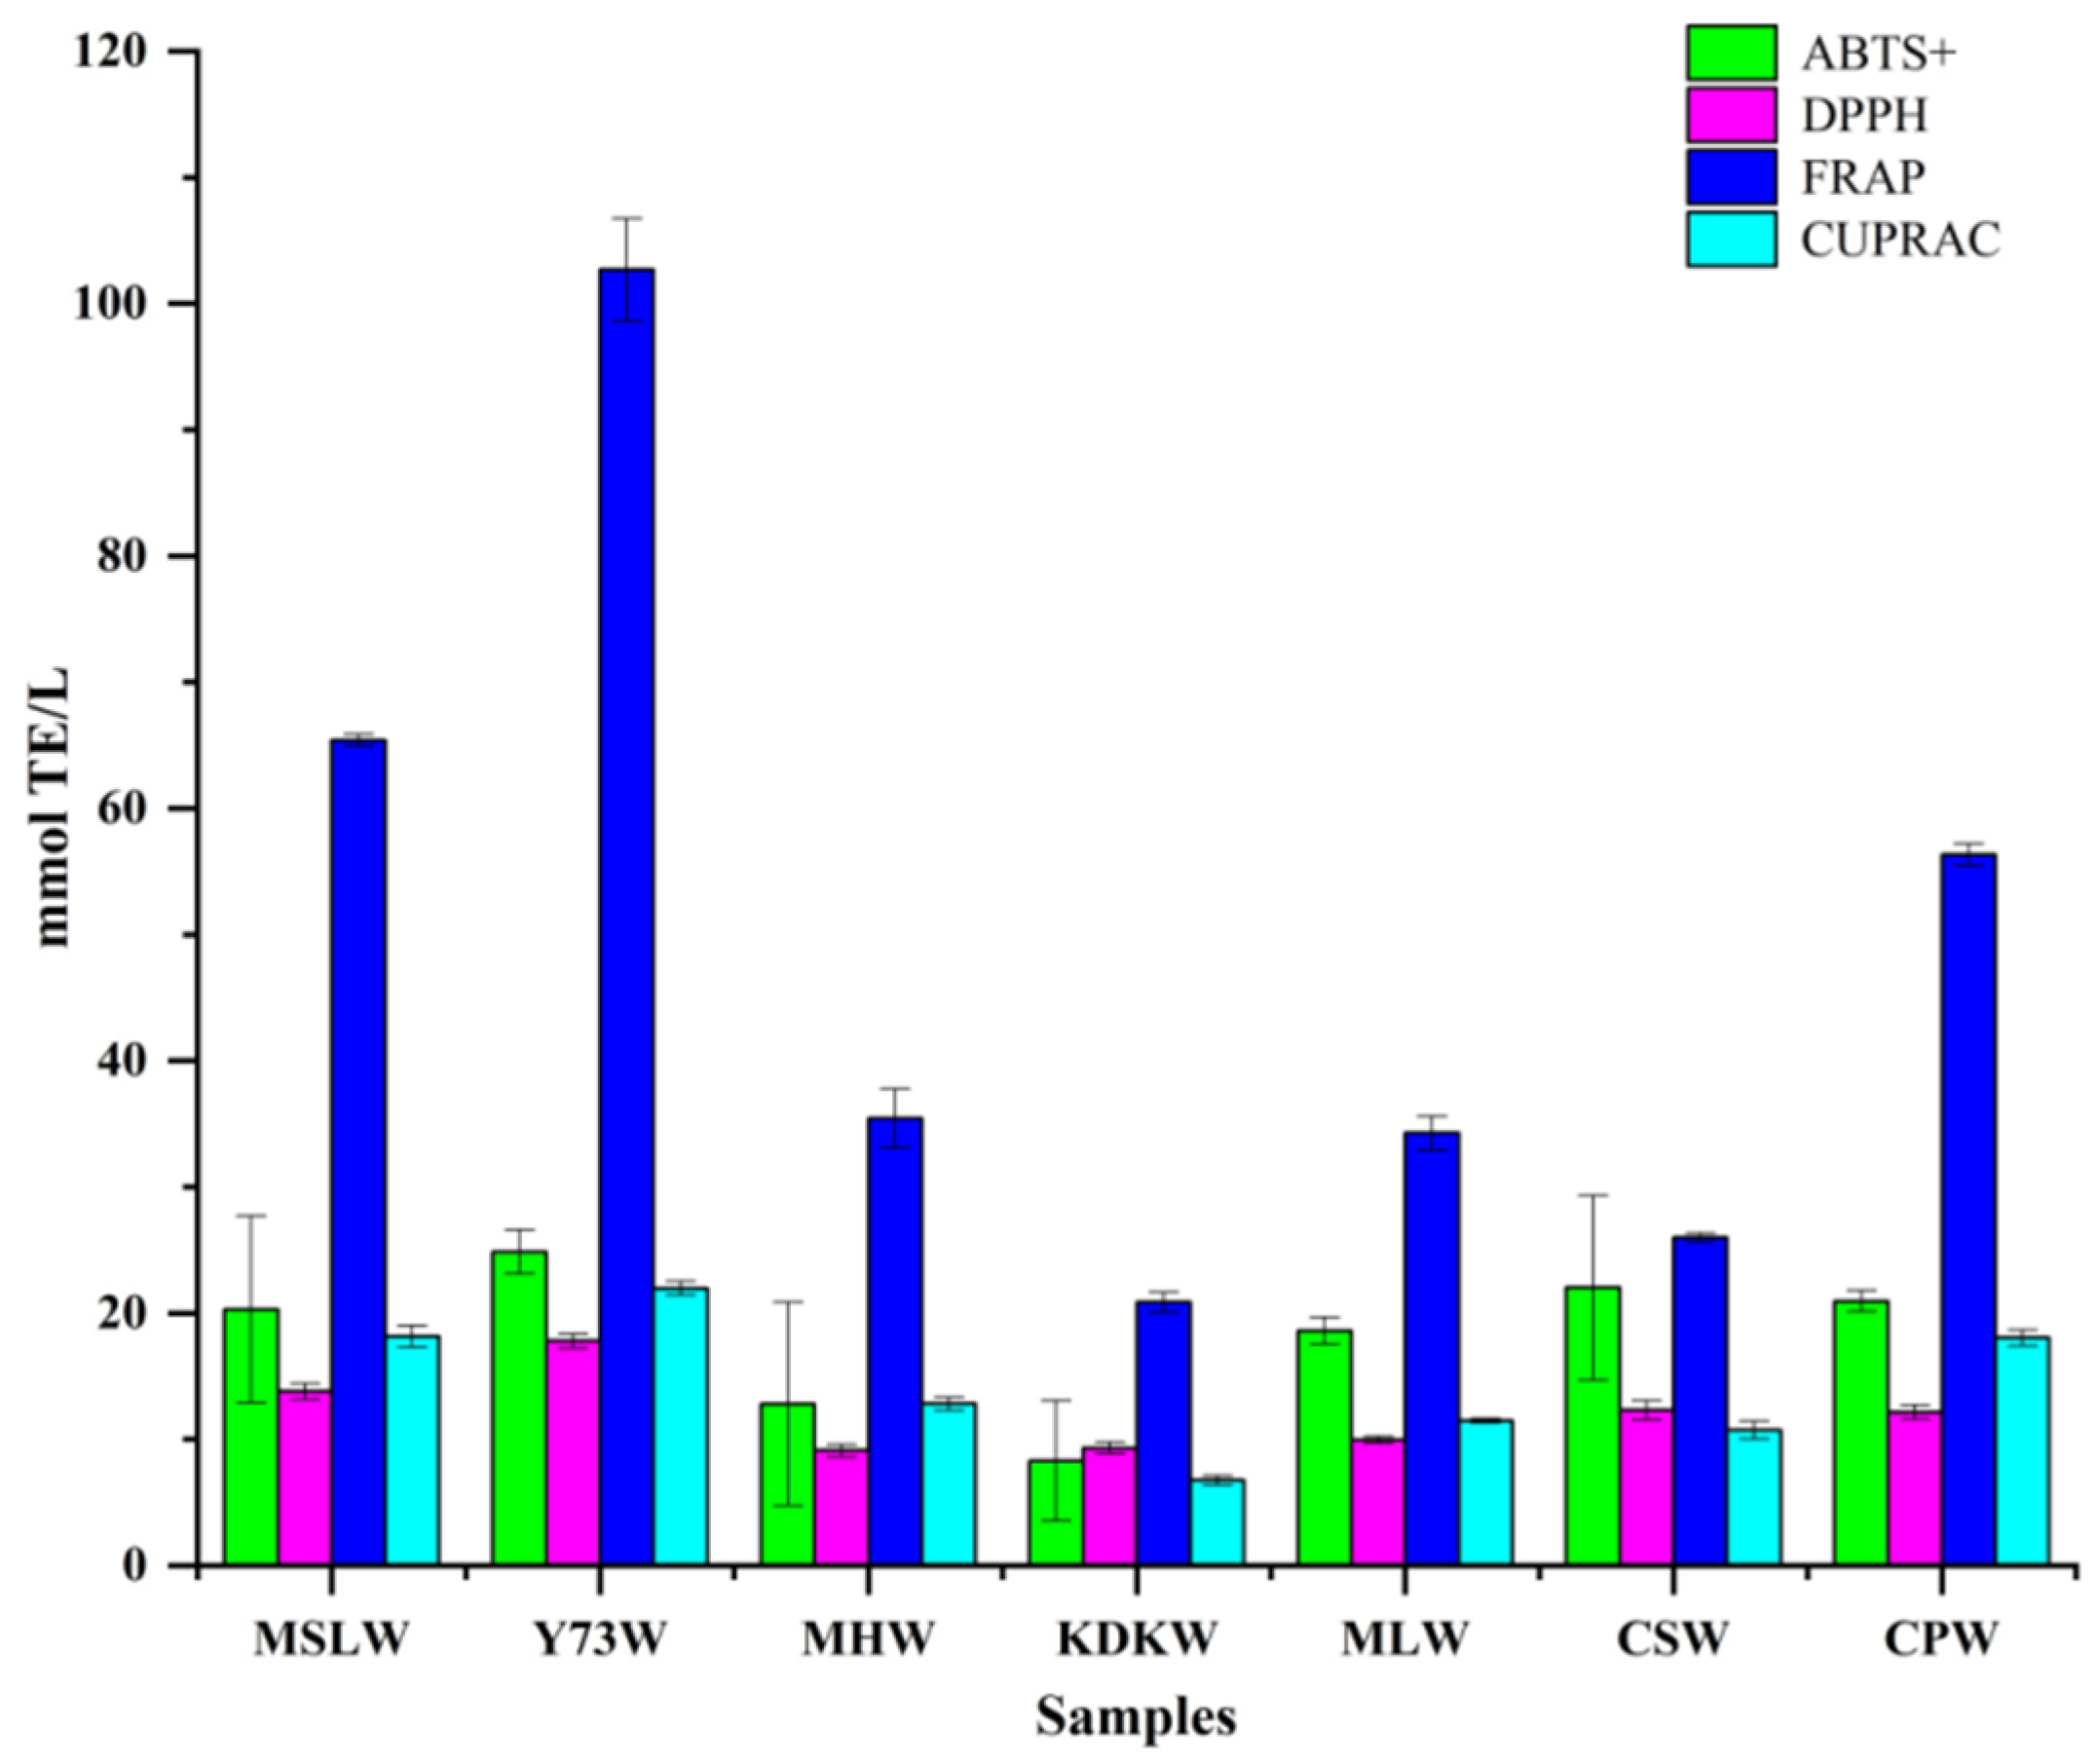
3.5. Determination of Antioxidant Activity

The antioxidant activity of all wines was evaluated by determining the radical scavenging capacity (ABTS+ and DPPH) and the reducing capacity (FRAP and CUPRAC) (Figure 5). Among all wines, the antioxidant activity was obviously different. The antioxidant activity of Y73W was the strongest, followed by that of MSLW, CPW, MLW, CSW, MHW and KDKW. Yan 73 (Vitis vinifera) grape is a teinturier grape cultivar, which accumulates anthocyanins in the skin, pulp, pedicels, and rachis [48]. According to Luan et al. [49], the phenolic content (anthocyanins and non-anthocyanins) of the Yan 73 wine was significantly higher than that of the Cabernet Sauvignon wine. This is consistent with the conclusion of our research.
The reducing power of the antioxidants of all wines was determined within the range of 6.74–102.68 mmol TE/L. As shown in Table S1, the antioxidant activity analyzed with the CUPRAC assay decreased in the following order: Y73W > MSLW > CPW > MHW > MLW > CSW > KDKW. The results of the FRAP assay of all wines followed the same order with the CUPRAC assay of all wines. The radical scavenging activity of all wines measured by the DPPH assay was found to be within a range of 9.12–17.81 mmol TE/L (Table S1). Here, Y73W exhibited higher radical scavenging activity than other wines. The antioxidant activity measured with the ABTS+ assay decreased in the following order: Y73W > CSW > CPW > MSLW > MLW > MHW > KDKW. The ABTS+ values obtained for Yan 73 wine and Cabernet Sauvignon wine are consistent with the results reported by Xu et al. [50].

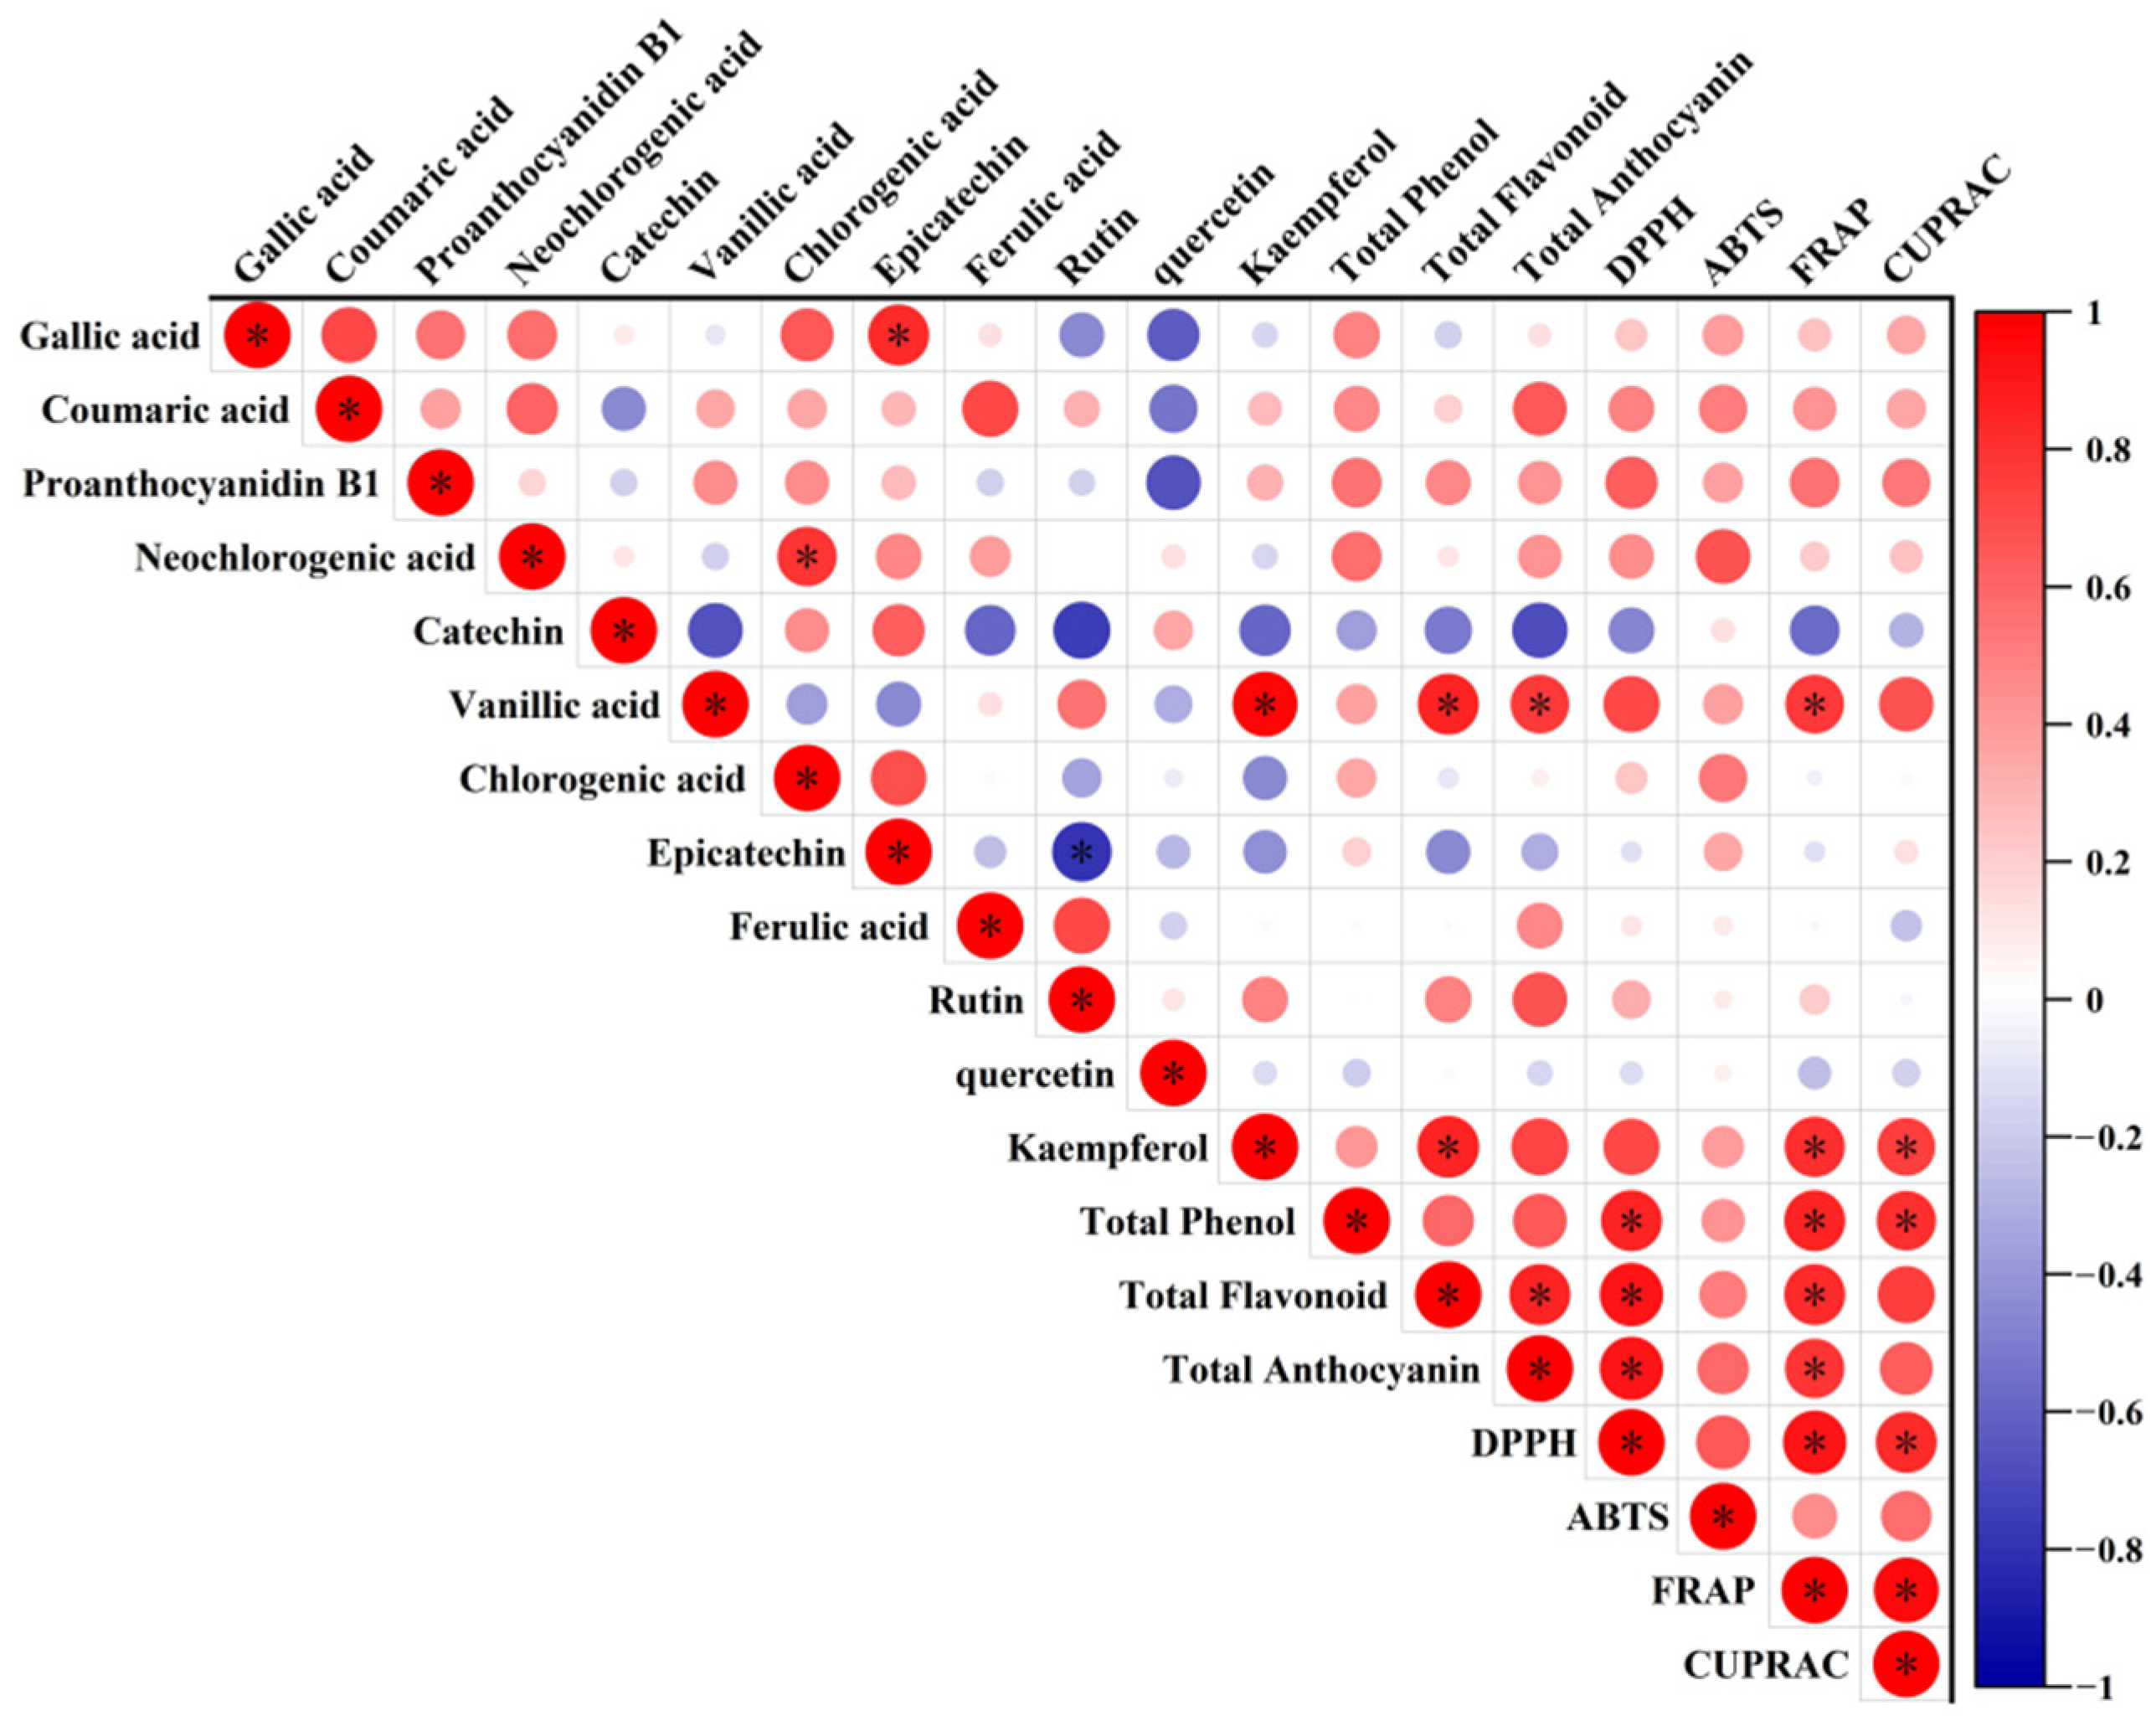
3.6. Correlation Analysis of Phenolic Compounds and Antioxidant Activity
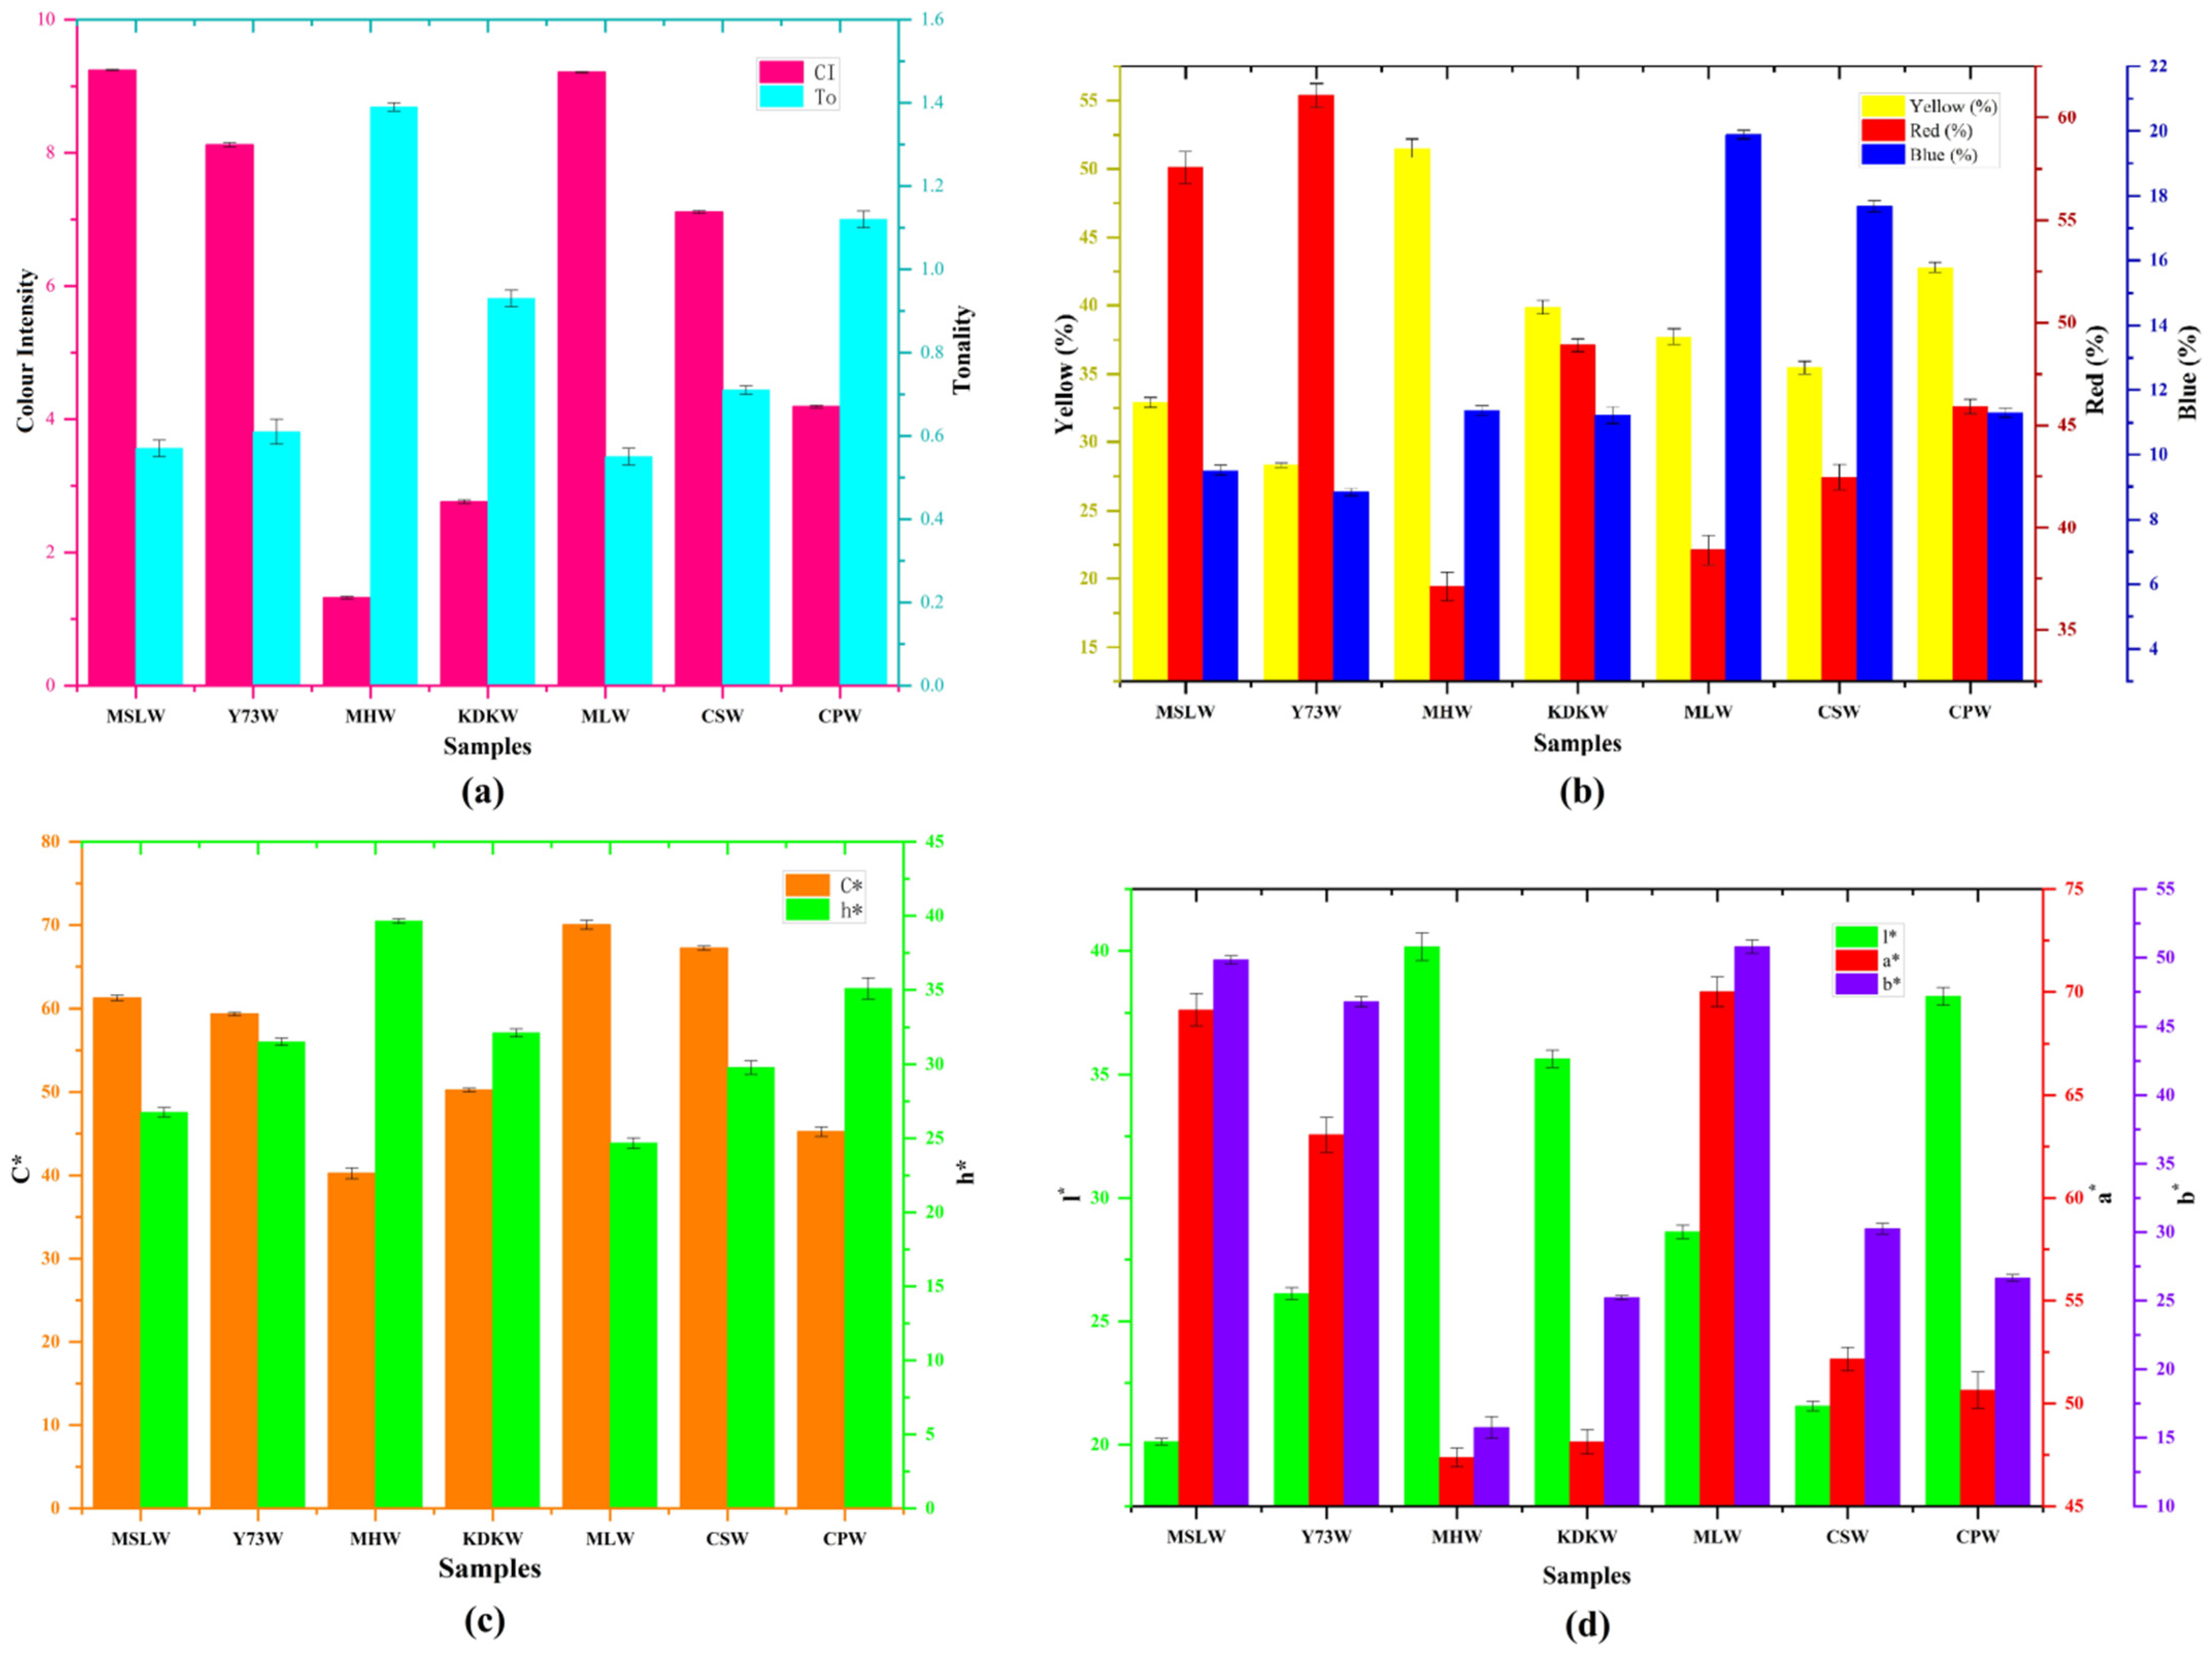
Wine, particularly red wine, is a rich source of antioxidant phenolic compounds, which possess antioxidant activity, and may have an important role in human health, especially in some diseases involving oxidation, such as coronary heart disease, inflammation, and cancer caused by mutagenesis [51]. All wines were evaluated by determining the contents of total phenol, total anthocyanins, total flavonoids, monomeric phenols, ABTS+, DPPH, FRAP, and CUPRAC. To examine the possible correlation among these parameters, Pearson’s coefficient was performed using the Origin software (Figure 6).
Strong positive correlations among four antioxidant activity assays (ABTS+, DPPH, FRAP, and CUPRAC) were found in different wines. Significant positive correlations were shown between total phenol content (TPC) and DPPH, FRAP, and CUPRAC of all wines. Lopez-Velez et al. also found significant positive correlations between total phenol content and total antioxidant capacity [52]. Total flavonoid content (TFC) had a good correlation with the DPPH and FRAP in all wines. Total anthocyanin content (TAC) also had a positive correlation with antioxidant activity in all wines, while the correlation for antioxidant activity with TPC and TFC was lower. These results were consistent with Ghatak et al. [53]
Additionally, for monomeric phenols, gallic acid, coumaric acid, proanthocyanidin B1, neochlorogenic acid, vanillic acid, and kaempferol presented good positive correlations with the antioxidant activity of wines. The potential antioxidant activity of these compounds was also characterized in previous research [54]. However, the mechanisms of the antioxidants of these monomeric phenols needs to be further studied.

3.7. Color Analysis

The colors of all wines are illustrated in Figure 7, calculated by the chromatic parameters (CI, To, %Yellow, %Red, %Blue) and CIELab indexes (C*, h*, l*, a*, b*). The colors of different wine varieties were obviously different. According to Bric-Cid et al. [55], the color of the wine is influenced by phenolic compounds in the wine. In addition, Fragoso et al. [56] thought that, although the phenolic components of grapes is affected by many factors, the most important is the grape cultivar.
As shown in Figure 7a, the highest value of color intensity (CI) was registered for MSLW (9.24), and the lowest value was measured for MHW (1.32). Fragoso et al. found that the anthocyanin content significantly correlated with the color intensity [57]. For color tonality (To), the value ranged from 0.55 in MLW to 1.39 in MHW, with a smaller difference between MLW and MHW. Three tonalities of the yellow, red, and blue in all wines are presented in Figure 7b. Here, Y73W showed the highest red tonality (61.09%) and lowest yellow tonality (28.31%). The MLW had the highest blue tonality (19.89%). According to the research of Gordillo et al. [58], red wine with a notably darker color will have a more bluish tonality.
The results of CIELab parameters are showed in Figure 7c,d. The color parameter a* (green-red) and b* (blue-yellow) values were found to be slightly different between MSLW and MLW. The MHW had a highest value of l* (lightness); this was also shown by Zhang et al. [59] when analyzing the color properties of Muscat Hamburg wine, wherein they found that the l* value was very high in Muscat Hamburg wines.

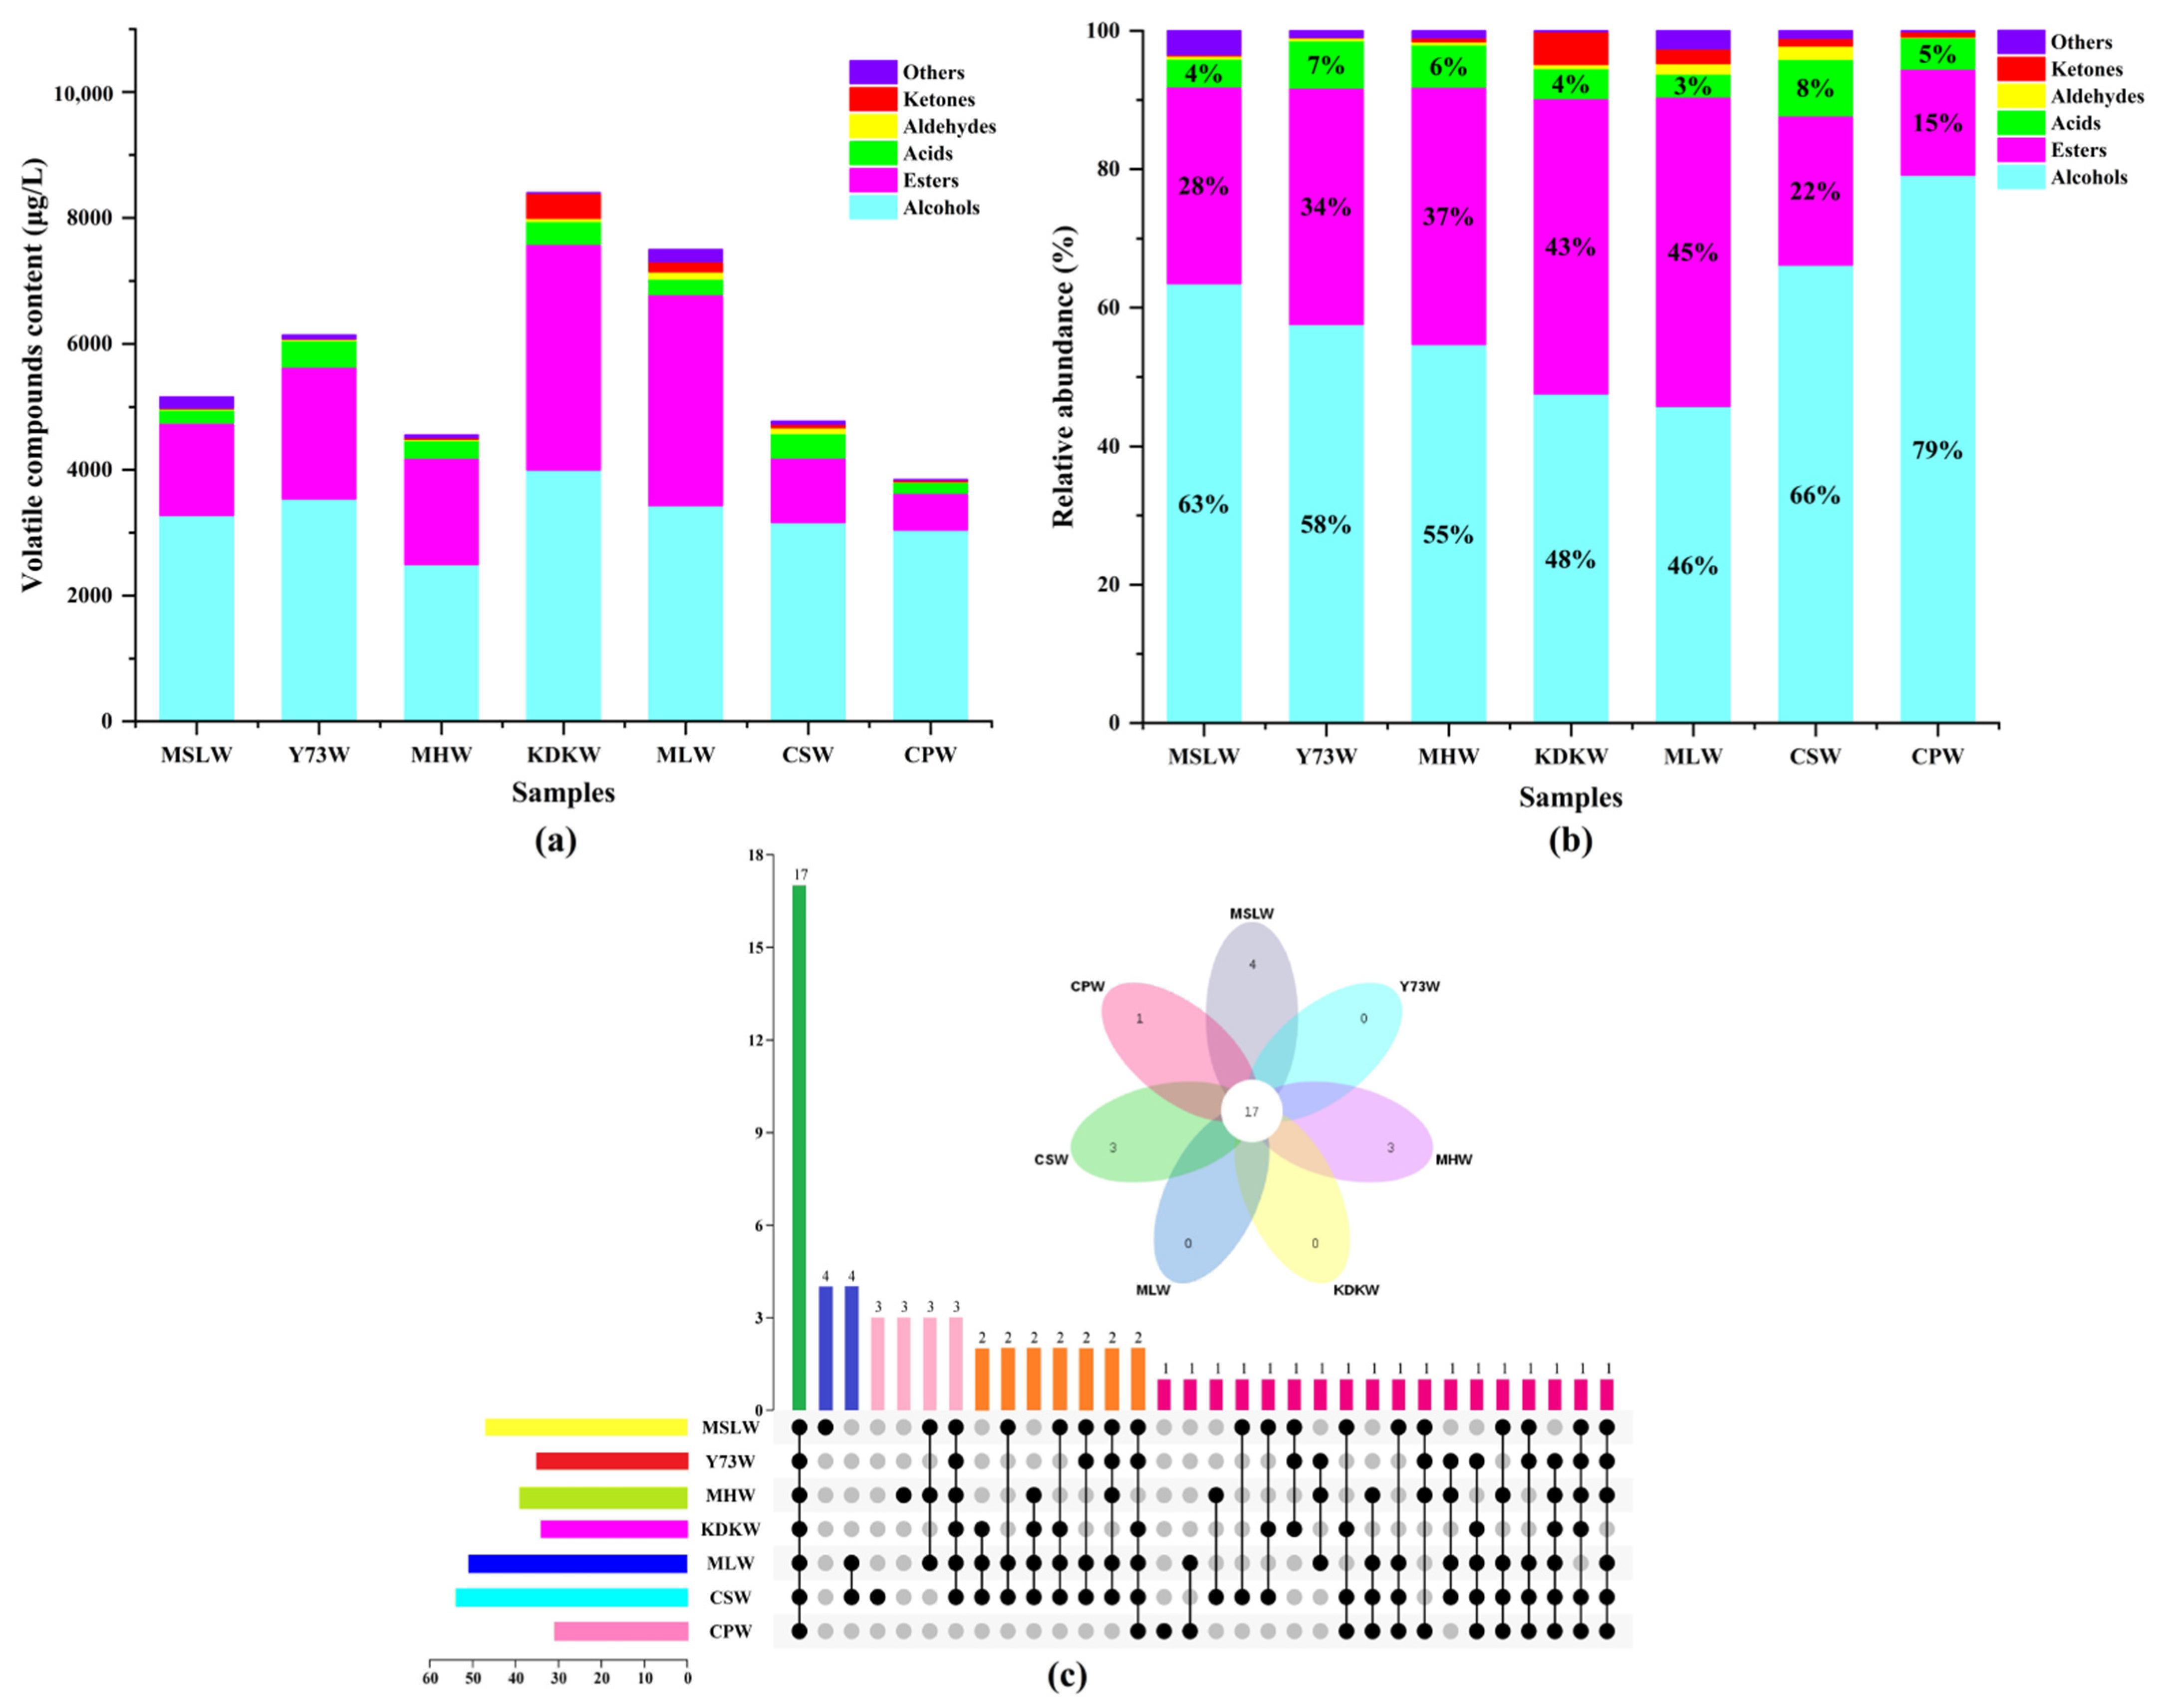
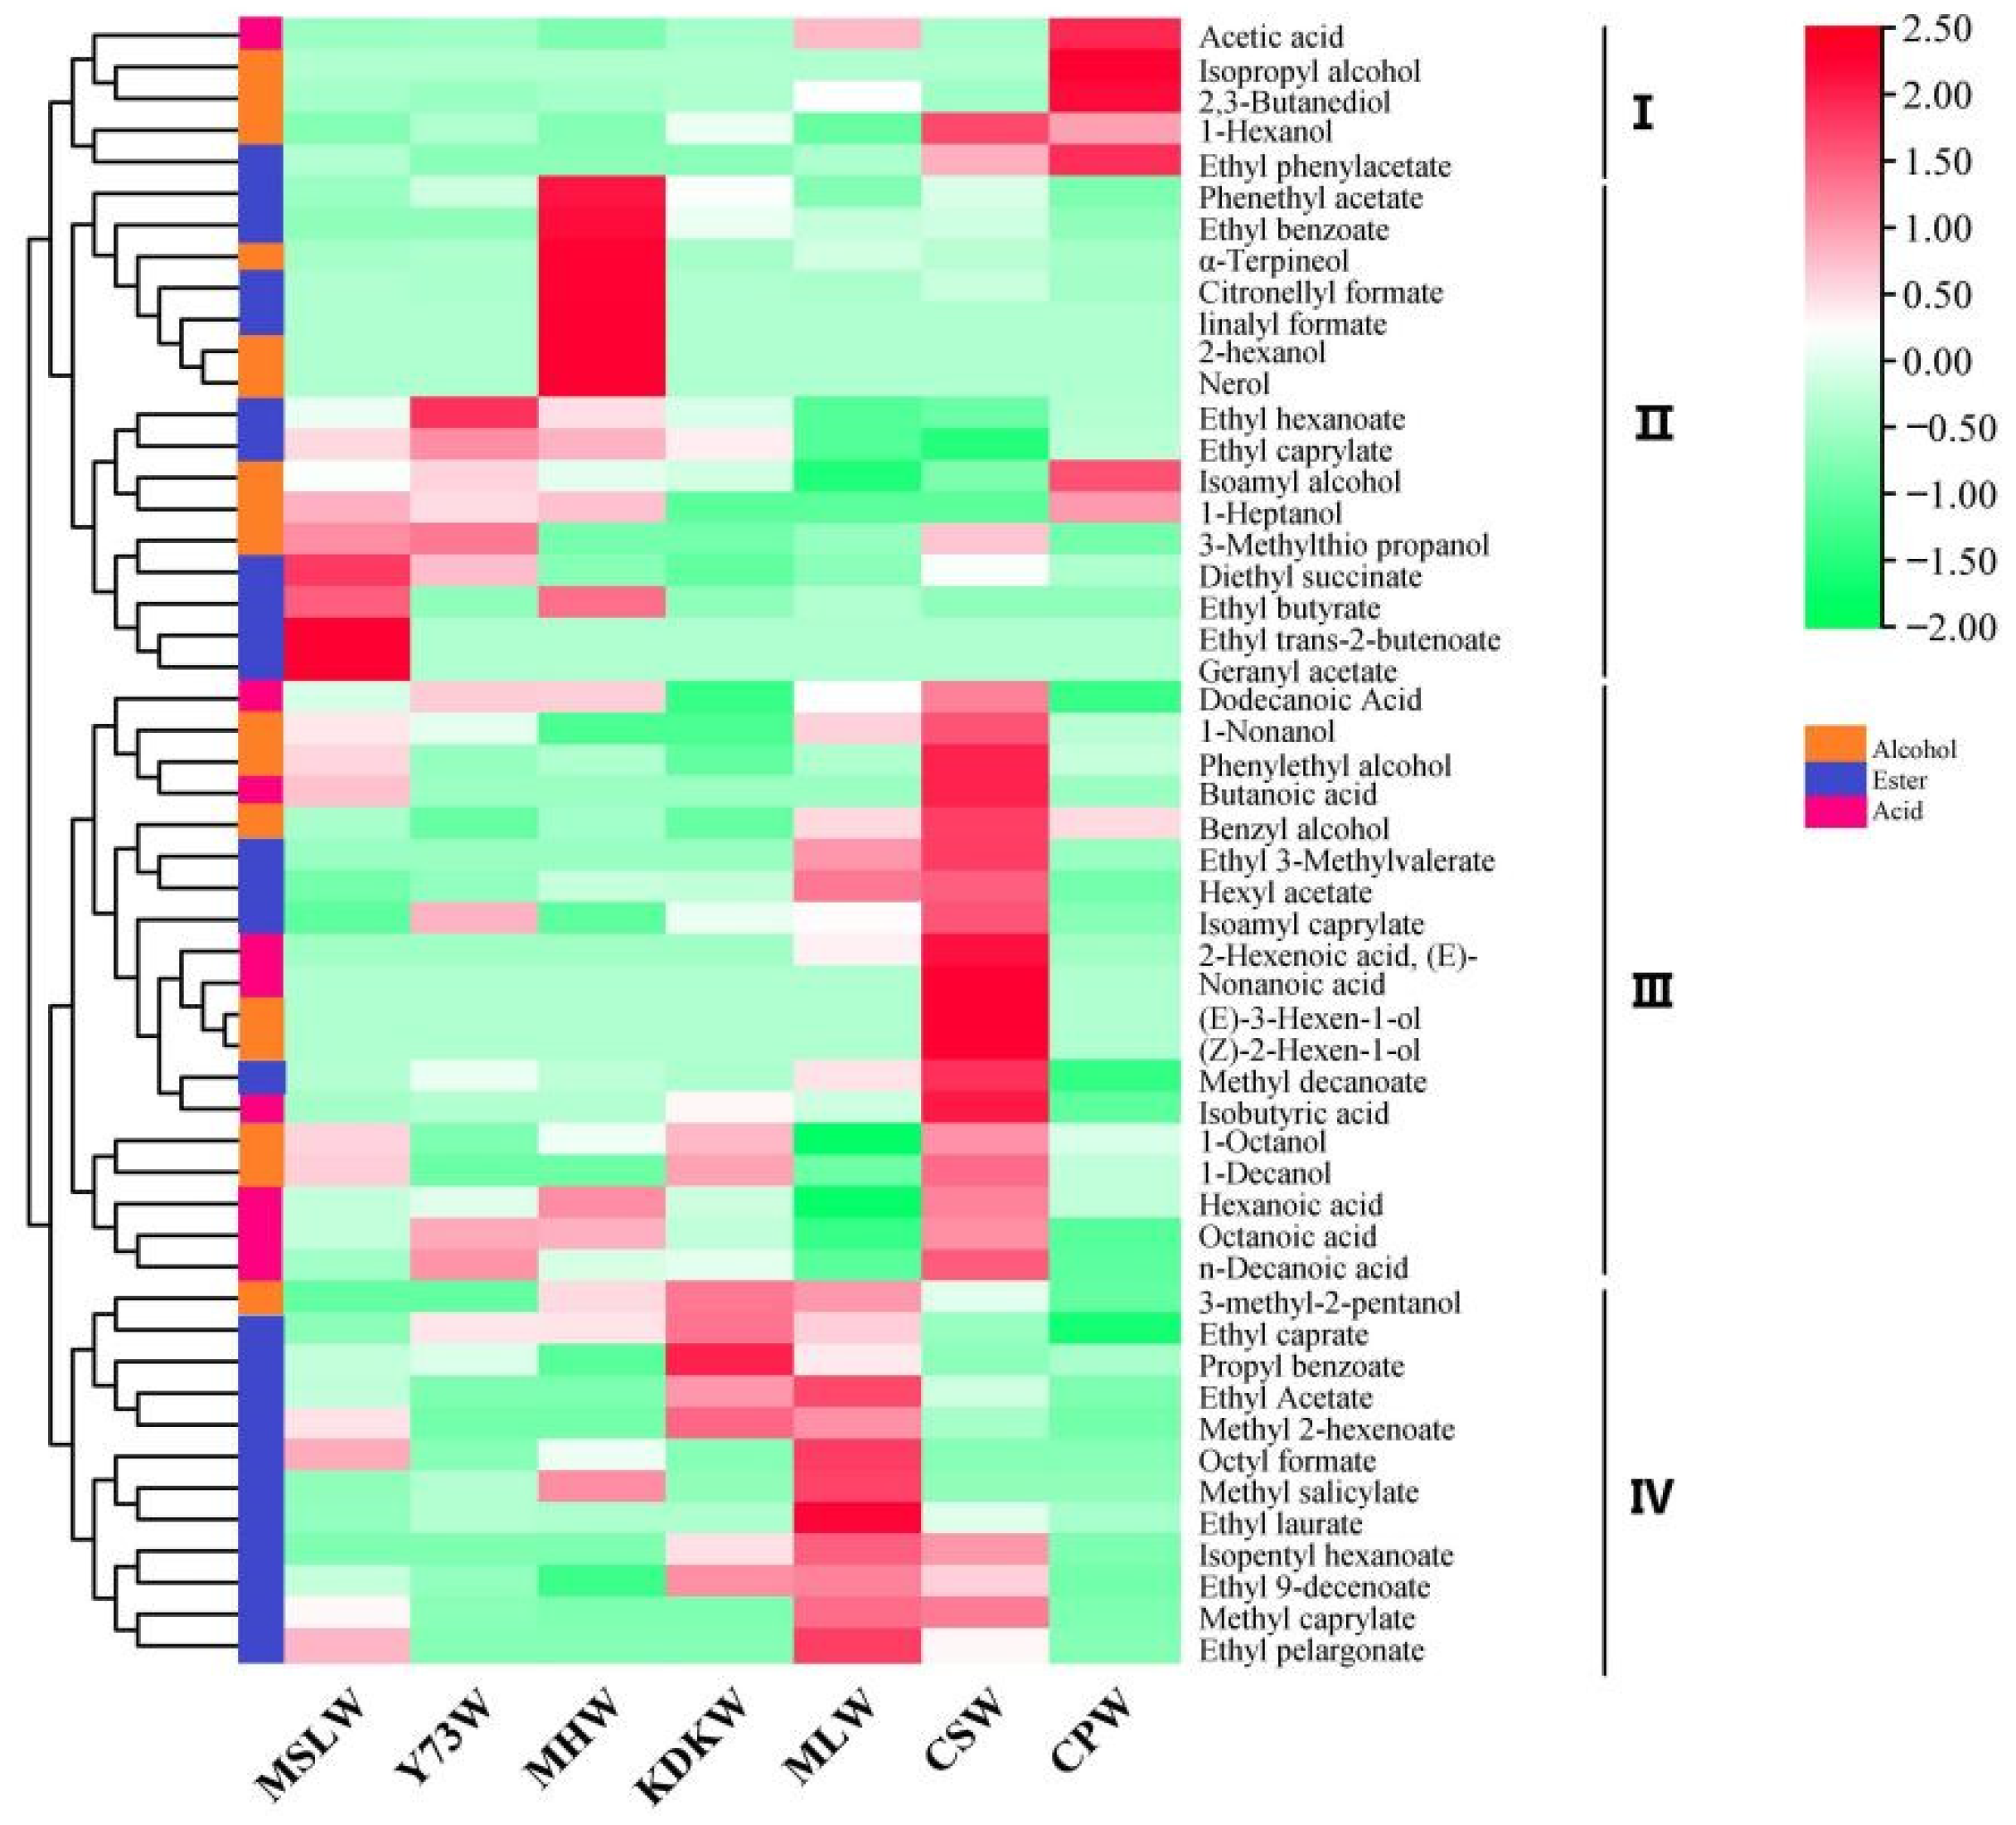
3.8. Volatile Compounds Composition and Content

Here, HS-SPME/GC-MS was used to analyze volatile compounds in seven grape cultivars and corresponding wines. A total of 61 aroma compounds were identified from 7 grape cultivars, including 14 alcohols, 24 esters, 6 aldehydes, 8 acids, 7 ketones, and 2 other volatile compounds (Table S2). However, more aroma compounds were determined from the wines, including 17 alcohols, 26 esters, 5 aldehydes, 9 acids, 7 ketones, and 5 other volatile compounds (Table S3). Wine aroma strongly affects wine quality, and volatile components that construct wine aroma are traditionally divided into three categories according to their orgin, as follows: grape, fermentation, and maturation aroma [60]. The aromatic characteristics play an important roles in the properties of the wine.
The composition and relative abundance of alcohols, esters, acids, aldehydes, ketones, and other compounds in different wines are shown in Figure 8a,b. As shown in Figure 8a, the highest content of the total volatile compounds was found in KDKW, followed by MLW, at 8403.43 μg/L and 7499.59 μg/L, respectively. The lowest content was determined in CPW, at only 3844.06 μg/L. The percentage content of compounds of different chemical types was found to be significant different in various wines (Figure 8b). Alcohols were the largest group of volatile compounds in all wines, accounting for 46–79%; this result is in accordance with other results for these and other red wine varieties [61]. Esters were the second most abundant group of volatile compounds in all wines (15–45%), and this result is consistent with previous studies for different red wine varieties [62]. This was followed by acids, as the percentage content of those in all wines was between 3–8%; this conclusion also was reported by previous data [63]. Furthermore, the number of mutual and unique aromas of different wines are presented by the Venn and upset diagrams in Figure 8c.

3.8.1. Alcohols

Higher alcohol has been considered as a secondary product of the yeast metabolism during alcoholic fermentation, and is related to pungent, caramel, and fruity odors [64]. They can have both positive and negative effects on wine aroma; in fact, they can have a detrimental effects when their concentrations exceed 400 mg/L, although they play a positive role when they are present at optimal levels [65]. As can be seen from the results in Table S3, the significant highest concentrations of isoamyl alcohol were found in different wine varieties ranging from 1565.27 to 3335.76 μg/L, followed by phenylethyl alcohol (495.26–1475.8 μg/L). The KDKW had the highest content of isoamyl alcohol. Isoamyl alcohol is described as having a whiskey and malty odor [66]. The interaction between isoamyl alcohol and the anthocyanin-derivative fraction and/or tannins is suggested to be involved in the formation of a “green character” in red wines. Phenylethyl alcohol is the most important benzene-derived higher alcohol, and is also the only fusel alcohol characterized with positive terms, such as sweet, rose, and perfumed [67]. The CSW had the highest content of phenylethyl alcohol. It has previously been reported in the literature as the major higher alcohol found in Cabernet Sauvignon wine [68], thus, supporting the results obtained here. In addition, 2-hexanol and nerol were only determined in MHW, and their contents were 0.1 and 43.09 μg/L, respectively. Here, 1-hexanol was found to be present in all wines, ranging from 16.37 μg/L in MHW to 51.05 μg/L in CSW. This compound provides the green character of the wine [69]. Overall, it was observed that the content of higher alcohol was obviously affected by the grape cultivar.

3.8.2. Esters

The yeasts produce aliphatic ethyl esters and acetates in enzymatic reactions during alcoholic fermentation [70], and the content of esters can also be modulated by lactic acid bacteria during malolactic fermentation [71]. Previous data indicated that esters play an important role in wine aroma perception even at low concentrations (a few micrograms per liter) through complex synergistic effects [72]. A total of 26 esters were identified in this study, and they were found to be significantly different in the compositions and contents of all wines (Figure 9). Phenethyl acetate, ethyl benzoate, citronellyl formate, and linalyl formate showed the highest concentrations in MHW. Diethyl succinate, ethyl butyrate, ethyl trans-2-butenoate, and geranyl acetate were found to be highest in MSLW. This study also found a significantly higher content of ethyl acetate, methyl 2-hexenoate, octyl formate, methyl salicylate, ethyl laurate, isopentyl hexanoate, ethyl 9-decenoate, methyl caprylate and ethyl pelargonate in MLW. To sum up, the types and contents of esters in the wine may depend on different grape varieties, which is consistent with the results of Philipp et al. [73].

3.8.3. Acids

A total of nine volatile fatty acids were identified from different wines. Fatty acids constitute an important aroma group that can contribute fruity, sour, cheesy, and rancid odors [14]. These compounds have been related with unpleasant flavors when above their sensory threshold [74] but, in this research, these compounds were present at subthreshold concentrations, and they had a positive contribution to the quality of all wines by increasing the aromatic complexity. The total concentration of these compounds in all wines ranged between 174.43 and 419.88 μg/L. This result is similar to that reported for other grape varieties by San et al. [75]. As shown in Figure 9, dodecanoic acid, butanoic acid, 2-hexenoic acid, nonanoic acid, and isobutyric acid were found at higher concentrations in CSW, and the results were similar with those of Vilanova et al., who found the highest content of fatty acids in Cabernet Sauvignon wine compared with other red wines [76].

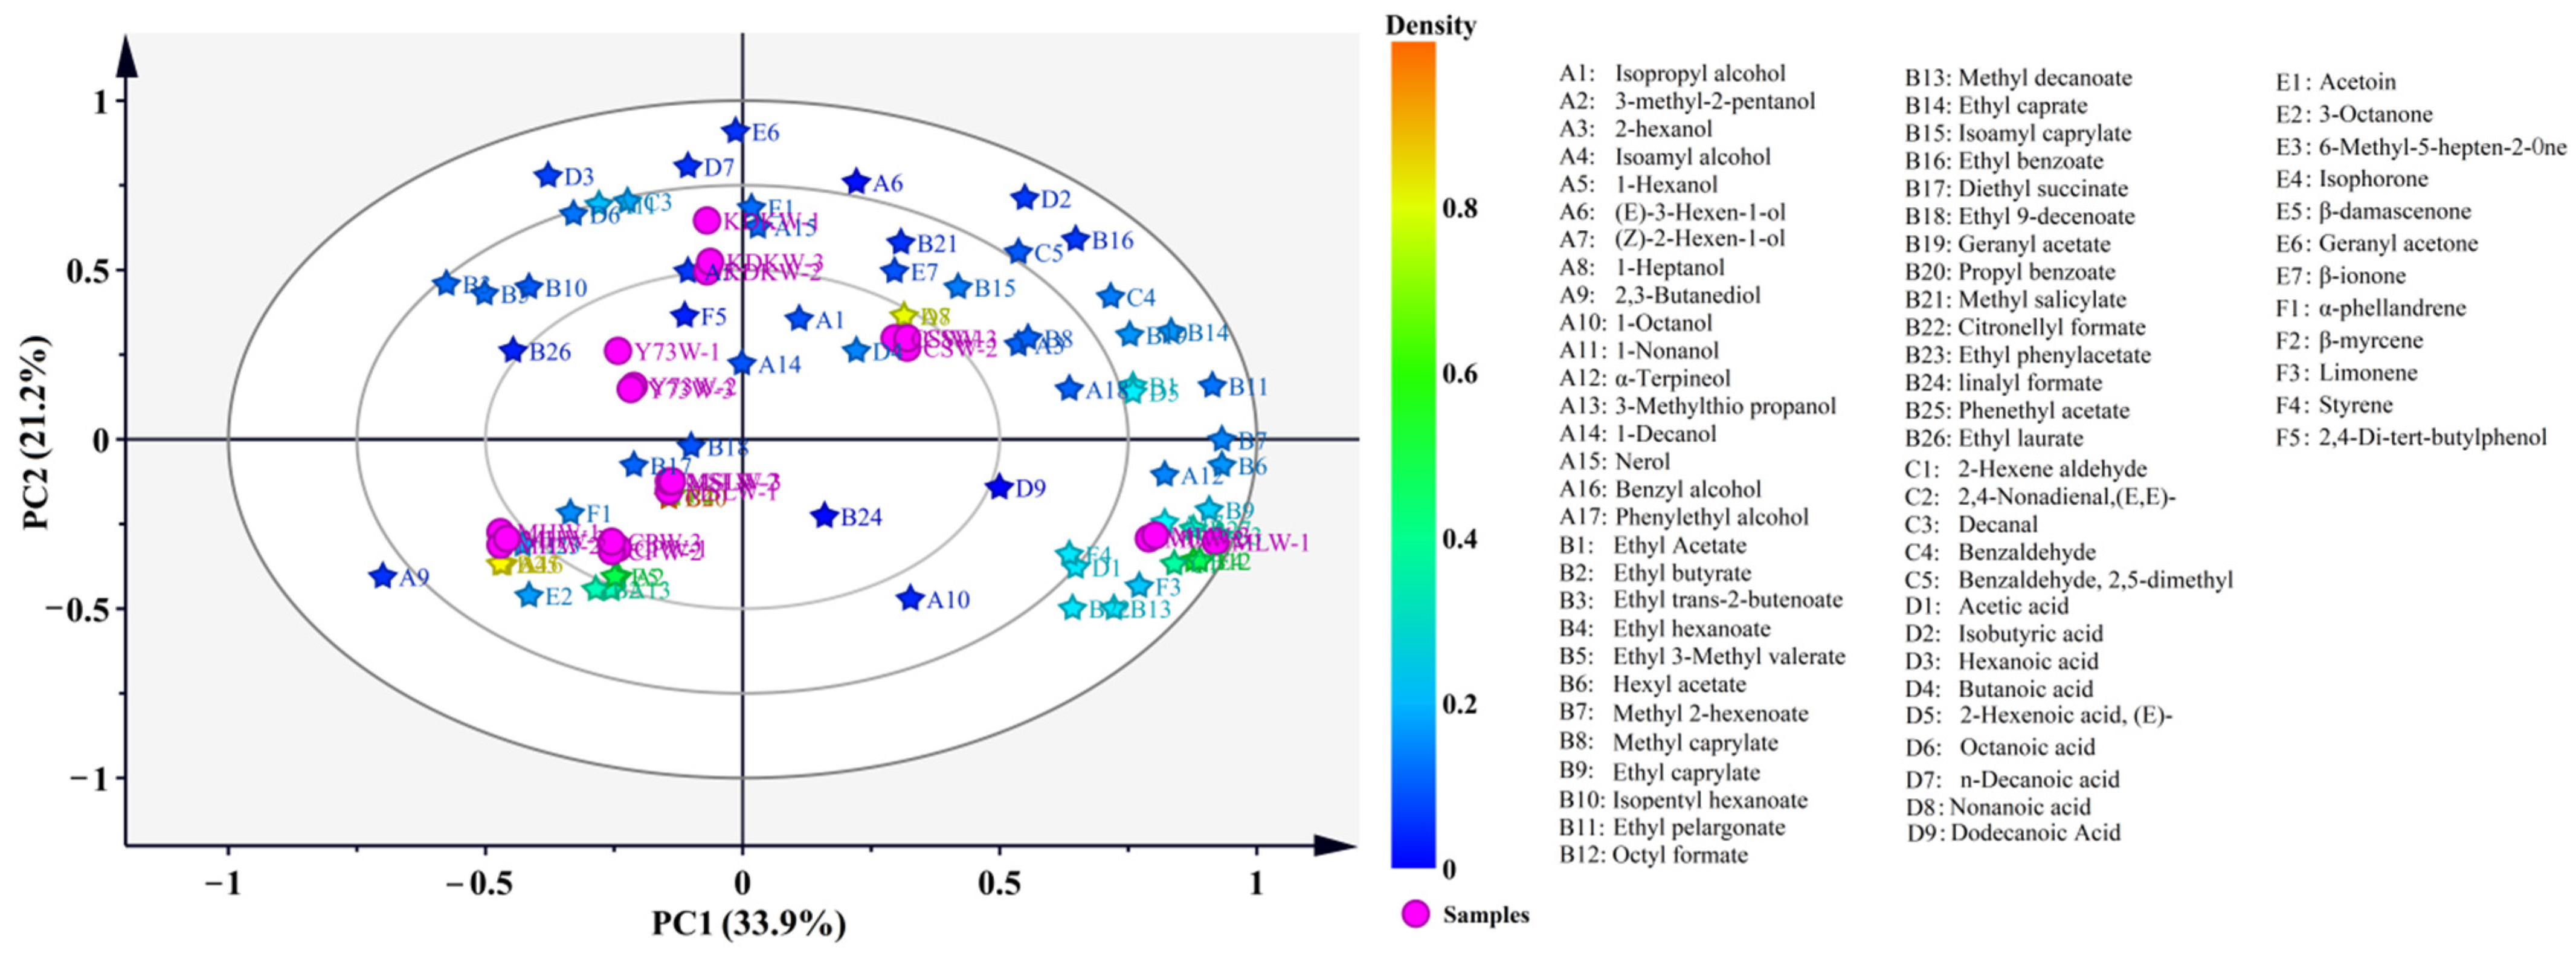
3.9. Principal Component Analysis

Principal component analysis (PCA) was applied to the data matrix containing the concentrations of 69 aroma compounds quantified by the HS-SPME-GC-MS technique, in order to detect differences/similarities among different wine samples. This study used PCA to explore possible differentiation among seven varieties of wine and present correlations between different wines and compounds (Figure 10). Here, 55.1% of the variance was explained by 69 different aroma compounds, with PC1 and PC2 accounting for 33.9 and 21.2% of the variance, respectively.
As shown in Figure 10, whether from the perspective of PC1 or PC2, a clear separation of different wine samples was observed, indicating that significant differences in volatile compounds occurred between wine varieties. Additionally, most volatile compounds clustered at KDKW and MLW, which indicated the higher concentrations of volatile compounds in these wines. In particular, MLW was located far away from the other wines, and abundant volatile compounds were found in MLW, whether in terms of type or content. Methyl caprylate was a distinctive aroma compound in MLW; moreover, 1-nonanol, benzyl alcohol, ethyl 3-methyl valerate, ethyl laurate, ethyl pelargonate, octyl formate, methyl salicylate, 2-hexene aldehyde, and limonene were strongly correlated to MLW. Other wines were surrounded by only a few volatile compounds. Only butanoic acid and nonanoic acid were clustered with CSW, which is consistent with the results of Duan et al., who found that the high-temperature circumstances in summer and perennial intense sun exposure in Xinjiang have a negative impact on the aroma of Cabernet Sauvignon wine [12].

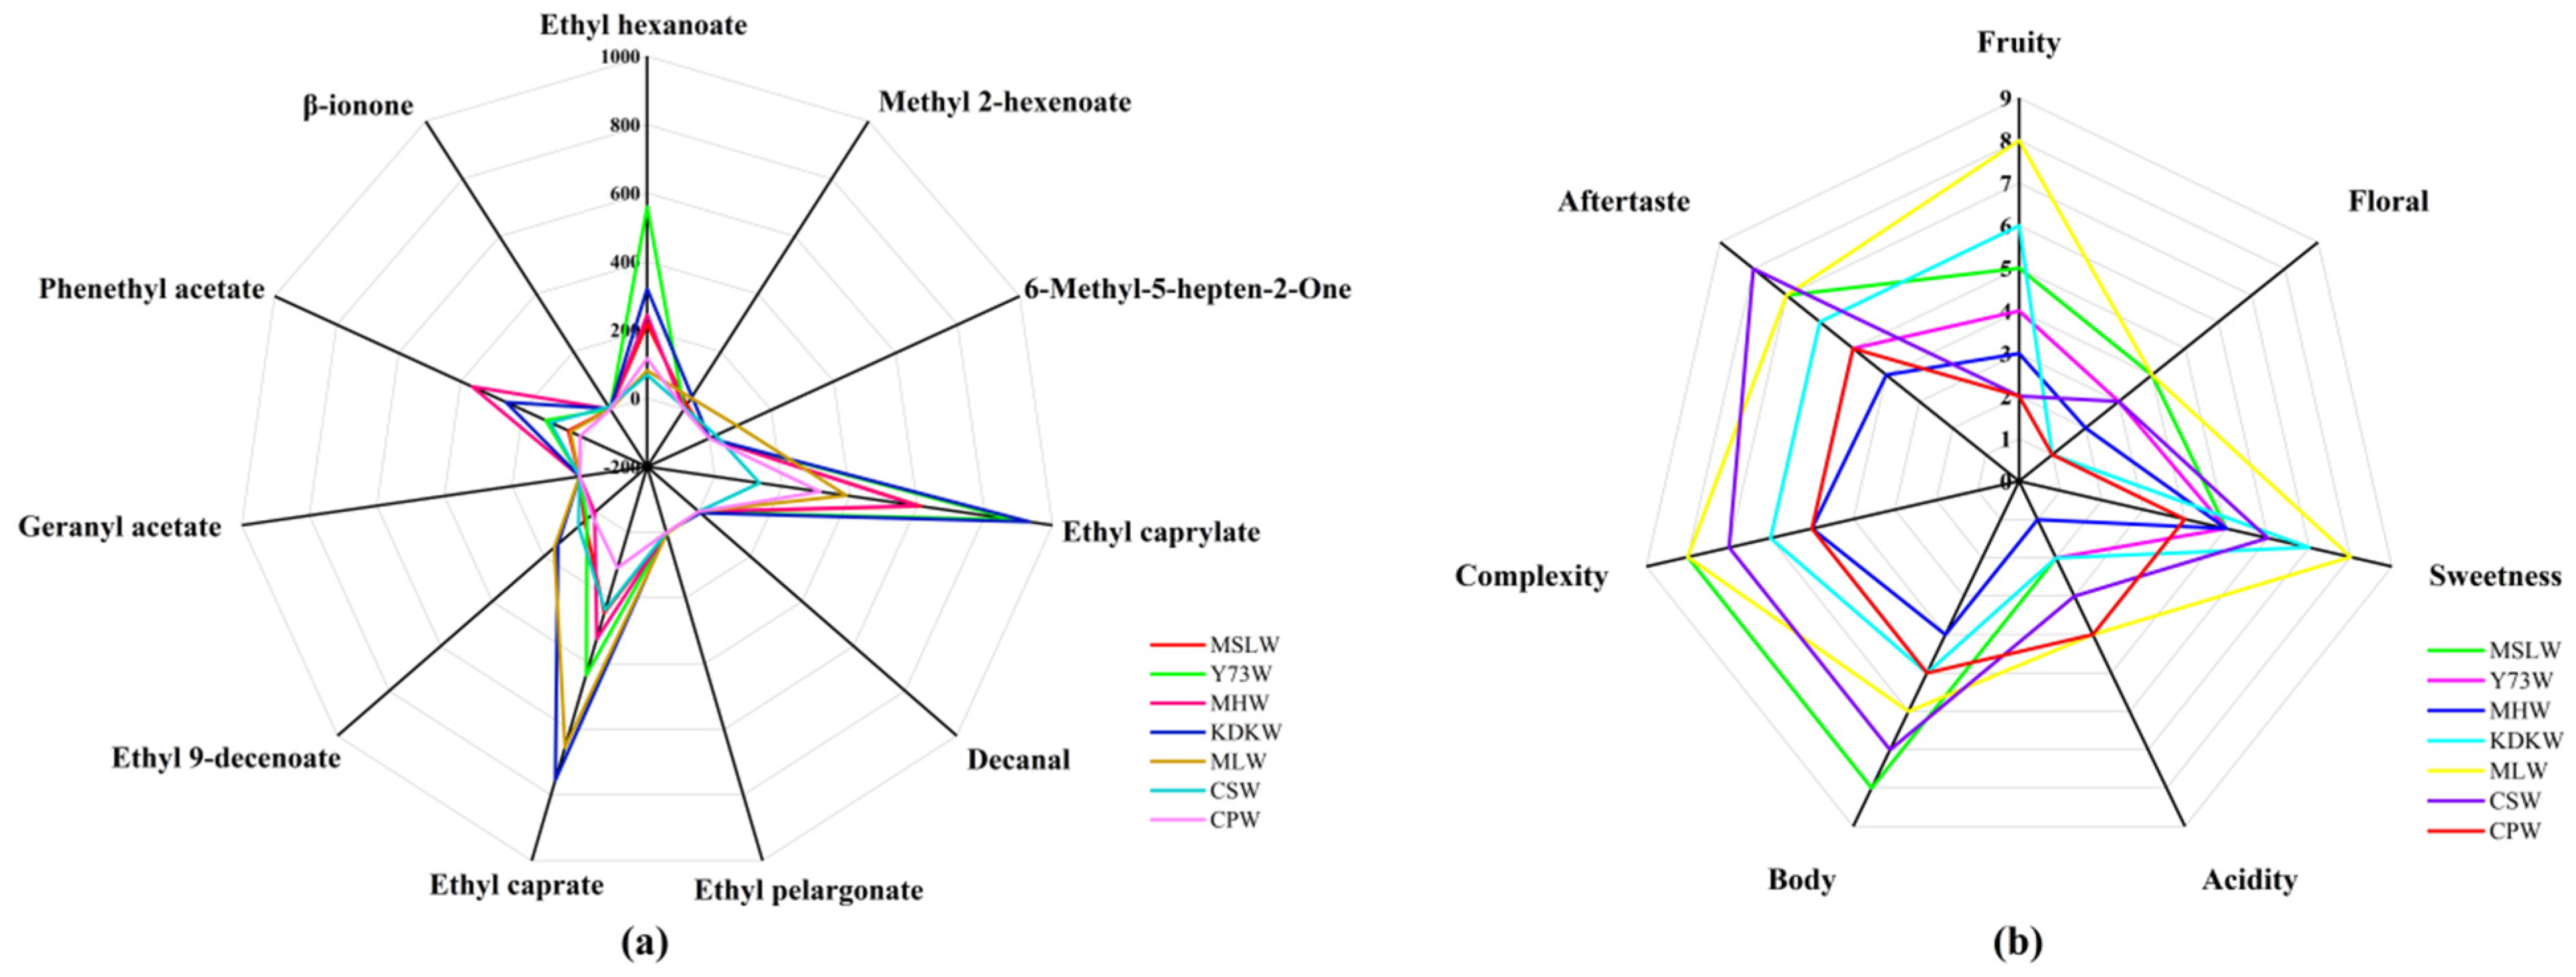
3.10. Identification of Aroma Fingerprints of Wines

Odor activity value (OAV) was used to characterize the contribution of each volatile compound to total aroma components, which is an objective method with certain reference value [77]. The OAV of each volatile compound was evaluated in order to identify potential impact odorants [78], which was calculated by dividing its concentration in the wine by the concentration corresponding to its odor threshold obtained from the previous literature [79]. In this study, 11 key aroma compounds (OAV > 1) were identified from all wines, comprising β-ionone, phenethyl acetate, geranyl acetate, ethyl 9-decenoate, ethyl caprate, ethyl pelargonate, decanal, ethyl caprylate, 6-methyl-5-hepten-2-one, methyl 2-hexenoate, and ethyl hexanoate (Figure S3). Furthermore, the obvious differences between these 11 volatile compounds were found in different wines (Figure 11). The total concentration of the 11 volatile compounds (OAV > 1) of wines decreased in the following order: KDKW > Y73W > MHW > MLW > MSLW > CSW > CPW. Ethyl caprylate is described as having pineapple and brandy odors, which was the dominant aromatic active compound in KDKW, Y73W, MHW, and CPW, ranging from 311.82 to 931.73 μg/L. Ethyl caprate, possessing a coconut aroma, was the main aromatic active compound in CSW and MLW. Geranyl acetate is always described as having rose and lemon odors; in this study, it only occurred in MSLW and, thus, may be distinctive aromatic compound of MSLW. Further analysis showed that all wines could be categorized into three types. Ethyl caprylate and ethyl caprate were the dominant aromatic active compounds in KDKW, MSLW, MLW, CSW, and MHW, which may be classified together; ethyl caprate and ethyl hexanoate accounted for a higher proportion in Y73W; ethyl caprylate and ethyl hexanoate were key aromatic compounds in CPW. Overall, the data indicates that the key aromatic compounds of wines were clearly identified in this study, and the results will provide a theoretical basis for differentiating seven varieties of wines.

3.11. Sensory Analysis of Different Wines

The results of the sensory evaluation of the wines produced from seven different grape cultivars were shown in Figure 11b. It was observed that both fruity flavors and sweetness were prominent in different wines, especially in MLW; this result is consistent with the results of Zhang et al. [80], who found that merlot wine has a strong fruity aroma. This study found that floral and acidic flavors were not obvious in all wines. Yildirim et al.’s research [81] has shown that phenolics, terpenes, ethyl esters, and ketones have positive effects on the floral aroma of the wine. However, in this study, lower concentrations of these compounds were detected in all wines, which may be the reason that they have weak floral aromas. Furthermore, acidity, when exceeding its threshold, can bring unpleasant feelings for human [82]. The body of the wine can be described as light, medium, or full [83]; except for MHW, all of the wines had fuller bodies. The complexity of wine flavor reflects the quality of the wine [84]. Here, MLW, MSLW, and CSW were positively appreciated by tasters, with higher “complexity” scores compared with other wines. Aftertaste, also called flavor length, is often described as short, medium, or long. Usually on the premise of a pleasant aftertaste, the longer it lasts, the better the quality of wine [85]. In general, CSW, MLW, and MSLW had a better aftertaste than other wines.

4. Conclusions

This study explored the differences in seven grape cultivars and corresponding wines through physicochemical indexes, organic acids, phenolic compounds, volatile compounds, antioxidant activity, and sensory diversity. Tartaric acid, malic acid, citric acid, lactic acid, and succinic acid were the prominent contributors to the acidity of different grapes and wines, and total contents of organic acid in wines were much larger than those in grapes. Highest concentrations of total phenols, total flavonoids, and total anthocyanins were found in Y73G and Y73W. Similarly, Y73W had the highest antioxidant activity compared to other wines. Regarding color parameters, MLW and CSW had higher blue tonality, MSLW and Y73W had higher red tonality; these wines had better color characteristics. Additionally, the total content of volatile compounds was measured as being highest in KDKW, followed by MLW; they had higher concentrations of esters, exhibiting strong fruity aromas. Our research provides more options for improving the homogeneity phenomenon in the wine industry of Xinjiang, and exhibits a foundation for exploring the blending fermentation of various red grapes.

Supplementary Materials

The following supporting information can be downloaded at: https://www.mdpi.com/article/10.3390/fermentation8120689/s1, Figure S1: the relative abundance of total anthocyanin, total flavonoid, total phenol in seven grape cultivars (a) and corresponding wines (b); Figure S2: the clustering analysis of twelve phenolic compounds in seven grape cultivars (a) and corresponding wines (b); Figure S3: overlay of the main ion chromatograms of seven varieties of wine; Table S1: antioxidant activity (mmol TE/L) in seven varieties of wine; Table S2: selected volatile compounds found in seven varieties of grapes (μg/kg); Table S3: selected volatile compounds found in seven varieties of wines (μg/L) [86,87,88,89,90,91,92].

Author Contributions

Conceptualization, X.S. and F.C.; methodology, Y.M. and H.W. (Huan Wang); software, X.S.; validation, R.Z. and H.W. (Huimin Wu); formal analysis, Y.M. and H.W. (Huan Wang); investigation, Y.M. and H.W. (Huan Wang); resources, P.Y.; data curation, Y.M. and H.W.; writing—original draft preparation, Y.M.; writing—review and editing, X.S. and F.C.; visualization, Y.M. and H.W. (Huan Wang); supervision, X.X. and P.Y.; project administration, X.S. and F.C.; funding acquisition, X.S. and F.C. All authors have read and agreed to the published version of the manuscript.

Funding

This research was funded by Science and Technology Reserch Project of the Seventh Division (No. 2022B01), Science and Technology Reserch Project of the Xinjiang Production and Construction Crops (No. 2020AB014), Science and Technology Research Project of the Fifth Division (No. 202001), the National Natural Science Foundation of China (No. 31960465), the Shihezi University Young Innovative Talents Training Program (No. CXBJ202004), the Bingtuan Science and Technology Program (No. 2022AB008), the Bingtuan Science and Technology Program (No. 2022DB006). We greatly appreciate Xinjiang Zhongxin Guoan Grape Wine Co., Ltd. for providing grape samples.

Institutional Review Board Statement

Not applicable.

Informed Consent Statement

Not applicable.

Data Availability Statement

Data are contained within the article or Supplementary Material.

Conflicts of Interest

The authors declare no conflict of interest.

References

  1. Yao, Y.; Chen, K.; Yang, X.Y.; Li, J.M.; Li, X.W. Comparative study of the key aromatic compounds of Cabernet Sauvignon wine from the Xinjiang region of China. J. Food. Sci. Technol. 2021, 58, 2109–2120. [Google Scholar] [CrossRef] [PubMed]
  2. Titarenko, O.; Khalafyan, A.; Temerdashev, A.; Kaunova, A.; Abakumov, G. Identification of the Varietal and Regional Origin of Red Wines by Classification Analysis. J. Anal. Chem. 2018, 73, 195–206. [Google Scholar] [CrossRef]
  3. Miller, V.; Block, E. A review of wine fermentation process modeling. J. Food. Eng. 2020, 273, 225–226. [Google Scholar] [CrossRef]
  4. Gambuti, A.; Picariello, L.; Rinaldi, A.; Moio, L. Evolution of Sangiovese Wines with varied tannin and anthocyanin ratios during oxidative aging. Front. Chem. 2018, 6, 32–35. [Google Scholar] [CrossRef] [Green Version]
  5. Kassara, S.; Kennedy, J.A. Relationship between red wine grade and phenolics. 2. tannin composition and size. J. Agr. Food Chem. 2011, 59, 8409–8412. [Google Scholar] [CrossRef]
  6. Stamatina, K.; Yorgos, K.; Maria, K.; Niki, P.; Argirios, T.; Garifalia, K. Analytical phenolic composition and sensory assessment of selected rare Greek cultivars after extended bottle ageing. J. Sci. Food Agr. 2015, 95, 1638–1647. [Google Scholar]
  7. Jagatic Korenika, M.; Tomaz, I.; Preiner, D.; Plichta, V.; Jeromel, A. Impact of commercial yeasts on phenolic profile of Plavac Mali wines from Croatia. Fermentation 2021, 7, 92. [Google Scholar] [CrossRef]
  8. Lombardi, G.; Cossignani, L.; Giua, L.; Simonetti, S.; Maurizi, A.; Burini, G.; Coli, R.; Blasi, F. Phenol composition and antioxidant capacity of red wines produced in Central Italy changes after one-year storage. J. Appl. Bot. Food Qual. 2017, 90, 197–204. [Google Scholar]
  9. Jiao, J.; Xia, Y.; Yang, M.; Zheng, J.; Liu, Y.; Cao, Z. Differences in grape-surface yeast populations significantly influence the melatonin level of wine in spontaneous fermentation. LWT Food Sci. Technol. 2022, 163, 45–47. [Google Scholar] [CrossRef]
  10. Bhattacharyya, N.; Seth, S.; Tudu, B.; Tamuly, P.; Jana, A.; Ghosh, D.; Bandyopadhyay, R.; Bhuyan, M.; Sabhapandit, S. Detection of optimum fermentation time for black tea manufacturing using electronic nose. Sensor. Actuat. B Chem. 2007, 122, 627–634. [Google Scholar] [CrossRef]
  11. Peng, B.; Lei, Y.; Zhao, H.; Cui, L. Response surface methodology for optimization of fermentation process parameters for improving apple wine quality. J. Food Sci. Technol. 2015, 52, 7513–7518. [Google Scholar] [CrossRef]
  12. Huang, Y.; Jiang, T.; Tan, J.; Li, R. Geographical origin traceability of red wines based on chemometric classification via organic acid profiles. J. Food Qual. 2017, 54, 45–47. [Google Scholar] [CrossRef]
  13. Pons, A.; Allamy, L.; Schuttler, A.; Rauhut, D.; Thibon, C.; Darriet, P. What is the expected impact of climate change on wine aroma compounds and their precursors in grape? Oeno One 2017, 51, 141–146. [Google Scholar] [CrossRef] [Green Version]
  14. Chen, H.; Yang, J.; Deng, X.; Lei, Y.; Xie, S.; Guo, S.; Ren, R.; Li, J.; Zhang, Z.; Xu, T. Foliar-sprayed manganese sulfate improves flavonoid content in grape berry skin of Cabernet Sauvignon (Vitis vinifera L.) growing on alkaline soil and wine chromatic characteristics. Food Chem. 2020, 314, 45–49. [Google Scholar] [CrossRef]
  15. Bellvert, J.; Marsal, J.; Mata, M.; Girona, J. Yield, Must composition, and wine quality responses to preveraison water deficits in sparkling base wines of chardonnay. Am. J. Eno. Viticult. 2016, 67, 1–12. [Google Scholar] [CrossRef]
  16. Collombel, I.; Campos, M.; Hogg, T. Changes in the composition of the lactic acid bacteria behavior and the diversity of Oenococcus oeni isolated from red wines supplemented with selected grape phenolic compounds. Fermentation 2018, 5, 1. [Google Scholar] [CrossRef] [Green Version]
  17. Izquierdo-Llopart, A.; Saurina, J. Multi-sensor characterization of sparkling wines based on data fusion. Chemosensors 2021, 9, 200. [Google Scholar] [CrossRef]
  18. Tao, Y.-S.; Li, H.; Wang, H. Data visualization of wine aroma compounds of Cabernet Sauvignon dry red wines from different origins in China. Chin. J. Anal. Chem. 2008, 36, 653–657. [Google Scholar]
  19. Zhang, K.; Yu, L.; Li, Q.; Wang, R.; Zhang, Z.Z. Comparison of the anthocyanins composition of five wine-making grape cultivars cultivated in the Wujiaqu area of Xinjiang, China. Oeno One 2019, 53, 549–559. [Google Scholar] [CrossRef] [Green Version]
  20. Duan, W.-P.; Zhu, B.-Q.; Song, R.-R.; Zhang, B.; Lan, Y.-B.; Zhu, X.; Duan, C.-Q.; Han, S.-Y. Volatile composition and aromatic attributes of wine made with Vitisvinifera L.cv Cabernet Sauvignon grapes in the Xinjiang region of China: Effect of different commercial yeasts. Int. J. Food Prop. 2018, 21, 1423–1441. [Google Scholar] [CrossRef] [Green Version]
  21. Petronilho, S.; Rudnitskaya, A.; Coimbra, M.A.; Rocha, S.M. Comprehensive study of variety oenological potential using statistic tools for the efficient use of non-renewable resources. Appl. Sci. 2021, 11, 4003. [Google Scholar] [CrossRef]
  22. Borazan, A.; Bozan, B. The influence of pectolytic enzyme addition and prefermentative mash heating during the winemaking process on the phenolic composition of Okuzgozu red wine. Food Chem. 2013, 138, 389–395. [Google Scholar] [CrossRef] [PubMed]
  23. Samaniego-Sanchez, C.; Marin-Garcia, G.; Quesada-Granados, J. A new fermented beverage from sugarcane (Saccharum officinarum L.) molasses: Analysis of physicochemical properties and antioxidant capacity, and comparison with other industrial alcohol products. LWT Food Sci. Technol. 2020, 128, 324–345. [Google Scholar] [CrossRef]
  24. Murtaza, A.; Huma, N.; Shabbir, A.; Murtaza, S.; Anees-Ur-Rehman, M. Survival of micro-organisms and organic acid profile of probiotic Cheddar cheese from buffalo milk during accelerated ripening. Int. J. Dairy Technol. 2017, 70, 562–571. [Google Scholar] [CrossRef]
  25. Andlauer, W.; Stumpf, C.; Furst, P. Influence of the acetification process on phenolic compounds. J. Agr. Food Chem. 2000, 48, 3533–3536. [Google Scholar] [CrossRef]
  26. Abu Bakar, F.; Mohamed, M.; Rahmat, A.; Fry, J. Phytochemicals and antioxidant activity of different parts of bambangan (Mangifera pajang) and tarap (Artocarpus odoratissimus). Food Chem. 2009, 113, 479–483. [Google Scholar] [CrossRef]
  27. Anon, A.; Lopez, F.; Hernando, D.; Orriols, I.; Revilla, E.; Losada, M. Effect of five enological practices and of the general phenolic composition on fermentation-related aroma compounds in Mencia young red wines. Food Chem. 2014, 148, 268–275. [Google Scholar] [CrossRef] [Green Version]
  28. Briz-Cid, N.; Figueiredo-Gonzalez, M.; Rial-Otero, R.; Cancho-Grande, B.; Simal-Gandara, J. Effect of two anti-fungal treatments (Metrafenone and Boscalid Plus Kresoxim-methyl) applied to vines on the color and phenol profile of different red wines. Molecules 2014, 19, 8093–8111. [Google Scholar] [CrossRef] [Green Version]
  29. Stopka, P.; Krizova, J.; Vrchotova, N.; Babikova, P.; Triska, J.; Balik, J.; Kyselakova, M. Antioxidant activity of wines and related matters studied by EPR spectroscopy. Czech J. Food Sci. 2008, 26, S49–S54. [Google Scholar] [CrossRef] [Green Version]
  30. Wang, J.; Wu, J.; Wang, X.; Li, S.; Zheng, C.; Du, H.; Xu, J.; Wang, S. Composition of phenolic compounds and antioxidant activity in the leaves of blueberry cultivars. J. Funct. Foods 2015, 16, 295–304. [Google Scholar] [CrossRef]
  31. Apak, R.; Guclu, K.; Ozyurek, M.; Karademir, E. Novel total antioxidant capacity index for dietary polyphenols and vitamins C and E, using their cupric ion reducing capability in the presence of neocuproine: CUPRAC method. J. Agr. Food Chem. 2004, 52, 7970–7981. [Google Scholar] [CrossRef]
  32. Di Mattia, D.; Piva, A.; Martuscelli, M.; Mastrocola, D.; Sachetti, G. Effect of sulfites on the in vitro antioxidant activity of wines. Ital. J. Food Sci. 2015, 27, 505–512. [Google Scholar]
  33. Mutanen, J.; Raty, J.; Gornov, E.; Lehtonen, P.; Peiponen, K.-E.; Jaaskelainen, T. Measurement of color, refractive index, and turbidity of red wines. Am. J. Enolo. Viticult. 2007, 58, 387–392. [Google Scholar] [CrossRef]
  34. Poggio, C.; Vialba, L.; Berardengo, A.; Federico, R.; Colombo, M.; Beltrami, R.; Scribante, A. Color Stability of New Esthetic Restorative Materials: A Spectrophotometric Analysis. J. Funct Biomater. 2017, 8, 26. [Google Scholar] [CrossRef]
  35. Cellamare, L.; D’Auria, M.; Emanuele, L.; Racioppi, R. The effect of light on the composition of some volatile compounds in wine: An HS-SPME-GC-MS study. Int. J. Food Sci. Technol. 2009, 44, 2377–2384. [Google Scholar] [CrossRef]
  36. Granato, D.; Katayama, U.; de Castro, A. Phenolic composition of South American red wines classified according to their antioxidant activity, retail price and sensory quality. Food Chem. 2011, 129, 366–373. [Google Scholar] [CrossRef]
  37. Rolle, L.; Torchio, F.; Giacosa, S.; Segade, R.; Cagnasso, E.; Gerbi, V. Assessment of physicochemical differences in Nebbiolo grape berries from different production areas and sorted by flotation. Am. J. Enolo. Viticult. 2012, 63, 195–204. [Google Scholar] [CrossRef]
  38. Yuan, F.; Wang, T.; Chen, Y.; Wang, H.; Gong, G.; Li, Y. Microwave irradiation: Impacts on physicochemical properties of red wine. Cyta J. Food 2020, 18, 281–290. [Google Scholar] [CrossRef]
  39. Ricciutelli, M.; Moretti, S.; Galarini, R.; Sagratini, G.; Mari, M.; Lucarini, S.; Vittori, S.; Caprioli, G. Identification and quantification of new isomers of isopropyl-malic acid in wine by LC-IT and LC-Q-Orbitrap. Food Chem. 2019, 294, 390–396. [Google Scholar] [CrossRef]
  40. Ma, Y.; Li, T.; Xu, X.; Ji, Y.; Jiang, X.; Shi, X.; Wang, B. Investigation of volatile compounds, microbial succession, and their relation during spontaneous fermentation of Petit Manseng. Front. Microbiol. 2021, 12, 34–36. [Google Scholar] [CrossRef]
  41. Valentao, P.; Seabra, M.; Lopes, G.; Silva, R.; Martins, V.; Trujillo, E.; Velazquez, E.; Andrade, B. Influence of Dekkera bruxellensis on the contents of anthocyanins, organic acids and volatile phenols of Dao red wine. Food Chem. 2007, 100, 64–70. [Google Scholar] [CrossRef]
  42. Wang, Q.; Su, N.; Zhang, H.; Yang, P. The effects of pulsed electric fields applied to red and white wines during bottle ageing on organic acid contents. J. Food Sci Technol. 2015, 52, 171–180. [Google Scholar] [CrossRef]
  43. Hosu, A.; Cristea, M.; Cimpoiu, C. Analysis of total phenolic, flavonoids, anthocyanins and tannins content in Romanian red wines: Prediction of antioxidant activities and classification of wines using artificial neural networks. Food Chem. 2014, 150, 113–118. [Google Scholar] [CrossRef] [PubMed]
  44. Ye, Z.; Shavandi, A.; Harrison, R.; Bekhit, A. Characterization of Phenolic Compounds in Wine Lees. Antioxidants 2018, 7, 25–27. [Google Scholar]
  45. Zeng, L.; Teissedre, L.; Jourdes, M. Structures of polymeric pigments in red wine and their derived quantification markers revealed by high-resolution quadrupole time-of-flight mass spectrometry. Rapid Commun. Mass Sp. 2016, 30, 81–88. [Google Scholar] [CrossRef] [PubMed]
  46. Agatonovic-Kustrin, S.; Hettiarachchi, G.; Morton, W.; Razic, S. Analysis of phenolics in wine by high performance thin-layer chromatography with gradient elution and high resolution plate imaging. J. Pharmaceut. Biomed. 2015, 102, 93–99. [Google Scholar] [CrossRef]
  47. Garaguso, I.; Nardini, M. Polyphenols content, phenolics profile and antioxidant activity of organic red wines produced without sulfur dioxide/sulfites addition in comparison to conventional red wines. Food Chem. 2015, 179, 336–342. [Google Scholar] [CrossRef]
  48. Guan, L.; Li, H.; Fan, G.; Li, H.; Fang, B.; Dai, W.; Delrot, S.; Wang, J.; Wu, H. Regulation of anthocyanin biosynthesis in tissues of a Teinturier grape cultivar under sunlight exclusion. Am. J. Enolo. Viticult. 2014, 65, 363–374. [Google Scholar] [CrossRef]
  49. Luan, Y.; Zhang, W.; Xi, M.; Huo, S.; Ma, N. Comparing the effects of exogenous abscisic acid on the phenolic composition of Yan 73 and Cabernet Sauvignon (Vitis vinifera L.) wines. Eur. Food Res. Technol. 2014, 239, 203–213. [Google Scholar] [CrossRef]
  50. Xu, F.; Luan, Y.; Zhang, W.; Huo, S.; Gao, X.; Fang, L.; Xi, M. Phenolic profiles and antioxidant properties of young wines made from Yan73 (Vitis vinifera L.) and Cabernet Sauvignon (Vitis vinifera L.) grapes treated by 24-Epibrassinolide. Molecules 2014, 19, 10189–10207. [Google Scholar] [CrossRef] [Green Version]
  51. Lopez-Velez, M.; Martinez-Martinez, F.; Del Valle-Ribes, C. The study of phenolic compounds as natural antioxidants in wine. Crit. Rev. Food Sci. 2003, 43, 233–244. [Google Scholar] [CrossRef]
  52. Manolescu, N.; Oprea, E.; Bodolica, M.; Simion, C. Is wine industrialization lowering natural qualities of white wines? Rev. Roum. Chim. 2016, 61, 199–203. [Google Scholar]
  53. Ghatak, A.; Chaturvedi, A.; Desai, S. Indian grape wines: A potential source of phenols, polyphenols, and antioxidants. Int. J. Food Prop. 2014, 17, 818–828. [Google Scholar] [CrossRef]
  54. Jose Jara-Palacios, M.; Gordillo, B.; Lourdes Gonzalez-Miret, M.; Hernanz, D.; Luisa Escudero-Gilete, M.; Heredia, J. Comparative study of the enological potential of different winemaking byproducts: Implications in the antioxidant activity and color expression of red wine anthocyanins in a model solution. J. Agr. Food Chem. 2014, 62, 6975–6983. [Google Scholar] [CrossRef]
  55. Briz-Cid, N.; Figueiredo-Gonzalez, M.; Rial-Otero, R.; Cancho-Grande, B.; Simal-Gandara, J. The measure and control of effects of botryticides on phenolic profile and color quality of red wines. Food Control 2015, 50, 942–948. [Google Scholar] [CrossRef]
  56. Fragoso, S.; Guasch, J.; Acena, L.; Mestres, M.; Busto, O. Prediction of red wine colour and phenolic parameters from the analysis of its grape extract. Int. J. Food Sci. Technol. 2011, 46, 2569–2575. [Google Scholar] [CrossRef]
  57. He, F.; Liang, N.; Mu, L.; Pan, H.; Wang, J.; Reeves, J.; Duan, Q. Anthocyanins and their variation in red wines II. anthocyanin derived pigments and their color evolution. Molecules 2012, 17, 1483–1519. [Google Scholar] [CrossRef] [Green Version]
  58. Gordillo, B.; Jesus Cejudo-Bastante, M.; Rodriguez-Pulido, J.; Lourdes Gonzalez-Miret, M.; Heredia, J. Application of the differential colorimetry and polyphenolic profile to the evaluation of the chromatic quality of Tempranillo red wines elaborated in warm climate. Influence of the presence of oak wood chips during fermentation. Food Chem. 2013, 141, 2184–2190. [Google Scholar] [CrossRef] [PubMed]
  59. Zhang, S.; Du, G.; Gao, T.; Wang, W.; Meng, D.; Li, J.; Brennan, C.; Wang, Y.; Zhao, H.; Wang, Y.; et al. The effect of carbonic maceration during winemaking on the color, aroma and sensory properties of ‘Muscat Hamburg’ wine. Molecules 2019, 24, 3120. [Google Scholar] [CrossRef] [PubMed] [Green Version]
  60. Ilc, T.; Werck-Reichhart, D.; Navrot, N. Meta-analysis of the core aroma components of grape and wine aroma. Front. Plant Sci. 2016, 7, 24–27. [Google Scholar] [CrossRef] [Green Version]
  61. Saenz-Navajas, M.-P.; Arias, I.; Ferrero-del-Teso, S.; Fernandez-Zurbano, P.; Escudero, A.; Ferreira, V. Chemo-sensory approach for the identification of chemical compounds driving green character in red wines. Food Res. Int. 2018, 109, 138–148. [Google Scholar] [CrossRef] [PubMed] [Green Version]
  62. Lambropoulos, I.; Roussis, G. Inhibition of the decrease of volatile esters and terpenes during storage of wines and a model wine medium by wine phenolic extracts. Food Technol. Biotech. 2007, 45, 147–155. [Google Scholar]
  63. Petronilho, S.; Lopez, R.; Ferreira, V.; Coimbra, A.; Rocha, M. Revealing the usefulness of aroma networks to explain wine aroma properties: A case study of portuguese wines. Molecules 2020, 25, 272. [Google Scholar] [CrossRef] [PubMed] [Green Version]
  64. Tufariello, M.; Capone, S.; Siciliano, P. Volatile components of Negroamaro red wines produced in Apulian Salento area. Food Chem. 2012, 132, 2155–2164. [Google Scholar] [CrossRef]
  65. De-la-Fuente-Blanco, A.; Saenz-Navajas, P.; Ferreira, V. On the effects of higher alcohols on red wine aroma. Food Chem. 2016, 210, 107–114. [Google Scholar] [CrossRef]
  66. Song, Q.; Li, H.; Liang, Y.; Tao, S.; Mi, Q.; Qian, C.; Wang, H. Characterisation of volatile components of red and sparkling wines from a new wine grape cultivar ‘Meili’ (Vitis vinifera L.). Vitis 2013, 52, 41–48. [Google Scholar]
  67. Rutan, E.; Herbst-Johnstone, M.; Kilmartin, A. Effect of cluster thinning vitis vinifera cv. Pinot Noir on wine volatile and phenolic composition. J. Agr. Food Chem. 2018, 66, 10053–10066. [Google Scholar] [CrossRef]
  68. Han, B.; Gao, J.; Han, X.; Deng, H.; Wu, T.; Li, C.; Zhan, J.; Huang, W.; You, Y. Hanseniaspora uvarum FS35 degrade putrescine in wine through the direct oxidative deamination pathway of copper amine oxidase 1. Food Res. Int. 2022, 162, 25–28. [Google Scholar] [CrossRef]
  69. Fabani, P.; Ravera, J.A.; Wunderlin, A. Markers of typical red wine varieties from the Valley of Tulum (San Juan-Argentina) based on VOCs profile and chemometrics. Food Chem. 2013, 141, 1055–1062. [Google Scholar] [CrossRef]
  70. Ouyang, X.; Zhu, B.; Liu, R.; Gao, Q.; Lin, G.; Wu, J.; Hu, Z.; Zhang, B. Comparison of volatile composition and color attributes of mulberry wine fermented by different commercial yeasts. J. Food Process. Pres. 2018, 42, 450–453. [Google Scholar] [CrossRef]
  71. Antalick, G.; Perello, C.; de Revel, G. Esters in wines: New insight through the establishment of a database of French wines. Am. J. Enolo. Viticult. 2014, 65, 293–304. [Google Scholar] [CrossRef]
  72. Lytra, G.; Tempere, S.; Marchand, S.; de Revel, G.; Barbe, C. How do esters and dimethyl sulphide concentrations affect fruity aroma perception of red wine? Demonstration by dynamic sensory profile evaluation. Food Chem. 2016, 194, 196–200. [Google Scholar] [CrossRef]
  73. Philipp, C.; Nauer, S.; Sari, S.; Eder, P.; Patzl-Fischerleitner, E.; Eder, R. Quantification of 38 volatile ester compounds by means of SIDA-HS-SPME-GC-MS in ‘Pinot blanc’ wines and comparison with other important Austrian varieties. Mitteilungen Klosterneuburg. 2019, 69, 93–114. [Google Scholar]
  74. Rossetti, F.; Jouin, A.; Jourdes, M.; Teissedre, L.; Foligni, R.; Longo, E.; Boselli, E. Impact of different stoppers on the composition of red and rose Lagrein, Schiava (Vernatsch) and Merlot wines stored in bottle. Molecules 2020, 25, 4276. [Google Scholar] [CrossRef] [PubMed]
  75. San Juan, F.; Cacho, J.; Ferreira, V.; Escudero, A. Aroma chemical composition of red wines from different price categories and its relationship to quality. J. Agr. Food Chem. 2012, 60, 5045–5056. [Google Scholar] [CrossRef]
  76. Vilanova, M.; Genisheva, Z.; Grana, M.; Oliveira, M. Determination of odorants in varietal wines from international grape cultivars (Vitis vinifera) grown in NW Spain. S. Afr. J. Enol. Viticult. 2013, 34, 212–222. [Google Scholar] [CrossRef] [Green Version]
  77. Gomez Garcia-Carpintero, E.; Sanchez-Palomo, E.; Gomez Gallego, A.; Gonzalez-Vinas, A. Characterization of impact odorants and sensory profile of Bobal red wines from Spain’s La Mancha region. Flavour. Frag. J. 2012, 27, 60–68. [Google Scholar] [CrossRef]
  78. Garcia-Carpintero, G.; Sanchez-Palomo, E.; Gomez Gallego, A.; Gonzalez-Vinas, A. Effect of cofermentation of grape varieties on aroma profiles of La Mancha red wines. J. Food Sci. 2011, 76, C1169–C1180. [Google Scholar] [CrossRef]
  79. Capone, S.; Tufariello, M.; Siciliano, P. Analytical characterisation of Negroamaro red wines by “Aroma Wheels”. Food Chem. 2013, 141, 2906–2915. [Google Scholar] [CrossRef]
  80. Zhang, L.; Tao, Y.S.; Wen, Y.; Wang, H. Aroma evaluation of young Chinese Merlot wines with denomination of origin. S. Afr. J. Enolo. Viticult. 2013, 34, 46–53. [Google Scholar] [CrossRef] [Green Version]
  81. Yildirim, K.; Elmaci, Y.; Ova, G.; Altug, T.; Yuecel, U. Descriptive analysis of red wines from different grape cultivars in turkey. Int. J. Food Prop. 2007, 10, 93–102. [Google Scholar] [CrossRef]
  82. Koussissi, E.; Paterson, A.; Piggott, R. Sensory flavour discrimination of Greek dry red wines. J. Sci. Food. Agr. 2003, 83, 797–808. [Google Scholar] [CrossRef]
  83. Saenz-Navajas, P.; Martin-Lopez, C.; Ferreira, V.; Fernandez-Zurbano, P. Sensory properties of premium Spanish red wines and their implication in wine quality perception. Aust. J. Grape Wine R 2011, 17, 9–19. [Google Scholar] [CrossRef]
  84. Llobodanin, G.; Barroso, P.; Castro, A. Sensory characterization of young South American red wines classified by varietal and origin. J. Food Sci. 2014, 79, S1595–S1603. [Google Scholar] [CrossRef] [PubMed]
  85. McKay, M.; Buica, A. Factors influencing olfactory perception of selected off-flavour-causing compounds in red wine–A Review. S. Afr. J. Enolo. Viticult. 2020, 41, 56–71. [Google Scholar]
  86. Cao, W.; Shu, N.; Wen, J.; Yang, Y.; Jin, Y.; Lu, W. Characterization of the key aroma volatile compounds in nine different grape varieties wine by headspace gas chromatography-ion mobility spectrometry (HS-GC-IMS), odor activity values (OAV) and sensory analysis. Foods 2022, 11, 2767. [Google Scholar] [CrossRef] [PubMed]
  87. Garcia-Ruiz, A.; Jose Rodriguez-Bencomo, J.; Garrido, I.; Martin-Alvarez, J.; Victoria Moreno-Arribas, M.; Bartolome, B. Assessment of the impact of the addition of antimicrobial plant extracts to wine: Volatile and phenolic composition. J. Sci. Food Agr. 2013, 93, 2507–2516. [Google Scholar] [CrossRef] [PubMed] [Green Version]
  88. Lorenzo, C.; Pardo, F.; Zalacain, A.; Alonso, L.; Salinas, R. Differentiation of co-winemaking wines by their aroma composition. Euro Food Res. Techol. 2008, 227, 777–787. [Google Scholar] [CrossRef]
  89. Pavez, C.; Steinhaus, M.; Casaubon, G.; Schieberle, P.; Agosin, E. Identification, quantitation and sensory evaluation of methyl 2-and methyl 3-methylbutanoate in varietal red wines. Aust. J. Grape Wine Res. 2015, 21, 189–193. [Google Scholar] [CrossRef]
  90. Radeka, S.; Lukic, I.; Persuric, D. Influence of different maceration treatments on the aroma profile of rose and red wines from croatian aromatic cv. Muskat ruza porecki (Vitis vinifera L.). Food Technol. Biotech. 2012, 50, 442–453. [Google Scholar]
  91. Sanchez-Palomo, E.; Gomez Garcia-Carpintero, E.; Alonso-Villegas, R.; Gonzalez-Vinas, A. Characterization of aroma compounds of Verdejo white wines from the La Mancha region by odour activity values. Flavour. Frag. J. 2010, 25, 456–462. [Google Scholar] [CrossRef]
  92. Sanchez-Palomo, E.; Trujillo, M.; Garcia Ruiz, A.; Gonzalez Vinas, A. Aroma profile of malbec red wines from La Mancha region: Chemical and sensory characterization. Food Res. Int. 2017, 100, 201–208. [Google Scholar] [CrossRef] [PubMed]
Figure 1. Difference in seven organic acid contents (g/L) in seven grape cultivars and corresponding wines. Samples’ full names are as follows: MSL (Marselan), Y73 (Yan 73), MH (Muscat Hamburg), KDK (Kadarka), ML (Merlot), CS (Cabernet Sauvignon) and CP (Crimpose). Furthermore, G represents “grape” and W represents “wine”.
Fermentation 08 00689 g001
Figure 2. The clustering analysis of seven organic acids in seven grape cultivars (a) and corresponding wines (b). If the color of the circle tends towards red, the content of organic acid is higher. Samples’ full names are as follows: MSL (Marselan), Y73 (Yan 73), MH (Muscat Hamburg), KDK (Kadarka), ML (Merlot), CS (Cabernet Sauvignon) and CP (Crimpose). Furthermore, G represents “grape” and W represents “wine”.
Fermentation 08 00689 g002
Figure 3. The content of total phenol, total flavonoid, and total anthocyanin of seven grape cultivars and corresponding wines (p ≤ 0.05). Samples’ full names are as follows: MSL (Marselan), Y73 (Yan 73), MH (Muscat Hamburg), KDK (Kadarka), ML (Merlot), CS (Cabernet Sauvignon) and CP (Crimpose). Furthermore, G represents “grape” and W represents “wine”.
Fermentation 08 00689 g003
Figure 4. The relative abundance of 12 polyphenols in 7 grape cultivars and corresponding wines. Samples’ full names, as follows: MSL (Marselan), Y73 (Yan 73), MH (Muscat Hamburg), KDK (Kadarka), ML (Merlot), CS (Cabernet Sauvignon) and CP (Crimpose). Furthermore, G represents “grape” and W represents “wine”.
Fermentation 08 00689 g004
Figure 5. The antioxidant activities (mmol TE/L) of wines produced from seven different grape varieties (p ≤ 0.05). Samples’ full names, as follows: MSL (Marselan), Y73 (Yan 73), MH (Muscat Hamburg), KDK (Kadarka), ML (Merlot), CS (Cabernet Sauvignon) and CP (Crimpose). Furthermore, G represents “grape” and W represents “wine”.
Fermentation 08 00689 g005
Figure 6. The correlations between phenolic compounds and antioxidant activity. Strong and weak correlations are indicated by the large and small circles, respectively. The color of the scale bar denotes the nature of the correlation; 1 indicates a perfect positive correlation (red), and −1 indicates a perfect negative correlation (blue). Significant correlations (p ≤ 0.05) are indicated by *.
Fermentation 08 00689 g006
Figure 7. Color analysis of wines produced from seven different grape varieties. (a) Color intensity (CI) and tonality (To); (b) %Yellow, %Red, %Blue; (c) C*, h*; (d) l*, a*, b*. The * is part of the full name to distinguish it from the letters C, h, l, a, b (p ≤ 0.05). Samples’ full names, as follows: MSL (Marselan), Y73 (Yan 73), MH (Muscat Hamburg), KDK (Kadarka), ML (Merlot), CS (Cabernet Sauvignon) and CP (Crimpose). Furthermore, G represents “grape” and W represents “wine”.
Fermentation 08 00689 g007
Figure 8. The composition of volatile compounds in wines produced from seven different grape varieties (a). The relative abundance of volatile compounds in all wines (b). The Venn diagram and upset plot of all wines (c). In the upset plot, black dots indicate the common aroma compounds in different wines. Samples’ full names, as follows: MSL (Marselan), Y73 (Yan 73), MH (Muscat Hamburg), KDK (Kadarka), ML (Merlot), CS (Cabernet Sauvignon) and CP (Crimpose). Furthermore, G represents “grape” and W represents “wine”.
Fermentation 08 00689 g008
Figure 9. Heatmap analysis of alcohol, ester, and acid compounds in wines produced from seven different grape varieties. The boxes of three colors on the left side represent different compounds categories. Here, Ⅰ, ⅠⅠ, Ⅲ, ⅠⅤ represent these compounds as clustered into four groups. Samples’ full names, as follows: MSL (Marselan), Y73 (Yan 73), MH (Muscat Hamburg), KDK (Kadarka), ML (Merlot), CS (Cabernet Sauvignon) and CP (Crimpose). Furthermore, G represents “grape” and W represents “wine”.
Fermentation 08 00689 g009
Figure 10. Biplot of PCA for volatile compounds of wines produced from seven different grape varieties. Samples’ full names, as follows: MSL (Marselan), Y73 (Yan 73), MH (Muscat Hamburg), KDK (Kadarka), ML (Merlot), CS (Cabernet Sauvignon) and CP (Crimpose). Furthermore, G represents “grape” and W represents “wine”. Here, −1, −2, and −3 indicates, respectively, replicates 1, 2, 3.
Fermentation 08 00689 g010
Figure 11. Eleven important aroma compounds (OAV > 1) in wines produced from seven different grape varieties (a). Sensory analysis of different wines (b). Samples’ full names, as follows: MSL (Marselan), Y73 (Yan 73), MH (Muscat Hamburg), KDK (Kadarka), ML (Merlot), CS (Cabernet Sauvignon) and CP (Crimpose). Furthermore, G represents “grape” and W represents “wine”.
Fermentation 08 00689 g011
Table 1. Classic physicochemical indexes of different grape and wine samples.
VarietyTotal Sugar (g/L)pHTotal Acidity (g/L)Alcohol % (v/v)
MSLG229.56 ± 0.16 b3.98 ± 0.34 cdef6.43 ± 0.02 f-
Y73G178.31 ± 0.12 f3.63 ± 0.2 fg6.43 ± 0.09 f-
MHG204.81 ± 0.21 a4.11 ± 0.15 bcd7.23 ± 0.26 de-
KDKG207.23 ± 0.13 d4.17 ± 0.24 bc7.14 ± 0.43 e-
MLG228.06 ± 0.23 c4.48 ± 0.11 b5.52 ± 0.22 g-
CSG166.11 ± 0.34 e4.89 ± 0.34 a6.31 ± 0.25 f-
CPG223.12 ± 0.24 g4.07 ± 0.12 cde6.52 ± 0.18 f-
MSLW1.82 ± 0.07 j3.73 ± 0.12 defg7.42 ± 0.13 cde13.47 ± 0.47 a
Y73W1.83 ± 0.12 j3.47 ± 0.13 g6.13 ± 0.35 f9.79 ± 0.19 c
MHW1.81 ± 0.14 j3.97 ± 0.24 cdef7.56 ± 0.31 bcd11.35 ± 0.63 b
KDKW3.12 ± 0.34 h3.95 ± 0.13 cdef7.69 ± 0.03 bc12.18 ± 0.77 b
MLW2.31 ± 0.16 i3.48 ± 0.21 g7.92 ± 0.12 ab13.42 ± 0.62 a
CSW2.89 ± 0.06 h3.67 ± 0.25 efg8.11 ± 0.14 a8.52 ± 0.42 d
CPW1.64 ± 0.11 j3.81 ± 0.15 cdefg7.31 ± 0.09 cde13.29 ± 0.52 a
(1). Samples’ full names are as follows: MSL (Marselan), Y73 (Yan 73), MH (Muscat Hamburg), KDK (Kadarka), ML (Merlot), CS (Cabernet Sauvignon), and CP (Crimpose). Furthermore, G represents “grape” and W represents “wine”. (2). Mean values and standard deviations followed by different letters in a column indicate that the samples were significantly different (p < 0.05, Tukey’s HSD test). (3). ”-” indicates “not measured”.
Publisher’s Note: MDPI stays neutral with regard to jurisdictional claims in published maps and institutional affiliations.

