Article

Probiotic Properties of Weissella confusa PP29 on Hibiscus sabdariffa L. Media

by
Alexandra Dimofte
1,
Natalia Simionescu
2,
Anca-Roxana Petrovici
1,* and
Iuliana Spiridon
1
1
Natural Polymers, Bioactive and Biocompatible Materials Department, “Petru Poni” Institute of Macromolecular Chemistry, 41A Grigore Ghica Voda Alley, 700487 Iasi, Romania
2
Centre of Advanced Research in Bionanoconjugates and Biopolymers Department, “Petru Poni” Institute of Macromolecular Chemistry, 41A Grigore Ghica Voda Alley, 700487 Iasi, Romania
*
Author to whom correspondence should be addressed.
Fermentation 2022, 8(10), 553; https://doi.org/10.3390/fermentation8100553
Submission received: 28 September 2022 / Revised: 13 October 2022 / Accepted: 17 October 2022 / Published: 18 October 2022
(This article belongs to the Special Issue Postbiotics from Production to Their Health-Promoting Aspects)

Abstract

:
To date, there are very few data regarding new efficient probiotics’ development with their own prebiotic substrate. All commercial products contain prebiotic substrate that was previously purified from external sources and added to the final product. The present study describes Weissella confusa strain fermentations in media with different anthocyanin concentrations from Hibiscus sabdariffa L., in order to increase the exopolysaccharide (EPS) yield, leading to augmented probiotic and prebiotic properties. The extracted and purified EPS were characterized by Gel permeation chromatography, Fourier-transform infrared, and nuclear magnetic resonance spectroscopy; thermal analysis measurements and the whole fermented media’s probiotic properties were evaluated by testing low pH and bile salt resistance, along with hydrophobicity and auto-aggregation capacity. The anthocyanins increased biomass and EPS yields and the high EPS molecular mass improved nutrient access by allowing a good microbial suspension in media. The confirmed dextran structure provides media biocompatibility and very good probiotic properties compared with existing literature. Simultaneously, the anthocyanins in media protected the strain cells against low pH and bile salt compared with the control fermentation. These very good results show that the whole fermented culture media is suitable for further in-vitro and in-vivo studies regarding its probiotic and prebiotic activity.

1. Introduction

From the beginning of time, plants represented the main source of medications for humans due to their secondary metabolites, known today as phytochemicals which present antifungal, antimicrobial, and anticancer properties. The use of medicinal plants (as an alternative therapy) has become more frequent in recent years, even in developed countries, as estimated by the World Health Organization [1,2]. Hibiscus sabdariffa L. (Malvaceae), known as Roselle, is a plant native to Africa and relatively easy to grow, being cultivated all around the world [3]. It is used as tea (infusion), food, or medicine [4]. The main H. sabdariffa L. classes of bioactive compounds in the context of therapeutic importance are polysaccharides, organic acids, flavonoids, and anthocyanins, which provide a high antioxidant capacity [4] and free radical scavenging activity [3]. Several studies revealed the therapeutic properties of H. sabdariffa L. extracts in which the major components are anthocyanins such as delphinidin-3-O sambubioside and cyanidin-3-O sambubioside [5,6]. Other flavonoids found in this extract are gossypetine, hibiscetin, and their respective glycosides, as well as protocatechuic acid, eugenol, and sterols like β-sitoesterol and ergoesterol [3]. The most important aspect of the process of extraction optimization is to preserve a higher targeted compound yield, while minimizing compounds’ degradation. Higher temperatures (50 °C and above) caused the thermal degradation of polyphenols and reduced their antioxidant activity [5]. The anthocyanins are soluble in polar solvents and the extraction must be performed at low temperatures to preserve the compounds’ stability [7] and their therapeutic properties.
Recently, it has been demonstrated that H. sabdariffa extracts exhibit bioactive properties that play a crucial role in inhibiting the growth of multidrug-resistant pathogens [8,9], as well as in preventing chronic diseases such as cancer [10,11,12], hypertension [13], hyperlipidemia [14,15], liver disorders [9], inflammation [6], metabolic disorders [3,16].
On the other hand, it has been confirmed experimentally that anthocyanins contained in commercial supplements were rapidly metabolized by gut microbiota into active metabolites, which in turn modulate the composition and metabolic functionality of gut microbiota [17]. At the same time, the plant extracts used in commercial supplements protect the gastric tract from cancer, being a perfect herbal supplement for cancer prevention [18]. It has been demonstrated that lactic acid bacteria (LAB) modulate the extracts’ composition in phenolic compounds. The extracellular enzymes involved in the fermentation process de-glycosylate polyphenols from plant extracts, enhancing their antioxidant activity by increasing the active groups that give the polyphenol compounds antioxidant properties [19]. Using plant extracts in culture media for exopolysaccharide (EPS) biosynthesis, the resulting product could constitute a valuable prebiotic food improving the composition and function of the gut microbiota [2,20]. For EPS biosynthesis, up to 70% of the microbial cell’s energy is used. The EPS quantity and quality depend on sugar availability, micronutrients’ presence, and fermentation conditions [20], and in turn represent a valuable carbon source and growth substrate for LAB.
Weissella sp. was identified as one of the first microorganisms involved in the early fermentation stage. Recently, the probiotic properties of this genus were demonstrated [21], but, as always, in order for the probiotic strains to maintain their properties, they need a prebiotic substrate to maintain their growth. Prebiotics are defined as functional foods which are not absorbed systemically but modulate and stimulate the proliferation of healthy gut microbial flora and suppress the proliferation of harmful bacterial strains [22]. More recent reports confirm the in-vitro techno-functional properties and the potential prebiotic properties of EPS produced by W. confusa from fermented food [23].
Based on previously published reports stating that consumption of plant polyphenols decreases the incidence of certain chronic diseases [24], in the present study we aimed to obtain a fermented probiotic product that contains EPS produced by W. confusa PP29 as a possible prebiotic substrate, in a culture media with different concentrations of anthocyanins extracted from H. sabdariffa L. flowers. The culture media was supplemented with peptone as nitrogen source and with sucrose as carbon source in order to stimulate the EPS biosynthesis. The fermentations were monitored for four days by quantifying the biomass and EPS yields. The extracted and purified EPS were chemically characterized by using gel permeation chromatography (GPC), Fourier-transform infrared (FT-IR) and nuclear magnetic resonance spectroscopy (NMR), and thermal analysis (TG/DTG) techniques. The probiotic properties of complete culture media were determined by customary methods for quantifying low pH and bile salt resistance, hydrophobicity, and auto-aggregation capacity. The experimental flow is summarized in Scheme 1, which includes all the experimental stages as well as the characterization techniques used.

2. Materials and Methods

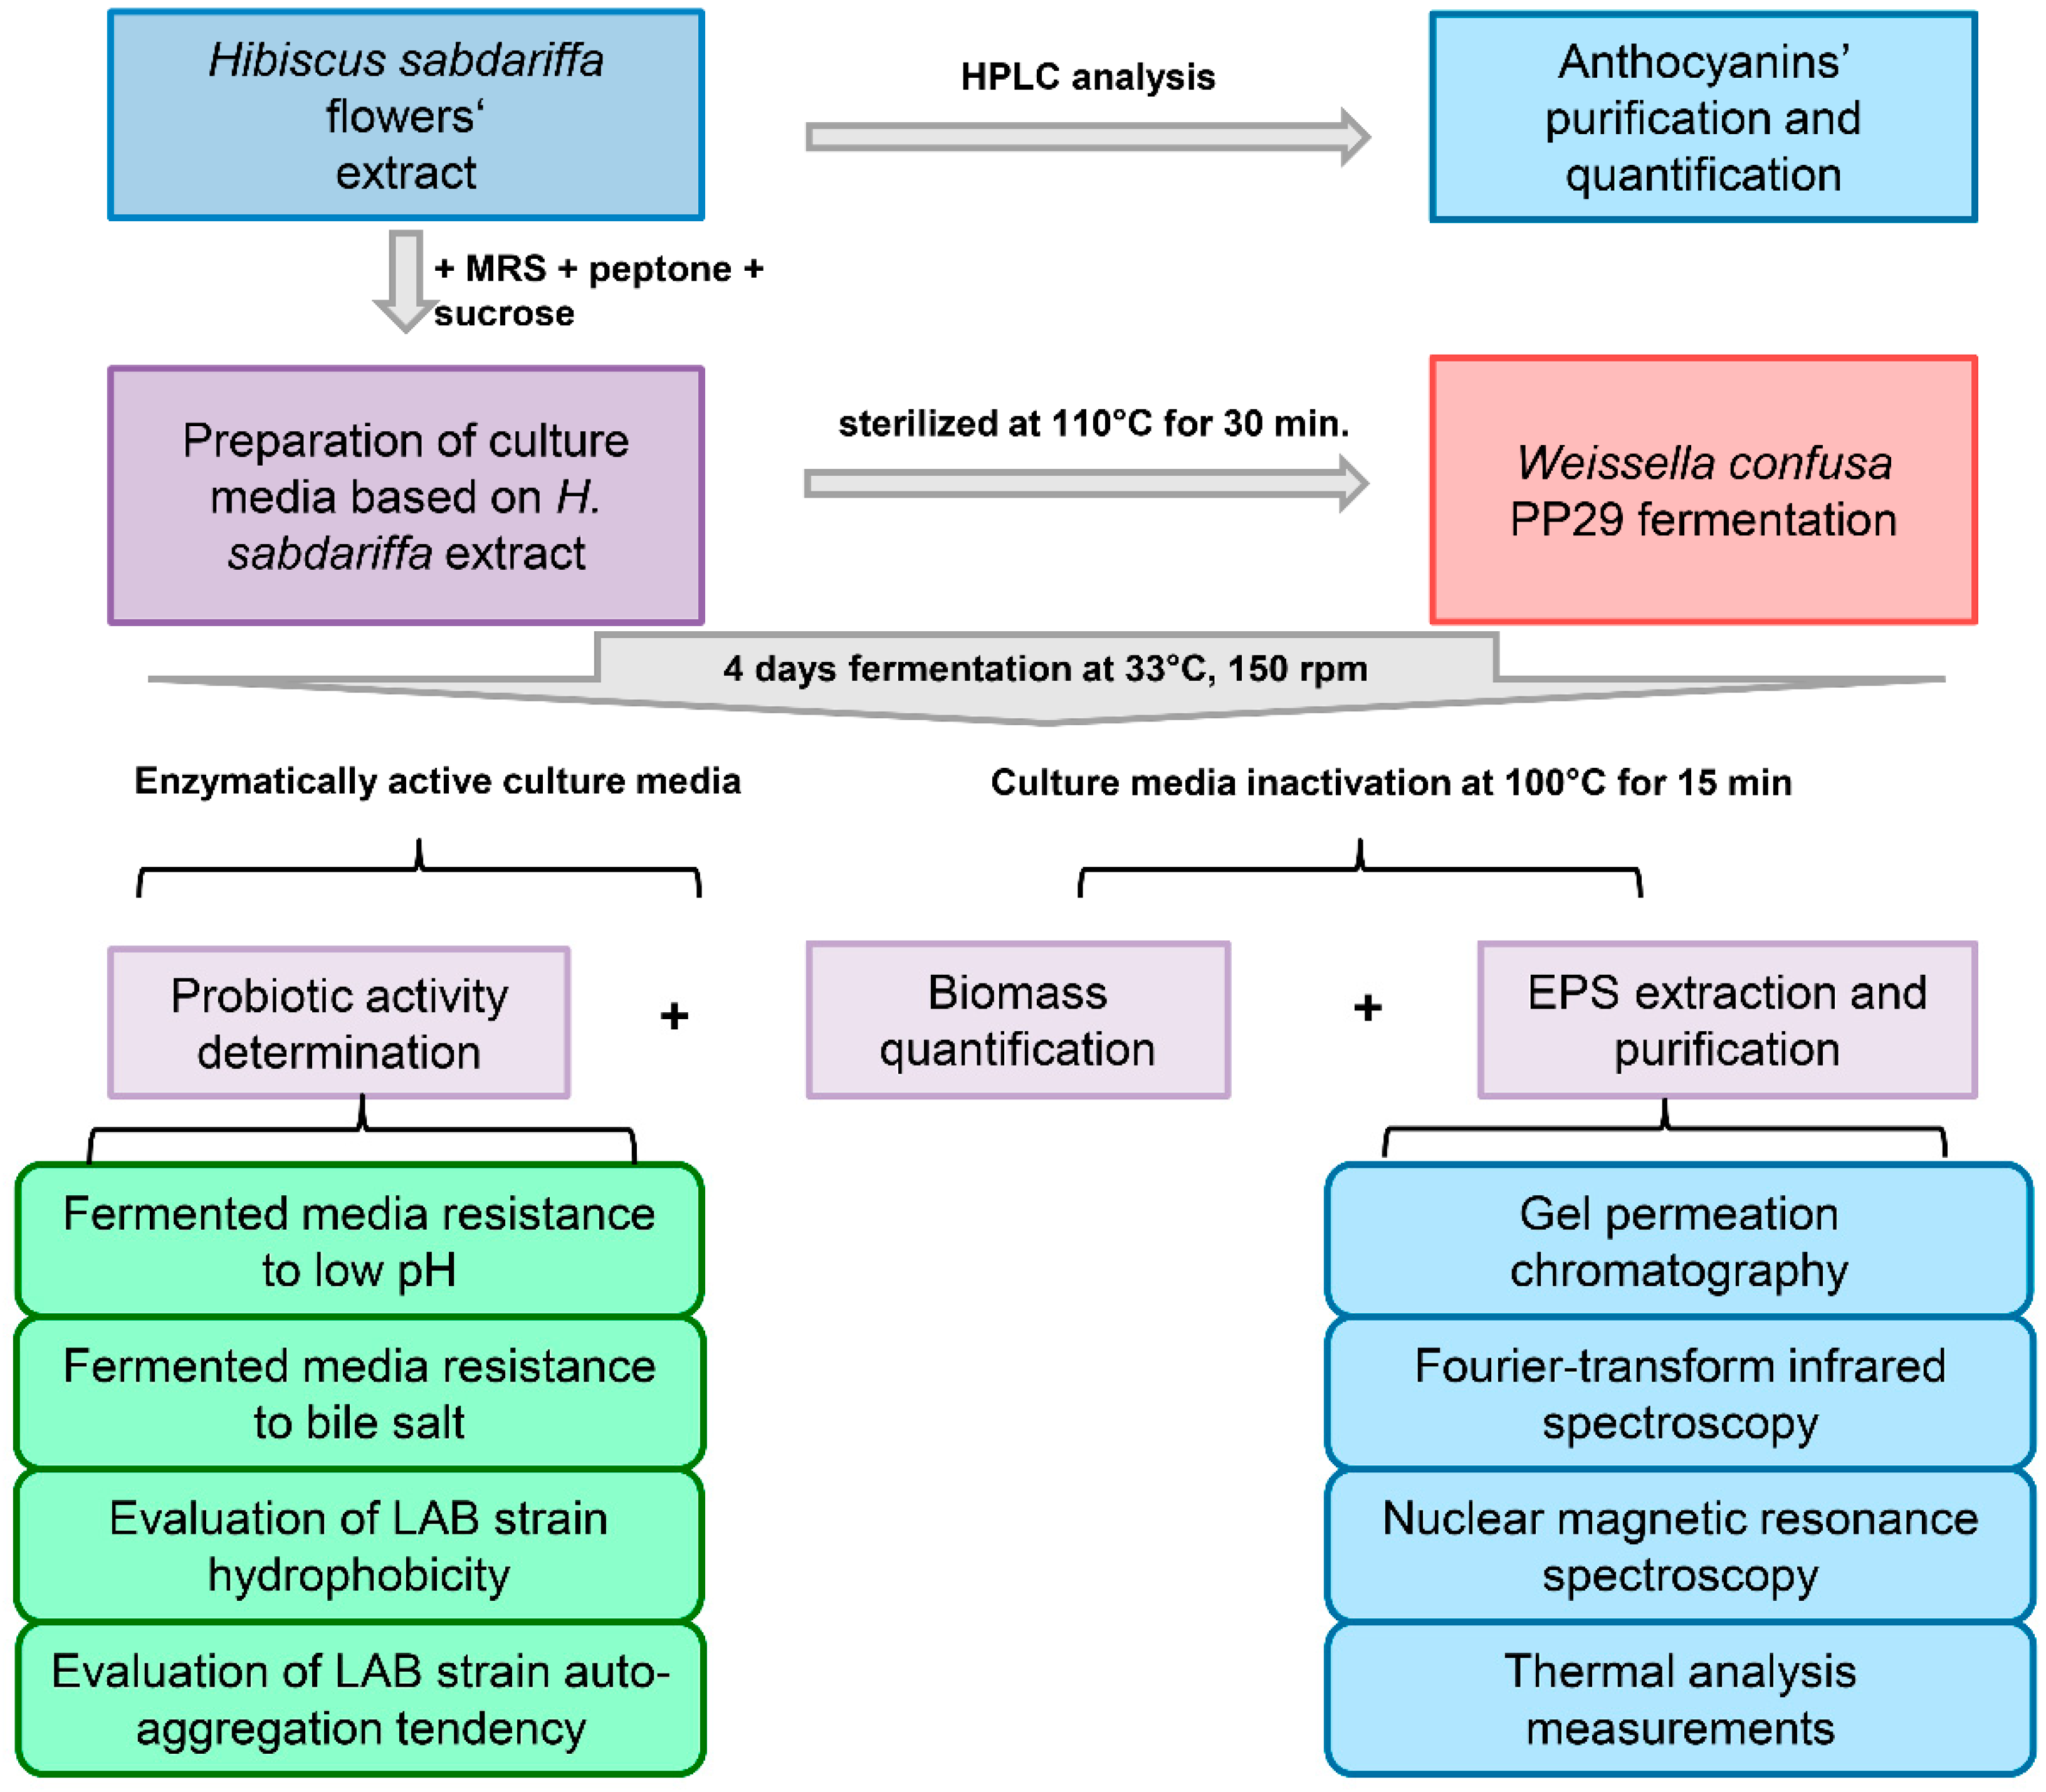
2.1. H. sabdariffa L. Extract

Anthocyanins from H. sabdariffa flowers were extracted using an already published protocol [25] as follows: dried flowers were immersed in a hydro-alcoholic acidified solution (75% ethanol, 0.1% HCl, both purchased from Merck Group, Darmstadt, Germany) at room temperature (24 °C) for 24 h, then the vegetal residue was removed by filtration. The anthocyanins’ sugar moieties were removed by subjecting the hydro-alcoholic extract to acid hydrolysis (90 °C for 1 h). The anthocyanins’ purification was made by selective adsorption on polystyrene-coated silica gel. The purified extract was dried under a vacuum at 40 °C and quantified by High Performance Liquid Chromatography (HPLC) [25].

2.2. Extract Characterization

Extract was characterized using a Shimadzu Prominence HPLC System (Shimadzu Corporation, Kyoto, Japan) equipped with an Alltech Econosil C18 column (4.6 × 250 mm, 5 μm) (BGB Analytik, Lörrach, Germany). The elution was performed in gradient mode: solvent A (water with 1% acetic acid, HPLC grade), solvent B (methanol, HPLC grade, both purchased from Merck Group, Darmstadt, Germany). The separation was performed in gradient as follows: solvent B from 20% to 100% in 60 min at a low rate of 1 mL/min and 25 °C. Anthocyanins were dissolved in the initial mobile phase at a concentration of 1 mg/mL. In order to identify and quantify the extract’s components, cyanidin-3-sambubioside and delphinidin-3-sambubioside (purchased from Sigma-Aldrich, St. Louis, MO, USA) were used as standards, as previously published [26].

2.3. Microorganism

The LAB strain coded PP29 was isolated from a Romanian commercial yoghurt in the Centre of Advanced Research in Bionanoconjugates and Biopolymers’ laboratories, and stored at −80 °C in Man Rogosa Sharpe medium (MRS) with 20% glycerol (both purchased from Merck Group, Darmstadt, Germany). The molecular identification was performed by 16S rRNA gene sequence analysis, as described in detail in Rosca et al., 2018 [26]. The analysis established that our newly isolated LAB strain belongs to the Weissella confusa species.

2.4. Fermentation Conditions

The basic culture media (denoted M1), used as a control media, containing MRS (55.3 g/L) was supplemented with peptone (5 g/L) and sucrose (80 g/L, all purchased from Merck Group, Darmstadt, Germany), as previously suggested [27]. The experimental culture media (denoted M3) was prepared from M1 media supplemented with different concentrations of Hibiscus sabdariffa L. aqueous extract: 1, 2, 3, 1000, and 2000 μg/mL anthocyanins (experiments denoted M3C1, M3C2, M3C3, M3C4, and M3C5, respectively, see Table 1). The culture medium was sterilized at 110 °C for 30 min and all the experiments were inoculated with a 24 h fresh inoculum in a final concentration of 105 and 109 CFU/mL. The fermentations were performed at 33 °C, 150 rpm, for 4 days in dynamic conditions without pH correction during fermentation. Every 24 h samples were taken from the fermentation media and the wet and dry biomass were determined by drying 24 h at 55 °C and weighing.

2.5. EPS Isolation and Purification

The EPS was isolated and purified following a previously published protocol [26]. First, the culture was heated at 100 °C for 15 min in order to inactivate the enzymatic equipment capable of degrading the biopolymer [26]. The biological mass was removed by precipitation with 20% trichloroacetic acid (TCA, purchased from Merck Group, Darmstadt, Germany), followed by centrifugation at 10,000 rpm for 10 min at 4 °C. The EPS were separated by precipitation with three volumes of cold ethanol (purchased from Merck Group, Darmstadt, Germany) for 24 h at 4 °C. The EPS were collected by centrifugation at 10,000 rpm for 20 min at 4 °C, washed with ethanol three times, resuspended in double distilled water (DDW), freeze-dried, and weighed. The amount of biopolymer was expressed in grams of dry biopolymer per litter of culture media [28]. For analysis, the samples were coded as presented in Table 1.

2.6. Gel Permeation Chromatography (GPC) Analysis

The EPS molar masses’ distribution was determined by gel permeation chromatography (GPC), using the average molecular weight (Mw) and the polydispersity index (PDI). The measurements were recorded on a Malvern Omnisec Reveal System (Malvern Instruments Ltd., Malvern, UK) equipped with a refractive index detector and two A6000M columns (300 × 8 mm, exclusion limit 20,000,000 Da for Pullulan) and guard, connected in series and placed in the column oven at 35 °C. The samples’ concentration was 3.7 mg/mL in H2O, filtrated through a cellulose filter, 0.45 μm pore size, and 0.1 M NaNO3 solution was used as mobile phase with a flow rate of 0.7 mL/min. The calibration curve was made on Dextran standard (Shodex, Showa Denko Europe GmbH, Wiesbaden, Germany) with Mw 0.6 × 10⁴, 1 × 10⁴, 2.17 × 10⁴, 4.88 × 10⁴, and 11.3 × 10⁴, 21 × 104, 36.6 × 10⁴, 80.5 × 10⁴ g/mole in H2O, and 100 µL injection volume was used. The data recording and processing were made on Malvern software, using the Dextran calibration curve.

2.7. Fourier-Transform Infrared Spectroscopy (FT-IR)

FT-IR spectra were recorded on a Bruker Vertex 70 Spectrometer (Bruker, Billerica, MA, USA) equipped with ZnSe crystal in Attenuated Total Reflectance (ATR) mode, in the 600–4000 cm−1 spectral range, with a resolution of 4 cm−1 and accumulation of 32 scans. Before each recording, a background spectrum was measured. Then, about 10 mg of each sample was put in contact with the surface of the ZnSe crystal by pressing with a device attached to the ATR device. The resulting spectra were processed by using OPUS 6.5 software (Bruker, Billerica, MA, USA). A number of steps were applied to obtain a quality spectrum: atmospheric compensation, baseline correction ATR-Absorbance convert spectrum, and normalization.

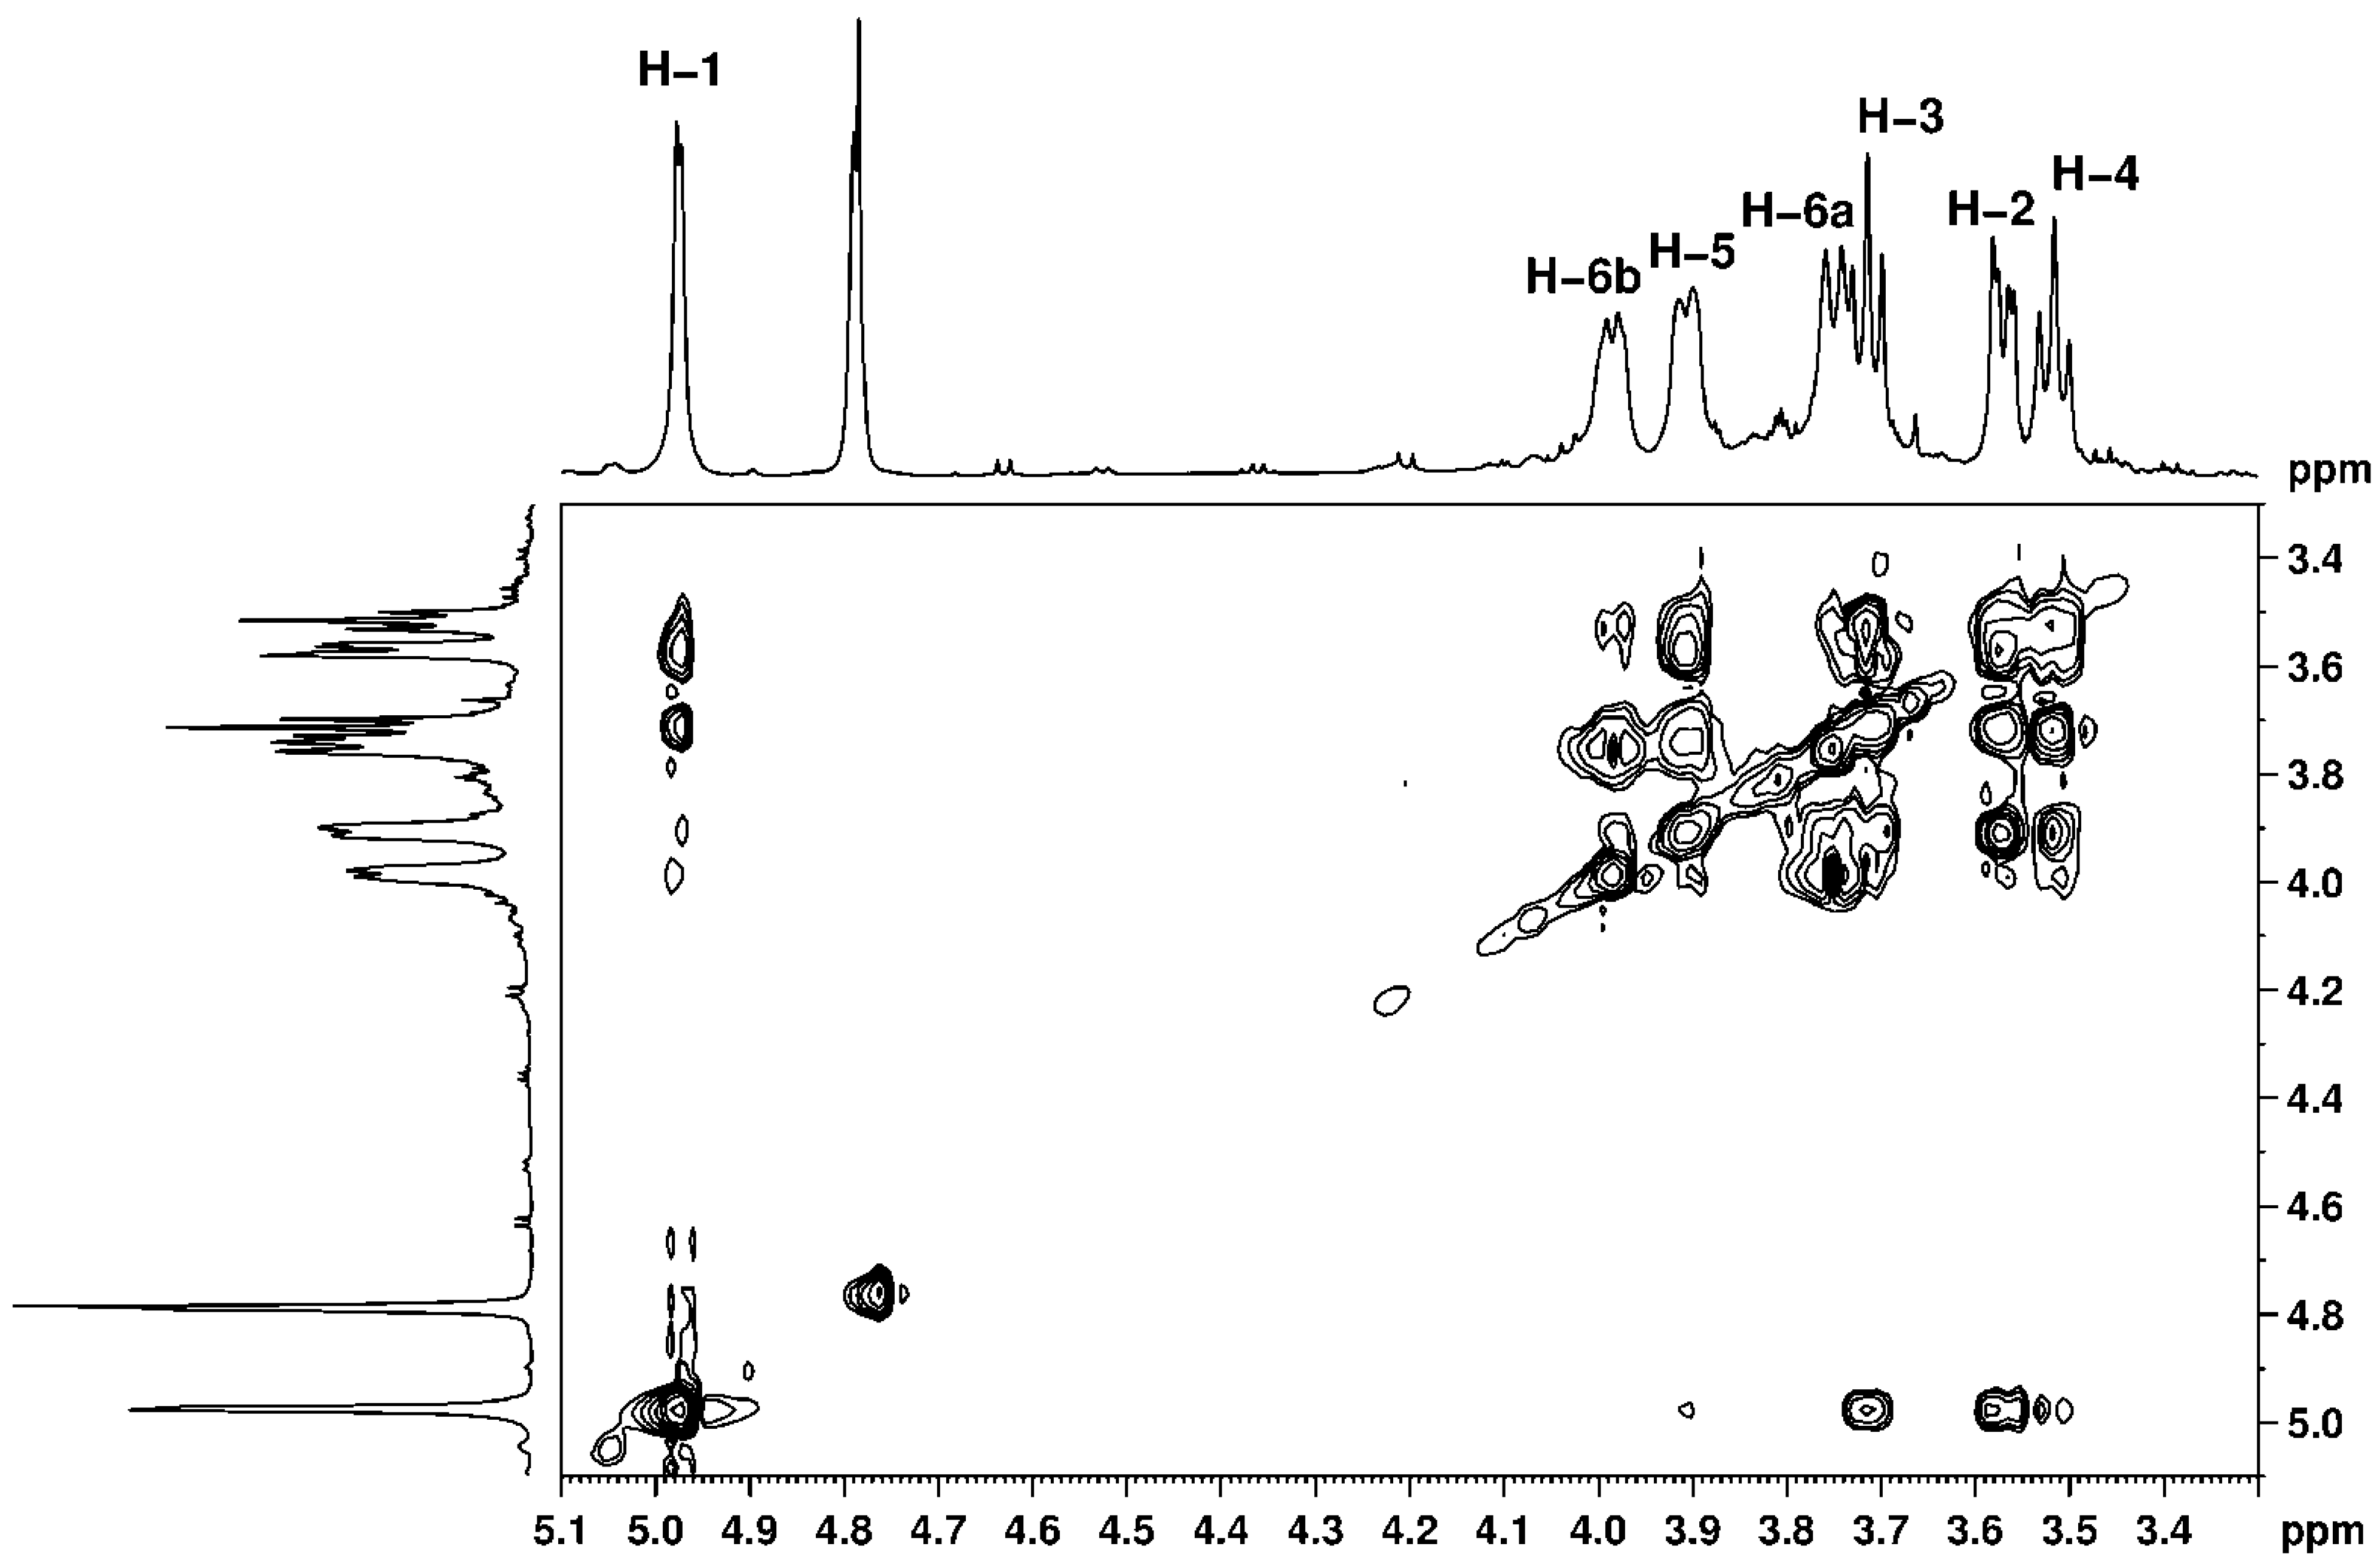
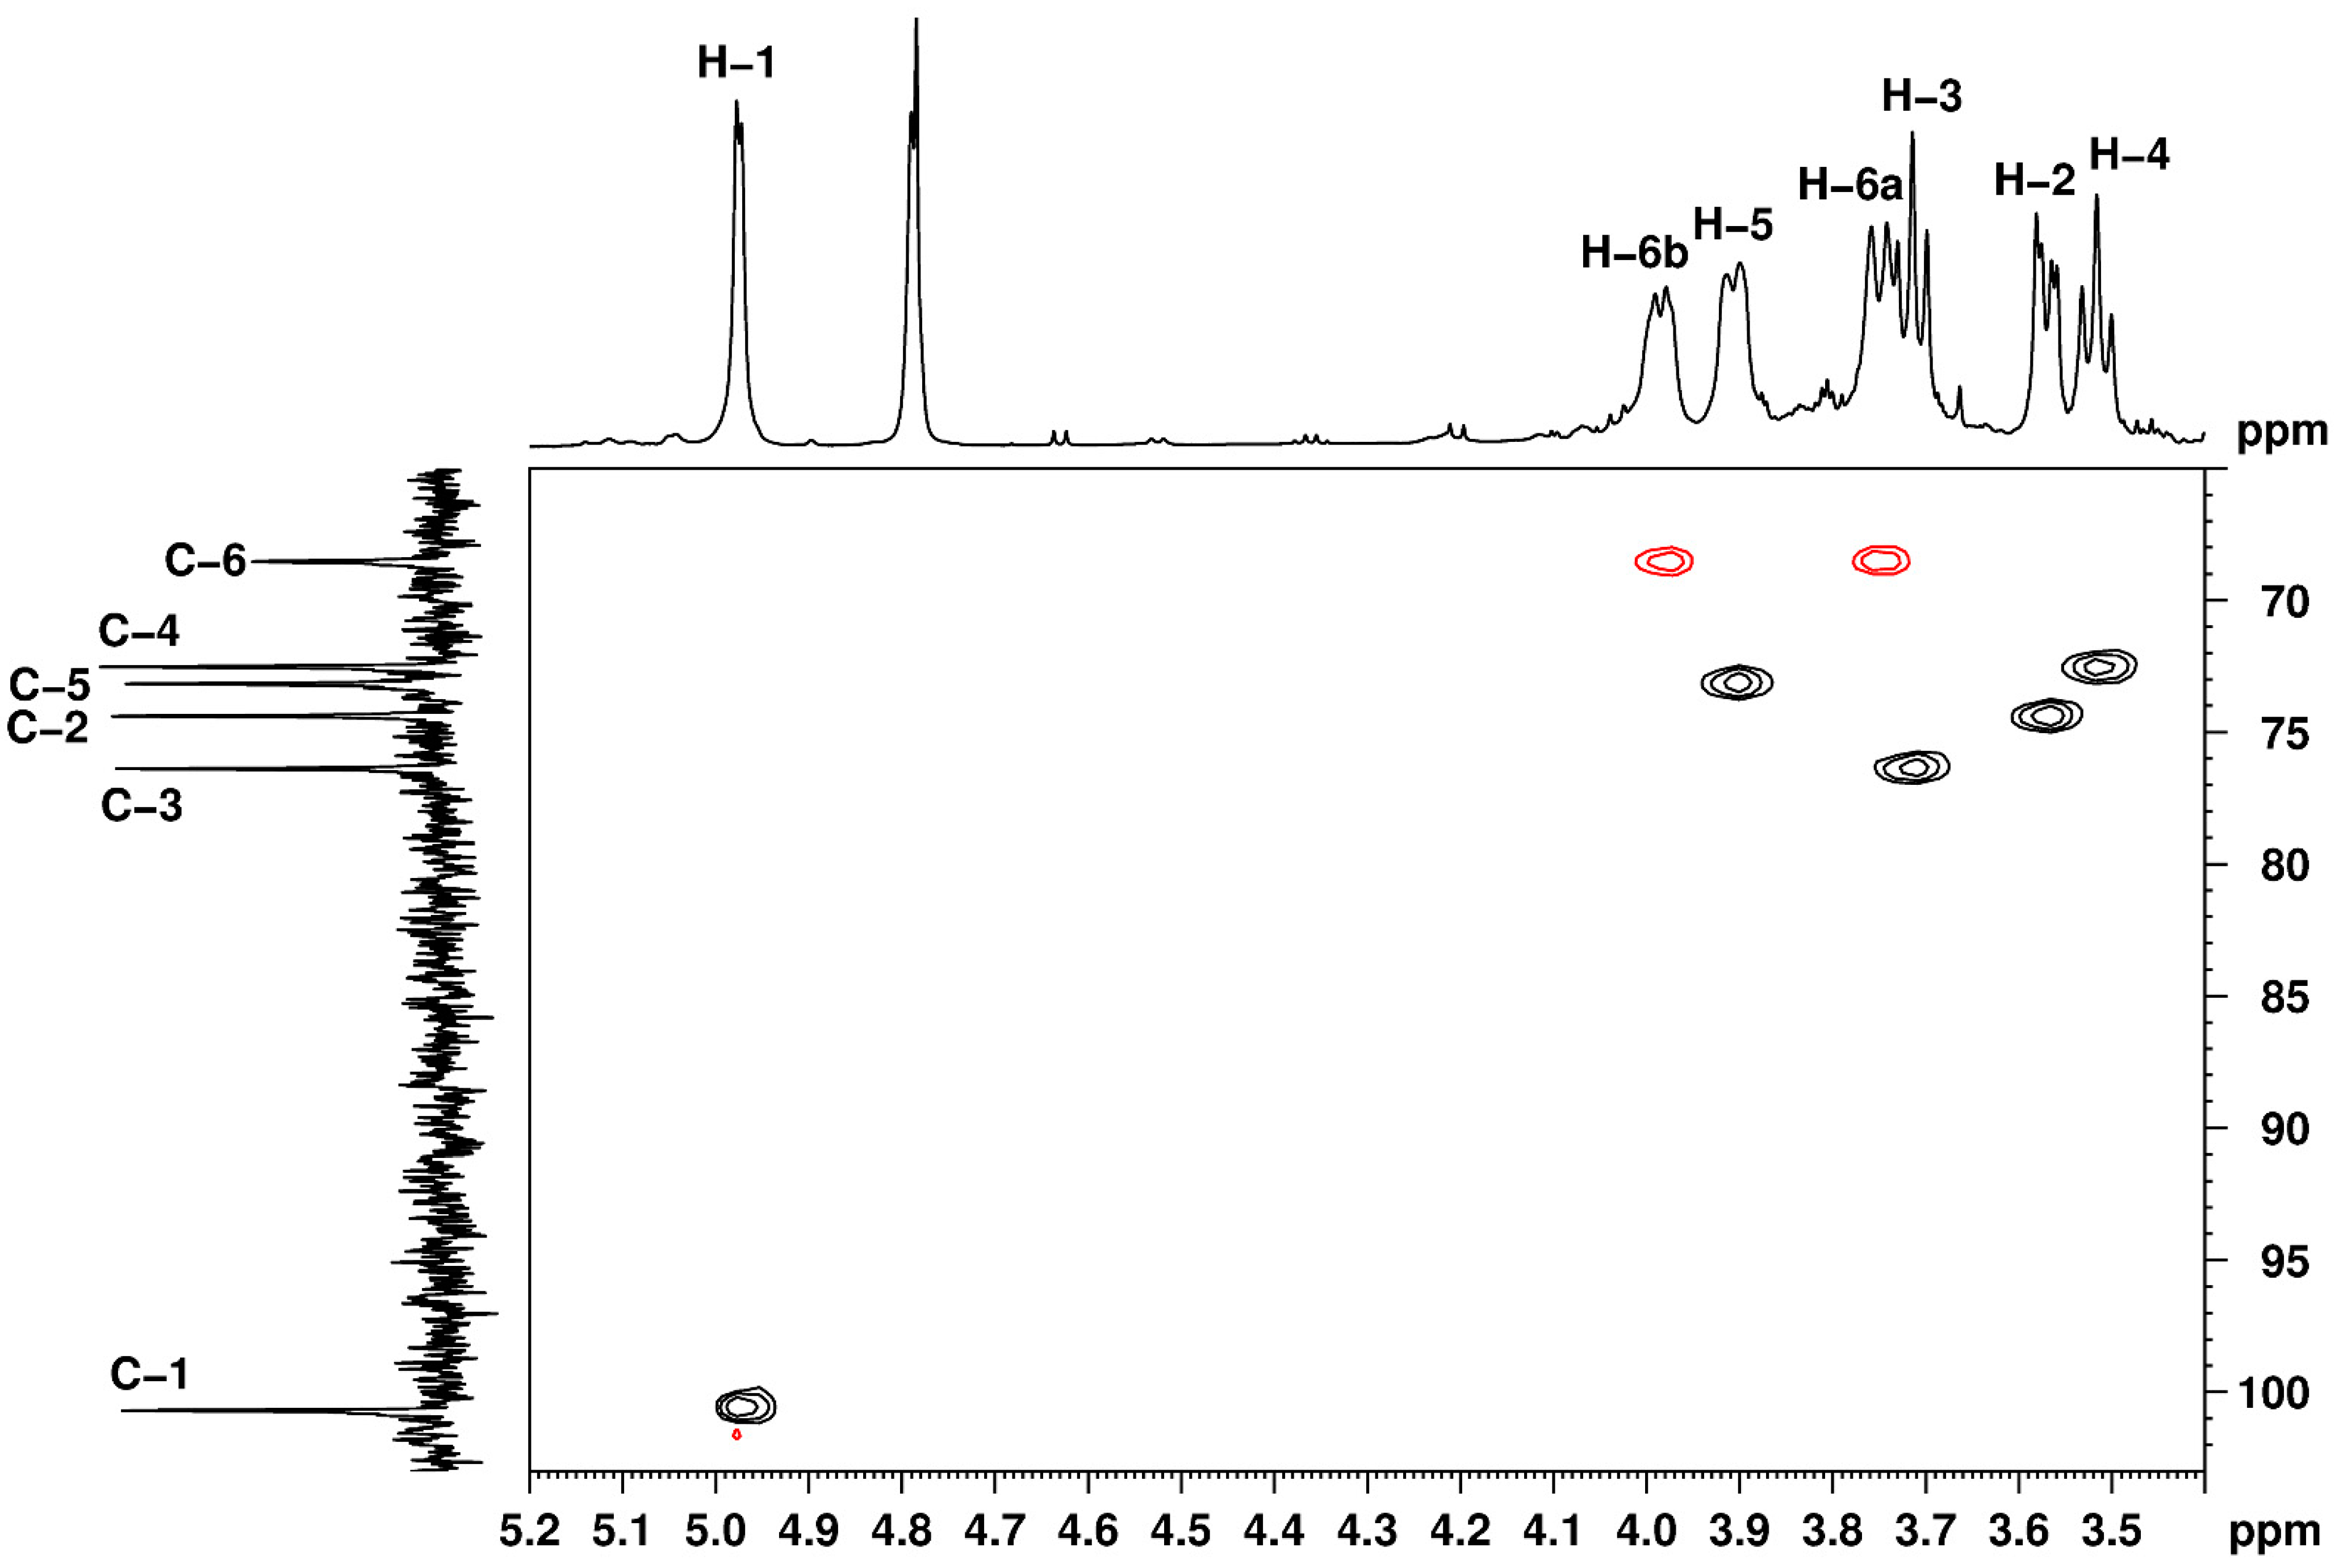
2.8. Nuclear Magnetic Resonance (NMR) Studies

The samples for the NMR analysis, consisting of 4 to 5 mg of EPS, were dissolved in 0.6 mL deuterated water (D2O) with 3-(trimethylsilyl) propionic-2,2,3,3-d4 acid sodium salt (TSP, purchased from Merck Group, Darmstadt, Germany) used as internal standard. The NMR spectra were recorded at room temperature (approx. 24 °C), on a Bruker Avance NOE 600 MHz Spectrometer (Bruker, Billerica, MA, USA) operating at 600.1 and 150.9 MHz for 1H and 13C nuclei, respectively, equipped with a 5 mm inverse detection z-gradient probe. Chemical shifts are reported in ppm and referred to TSP (ref. 1H 0.00 ppm and 13C 0.00 ppm). Due to the fact that the water signal was the most intense signal in the spectrum and it was partially overlapping on the anomeric-protons region, proton spectra were recorded with suppression of the water signal. Total correlation spectroscopy (TOCSY) and multiplicity edited heteronuclear single quantum coherence (HSQC) experiments were recorded using standard pulse sequences, as delivered by Bruker with TopSpin 4.0.8 spectrometer control and processing software (Bruker, Billerica, MA, USA).

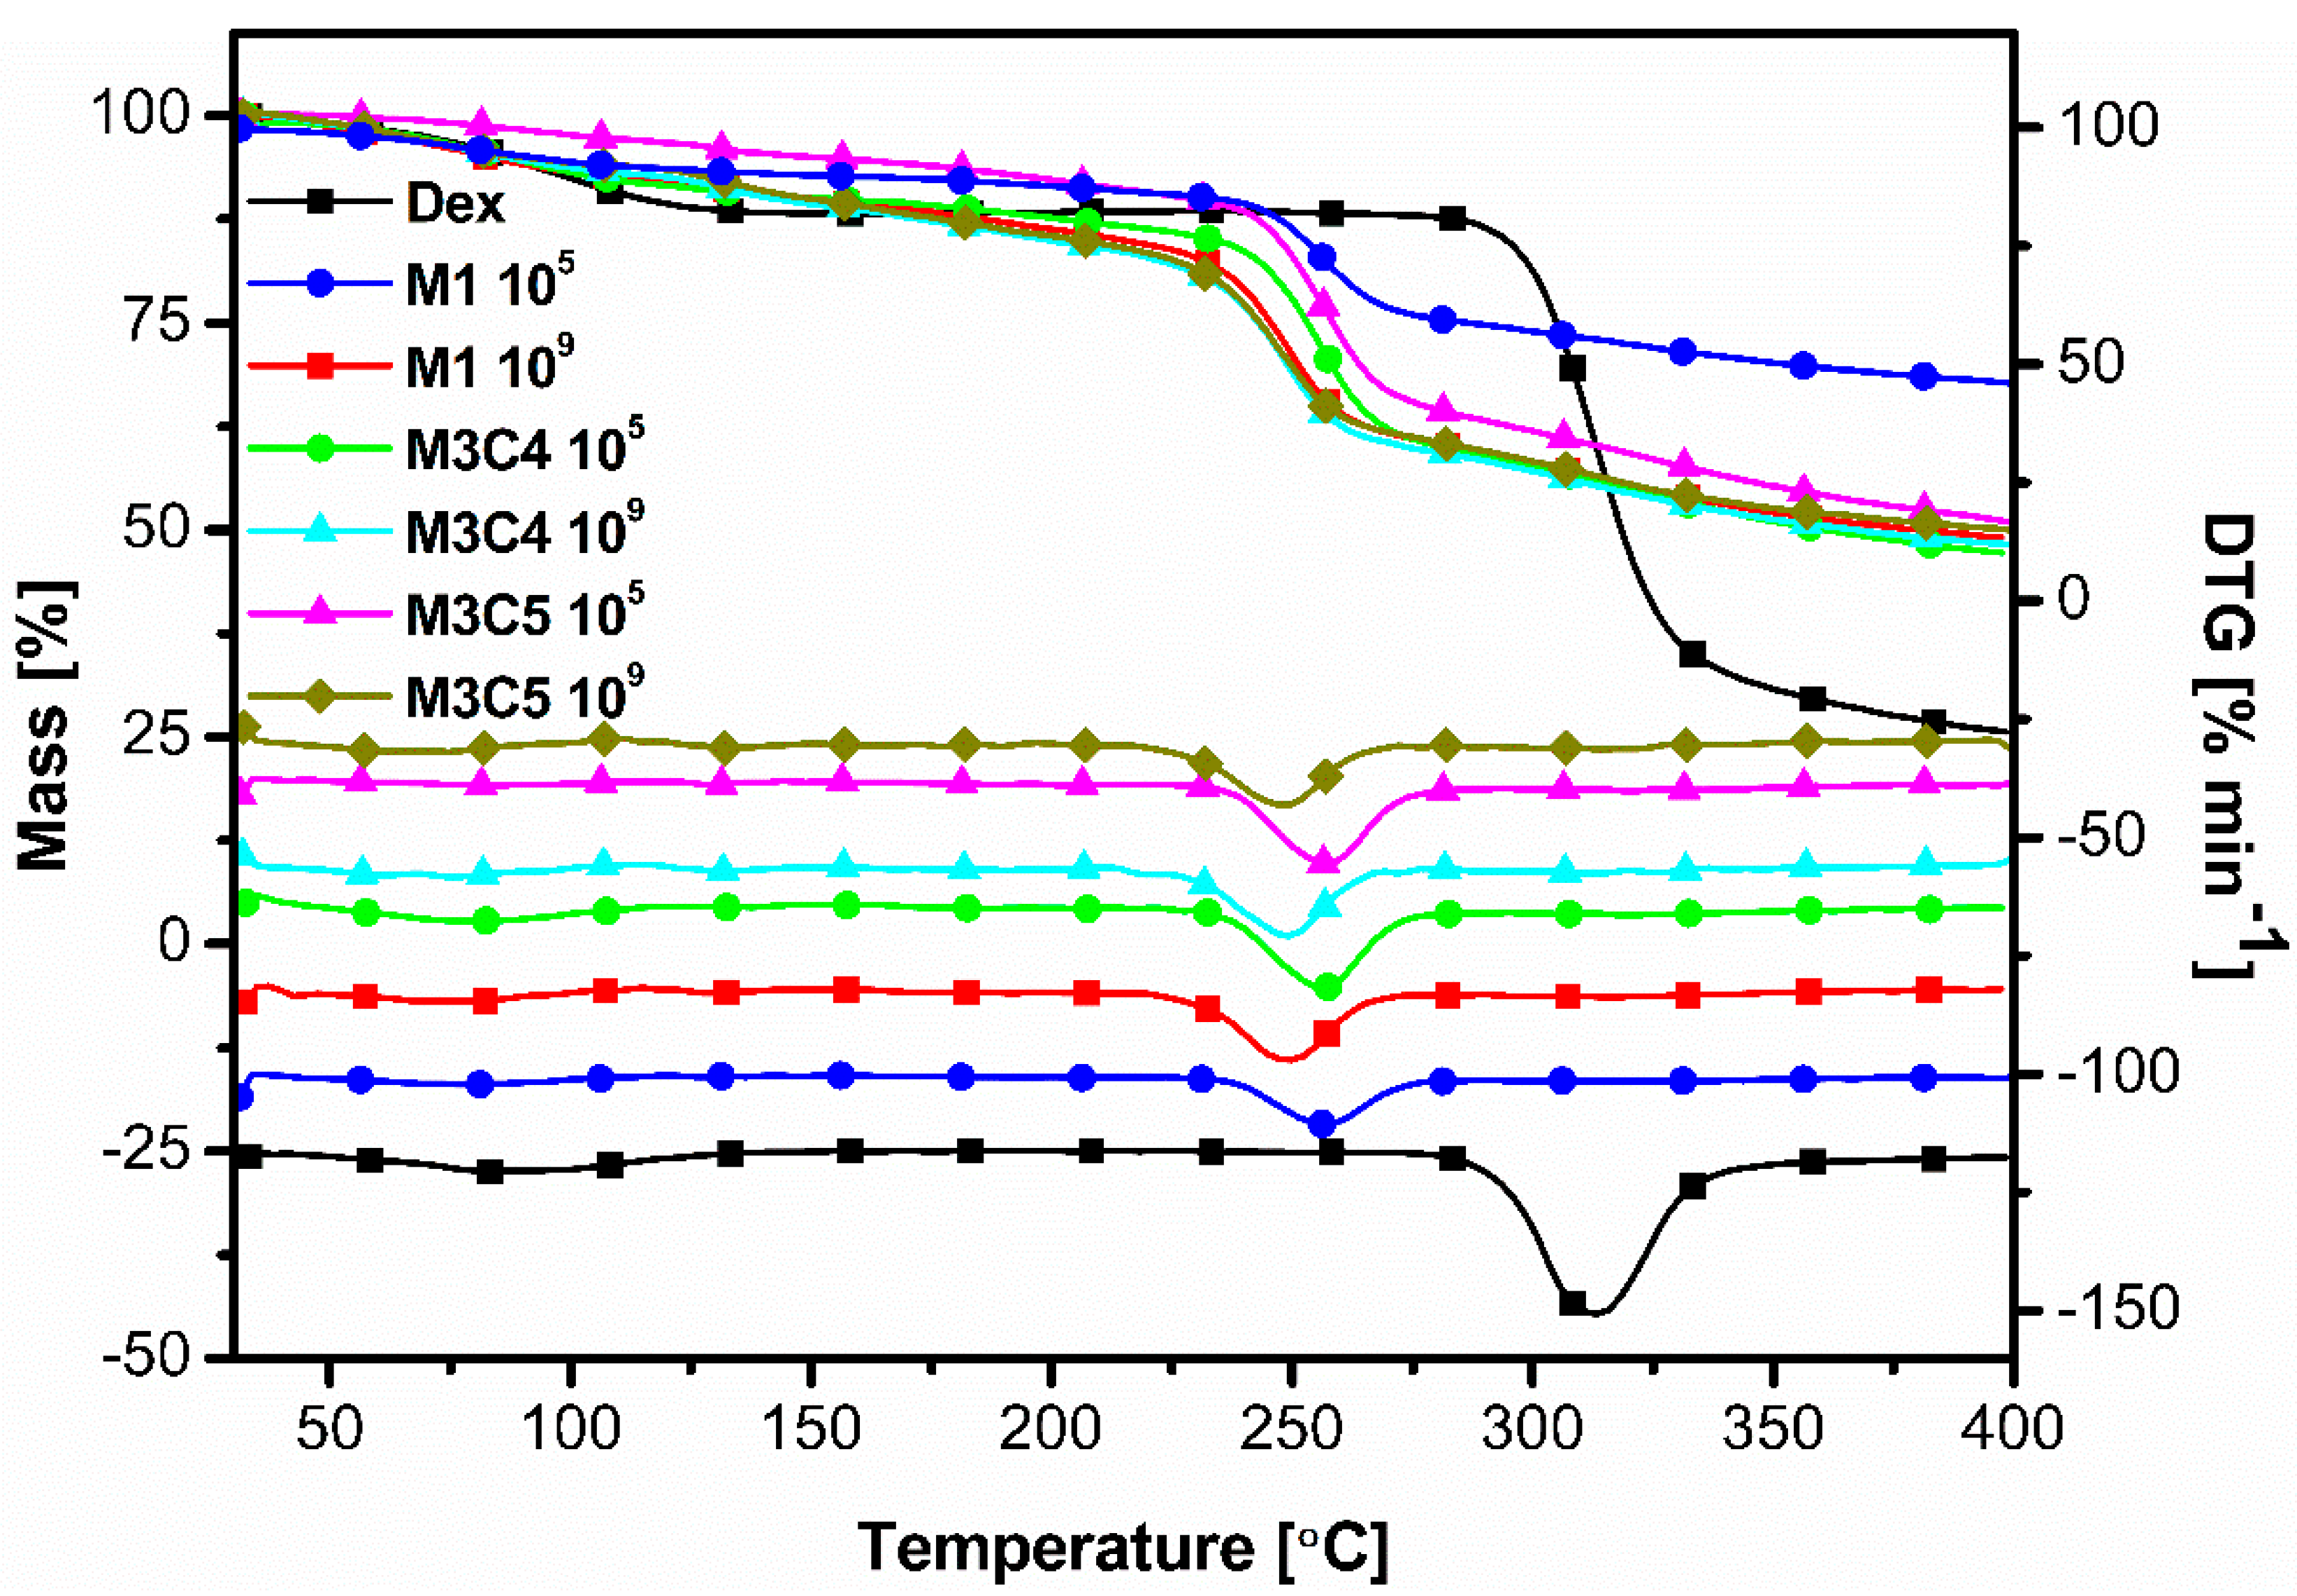
2.9. Thermal Analysis Measurements-Thermogravimetry (TG/DTG)

The thermogravimetric analysis (TG/DTG) of EPS samples was performed on an STA 449F1 Jupiter NETZSCH equipment (Netzsch, Selb, Germany) using 10 mg of freeze-dried sample. Measurements were carried out in the 30–400 °C temperature range, applying a heating rate of 10 °C / min. Nitrogen purge gas was used as an inert atmosphere at a flow rate of 50 mL/min. Samples were heated in open Al2O3 crucibles. The device was calibrated for temperature and sensitivity with indium, according to standard procedure.

2.10. Probiotic Activity Determination

2.10.1. Resistance to Low pH

In order to determine the effect of anthocyanins on the PP29 strain’s resistance to low pH, we used 24 h fresh cultures from all fermentation conditions. The cultures were centrifuged at 4000× g for 10 min and the biomass was resuspended in freshly prepared quarter-strength Ringer’s Solution (QSRS) [29]: Sodium chloride 2.25 g/L, Potassium chloride 0.105 g/L, Calcium chloride 0.12 g/L, Sodium bicarbonate 0.05 g/L (all purchased from Merck Group, Darmstadt, Germany) with different pH (pH 2, pH 3, pH 7) and incubated for 2 h. Then, 0.5 mL of each sample was serially diluted in QSRS, plated on an MRS agar plate, and incubated at 37 °C for another 12 h. Viable colonies were counted and the survival rate in low pH was calculated relative to control (pH 7 group), as previously suggested [21].

2.10.2. Resistance to Bile Salt

In order to determine the effect of anthocyanins on the PP29 strain’s resistance to bile salt, 24 h fresh cultures were further inoculated in QSRS containing 0, 0.1, 0.2, and 0.3% (w/v) bile salt (purchased from Merck Group, Darmstadt, Germany) and incubated for 2 h Next, 0.5 mL of each sample was serially diluted in QSRS, plated on MRS agar plate and incubated at 37 °C for another 12 h. Viable colonies were counted and the survival rate in the presence of bile salt was calculated relative to the control (0% bile salt group), as previously suggested [21].

2.10.3. Evaluation of Hydrophobicity and Auto-Aggregation

Hydrophobicity and auto-aggregation of the fermented media were evaluated as described by Krausova et al. [29] and Mushtaq et al. [30]. The 24 h fresh cultures of PP29 strain fermentations were harvested by centrifugation at 4000× g for 10 min, resuspended in 8 mL of QSRS media, and the optical density was adjusted to 0.55–0.60 at 600 nm (A0, H0). Then samples were incubated at 37 °C and the optical density was measured at 1, 6, and 24 h (At). The percent of auto-aggregation was calculated using the following formula:
A   ( % ) = ( 1 A t A 0 ) × 100
To determine the hydrophobicity of the PP29 strain cell surface, hexane, and chloroform (purchased from Merck Group, Darmstadt, Germany) were used as solvents, added to the cell suspension, and vortexed for 1 min. After approximately 10 min at room temperature, when the phase separation was achieved, the optical density of the aqueous phase was measured at 600 nm (Ht). The percent of hydrophobicity was calculated using the following formula:
H   ( % ) = ( H 0 H t H 0 ) × 100
where H0 represents the initial absorbance value of the aqueous phase and Ht represents the absorbance value of the aqueous phase after contact with hexane or chloroform.

3. Results and Discussion

Weissella sp. was first isolated and taxonomically classified by Collins et al. in 1993 [31]. The strains have complex nutritional requirements for growth [31] and require the presence of rich amounts of carbon and nitrogen sources for EPS biosynthesis [26]. For this purpose, the culture media was improved as described above, so that it meets the growth and EPS biosynthesis criteria of the W. confusa PP29 LAB strain.

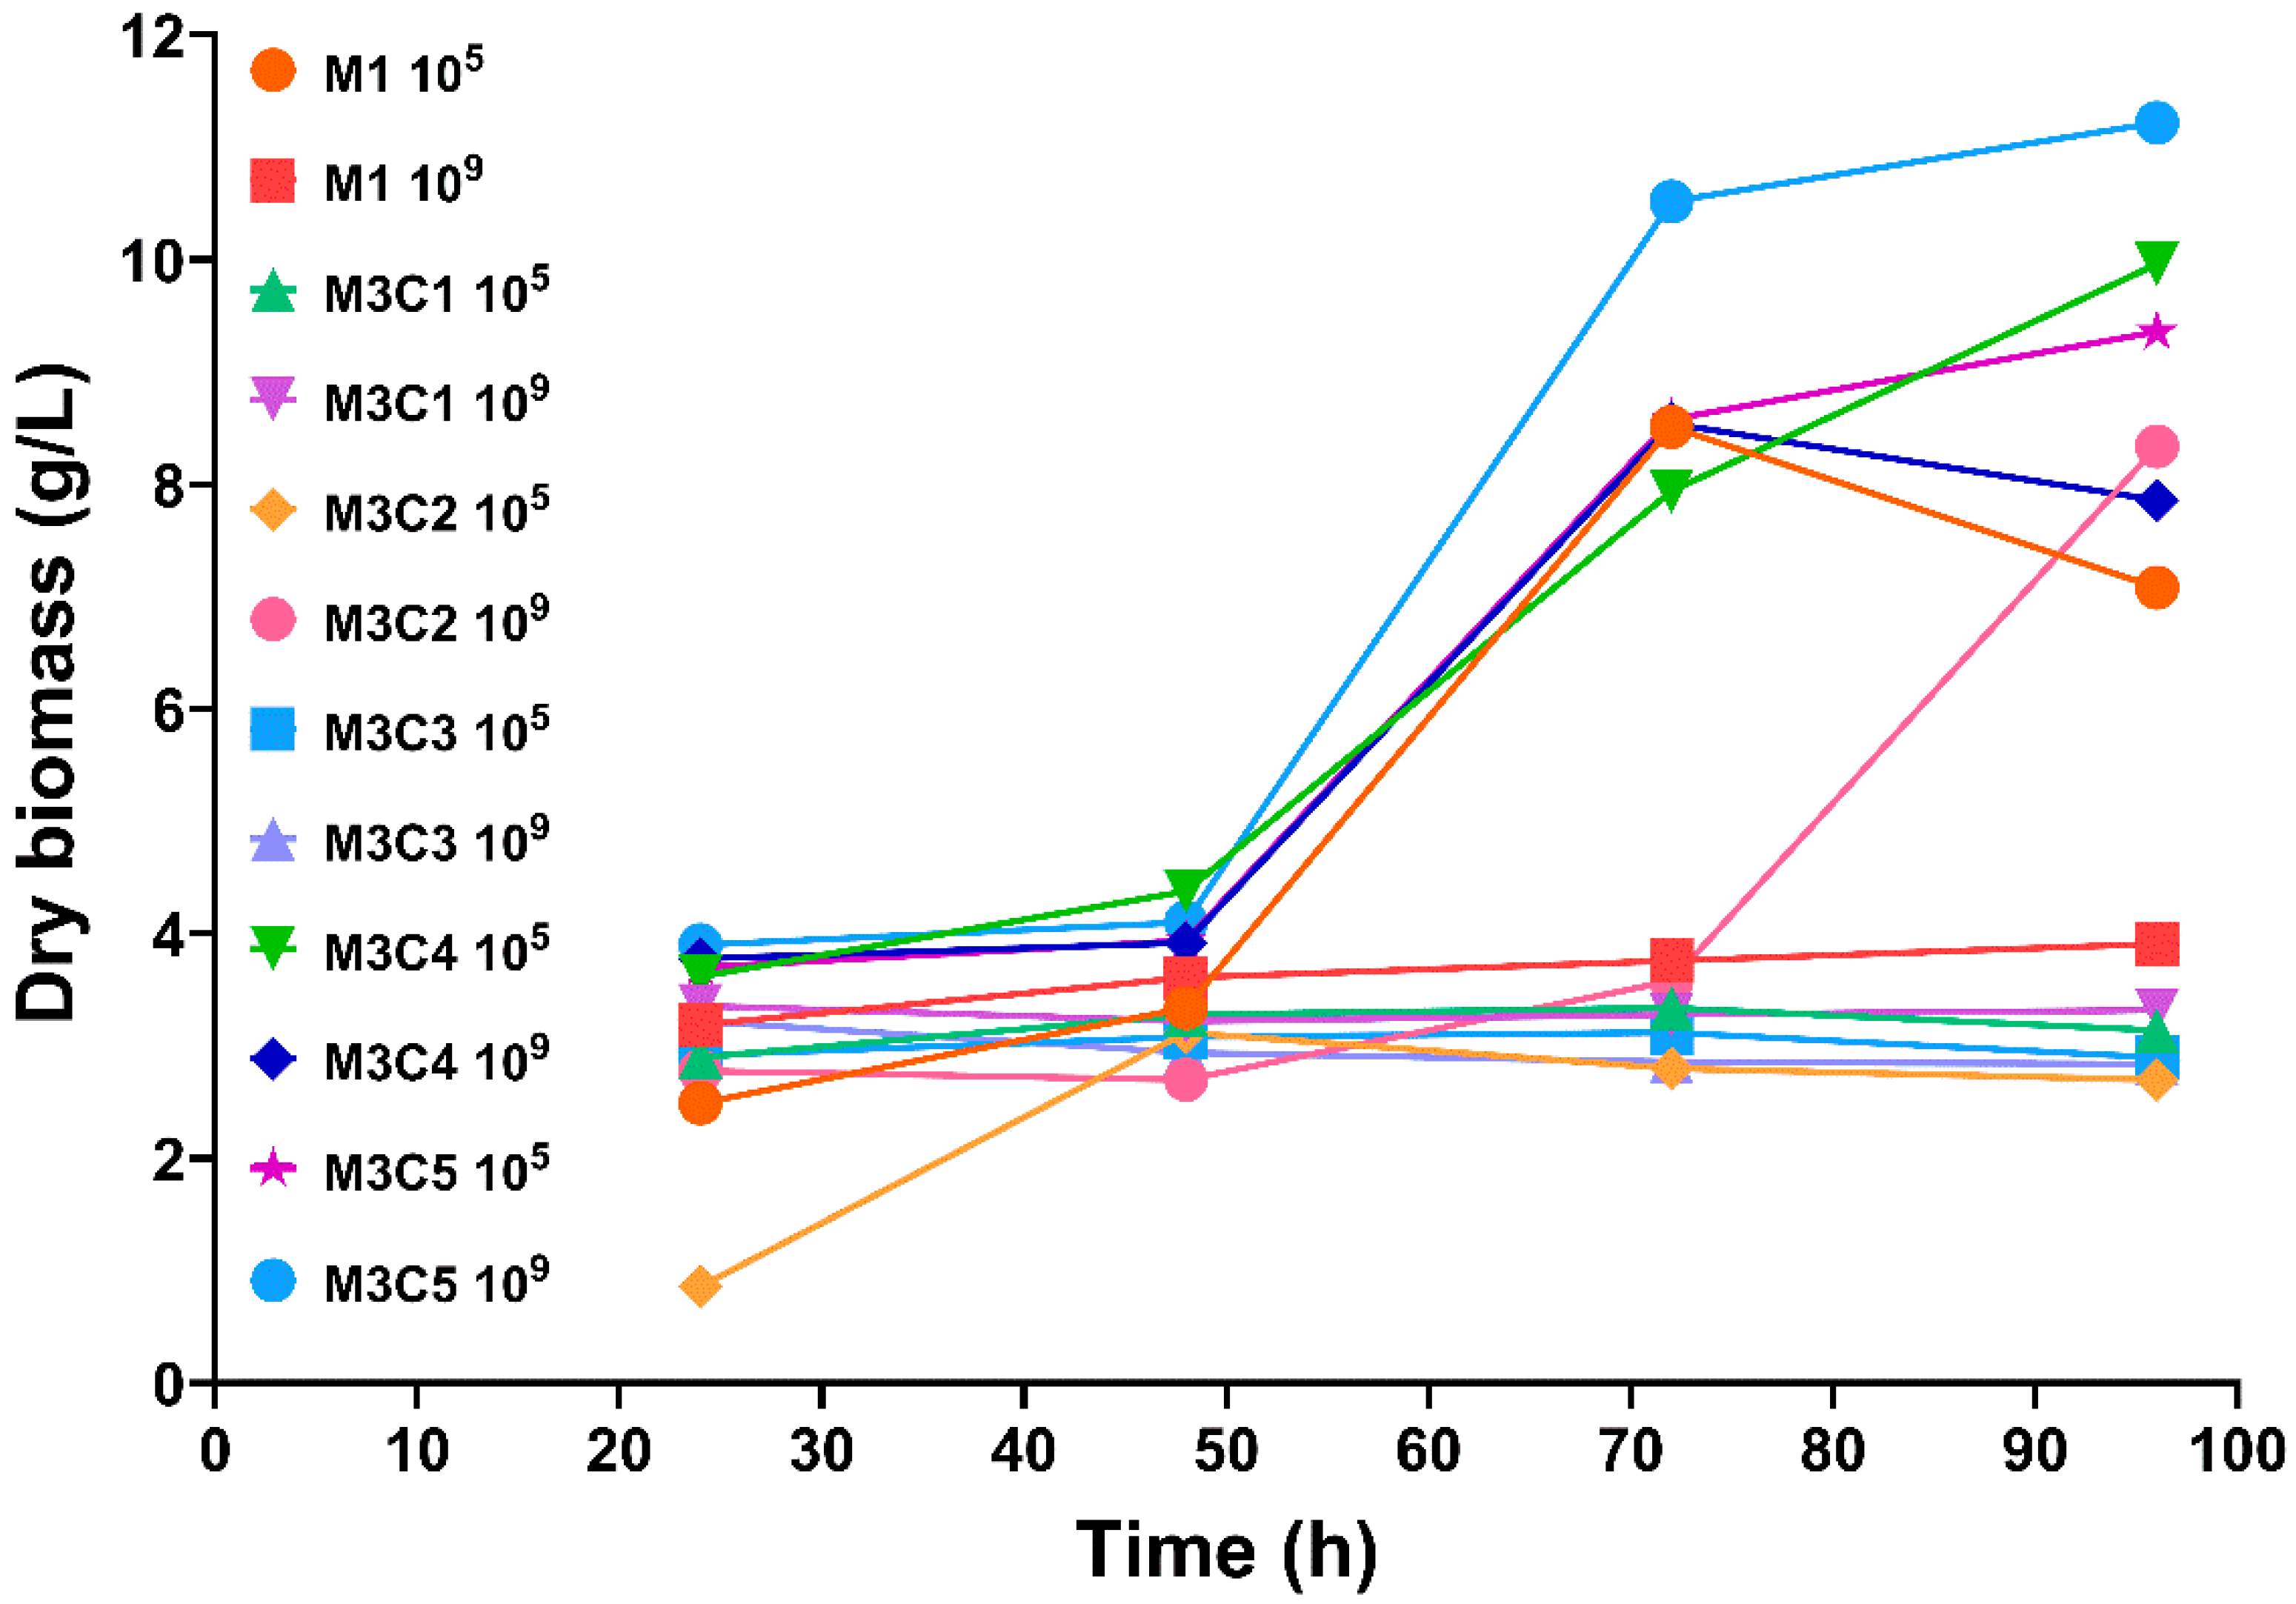
3.1. Dry Biomass Determination

As can be observed in Figure 1, the presence of 1 and 3 μg/mL anthocyanins in the culture medium had inhibitory effects on the cell’s mass development. At the same time, the presence of 2 μg/mL anthocyanins in the culture medium stimulated growth after 2 days of fermentation so that at 96 h the culture was in the exponential growth phase. Generally, the presence of polyphenols extracted from plants in a fermentative culture media may have stimulating or inhibitory effects on the microorganisms’ growth or on the biosynthesis of biologically active compounds as secondary metabolites [32]. At the same time, one phenolic compound extracted from plants can have a stimulating effect on biomass growth, but also inhibit the biosynthesis of valuable secondary metabolites [33]. It is possible that the addition of low anthocyanin concentrations into the culture medium affects the cell membrane fluidity and permeability, which leads to a greater exchange of nutrients and elimination of metabolites, as previously reported for a fungal strain [34]. Additionally, a higher or lower number of CFUs influences the T0 time from which the exponential growth starts, as well as the amount of biomass obtained at each sampling time. This can be observed for the M3C2 109 culture which was in exponential growth phase at 96 h, while the growth of M3C2 105 culture was inhibited, its biomass being lower than the control M1 105 culture.
In contrast, the M3C5 109 culture had the highest growth rate, being in the plateau phase at 96 h, and had the highest amount of dry biomass (11.22 g/L). The M3C5 105 culture, inoculated with 105 CFU/mL, was also in the plateau phase at 96 h and, as expected, had a much smaller biomass amount (9.36 g/L) compared to the culture inoculated with 109 CFU/mL. In conclusion, comparing all the obtained results for fermentations in culture media with different concentrations of anthocyanins, we can say that the increase in anthocyanins’ concentration above 1000 μg/mL in the fermentation media had a stimulating effect on the biomass growth of this LAB strain, while very low anthocyanins’ concentrations had inhibitory effects.

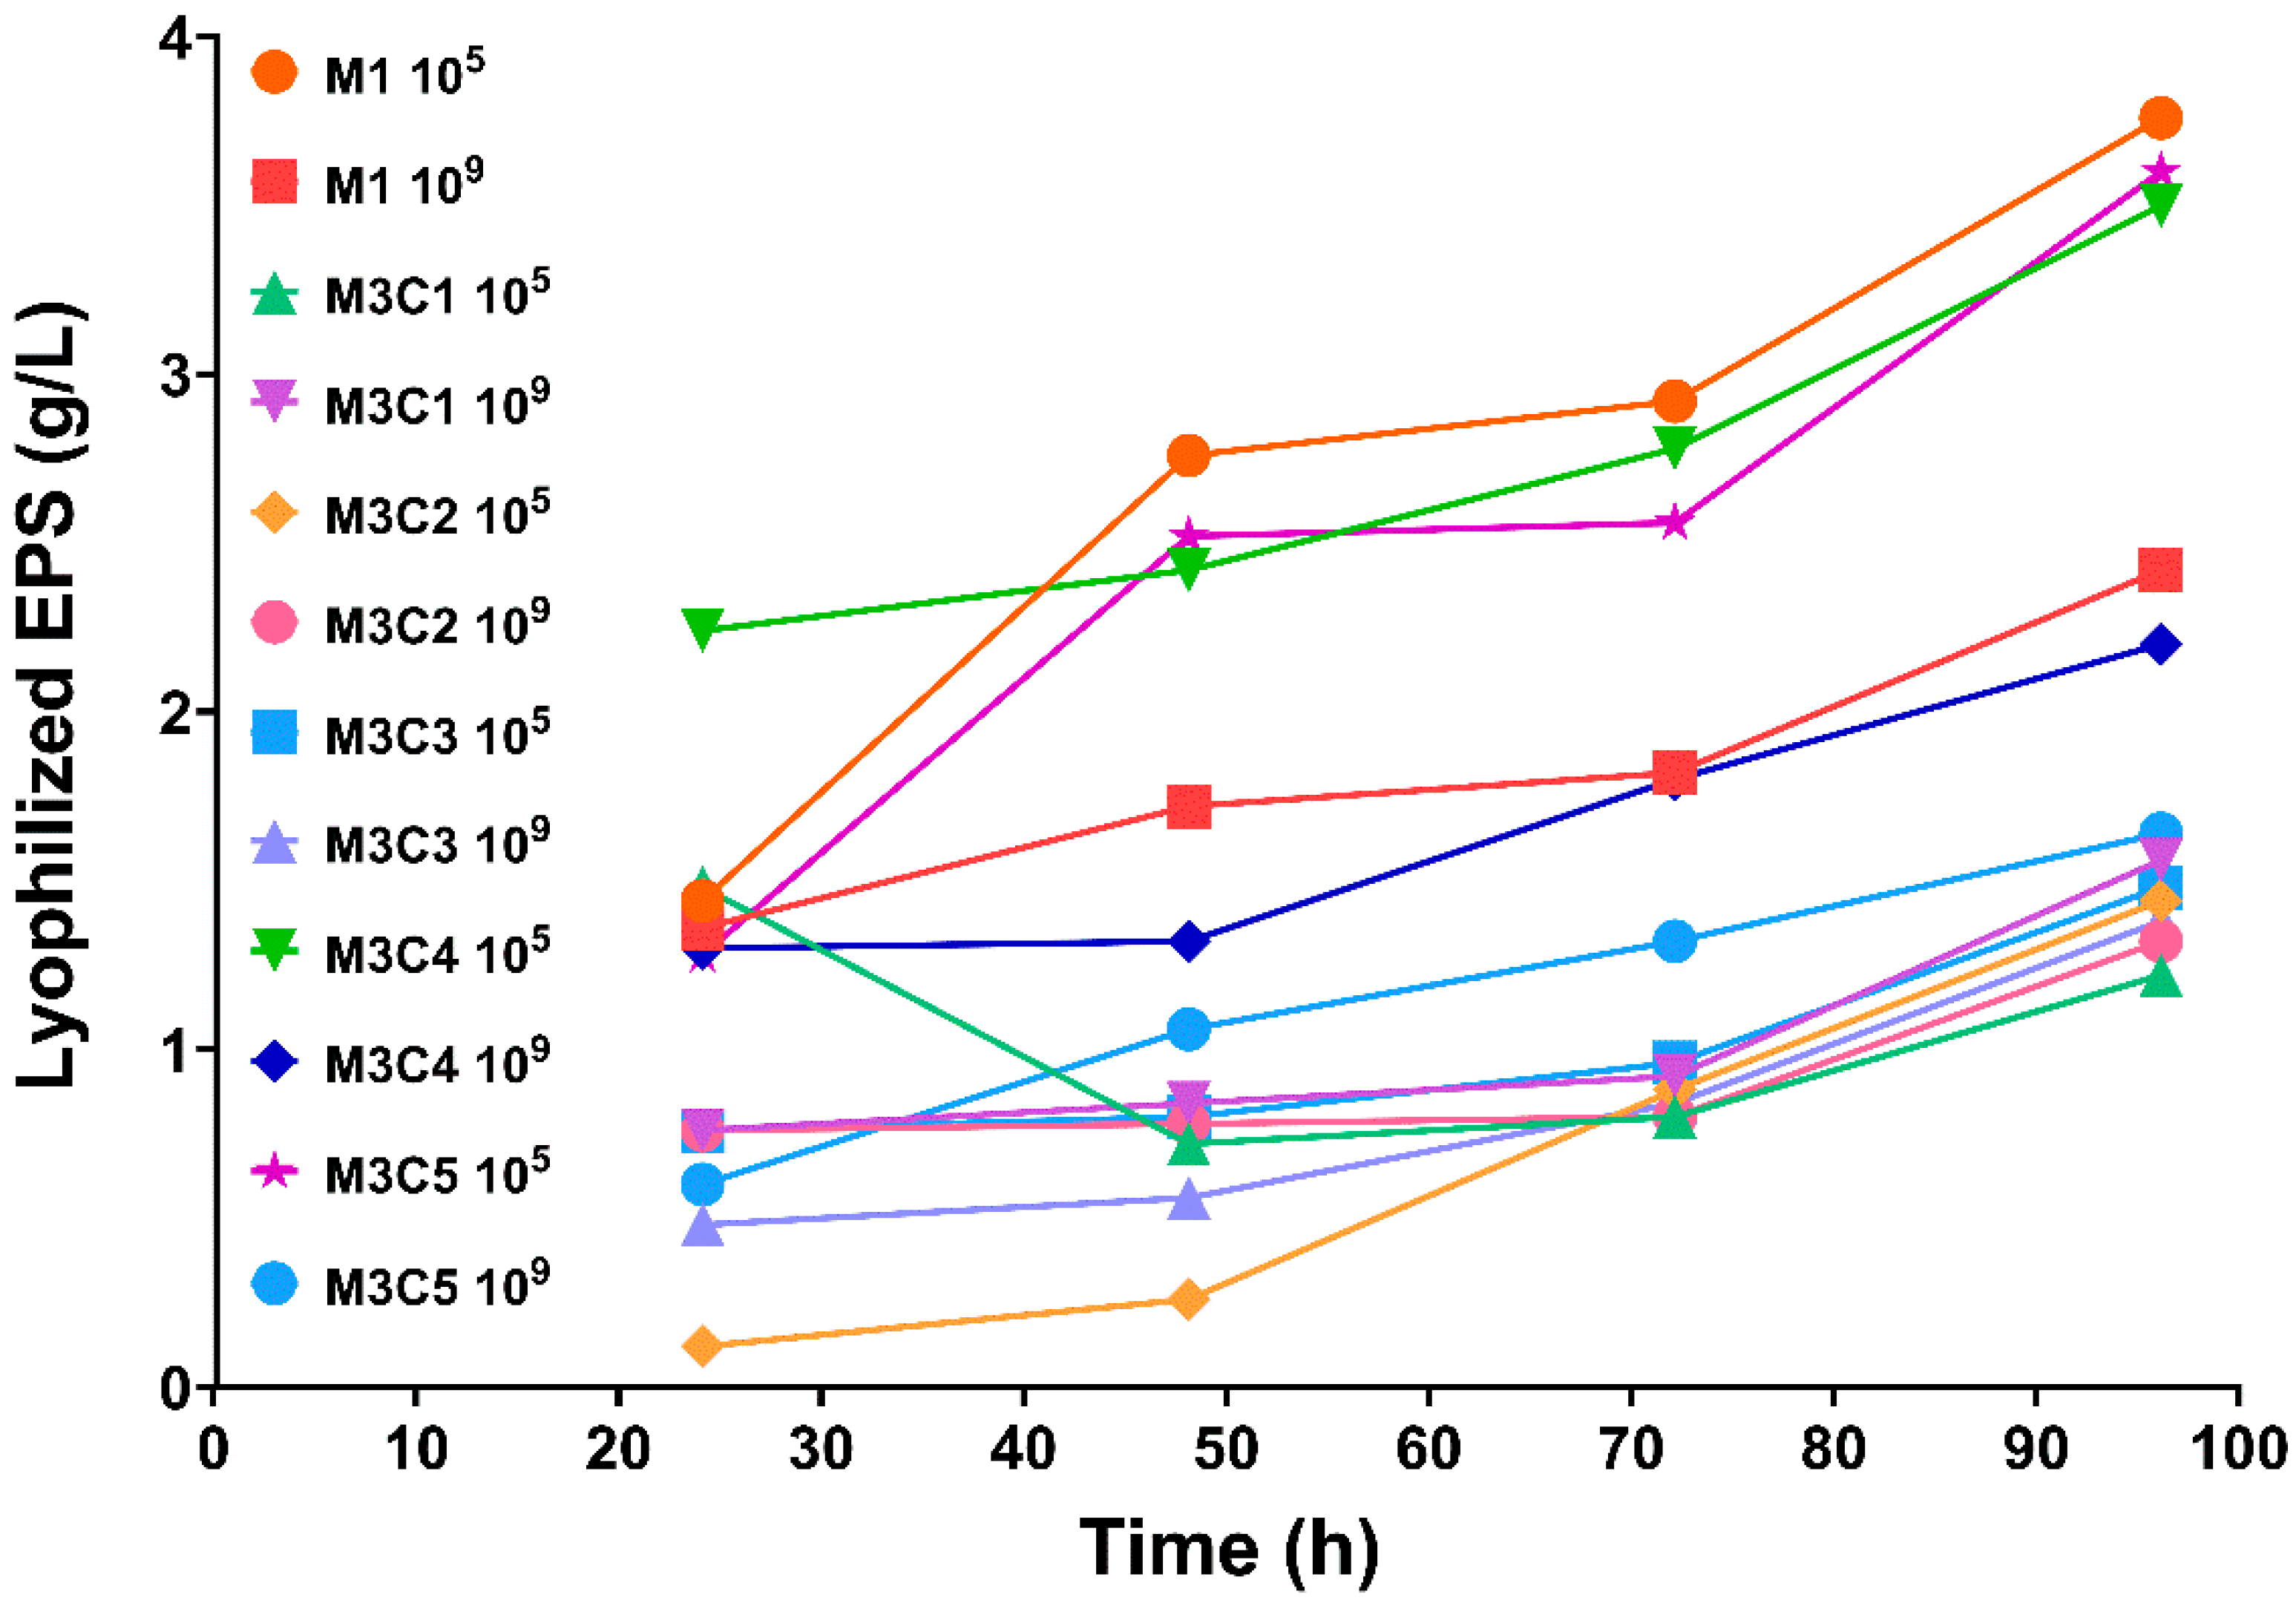
3.2. EPS Quantification from Fermentative Culture Media

We found that EPS biosynthesis was different compared to biomass growth, as expected, considering that EPS are secondary metabolites. For EPS biosynthesis, microbial cells use up to 70% of their energy stores [20], a fact that is obvious for the control samples, where we quantified the highest amount of EPS (3.76 g/L) for the experiment inoculated with 105 CFU/mL. The difference between the two control experiments was substantial, confirming that when there is more CFU/mL, the consumption of nutrients for cell development is much higher, and EPS biosynthesis decreases significantly at 2.42 g/L (Figure 2).
We determined similar amounts of EPS for the experiments denoted M3C5 105 and M3C4 105, but the quantity was lower than that of the control sample. As can be observed from analysing biomass and EPS measurements, when inoculated at 105 CFU/mL, the LAB strain has enough resources to increase its biomass and, at the same time, has sufficient available resources in the culture medium for EPS biosynthesis as a secondary metabolite. Furthermore, we can also assert that the presence of anthocyanins in concentrations of 1000 and 2000 μg/mL has neither stimulating nor inhibitory effects on the biosynthesis of EPS as a secondary metabolite. On the other hand, low anthocyanin concentrations (1, 2, and 3 μg/mL) have strong inhibitory effects on EPS biosynthesis. However, the amount of EPS obtained in this study is in the middle of the range compared to the existing literature [20].

3.3. Gel Permeation Chromatography (GPC) Analysis

GPC was used in order to characterize the EPS extracted from culture media after enzyme inactivation and to obtain information on the molecular weight (Mw) expressed in fractions of different weights. The average molecular number (Mn) was estimated using a Dextran 70.000 Da standard calibration curve in order to calculate the polydispersity index (PDI), an important indicator used to determine if the macromolecule is branched or not. If the PDI registers values higher than one, then the analysed polymer presents different sizes of chains. Table 2 presents the results obtained for the experiments with higher biosynthesised EPS amounts.
As can be observed, the fraction number and the Mw are influenced by the fermentation process and the media composition. In culture media with 2000 μg/mL anthocyanins, we recorded three fractions and a higher Mw and Mn of the studied samples compared with MRS media. This phenomenon has been observed before [26] and the modified media determines the proportional increase of the molecular weight. Moreover, we observed that if the MRS media is supplemented with nitrogen and carbon source, the EPS amount and the Mw of the biosynthesized polymer were increased compared with un-supplemented MRS media.

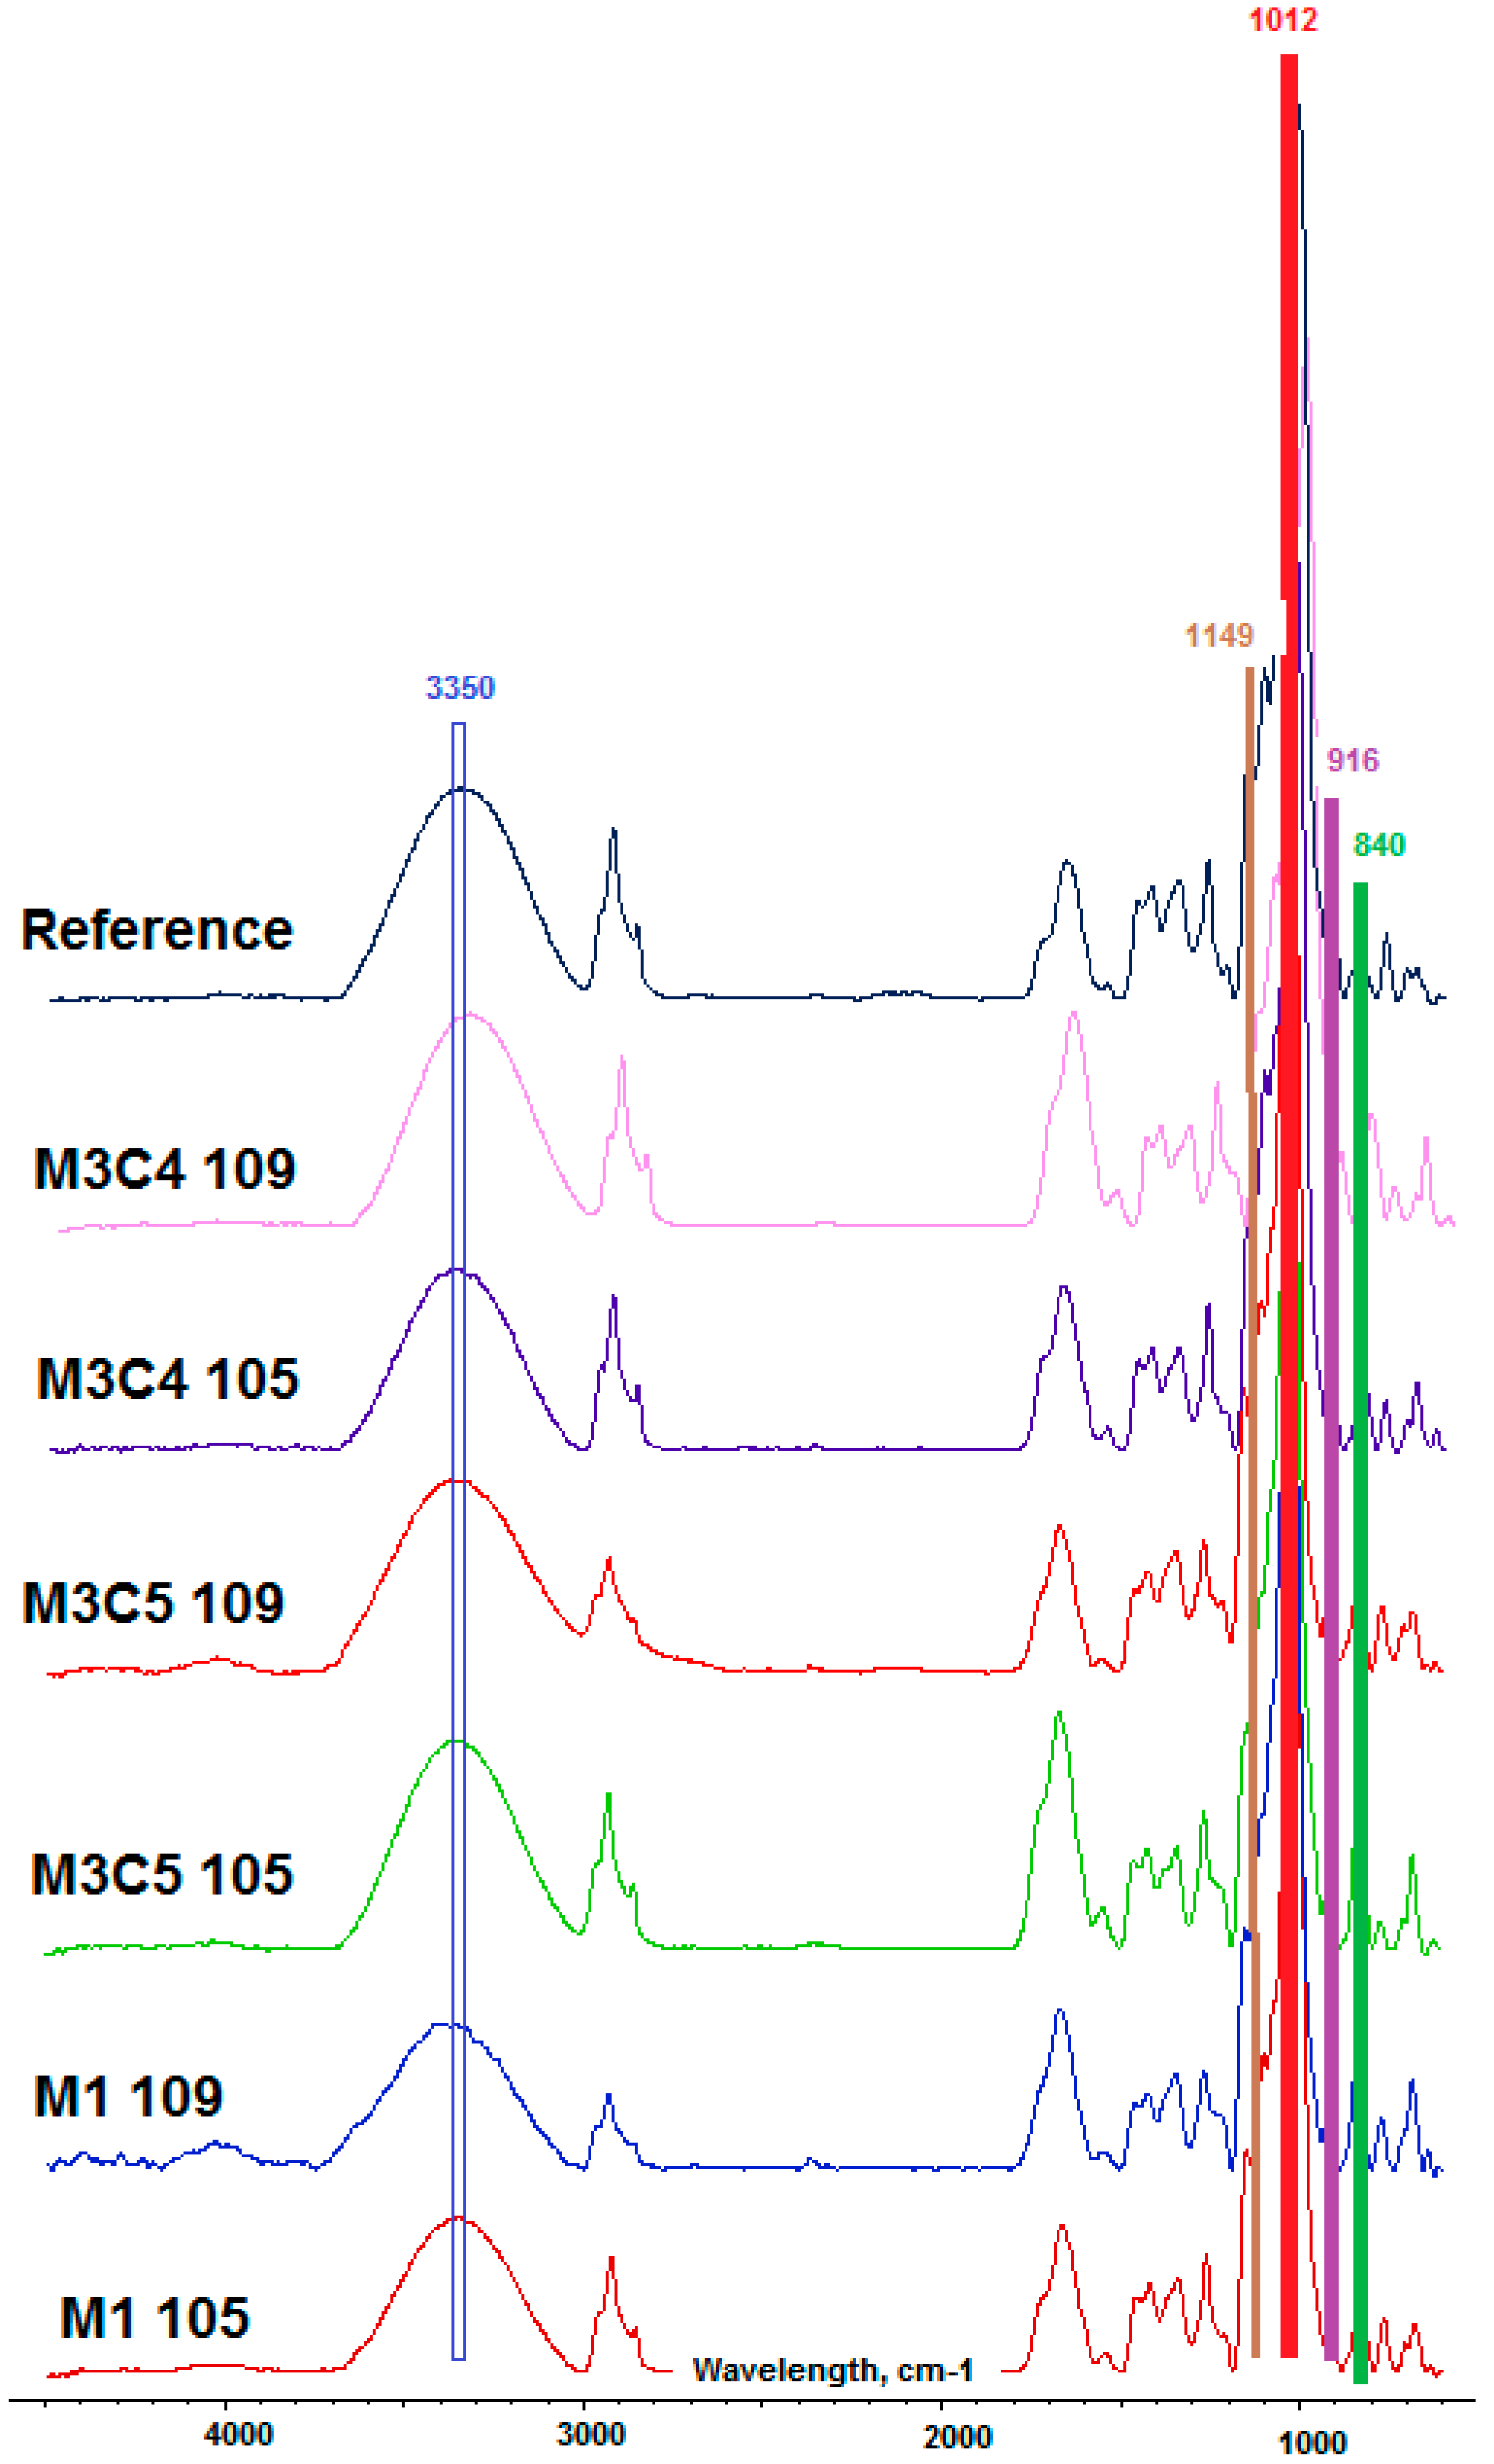
3.4. Fourier-Transform Infrared Spectroscopy (FTIR)

FTIR was used to investigate the nature of the EPS’s functional groups after enzyme inactivation and extraction from culture media. Figure 3 shows the FTIR spectra recorded for the representative samples compared with the standard Dextran spectra. Polysaccharide structural information related to monomeric units and their linkages can be evidenced. Thus, dextran synthesised in the MRS by Weissella spp. strain fermentation (105 and 109) was evidenced by the presence of a sharp peak at 1012 cm−1 and 1016 cm−1, respectively, which is characteristic of the α-(1→6)-glycosidic bond of dextran. Peaks at 916.1 and 840 cm–1 region, specific for α-(1→3)-glycosidic bond were also recorded [35]. The absorption peak at 758 cm−1 indicates that the configuration should be a pyran ring. The peak at 1103 cm−1 should be ascribed to the vibration of the C-O bond at the C-4 position of a glucose residue and the peak at 1149 cm−1 is ascribed to the exocyclic C-O stretching vibrations. The broad peak obtained at 3350 cm−1 is associated with the stretching vibration of the O-H groups present in the polysaccharide chain, while the peak recorded at 2920 cm−1 is due to the stretching vibration of the C-H bonds. The above-mentioned peaks were recorded and marked for all studied samples (Figure 3).

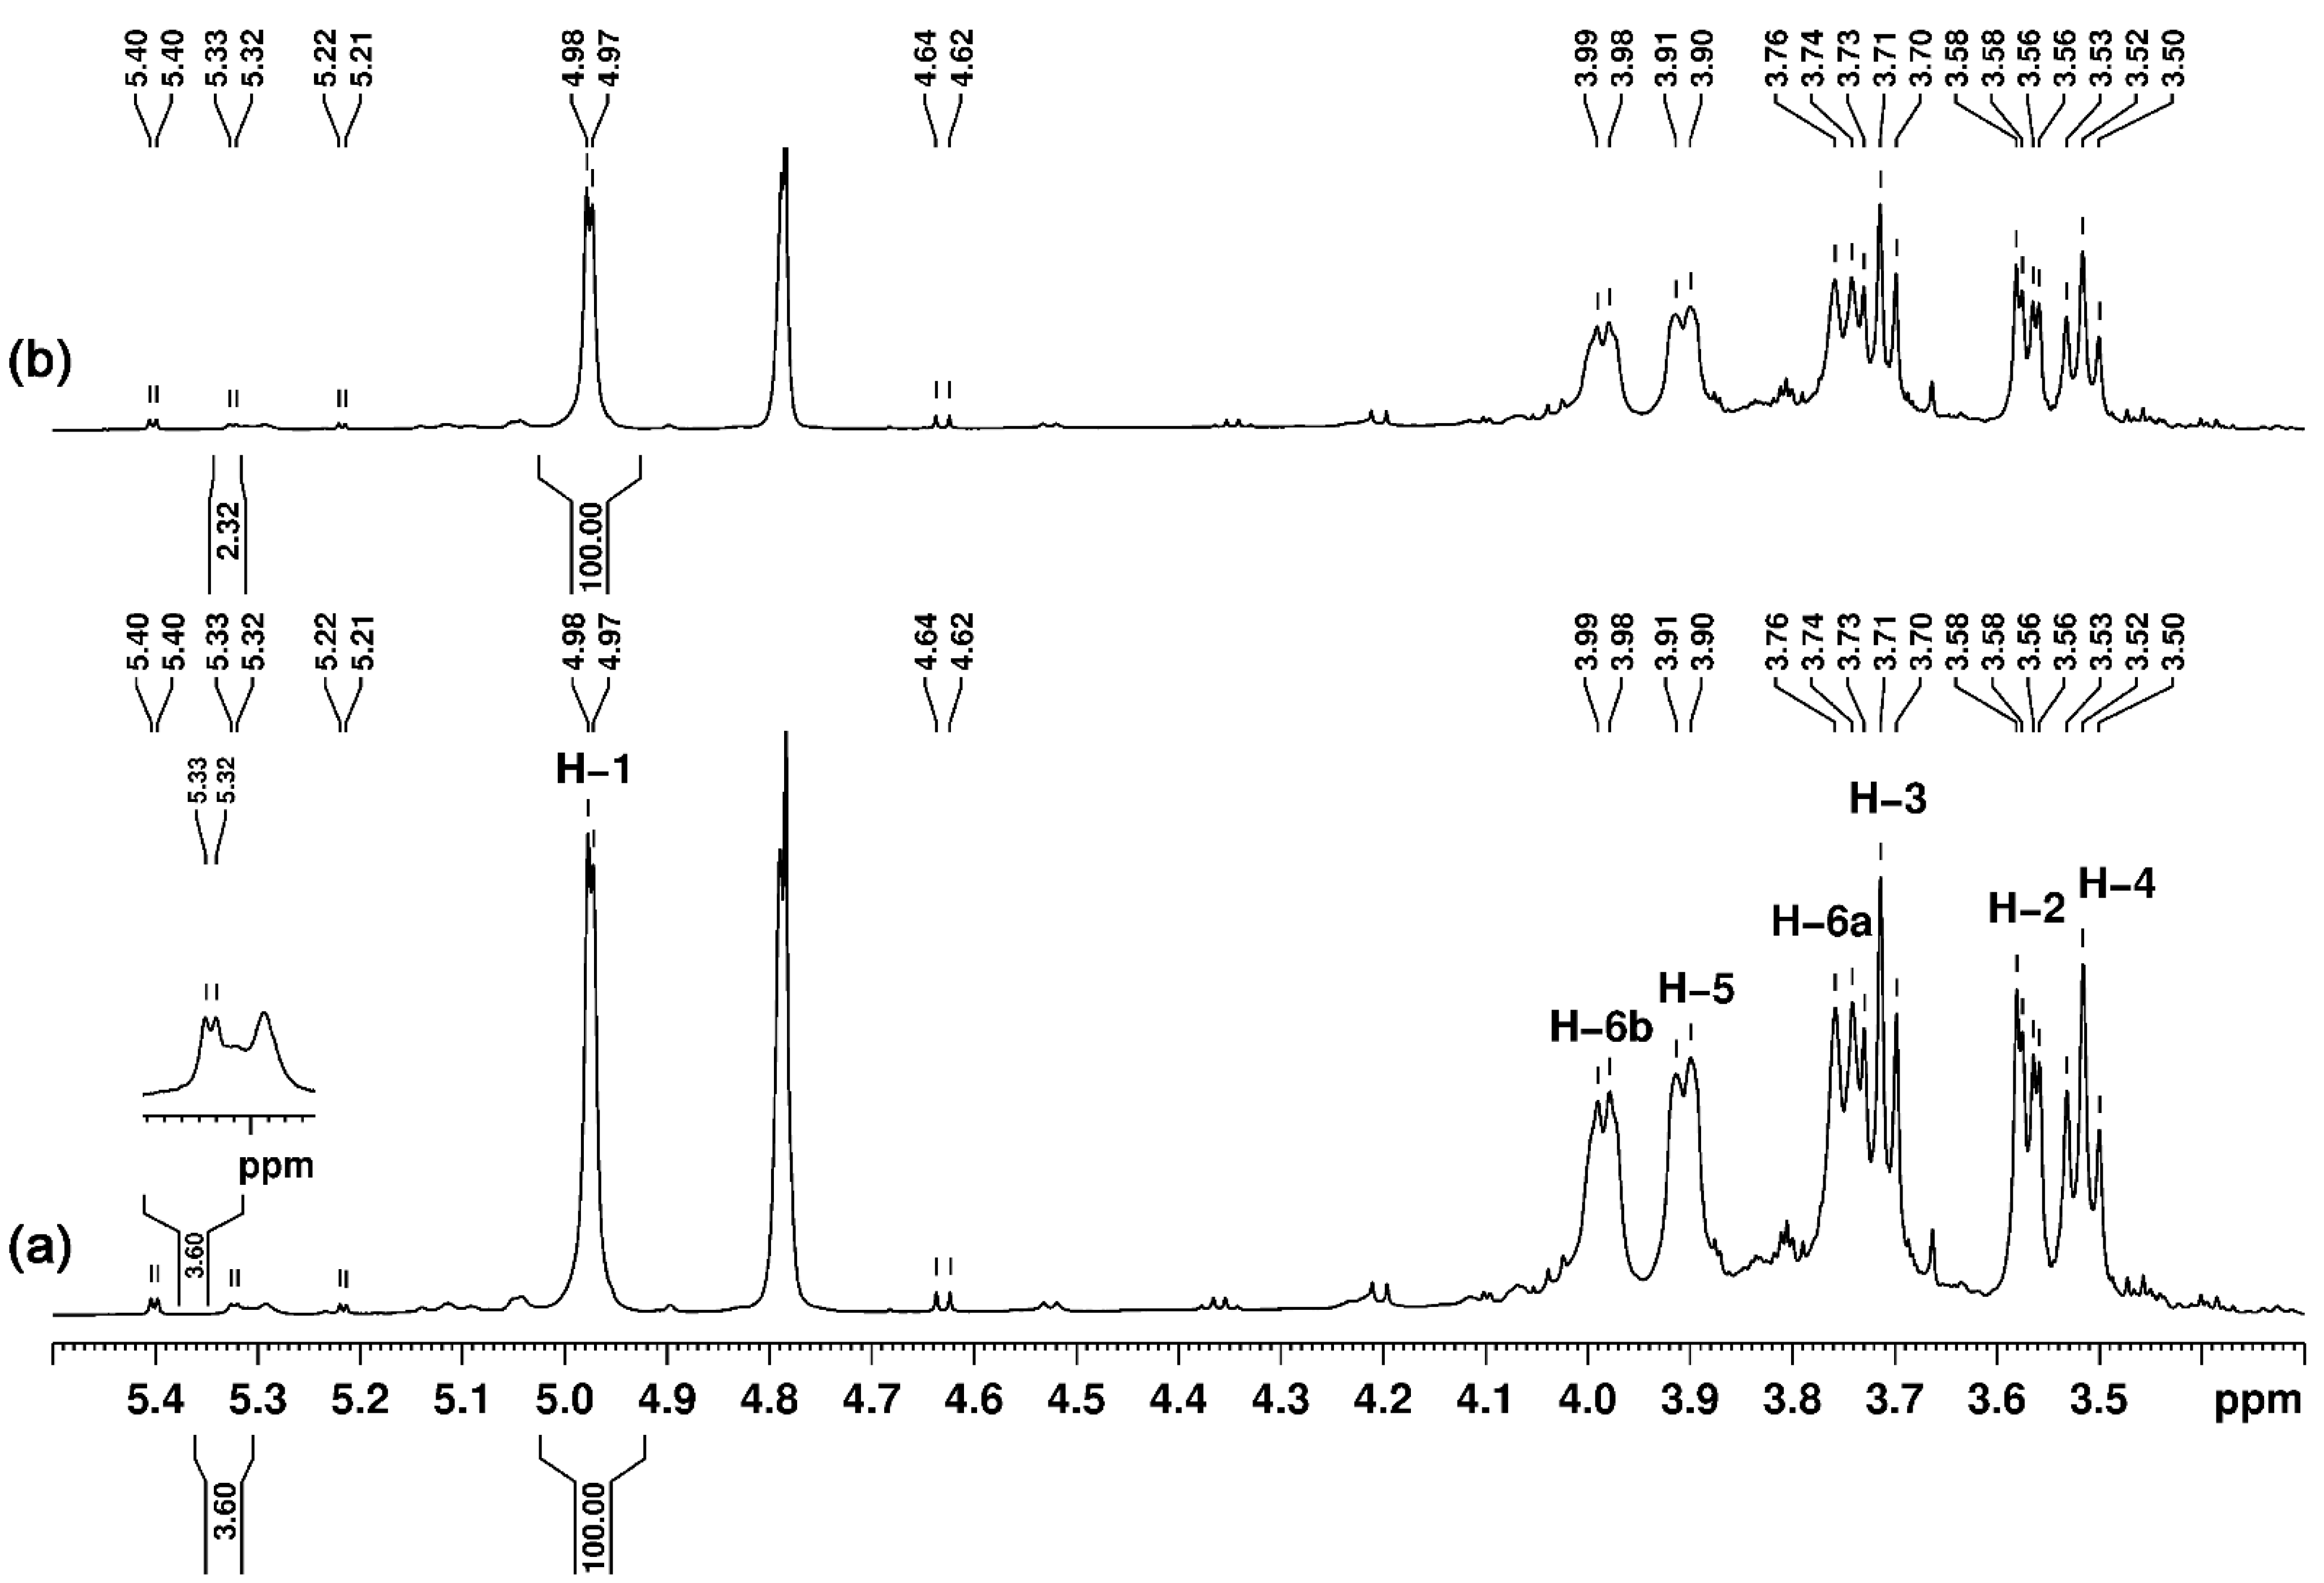
3.5. Nuclear Magnetic Resonance (NMR) Studies

The proton and carbon NMR spectral profiles of the studied samples indicated the presence of an EPS. Based on our previous experience [26] and other published data [36], we concluded that the EPS present in the two studied samples, M3C4 and M3C5, respectively, was dextran. We obtained the structural information supporting the presence of dextran from both one- and bi-dimensional NMR experiments. The overlapped 1H NMR spectra corresponding to the two analysed samples reveal similar NMR patterns, as can be seen in Figure 4.
Dextran’s main chain consists mainly of α-(1→6)-linked glucose units that are associated with the most intense signals in both proton and carbon NMR spectra of our samples. Starting from the anomeric proton that resonates at 4.97 ppm, the assignments for the rest of the α-glucopyranose protons were performed from the TOCSY experiment. Thus, in the TOCSY spectrum exemplified in Figure 5 for sample M3C4, one can observe the couplings of the H-1 anomeric proton from 4.97 ppm (doublet with coupling constant 3 Hz) with protons that belong to the same spin system, such as: H-2 from 3.57 ppm (doublet of doublets with coupling constant 10 and 3 Hz), H-3 from 3.71 ppm (triplet with coupling constant 10 Hz) and H-4 from 3.52 ppm (triplet with coupling constant 10 Hz) protons. Another spin system identified in TOCSY is formed by H-5 from 3.90 ppm (doublet with coupling constant 8 Hz) with H-6 from 3.75 ppm (doublet with coupling constant 10 Hz) and 3.98 ppm (doublet with coupling constant 7 Hz).
The diastereotopic nature of the two protons from the methylene group is clearly visible in the multiplicity-edited HSQC spectrum, exemplified in Figure 6 for sample M3C4. In this type of experiment, the correlation signals associated with the proton-carbon direct chemical bond are “phase coded” depending on the number of hydrogen atoms attached to a given carbon atom. Thus, the signals for CH and CH3 groups have the same phase, while those for CH2 groups have an opposite phase. In the multiplicity-edited HSQC spectrum exemplified in Figure 6, the methylene group was straightforwardly identified based on the negative phase (colour code red in Figure 6 of the corresponding correlation signal). Indeed, the phase difference, another characteristic can be observed in the HSQC spectrum, namely, for the same carbon (68.5 ppm) there are two different signals in the proton dimension at 3.75 and 3.98 ppm. In general, this pattern present in an HSQC-type experiment indicates the existence of diastereotopic methylene protons. From the same HSQC experiment, the rest of the glucose’s carbon atoms were assigned at the following chemical shifts: 72.5 (CH-4), 73.2 (CH-5), 74.4 (CH-2), 76.4 (CH-3), and 100.7 (CH-1).
In the anomeric spectral region of the proton spectrum, four less intense signals with doubled multiplicity are observed at: 4.63 ppm (coupling constant 8.0 Hz), 5.21 ppm (coupling constant 4.0 Hz), 5.32 ppm (coupling constant 3.7 Hz), and 5.40 (coupling constant 4.0 Hz). The first two doublets belong to free glucose (4.63 ppm–anomeric proton from beta glucose and 5.32 ppm–anomeric proton from alfa glucose), while the one from 5.40 ppm was associated with free sucrose. Both sugars carried over from the culture medium. The doublet from 5.32 ppm, was previously assigned by us [26] to anomeric protons of α-(1→3)-linked glucose units, as branches of the dextran’s main chain. The rest of the signals for the branch glucose units could not be assigned because of their low intensity and overlap with the signals from the main chain units. Based on the two anomeric signals and the ratio of their integrals, the percentage of glycosidic linkages was established to be 97% for α-(1→6) and 3% for α-(1→3) for sample M3C4 and 98% for α-(1→6) and 2% for α-(1→3) for sample M3C5, the data are in accordance with the current literature [20].

3.6. Thermal Analysis Measurements-Thermogravimetry (TGA)

The studied samples’ thermal degradation curves are presented in Figure 7 and the degradation temperatures are listed in Table 3. Up to 400 °C, dextran records two degradation steps [37]. The first step is recorded in the range of 80–100 °C due to the loss of intra-molecularly bound water [37]. In the second step, the most pronounced mass loss takes place in the range of 150–400 °C, which is due to the degradation of the dextran macromolecule [37]. For our samples, the more stable structure is recorded for the Dextran standard, for which the main degradation of the structure was recorded at 312 °C.
A very interesting aspect was observed for all the studied samples regarding the degradation temperatures. The EPS purified from media denoted 105 presented almost the same degradation temperature, with ± 1 °C differences between samples and with 57 °C less than standard dextran (Figure 7, Table 3). For all the EPS purified from experimental media denoted 109, similar degradation temperatures were recorded between samples, but with 63 °C less than standard Dextran (Figure 7, Table 3). The degradation steps correspond to depolymerisation, random polymer backbone cleavages, and, lastly, remaining inorganic material [26].
These results show that even if the samples’ degradation tendency is similar when inoculating the culture medium with lower CFU/mL, the obtained dextran has higher thermal stability compared to dextran obtained from higher CFU/mL cultures. Zhou et al. in 2017 [38] reported 313.8 °C for the degradation of dextran biosynthesised by Leuconostoc pseudomesenteroides XG5 in MRS media supplemented with 125 g/L sucrose, a value closer to our standard dextran. However, Wang et al. in 2010 [39] reported 279.59 °C for the degradation of dextran biosynthesised by Lactobacillus plantarum KF5, a temperature closer to what we obtained in our study. Considering this information, we can say that, depending on the strain and the fermentation conditions used, we can obtain biosynthesised dextran with different thermal stability properties.

3.7. Probiotic Activity Determination

Recently, W. confusa was isolated from faecal matter and its probiotic properties have been demonstrated [21]. The most important step for probiotics to develop beneficial effects is the colonization of the intestinal tract after withstanding the harsh conditions of very low pH and high bile salt concentrations [40]. Then, the cell’s auto-aggregation and surface hydrophobicity are very important selection criteria for probiotic screening. A LAB strain presenting in-vitro high surface hydrophobicity and co-aggregation rate can develop a strong adherence to the gastrointestinal tract in-vivo, which is an essential factor for probiotics to colonize the intestines and play a beneficial role [21].

3.7.1. Resistance to Low pH

The low pH level in the stomach represents an environment for the second main digestion stage. If microorganisms are resistant to the passage through the stomach, they may have the chance to colonize the intestinal tract. If the microorganisms are pathogenic, the colonisation may result in infection with diarrhoea, but if the microorganisms are non-pathogenic, beneficial effects can be obtained. It has been demonstrated that W. confusa can tolerate low pH with a survival rate of 2.4 to 20.2% [21,41]. However, our data, presented in Table 4, show that the survival rate was higher than 30% for all cultures at pH 3. It has been reported that polyphenols act as buffers in acidic environments, protecting probiotics against pH values as low as 2 and 3 [42]. Our data show that anthocyanins present in the media are very beneficial for microbial growth, as well as conferring protection against low pH. More than that, at pH 2, we recorded more than 50% survival rate for the experiment denoted M3C5 109, which has the highest anthocyanin concentration.

3.7.2. Resistance to Bile Salt

The bile salt resistance test was performed only on the samples for which the largest amounts of synthesized EPS were obtained. Previously published data reported that W. confusa can tolerate 0.3% bile salt concentrations, which are very toxic for living cells, with a survival rate of 2.2 to 128.8% [21]. Additionally, it was reported that a higher survival rate in the bile salt media confers a more pronounced prebiotic effect of LAB strains [21]. As can be observed in Table 5, the presence of anthocyanins in the culture media manifests a protective media against high bile salt concentrations. The highest cell viability was obtained for M3C5 109, confirming that polyphenols protect cell metabolism in hostile environments. Furthermore, the inoculation of higher CFU numbers per mL of media increases the survival degree. The survival rates obtained show that this media for W. confusa LAB cultures can be recommended for further studies regarding the final product’s prebiotic effect.

3.7.3. Evaluation of Hydrophobicity and Auto-Aggregation

The hydrophobicity and auto-aggregation rate are very important indicators of the isolates regarding a possible prebiotic effect [29,30]. The auto-aggregation is strongly related to the type and the amount of surface layer protein that influences bacterial adhesion onto the intestinal cell wall [42]. We performed this test on culture media containing the highest anthocyanin concentrations compared with MRS media, and the results are presented in Table 6. As it can be observed, higher percentages of both hydrophobicity and auto-aggregation rate were obtained for media supplemented with anthocyanins, compared with MRS media fermentations, highlighting the importance of the overall positive modulatory effects exerted by anthocyanins [42]. Auto-aggregation rate increases with anthocyanin concentration in the culture media and over time, the highest values being obtained for M3C5. Table 6 also shows that M3C5 has hydrophobicity higher than 70%, which is arbitrarily considered hydrophobic, and this parameter usually suggests high prebiotic potential [30]. The presence in the culture media of 1000 μg anthocyanins /mL compared to MRS media determines a lower hydrophobicity percent. From these results, we can conclude that a LAB strain can have a prebiotic effect depending on its culture media composition and high anthocyanin concentrations improve the overall prebiotic effect. Comparing our results to available literature, we conclude that our proposed culture media is superior to previously published media with probiotic applications [21].
Until now it was postulated that plants’ polyphenols are a part of the concept of the three P’s responsible for gut wellness which includes prebiotics, probiotics, and polyphenols [24]. Before now, it was postulated that LABs are able to modulate the polyphenolic compounds’ composition and enhance antioxidant activity in the gut. As was mentioned already, EPS positively influences the LAB passage through the gastrointestinal tract, increasing LABs growth, mucosal adhesion, and prebiotic activity [43], results which were confirmed by our data. More than that, a media which contains EPS and exhibits a specific phenolic composition could constitute a prebiotic effect by influencing the gut microbiota structure and function [20]. The EPS anti-inflammatory, antimicrobial, antitumor, or immunomodulatory properties are increased by the synergetic effects of H. sabdariffa anthocyanins from fermented media [44], protecting the tested products from harsh conditions in the stomach and intestine. More than that, S’ayago-Ayerdi et al. in 2020 and 2021 demonstrated that the anthocyanins from H. sabdariffa are degraded in-vitro by human faecal microbiota in a validated colon model [24], resulting in digestion metabolites that represent very important compounds for human health [45]. These facts are strongly supported by our results.

4. Conclusions

The presence of high anthocyanin concentrations in the fermentation media led to the biosynthesis of dextran with high molecular weight which exerted a considerable influence by improving the probiotic properties of W. confusa PP29 strain. Thus, a higher percentage of both hydrophobicity and auto-aggregation rate was obtained for anthocyanin-supplemented media as compared with MRS media fermentations. Additionally, the presence of anthocyanins in the culture media exhibited a protective effect against high bile salt concentrations and low pH values. These effects increase the LAB strain’s viability during passage through the stomach and increase its ability to populate the intestinal tract, manifesting positive effects on human health. The presented results encourage future in-vitro and in-vivo studies in order to elucidate the interactions that led to these obtained effects and to develop improved commercial products.

Author Contributions

Conceptualization, A.-R.P. and I.S.; data curation, A.D., N.S. and A.-R.P.; formal analysis, A.D.; funding acquisition, A.-R.P. and I.S.; investigation, A.D., N.S. and A.-R.P.; methodology, A.-R.P. and I.S.; project administration, A.-R.P. and I.S.; resources, A.-R.P. and I.S.; supervision, A.-R.P. and I.S.; validation, A.D. and A.-R.P.; visualization, A.-R.P. and I.S.; writing–original draft, N.S., A.-R.P. and I.S.; writing–review & editing, N.S. and I.S. All authors have read and agreed to the published version of the manuscript.

Funding

This research was funded by a grant of the Romanian Ministry of Education and Research, CNCS-UEFISCDI, project number PN-III-P4-ID-PCE-2020–1523, within PNCDI III, and supported by the European Social Fund for Regional Development, Competitiveness Operational Programme 2014–2020, Axis 1, Action: 1.1.3, Project “Infra SupraChem Lab-Center for Advanced Research in Supramolecular Chemistry” (Contract 339/390015/25.02.2021, cod MySMIS: 108983).

Institutional Review Board Statement

Not applicable.

Informed Consent Statement

Not applicable.

Data Availability Statement

The data presented in this study are available on request from the corresponding author.

Conflicts of Interest

The authors declare no conflict of interest.

References

  1. Abdallah, E.M. Antibacterial activity of Hibiscus sabdariffa L. calyces against hospital isolates of multidrug resistant Acinetobacter baumannii. J. Acute Dis. 2016, 5, 512–516. [Google Scholar] [CrossRef] [Green Version]
  2. Jabeur, I.; Pereira, E.; Barros, L.; Calhelha, R.C.; Soković, M.; Oliveira, M.B.P.P.; Ferreira, I.C.F.R. Hibiscus sabdariffa L. as a source of nutrients, bioactive compounds and colouring agents. Food Res. Int. 2017, 100, 717–723. [Google Scholar] [CrossRef] [PubMed] [Green Version]
  3. Riaz, G.; Chopra, R. A review on phytochemistry and therapeutic uses of Hibiscus sabdariffa L. Biomed. Pharmacother. 2018, 102, 575–586. [Google Scholar] [CrossRef] [PubMed]
  4. Van Nguyen Thien, T.; Do, L.T.M.; Dang, P.H.; Huynh, N.V.; Dang, H.P.; Nguyen, T.T.; Tran, K.T.; Nguyen Huu, D.M.; Ton That, Q. A new lignan from the flowers of Hibiscus sabdariffa L. (Malvaceae). Nat. Prod. Res. 2019, 35, 2218–2223. [Google Scholar] [CrossRef] [PubMed]
  5. Singh, M.; Thrimawithana, T.; Shukla, R.; Adhikari, B. Extraction and characterization of polyphenolic compounds and potassium hydroxycitrate from Hibiscus sabdariffa. Futur. Foods 2021, 4, 100087. [Google Scholar] [CrossRef]
  6. Khan, N.H.; Abdulbaqi, I.M.; Darwis, Y.; Aminu, N.; Chan, S.Y. A stability-indicating HPLC-UV method for the quantification of anthocyanin in Roselle (Hibiscus sabdariffa L.) spray-dried extract, oral powder, and lozenges. Heliyon 2022, 8, e09177. [Google Scholar] [CrossRef]
  7. Maciel, L.G.; do Carmo, M.A.V.; Azevedo, L.; Daguer, H.; Molognoni, L.; de Almeida, M.M.; Granato, D.; Rosso, N.D. Hibiscus sabdariffa anthocyanins-rich extract: Chemical stability, in vitro antioxidant and antiproliferative activities. Food Chem. Toxicol. 2018, 113, 187–197. [Google Scholar] [CrossRef]
  8. Higginbotham, K.L.; Burris, K.P.; Zivanovic, S.; Davidson, P.M.; Stewart, C.N. Aqueous extracts of Hibiscus sabdariffa calyces as an antimicrobial rinse on hot dogs against Listeria monocytogenes and methicillin-resistant Staphylococcus aureus. Food Control 2014, 40, 274–277. [Google Scholar] [CrossRef]
  9. Da-Costa-Rocha, I.; Bonnlaender, B.; Sievers, H.; Pischel, I.; Heinrich, M. Hibiscus sabdariffa L.–A phytochemical and pharmacological review. Food Chem. 2014, 165, 424–443. [Google Scholar] [CrossRef] [PubMed] [Green Version]
  10. Su, C.C.; Wang, C.J.; Huang, K.H.; Lee, Y.J.; Chan, W.M.; Chang, Y.C. Anthocyanins from Hibiscus sabdariffa calyx attenuate in vitro and in vivo melanoma cancer metastasis. J. Funct. Foods 2018, 48, 614–631. [Google Scholar] [CrossRef]
  11. Goldberg, K.H.; Yin, A.C.; Mupparapu, A.; Retzbach, E.P.; Goldberg, G.S.; Yang, C.F. Components in aqueous Hibiscus rosa-sinensis flower extract inhibit in vitro melanoma cell growth. J. Tradit. Complement. Med. 2017, 7, 45–49. [Google Scholar] [CrossRef] [PubMed] [Green Version]
  12. Wu, C.H.; Huang, C.C.; Hung, C.H.; Yao, F.Y.; Wang, C.J.; Chang, Y.C. Delphinidin-rich extracts of Hibiscus sabdariffa L. trigger mitochondria-derived autophagy and necrosis through reactive oxygen species in human breast cancer cells. J. Funct. Foods 2016, 25, 279–290. [Google Scholar] [CrossRef]
  13. Ali, B.H.; Al Wabel, N.; Blunden, G. Phytochemical, pharmacological and toxicological aspects of Hibiscus sabdariffa L.: A review. Phyther. Res. 2005, 19, 369–375. [Google Scholar] [CrossRef] [PubMed]
  14. Guardiola, S.; Mach, N. Potencial terapéutico del Hibiscus sabdariffa: Una revisión de las evidencias científicas. Endocrinol. Nutr. 2014, 61, 274–295. [Google Scholar] [CrossRef]
  15. Amaya-Cruz, D.; Peréz-Ramírez, I.F.; Pérez-Jiménez, J.; Nava, G.M.; Reynoso-Camacho, R. Comparison of the bioactive potential of Roselle (Hibiscus sabdariffa L.) calyx and its by-product: Phenolic characterization by UPLC-QTOF MSE and their anti-obesity effect in vivo. Food Res. Int. 2019, 126, 108589. [Google Scholar] [CrossRef]
  16. Nguyen, T.T.; Phan-Thi, H.; Pham-Hoang, B.N.; Ho, P.T.; Tran, T.T.T.; Waché, Y. Encapsulation of Hibiscus sabdariffa L. anthocyanins as natural colours in yeast. Food Res. Int. 2018, 107, 275–280. [Google Scholar] [CrossRef]
  17. Silva, M.; Cueva, C.; Alba, C.; Rodriguez, J.M.; de Pascual-Teresa, S.; Jones, J.; Caturla, N.; Victoria Moreno-Arribas, M.; Bartolomé, B. Gut microbiome-modulating properties of a polyphenol-enriched dietary supplement comprised of hibiscus and lemon verbena extracts. Monitoring of phenolic metabolites. J. Funct. Foods 2022, 91, 105016. [Google Scholar] [CrossRef]
  18. Laskar, Y.B.; Mazumder, P.B. Insight into the molecular evidence supporting the remarkable chemotherapeutic potential of Hibiscus sabdariffa L. Biomed. Pharmacother. 2020, 127, 110153. [Google Scholar] [CrossRef]
  19. Nazhand, A.; Souto, E.B.; Lucarini, M.; Souto, S.B.; Durazzo, A.; Santini, A. Ready to Use Therapeutical Beverages: Focus on Functional Beverages Containing Probiotics, Prebiotics and Synbiotics. Beverages 2020, 6, 26. [Google Scholar] [CrossRef] [Green Version]
  20. Guérin, M.; Robert-Da Silva, C.; Garcia, C.; Remize, F. Lactic Acid Bacterial Production of Exopolysaccharides from Fruit and Vegetables and Associated Benefits. Fermentation 2020, 6, 115. [Google Scholar] [CrossRef]
  21. Xiong, L.; Ni, X.; Niu, L.; Zhou, Y.; Wang, Q.; Khalique, A.; Liu, Q.; Zeng, Y.; Shu, G.; Pan, K.; et al. Isolation and Preliminary Screening of a Weissella confusa Strain from Giant Panda (Ailuropoda melanoleuca). Probiotics Antimicrob. Proteins 2019, 11, 535–544. [Google Scholar] [CrossRef]
  22. de Souza Aquino, J.; Batista, K.S.; Menezes, F.N.D.D.; Lins, P.P.; de Sousa Gomes, J.A.; da Silva, L.A. Models to Evaluate the Prebiotic Potential of Foods. Funct. Food-Improv. Health Adequate Food 2017. [Google Scholar] [CrossRef] [Green Version]
  23. Devi, P.B.; Kavitake, D.; Jayamanohar, J.; Shetty, P.H. Preferential growth stimulation of probiotic bacteria by galactan exopolysaccharide from Weissella confusa KR780676. Food Res. Int. 2021, 143, 110333. [Google Scholar] [CrossRef] [PubMed]
  24. Sáyago-Ayerdi, S.G.; Venema, K.; Tabernero, M.; Sarriá, B.; Bravo, L.; Mateos, R. Bioconversion of polyphenols and organic acids by gut microbiota of predigested Hibiscus sabdariffa L. calyces and Agave (A. tequilana Weber) fructans assessed in a dynamic in vitro model (TIM-2) of the human colon. Food Res. Int. 2021, 143, 110301. [Google Scholar] [CrossRef] [PubMed]
  25. Anghel, N. SPRUCE BARK POLYPHENOLS AS METABOLIC BOOSTERS FOR YEAST DEVELOPMENT. Cellul. Chem. Technol. Cellul. Chem. Technol. 2019, 53, 925–928. [Google Scholar] [CrossRef]
  26. Rosca, I.; Petrovici, A.R.; Peptanariu, D.; Nicolescu, A.; Dodi, G.; Avadanei, M.; Ivanov, I.C.; Bostanaru, A.C.; Mares, M.; Ciolacu, D. Biosynthesis of dextran by Weissella confusa and its In vitro functional characteristics. Int. J. Biol. Macromol. 2018, 107, 1765–1772. [Google Scholar] [CrossRef]
  27. Miao, M.; Bai, A.; Jiang, B.; Song, Y.; Cui, S.W.; Zhang, T. Characterisation of a novel water-soluble polysaccharide from Leuconostoc citreum SK24.002. Food Hydrocoll. 2014, 36, 265–272. [Google Scholar] [CrossRef]
  28. Petrovici, A.R.; Nicolescu, A.; Silion, M.; Roșca, I.; Ciolacu, D. Biopolymer biosynthesis by lactic acid bacteria strain in four different culture media. Rev. Roum. Chim. 2018, 63, 637–642. [Google Scholar]
  29. Krausova, G.; Hyrslova, I.; Hynstova, I. In Vitro Evaluation of Adhesion Capacity, Hydrophobicity, and Auto-Aggregation of Newly Isolated Potential Probiotic Strains. Ferment. 2019, 5, 100. [Google Scholar] [CrossRef] [Green Version]
  30. Mushtaq, M.; Gani, A.; Noor, N.; Masoodi, F.A. Phenotypic and probiotic characterization of isolated LAB from Himalayan cheese (Kradi/Kalari) and effect of simulated gastrointestinal digestion on its bioactivity. LWT 2021, 149, 111669. [Google Scholar] [CrossRef]
  31. Collins, M.D.; Samelis, J.; Metaxopoulos, J.; Wallbanks, S. Taxonomic studies on some leuconostoc-like organisms from fermented sausages: Description of a new genus Weissella for the Leuconostoc paramesenteroides group of species. J. Appl. Bacteriol. 1993, 75, 595–603. [Google Scholar] [CrossRef] [PubMed]
  32. Hainal, A.-R.; Ignat, I.; Volf, I.; Popa, V.I. TRANSFORMATION OF POLYPHENOLS FROM BIOMASS BY SOME YEAST SPECIES. Cellul. Chem. Technol. 2011, 45, 211–219. [Google Scholar]
  33. Petrovici, A.R.; Roşca, I.; Dodi, G.; Nicolescu, A.; Avǎdanei, M.; Varganici, C.D.; Ciolacu, D. Effects of culture medium composition on biosynthesis of exopolysaccharides. Cellul. Chem. Technol. 2017, 51, 821–830. [Google Scholar]
  34. Wu, S.; Lu, H.Y.; Chen, Q.H.; Xie, H.C.; Jiao, Y.C. Anthocyanin extract from Lycium ruthenicum enhanced production of biomass and polysaccharides during submerged fermentation of Agaricus bitorquis (Quél.) Sacc. Chaidam. Bioprocess Biosyst. Eng. 2021, 44, 2303–2313. [Google Scholar] [CrossRef] [PubMed]
  35. Wang, T.; Deng, L.; Li, S.; Tan, T. Structural characterization of a water-insoluble (1 → 3)-α-d-glucan isolated from the Penicillium chrysogenum. Carbohydr. Polym. 2007, 67, 133–137. [Google Scholar] [CrossRef]
  36. Maina, N.H.; Tenkanen, M.; Maaheimo, H.; Juvonen, R.; Virkki, L. NMR spectroscopic analysis of exopolysaccharides produced by Leuconostoc citreum and Weissella confusa. Carbohydr. Res. 2008, 343, 1446–1455. [Google Scholar] [CrossRef]
  37. Kothari, D.; Tingirikari, J.M.R.; Goyal, A. In vitro analysis of dextran from Leuconostoc mesenteroides NRRL B-1426 for functional food application. Bioact. Carbohydrates Diet. Fibre 2015, 6, 55–61. [Google Scholar] [CrossRef]
  38. Zhou, Q.; Feng, F.; Yang, Y.; Zhao, F.; Du, R.; Zhou, Z.; Han, Y. Characterization of a dextran produced by Leuconostoc pseudomesenteroides XG5 from homemade wine. Int. J. Biol. Macromol. 2018, 107, 2234–2241. [Google Scholar] [CrossRef]
  39. Wang, Y.; Li, C.; Liu, P.; Ahmed, Z.; Xiao, P.; Bai, X. Physical characterization of exopolysaccharide produced by Lactobacillus plantarum KF5 isolated from Tibet Kefir. Carbohydr. Polym. 2010, 82, 895–903. [Google Scholar] [CrossRef]
  40. Grispoldi, L.; Giglietti, R.; Traina, G.; Cenci-Goga, B. How to Assess in vitro Probiotic Viability and the Correct Use of Neutralizing Agents. Front. Microbiol. 2020, 11, 204. [Google Scholar] [CrossRef] [Green Version]
  41. Fessard, A.; Remize, F. Why Are Weissella spp. Not Used as Commercial Starter Cultures for Food Fermentation? Ferment. 2017, 3, 38. [Google Scholar] [CrossRef] [Green Version]
  42. Monteagudo-Mera, A.; Rodríguez-Aparicio, L.; Rúa, J.; Martínez-Blanco, H.; Navasa, N.; García-Armesto, M.R.; Ferrero, M.Á. In vitro evaluation of physiological probiotic properties of different lactic acid bacteria strains of dairy and human origin. J. Funct. Foods 2012, 4, 531–541. [Google Scholar] [CrossRef]
  43. Korcz, E.; Varga, L. Exopolysaccharides from lactic acid bacteria: Techno-functional application in the food industry. Trends Food Sci. Technol. 2021, 110, 375–384. [Google Scholar] [CrossRef]
  44. Huang, H.C.; Chang, W.T.; Wu, Y.H.; Yang, B.C.; Xu, M.R.; Lin, M.K.; Chen, H.J.; Cheng, J.H.; Lee, M.S. Phytochemicals levels and biological activities in Hibiscus sabdariffa L. were enhanced using microbial fermentation. Ind. Crops Prod. 2022, 176, 114408. [Google Scholar] [CrossRef]
  45. Sáyago-Ayerdi, S.G.; Zamora-Gasga, V.M.; Venema, K. Changes in gut microbiota in predigested Hibiscus sabdariffa L. calyces and Agave (Agave tequilana weber) fructans assessed in a dynamic in vitro model (TIM-2) of the human colon. Food Res. Int. 2020, 132, 109036. [Google Scholar] [CrossRef]
Scheme 1. Experimental flow and characterisation techniques used in order to demonstrate the experimental goals.
Fermentation 08 00553 sch001
Figure 1. Dry biomass quantification during fermentative processes. Experiments’ codifications are presented in Table 1.
Fermentation 08 00553 g001
Figure 2. EPS quantification during fermentative processes. Experiments’ codifications are presented in Table 1.
Fermentation 08 00553 g002
Figure 3. The FTIR spectra recorded for the studied EPS samples.
Fermentation 08 00553 g003
Figure 4. The overlap of the 1H NMR spectra corresponding to the two analysed samples (a) M3C4 and (b) M3C5, recorded in D2O with water signal suppression. The signals’ assignments are annotated in the figure.
Fermentation 08 00553 g004
Figure 5. The H, H TOCSY spectrum corresponding to sample M3C4, showing the couplings between the protons belonging to the same spin systems.
Fermentation 08 00553 g005
Figure 6. Multiplicity edited H, C HSQC spectrum corresponding to samples M3C4, showing the correlation signals associated with a proton-carbon direct chemical bond. The methylene group is clearly identified based on the negative phase (colour code red).
Fermentation 08 00553 g006
Figure 7. TG and DTG curves of the studied samples.
Fermentation 08 00553 g007
Table 1. The codification and description of the experiments.
Experiment CodeAnthocyanins’ Concentration in Culture Media, μg/mLDescription
M1 105-The PP29 strain fermented in M1 inoculated with 105 CFU/mL
M1 109-The PP29 strain fermented in M1 inoculated with 109 CFU/mL
M3C1 1051The PP29 strain fermented in M3C1 inoculated with 105 CFU/mL
M3C1 1091The PP29 strain fermented in M3C1 inoculated with 109 CFU/mL
M3C2 1052The PP29 strain fermented in M3C2 inoculated with 105 CFU/mL
M3C2 1092The PP29 strain fermented in M3C2 inoculated with 109 CFU/mL
M3C3 1053The PP29 strain fermented in M3C3 inoculated with 105 CFU/mL
M3C3 1093The PP29 strain fermented in M3C3 inoculated with 109 CFU/mL
M3C4 1051000The PP29 strain fermented in M3C4 inoculated with 105 CFU/mL
M3C4 1091000The PP29 strain fermented in M3C4 inoculated with 109 CFU/mL
M3C5 1052000The PP29 strain fermented in M3C5 inoculated with 105 CFU/mL
M3C5 1092000The PP29 strain fermented in M3C5 inoculated with 109 CFU/mL
Table 2. Average molecular number (Mn), average molecular weight (Mw), and polydispersity index (PDI) of the biosynthesised EPS.
Sample,
109 Initial CPU
FractionMn, DaMw, DaPDI
M112.0 × 1062.2 × 1061.1
26.1 × 1046.3 × 1041.03
M3C418.6 × 1051.2 × 1061.39
24.9 × 1055.6 × 1051.14
31.2 × 1052.7 × 1052.25
M3C519.1 × 1051.3 × 1061.42
26.8 × 1058.1 × 1051.19
36.7 × 1048.8 × 1041.31
Table 3. Thermal characteristics of the studied samples.
Degradation Temperature, °C249 255 312
SamplesM1 109M1 105Dex
M3C4 109M3C4 105
M3C5 109M3C5 105
Table 4. The W. confusa resistance rate at lower pH.
ExperimentspH 7pH 3pH 2
M1 1051003.00 ± 0.120.00 ± 0.00
M1 10910025.00 ± 1.084.89 ± 0.98
M3C4 10510039.56 ± 1.575.02 ± 0.22
M3C4 10910040.59 ± 1.6910.28 ± 0.50
M3C5 10510042.05 ± 1.7721.05 ± 0.98
M3C5 10910072.74 ± 3.1953.51 ± 2.42
Table 5. The bile salt resistance of the studied samples.
Experiments0.0 % Bile Salt
in QSRS
0.1 % Bile Salt
in QSRS
0.2 % Bile Salt
in QSRS
0.3 % Bile Salt
in QSRS
M1 10510021.00 ± 0.9118.59 ± 0.792.85 ± 0.12
M1 10910042.85 ± 1.7729.05 ± 1.225.02 ± 0.23
M3C4 10510059.61 ± 2.8431.05 ± 1.328.05 ± 0.37
M3C4 10910072.74 ± 3.2839.05 ± 1.6815.08 ± 0.75
M3C5 10510078.02 ± 3.2557.02 ± 2.3723.58 ± 1.15
M3C5 10910086.25 ± 4.0769.05 ± 2.7542.05 ± 2.02
Table 6. Hydrophobicity and auto-aggregation rate of the tested samples.
ExperimentsA%, 1 hA%, 6 hA%, 24 hH%,
Hexane
H%,
Chloroform
M1 1053.10 ± 0.148.35 ± 0.369.28 ± 0.4142.5 ± 2.0238.52 ± 1.83
M1 1095.90 ± 0.2511.02 ± 0.5013.25 ± 0.6249.2 ± 2.2939.58 ± 1.92
M3C4 10512.80 ± 0.5628.25 ± 1.1031.02 ± 1.4959.8 ± 2.7842.52 ± 1.77
M3C4 10919.25 ± 0.8131.05 ± 1.3632.25 ± 1.5967.58 ± 2.9349.85 ± 2.08
M3C5 10525.29 ± 1.1449.85 ± 2.3352.35 ± 2.4072.85 ± 3.0570.21 ± 3.18
M3C5 10941.02 ± 1.8659.80 ± 2.8661.25 ± 2.9279.58 ± 3.7378.58 ± 3.62
Publisher’s Note: MDPI stays neutral with regard to jurisdictional claims in published maps and institutional affiliations.

