

Self-Produced Hydrogen Sulfide Improves Ethanol Fermentation by Saccharomyces cerevisiae and Other Yeast Species
 ,
, 
 , and
, and 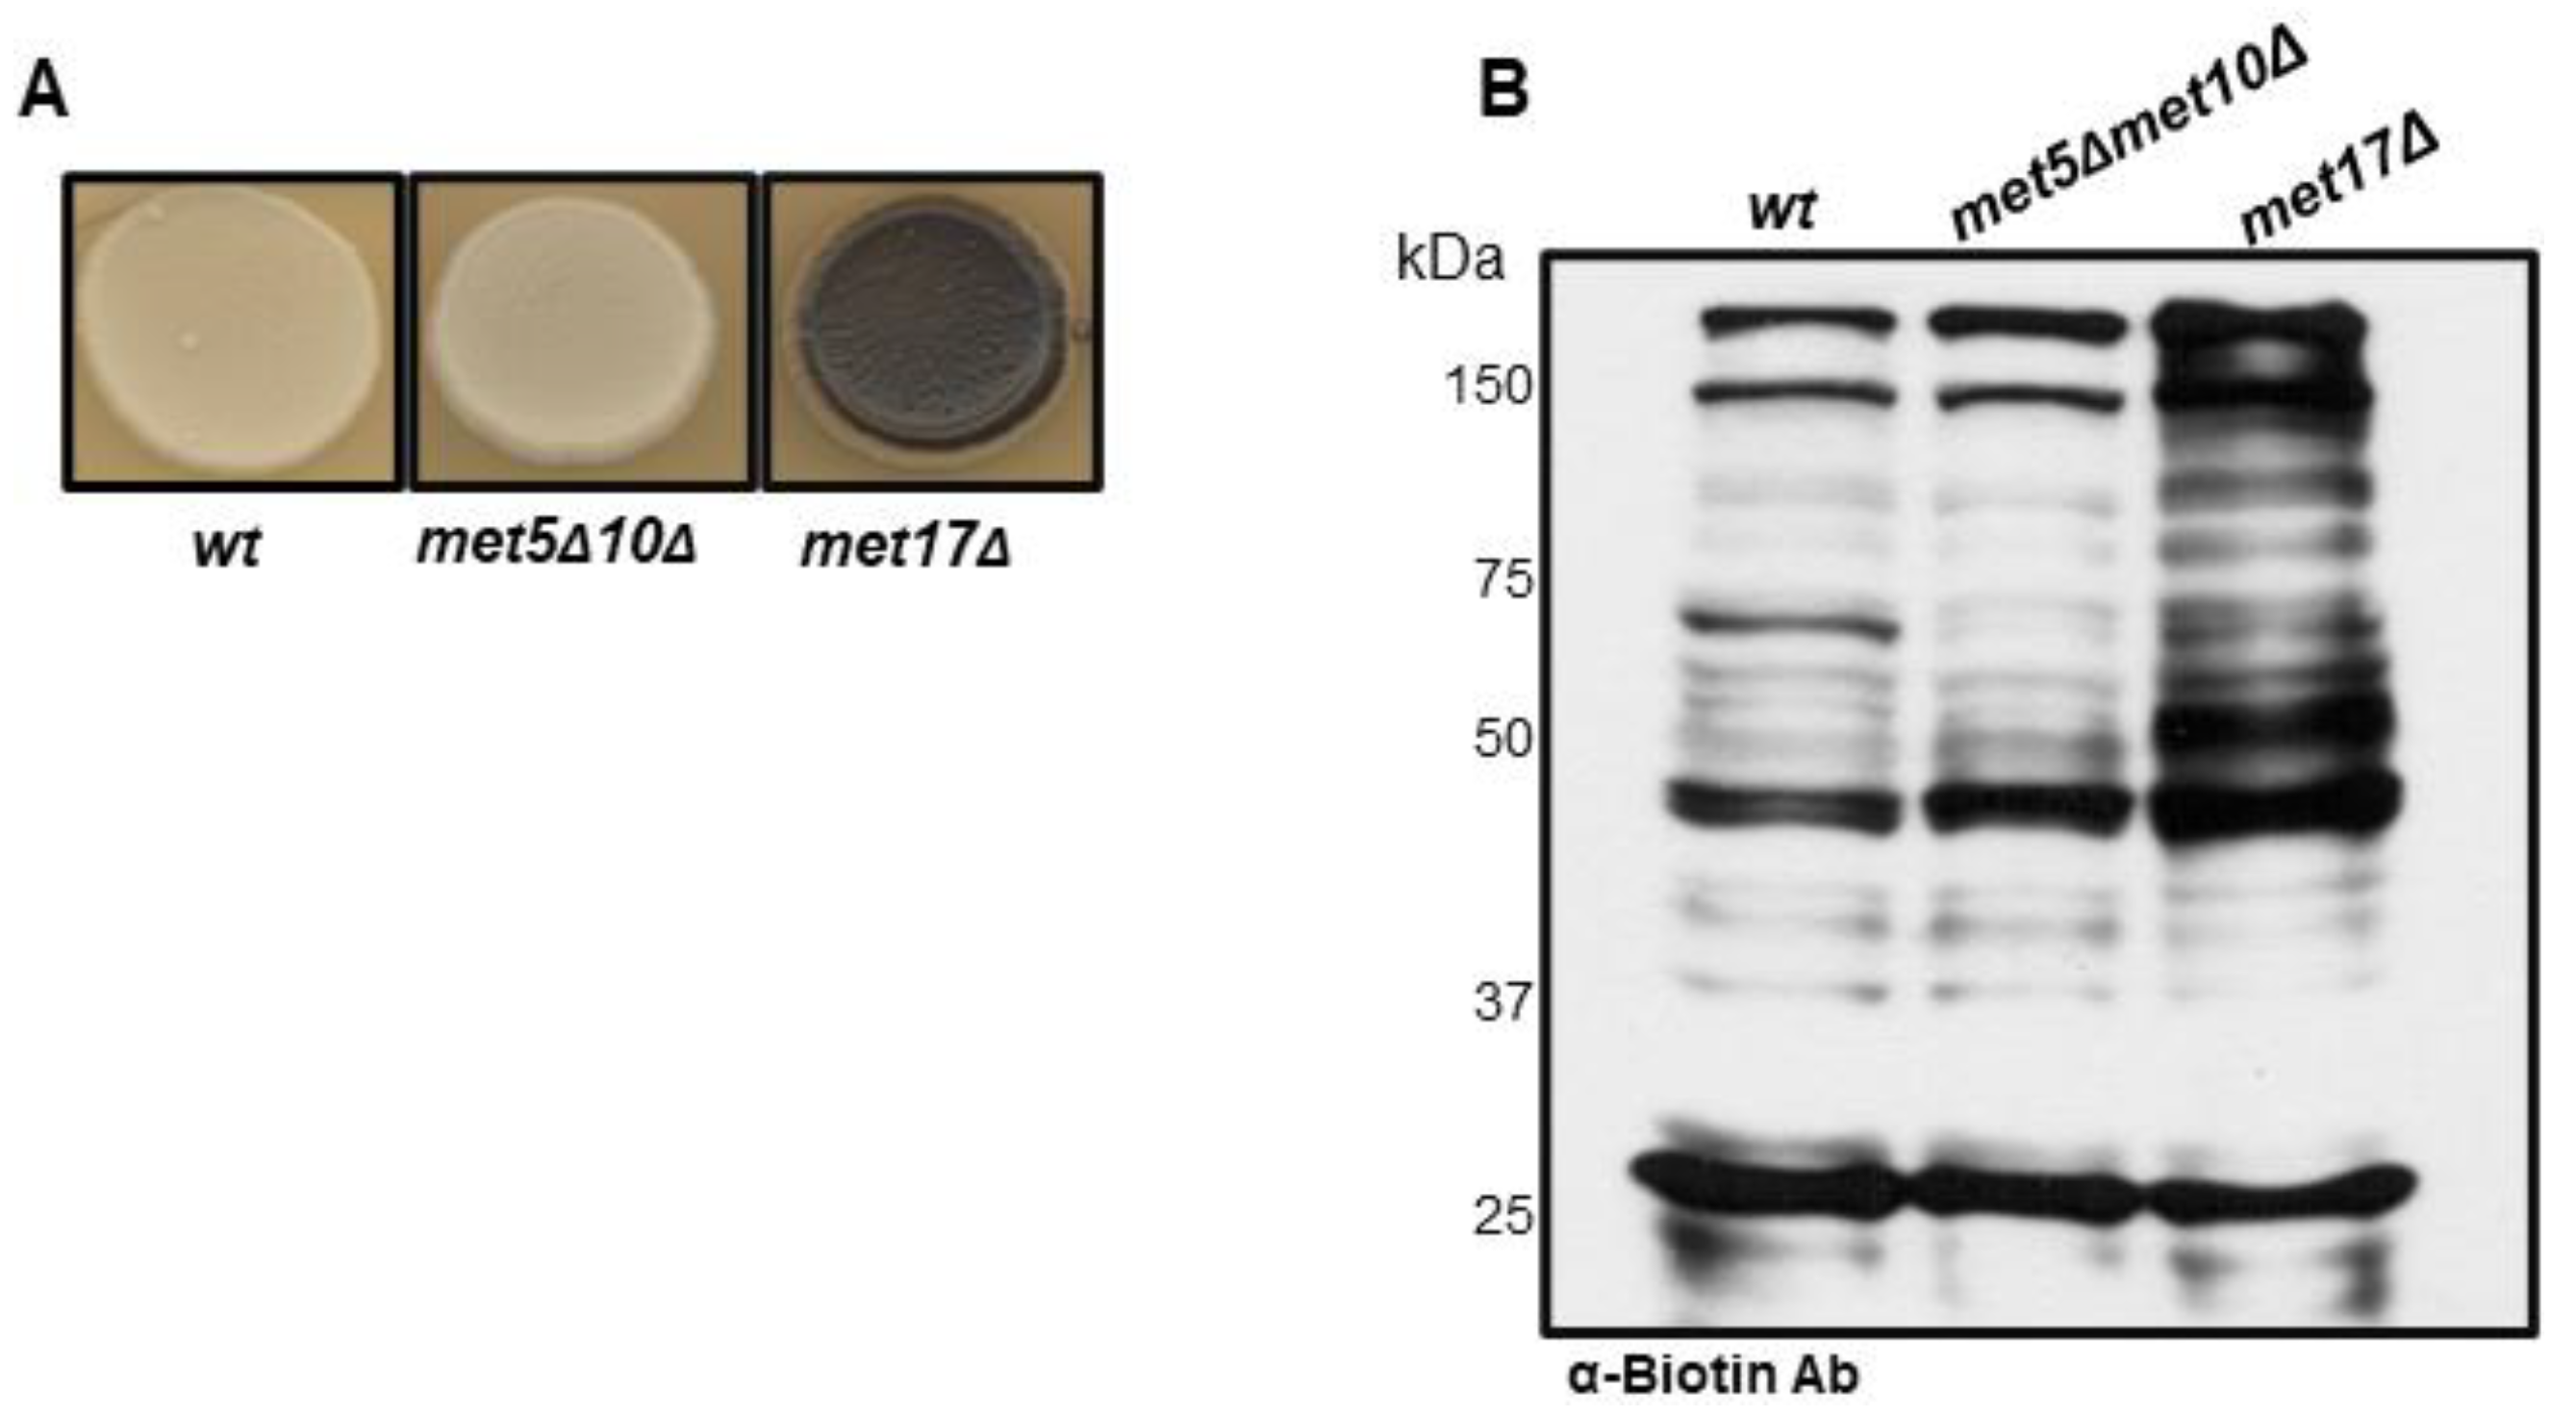
Abstract
:1. Introduction
2. Materials and Methods
2.1. Yeast Strains, Media, and Growth Conditions
2.2. Reagents
2.3. Modified Biotin Switch Assay
2.4. Purification of Biotinylated Proteins
2.5. Immunoblot Analysis
2.6. Quantification of Intracellular ATP Concentration
2.7. Detection of H2S Production
2.8. Fermentation Assays
2.9. Enzyme Activity Assays
2.10. Oxygen Consumption Rate Assay
2.11. Sample Preparation and LC-MALDI-MS/MS
3. Results
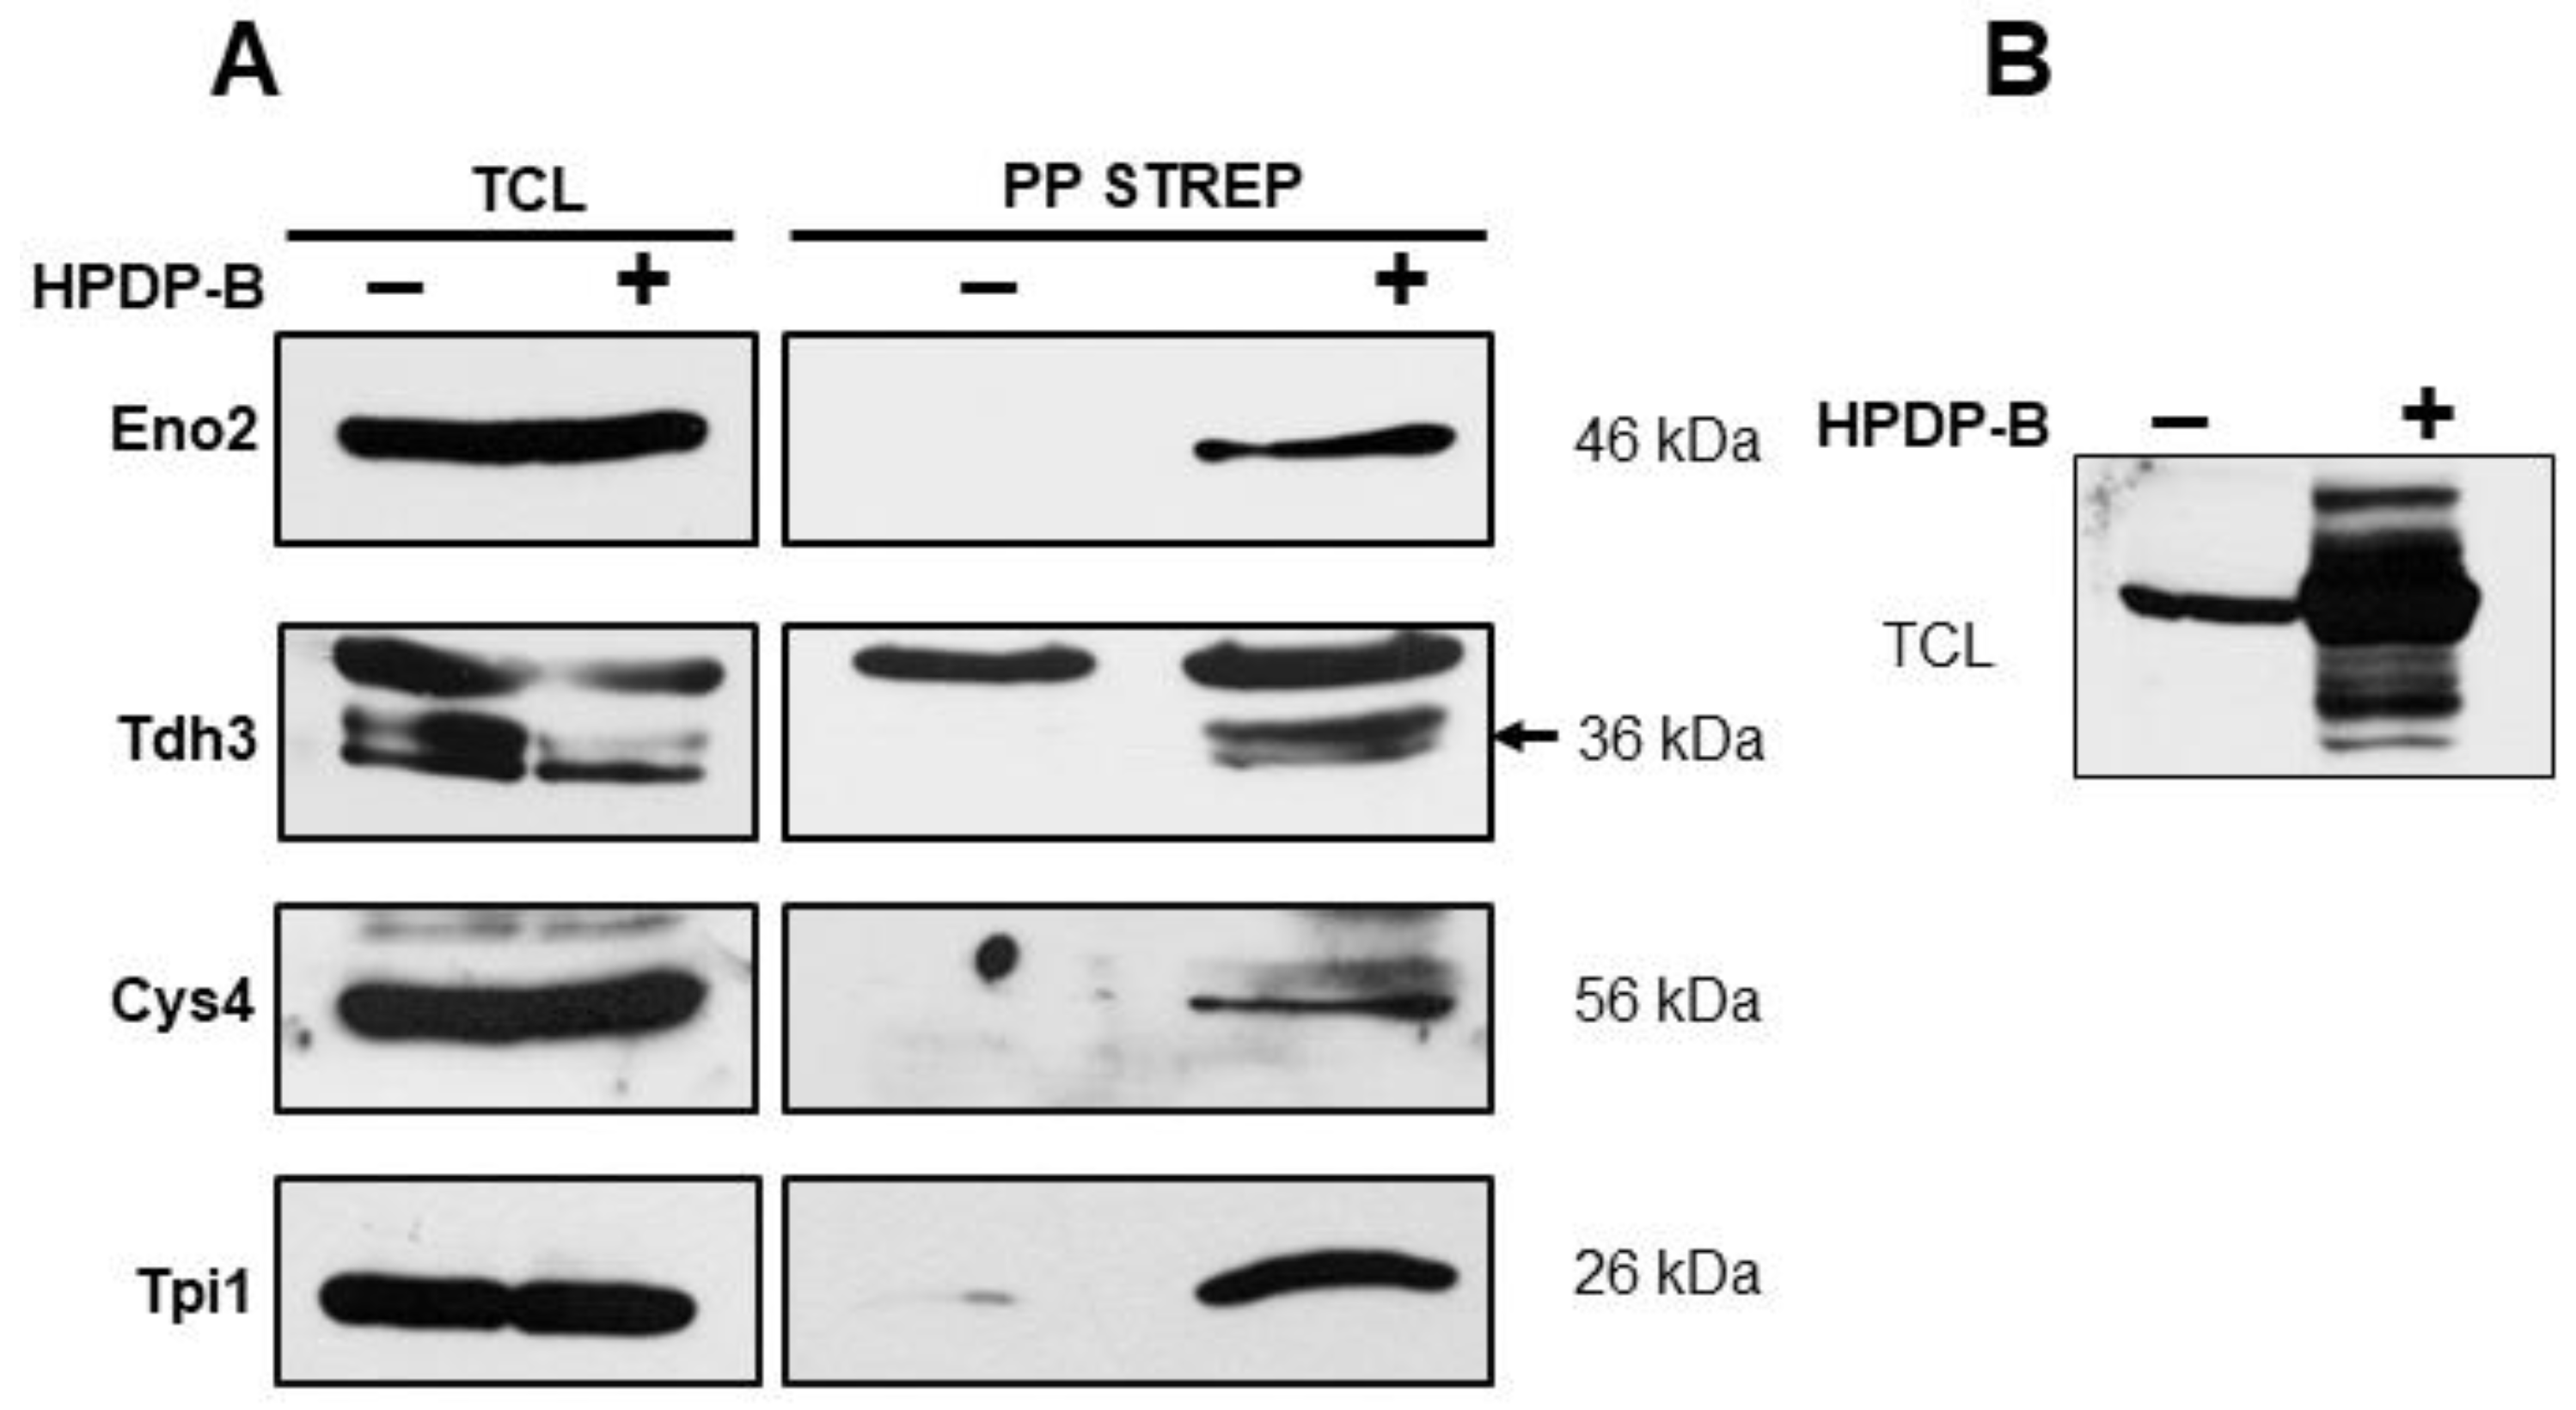
3.1. S-Persulfidation of Yeast Proteins Growing on a Fermentable Carbon Source
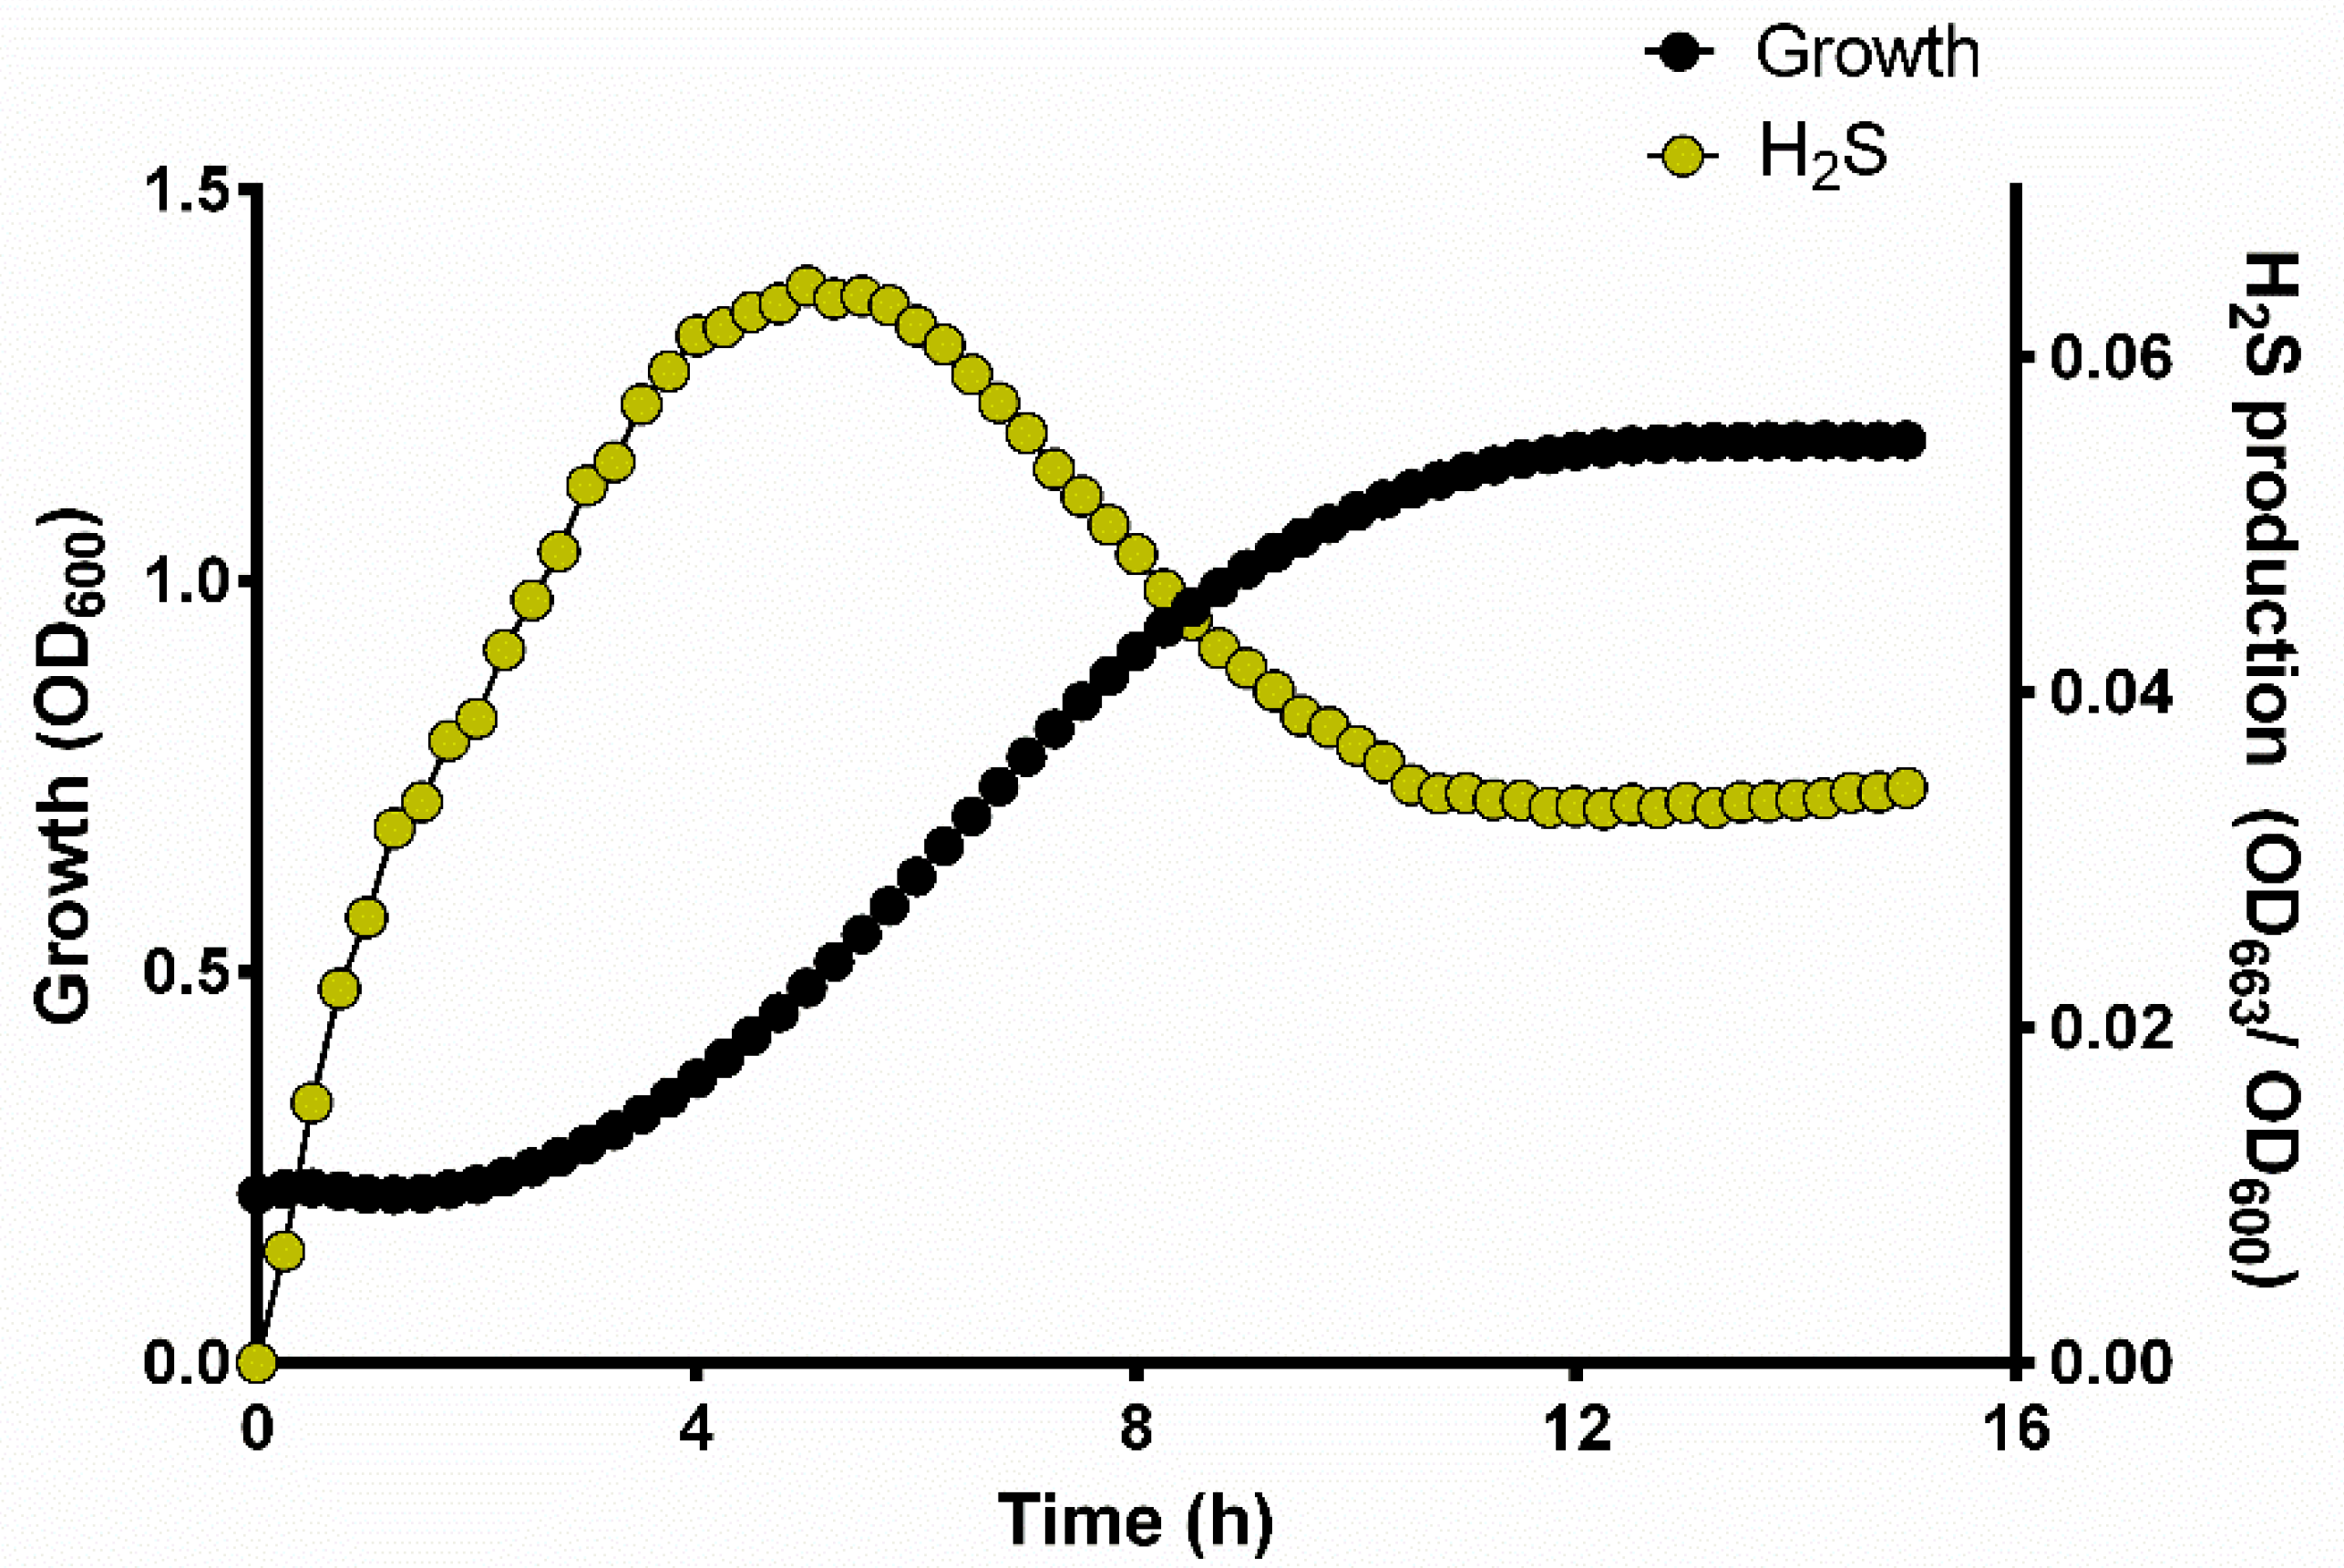
3.2. H2S Production during Yeast Growth
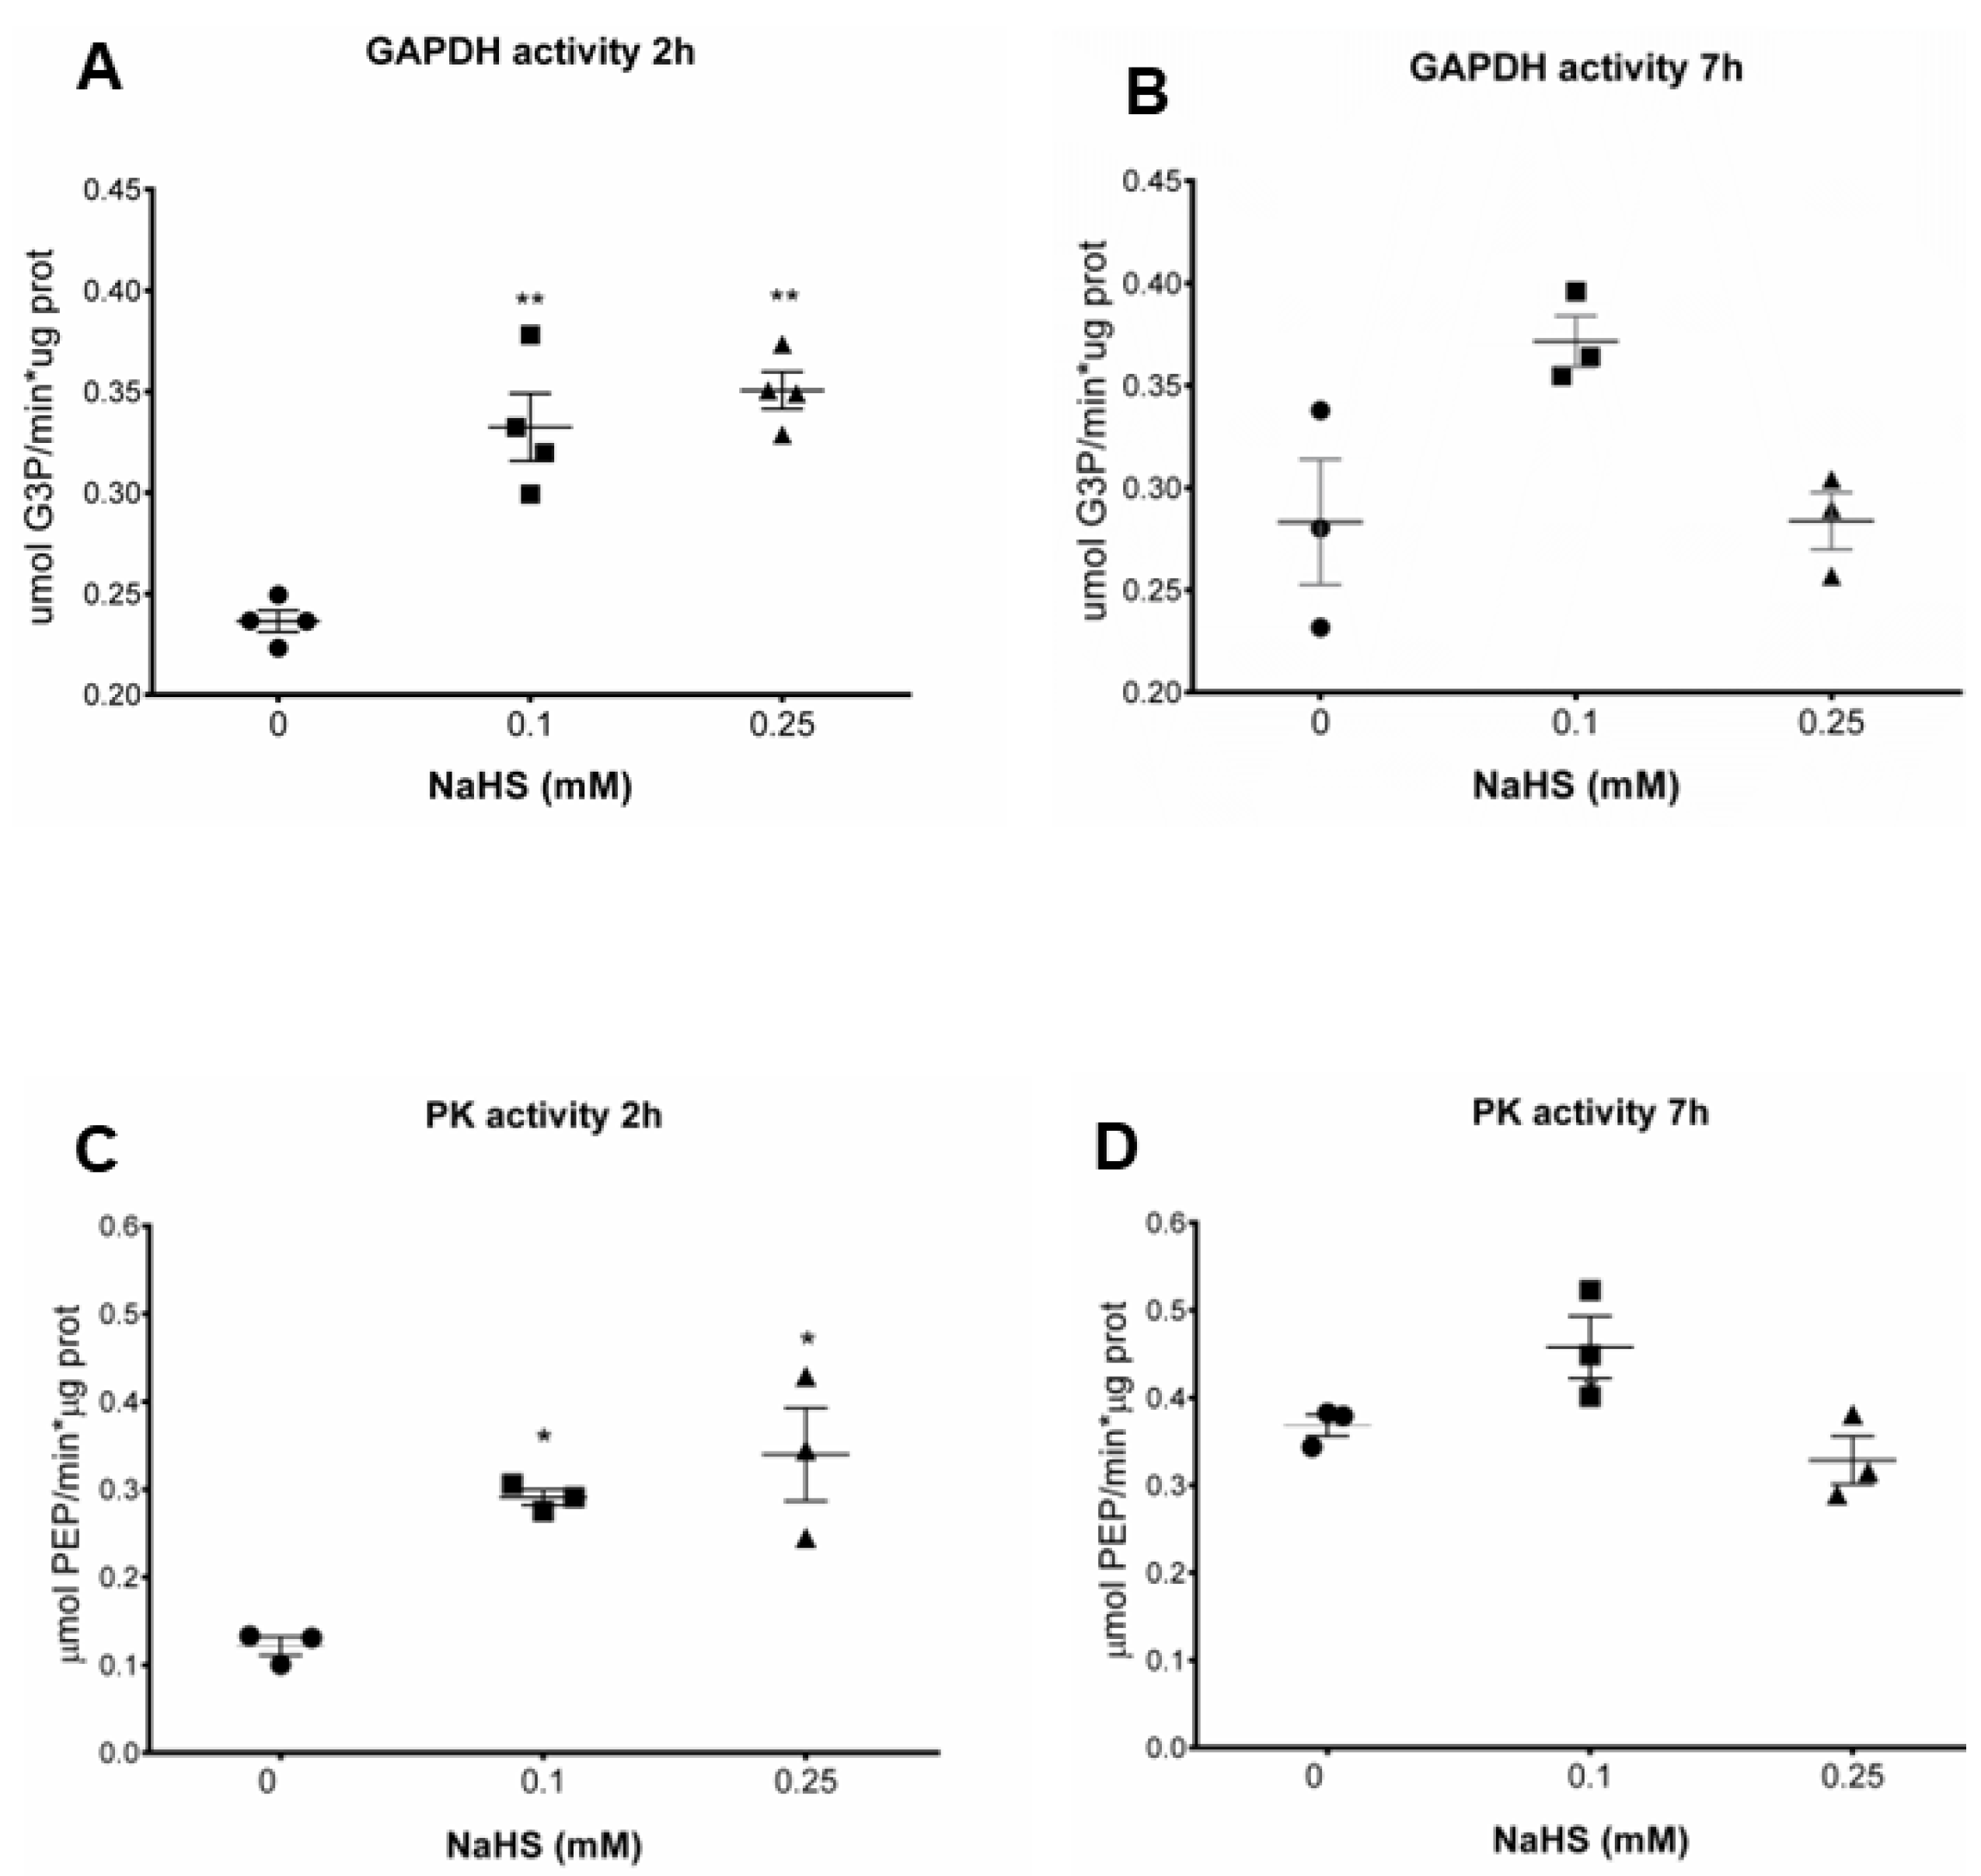
3.3. H2S Increases Glycolytic Enzymes Activities
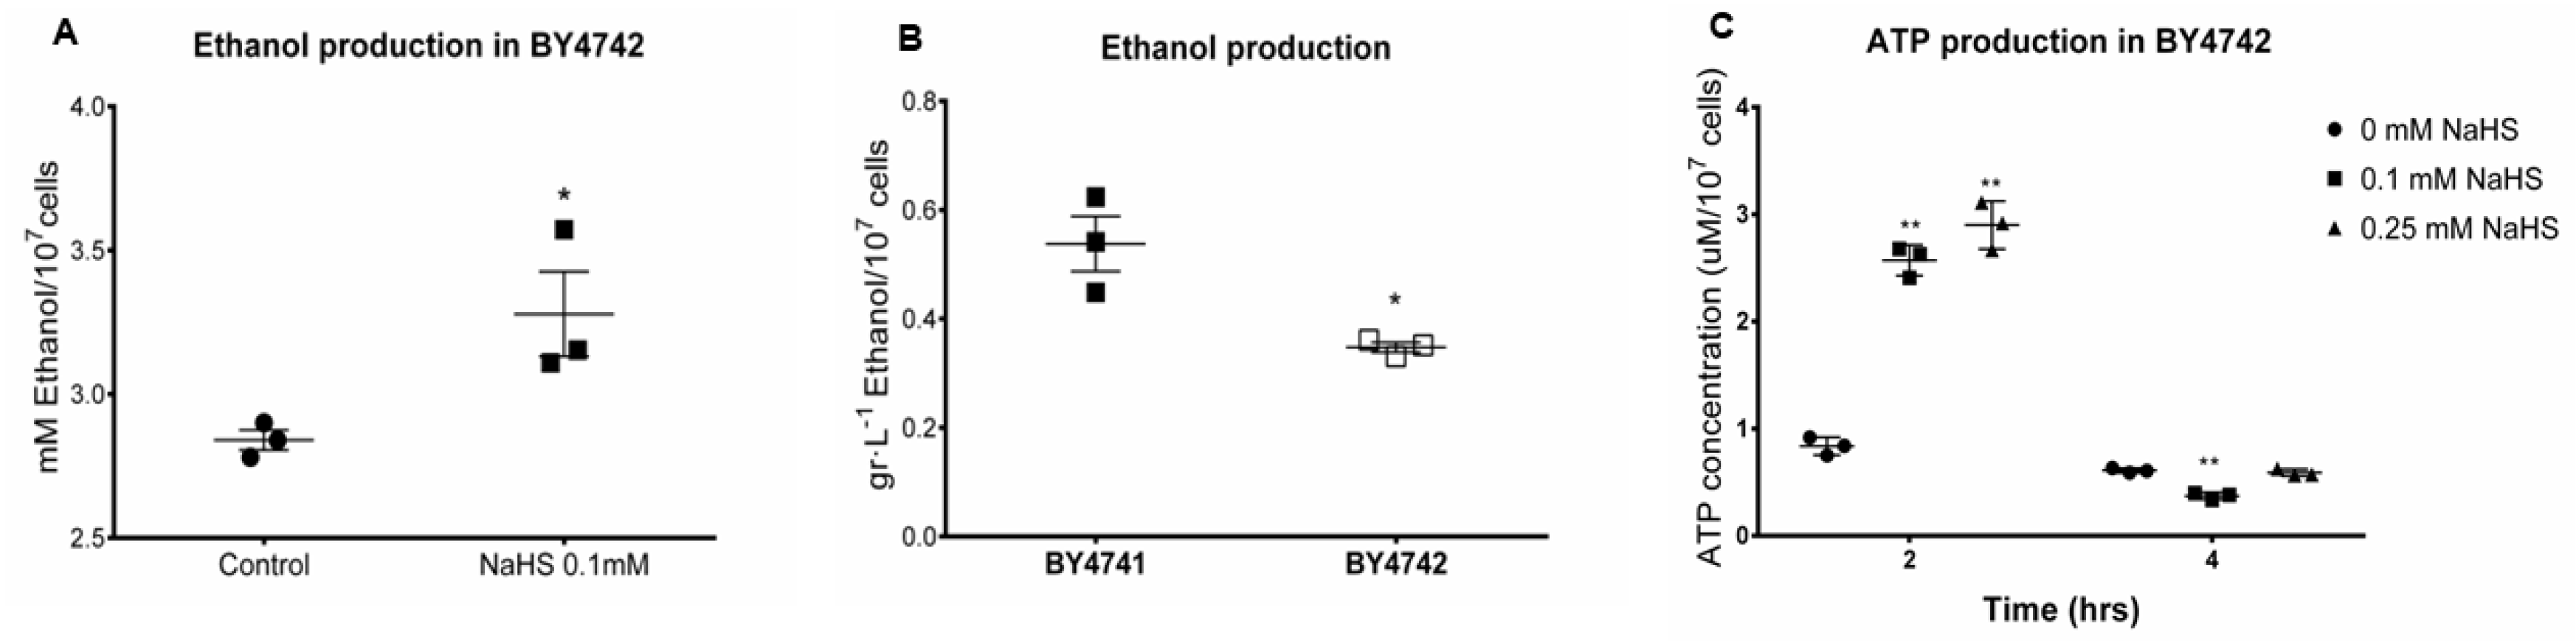
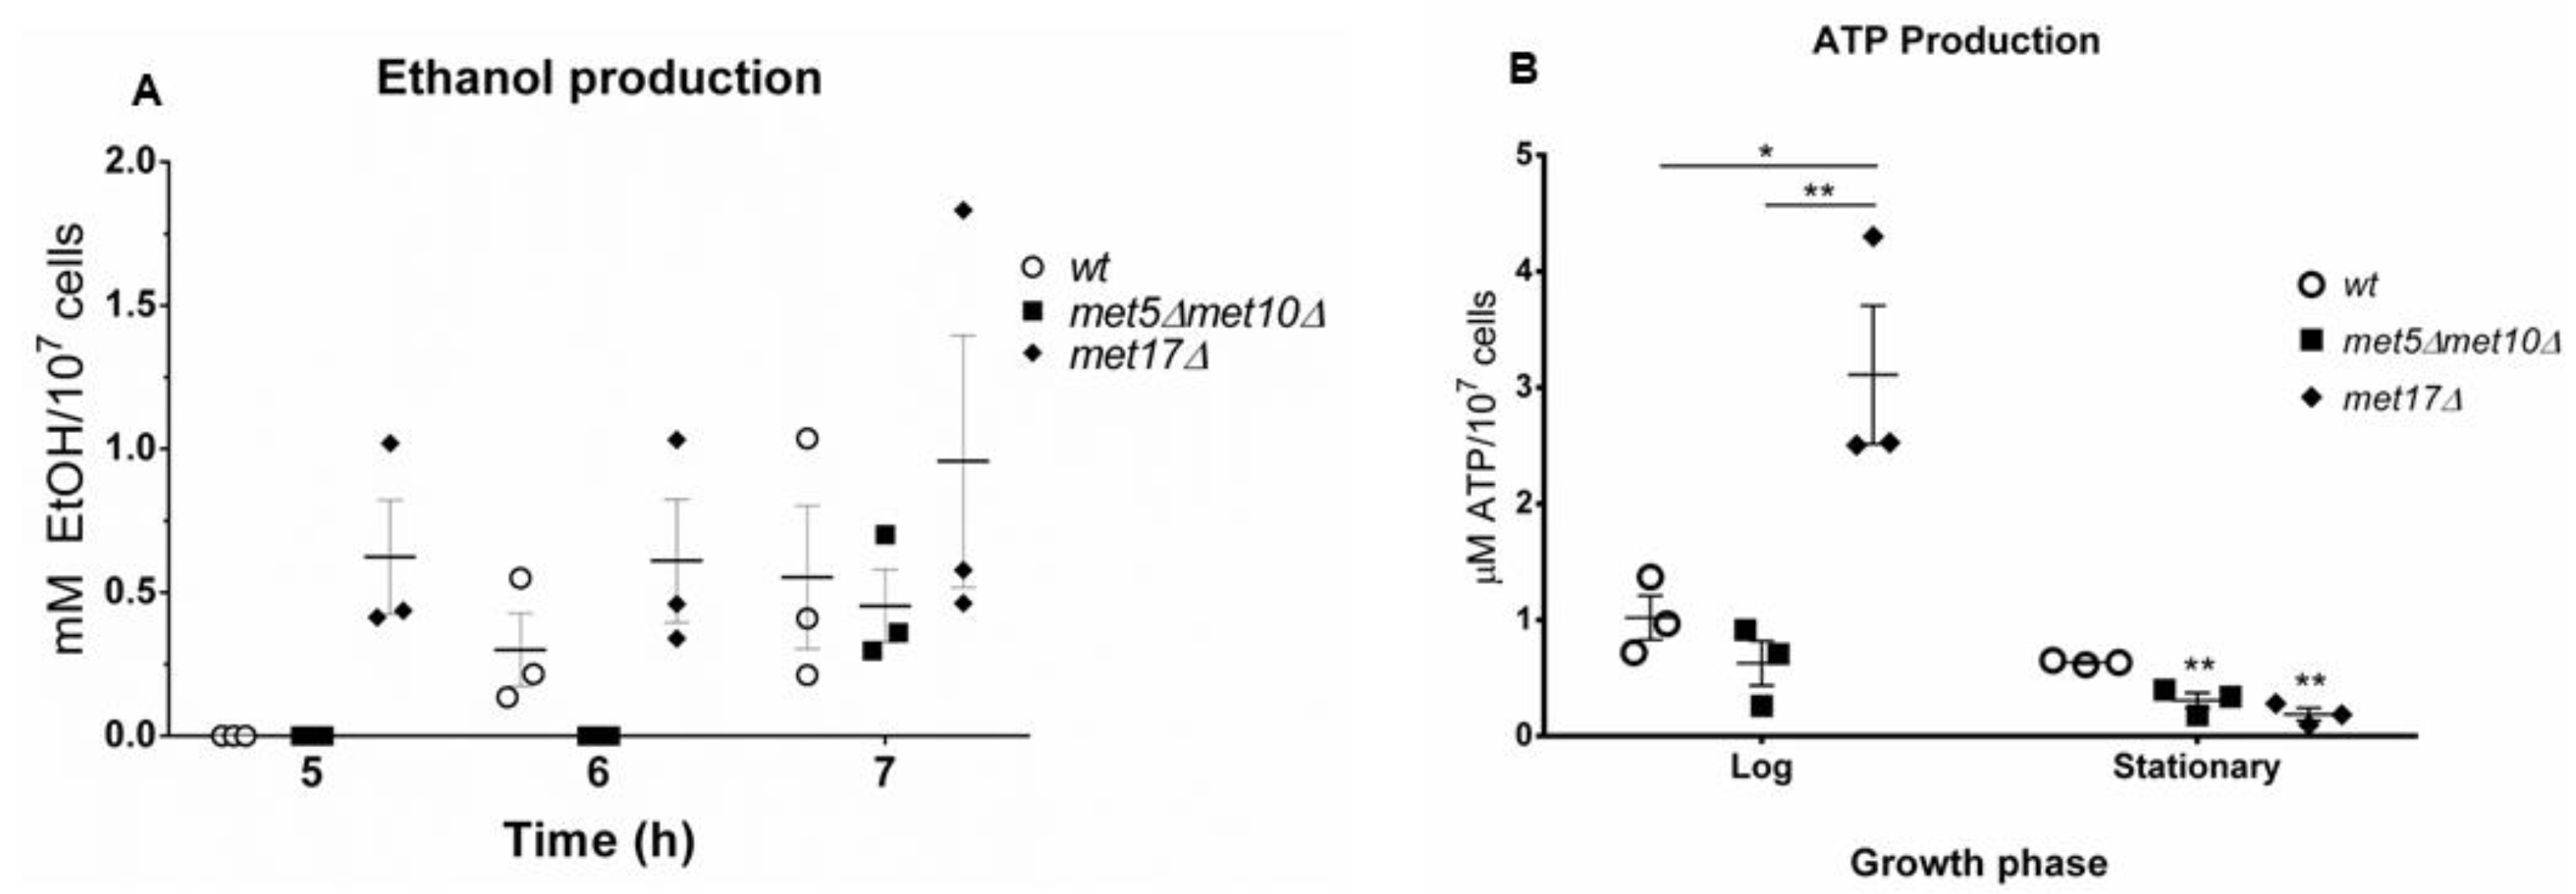
3.4. H2S Stimulates Fermentation
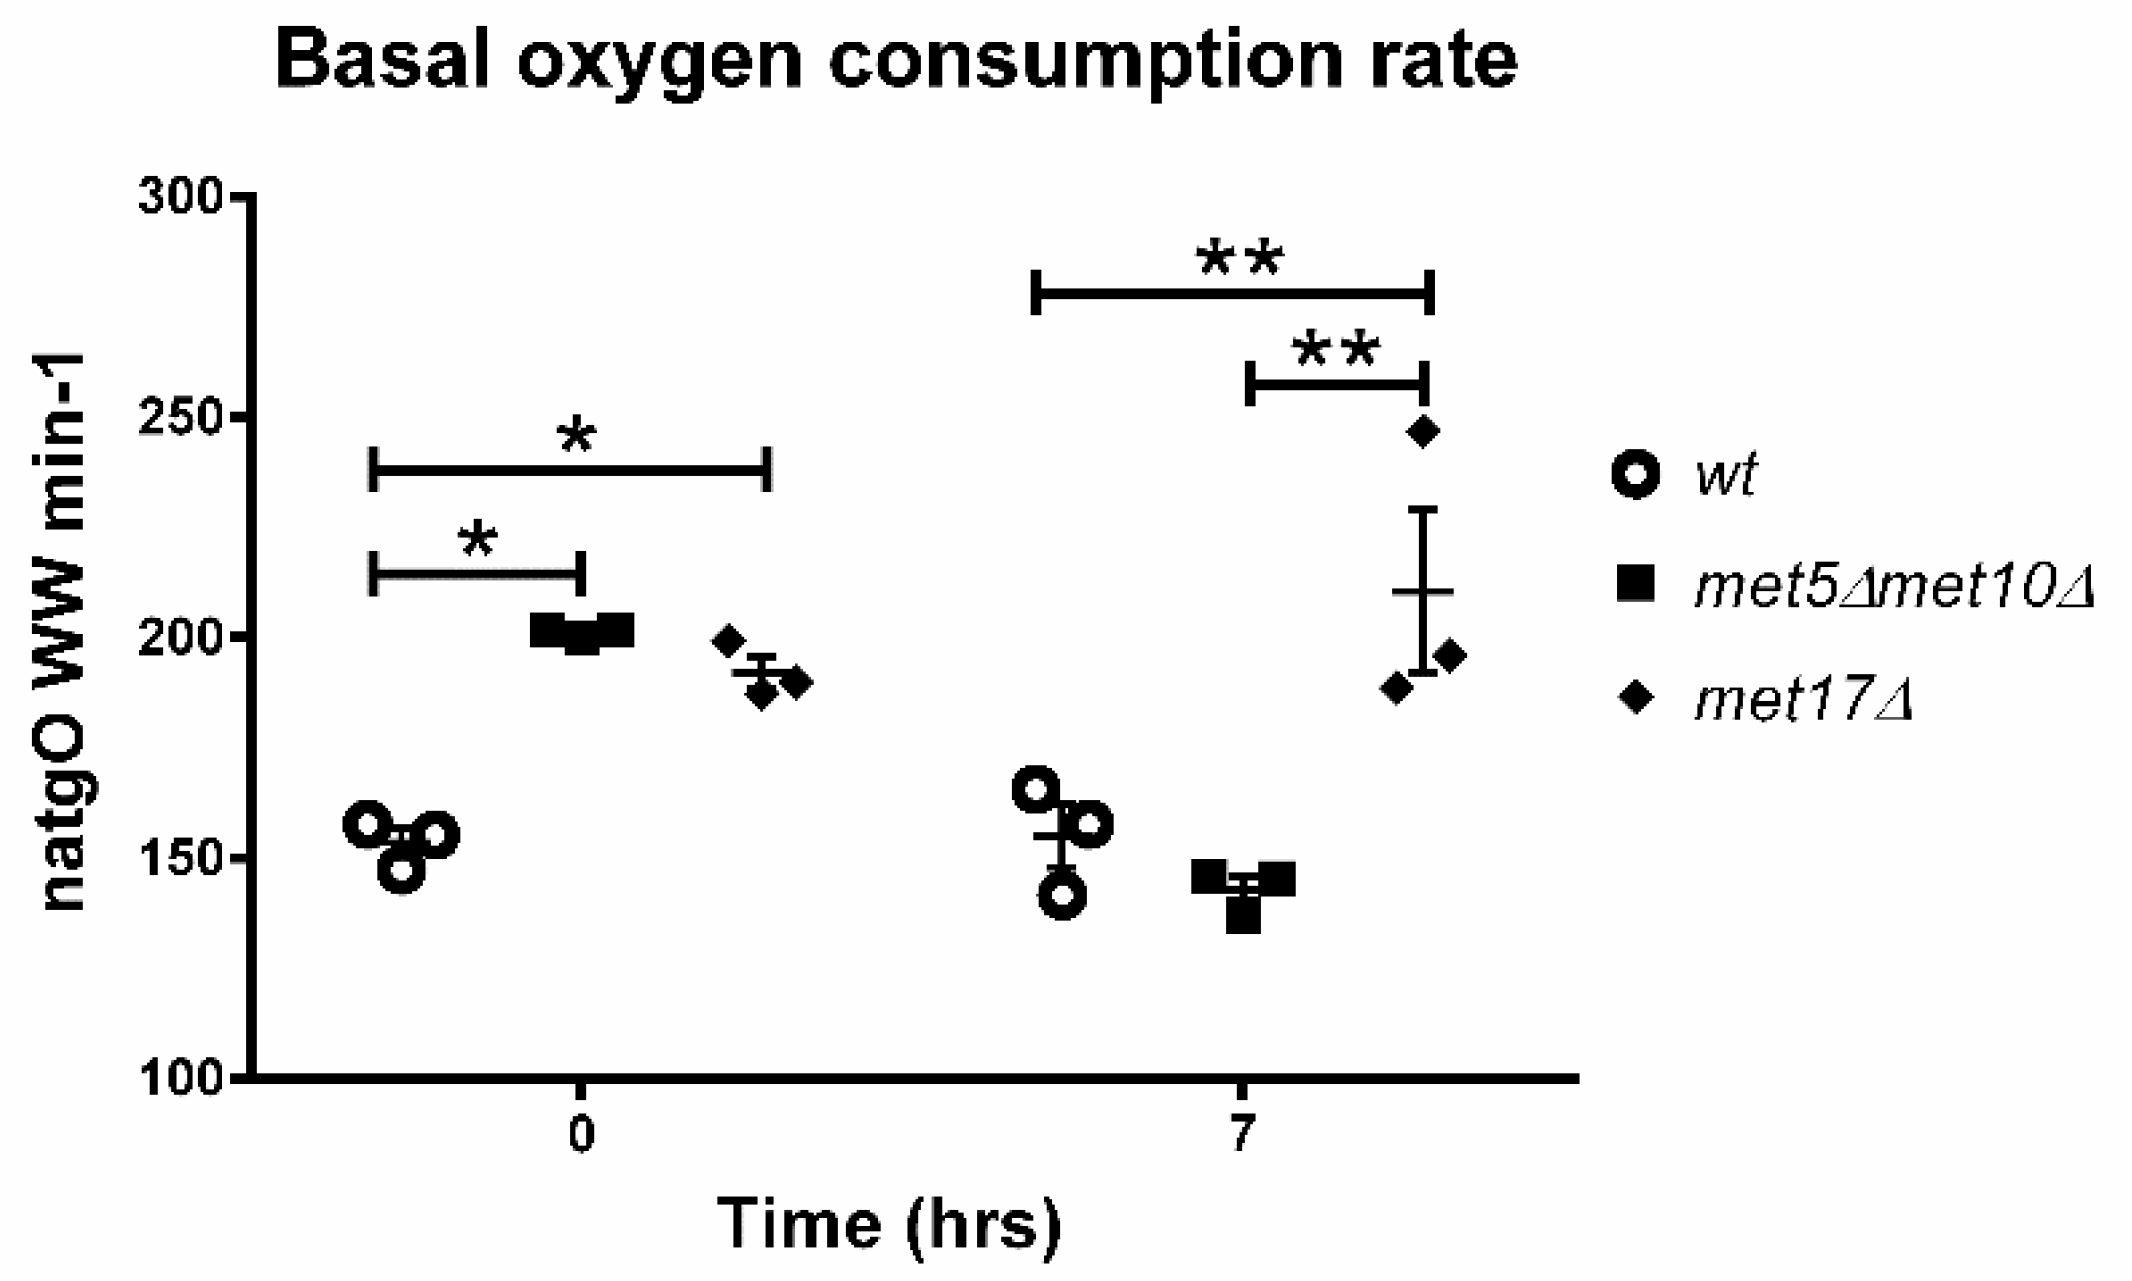
3.5. Endogenous H2S Accumulation Promotes Basal Oxygen Consumption
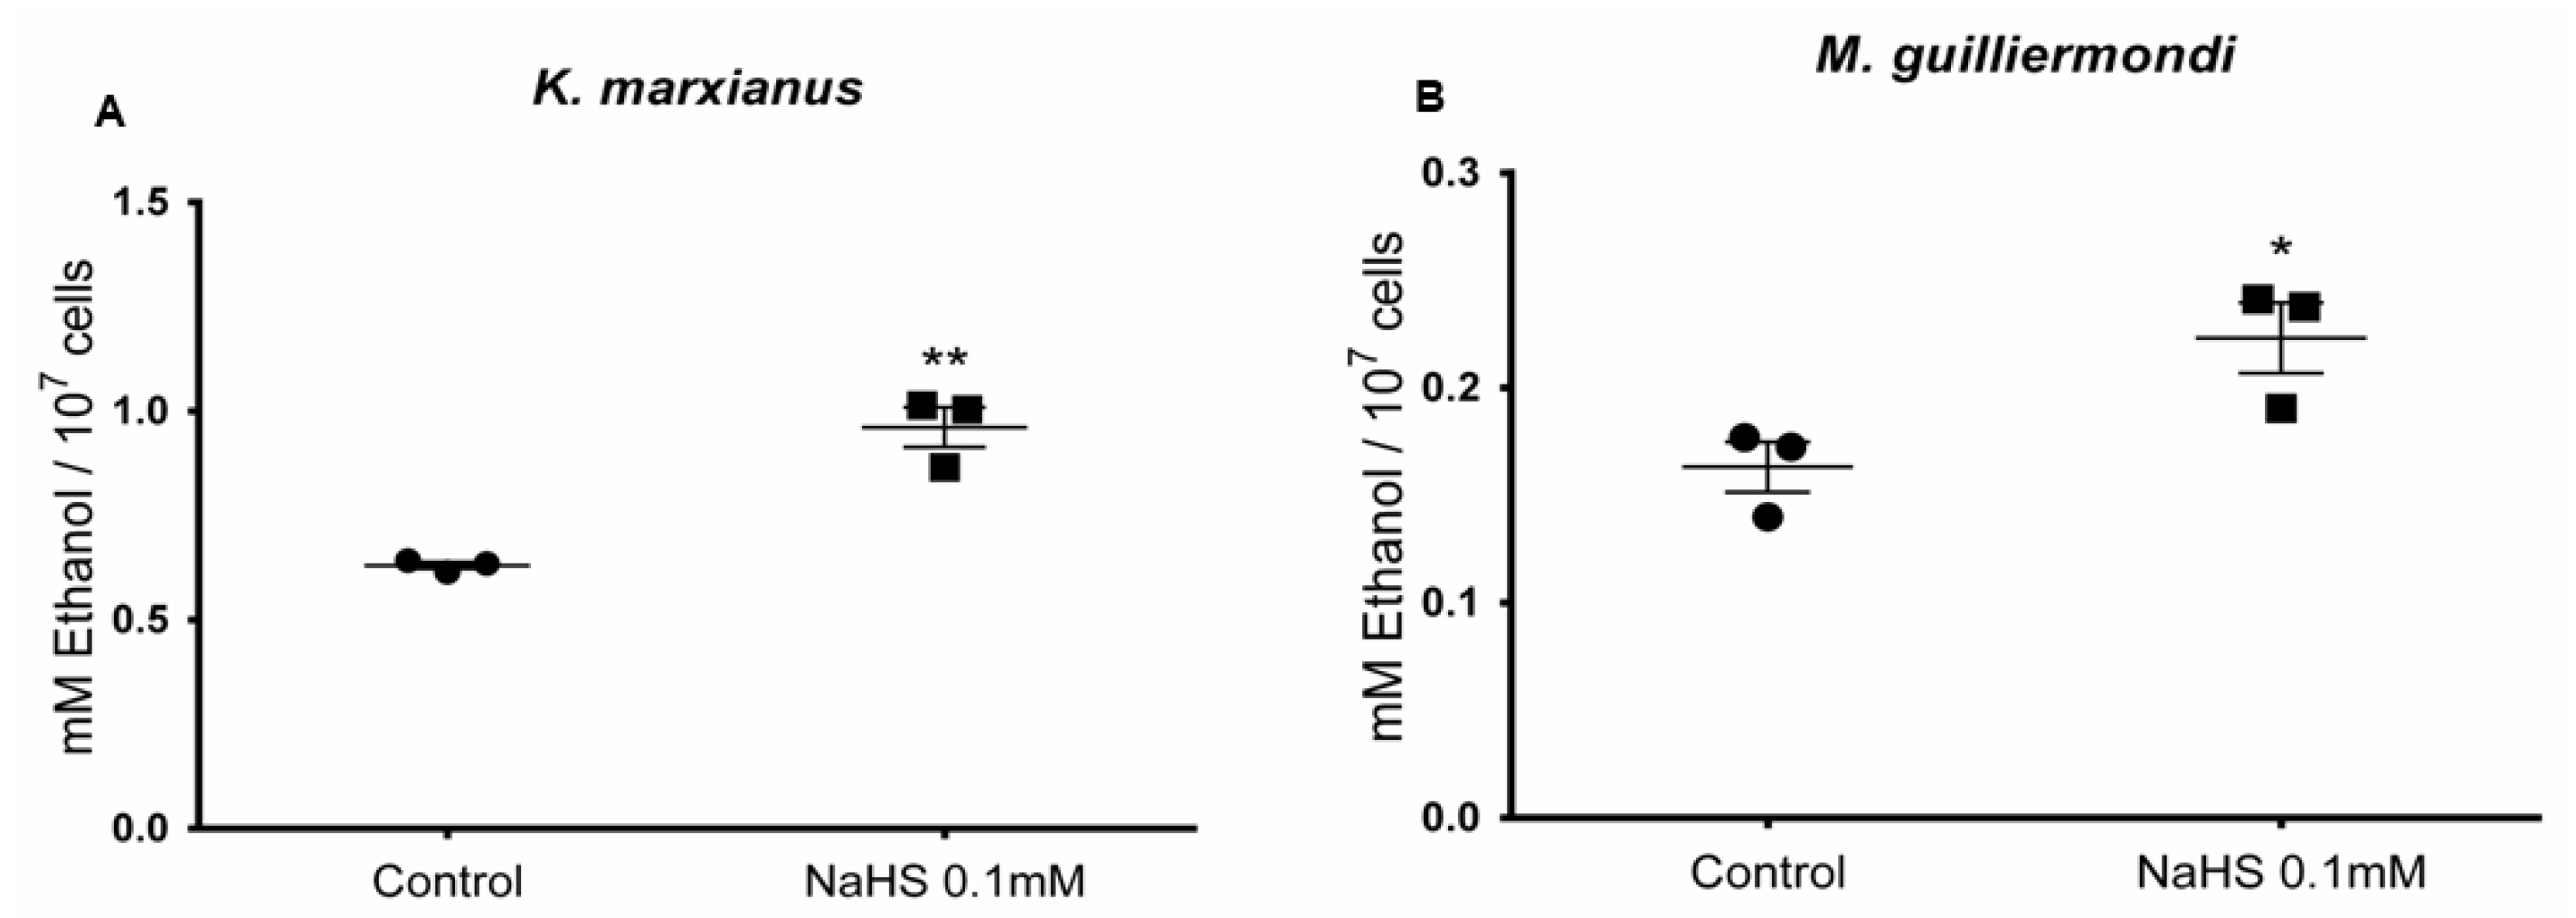
3.6. H2S Stimulates Ethanol Production in Meyerozyma guilliermondii and Kluyveromyces marxianus
4. Discussion
5. Conclusions
Supplementary Materials
Author Contributions
Funding
Institutional Review Board Statement
Informed Consent Statement
Data Availability Statement
Acknowledgments
Conflicts of Interest
References
- Yang, G.; Wu, L.; Jiang, B.; Yang, W.; Qi, J.; Cao, K.; Meng, Q.; Mustafa, A.K.; Mu, W.; Zhang, S.; et al. H2S as a Physiologic Vasorelaxant: Hypertension in Mice with Deletion of Cystathionine γ-Lyase. Science 2008, 322, 587–590. [Google Scholar] [CrossRef] [PubMed] [Green Version]
- Kawabata, A.; Ishiki, T.; Nagasawa, K.; Yoshida, S.; Maeda, Y.; Takahashi, T.; Sekiguchi, F.; Wada, T.; Ichida, S.; Nishikawa, H. Hydrogen sulfide as a Novel Nociceptive Messenger. Pain 2007, 132, 74–81. [Google Scholar] [CrossRef] [PubMed]
- Hine, C.; Harputlugil, E.; Zhang, Y.; Ruckenstuhl, C.; Lee, B.C.; Brace, L.; Longchamp, A.; Treviño-Villarreal, J.H.; Mejia, P.; Ozaki, C.K.; et al. Endogenous Hydrogen Sulfide Production Is Essential for Dietary Restriction Benefits. Cell 2015, 160, 132–144. [Google Scholar] [CrossRef] [PubMed] [Green Version]
- Dooley, F.D.; Nair, S.P.; Ward, P.D. Increased Growth and Germination Success in Plants following Hydrogen Sulfide Administration. PLoS ONE 2013, 8, e62048. [Google Scholar] [CrossRef] [Green Version]
- Shatalin, K.; Shatalina, E.; Mironov, A.; Nudler, E. H2S: A Universal Defense Against Antibiotics in Bacteria. Science 2011, 334, 986–990. [Google Scholar] [CrossRef]
- Jiranek, V.; Langridge, P.; Henschke, P.A. Regulation of Hydrogen Sulfide Liberation in Wine-Producing Saccharomyces cerevisiae Strains by Assimilable Nitrogen. Appl. Environ. Microbiol. 1995, 61, 461–467. [Google Scholar] [CrossRef] [Green Version]
- Huang, C.-W.; Walker, M.E.; Fedrizzi, B.; Gardner, R.C.; Jiranek, V. Hydrogen Sulfide and Its Roles in Saccharomyces cerevisiae in a Winemaking Context. FEMS Yeast Res. 2017, 17, fox058. [Google Scholar] [CrossRef] [Green Version]
- Huang, C.; Roncoroni, M.; Gardner, R.C. MET2 Affects Production of Hydrogen Sulfide during Wine Fermentation. Appl. Microbiol. Biotechnol. 2014, 98, 7125–7135. [Google Scholar] [CrossRef]
- Boudreau, T.F.; Peck, G.; O’Keefe, S.F.; Stewart, A.C. The Interactive Effect of Fungicide Residues and Yeast Assimilable Nitrogen on Fermentation Kinetics and Hydrogen Sulfide Production during Cider Fermentation. J. Sci. Food Agric. 2016, 97, 693–704. [Google Scholar] [CrossRef] [Green Version]
- Wang, C.; Liu, M.; Li, Y.; Zhang, Y.; Yao, M.; Qin, Y.; Liu, Y. Hydrogen Sulfide Synthesis in Native Saccharomyces cerevisiae Strains during Alcoholic Fermentations. Food Microbiol. 2018, 70, 206–213. [Google Scholar] [CrossRef]
- Sun, G.L.; Reynolds, E.E.; Belcher, A.M. Using Yeast to Sustainably Remediate and Extract Heavy Metals from Waste Waters. Nat. Sustain. 2020, 3, 303–311. [Google Scholar] [CrossRef]
- Sohn, H.Y.; Murray, D.B.; Kuriyama, H. Ultradian Oscillation of Saccharomyces cerevisiae during Aerobic Continuous Culture: Hydrogen Sulphide Mediates Population Synchrony. Yeast 2000, 16, 1185–1190. [Google Scholar] [CrossRef]
- Mendoza-Cózatl, D.; Loza-Tavera, H.; Hernández-Navarro, A.; Moreno-Sanchez, R. Sulfur Assimilation and Glutathione Metabolism Under Cadmium Stress in Yeast, Protists and Plants. FEMS Microbiol. Rev. 2005, 29, 653–671. [Google Scholar] [CrossRef] [PubMed] [Green Version]
- Oka, K.; Hayashi, T.; Matsumoto, N.; Yanase, H. Decrease in Hydrogen Sulfide Content during the Final Stage of Beer Fermentation Due to Involvement of Yeast and Not Carbon Dioxide Gas Purging. J. Biosci. Bioeng. 2008, 106, 253–257. [Google Scholar] [CrossRef] [PubMed]
- Huang, C.-W.; Walker, M.E.; Fedrizzi, B.; Roncoroni, M.; Gardner, R.C.; Jiranek, V. The yeast TUM1 Affects Production of Hydrogen Sulfide from Cysteine Treatment during Fermentation. FEMS Yeast Res. 2016, 16, fow100. [Google Scholar] [CrossRef] [PubMed] [Green Version]
- D’Andrea, R.; Surdin-Kerjan, Y.; Pure, G.; Cherest, H. Molecular Genetics of Met17 and Met25 Mutants of Saccharomyces cerevisiae: Intragenic Complementation between Mutations of a Single Structural Gene. Mol. Gen. Genet. 1987, 207, 165–170. [Google Scholar] [CrossRef] [PubMed]
- Mustafa, A.K.; Gadalla, M.M.; Sen, N.; Kim, S.; Mu, W.; Gazi, S.K.; Barrow, R.K.; Yang, G.; Wang, R.; Snyder, S.H. H2S Signals Through Protein S-Sulfhydration. Sci. Signal. 2009, 2, ra72. [Google Scholar] [CrossRef] [PubMed] [Green Version]
- Krishnan, N.; Fu, C.; Pappin, D.J.; Tonks, N.K. H2S-Induced Sulfhydration of the Phosphatase PTP1B and Its Role in the Endoplasmic Reticulum Stress Response. Sci. Signal. 2011, 4, ra86. [Google Scholar] [CrossRef] [PubMed] [Green Version]
- Estrada-Ávila, A.K.; González-Hernández, J.C.; Calahorra, M.; Sánchez, N.S.; Peña, A. Xylose and yeasts: A Story Beyond Xylitol Production. Biochim. Biophys. Acta (BBA) Gen. Subj. 2022, 1866, 130154. [Google Scholar] [CrossRef]
- Bergkessel, M.; Guthrie, C.; Abelson, J. Yeast-Gene Replacement Using PCR Products. Methods Enzymol 2013, 533, 43–55. [Google Scholar] [CrossRef]
- Paul, B.D.; Snyder, S.H. Protein Sulfhydration. Methods Enzymol. 2015, 555, 79–90. [Google Scholar] [CrossRef]
- Cost, G.J.; Boeke, J.D. A useful Colony Colour Phenotype Associated with the Yeast Selectable/Counter-Selectable Marker MET15. Yeast 1996, 12, 939–941. [Google Scholar] [CrossRef]
- Choi, K.-M.; Kim, S.; Kim, S.; Lee, H.M.; Kaya, A.; Chun, B.-H.; Lee, Y.K.; Park, T.-S.; Lee, C.-K.; Eyun, S.-I.; et al. Sulfate Assimilation Regulates Hydrogen Sulfide Production Independent of Lifespan and Reactive Oxygen Species Under Methionine Restriction Condition in Yeast. Aging 2019, 11, 4254–4273. [Google Scholar] [CrossRef] [PubMed]
- Peña, A.; Sánchez, N.S.; González-López, O.; Calahorra, M. Mechanisms Involved in the Inhibition of Glycolysis by Cyanide and Antimycin a in Candida albicans and Its Reversal by Hydrogen Peroxide. A Common Feature in Candida species. FEMS Yeast Res. 2015, 15, fov083. [Google Scholar] [CrossRef] [PubMed] [Green Version]
- Sakai, H.; Suzuki, K.; Imahori, K. Purification and Properties of Pyruvate Kinase from Bacillus Stearothermophilus. J. Biochem. 1986, 99, 1157–1167. [Google Scholar] [CrossRef]
- Bergmeyer, H.V.; Gawhn, K.; Grassel, M. Alcohol Dehydrogenase. In Methods of Enzymatic Analysis; Academic Press: New York, NY, USA, 1974; Volume 1, pp. 428–429. [Google Scholar]
- Marino, S.M.; Li, Y.; Fomenko, D.E.; Agisheva, N.; Cerny, R.L.; Gladyshev, V.N. Characterization of Surface-Exposed Reactive Cysteine Residues in Saccharomyces cerevisiae. Biochemistry 2010, 49, 7709–7721. [Google Scholar] [CrossRef] [Green Version]
- Alcock, L.J.; Perkins, M.V.; Chalker, J.M. Chemical Methods for Mapping Cysteine Oxidation. Chem. Soc. Rev. 2017, 47, 231–268. [Google Scholar] [CrossRef] [Green Version]
- Fu, L.; Liu, K.; He, J.; Tian, C.; Yu, X.; Yang, J. Direct Proteomic Mapping of Cysteine Persulfidation. Antioxid. Redox Signal. 2020, 33, 1061–1076. [Google Scholar] [CrossRef]
- Dashko, S.; Zhou, N.; Compagno, C.; Piškur, J. Why, When, And How Did Yeast Evolve Alcoholic Fermentation? FEMS Yeast Res. 2014, 14, 826–832. [Google Scholar] [CrossRef] [Green Version]
- Marcet-Houben, M.; Gabaldón, T. Beyond the Whole-Genome Duplication: Phylogenetic Evidence for an Ancient Interspecies Hybridization in the Baker’s Yeast Lineage. PLoS Biol. 2015, 13, e1002220. [Google Scholar] [CrossRef] [Green Version]
- Shen, X.-X.; Opulente, D.A.; Kominek, J.; Zhou, X.; Steenwyk, J.L.; Buh, K.V.; Haase, M.A.; Wisecaver, J.H.; Wang, M.; Doering, D.T.; et al. Tempo and Mode of Genome Evolution in the Budding Yeast Subphylum. Cell 2018, 175, 1533–1545.e20. [Google Scholar] [CrossRef] [PubMed] [Green Version]
- Fabricio, M.F.; Valente, P.; Ayub, M.A.Z. Oleaginous Yeast Meyerozyma guilliermondii Shows Fermentative Metabolism of Sugars in the Biosynthesis of Ethanol and Converts Raw Glycerol and Cheese Whey Permeate into Polyunsaturated Fatty Acids. Biotechnol. Prog. 2019, 35, e2895. [Google Scholar] [CrossRef] [PubMed]
- Gao, X.-H.; Krokowski, D.; Guan, B.-J.; Bederman, I.R.; Majumder, M.; Parisien, M.; Diatchenko, L.; Kabil, O.; Willard, B.; Banerjee, R.; et al. Quantitative H2S-Mediated Protein Sulfhydration Reveals Metabolic Reprogramming during the Integrated Stress Response. eLife 2015, 4, e10067. [Google Scholar] [CrossRef] [PubMed]
- Aroca, Á.; Serna, A.; Gotor, C.; Romero, L.C. S-Sulfhydration: A Cysteine Posttranslational Modification in Plant Systems. Plant Physiol. 2015, 168, 334–342. [Google Scholar] [CrossRef] [Green Version]
- Aroca, A.; Benito, J.M.; Gotor, C.; Romero, L.C. Persulfidation Proteome Reveals the Regulation of Protein Function by Hydrogen Sulfide in Diverse Biological Processes in Arabidopsis. J. Exp. Bot. 2017, 68, 4915–4927. [Google Scholar] [CrossRef] [Green Version]
- Peng, H.; Zhang, Y.; Palmer, L.D.; Kehl-Fie, T.E.; Skaar, E.P.; Trinidad, J.C.; Giedroc, D.P. Hydrogen Sulfide and Reactive Sulfur Species Impact Proteome S-Sulfhydration and Global Virulence Regulation in Staphylococcus aureus. ACS Infect. Dis. 2017, 3, 744–755. [Google Scholar] [CrossRef] [Green Version]
- Aroca, A.; Schneider, M.; Scheibe, R.; Gotor, C.; Romero, L.C. Hydrogen Sulfide Regulates the Cytosolic/Nuclear Partitioning of Glyceraldehyde-3-Phosphate Dehydrogenase by Enhancing its Nuclear Localization. Plant Cell Physiol. 2017, 58, 983–992. [Google Scholar] [CrossRef] [Green Version]
- Mitchell, A.R.; Yuan, M.; Morgan, H.P.; McNae, I.W.; Blackburn, E.A.; Le Bihan, T.; Homem, R.A.; Yu, M.; Loake, G.J.; Michels, P.A.; et al. Redox Regulation of Pyruvate Kinase M2 by Cysteine Oxidation and S-Nitrosation. Biochem. J. 2018, 475, 3275–3291. [Google Scholar] [CrossRef] [Green Version]
- Ford, A.; Denicourt, C.; Morano, K.A. Thiol Stress–Dependent Aggregation of the Glycolytic Enzyme Triose Phosphate Isomerase in Yeast and Human Cells. Mol. Biol. Cell 2019, 30, 554–565. [Google Scholar] [CrossRef]
- Li, L.; Whiteman, M.; Guan, Y.Y.; Neo, K.L.; Cheng, Y.; Lee, S.W.; Zhao, Y.; Baskar, R.; Tan, C.-H.; Moore, P.K. Characterization of a Novel, Water-Soluble Hydrogen Sulfide–Releasing Molecule (GYY4137) New Insights into the Biology of Hydrogen Sulfide. Circulation 2008, 117, 2351–2360. [Google Scholar] [CrossRef] [Green Version]
- Ju, Y.; Wu, L.; Yang, G. Thioredoxin 1 Regulation of Protein S Desulfhydration. Biochem. Biophys. Rep. 2015, 5, 27–34. [Google Scholar] [CrossRef] [Green Version]
- Wedmann, R.; Onderka, C.; Wei, S.; Szijártó, I.A.; Miljkovic, J.L.; Mitrovic, A.; Lange, M.; Savitsky, S.; Yadav, P.K.; Torregrossa, R.; et al. Improved Tag-Switch Method Reveals That Thioredoxin Acts as Depersulfidase and Controls the Intracellular Levels of Protein Persulfidation. Chem. Sci. 2016, 7, 3414–3426. [Google Scholar] [CrossRef] [Green Version]
- Paul, B.D.; Filipovic, M.R. Editorial: Molecular Mechanisms of Thiol-Based Redox Homeostasis and Signaling in the Brain. Front. Aging Neurosci. 2021, 13, 771877. [Google Scholar] [CrossRef]
- Campbell, S.; Shulman, R.G. High-Resolution NMR Studies of Saccharomyces cerevisiae. Annu. Rev. Microbiol. 1987, 41, 595–616. [Google Scholar] [CrossRef]
- Harsch, M.J.; Lee, S.A.; Goddard, M.R.; Gardner, R.C. Optimized Fermentation of Grape Juice by Laboratory Strains of Saccharomyces cerevisiae. FEMS Yeast Res. 2009, 10, 72–82. [Google Scholar] [CrossRef] [Green Version]
- Wang, T.; Yang, Y.; Liu, M.; Liu, H.; Liu, H.; Xia, Y.; Xun, L. Elemental Sulfur Inhibits Yeast Growth via Producing Toxic Sulfide and Causing Disulfide Stress. Antioxidants 2022, 11, 576. [Google Scholar] [CrossRef]
- Módis, K.; Ju, Y.; Ahmad, A.; Untereiner, A.A.; Altaany, Z.; Wu, L.; Szabo, C.; Wang, R. S-Sulfhydration of ATP Synthase by Hydrogen Sulfide Stimulates Mitochondrial Bioenergetics. Pharmacol. Res. 2016, 113, 116–124. [Google Scholar] [CrossRef] [Green Version]


Publisher’s Note: MDPI stays neutral with regard to jurisdictional claims in published maps and institutional affiliations. |
© 2022 by the authors. Licensee MDPI, Basel, Switzerland. This article is an open access article distributed under the terms and conditions of the Creative Commons Attribution (CC BY) license (https://creativecommons.org/licenses/by/4.0/).
Share and Cite
Espinoza-Simón, E.; Moreno-Álvarez, P.; Nieto-Zaragoza, E.; Ricardez-García, C.; Ríos-Castro, E.; Uribe-Carvajal, S.; Torres-Quiroz, F. Self-Produced Hydrogen Sulfide Improves Ethanol Fermentation by Saccharomyces cerevisiae and Other Yeast Species. Fermentation 2022, 8, 505. https://doi.org/10.3390/fermentation8100505
Espinoza-Simón E, Moreno-Álvarez P, Nieto-Zaragoza E, Ricardez-García C, Ríos-Castro E, Uribe-Carvajal S, Torres-Quiroz F. Self-Produced Hydrogen Sulfide Improves Ethanol Fermentation by Saccharomyces cerevisiae and Other Yeast Species. Fermentation. 2022; 8(10):505. https://doi.org/10.3390/fermentation8100505
Chicago/Turabian StyleEspinoza-Simón, Emilio, Paola Moreno-Álvarez, Elias Nieto-Zaragoza, Carolina Ricardez-García, Emmanuel Ríos-Castro, Salvador Uribe-Carvajal, and Francisco Torres-Quiroz. 2022. "Self-Produced Hydrogen Sulfide Improves Ethanol Fermentation by Saccharomyces cerevisiae and Other Yeast Species" Fermentation 8, no. 10: 505. https://doi.org/10.3390/fermentation8100505