
Synthetic Pitch from Solvent Extraction of Coal as a Source for High-Quality Graphite


Abstract
:
1. Introduction
2. Materials and Methods
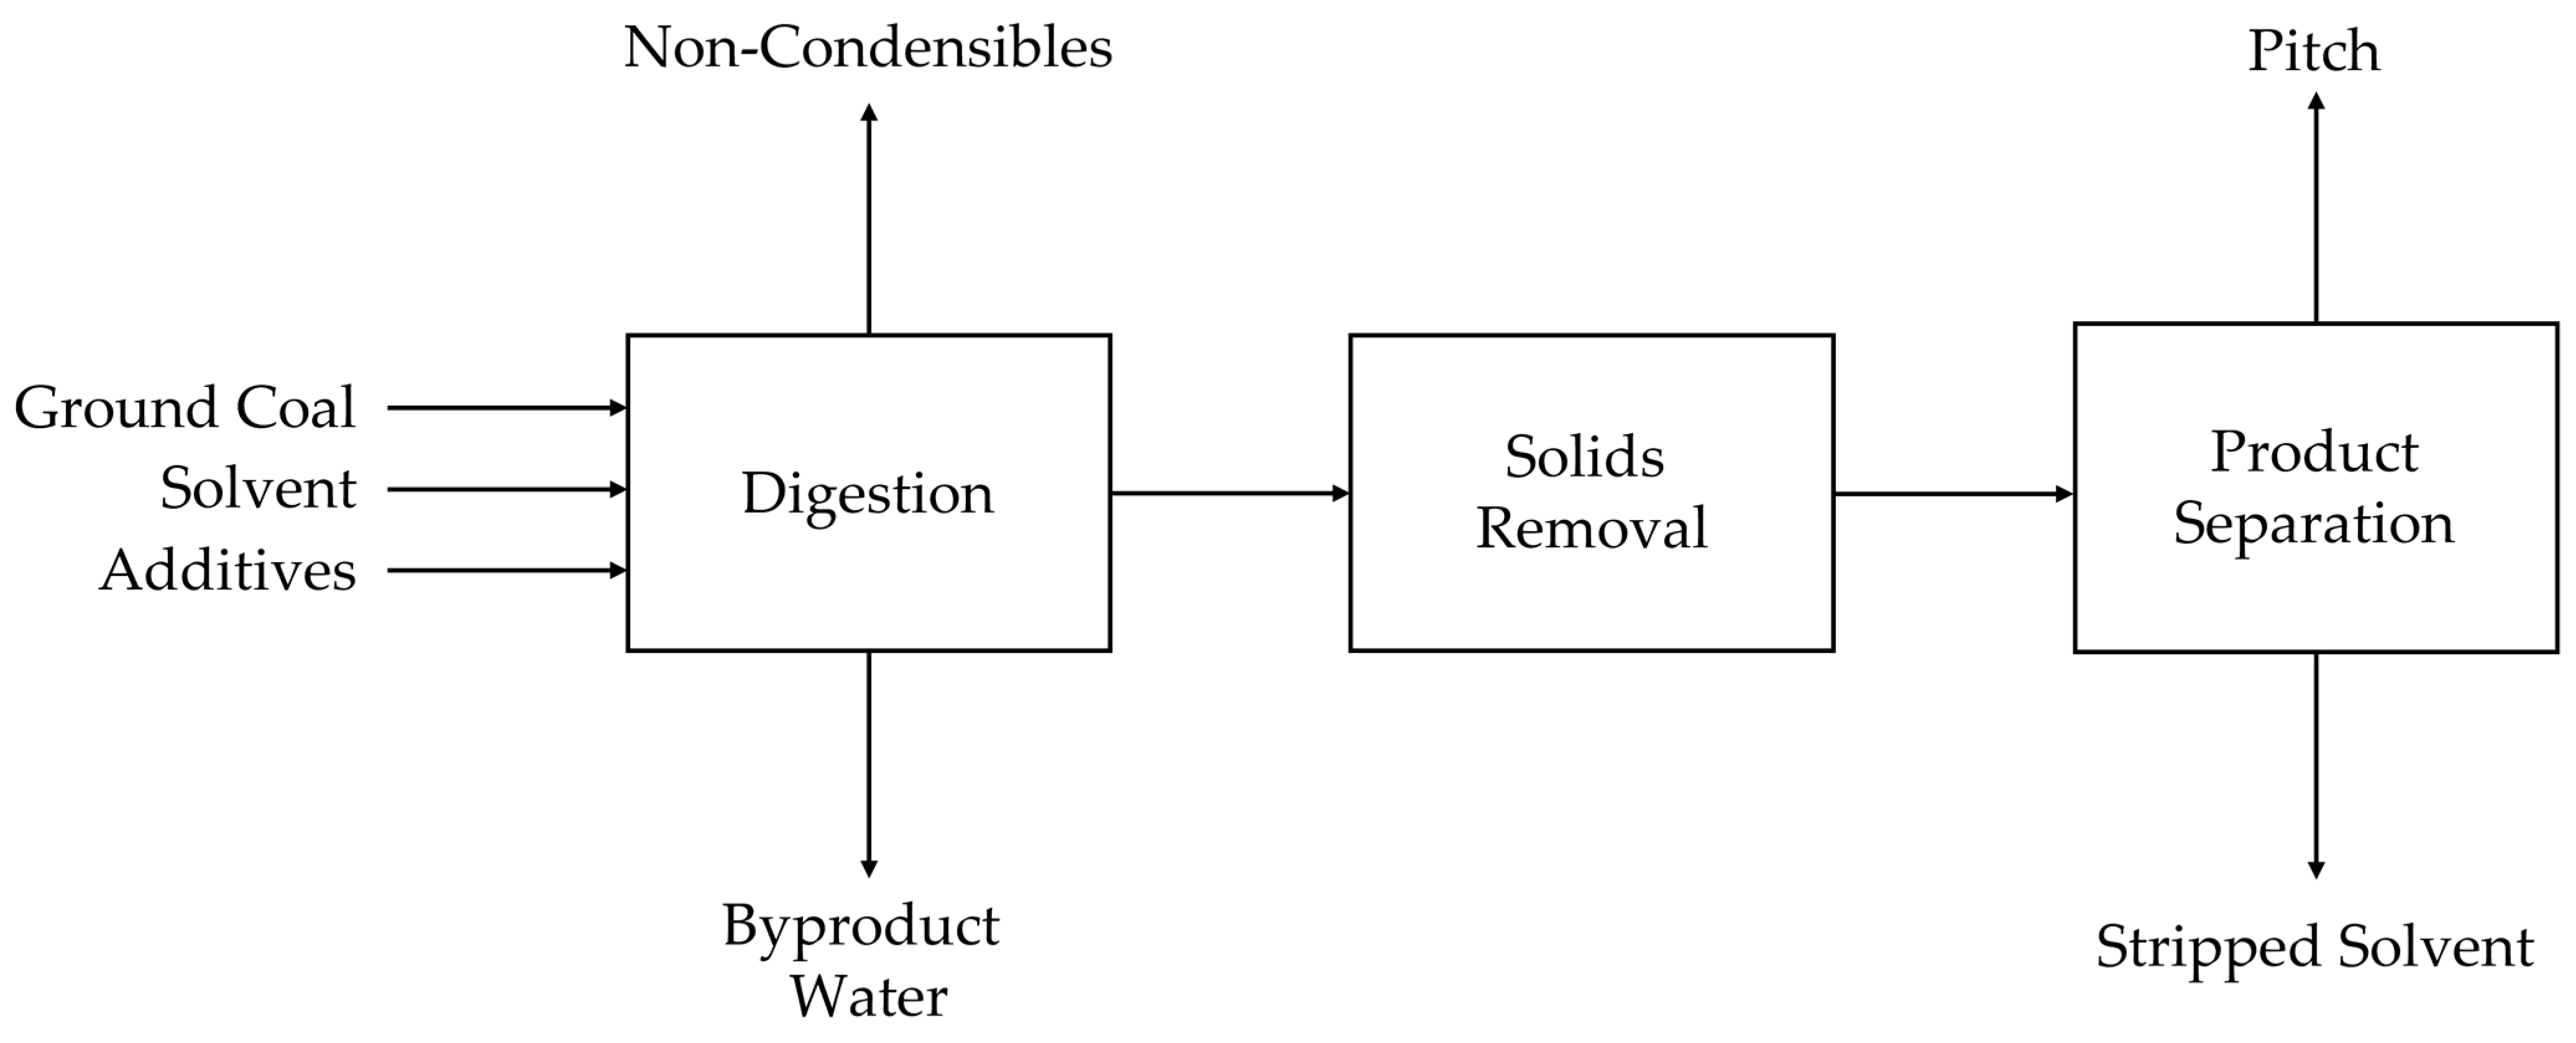
2.1. Materials
2.2. Fourier Transform Infrared Spectroscopy
2.3. Nuclear Magnetic Resonance
2.4. Thermogravimetric Analysis/Differential Scanning Calorimetry
2.5. Carbonization and Graphitization
2.6. X-ray Diffraction
2.7. Transmission Electron Microscopy
3. Results
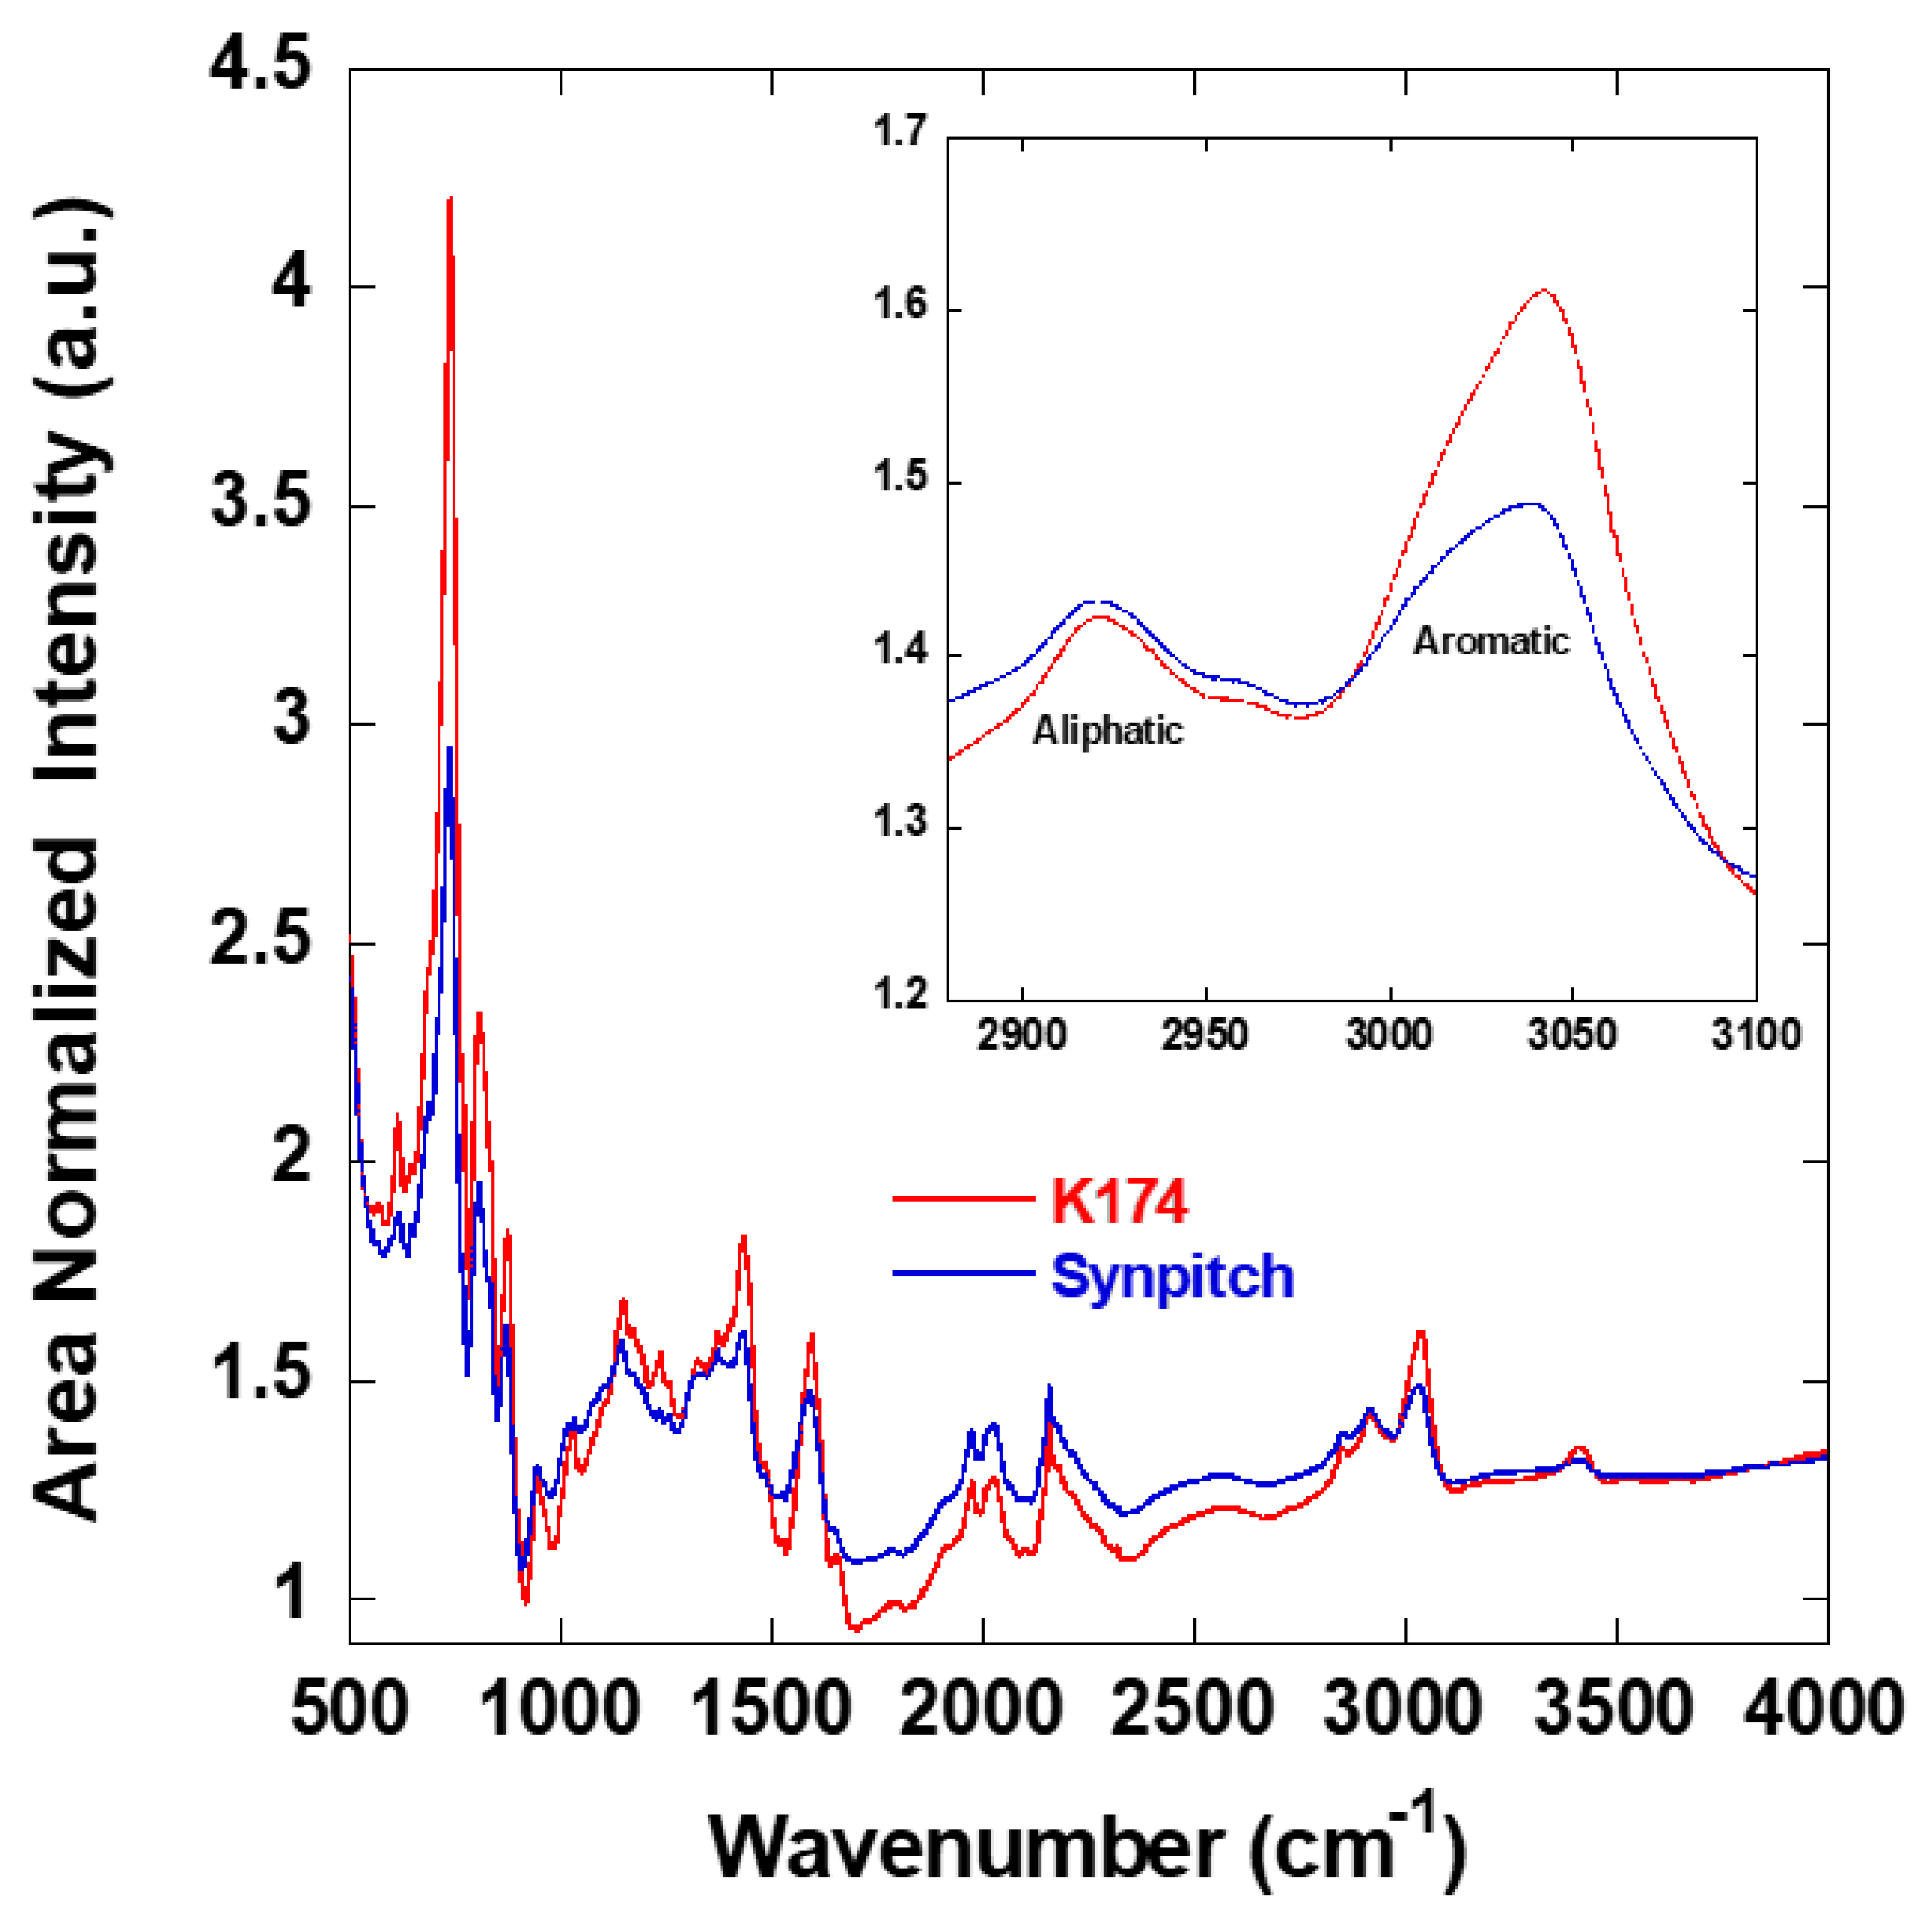
3.1. FTIR
3.2. NMR
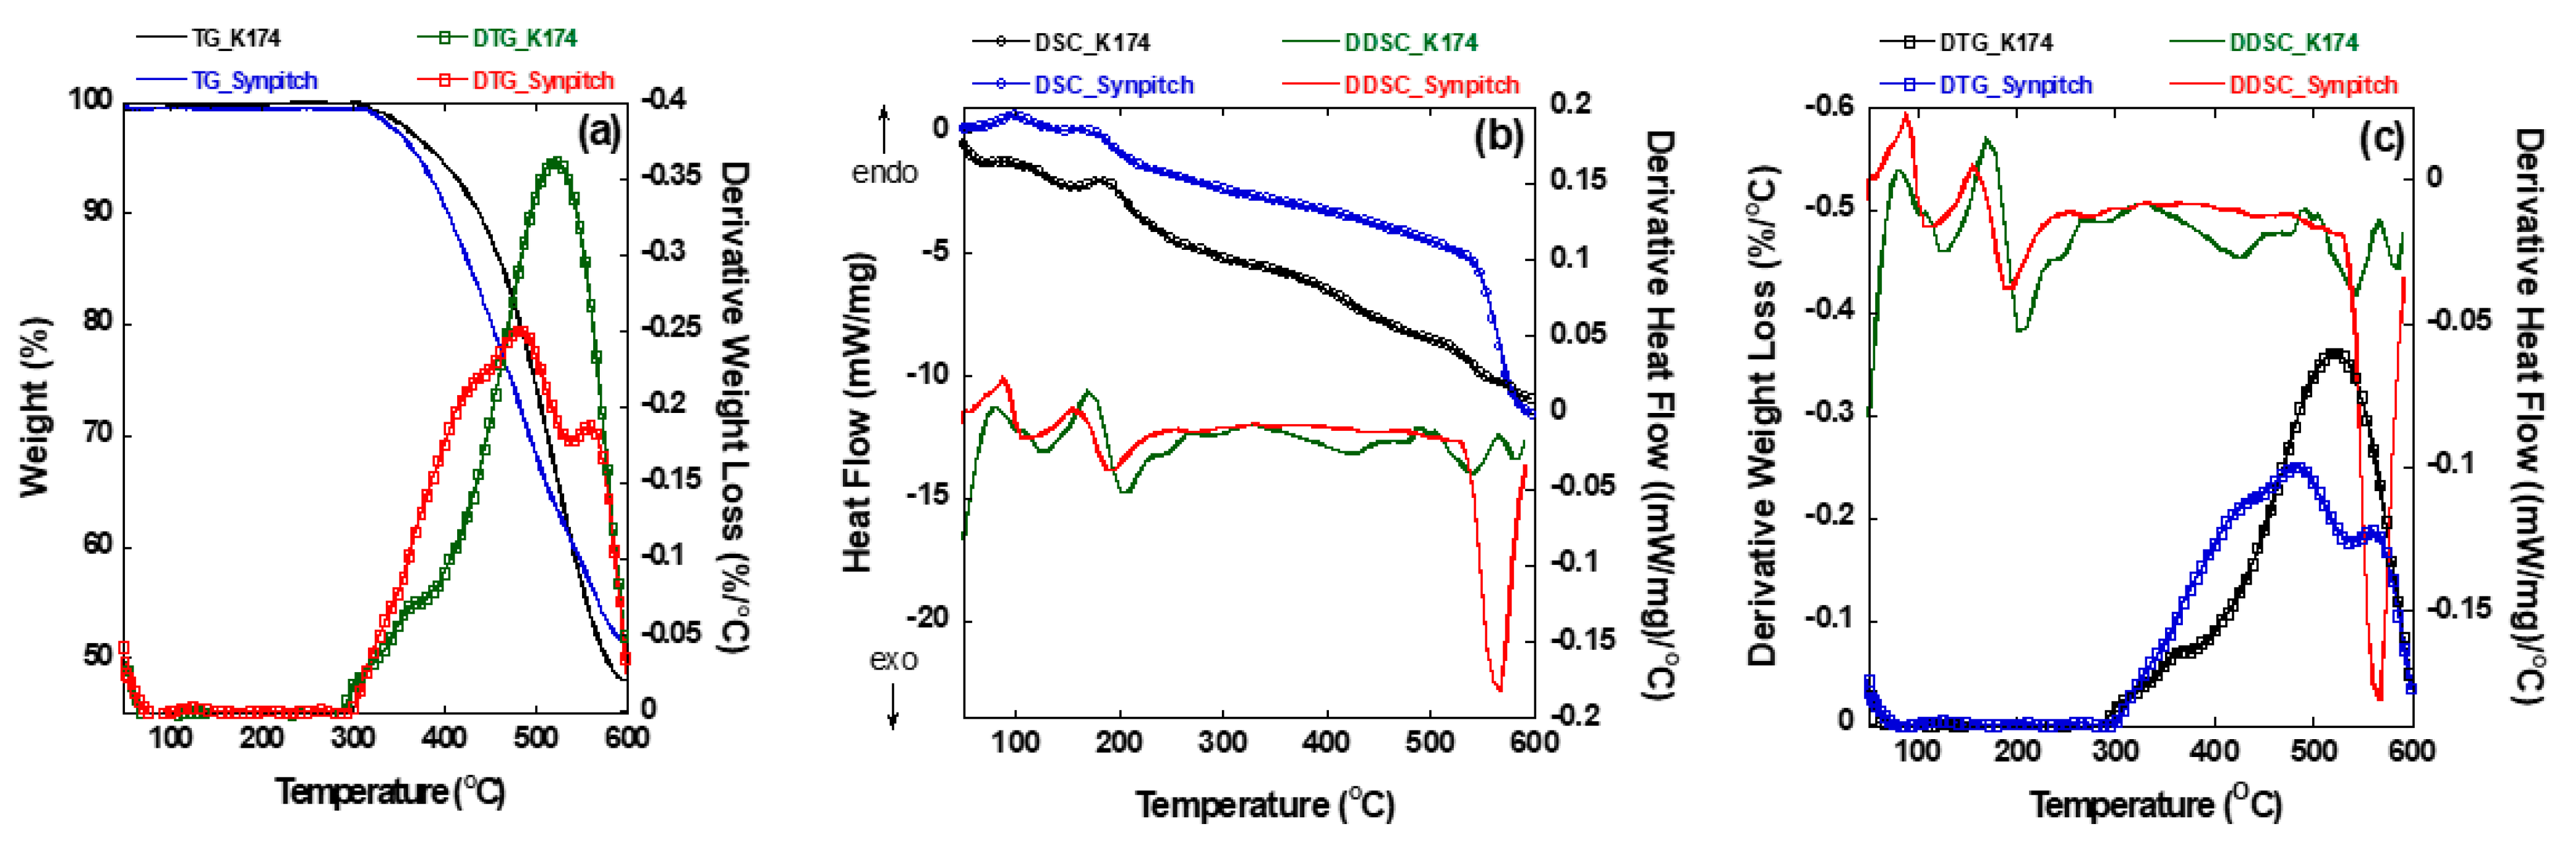
3.3. TGA-DSC
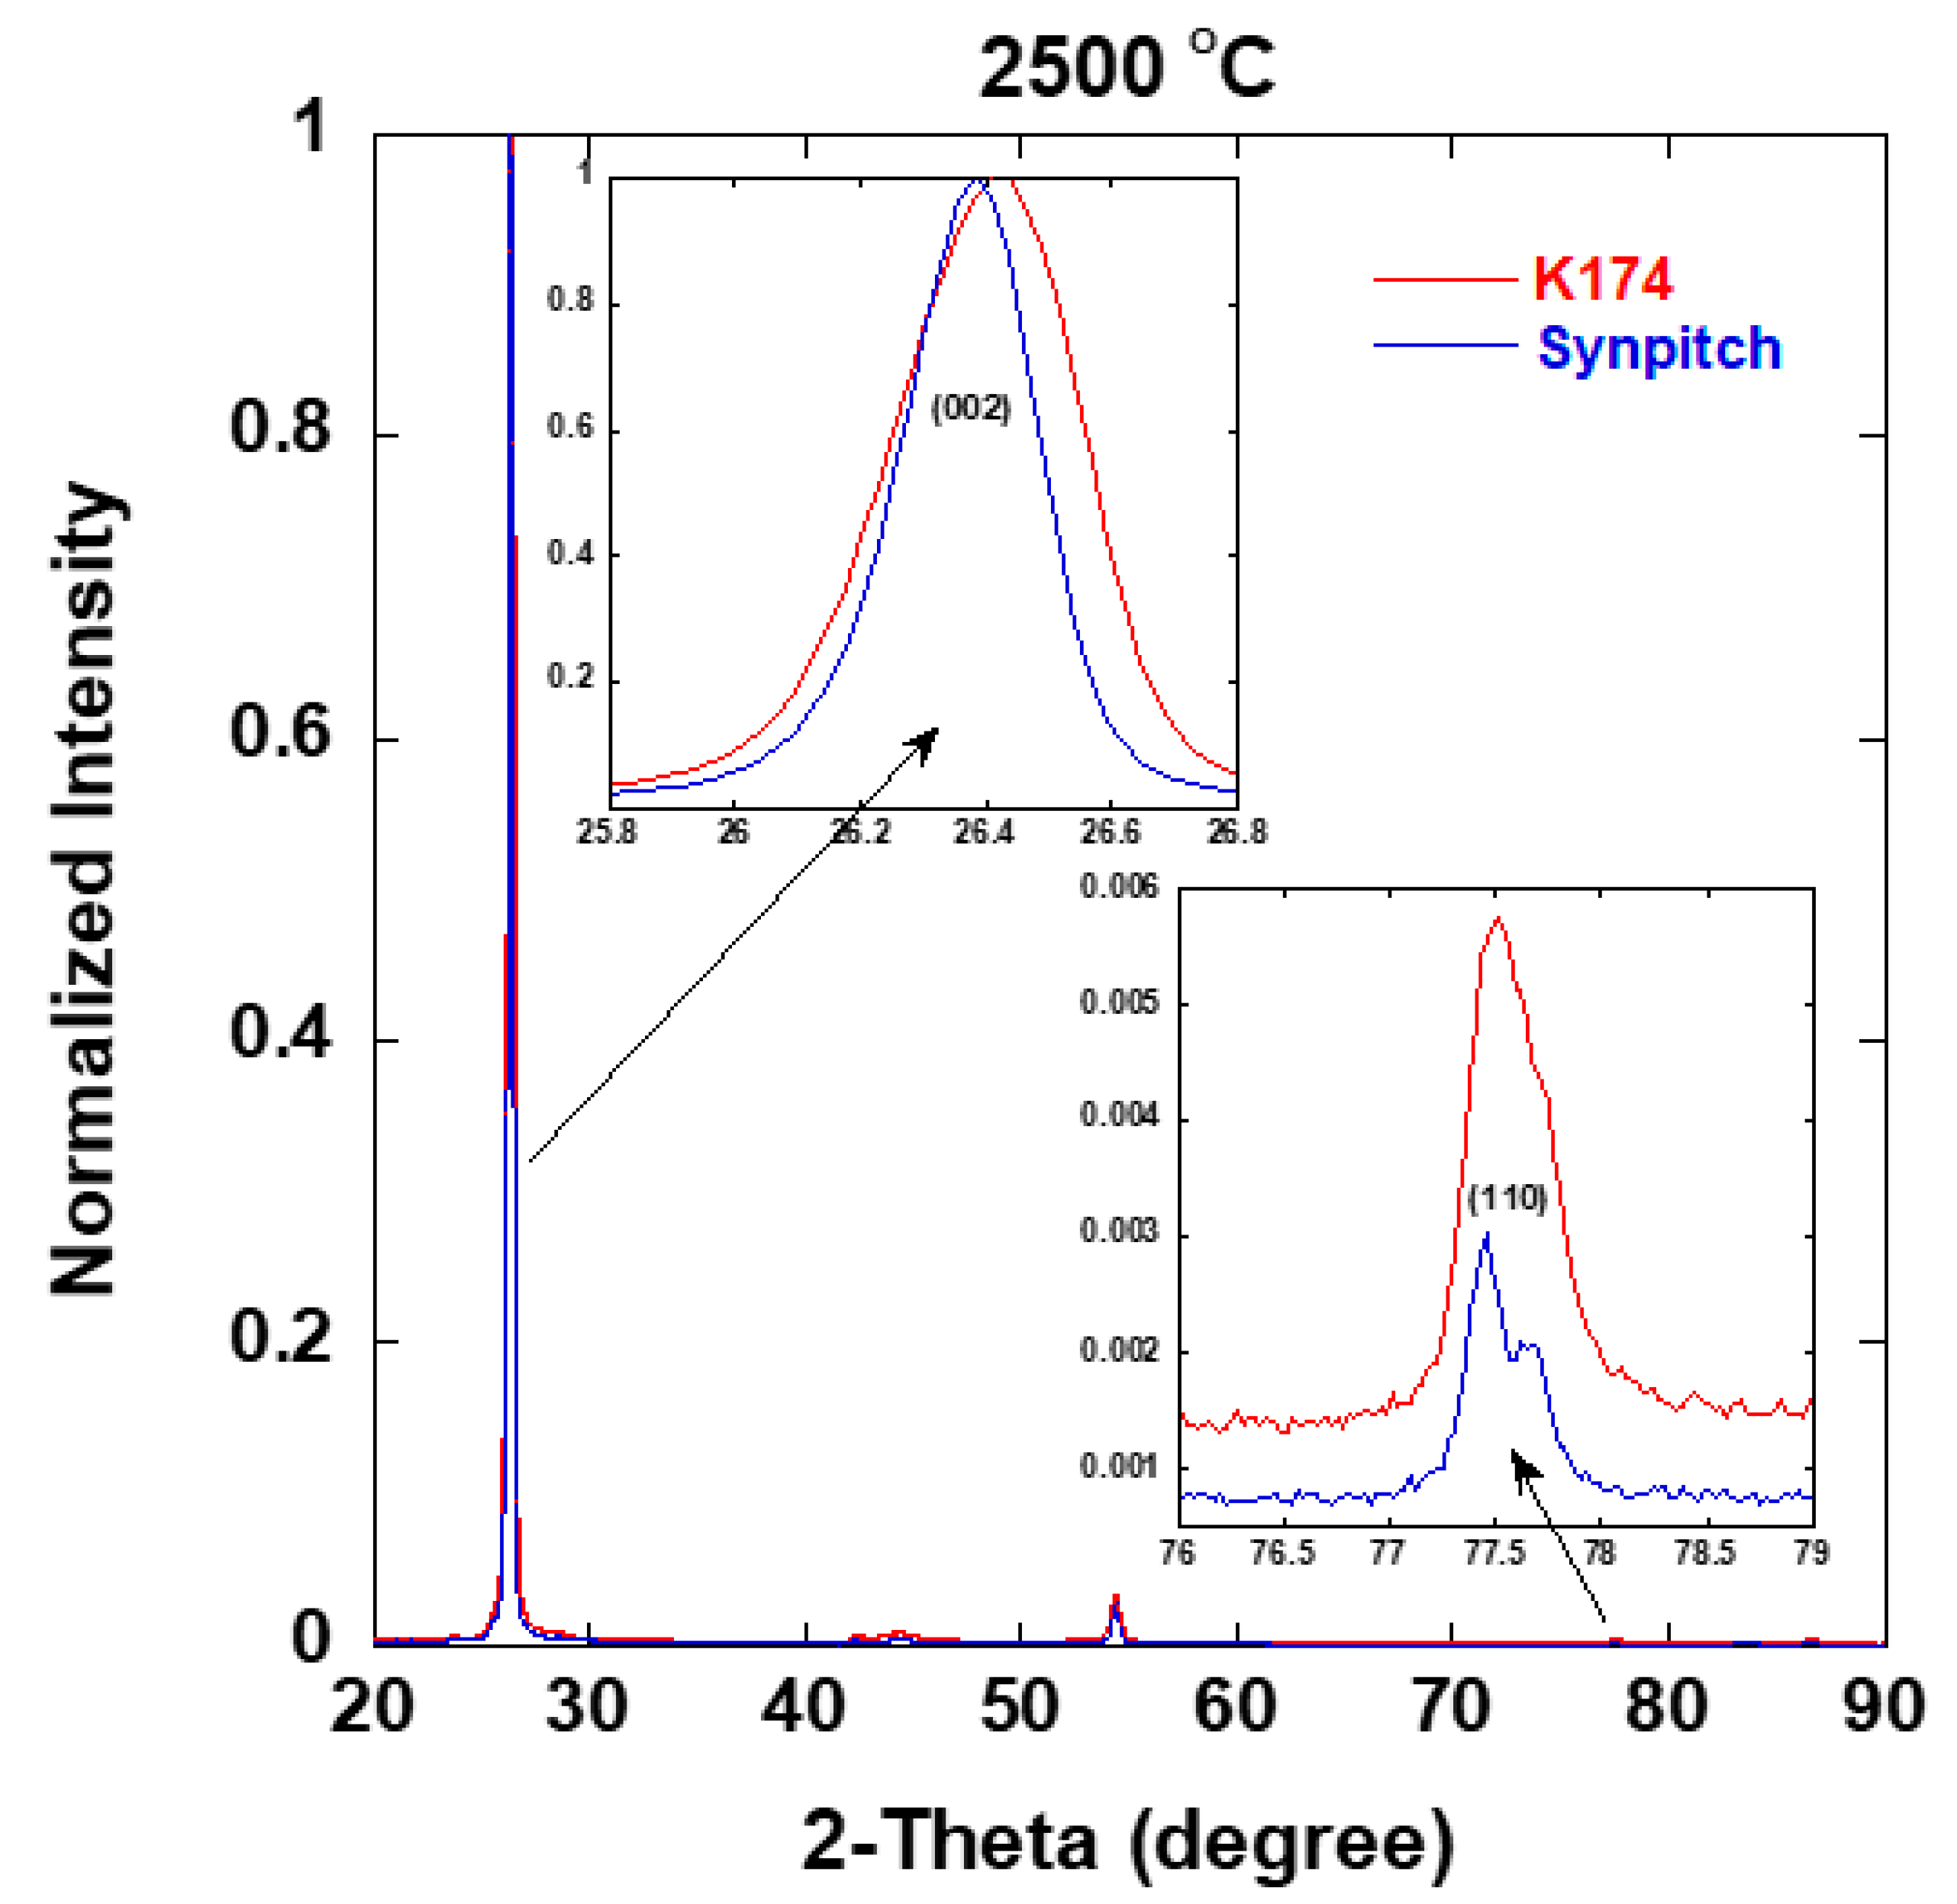
3.4. X-ray Diffraction
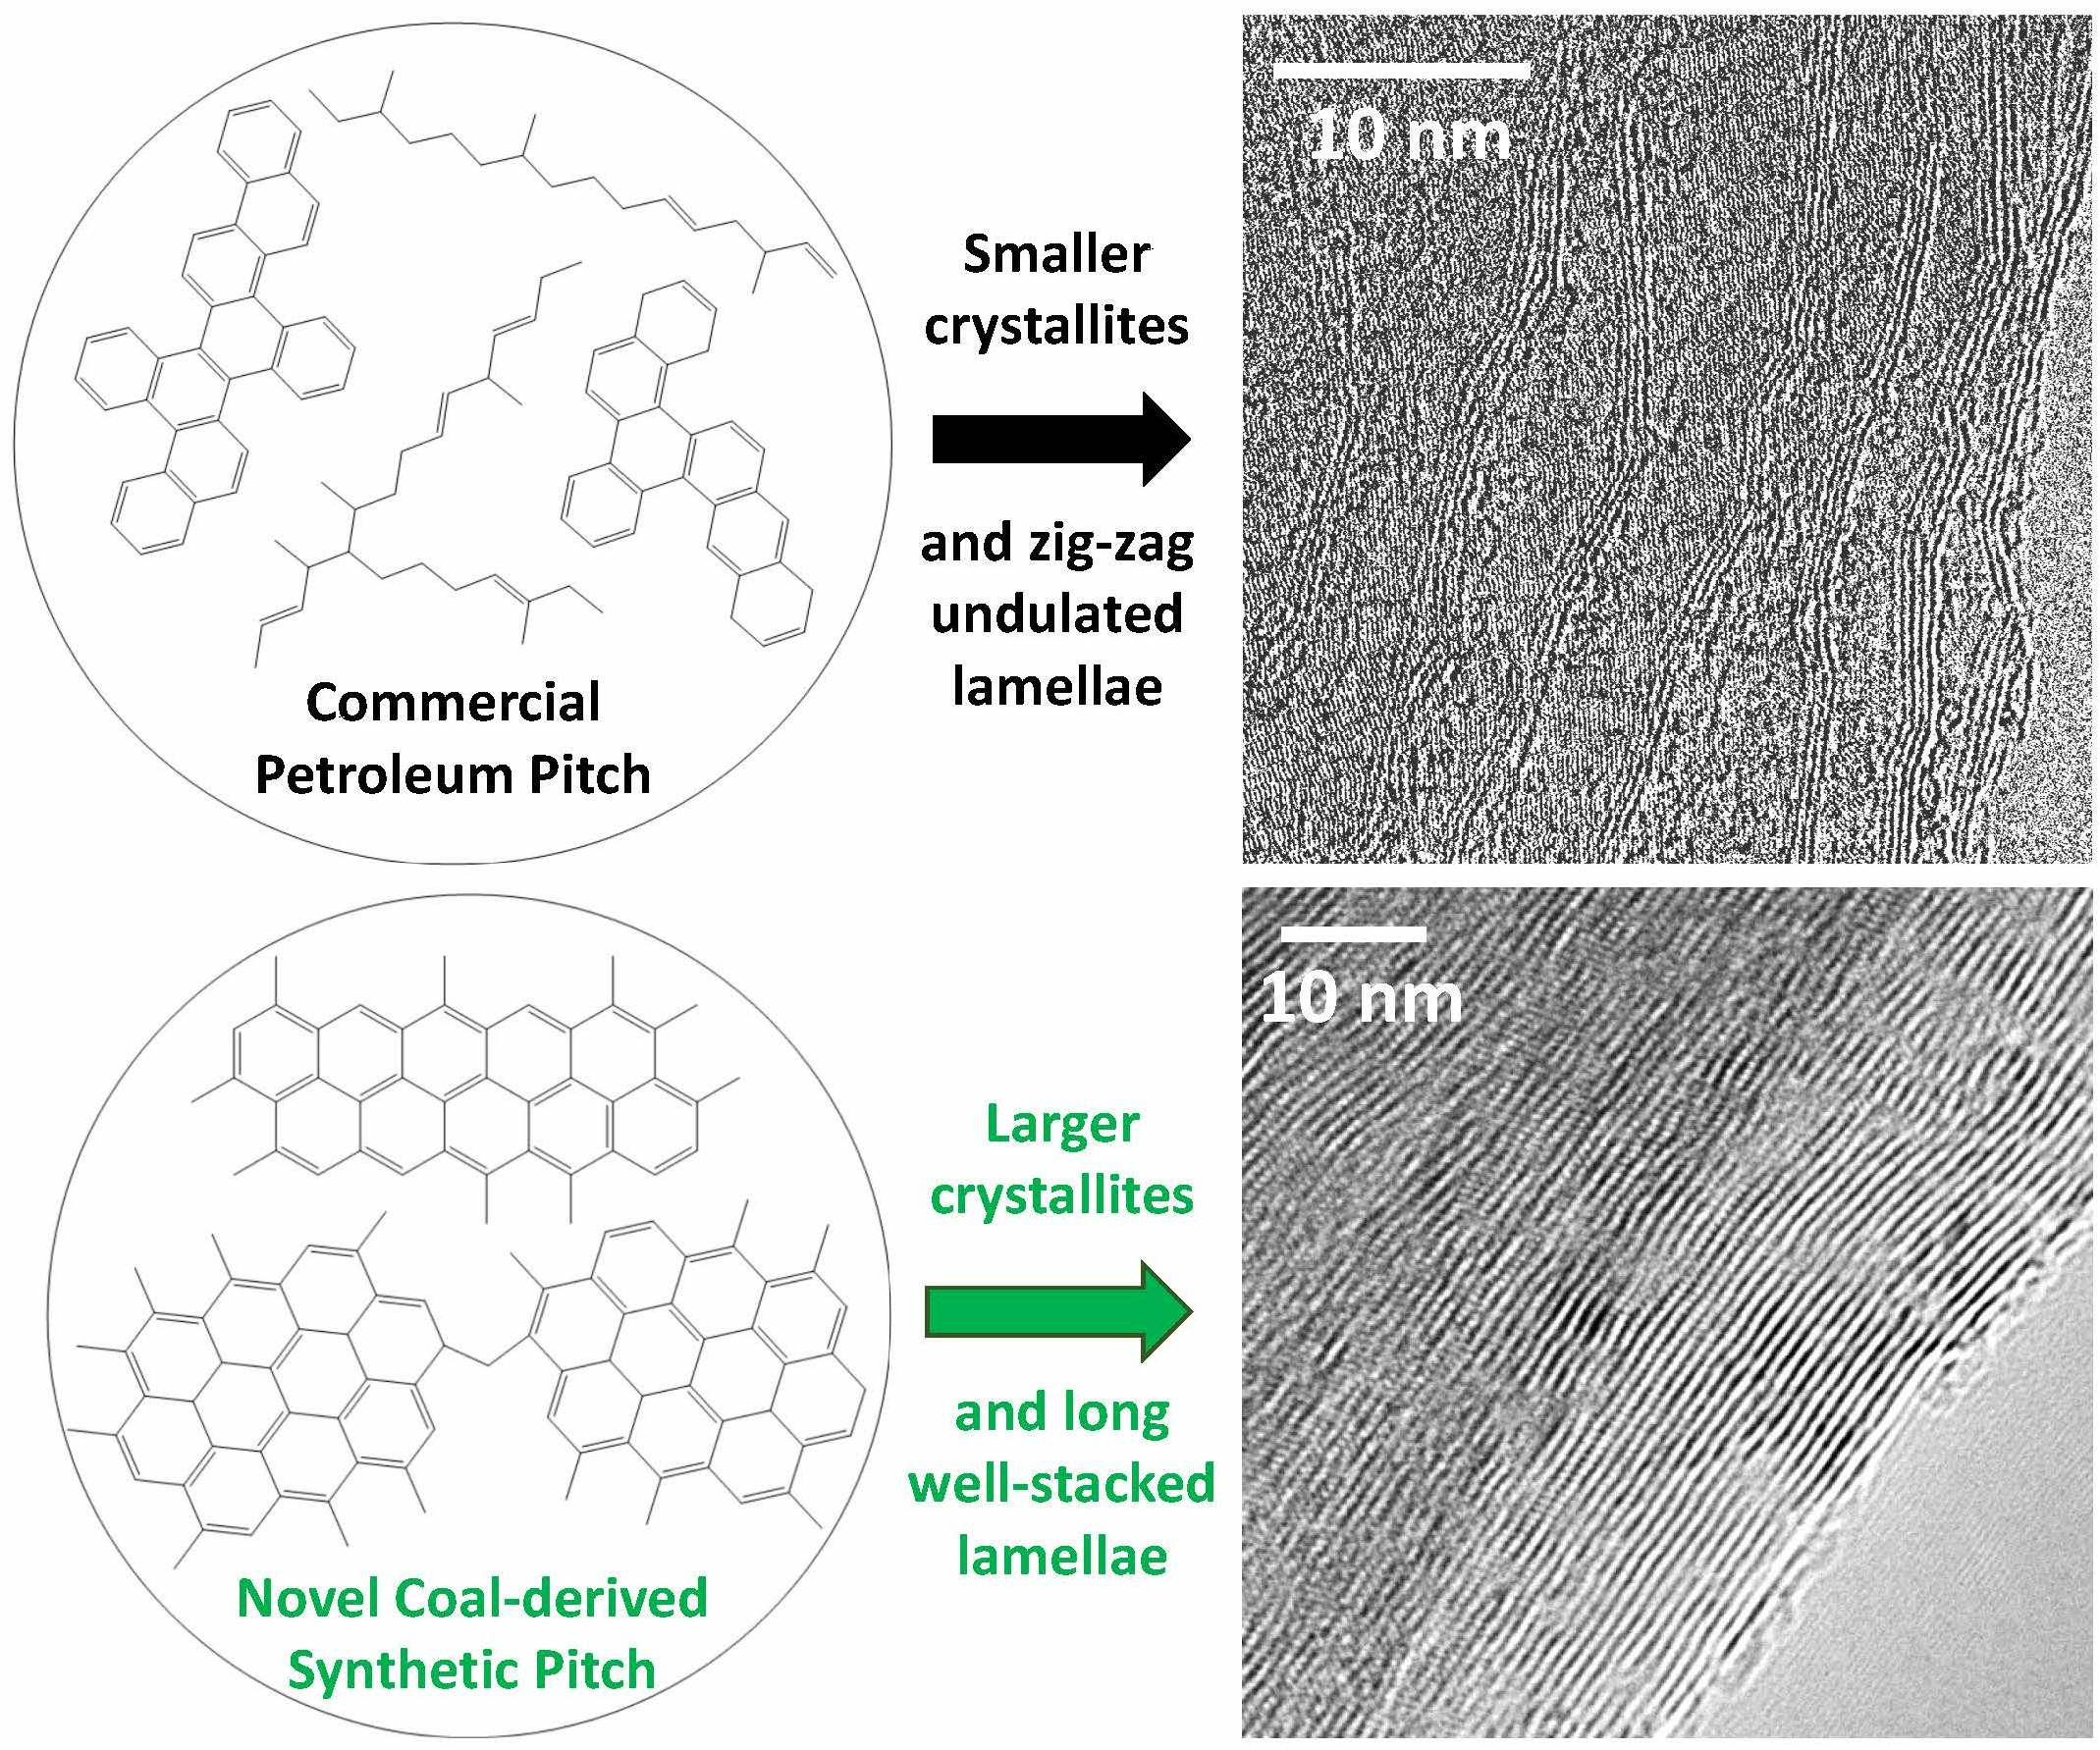
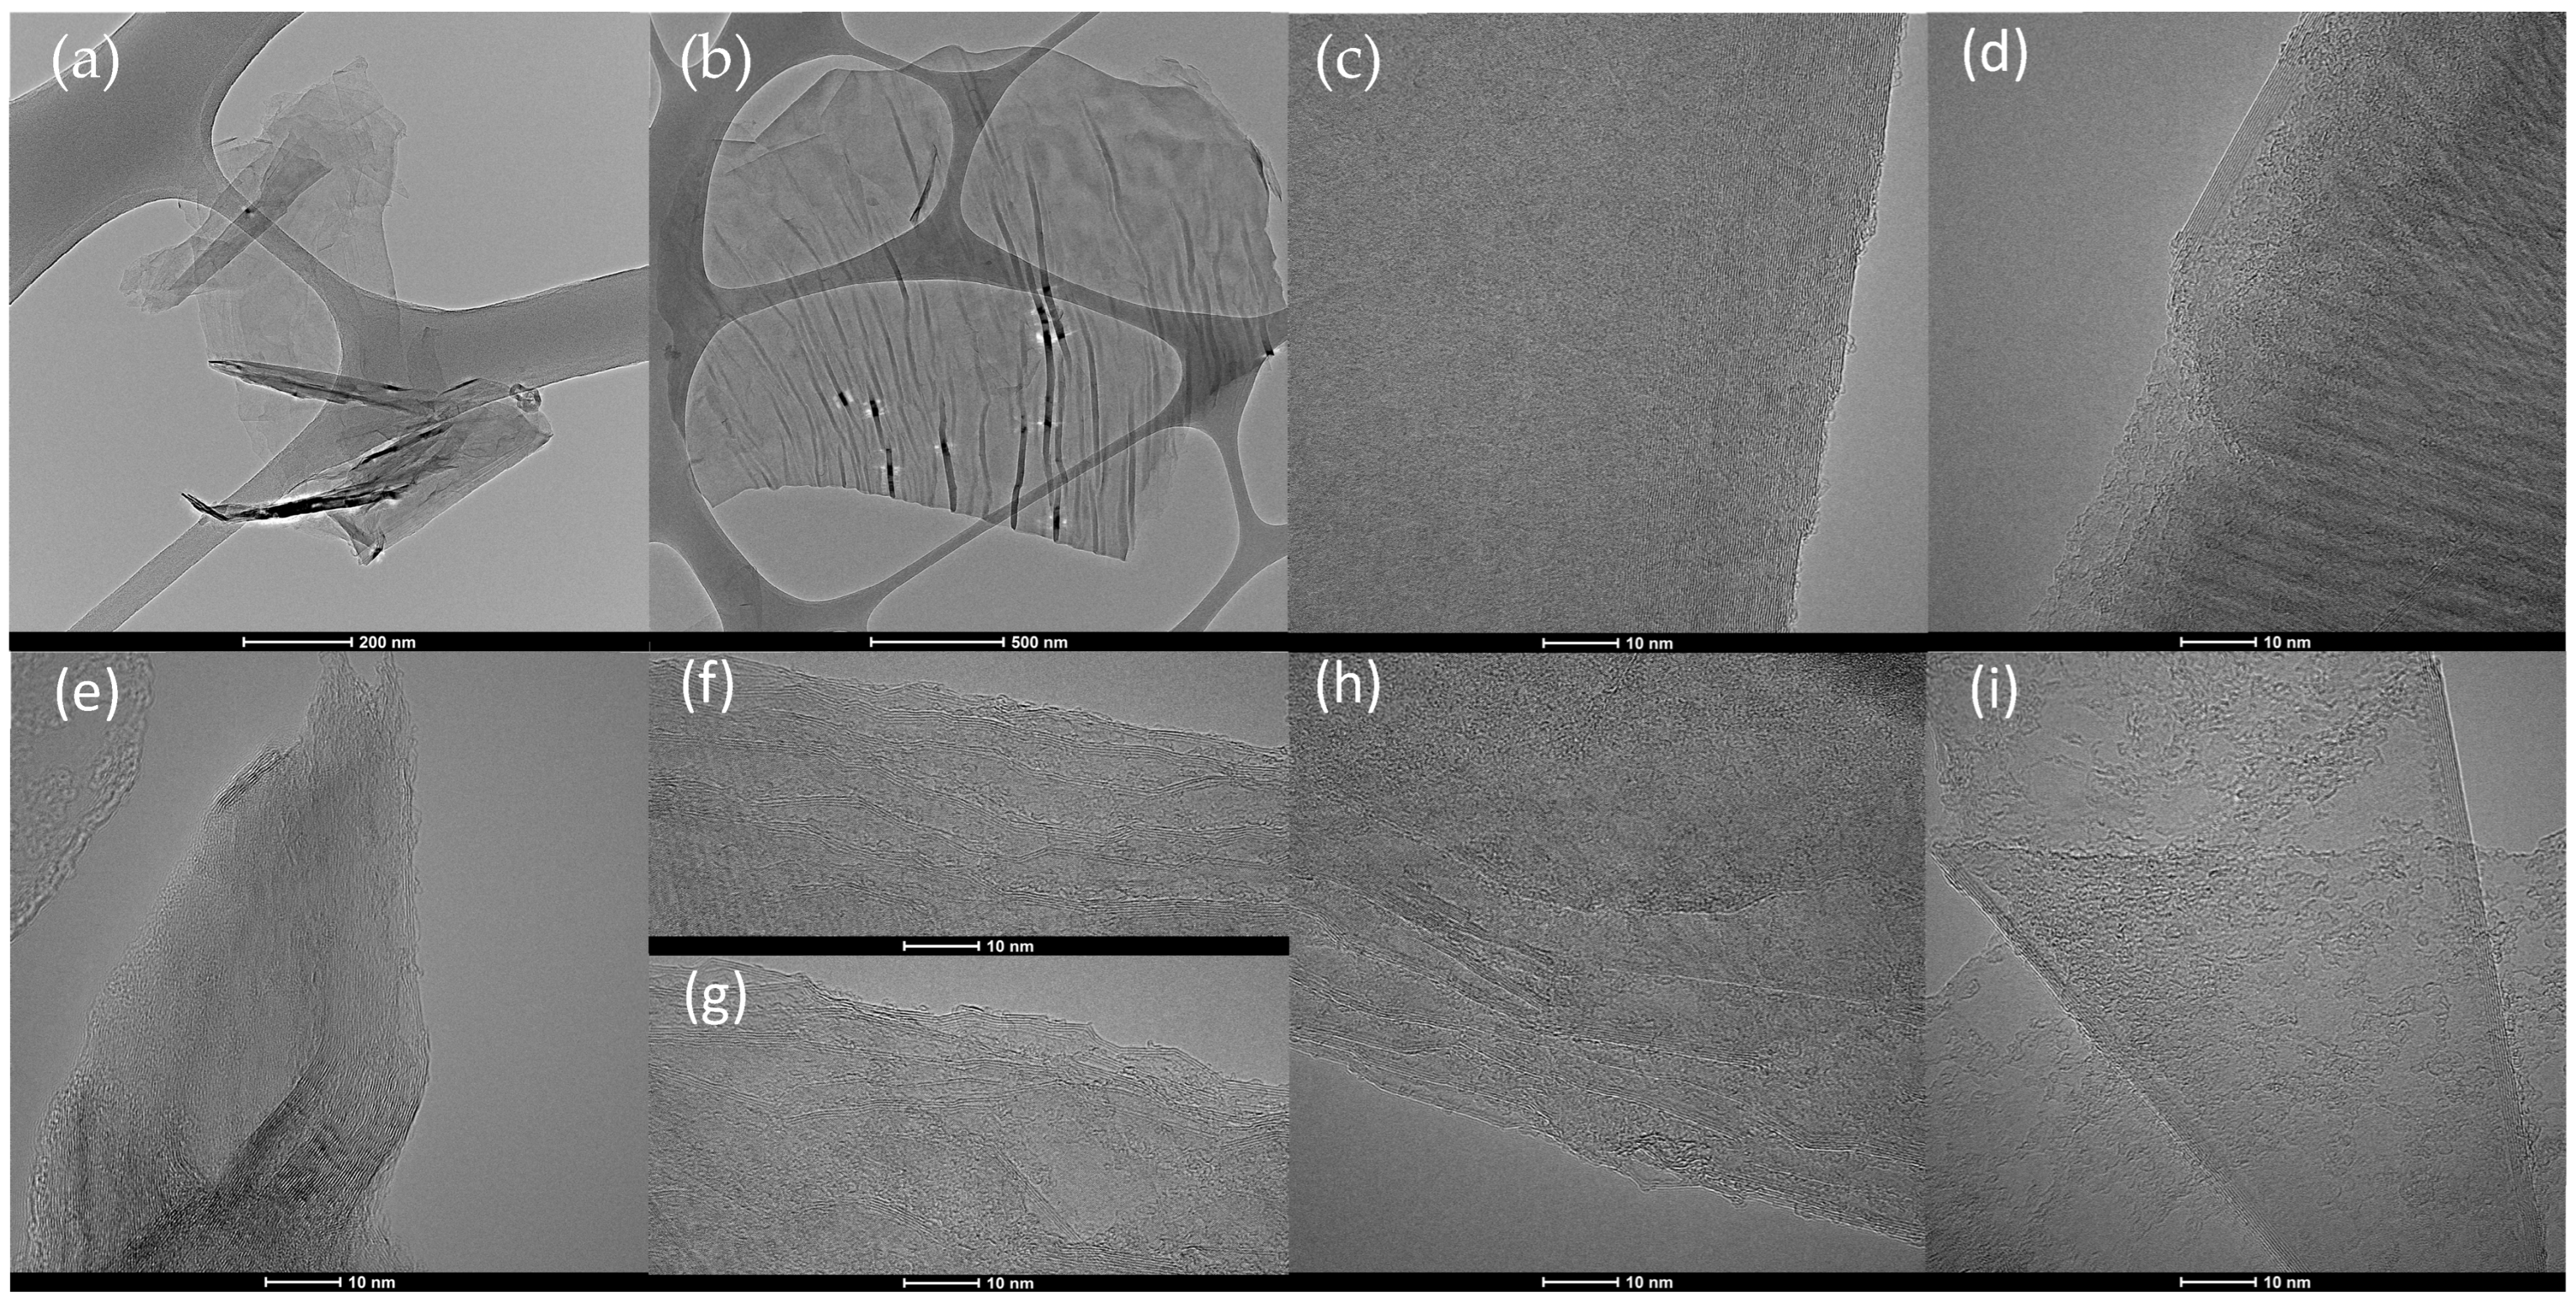
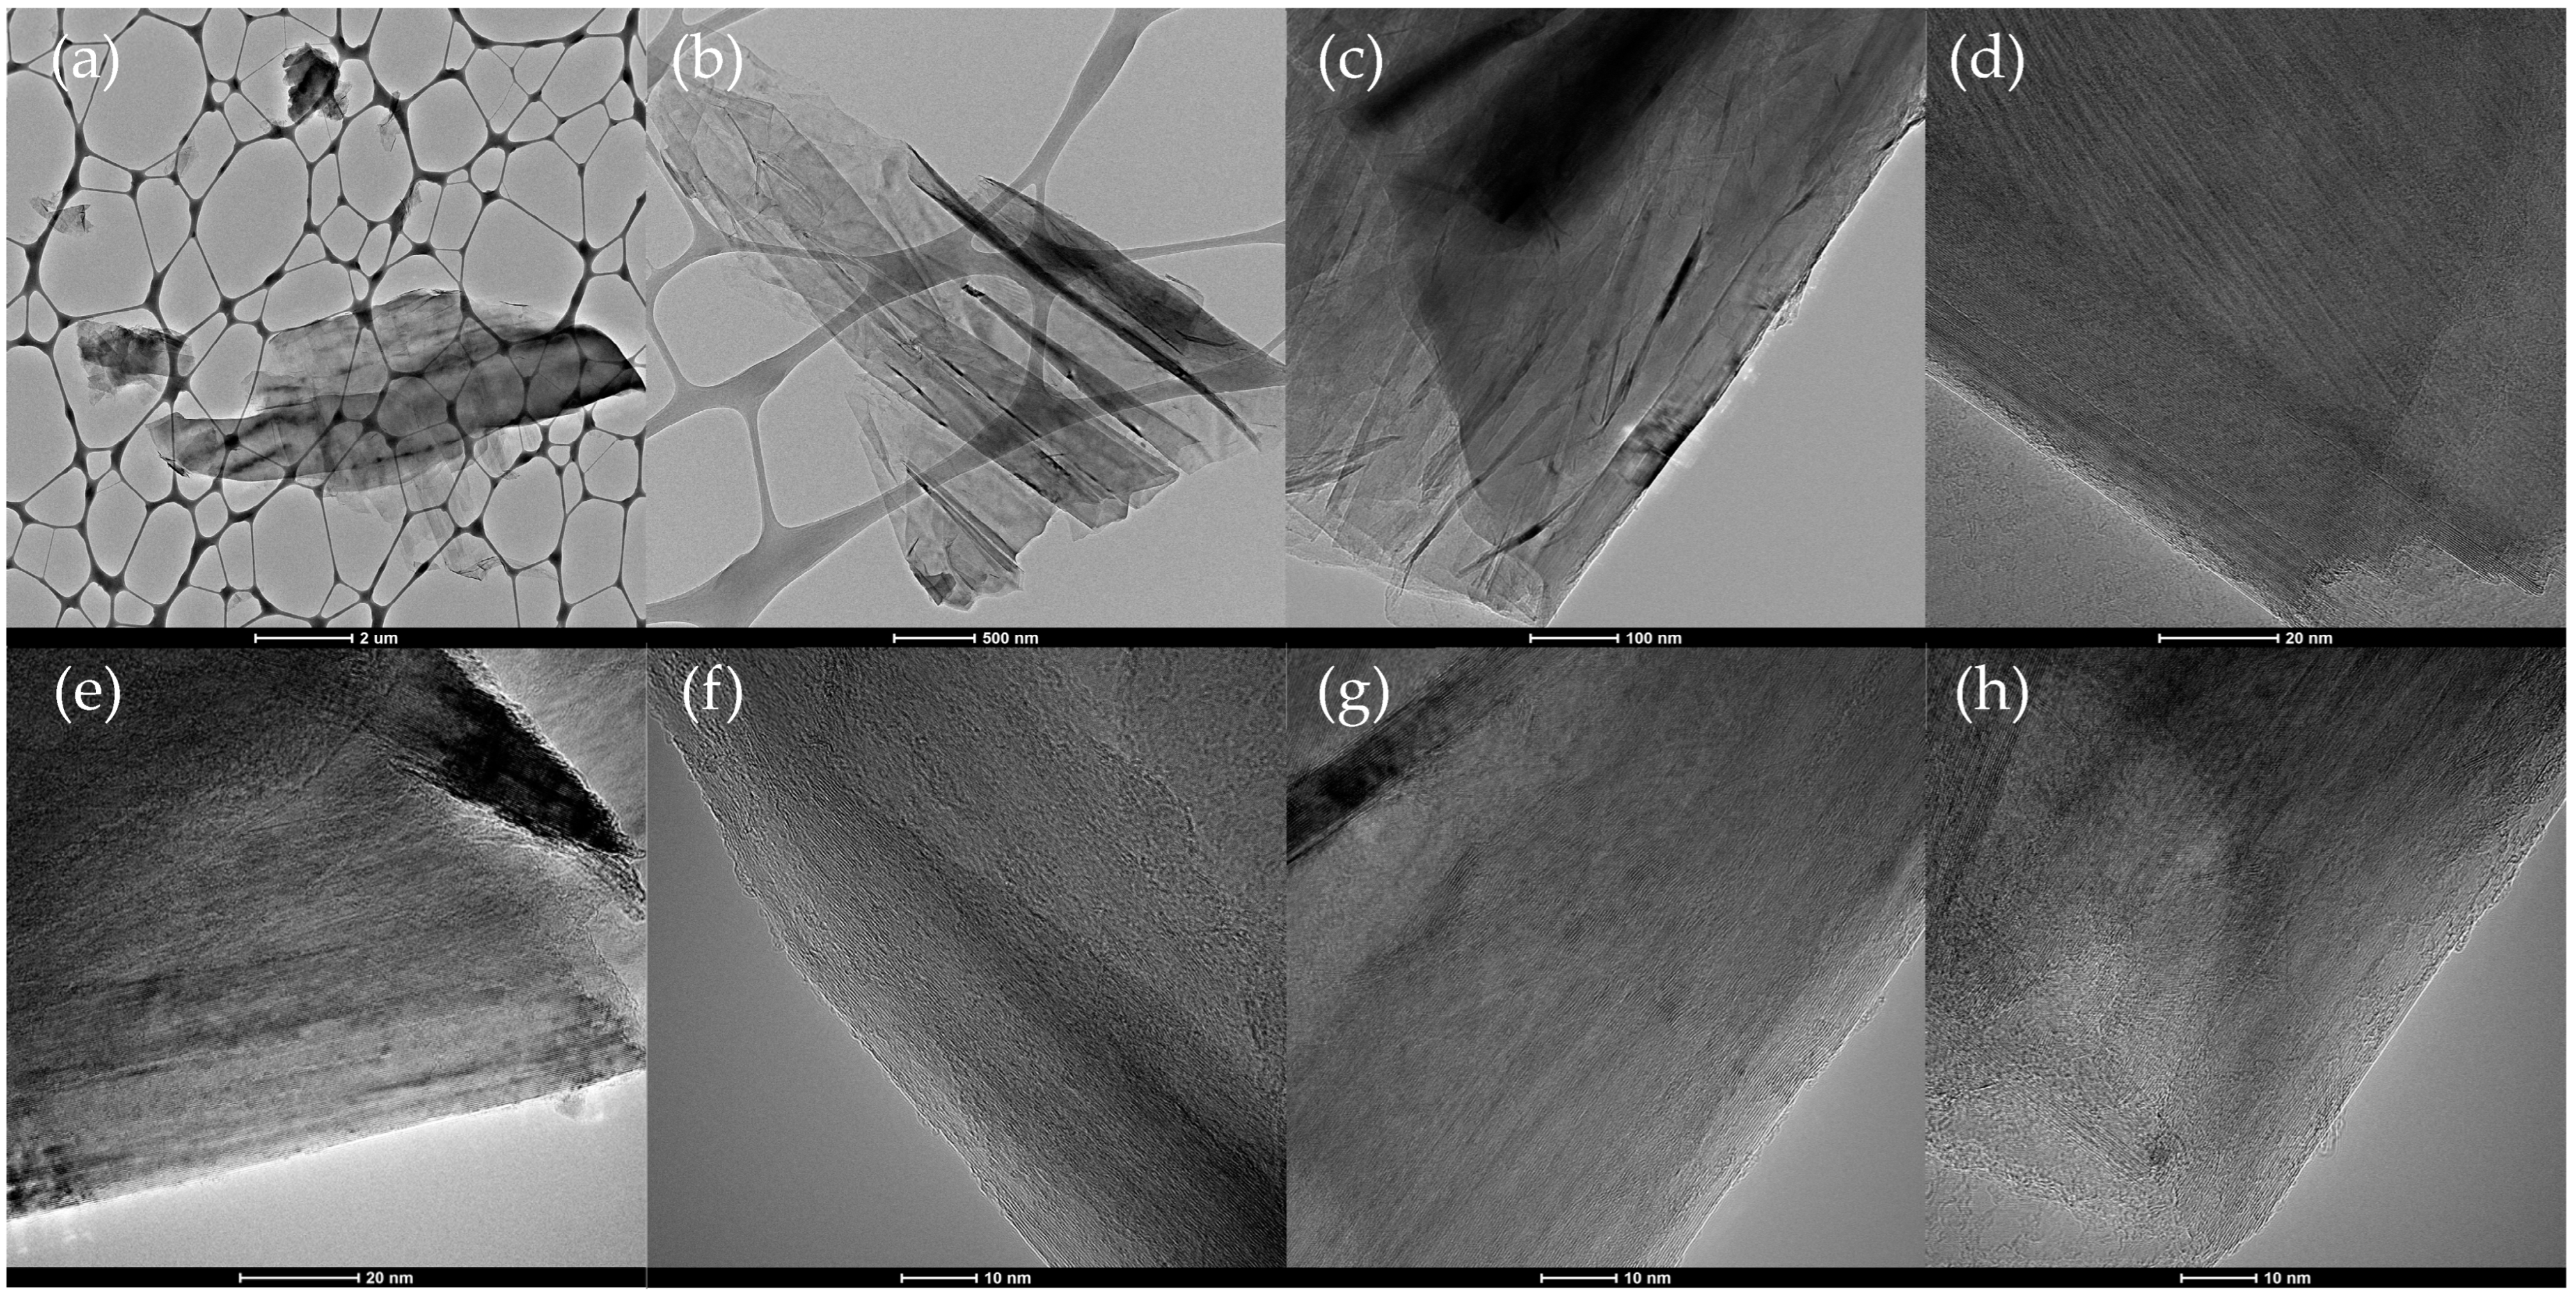
3.5. Morphology and Nanostructure Assessment
4. Discussion
5. Conclusions
Supplementary Materials
Author Contributions
Funding
Institutional Review Board Statement
Acknowledgments
Conflicts of Interest
References
- MarketWatch. Coke Market Size by Regional Industry Growth, Statistics & Forecast. Available online: https://www.marketwatch.com/press-release/coke-market-size-by-regional-industry-growth-statistics-&-forecast-2019-05-18 (accessed on 17 December 2019).
- Kraynik, C.E. Strategies for a Declining North American Coal Tar Supply. In National Coal Industrial Meeting; Koppers Industries Inc., Technical Center: Pittsburgh, PA, USA, 2005. [Google Scholar]
- United Nations Statistics Division. Coke Oven Coke Production. Available online: http://data.un.org/Data.aspx?d=EDATA&f=cmID%3AOK (accessed on 6 October 2022).
- Conner, J.R. Metallurgical Coal. Available online: http://www.flatheadmemo.com/north_fork_coal/Coal/News/coke.html#:~:text=Foundries_use_coke_as_a,the_production_of_calcium_carbide (accessed on 6 October 2022).
- Mochida, I.; Kudo, K.; Takeshita, K.; Takahashi, R.; Suetsugu, Y.; Furumi, J. Modifying Carbonization Properties of Pitches. 1. Conversion of Benzene-Insoluble Matter of Coal-Tar Pitch into Graphitizable Carbon. Fuel 1974, 53, 253–257. [Google Scholar] [CrossRef]
- Edwards, I.A.S.; Marsh, H.; Menendez, R. Introduction to Carbon Science; Butterworth-Heinemann: Oxford, UK, 2013. [Google Scholar]
- U.S. Environmental Protection Agency. Coke Production. Available online: https://www3.epa.gov/ttnchie1/old/ap42/ch12/s02/bgdocs/b12s02.pdf (accessed on 6 October 2022).
- Clean Air Council. Coke and How Its Made. Available online: https://pacokeovens.org/what-is-coke/ (accessed on 6 October 2022).
- Taylor, W.F.; Hall, H.J. Future Synthetic Fuels. A Scientific and Technical Applications Forecast. Final Report; Government Research Lab, Exxon Research and Engineering Co.: Linden, NJ, USA, 1975. [Google Scholar]
- Stevens, T.; Udall, M.K. Increased Automobile Fuel Efficiency and Synthetic Fuels: Alternatives for Reducing Oil Imports; Congress of the U.S., Office of Technology Assessment: Washington, DC, USA, 1982. [Google Scholar]
- Baughman, G.L. Synthetic Fuels Data Handbook; Cameron Engineers: Denver, CO, USA, 1978. [Google Scholar]
- Shui, H.; Cai, Z.; Xu, C. Recent Advances in Direct Coal Liquefaction. Energies 2010, 3, 155–170. [Google Scholar] [CrossRef]
- Davis, A.; Glick, D.C.; Hatcher, P.G.; Mitchell, G.D. Maintenance of the Coal Sample Bank & Database, 11/99, 2841095. 1999. Available online: https://www.osti.gov/servlets/purl/827653 (accessed on 5 January 2021).
- Choi, C.Y.; Muntean, J.V.; Thompson, A.R.; Botto, R.E. Characterization of Coal Macerals Using Combined Chemical and NMR Spectroscopic Methods. Energy Fuels 1989, 3, 528–533. [Google Scholar] [CrossRef]
- Sun, Z.; Zhang, W. Chemical composition and structure characterization of distillation residues of middle-temperature coal tar. Chin. J. Chem. Eng. 2017, 25, 815–820. [Google Scholar] [CrossRef]
- Seshadri, A.S.; Cronauer, D.C. Characterization of coal-derived liquids by 13C nmr and FT-ir spectroscopy: Fractions of middle and heavy distillates of SRC-II. Fuel 1983, 62, 1436–1444. [Google Scholar] [CrossRef]
- Fairbridge, C.; Kriz, J.F. Hydroprocessing of coal-derived middle distillate. Fuel Sci. Technol. Int. 1986, 4, 171–189. [Google Scholar] [CrossRef]
- Caramão, E.B.; Gomes, L.M.F.; Bristoti, A.; Lancas, F.M. Characterization op medium distillate cut (100–230 °C) oil from high-ash “mina do leão” brazilian coal tar. Pet. Sci. Technol. 1990, 8, 173–190. [Google Scholar] [CrossRef]
- Dadyburjor, D.; Biedler, P.R.; Chen, C.; Clendenin, L.M.; Katakdaunde, M.; Kennel, E.B.; King, N.D.; Magean, L.; Stansberry, P.G.; Stiller, A.H. Production of Carbon Products Using a Coal Extraction Process; West Virginia University: Morgantown, WV, USA, 2004. [Google Scholar]
- Kennel, E.; Chen, C.; Dadyburjor, D.; Heavner, M.; Katakdaunde, M.; Magean, L.; Mayberry, J.; Stiller, A.; Stoffa, J.; Yurchick, C. Development of Continuous Solvent Extraction Processes for Coal Derived Carbon Products; West Virginia University: Morgantown, WV, USA, 2009. [Google Scholar]
- Kennel, E.B.; Stansberry, P.G.; Stiller, A.H.; Zondlo, J.W. Method of Producing Synthetic Pitch; West Virginia University: Morgantown, WV, USA, 2012. [Google Scholar]
- Franz, J.A.; Garcia, R.; Linehan, J.C.; Love, G.D.; Snape, C.E. Single-Pulse Excitation 13C NMR Measurements on the Argonne Premium Coal Samples. Energy Fuels 1992, 6, 598–602. [Google Scholar] [CrossRef]
- Maroto-Valer, M.M.; Andrésen, J.M.; Rocha, J.D.; Snape, C.E. Quantitative Solid-State 13C Nmr Measurements on Cokes, Chars and Coal Tar Pitch Fractions. Fuel 1996, 75, 1721–1726. [Google Scholar] [CrossRef]
- Muntean, J.V.; Stock, L.M. Bloch Decay Solid-State Carbon-13 NMR Spectroscopy of the Samarium Iodide-Treated Argonne Premium Coals. Energy Fuels 1991, 5, 765–767. [Google Scholar] [CrossRef]
- Andresen, J.M.; Luengo, C.A.; Moinelo, S.R.; Garcia, R.; Snape, C.E. Structural Uniformity of Toluene-Insolubles from Heat-Treated Coal Tar Pitch as Determined by Solid State 13C Nmr Spectroscopy. Energy Fuels 1998, 12, 524–530. [Google Scholar] [CrossRef]
- Alcañiz-Monge, J.; Cazorla-Amorós, D.; Linares-Solano, A. Characterization of Coal Tar Pitches by Thermal Analysis, Infrared Spectroscopy and Solvent Fractionation. Fuel 2001, 80, 41–48. [Google Scholar] [CrossRef]
- Díaz, C.; Blanco, C.G. NMR: A Powerful Tool in the Characterization of Coal Tar Pitch. Energy Fuels 2003, 17, 907–913. [Google Scholar] [CrossRef]
- Twigg, A.N.; Taylor, R.; Marsh, K.M.; Marr, G. The Characterization of Coal Tar Pitches Used in Electrode Binder Manufacture by n.m.r. Spectroscopy. Fuel 1987, 66, 28–33. [Google Scholar] [CrossRef]
- Blanco, C.; Prada, V.; Santamaría, R.; Bermejo, J.; Menéndez, R. Pyrolysis Behaviour of Mesophase and Isotropic Phases Isolated from the Same Pitch. J. Anal. Appl. Pyrolysis 2002, 63, 251–265. [Google Scholar] [CrossRef]
- Manocha, L.M.; Patel, M.; Manocha, S.M.; Vix-Guterl, C.; Ehrburger, P. Carbon/Carbon Composites with Heat-Treated Pitches: I. Effect of Treatment in Air on the Physical Characteristics of Coal Tar Pitches and the Carbon Matrix Derived Therefrom. Carbon N. Y. 2001, 39, 663–671. [Google Scholar] [CrossRef]


| Sample | Softening Point (°C) | Q.I. (wt%) | T.I. (wt%) | Coking Value (wt%) | Ash Content (wt%) | Moisture Content (wt%) |
|---|---|---|---|---|---|---|
| K174 | 174 | 8 | 20 | 48 | 0.1 | 0.1 |
| Synpitch | 120 | 2.8 | 30.9 | 51.7 | 0.2 | 0.1 |
| Compound Class | Aromatic/Aliphatic | Pericondensed/Catacondensed | Bridge/Methyl |
|---|---|---|---|
| K174 | 0.97 | 6.3 | 0.76 |
| Synpitch | 0.86 | 13.4 | 0.89 |
| Lattice Parameter|Compound | GR-K174 | GR-Synpitch |
|---|---|---|
| d002 [Å] | 3.37 | 3.37 |
| Lc (using 002) [nm] | 24.08 | 37.01 |
| La (using 100) [nm] | 38.79 | 55.80 |
| La (using 110) [nm] | 72.02 | 114.97 |
Disclaimer/Publisher’s Note: The statements, opinions and data contained in all publications are solely those of the individual author(s) and contributor(s) and not of MDPI and/or the editor(s). MDPI and/or the editor(s) disclaim responsibility for any injury to people or property resulting from any ideas, methods, instructions or products referred to in the content. |
© 2023 by the authors. Licensee MDPI, Basel, Switzerland. This article is an open access article distributed under the terms and conditions of the Creative Commons Attribution (CC BY) license (https://creativecommons.org/licenses/by/4.0/).
Share and Cite
Gharpure, A.; Vander Wal, R.L.; Pisupati, S. Synthetic Pitch from Solvent Extraction of Coal as a Source for High-Quality Graphite. C 2023, 9, 56. https://doi.org/10.3390/c9020056
Gharpure A, Vander Wal RL, Pisupati S. Synthetic Pitch from Solvent Extraction of Coal as a Source for High-Quality Graphite. C. 2023; 9(2):56. https://doi.org/10.3390/c9020056
Chicago/Turabian StyleGharpure, Akshay, Randy L. Vander Wal, and Sarma Pisupati. 2023. "Synthetic Pitch from Solvent Extraction of Coal as a Source for High-Quality Graphite" C 9, no. 2: 56. https://doi.org/10.3390/c9020056