Article

Temperature- and Pressure-Reducing Regimes in the Growth Cell of HPHT Diamonds, Optimal for Preserving Crystal Integrity after Growth Completion

by
Nikolay I. Alekseyev
1,*,
Anton P. Broyko
1,
Ivan K. Khmelnitskiy
1,
Alexander V. Kolyadin
2,
Vagarshak M. Aivazyan
1 and
Ivan V. Oreshko
1
1
Department of Micro- and Nanoelectronics, Faculty of Electronics, Saint Petersburg Electrotechnical University “LETI”, 197022 Saint Petersburg, Russia
2
LLC “NPK “Almaz”, 197706 Saint Petersburg, Russia
*
Author to whom correspondence should be addressed.
Submission received: 5 April 2023 / Revised: 11 May 2023 / Accepted: 15 May 2023 / Published: 18 May 2023
(This article belongs to the Special Issue Advanced in Low Dimensional Carbon: Processing and Applications)

Abstract

:
With its exceptional strength characteristics, diamond has some mechanical drawbacks, significant brittleness being among them. In particular, some HPHT-grown diamonds crack when the extreme parameters inherent to the diamond growth process gradually decrease. The cracking is caused by excessive stress due to the poor plastic properties of the diamond growth catalytic medium at certain stages of reducing the pressure and the temperature. An insulating container with the growth cell and heating circuit fragment inside can also make a significant contribution to the probability of cracking. This paper considers the possibility of minimizing the mechanical stress in the growth cell and, consequently, in the diamond crystal by choosing the optimal trajectory for the decrease in the pressure and temperature from diamond growth conditions to normal conditions.

1. Introduction and Objectives

At present, diamond electronics is a rapidly progressing branch of power and microwave electronics [1,2,3]. Traditional methods of synthetic diamond production (chemical vapor deposition (CVD) and high-pressure–high-temperature (HPHT) synthesis), as well as non-traditional methods [4,5,6], are being developed in parallel. This work is related to a particular but important problem, existing within the framework of well-explored HPHT technology—the problem of diamond preservation in the course of reducing the extreme conditions of the diamond synthesis (pressure above 5 GPa, temperature around 1750–1850 K). Experience shows that during this reduction, a part of diamonds gets cracked, which causes the loss of marketable quality of a considerable part of diamonds. The morphology of the cracks is varied, with cracks observed in both vertical and horizontal directions, and not necessarily coinciding with the cleavage fracturing planes.
The diamond cracking problem is relevant because HPHT technology, which can provide high pressure in much larger growth cells than before—over 50 × 50 × 50 mm (if we talk about cubic cells)—and obtain diamonds of tens of carats in size, is rapidly progressing. Herewith, proven technological solutions may come into conflict with the task of preserving the diamonds that have been grown.
In particular, an important element of the HPHT technology is the use of pyrophyllite (or lithographic stone) as a medium material for pressure transfer to the growth cell from the anvils and effective thermal insulation at the same time [7]. This material is unique in that it converts to a viscous liquid when subjected to ultrahigh pressure. However, pyrophyllite is characterized by a complete loss of plastic properties when it is exposed to HPHT conditions for many hours. Another problem may be the occurrence of significantly larger temperature gradients inside large cells than in small cells.
The analysis of this problem is complicated by the fact that the composition and plastic properties of the catalytic medium that ensure diamond growth are not known with any certainty. Moreover, there is no possibility to diagnose the integrity of the diamonds before normal conditions are reached. In our paper, the properties of the medium are supposed to be analogous with those of cast iron.
This paper is devoted to finding the optimal conditions that would provide the lowest mechanical stress upon both the catalytic medium and the container in a complex non-stationary process of reducing the extreme parameters p,T which exist during the diamond growth.
Thus, the objectives of this work can be formulated as follows:
  • To estimate the importance of mechanisms that pose a potential danger to the destruction of diamonds when reducing the extreme conditions that allow their growth;
  • To suggest a trajectory for reducing the parameters (p,T) and their reduction rates in different sections of the trajectory;
  • To evaluate the compatibility of requirements for the reduction trajectories from different diamond destruction mechanisms in case these requirements are contradictory;
  • To compare the obtained recommendations with statistical regularities of diamond preservation or their cracking observed in practice.

2. Materials and Methods: The Pyrophyllite Container and the Diamond Growth Cell in the Simulated Technology

The specific conditions and parameters of the simulated diamond production technology were as follows: the cubic growth cell side in the HPHT process with cubic presses was approximately 50 mm; and the operating pressure and temperature were 5.5–6 GPa and 1750–1800 K, respectively [8]. These growth conditions are quite standard in the production developed by the research and production company “Almaz” in Sestroretsk, Russia.
A schematic of the pyrophyllite container with the diamond growth cell inside is shown in Figure 1.
During the synthesis, the container is pressured by carbide anvils (not shown in Figure 1) with a pressure pad size of 50–60 mm and height of 150–170 mm. In addition to the growth cell, the pyrophyllite container has dolomite gaskets for thermal insulation, a heating circuit of thermally expanded graphite, steel electrodes, a double shell of magnesium oxide MgO and steel containing the growth volume inside.
The schematic of the cubic growth cell and partially of the surrounding reinforcement, shown in Figure 1, is quite standard. Other variants of the geometry and of the arrangement of insulating gaskets around the cell [9,10,11,12,13] differ only in the size and material of the gaskets, which is not essential for our consideration.

3. Model and Results

3.1. Difference in Thermal Expansion Coefficient between Diamond and Catalyst as a Reason for Stresses Generated in Diamond

An evident and, in a sense, trivial cause of diamond cracking is a difference in the thermal expansion coefficient (TEC) between the diamond αdiam and the solid metallic catalyst α
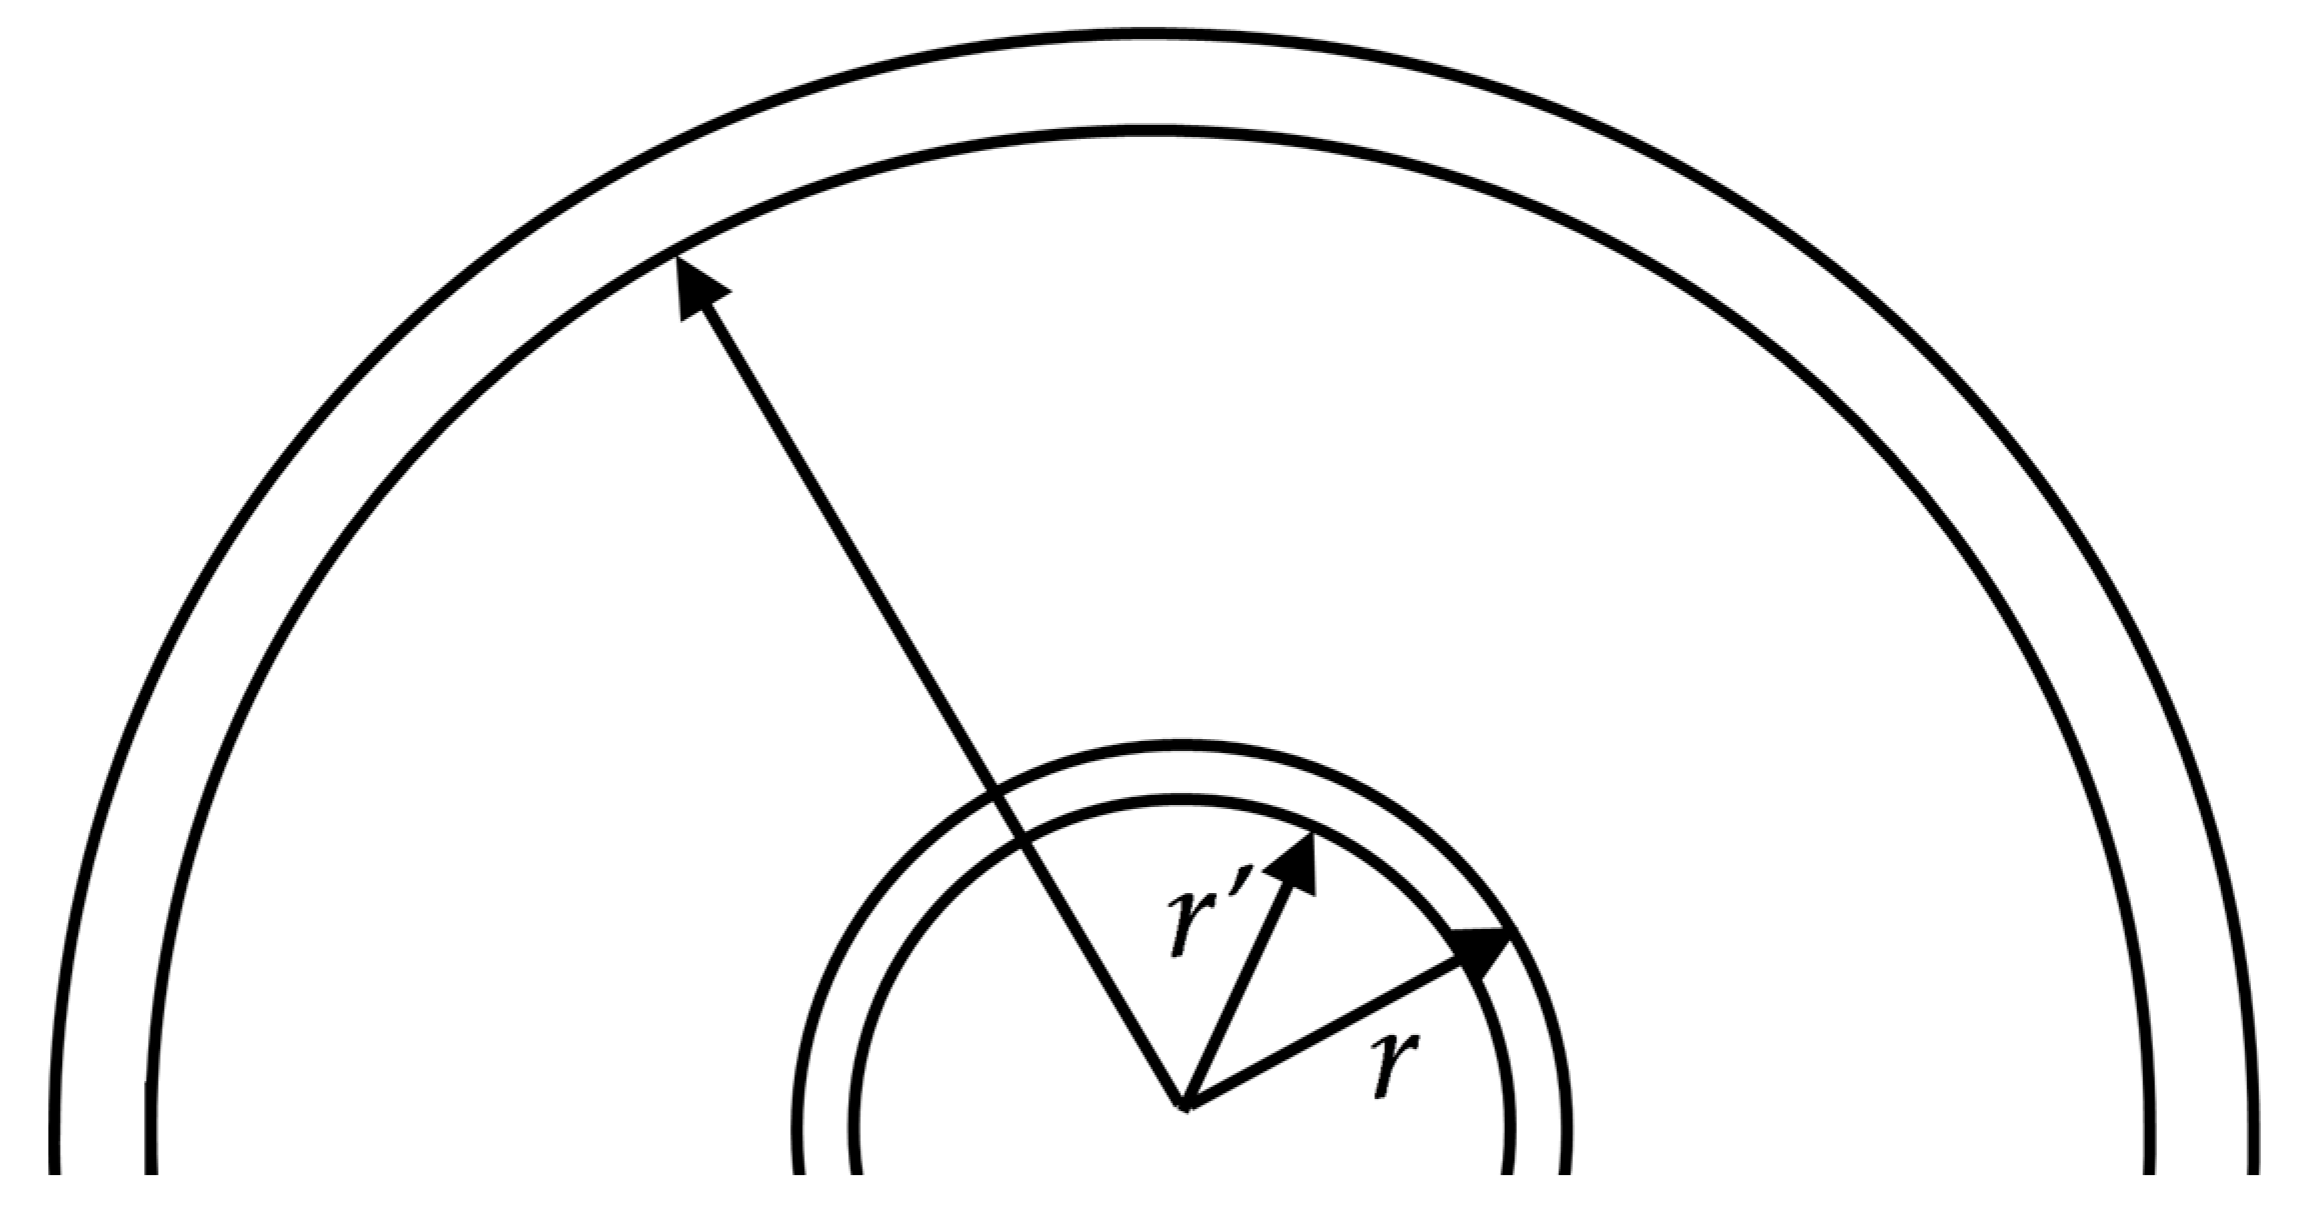
cat. It is easily accounted for in a simple model of a rigid spherical diamond core and a spherical catalyst shell enclosing it. In the absence of such a core, the cooled hollow-ball-shaped catalyst, initially without mechanical stresses and external pressure, reduces its inner radius from a value of r (equal to the original diamond radius) to a smaller value r′ = r∙(1 − αcatδT), where δT is the temperature decrease (Figure 2).
As the rigid diamond core has a smaller TEC, this value is even smaller:  r < r , such that the stress tensor component σrr in the catalyst along the shell–diamond contact contour is approximately  E ^ cat ( r r ( 1 α cat δ T ) ) , where  E ^ cat  is the effective Young’s modulus of the catalyst. This takes into account the simultaneous tangential stretch of the catalytic shell and includes the Poisson factor.
By equating the radial component of the catalyst stress tensor σρρ with a similar value for the diamond, we obtain  E ^ cat ( r r ( 1 α cat δ T ) ) = E ^ diam ( r ( 1 α diam δ T ) r ) . Finding r″ from here, one comes to the relationship
( σ ρ ρ ) r = r = E ^ diam ( r r ) = E ^ cat E ^ diam ( α cat α diam ) E ^ cat + E ^ diam δ T E ^ cat ( α cat α diam ) δ T
(The last equality in this relationship takes into account that Ediam = 1100 GPa >> Ecat = 200–300 GPa). Since the difference between the TEC of the diamond and of the catalyst has the order of the TECs themselves, i.e., 10−6, the radial stress should not exceed 1–10 MPa if the temperature decreases even by 103 K. The same applies to the tangential stress. Therefore, the difference between the TECs of the diamond and of the shell can hardly be considered a probable cause of the cracking of the diamonds and other causes should be analyzed.

3.2. Basic Concepts of Plasticity Theory in the Model under Consideration

Based on the loss of mass of the graphite substance, which is the carbon source in diamond growth, it is easy to estimate the carbon content in the substance initially forming a pure metallic catalyst. It is not less than 5–10%. Therefore, we conventionally correlate this catalyst with cast iron, especially since it completely loses its catalytic role at the stage of reducing the parameters p and T.
The diamond growth conditions (the pressure of 5.5 GPa and the temperature of 1750–1800 K) are close to the liquid–solid-phase equilibrium curve for iron and transition metals of the iron group (nickel–cobalt, following the book [14]). Because of this circumstance and the fact that the composition and morphology of the catalyst are not reliably known, we consider the initial point of the descent trajectory in the p,T diagram as a solid phase of the catalyst and compare it with the phase diagram in the p,T axes constructed for pure iron.
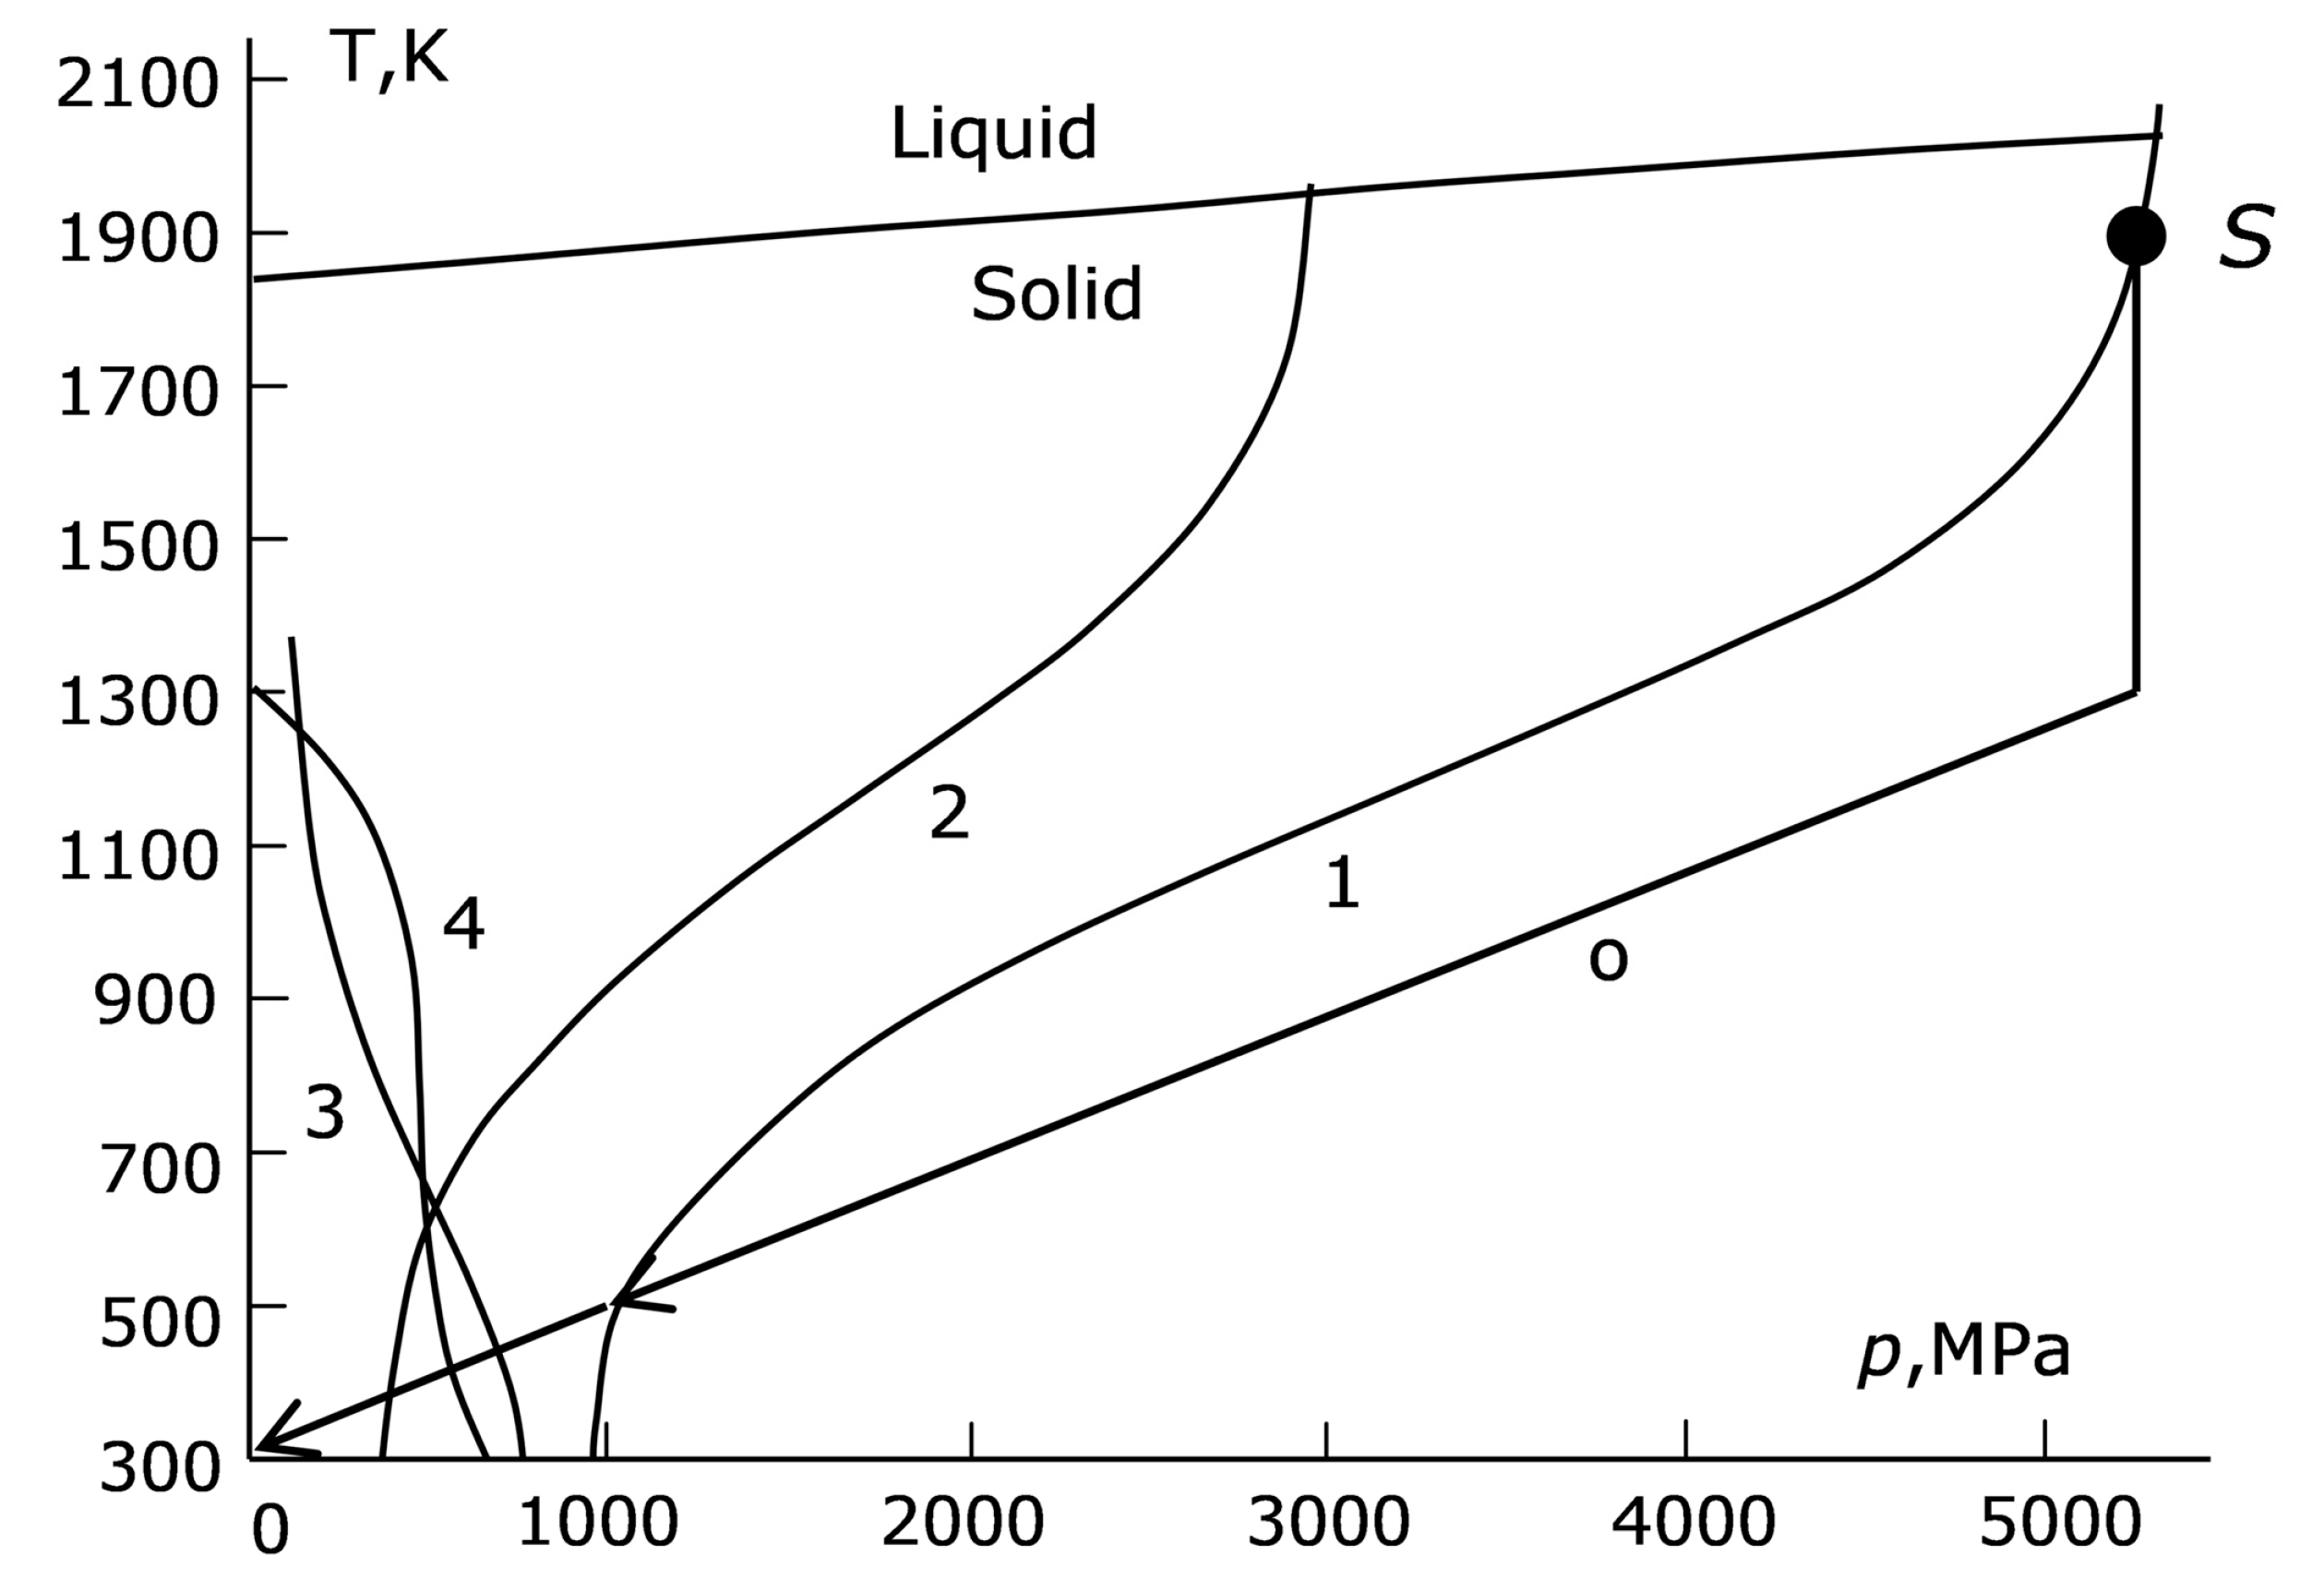
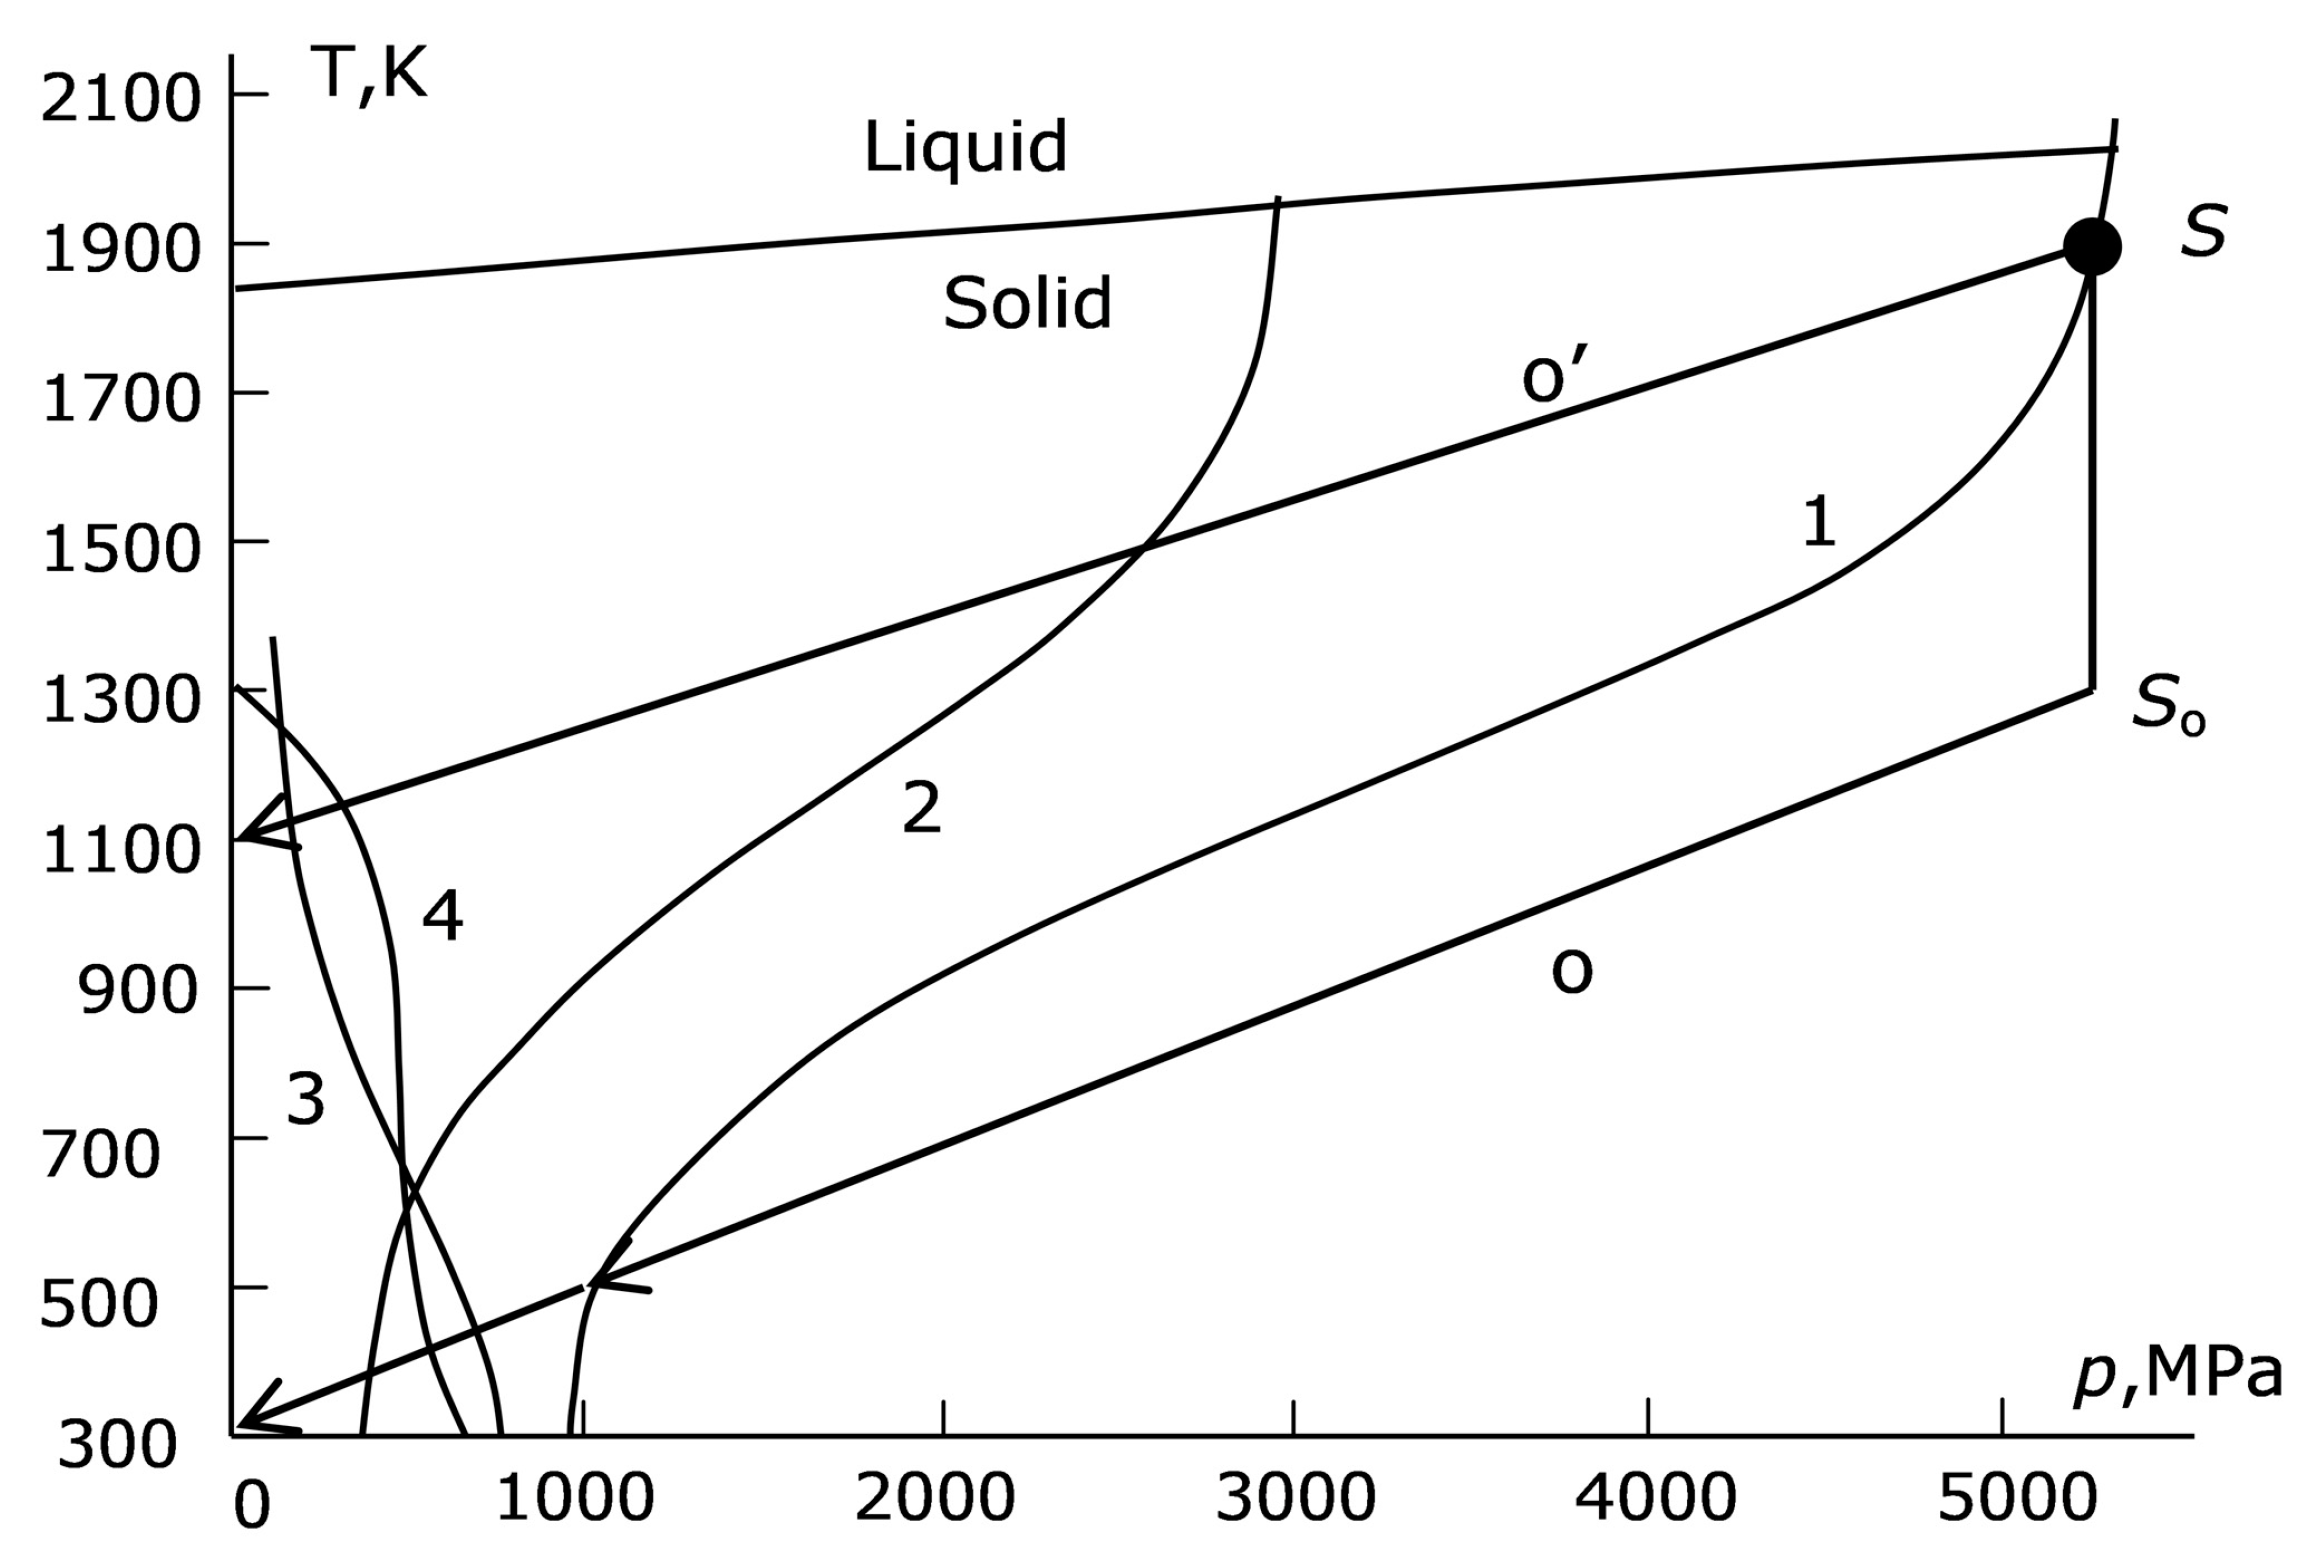
As the pressure and the temperature decrease from the diamond growth conditions (the bold black dot S in the upper right corner of Figure 3) to the normal conditions, we enter the region corresponding to a strongly plastic state. To evaluate this region, we can proceed from S.N. Zhurkov’s theory determining the effective time τrelax of plastic deformation or plastic fracture, or crack formation [15], as
τ relax = τ 0 exp ( U 0 γ σ ( p , T ) k B T ) ,
where σ is some generalized stress in the system; (U0, γ) is a pair of parameters corresponding to one of the above processes; and γ is called the activation volume. When describing plastic deformation, it is considered that the energy parameter U0 is close to 2/3 of the vaporization energy, and “bare” time τ0 is close to the inverse frequency of atomic vibrations in the lattice, i.e., 10−13 s.
The activation barrier  U 0 γ σ ( p , T )  in (1) is proportional to the stress  σ ( p , T ) . At the Zhurkov stress limit  σ Zh = U 0 / γ , this barrier turns to zero. If the value σZh is identified with the plasticity onset limit of the catalyst material σT(p,T) (considered to be known), one can draw a curve on the (p,T) plane (curve 1, Figure 3). To the right of this curve, the plastic state is established instantly, and the material is as plastic as it can be. Let us discuss the values of σZh and σT which can be used when drawing curve 1.
The value of σZh is known with sufficient accuracy only for a small number of metals. So, in [15], the values of U0 = 3.8, 4.4, 3.6, and 5.7 eV are suggested for Ni, Fe, Cu, and Pt, respectively. The values of γ for Ni, Cu, and Pt are 0.7, 1.6, and 5.2 nm3, such that σZh is 851.8, 354, and 1726 MPa for these metals, respectively. From indirect data for iron in the same paper, σZh = 865–880 MPa.
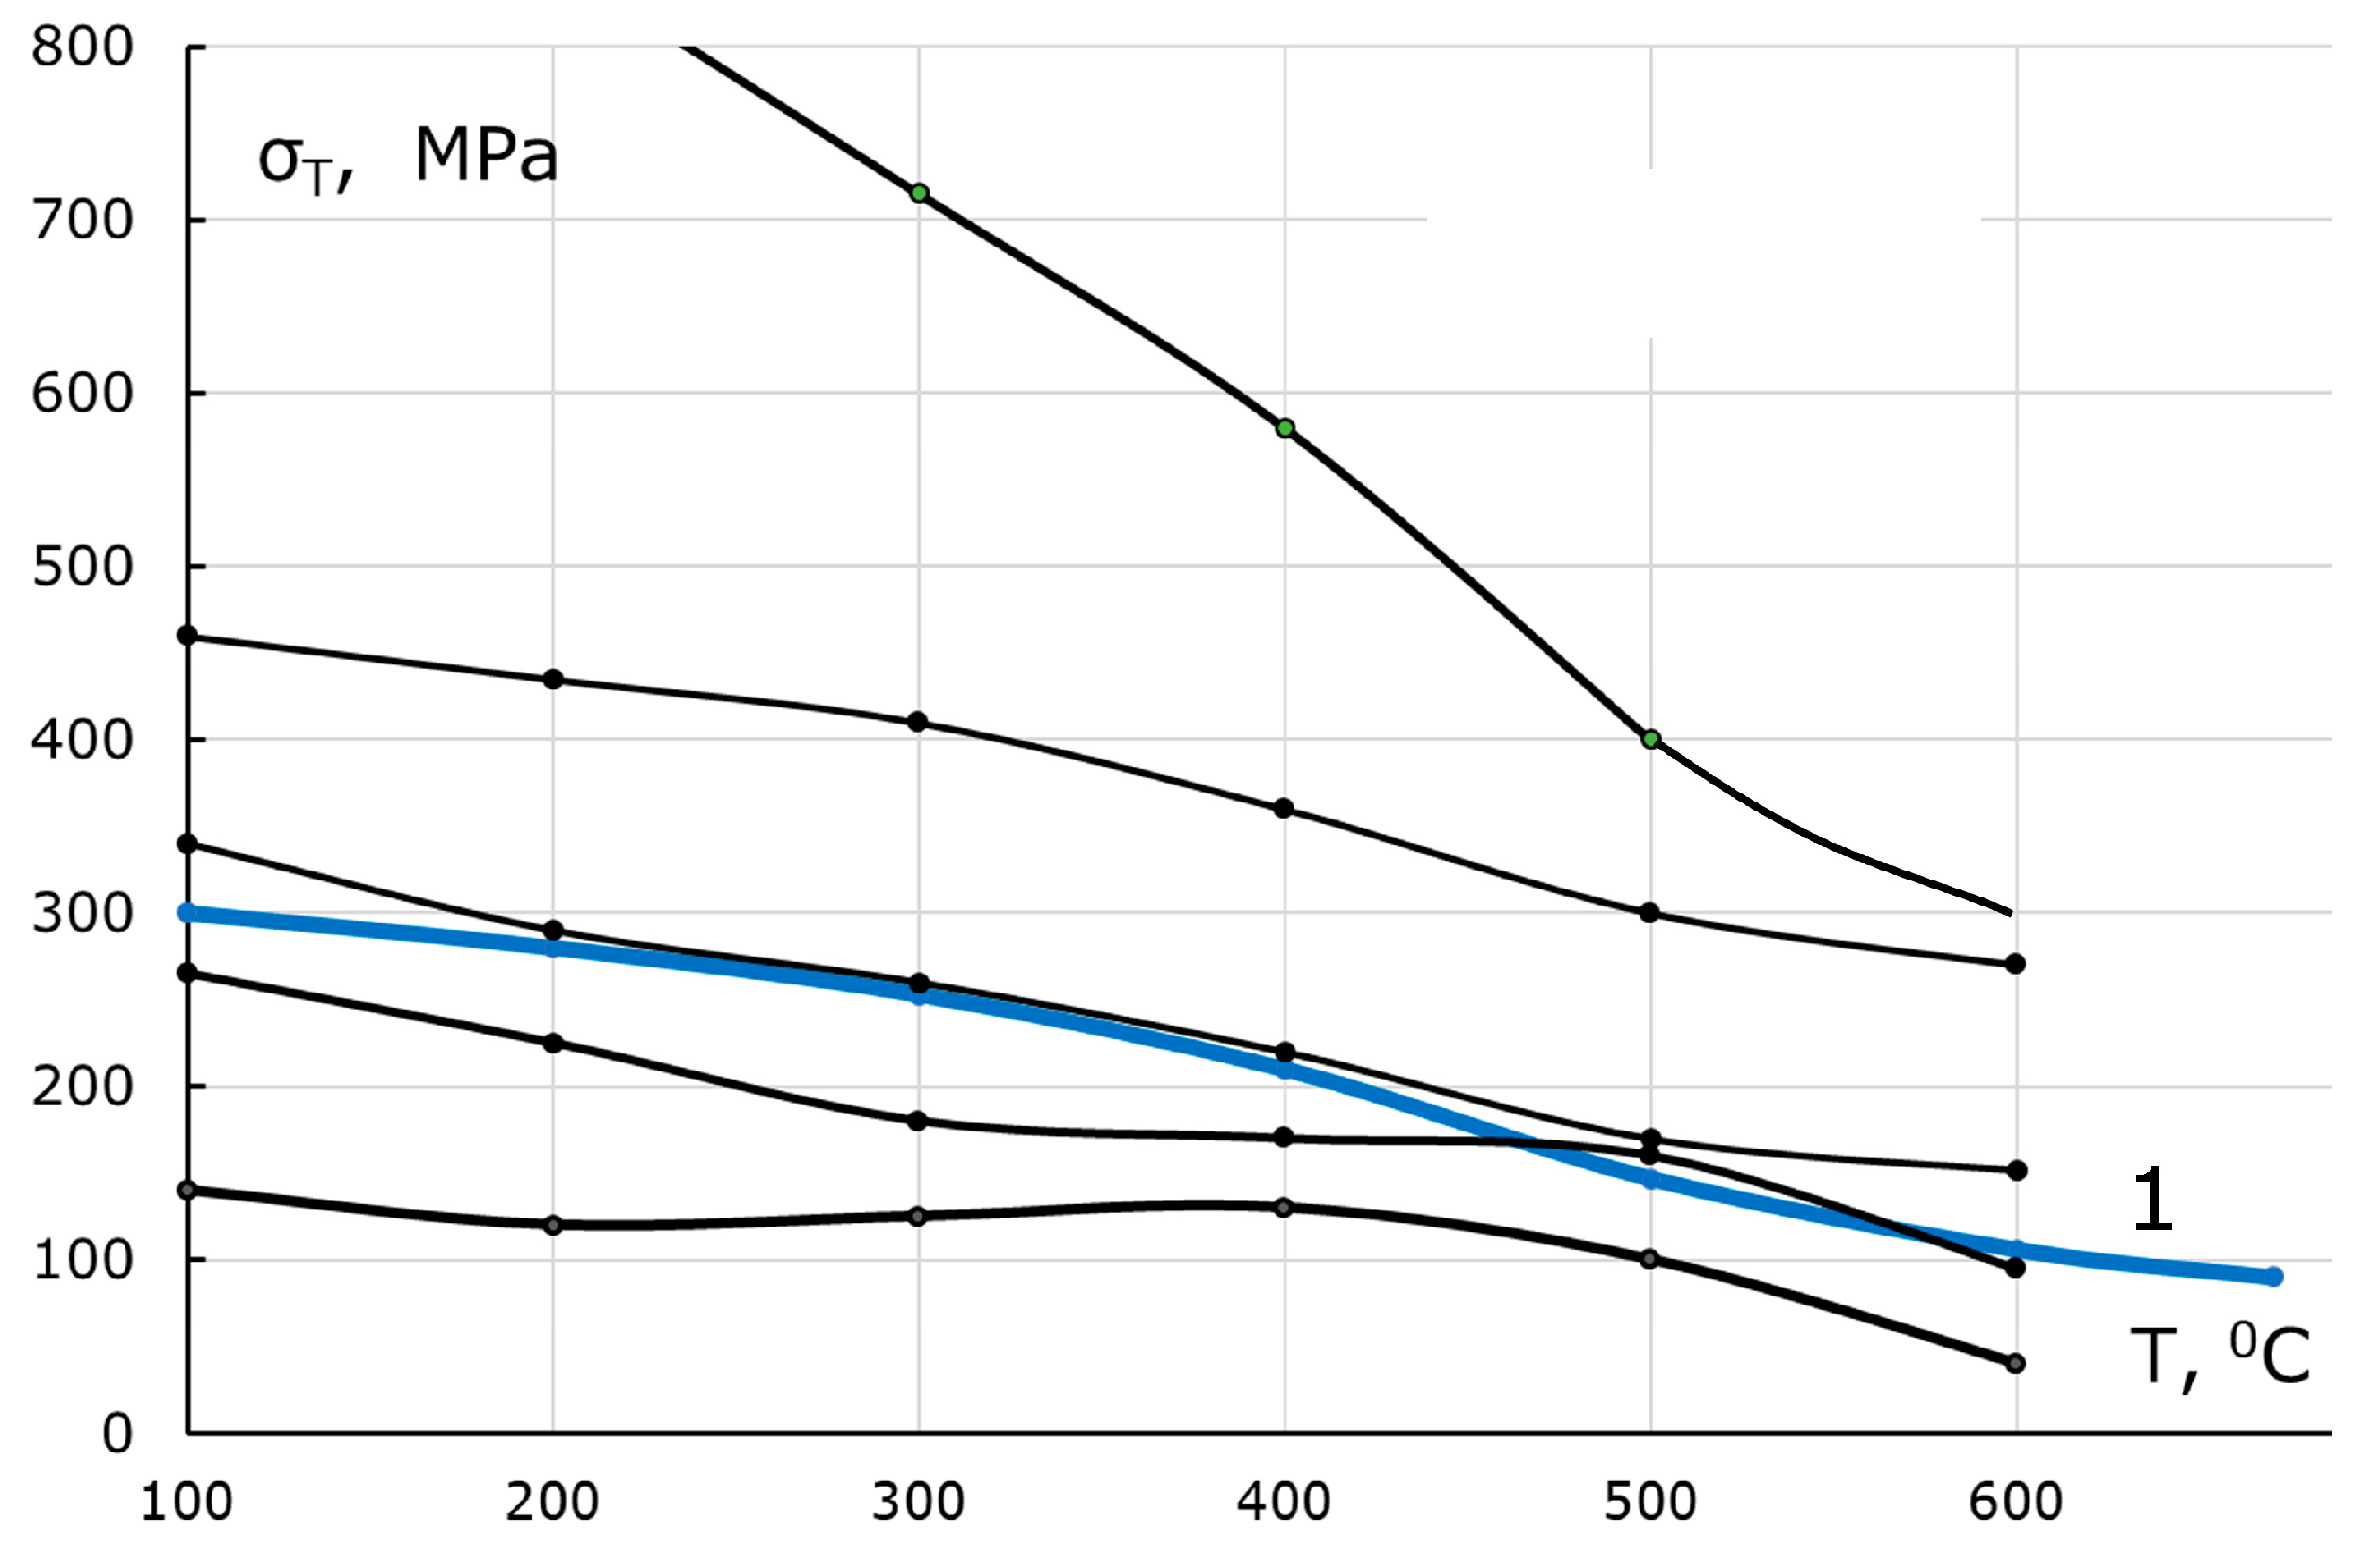
The initial information on the dependence σT(p,T), essential for drawing curve 1 in Figure 3, is rather scarce, though the parameter σT(T) at normal pressure is a quite standard characteristic both for cast irons and steels (Figure 4).
The dependences σT(T) in Figure 4 monotonically decrease. As a rule, they are known at temperatures up to 1000 K, which are practically interesting for structural materials. Focusing on obtaining qualitative conclusions and considering that the dependence σT(T) tends toward some constant value σT (p = pn = 1 atm, T) at temperatures up to 2000 K, we assume that
σ T ( p n , T ) = σ T ( p n , T ) + ( σ T ( p n , T n ) σ T ( p n , T ) ) E , E = exp ( ( T T n T 1 T n ) 2 ) ,
where T is a conditional “infinitely high” temperature.
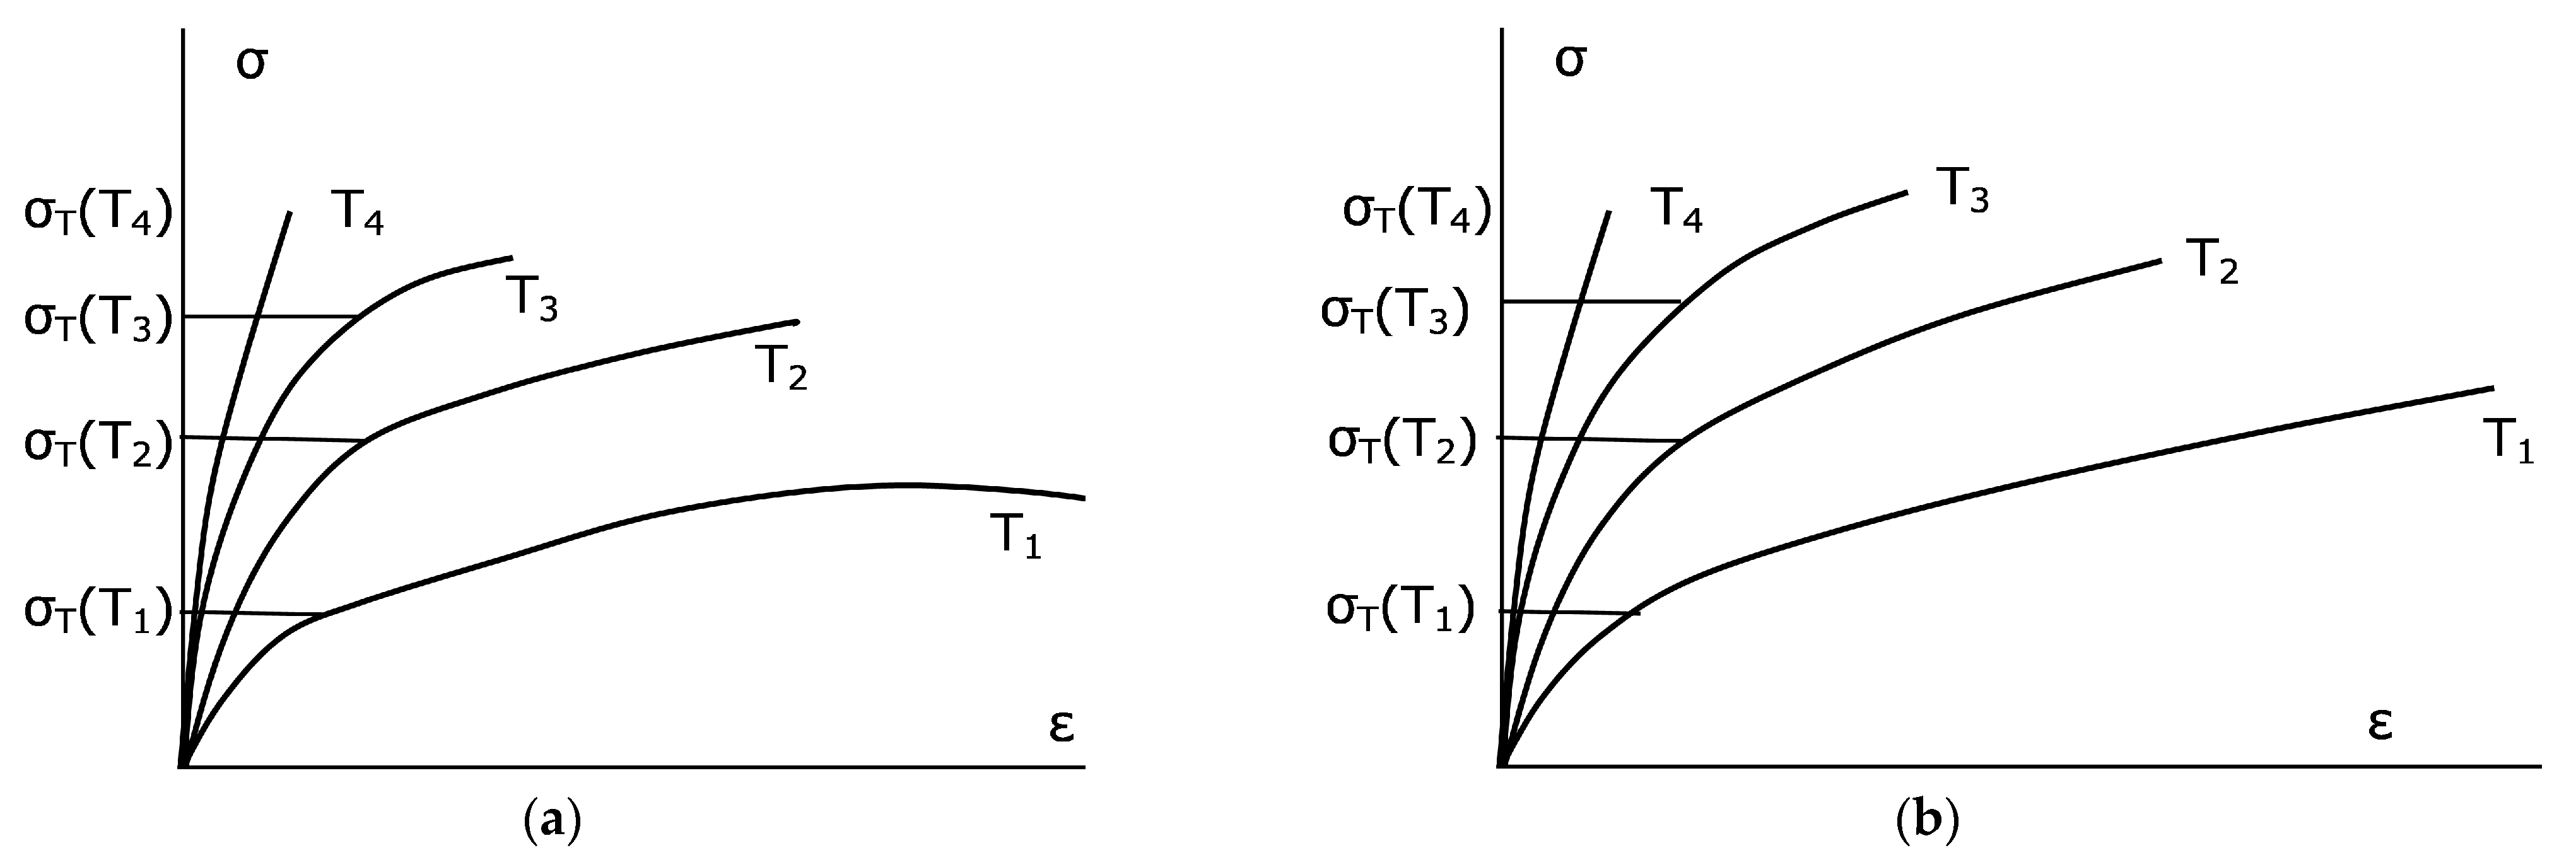
Formula (2) suggests that the plasticity onset limit decreases with the temperature growth to decrease “e” times at T. The fitting temperature T1 is assumed to be T1 = 980 K. As can be seen from a typical s-s diagram (strain ε-stress diagram, Figure 5), this formula does not contain all necessary information. Simultaneously to decreasing σT with temperature, there is an increase in the “plasticity plateau” of the strain ε, such that the dependence of plasticity on temperature is ambiguous.
Unfortunately, the known diagrams of cast irons similar to those shown in Figure 5 have been constructed only for tensile experiments with bars. It is difficult to predict on their basis the plastic medium behavior under the all-round compression of the growth cell complicated by rigid inclusions in the form of a diamond or a diamond group. It can be assumed then that the horizontal sections of the σ(ε) dependences are transformed into sloping ones (Figure 5b).
Therefore, we assumed that at temperatures considerably higher than room temperature Tn, the plasticity onset limit σT is sufficiently representative of the same value in all-round compression.
Other available information on the dependence σT(p,T) can be found in the dependence of σT (or of some proportional value such as activity or fracture limit) on pressure at normal temperature Tn. Such dependences have been plotted for some cast irons and steels in a number of works, information on which is collected in [16].
These curves look like straight (or nearly straight) lines brought to a pressure not exceeding 1 GPa. Their expression at normal temperature has the form
σ T ( p , T n ) = σ T ( p n , T n ) + ω n ( p p n ) ,
where the quantities σ and ω are accepted equal to σT(pn,Tn) = 300 MPa, ωn = 0.6 at T = Tn, and ω = 0.6 at T = T; the values of the both pressures and σT(p,Tn) are expressed in MPa. The limit of 1 GPa up to which the dependences (3) are known is obviously insufficient. However, it is known that P.W. Bridgman’s investigations of the mechanical properties of metals, glasses, and minerals [17,18], carried out in the 1930s–1940s, reached external pressures up to 30 thousand atm. A sharp increase in the plasticity of the materials was noted. Yet, the same source [16] suggests that all-round uniform pressure cannot increase the strength and the plasticity onset limit indefinitely. More specific data are not available.
On the other hand, the industrial hardening of steels in industry is conducted at pressures > 2.5 GPa. Ferrous iron, phosphor bronzes, beryllium, and marble are also hardened under such conditions. The pressure extrusion technology also uses pressures above 1 GPa and there is no information to suggest that after this processing the materials are easier to destroy.
The possibility of reducing plastic properties at ultrahigh pressures could be related to approaching the critical point (pcrit, Tcrit) of the melt-to-solid metal phase transition. The problem of whether such a point exists, above which the melt could not be hardened at any pressure (by analogy with liquid–vapor transitions), is relatively poorly investigated [19,20]. In the most recent work on this problem [21], the estimated critical pressure was not lower than 105–106 atm for alkali metals and lay in the range of 106–107 atm for transition metals of the iron group. This pressure is connected with approaching the region of relativistic electronic statistics when the Fermi energy of metal is comparable by the order of magnitude with mc2.
This pressure is much higher than the conditions of the conventional diamond anvil cell (DAS), not to mention the conditions of diamond synthesis.
Based on the above, the plasticity onset limit at “infinitely high temperature” (conventionally T = T) was chosen by analogy with that at room temperature in (3):
σ T ( p , T ) = σ T ( p n , T ) + ω ( p p n ) .
The relationship between the values of σT at room temperature and at T was assumed by
σ T ( p n , T ) = σ T ( p n , T n ) / exp ( 1 ) .
Taken together, the relationship  σ T ( p , T )  was given by combining Formulas (3)–(5):
σ T = σ n , + ω ( p p n ) + ( σ n , n σ n , + ( ω n ω ) ( p p n ) ) E ,
where the function E is introduced in (2).

3.3. Characteristic Curves of the Catalytic Metal on (p,T) Plane, along Which the Catalyst Properties Change Drastically

Let us now return to a qualitative discussion of the dependence
σ T ( p , T ) = σ Zh ,
i.e., of curve 1 (Figure 3). Note that the intersection of this curve with the liquid–solid interface curve at a pressure close to 5.5 GPa, i.e., at the diamond growth operating pressure in a particular technology, is rather random. In general, the start of the trajectory of reducing the p,T parameters does not necessarily lie at curve 1.
As mentioned above, the material is “superplastic” to the right of curve 1. To the left of curve 1, there is a region of activated plasticity, where the attainment of plasticity requires some finite time. If the plasticity properties are weakened on some trajectory of reducing the p,T parameters within this region, the excess stress over the plasticity onset limit at an earlier point in time may exceed the strength capabilities of the catalyst. In this case, the excess stress is transferred to the diamond, increasing the probability of its fracture.
To the left of the activated plasticity region, there is the elastic region. Its natural right boundary can be considered as the linearity limit σLin on the tensile stress curve. Given the lack of information, this limit was set in two ways.
The first way assumes a constancy of the ratio σLinT (e.g., σLinT = 0.6). For many cast irons, this assumption corresponds to reality and allows us to draw an analogue of curve 1 (Figure 3) with the substitution of σZh with 0.6σZh (curve 2, Figure 3):
0.6 σ Zh = σ T ( p , T ) .
Another way of setting the elastic region boundary assumes that in the elastic section of the s-s curve, the stress varies in proportion to the pressure and does not differ too much from it at the end of this section (curve 3 in Figure 3):
p = σ T ( p , T ) .
In addition to curves 2 and 3, the region of strongly activated plasticity was evaluated in yet another way. The parameters p,T were determined for the point at which the plasticity delay time τrelax in Formula (1) for the given dependence σT(p,T) reaches a preset value, e.g., one second (curve 4, Figure 3).
Curves 2 and 3 form a “gorge” with curve 1 in the region of low temperature and of comparatively low pressure (Figure 3), the crossing of this “gorge” being inevitable when the parameters p,T decrease. As the plastic properties of the catalyst reduce when approaching the linear region on the left edge of the “gorge”, the conditions here can be considered as extreme ones from the viewpoint of diamond preservation.
Until the “gorge” is reached, the optimal reduction trajectory should leave curve 1 to the left and top of itself. In this case, the catalyst instantly reaches the plastic state at each time moment and the diamond is subjected to the lowest probability of fracture.
So, the condition of not entering the activated plasticity region looks the simplest for the optimal trajectory of reducing the (p,T) parameters, but this condition may contradict other desirable conditions for diamond preservation. It is therefore necessary to understand which trajectories within this region expose the diamond to the greatest danger.
As it is most correct to compare the stress value not with the plasticity onset limit σT but with the fracture limit when assessing this danger, we considered that the fracture limit is related to σT by an unknown proportional multiplier. As a parameter characterizing the probability of the diamond fracture, we used initially the ratio
D = p σ T Θ ( p σ T 1 ) , σ T = σ T ( p ( t τ relax ) , T ( t τ relax ) )
of the instantaneous value of pressure and the plasticity onset limit at the earlier time t − τrelax, where θ(t) is the Heaviside theta function.
The introduction of the parameter D partially compensates for the paucity of information on the plastic properties of the catalytic material under complex deformation and allows one not to construct a numerical field of deformations and stresses for each point of the trajectory (
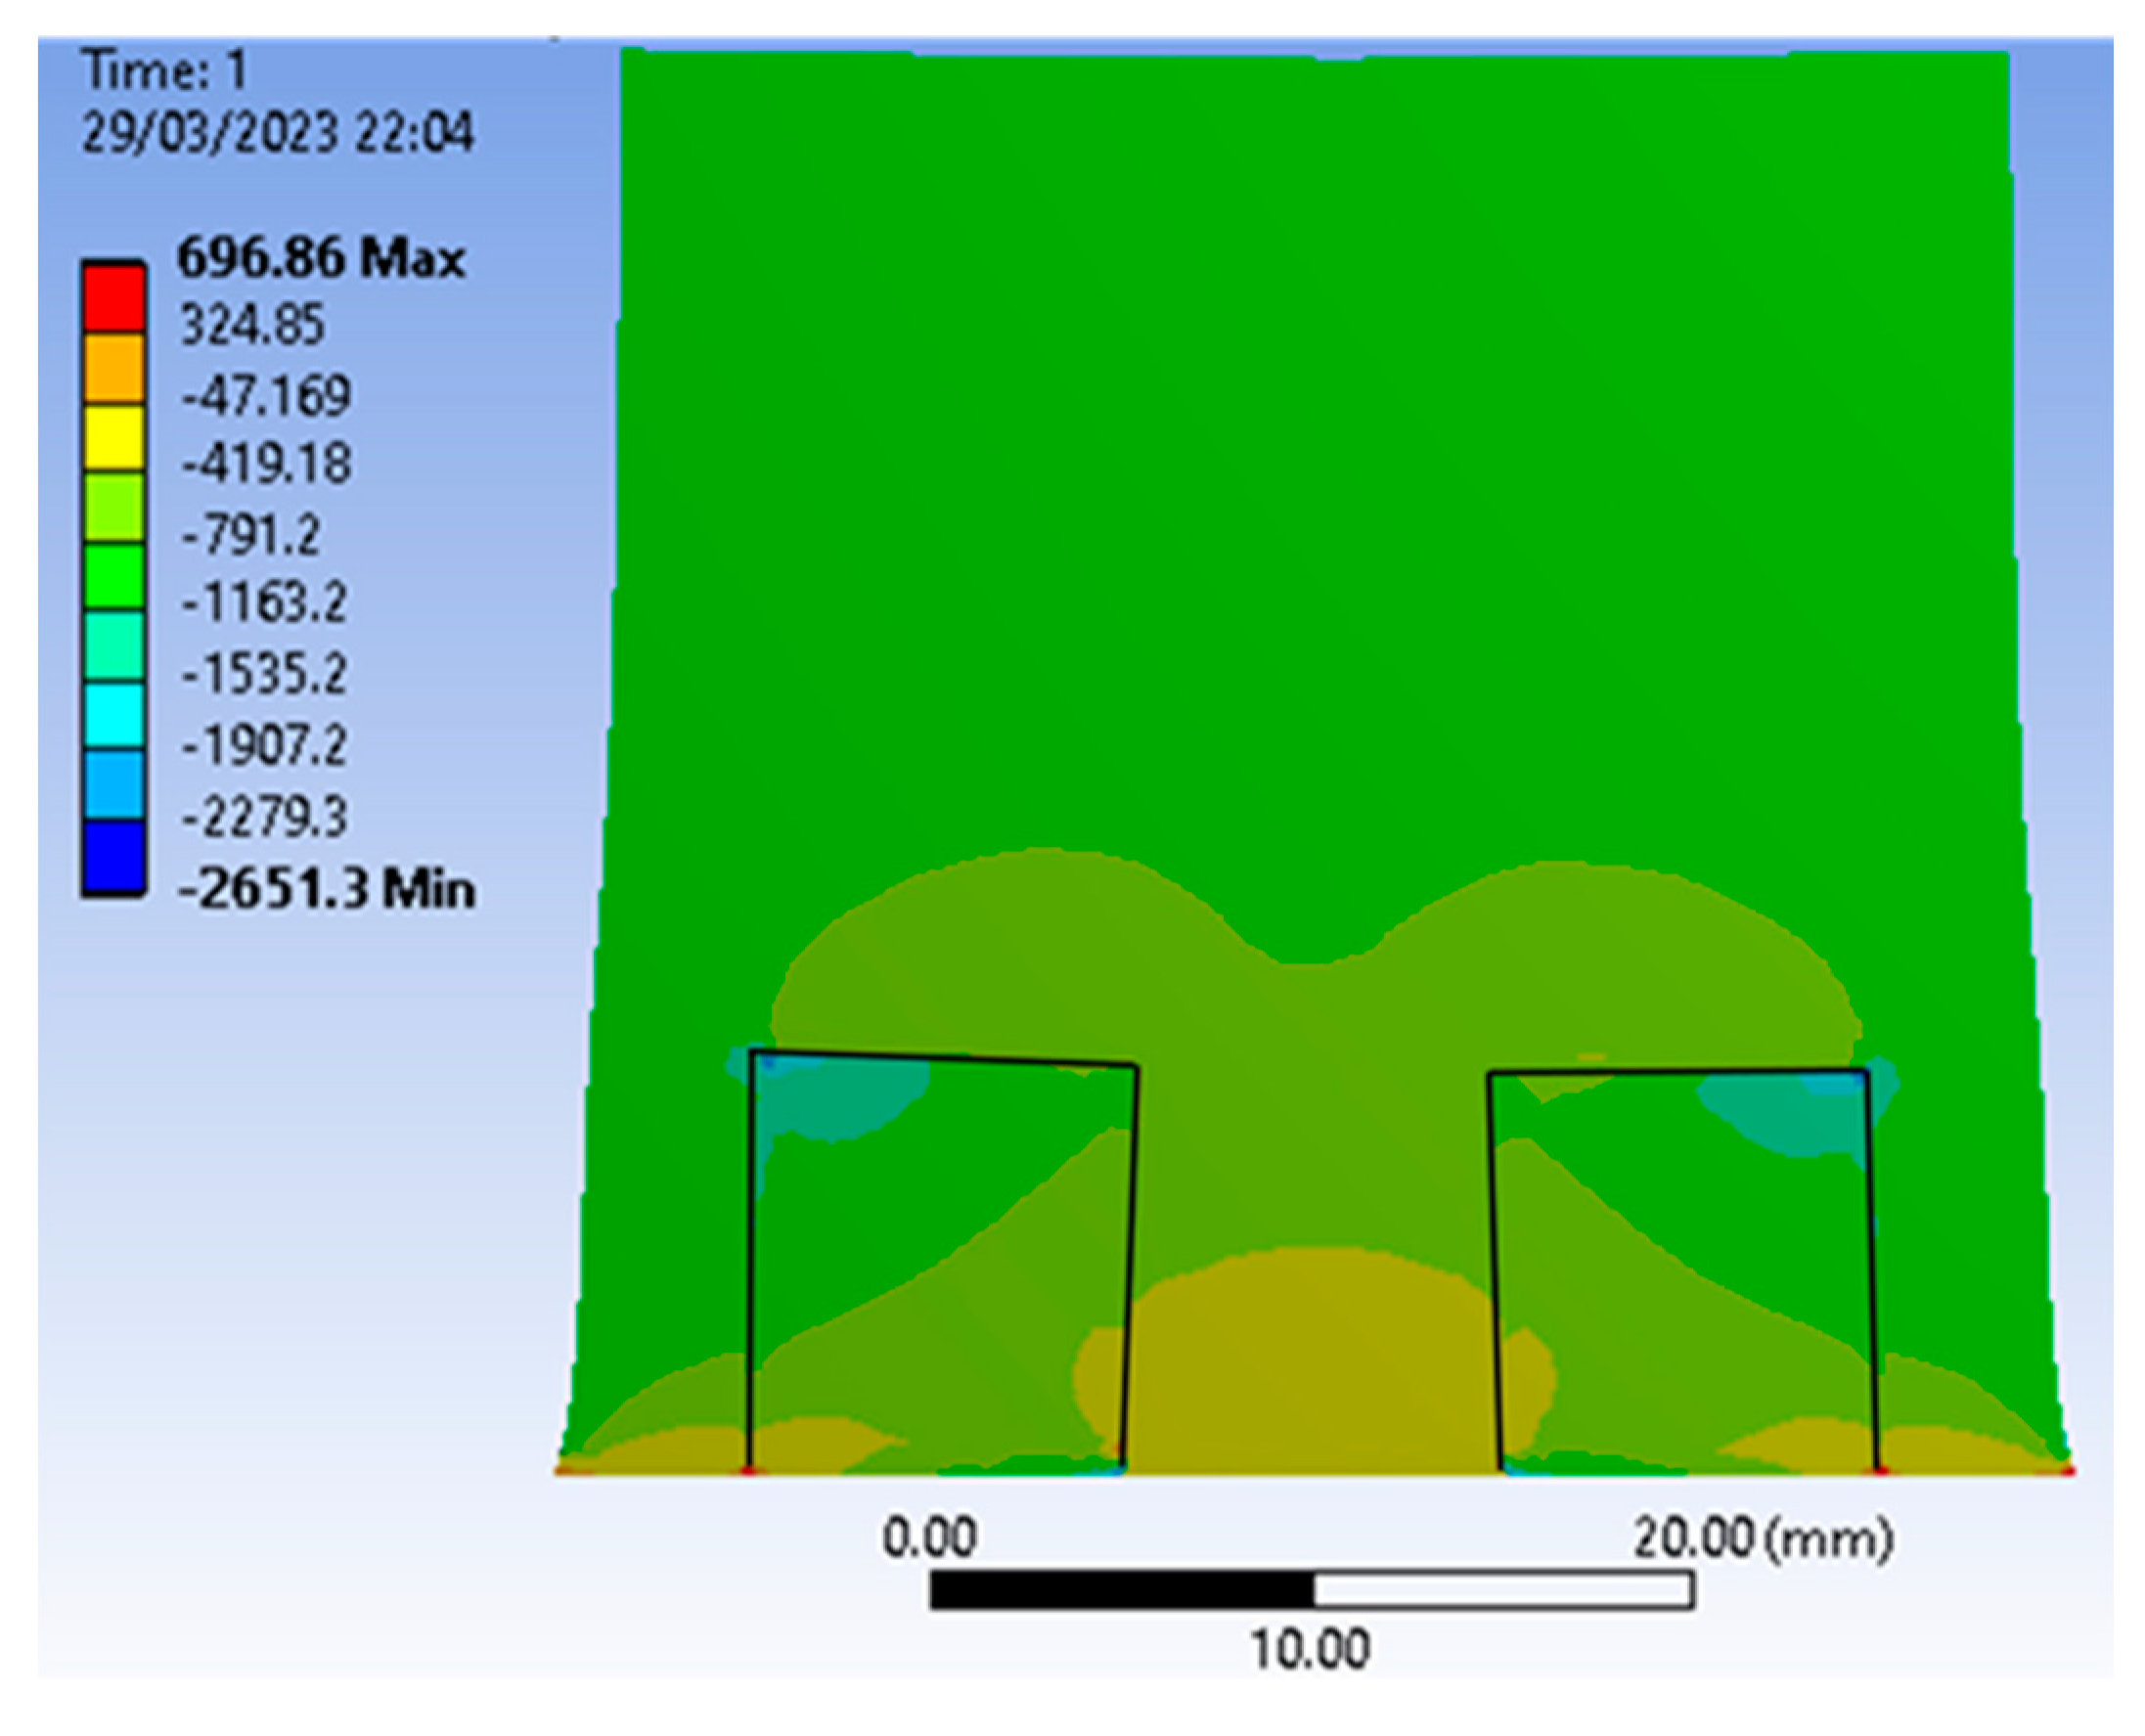
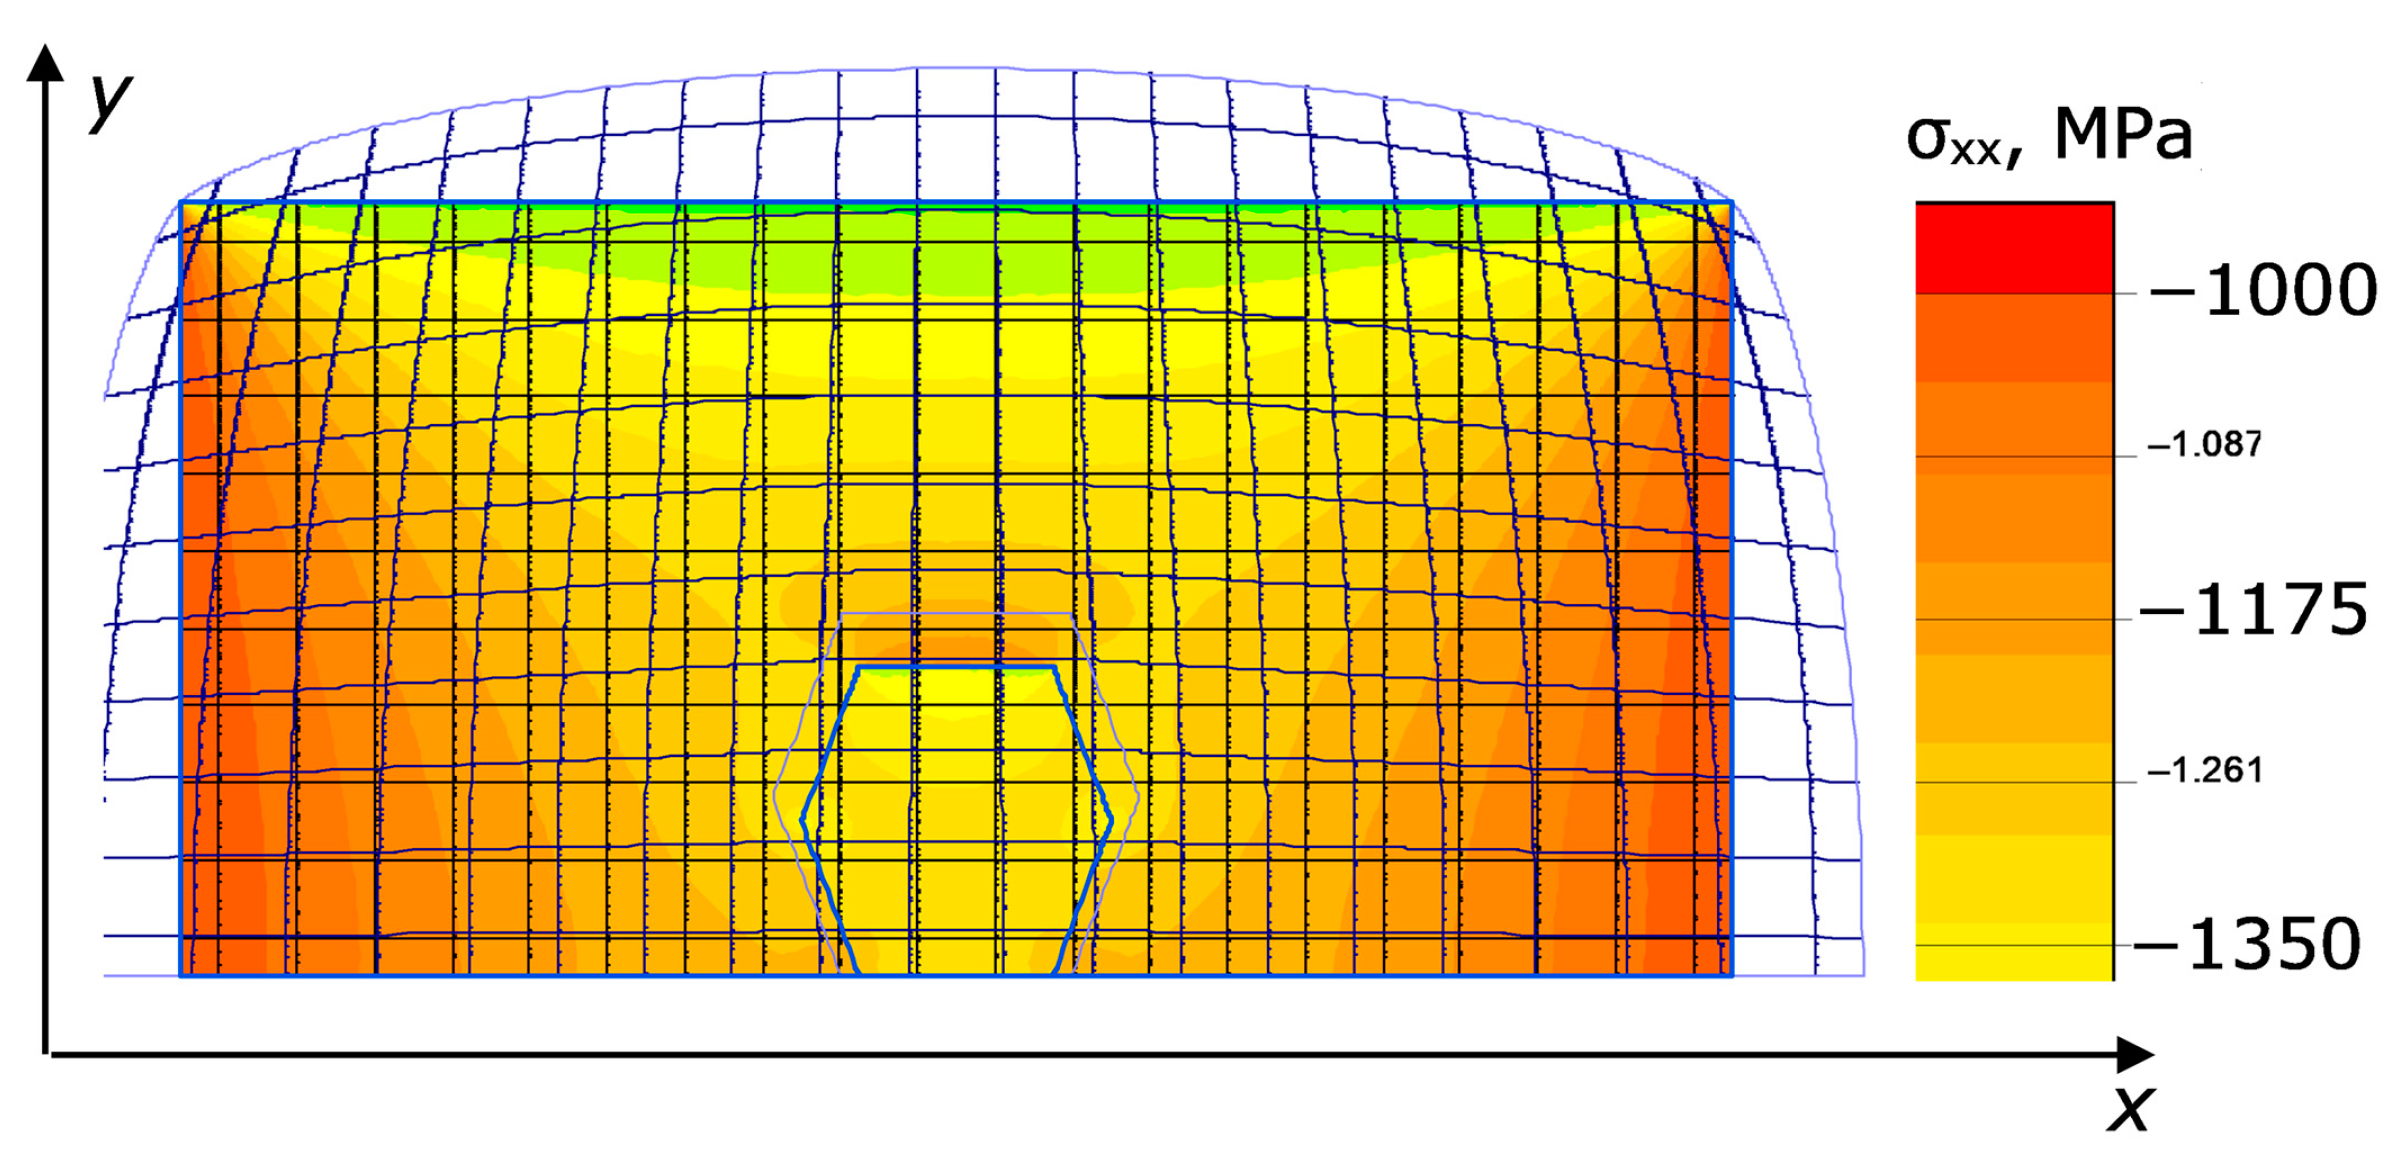
p,T) (such a field always describes an already established plasticity). An example of calculation of the stress field σxx in ANSYS 13 software (Static Structure) [22] in the 2D simulation framework is shown in Figure 6. The catalytic medium in the cell at an applied pressure of 1 GPa was assumed to be close to a perfectly plastic medium [23].
It is clearly seen that the stress level is notably reduced in the area between the diamonds, partially shielded from external pressure. On the contrary, inside the diamonds the stress increases on the sides facing the sides of the container. In general, this stress is distributed rather unevenly across the diamond.
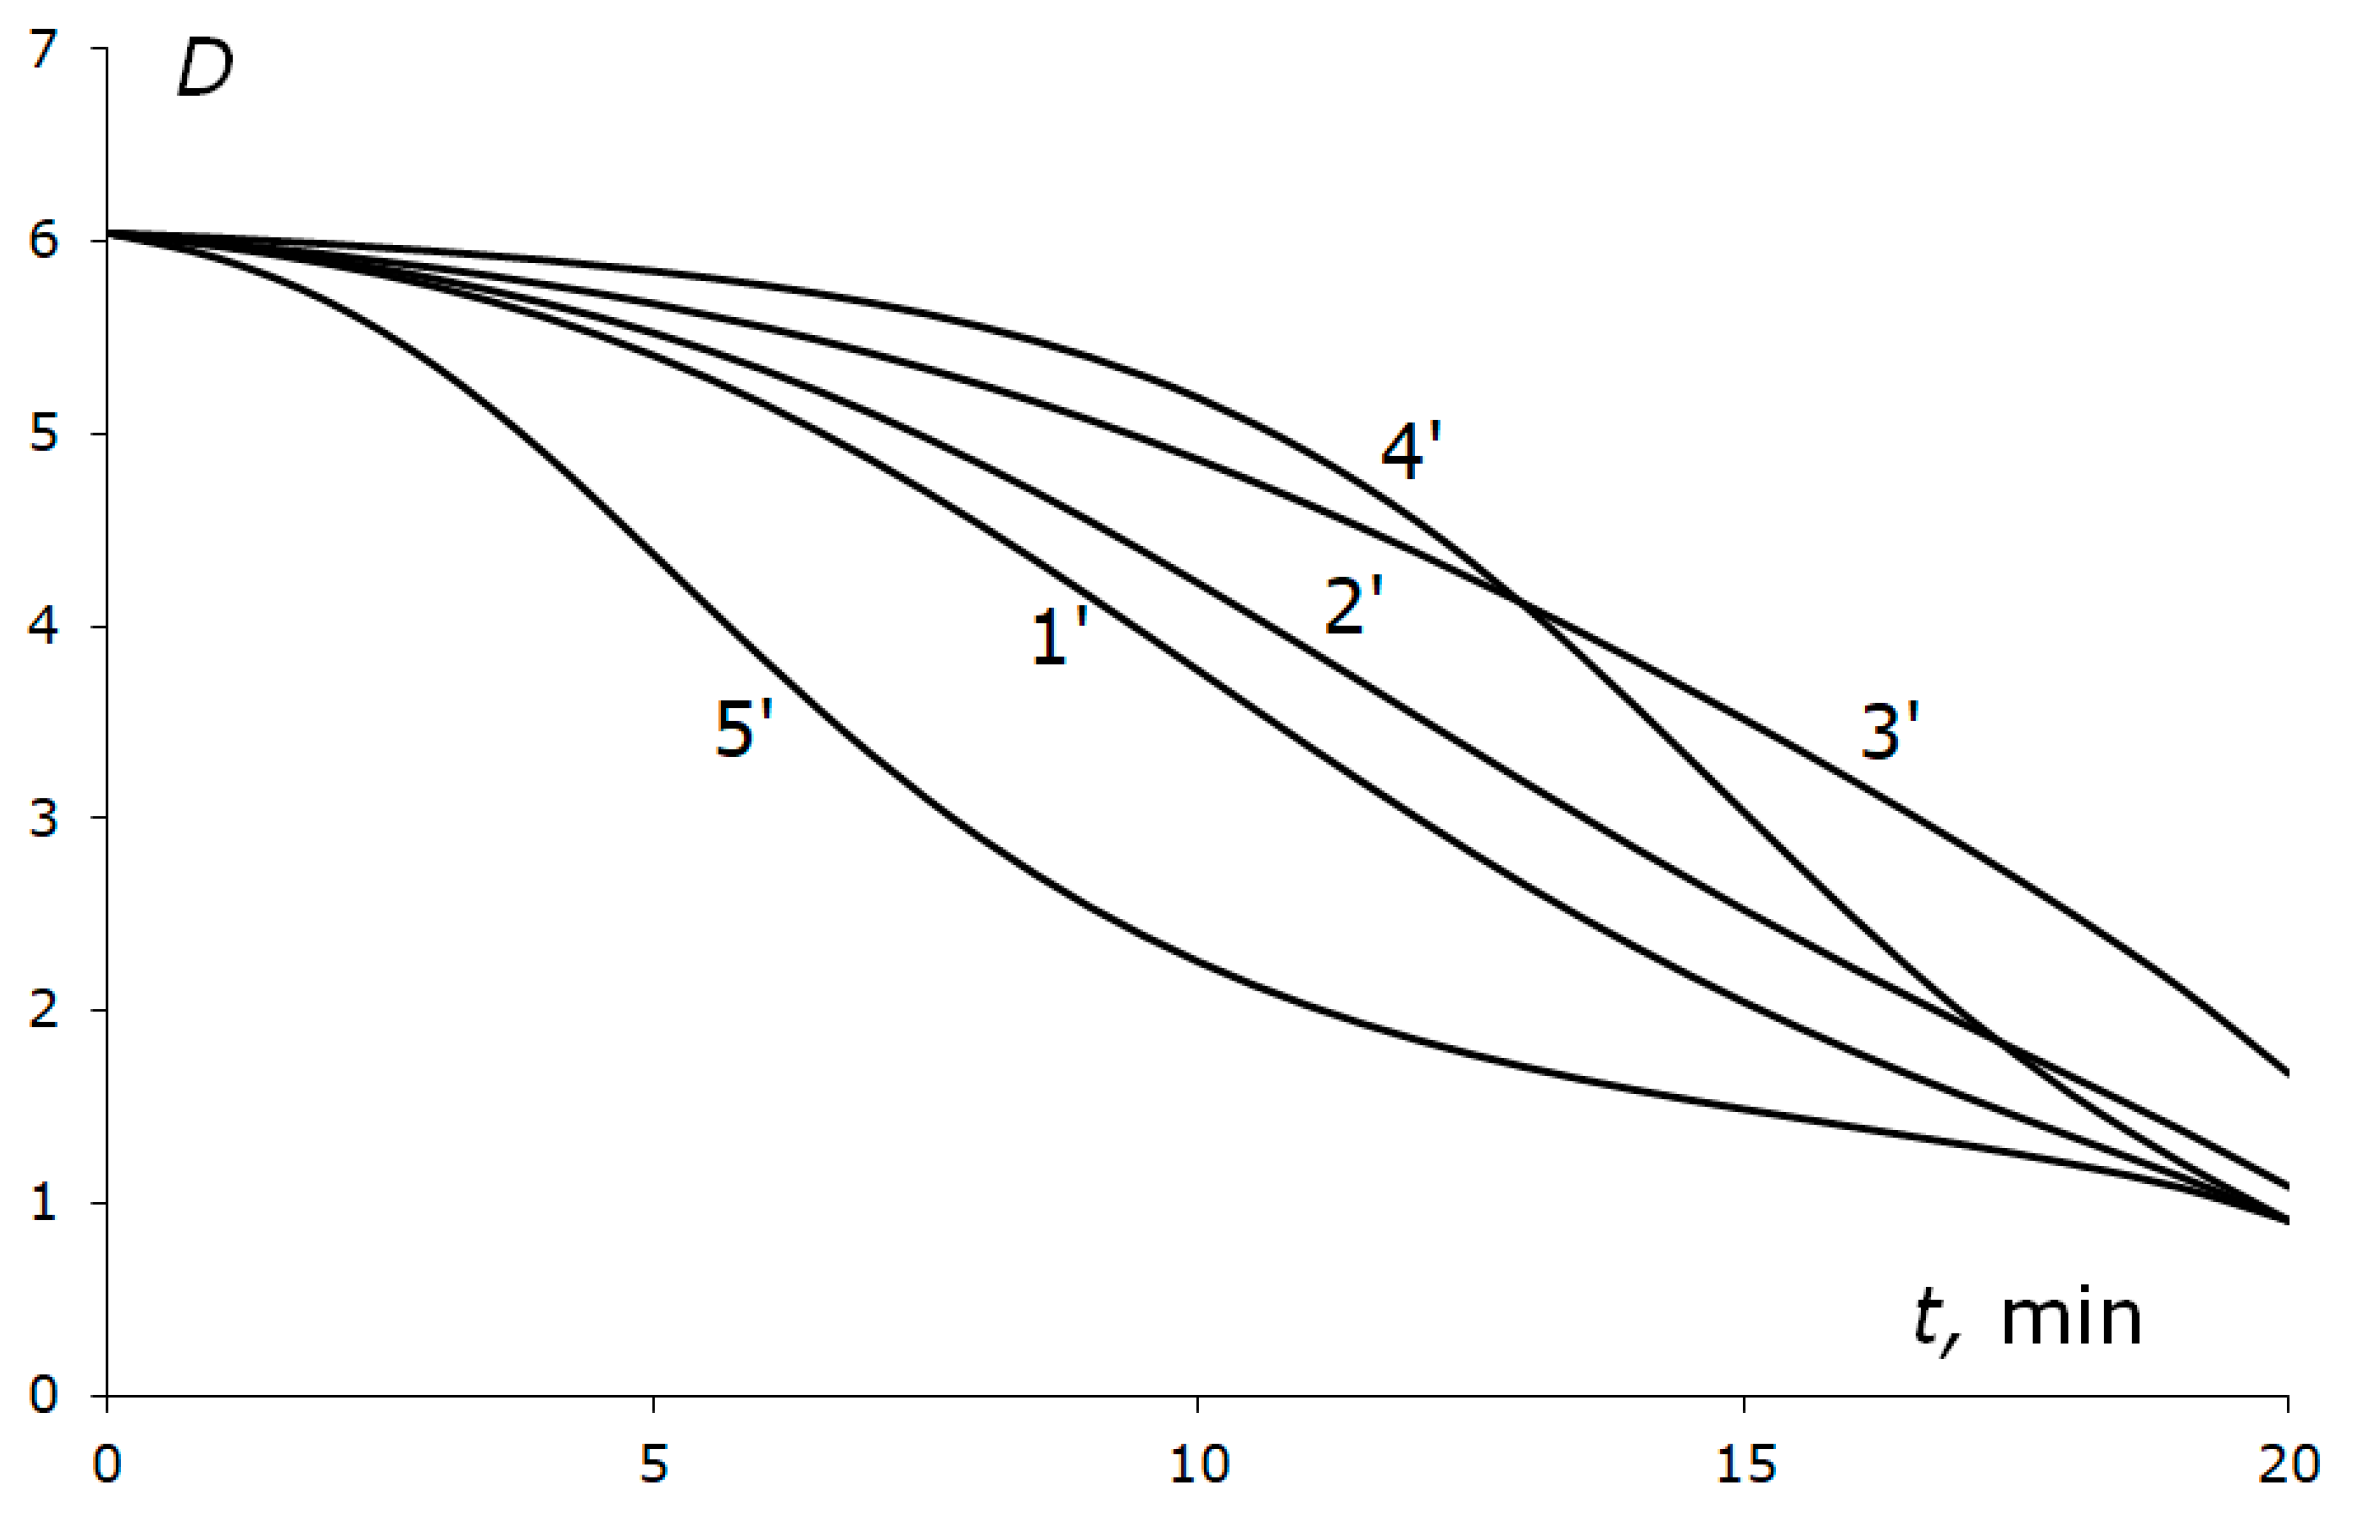
The variations in the parameter D(t) for several (p,T) reduction trajectories on the p,T plane from the starting point S on curve 1 (Figure 3) until reaching the elastic region of the catalyst were calculated for the same reduction time of 20 min. The reduction trajectories and the variation in parameter D are shown in Figure 7 and Figure 8, respectively. For curves 1′–3′ in Figure 7, the pressure reduces uniformly over time from the starting value of ps = 5250 MPa to pf = 514 MPa, which approximately corresponds to the elastic region boundary (curve 3, Figure 3).
The starting temperature Ts was 1888.2 K and the final temperature varied: Tf = 516.5 K for curve 1′, 700 K for 2′, and 1000 K for 3′. On these three curves, the temperature reduced uniformly over time, like pressure. On curve 5′, the temperature reduced to Tf = 516.5 K, initially with acceleration with respect to p, then slowed down. On curve 4′, it was vice versa. The curves of Figure 3 are shown as well in Figure 5 as dashed curves with the same numbers as in Figure 3.
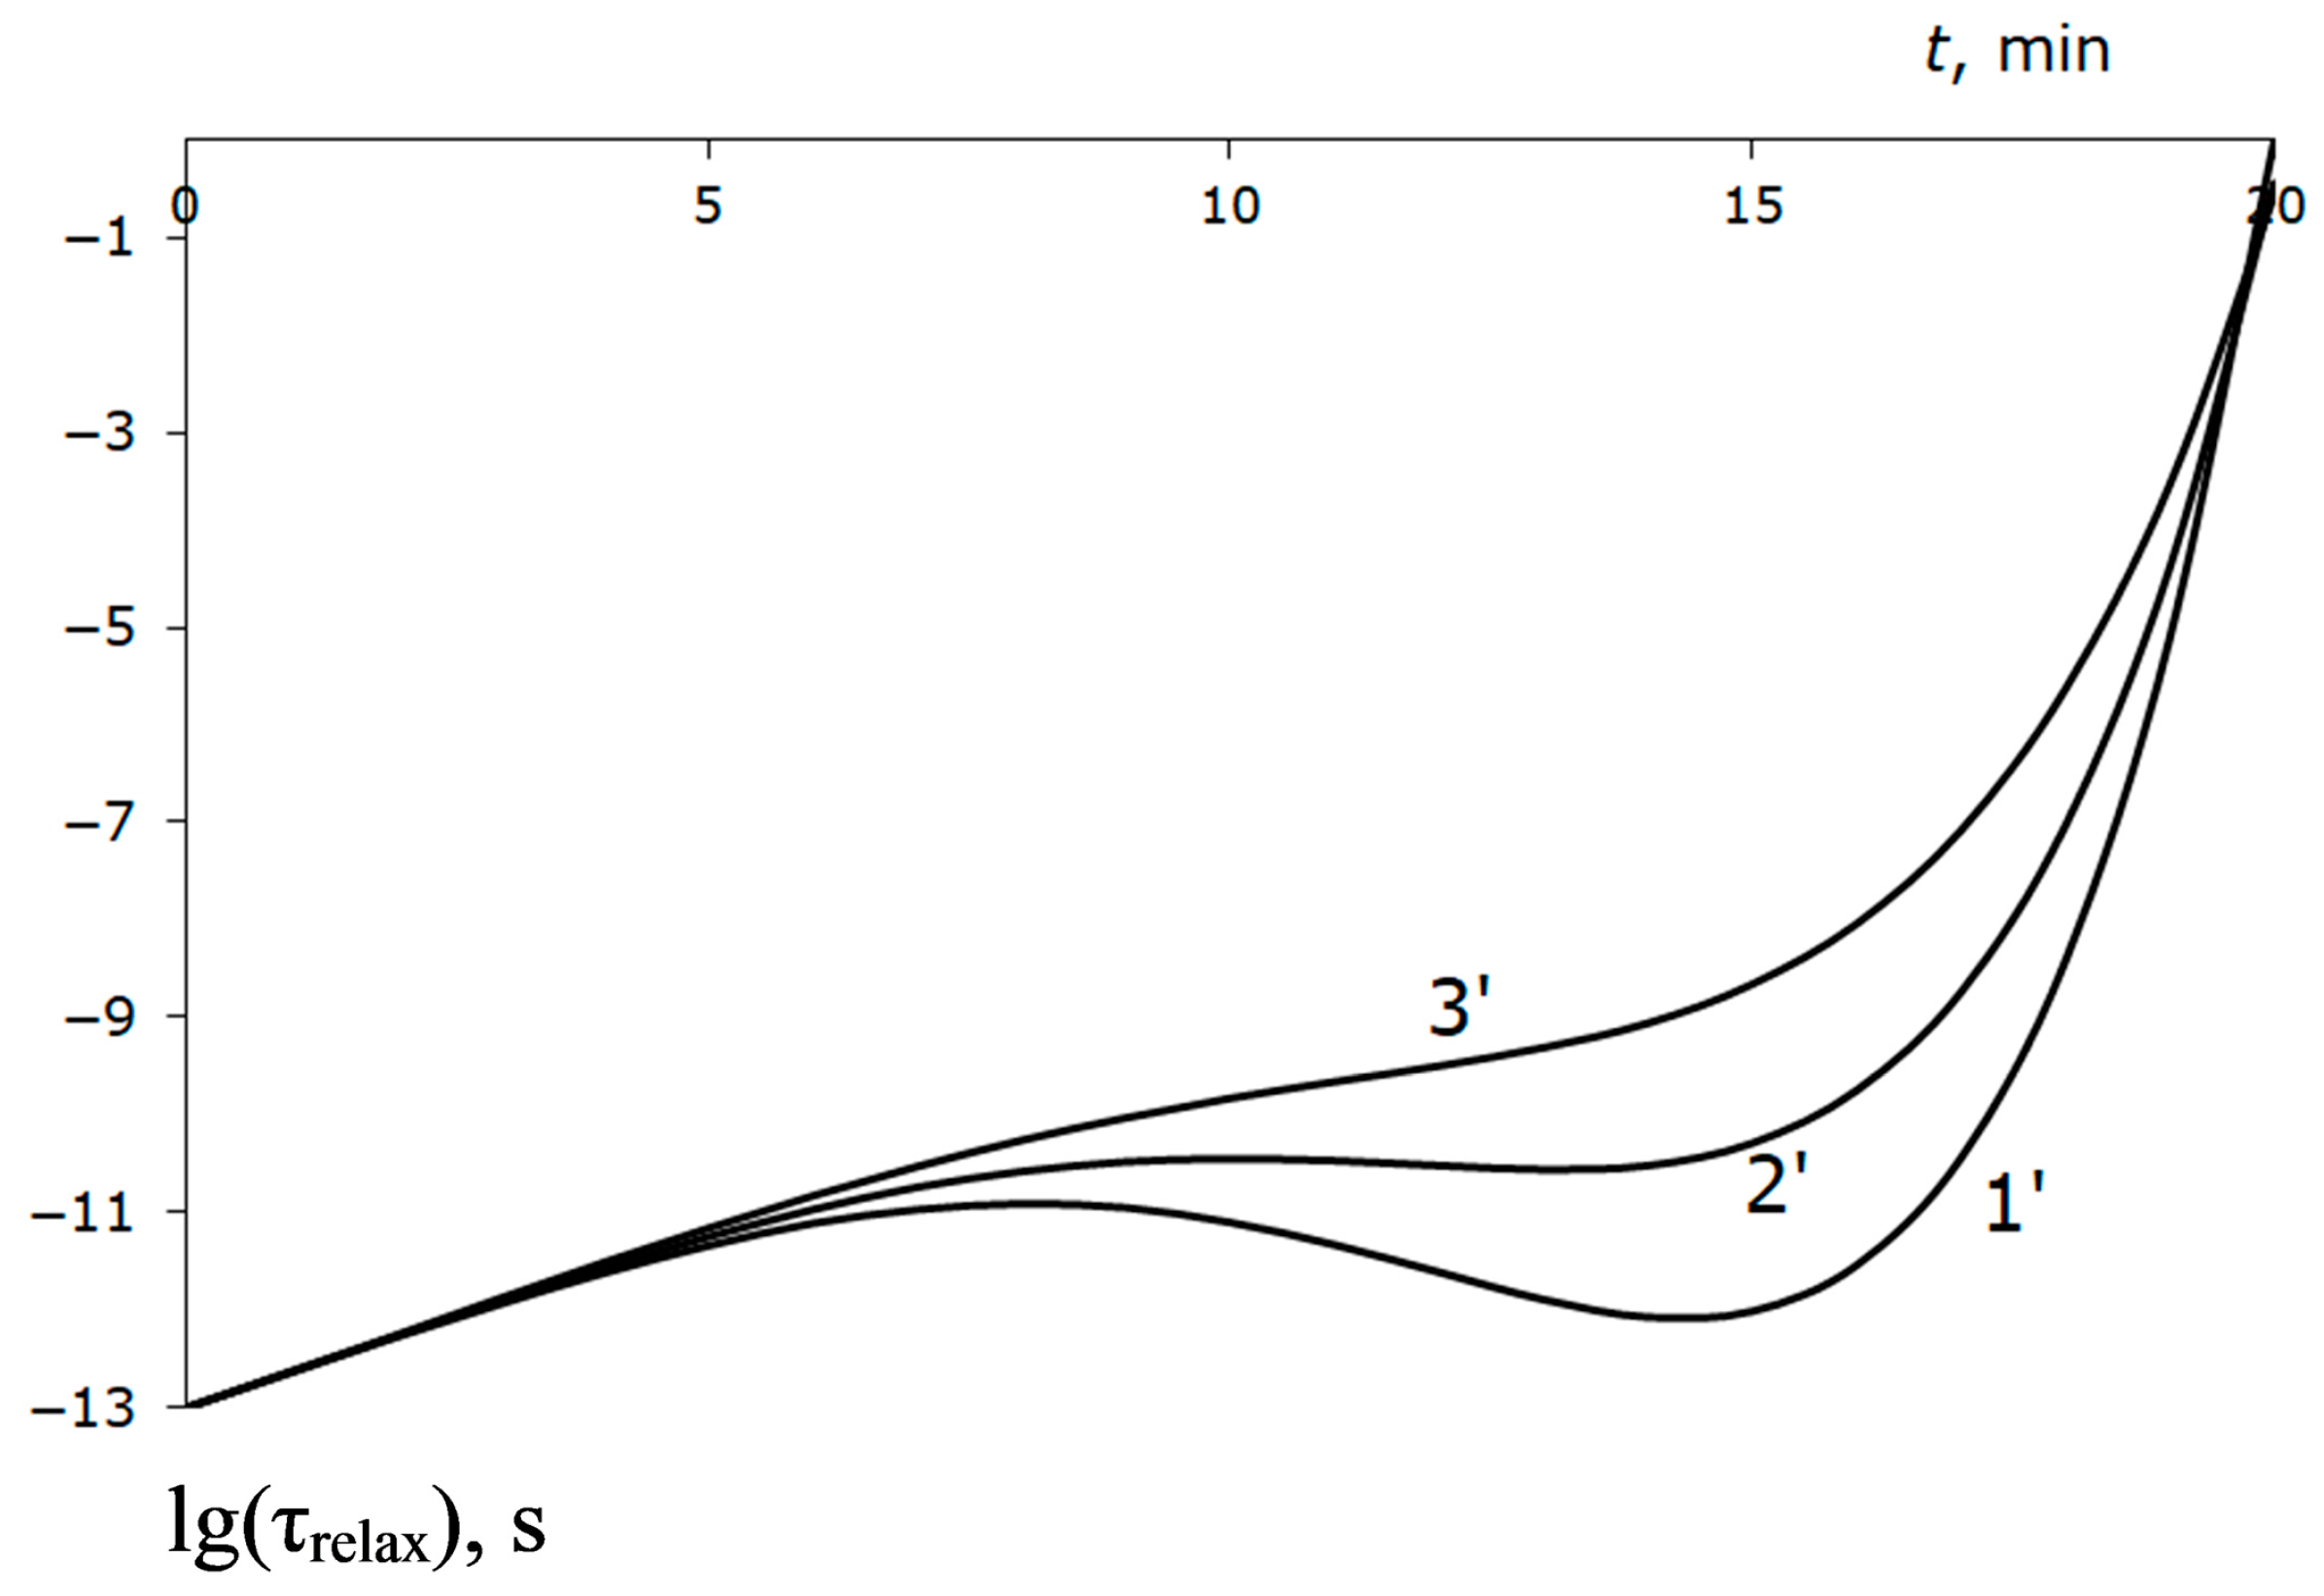
Figure 9 plots the relaxation time change for curves 1′, 2′, and 3′ (Figure 7). It can be seen that almost to the elastic region boundary, the delay in the development of the plastic state is small. It becomes significant only at the end of the trajectory, when the absolute value of external pressure reduces by 5–6 times.
The variation in static plastic properties is more important. The most dangerous trajectories are the trajectories of slow temperature descent (curves 3′ and 4′ in Figure 7 and Figure 8), where the growth of the plastic properties due to the temperature decrease does not manage to compensate for the reduction of these properties due to the pressure reduction.
The parameter D is maximal at the beginning of the trajectories (i.e., in early moments of time) and it is in this area that the pressure must first be reduced slowly (curve 5′, Figure 7 and Figure 8) and the temperature must be reduced much more rapidly. However, the area approaching the elastic region border can also be dangerous.
First of all, the position of curves 2, 3, and 4 in Figure 3 is known very approximately. In addition, the delay in the plastic state onset can be much higher if the pre-exponent factor τ0 of the relaxation time is longer than the approximate value of 10−13 s. Finally, if curves 1′–5′ in 
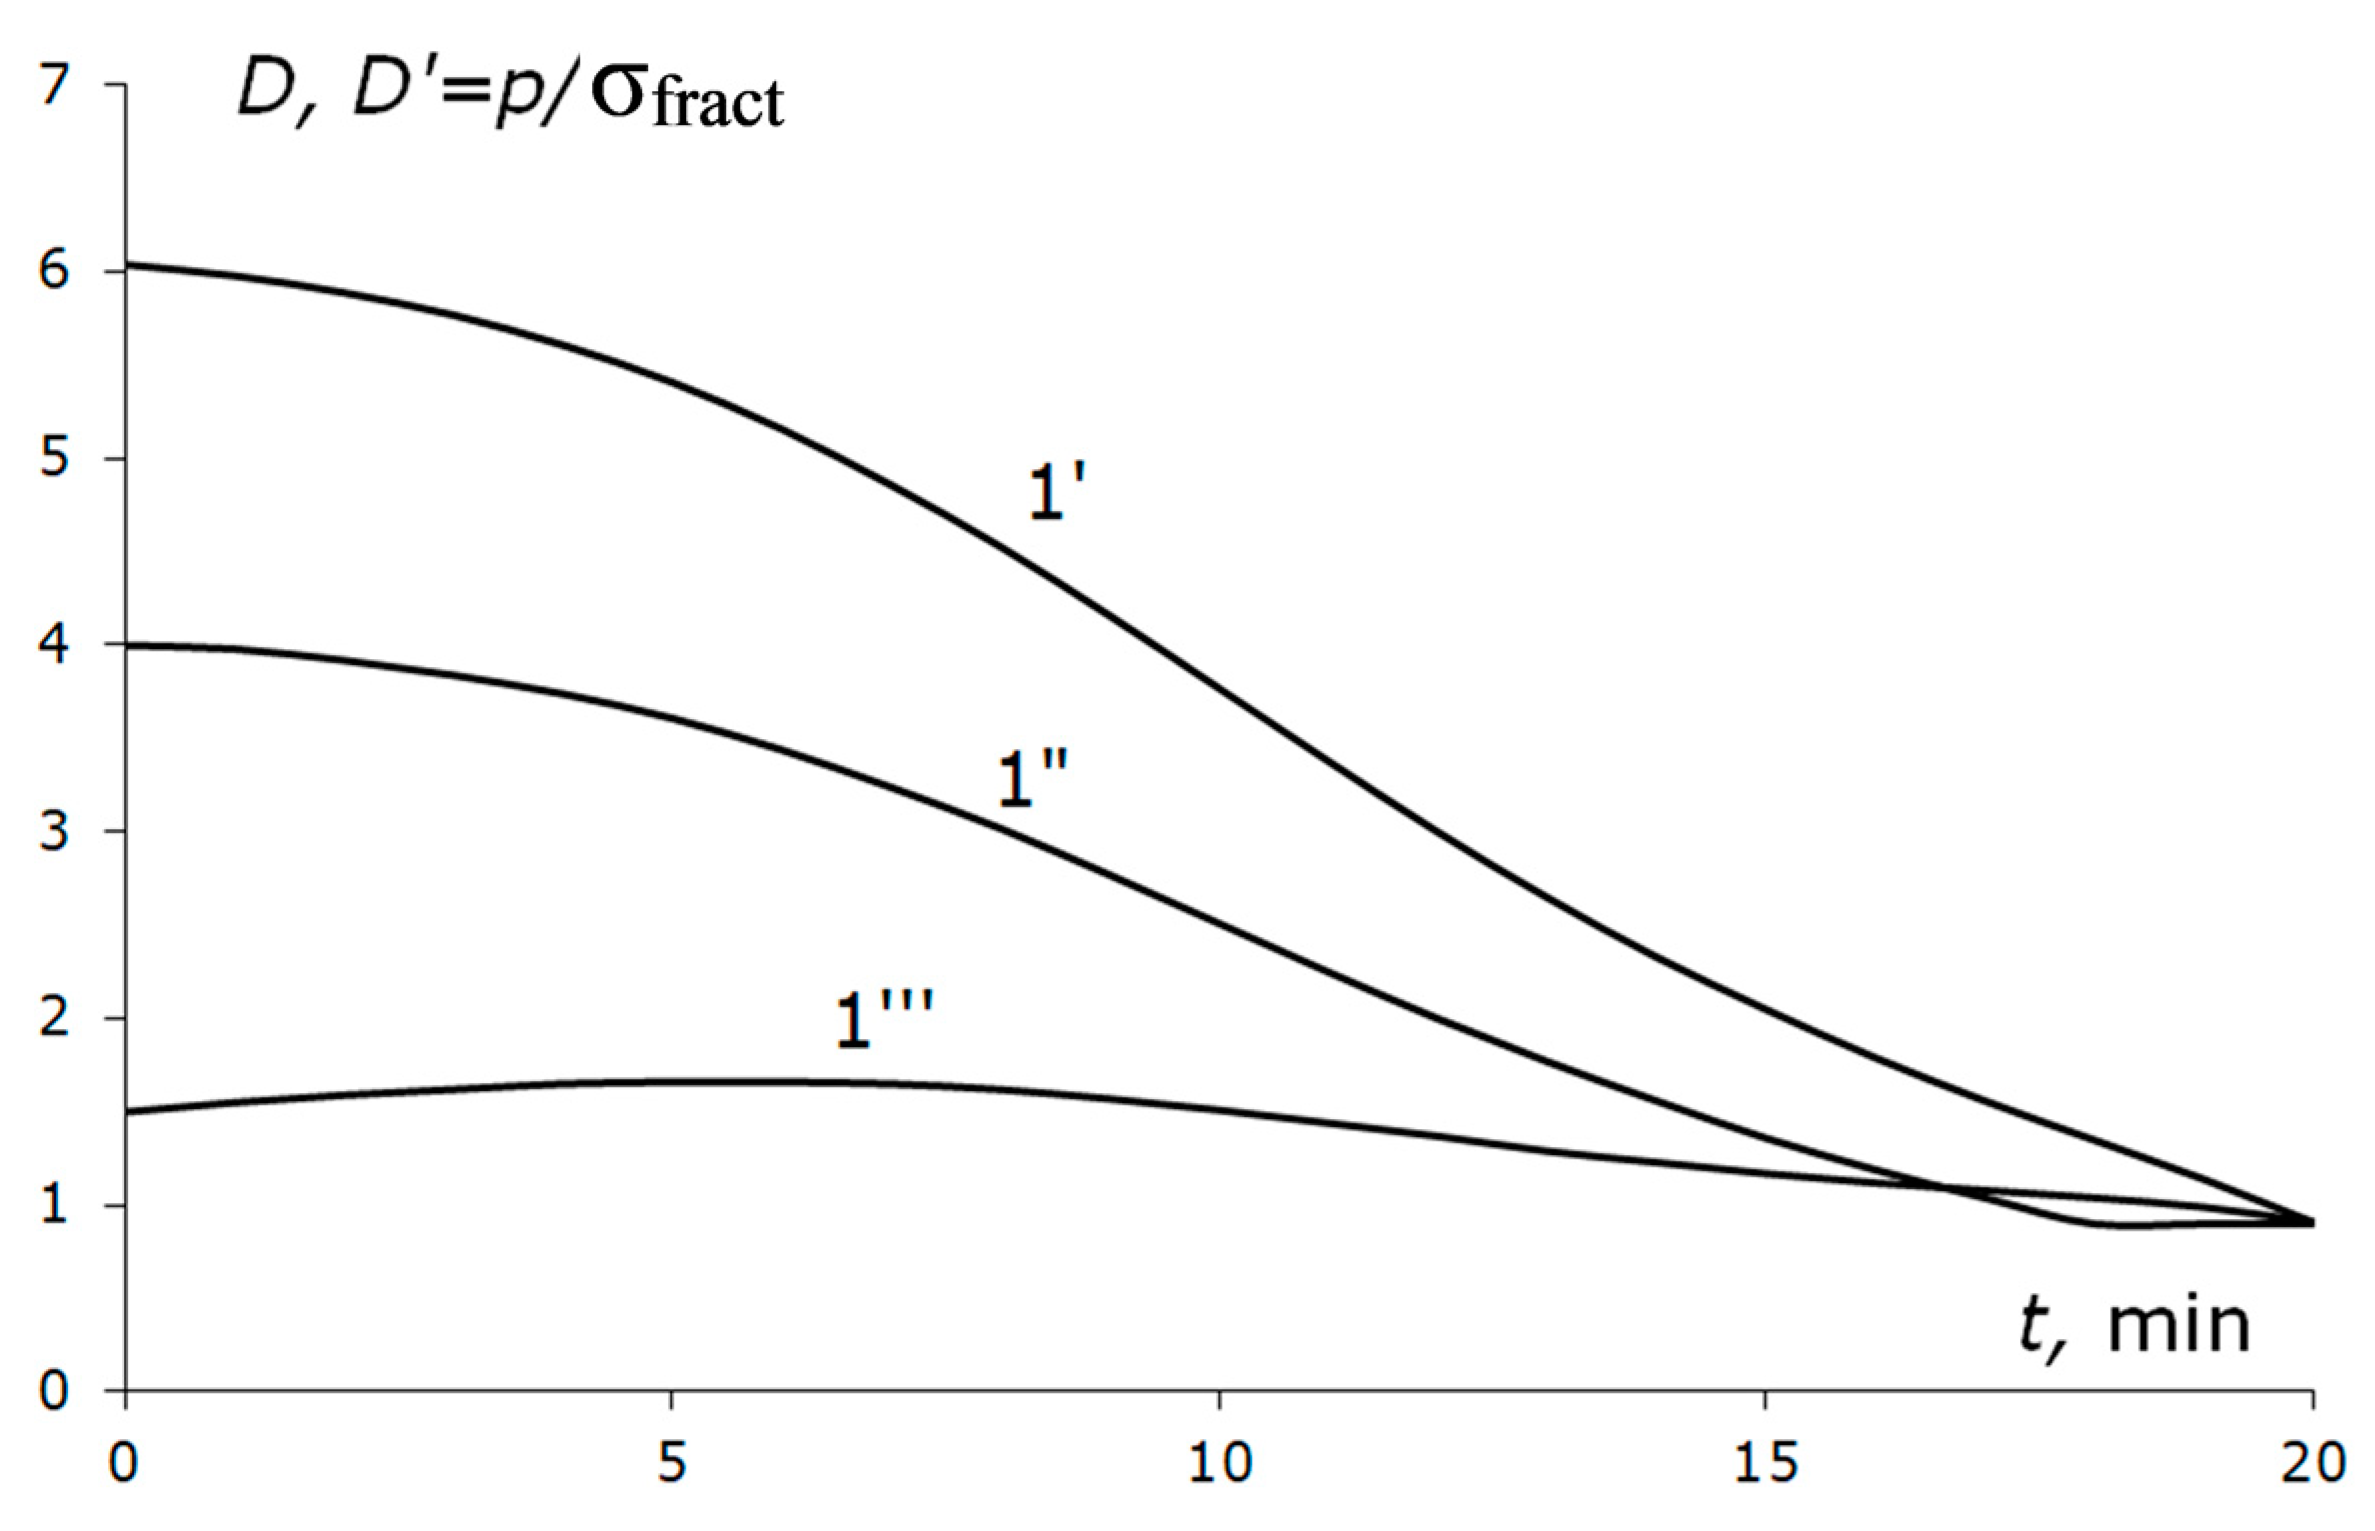
Figure 8 are reconstructed as ratios D’ of the pressure to the fracture limit σfract (instead of plasticity onset limit), they will quantitatively coincide with curve D only if the plasticity onset limit σT and fracture limit σfract change proportionally.
If the fracture limit decreases faster than the plasticity onset limit (as in Figure 5b) with the temperature decrease, the shape of curve D′(t) is much more gentle compared to curve D (curve 1′′′, Figure 10). Then, the risk of fracturing the solid catalytic medium is maintained throughout the cooling and pressure descent trajectory. We return to the question of how fitting the parameter σfractT allows us to describe the main body of experimental data in Section 4.
In practice, it is desirable to significantly decrease the reduction rate of both the pressure and the temperature at pressures in the range of p = 0.6–1 GPa, where the delay in the onset of plasticity becomes large (in the order of minutes). For example, one can take one hour to go through this range.
At lower pressure, the system enters the elastic behavior region of the catalyst. As the next section suggests, only unsteady temperature gradients can influence the stress level in this region. Let us estimate the possible temperature gradients associated with a sharp decrease in the average temperature  T ¯  in the growth cell.

3.4. Unsteady Temperature Gradients and Elastic and Weakly Plastic Behavior of Catalytic Medium

As shown in this section, unsteady temperature gradients can be made small by choosing a reasonable temperature reduction rate. Therefore, we have not conducted a detailed analysis of the temperature distribution in the growth cell. As far as we know, analysis of this sort for different designed anvils with self-consistent consideration of the position of the heating circuit and insulating gaskets was first carried out in [24]. For our particular problem, we either limited ourselves to a constant temperature in the growth cell (as above) or set a constant temperature gradient down and up the cell.
The elements of the electric circuit for heating the growth cell are a graphite heater and anvils (not shown in Figure 1), and the elements of the thermal problem are the insulating MgO gasket and the growth cell itself. The graphite heater can be immediately excluded from the consideration of the thermal problem, as well as the current-carrying circuit through the anvils of enormous cross-section. Then, the power supply to the pyrophyllite container is allocated almost entirely in the growth cell and the MgO gasket, the MgO being thin and having lower thermal conductivity than the growth cell. Therefore, the delay time τdelay in establishing a steady-state temperature distribution in the cell is determined by the heat capacity and thermal conductivity of the catalyst alone. By order of magnitude
τ delay r cell 2 2 χ cat = r cell 2 ρ cat c cat 2 κ cat ,
where χcat is the temperature conductivity of the catalyst medium. The unsteady temperature difference between the center of the cell and the heat deposition point (graphite heater at a periphery of the cell) is
δ T ~ τ delay d T ¯ d t .
The thermal conductivity  κ cat , the density  ρ cat , and the heat capacity  c cat  of the iron catalyst under normal conditions are 0.50 W/(cm∙K), 7.5 g/m3, and 0.9 J/(g∙K), respectively; the half side rcell of the 2 rcell side was assumed to be rcell = 3 cm. Taking into account the considerable variation in these parameters depending on p and T, τdelay~1 min and δT~50 K at uniform temperature reduction from 2000 to 500 K in 40 min. This reduction rate approximately corresponds to the steady-state bottom-top temperature difference in the cell during the diamond growth. At a lower temperature reduction rate of 10 K/min (1000 K for ~1.5 h), the unsteady temperature effects are unimportant and cannot cause significant stresses in the diamond.
Figure 11 shows the stress fields σxx in the diamond and in the catalyst due to the difference in Young’s moduli and TECs in the elastic problem (ELCUT 5.2 package [25]) at a temperature difference of about 50 K across the cell height. With the 2D simulation, the external pressure was 1 GPa, and the temperature varied from the bottom to the top as 330 + 2.5y (K) up to a height of y = 20 mm. It can be seen that the stress is very slightly higher than the external pressure, although it is accentuated on the diamond first of all.

3.5. Influence of Plastic Properties of the Container and Limitations on the Descent Trajectory of the p,T Parameters Associated with It

Thus, neither the “delayed plasticity” nor the temperature gradients should result in extreme stresses on the diamond at the “dangerous” region below 1 GPa and cause its fracture during the relatively slow reduction in the p,T parameters.
However, the above consideration does not address the strength and plastic properties of the pyrophyllite container enclosing the growth cell. The integrity of the container is practically irrelevant as long as the catalyst material retains its plasticity. This is true up to pressures of ~1 GPa, as shown in Figure 3. However, in the elastic region of the catalyst, it completely translates superstresses arising in the container.
If the container loses its plasticity and has “pre-acquired” cracks at pressures above 0.7–1 GPa, the loads translated to the diamond can exceed this value many times over.
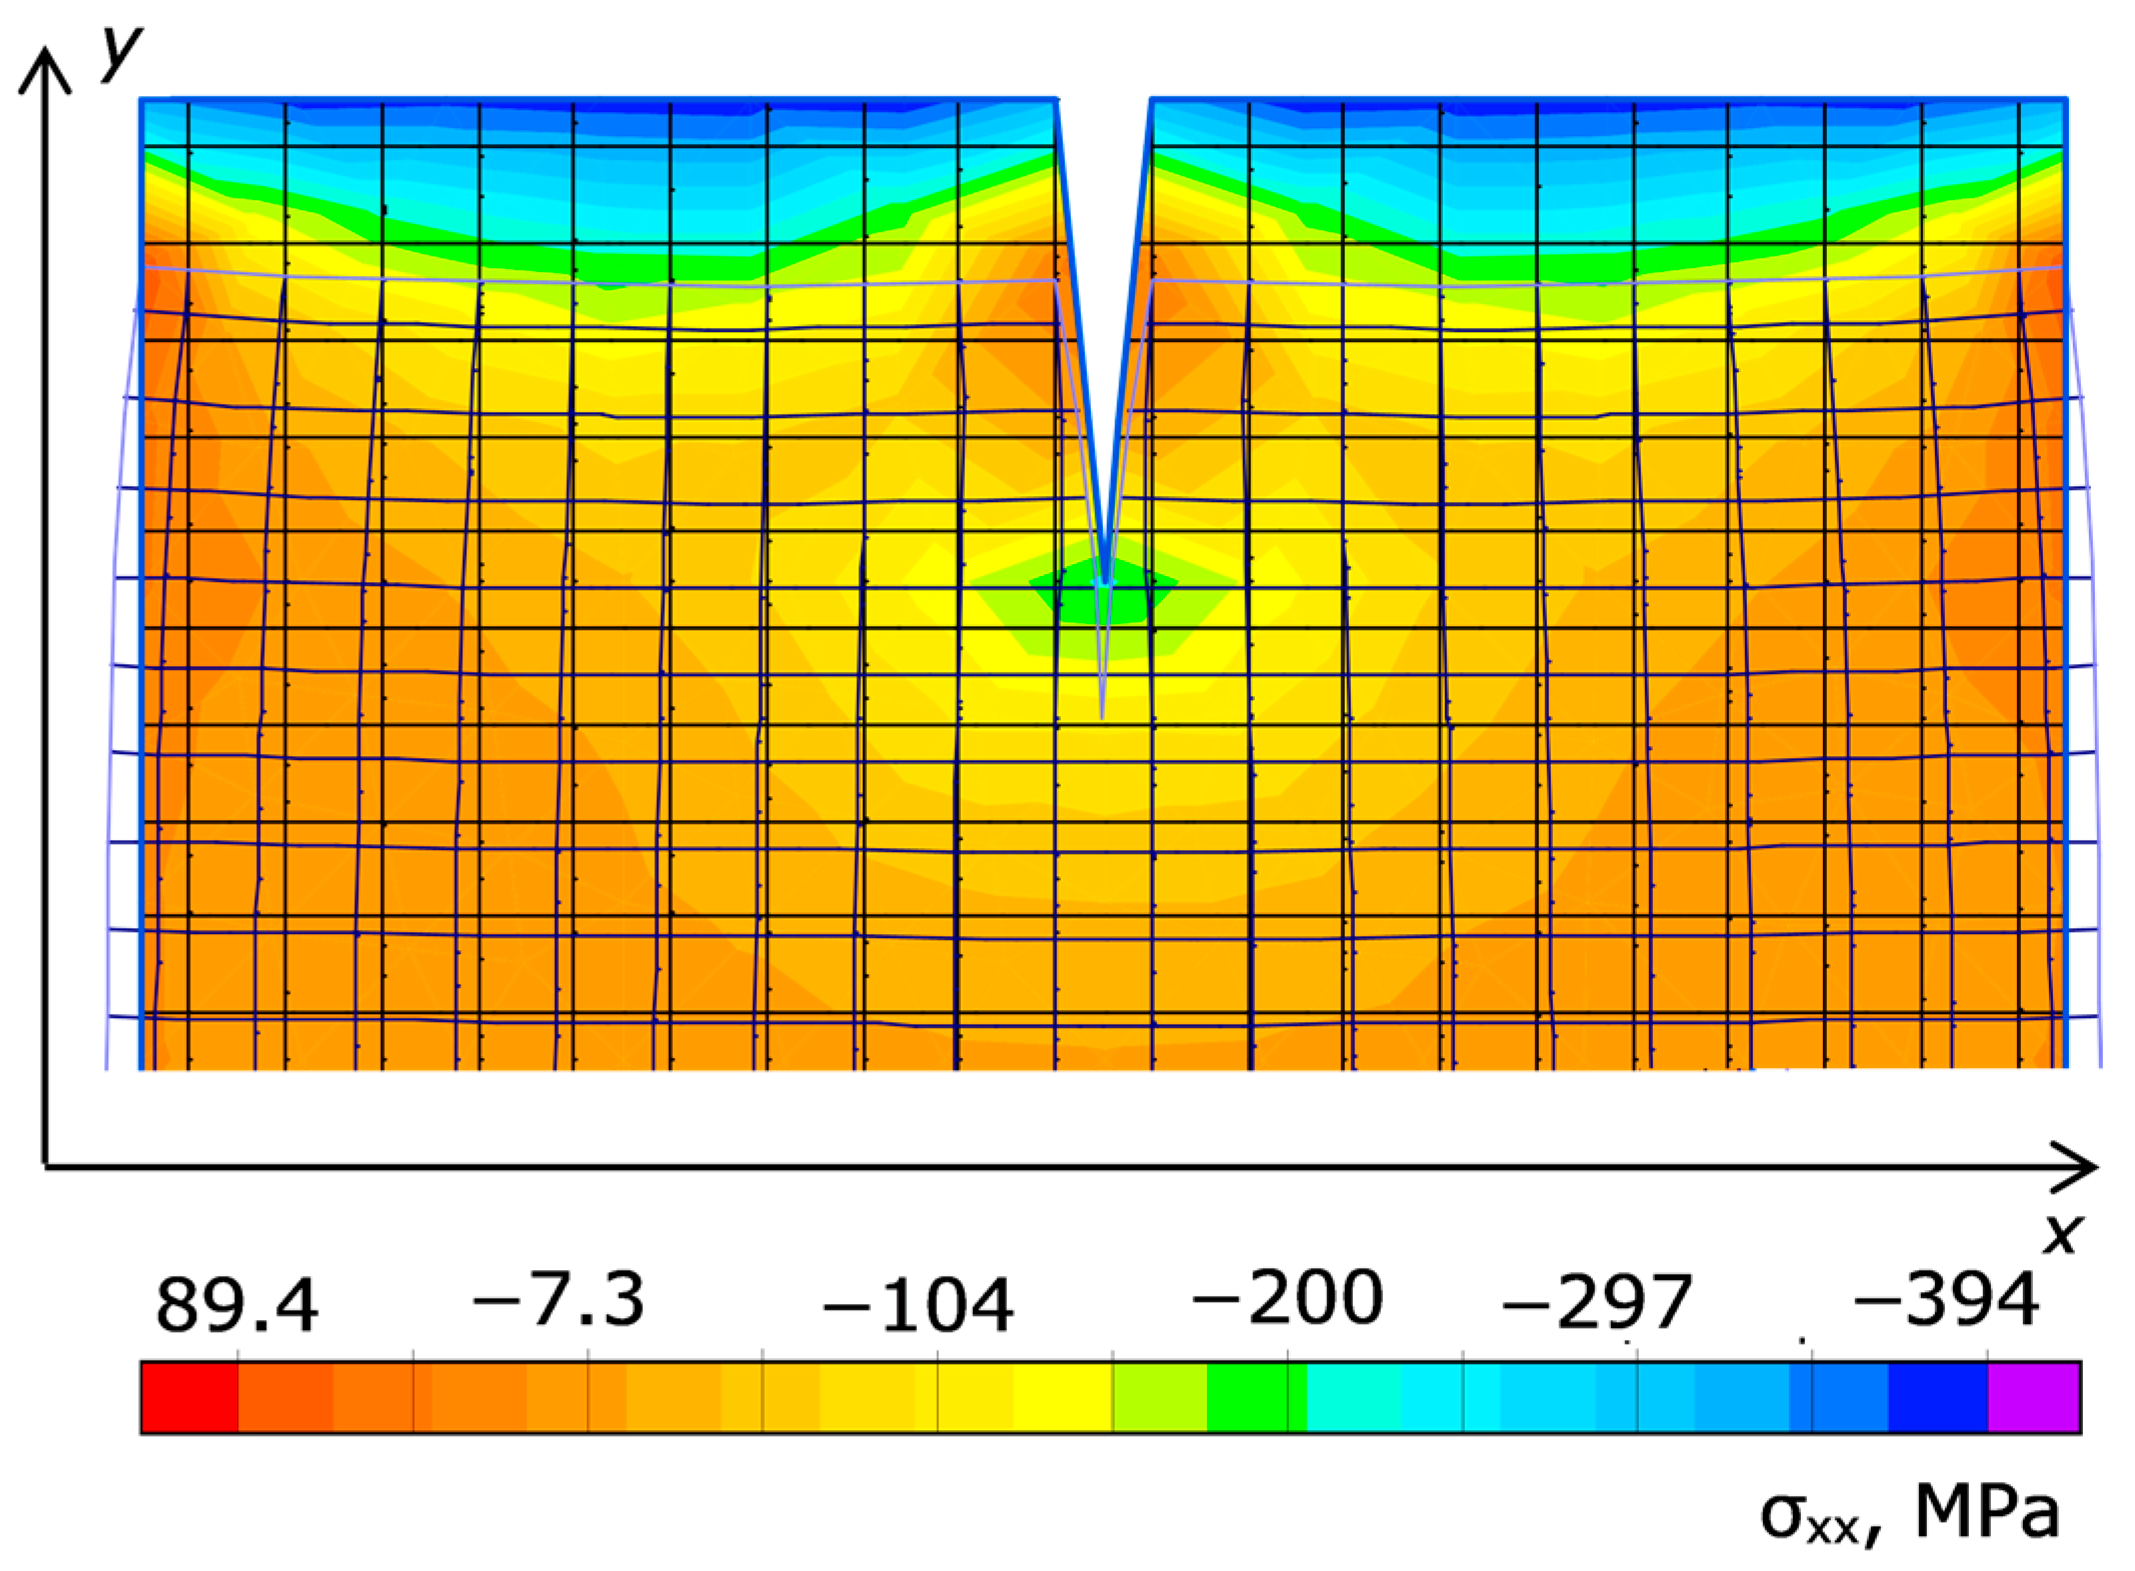
A typical picture of the stress field σxx created in an elastic material by a 5 mm-deep and 3 mm-wide triangular crack at the top of the material is shown in Figure 12.
It can be seen that the maximum rupturing stress occurs at the bottom of the crack and effectively extends deep into the catalyst at least to the depth of the crack. The effective width of the stress exceeds the transverse crack width by about an order of magnitude.
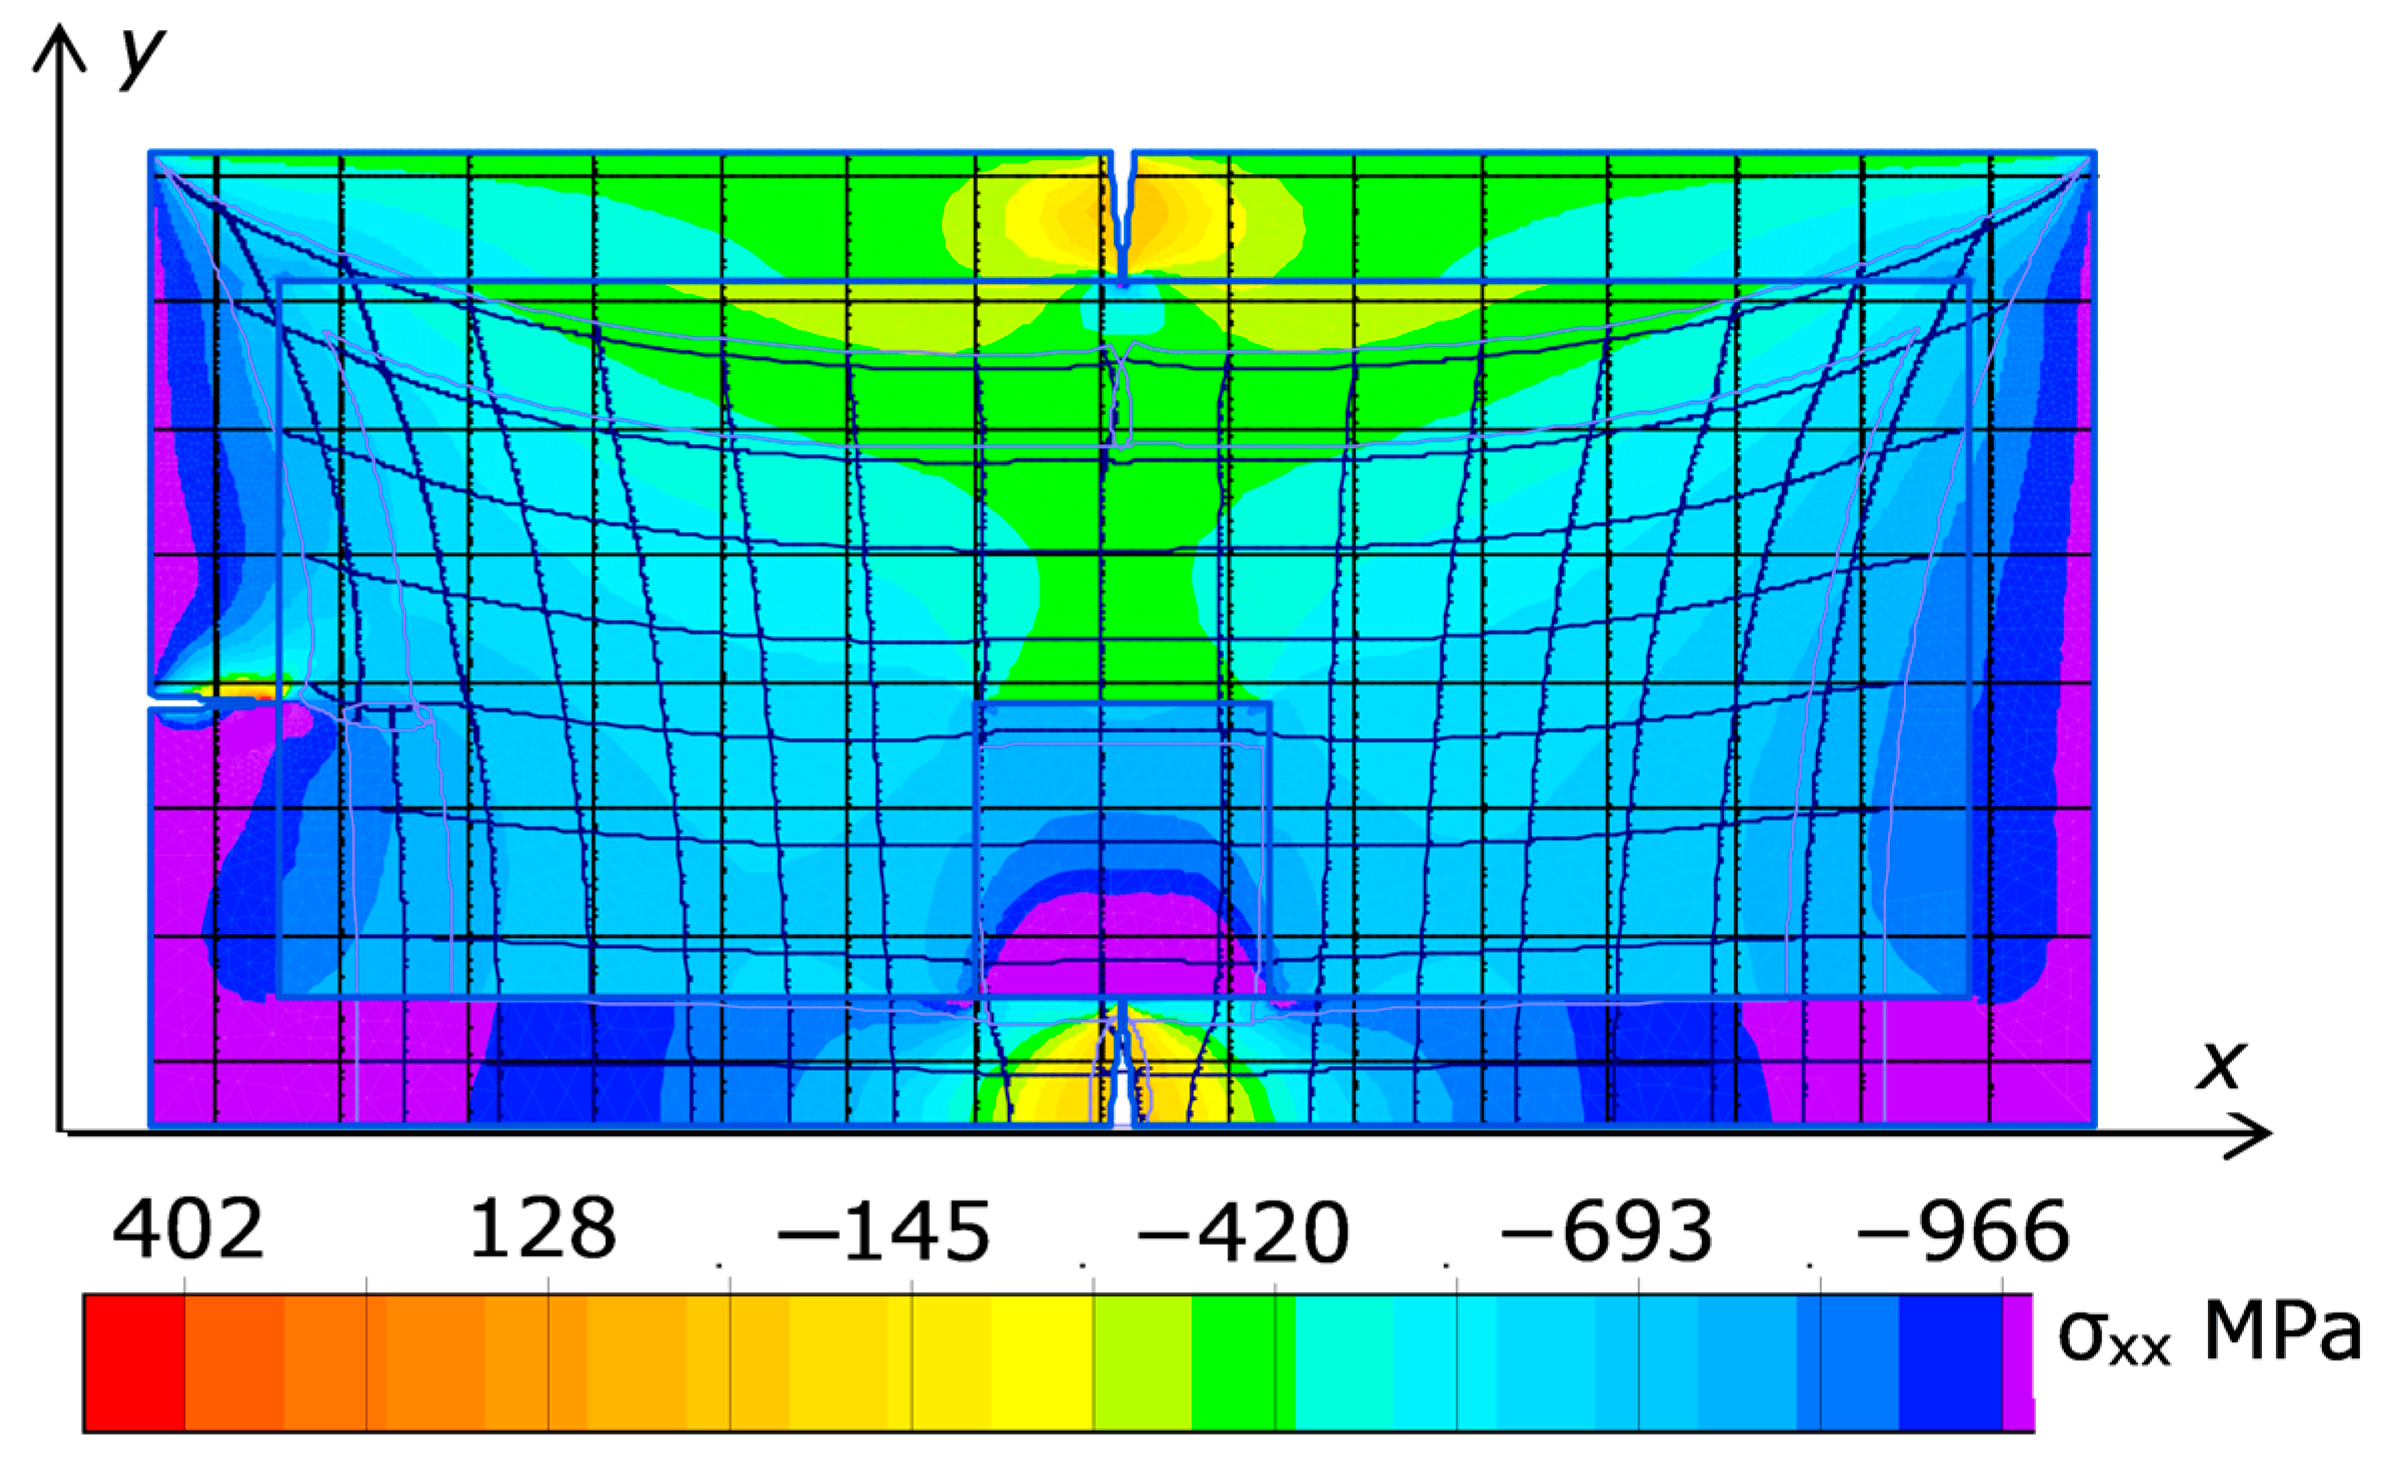
Figure 13 plots the stress field σxx initiated in the cell by the three cracks in the pyrophyllite container—top, left, and bottom under the diamond under an all-round load of 1 GPa. The Young’s modulus and Poisson’s ratio of the container are chosen rather arbitrarily as 300 GPa and 0.25, respectively. The dimensions of the diamond and the growth cell are 7 × 7 mm and 40 × 20 mm, respectively; the thickness of the container is 3 mm.
It can be seen that the maximum rupturing stress acting on the diamond is concentrated in its lower part, immediately above the crack (dark blue color).
Let us set a target to minimize the probability of cracks in the container during the reduction of the extreme parameters p,T, assuming that no cracks have yet occurred in the container at the growth times of the diamond.
Since almost nothing is known about the strength properties of pyrophyllite, wholly dehydrated and turned into stone after the diamond growth period is completed, the most stringent requirement for reducing the p and T parameters was as follows: the volume of the pyrophyllite container should not change. Thus, the reduction in the catalyst volume inside the pyrophyllite automatically leads to lower pressure on it from inside. Accordingly, in the parameter dynamics optimal for pyrophyllite container integrity, the external pressure should decrease at the same rate. Then, the external and internal pressures on the container remain approximately equal and the probability of cracking is minimal.
As follows from conventional thermodynamics, the decrease in the internal pressure pint due to the temperature reduction is approximately dpint/dT ≈ (∂p/∂T)V = −(∂p/∂V)T(∂V/∂T)p = 3αcat/ζ, where ζ is the isothermal compressibility of the catalyst material. For solid iron under normal conditions, αcat = 12 × 10−6, ζ = 0.6 × 10⁻⁶ 1/atm. That gives dpint/dT~50 atm/K for the internal pressure reduction rate, i.e., about 105 atm for the total temperature reduction of ~2000 K during the entire reduction time of the p,T parameters. This value is only twice the ratio of the total drops in the pressure and temperature over the reduction period.
Therefore, the reduction trajectory optimal for the pyrophyllite container preservation lies almost entirely in the activated plasticity region (trajectory o′ in Figure 14) and has a small slope. Herewith the load on the catalyst is maximum. Reaching the catalyst-safe trajectory requires passing through the initial cooling section without the pressure reduction (S-So section), when the risk of the pyrophyllite container failure is maximal, at least from the point in time where the curve o′ in Figure 14 intersects curve 2.

4. Discussion: Comparison of Model with Experiment

Thus, the requirements for integrity of the catalytic medium and of the pyrophyllite container are very poorly matched. Therefore, when comparing the proposed model with the experiment, it was assumed that the container was not destroyed and all destructive effects upon the diamond were related to the catalyst medium. The possibility of pyrophyllite fracture was considered as a random and uncontrollable factor.
The target function of the calculation was the fraction of diamonds with fractures Ω. A correct determination of ω was not difficult because in all experiments at least four diamond nuclei were initially present in the growth cell.
For any particular trajectory on the (p,T) plane, the integral fracture parameter <D′> must take into account that in the plasticity region the effect of the instantaneous parameter D′ is almost independent of the process rate. Then, one can assume that <D′> is proportional to the time integral of D′ and is smaller the faster the hazardous section of the trajectory is passed.
On the contrary, it is desirable to reduce the parameters p,T slowly when approaching the elastic region. Then, both the plasticity delay and unsteady effects of thermal expansion are negligible. The additive to <D′> emerged from these effects must be inversely proportional to the reduction time.
In this case, the plasticity delay can be considered insignificant if we limit ourselves to trajectories where the pressure reduction is slow and the temperature reduction is rapid at the start of the process and vice versa at the end of it (trajectories such as 5′ in Figure 7 and Figure 8). In this case, the plasticity delay can be very large, but the catalyst moves into the less plastic region from the more plastic one and no large stresses can arise.
The trajectories of the opposite type (such as 3′ and 4′ in Figure 7 and Figure 8) make a large contribution to <D′> even without considering the plasticity delay. Therefore, the contribution of the elastic and weakly plastic sections of the trajectory to <D′> is mainly determined by the unsteady effects of thermal expansion and must be inversely proportional to the transit time of these sections.
So, the behaviors of the elastic and plastic contributions to the fracture probability from the transit time of these sections are opposite, and it is difficult to select a common time scale for them to introduce a single dimensionless parameter.
However, if one considers only slow reduction trajectories in the elastic region where the additional temperature gradients are small, it is sufficient to calculate the integral fracture parameter from the plastic section of the trajectory only, supposing the plasticity delay is small. Then, the integral fracture parameter can be written in the style of Zhurkov’s theory in a form similar to (1), i.e.,
D ~ 0 t 1 exp ( γ ( p σ fract ( p ( t ) , T ( t ) ) ) T ( t ) ) d t ,
where t1 is the descent time of the parameters p,T from the starting point S to the elastic region boundary.
The parameter <D′> on each particular trajectory depends on the two fitting parameters (σfractT)s and (σfractT)f described in Section 4 and used in writing the dependence σfract(p,T) in Figure 7 and Figure 8. The optimal pair of parameters (σfractT)s and (σfractT)f was determined by minimizing the sum of least squares of the deviation of the parameter ω from its mean value. Each value of the argument on the horizontal axis <D′> corresponded to the value of the integral (12) with a given pair of values of (σfractT)s and (σfractT)f. When this pair is varied, the set of abscissa of the experimental points changes. Similarly, the position of the mean curve and the value of the variance change.
To simplify the calculation procedure, all values of <D′> calculated for a given pair of (σfractT)s and (σfractT)f were divided into five intervals from the minimum value to the maximum value. In the graph in Figure 15, this maximum value is equated to 1. This is possible because <D′> in (12), having the meaning of dimensionless probability, is defined with the accuracy of a constant multiplier.
Within each interval of <D′>, the mean value of ω was assumed to be constant, allowing the variance to be determined. To ensure that the contributions of different intervals of <D′> were equally significant, the sum of least squares was determined as  i ( ω i ω k ( i ) ) 2 / ω k ( i ) ,  where “i” is the number of experimental points; and k(i) is the number of intervals of value <D′> in which the point “i” falls. The number of experimental points (i.e., trajectories on the p,T plane) was 18.
Since the quantities plotted on the x and y axes are essentially the same value, the dependence found must be simply a straight line. Indeed, it follows from Figure 15 that the fraction of cracked diamonds decreases simultaneously with the value of <D′>. The spread of the points obtained for all <D′> intervals seems acceptable.
However, at the minimum values of <D′> realized experimentally, the fraction of cracked diamonds is still not reduced to zero, but is 10–15%. This value is somewhat lower than the relative frequency of the pyrophyllite container fracture relative to all the experiments performed.
In addition, it must be kept in mind that the diamond growth process always requires a considerable time and it is not always rational to choose a too-risky trajectory for reducing the p,T parameters just to obtain an experimental point.

5. Conclusions

Thus, it is established that the optimal trajectory of reducing the pressure p and the temperature T in terms of non-fracturing the catalyst material (and, consequently, the diamond) should bypass the activated plasticity region.
Trajectories partly passing inside this region are also acceptable, but must satisfy the following conditions:
  • At the initial stage of reducing the (p,T) parameters, the temperature must decrease with acceleration as compared with the pressure. The rate of reducing the (p,T) parameters over time at the stage of plasticity is insignificant;
  • When the descent trajectory on the (p,T) plane approaches the elastic region of the catalyst medium (at a pressure of about 1 GPa), the pressure should, on the contrary, decrease faster than the temperature. Thus, before entering the elastic region, the shape of the trajectory should be similar to that of the activated plasticity region boundary (curve 1, Figure 3);
  • In the elastic behavior region of the catalyst, the descent rate must be reduced to minimize unsteady temperature gradients within the growth cell.
The details of how the reduction trajectory is positioned in this region until normal parameters are reached have little importance.
The above recommendations assume the integrity of the pyrophyllite container with the diamond growth cell inside it.
If the container integrity is preserved at the moment when the p,T parameters start to decrease, its non-destruction at the stage of reducing the (p,T) parameters is best ensured under conditions opposite to the conditions of the non-destruction of the catalyst medium. Namely, the temperature decrease should be slow with a simultaneous sharp pressure decrease. This condition is particularly relevant at the beginning of the reduction trajectory, when the external pressure on the container is at its maximum.
Therefore, the use of a pyrophyllite container when growing diamonds at high pressure (above 5 GPa) is undesirable, although this material is well-established technologically and is commonly used. Synthetic composite materials as an alternative to pyrophyllite are well-known, but their adaptation to the technology of producing massive diamonds is a rather serious technical task. It is currently under both theoretical and design development.

Author Contributions

Conceptualization, N.I.A. and A.V.K.; methodology, A.V.K.; software, I.K.K., A.P.B. and I.V.O.; validation, N.I.A.; investigation, A.V.K. and N.I.A.; writing—original draft preparation, N.I.A.; writing—review and editing, I.K.K., V.M.A. and N.I.A.; supervision, N.I.A. All authors have read and agreed to the published version of the manuscript.

Funding

This research received no external funding.

Data Availability Statement

Not applicable.

Conflicts of Interest

The authors declare no conflict of interest.

References

  1. Shikata, S. Single crystal diamond wafers for high power electronics. Diam. Relat. Mater. 2016, 65, 168–175. [Google Scholar] [CrossRef]
  2. Alekseev, N.I.; Luchinin, V.V. Electronics of Diamond; Publishing House of ETU “LETI”: St. Petersburg, Russia, 2019; 144p. (In Russian) [Google Scholar]
  3. Power Electronics Device Applications of Diamond Semiconductors, 1st ed.; Koizumi, S.; Umezawa, H.; Pernot, J.; Suzuki, M. (Eds.) Woodhead Publishing: Cambridge, UK, 2018; 466p, ISBN 9780081021842. [Google Scholar]
  4. Alekseev, N.I.; Khadutin, V.S.; Khmel’nitskii, I.K. Quantum-Chemical Modeling of Elementary Processes That Accompany the Generation of Diamond and Graphite Clusters in the Gas Phase without a Substrate. Russ. J. Phys. Chem. A 2021, 95, 2263–2272. [Google Scholar] [CrossRef]
  5. Alekseev, N.I.; Khadutin, V.S.; Khmel’nitskii, I.K. Gas-Phase Nucleation of Diamond Clusters upon a Sharp Rise in Temperature under Conditions of CVD Synthesis. Russ. J. Phys. Chem. A 2021, 95, 2444–2453. [Google Scholar] [CrossRef]
  6. Alekseev, N.I.; Oreshko, I.V.; Khadutin, V.S.; Khmelnitsky, I.K. Possible Nucleation and Synthesis of Large Diamonds in a Carbonate–Silicate Matrix without the Use of High Pressure. Russ. J. Phys. Chem. A 2022, 96, 1–9. [Google Scholar] [CrossRef]
  7. Khadzhi, V.E.; Tsinober, L.I.; Shterenlikht, L.M.; Samoilovich, M.I.; Gordienko, L.A.; Detchuev, Y.A.; Zadneprovsky, V.I.; Kolodieva, S.V.; Komarov, O.P.; Laptev, V.A.; et al. Synthesis of Minerals; Publishing House “Nedra”: Moscow, Russia, 1987; Volume 1, 487p. (In Russian) [Google Scholar]
  8. Ōsawa, E. Recent progress and perspectives in single-digit nanodiamond. Diam. Relat. Mater. 2007, 16, 2018–2022. [Google Scholar] [CrossRef]
  9. Han, Q.G.; Ma, H.A.; Huang, G.F.; Zhang, C.; Li, Z.C.; Jia, X.P. Hybrid-anvil: A suitable anvil for large volume cubic high pressure apparatus. Rev. Sci. Instrum. 2009, 80, 096107. [Google Scholar] [CrossRef] [PubMed]
  10. Han, Q.G.; Ban, Q.C.; Zhu, P.W. Design of a novel large volume cubic high pressure apparatus for raising the yield and quality of synthetic diamond. J. Cryst. Growth 2015, 422, 29–35. [Google Scholar] [CrossRef]
  11. Li, R.; Xu, B.; Zhang, Q.; Gu, X.; Zheng, G.; Ma, H.; Jia, X. Finite-element analysis on pressure transfer mechanism in large-volume cubic press. High Press. Res. 2016, 36, 575–584. [Google Scholar] [CrossRef]
  12. Li, Y.; Li, Y.; Chen, L.; Guo, L.; He, Z.; Xia, L.; Wang, G.; Zhang, P. Studies on the mechanism of large cavity to improve the growth rate of large diamond under HPHT conditions. J. Cryst. Growth 2019, 515, 66–71. [Google Scholar] [CrossRef]
  13. Song, G.; Ma, D.; Zhou, X.; Wang, L.; Wei, Z.; Xu, C.; Wang, W.; Wang, L.; Zhao, Y.; Wang, S. Operation of large-volume cubic press above 8 GPa and 2500 °C with a centimeter-sized cell volume using an optimized hybrid assembly. High Press. Res. 2021, 41, 132–141. [Google Scholar] [CrossRef]
  14. Tonkov, E.Y. Phase Diagrams of Elements at High Pressure; Publishing House “Nauka”: Moscow, Russia, 1979; 192p. (In Russian) [Google Scholar]
  15. Regel’, V.R.; Slutsker, A.I.; Tomashevskii, É.E. The kinetic nature of the strength of solids. Sov. Phys. Usp. 1972, 15, 45–65. [Google Scholar] [CrossRef]
  16. Slutsker, A.I. Characteristics of elementary acts in the kinetics of metal fracture. Phys. Solid State 2004, 46, 1658–1666. [Google Scholar] [CrossRef]
  17. Potapova, L.B.; Yartsev, V.P. Mechanics of Materials under Complex Stress State. How to Predict the Ultimate Stresses? Publishing House “Mashinostroenie”: Moscow, Russia, 2005; 244p. (In Russian) [Google Scholar]
  18. Bridgman, P.W. Studies in Large Plastic Flow and Fracture: With Special Emphasis on the Effects of Hydrostatic Pressure; Harvard University Press: Cambridge, MA, USA, 1964; 362p, ISBN 9780674731349. [Google Scholar]
  19. Stishov, S.M. The thermodynamics of melting of simple substances. Sov. Phys. Usp. 1975, 17, 625–643. [Google Scholar] [CrossRef]
  20. Kirzhnits, D.A. Extremal states of matter (ultrahigh pressures and temperatures). Sov. Phys. Usp. 1972, 14, 512–523. [Google Scholar] [CrossRef]
  21. Prut, V.V. Estimation of melting critical point parameters. Tech. Phys. 2008, 53, 668–671. [Google Scholar] [CrossRef]
  22. ANSYS 13.0 (CFD)—Supercomputer Education and Research Centre. Available online: https://www.serc.iisc.ac.in/software/ansys-13-0-cfd-2/ (accessed on 9 May 2023).
  23. Hahn, H.G. Elastizitätstheorie: Grundlagen der Linearen Theorie Und Anwendungen Auf Eindimensionale, Ebene Und Räumliche Probleme; Vieweg+Teubner Verlag: Wiesbaden, Germany, 1985; 336p, ISBN 9783519023647. [Google Scholar]
  24. Hernlund, J.; Leinenweber, K.; Locke, D.; Tyburczy, J.A. A numerical model for steady-state temperature distributions in solid-medium high-pressure cell assemblies. Am. Mineral. 2006, 91, 295–305. [Google Scholar] [CrossRef]
  25. ELCUT—Simulation Program. Available online: http://www.elcut.ru (accessed on 9 May 2023). (In Russian).
Figure 1. Schematic of pyrophyllite container: 1—MgO gasket; 2—graphite; 3—dolomite thermal insulating gasket; 4—pyrophyllite; 5—steel electrodes. The interior of the diamond growth cell itself is separated by grey filler and is not detailed.
Carbon 09 00052 g001
Figure 2. Diamond (two inner circles) resisting the compression of the surrounding catalytic shell (two outer circles) as the shell cools.
Carbon 09 00052 g002
Figure 3. Characteristic curves of drastic changes in catalyst properties on the (p,T) plane and optimal trajectory of reducing the (p,T) parameters to the normal curve “o” (optimal). Other curves: 1—activated plasticity border σT(p,T) = σZh; 2—σT(p,T) = 0.6σZh; 3—σT(p,T) = p; 4—τrelax = 1 s; the upper curve is the liquid–solid-phase equilibrium curve; the bold point S marks the stationary p,T parameters during diamond growth.
Carbon 09 00052 g003
Figure 4. Typical temperature dependences of the plasticity onset limits for different cast irons at atmospheric pressure. Specific grades of cast irons are not shown in this figure. The bold blue curve 1 is an averaged curve accepted for simulation in this model.
Carbon 09 00052 g004
Figure 5. Qualitative picture of the plastic properties of cast-iron-type material under linear tension (a) and under all-round compression (b) as a function of temperature: T1 > T2 > T3 > T4. The value of ε in (b) has a slightly different meaning and is close to ε/3.
Carbon 09 00052 g005
Figure 6. Stress field σxx in a growth cell of 40 × 40 mm size (2D simulation). Two diamonds of 7 × 7 mm size are located at the bottom of the cell. The catalytic medium in the cell at an applied pressure of 1 GPa is assumed to be close to perfectly plastic media.
Carbon 09 00052 g006
Figure 7. Pressure- and temperature-reduction trajectories lying in the activated plasticity region (left-hand side of curve 1) down to the elastic region boundary. The temperature and the pressure along curves 1′, 2′, and 3′ reduce linearly with time over 20 min. The pressure reduces linearly. The temperature on curves 4′ and 5′ reduces as  T = T s + ( T f T s ) ( ( p p s ) / ( p f p s ) ) 2  and  T = T s + ( T s T f ) ( ( p p f ) / ( p s p f ) ) 2 , respectively.
Carbon 09 00052 g007
Figure 8. Variation in the fracture parameter D with time. Curves 1′–5′ correspond to the curves of reducing the parameters p,T shown in Figure 7 with the same numbers.
Carbon 09 00052 g008
Figure 9. Relaxation time variation for curves 1′, 2′, and 3′. They correspond to reducing the p,T parameters shown in Figure 7 with the same numbers.
Carbon 09 00052 g009
Figure 10. Variation in parameters D and D′ d during the activated plasticity stage. Curve 1′ corresponds to curve 1′ in Figure 8 and Figure 9. In curves 1″ and 1′′′ corresponding to the same process, the parameter D’ is defined as D’ = pfract. In curve 1″, σfractT = Const = 1.5 and varies linearly as  σ fract / σ T = ( σ fract / σ T ) s ( ( σ fract / σ T ) s ( σ fract / σ T ) f ) ( T T s ) / ( T f T s )  in curve 1′′′ from the starting value  ( σ fract / σ T ) s = 4  to the final value  ( σ fract / σ T ) f = 1  as the catalyst cools down.
Carbon 09 00052 g010
Figure 11. Stress σxx field arising from the differences in Young’s moduli and in TECs of the diamond and the catalyst in the diamond growth cell. The stress field is calculated within the 2D elastic problem at an external pressure of 1 GPa. The temperature varies as T[K] = 330 + 2.5y (K) from the bottom to the top of the cell of 20 mm height. The stress in the diamond exceeds that in the cell volume by about 100 MPa.
Carbon 09 00052 g011
Figure 12. Stress tensor component σxx in a catalyst cell with crack. The material of the cell is simulated as an elastic medium with a Young’s modulus of 200 GPa, at 1 GPa all-round load. The size of the cell is 40 × 40 mm, but the lower part with an almost uniform stress level is cut off.
Carbon 09 00052 g012
Figure 13. Stress field σxx initiated by three through cracks in the container—in the top, left, and bottom under the diamond crystal at an all-round load of 1 GPa.
Carbon 09 00052 g013
Figure 14. Trajectories of reducing the p,T parameter ensuring minimum overstress in the catalyst (o) and in the pyrophyllite container (o′), respectively.
Carbon 09 00052 g014
Figure 15. Experimental dependence of the fraction of cracked diamonds on the integral fracture parameter determined by (12) with optimal parameter selection (σfractT)s = 3.8 and (σfractT)f = 1.2.
Carbon 09 00052 g015
Disclaimer/Publisher’s Note: The statements, opinions and data contained in all publications are solely those of the individual author(s) and contributor(s) and not of MDPI and/or the editor(s). MDPI and/or the editor(s) disclaim responsibility for any injury to people or property resulting from any ideas, methods, instructions or products referred to in the content.

