Article

Replacing Lime with Rice Husk Ash to Reduce Carbon Footprint of Bituminous Mixtures

1
Department of Civil Engineering, Indian Institute of Engineering Science and Technology, Shibpur, Howrah 711 103, West Bengal, India
2
School of Sustainable Engineering and the Built Environment, Arizona State University, 660 S. College Avenue, Tempe, AZ 85287, USA
*
Authors to whom correspondence should be addressed.
Submission received: 26 December 2022 / Revised: 8 March 2023 / Accepted: 10 March 2023 / Published: 27 March 2023
(This article belongs to the Special Issue Biomass—a Renewable Resource for Carbon Materials (2nd Edition))

Abstract

:
There have been several emphasized pathways toward a reduction in carbon footprint in the built environment such as recycling, technologies with lower energy consumption, and alternative materials. Among alternative materials, bio-based materials and nature inspired solutions have been well-received. This study examines the merits of using rice husk ash as a replacement for lime; lime has a high carbon footprint mainly associated with the decomposition of calcium carbonate to calcium oxide to form lime. Lime is commonly used in bituminous composites for roadway construction to mitigate their susceptibility to moisture damage. Replacing lime with a low-carbon alternative could allow a reduction in CO2 equivalent of bituminous composites. This paper studies the merits of using rice husk ash (RHA) as a substitute for conventional hydrated lime (HL) in bituminous composites. It should be noted that rice industries burn rice husks in a boiler as fuel, generating a substantial volume of RHA. The disposal of this ash has major environmental impacts associated with the contamination of air and water. Here, we study physical and chemical characteristics of both HL and RHA for use in bitumen mixtures. This was followed by examining the extent of dispersion of each filler in bitumen via optical microscopy to ensure their uniform dispersion. The properties of the mixtures were further studied using the Marshall mix design method. It was found that a 25.67% increase in Marshall stability and a 5.95% decrease in optimum binder content were achieved when HL was replaced by RHA at 4% filler concentration. In addition, mixtures containing RHA exhibited higher resistance to cracking and permanent deformation compared to mixtures containing HL. Additionally, 4% RHA in the mix showed stripping resistance similar to the conventional mix with HL. The mixture with 4% RHA had a lower carbon footprint with enhanced economic and environmental impacts compared to the conventional mix with HL. The study results provide insights pertaining to the merits of bio-based materials to reduce the carbon footprint of pavements.

Graphical Abstract

1. Introduction

Generally, a bituminous mix is composed of aggregate, mastic (bitumen mixed with filler), and air voids [1]. Fillers are fine material that mostly passes through a 75-µm sieve and occupies 2–10% of the total mixture’s aggregate weight [2]. The critical roles of filler are to steady the mix by filling the holes in the aggregate skeleton and to enhance the viscoelastic properties of the mastic that glues the aggregate together [3]. It is commonly acknowledged that the performance of bituminous mixes is greatly affected by the overall characteristics of the filler [3].
Conventionally, stone dust produced during the process of stone crushing was used as filler in a bituminous mix. Presently, cement and hydrated lime (HL) are used as fillers in place of stone dust, since they deliver better binding and antistripping properties in the mix [4]. In comparison with cement, HL acts as an active filler and enhances adhesion by altering the aggregate’s surface chemistry and reacting with acid components in bitumen [5]. These conventionally used fillers are acquired by mining, and their constant use in bituminous mixes has led to their shortage in different parts of the world. Regular extraction for control fillers also causes the loss of riparian vegetation, damage in water-retentive strata, lowering of the groundwater level, and disturbance of the remaining ecosystem [6]. There are additional negative impacts on the environment: every ton of cement production emits 0.73–0.99 tons of CO2, and every ton of lime production emits 0.2–0.45 tons of CO2 [7].
The use of available waste as an eco-friendly replacement for conventional fillers will improve sustainability in building roads and create a way to lessen the carbon footprint throughout the world. However, before applying such wastes, it is essential to check the technical and economic viability of the resulting bituminous mix.
Rice is a primary food source for more than 100 countries and is consumed as an essential food by nearly half of the world’s population. In 2014, the global rice harvesting area was 162.72 million ha, and 741.48 million tons of rice were produced. Asia alone produced more than 90% of the rice; India contributed 21.20% of the total output [8]. In the production of milled rice, huge quantities of rice husk are generated as by-products. For instance, India produced 104.8 million tons of rice in 2015 [9]. Theoretically, in 2015, India generated 20.96 million tons of rice husk, which caused a problem for the rice-grinding industry. Due to the inherent properties of rice husk (hard surface, poor nutritional value, high silica content, fair resistance to bacterial decomposition), it is left unused or burned in a boiler to generate steam or electricity. Additionally, the burning of rice husk produces another source of pollutants called rice husk ash (RHA). The volume of this waste generated every year (5.58 million tons in 2019) is so large that the safe disposal of this waste powder has become a severe problem for the rice-milling industry [10]. Usually, RHA is discarded in nearby landfills, resulting in severe environmental pollution and contamination of water resources [10].
To overcome these problems, investigators have made many attempts to use RHA as added building materials to reduce the contamination effect and total construction cost. For instance, RHA has been used as a pozzolanic material in the construction industry [11]. From previous studies, it is known that RHA can be grinded finer and become more active because of the metastable state of the surface structure [12]. As a result, the activated fine nature of RHA makes it a potential filler/modifier in other materials, such as a bituminous binder or mix [12]. However, very few studies deal with RHA’s use in a bituminous mix. The application of RHA was examined as a partial replacement for the standard filler, i.e., limestone powder [4]. One study investigated the applicability of RHA combined with brick powder and waste glass dust as a filler in a bituminous mix; in that study, RHA did not show any noteworthy performance compared to the other fillers [13]. The result of another study showed that RHA could boost the visco-elastic properties of a bituminous binder. Furthermore, RHA upgraded the elastic response of the modified binder [12]. Yet, nearly all these research works are limited to only a few properties of the bituminous mixes, or the studies applied RHA in an arbitrary percentage. Various studies also established that RHA could be used as filler in a bituminous mix, but tests of RHA’s effectiveness against stripping acquired conflicting results [13]. Additionally, up to now, no study has investigated how modification with RHA affects the physical and morphological properties of the resultant bituminous mastic. Thus, further investigation is needed on the usefulness of RHA as a filler in a bituminous mix.

Objectives

This research has four objectives:
  • Analyze the suitability of HL and RHA individually as fillers by evaluating their essential properties.
  • Examine the effect of each filler on the physical and morphological behavior of the resultant bituminous mastics.
  • Design dense bituminous macadam mixes using each filler at four percentages (2%, 4%, 6%, and 8%) and compare their mechanical and durability properties at the corresponding optimum bitumen content.
  • Analyze the economic viability of each filler by comparing the costs of the prepared mixes.

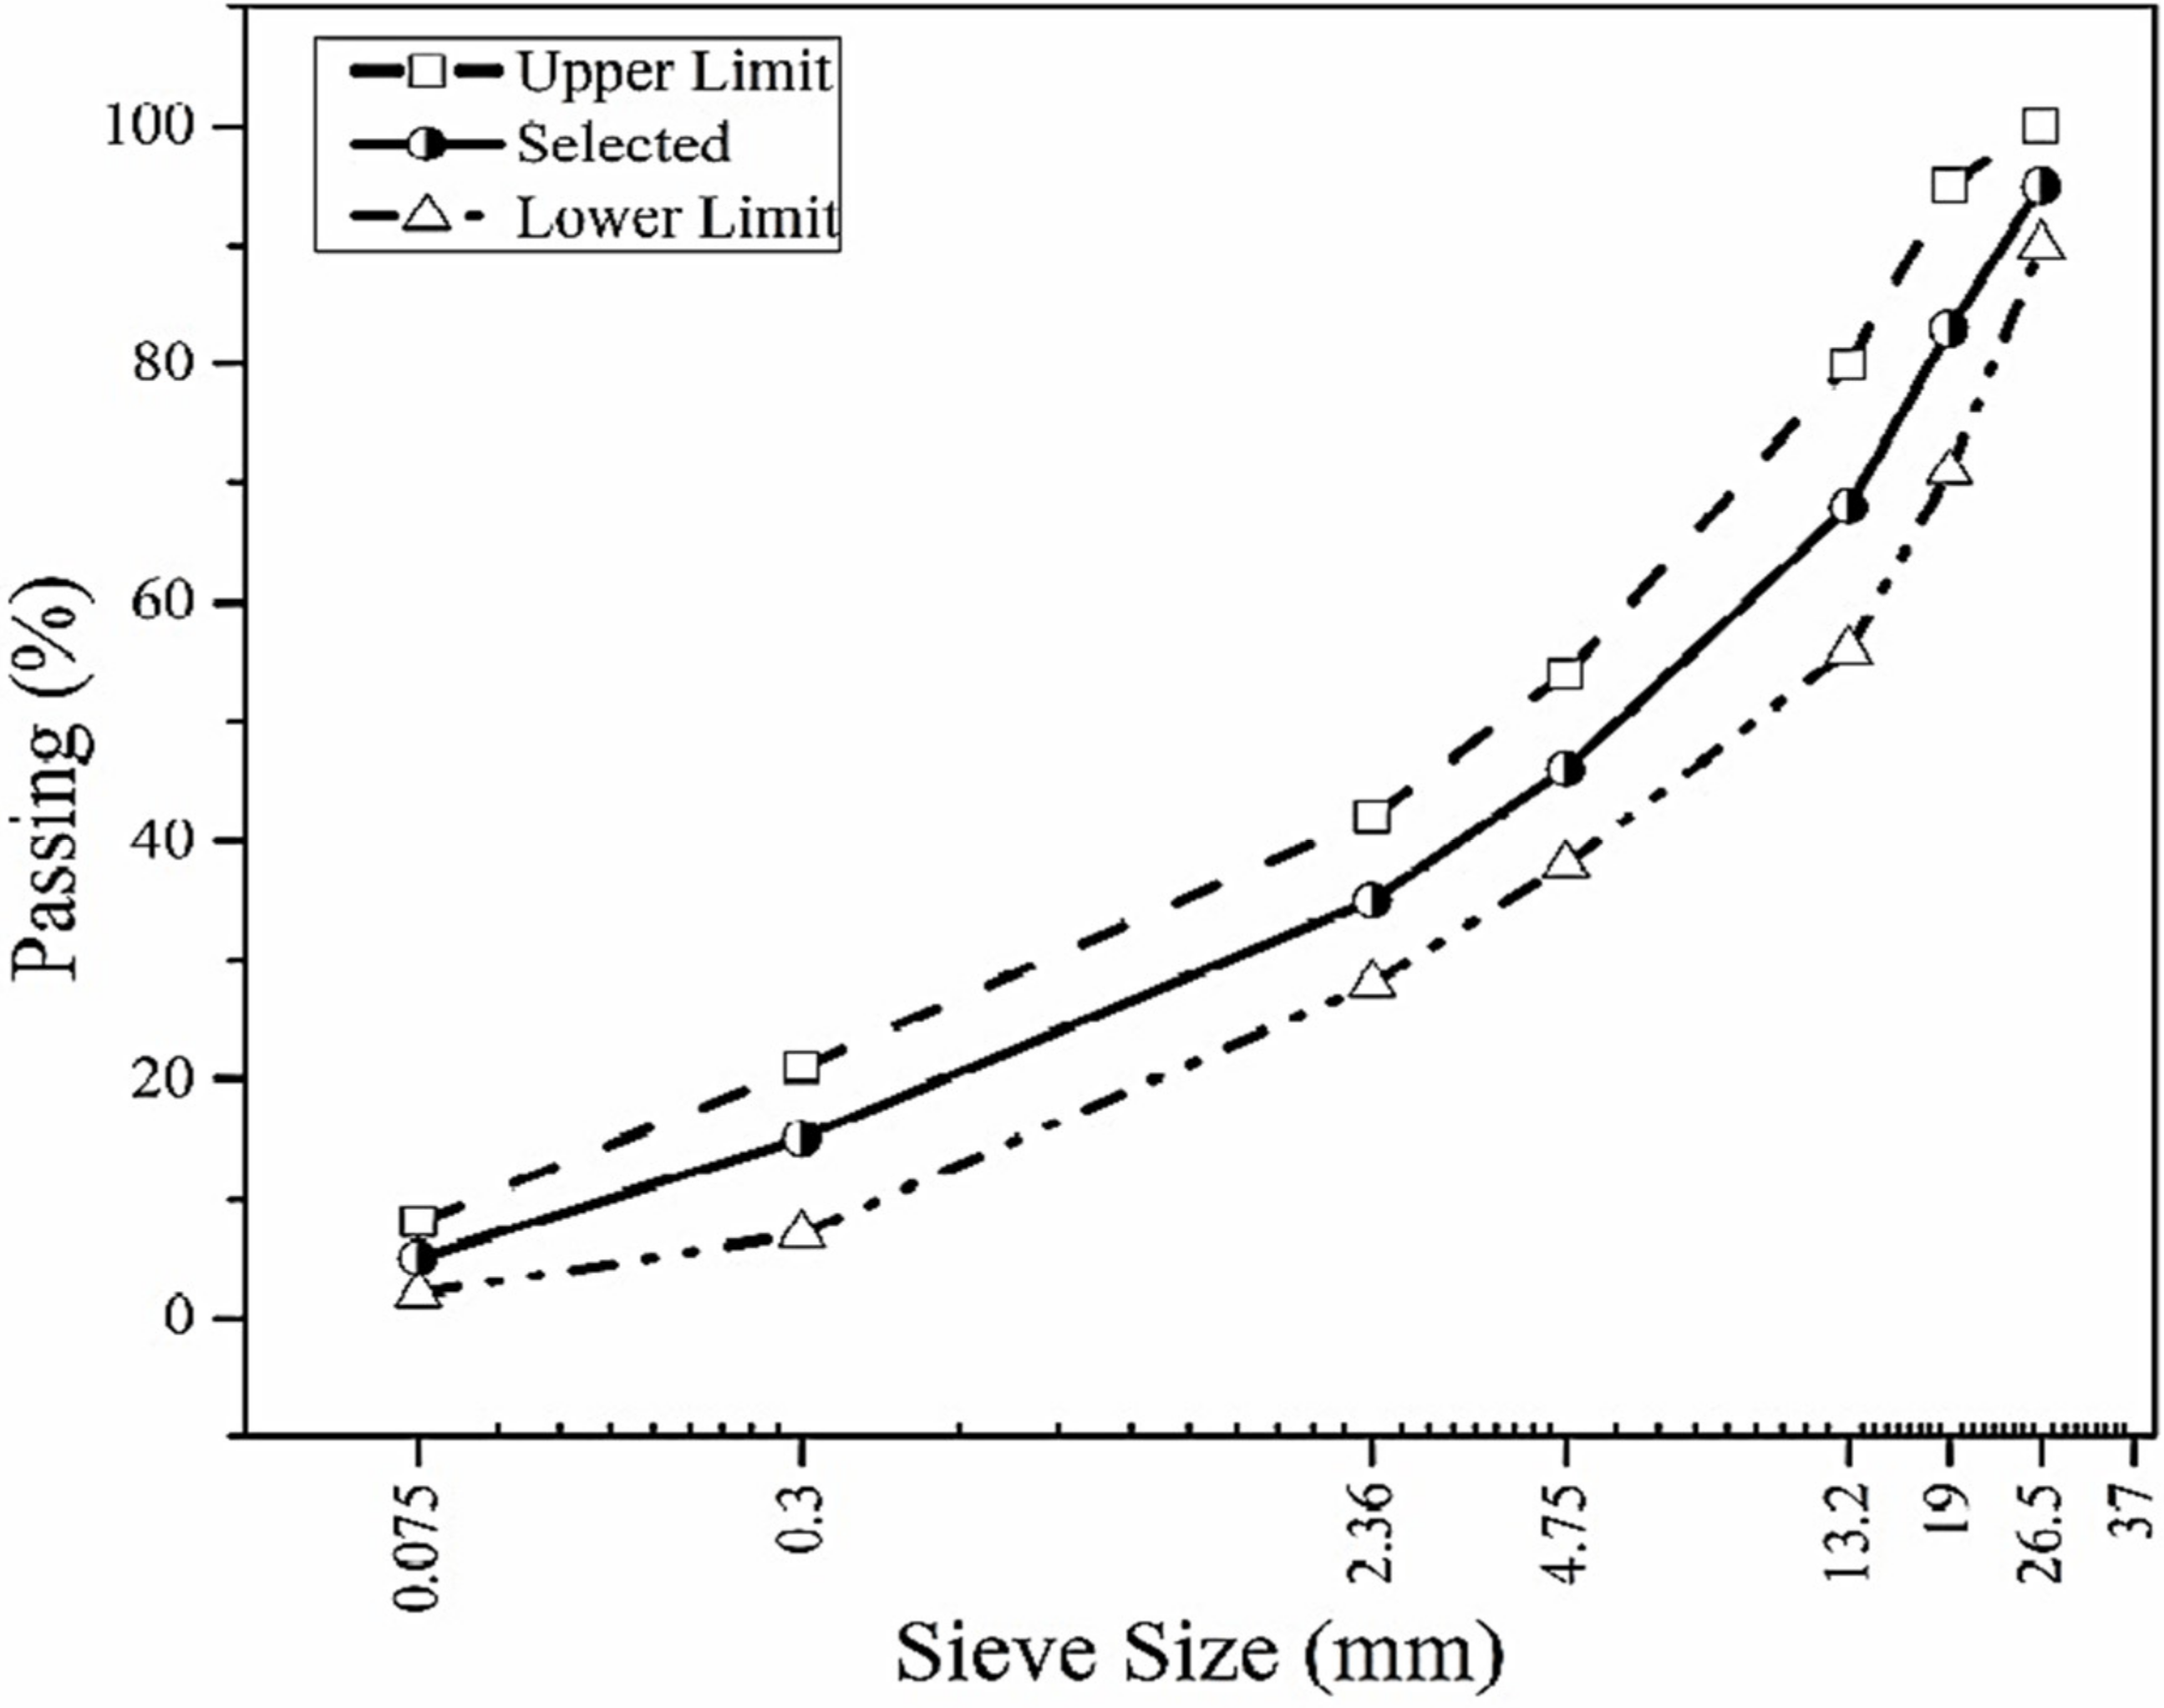
2. Materials and Methods

2.1. Materials

Aggregates of the basalt type were gathered from a Pakur quarry (Birbhum district, West Bengal, India) and used in this study. Table 1 provides a description of the aggregates’ attributes. To suit the continuous aggregate gradation of dense bituminous macadam (DBM) grade-II established by Indian standard specification [2], the collected coarse and fine aggregates were sieved. The results are shown in Figure 1.
A VG30 grade of bitumen was used as a binder. The bitumen came from Haldia Petrochemicals (Purba Medinipur district, West Bengal, India) and is typically used in the hot-mix asphalt industry in India. The binder had a penetration value of 57, a kinematic viscosity (135 °C cSt) of 368, an SG of 1.045, and a softening point of 49 °C.
HL collected from a local market of Shibpur (Howrah district, West Bengal, India) was used as the conventional filler. RHA was collected from a rice mill in the Purba Burdwan district of West Bengal, India. Oven-dried fillers were used in this investigation after sieving through a 0.075 mm sieve.

2.2. Test for Filler Characterization

The physical and chemical features of each filler were estimated according to associated specifications. Specific gravities of fillers were determined using a pycnometer as per ASTM D854 [14]. The particle size distribution test was conducted as per ASTM D422 [15], and the curves were plotted according to the guidelines. The fineness modulus (FM) and uniformity coefficient (UC) were used to examine the curves. The specific surface area (SSA) was evaluated by Blaine’s air permeability test using IS 4031 Part 2 [16]. Scanning electron microscopy (SEM) imaging methods were used to observe that the fillers’ particle shape and surface texture conformed to ASTM E 986–04 [17].
The quantity of harmful clays in the fillers was estimated by the methylene blue values (MBV) according to ASTM C837-09 [18]. X-ray diffraction (XRD) analysis was used to identify the prevalent minerals present in the fillers; the XRD was conducted using a Rigaku D/Max-IIIC diffractometer operated with CuKα radiation over a range of 5–40° (2θ = 10° to 80°) at a rate of 0.2° min−1. X-ray fluorescence spectroscopy was used to determine the chemical composition of each filler as per ASTM E1621-13 [19]. The organic content of each filler was quantified using a Loss-On-Ignition (LOI) test.

2.3. Designing and Testing of Bituminous Mastics and Mixes

2.3.1. Preparation of Mastic Samples

The mastic samples were fabricated by adding a suitable amount of fillers to preheated bitumen in order to maintain a filler/bitumen (f/b) ratio of 0.5–1.4 with a rate of 0.3 rises by weight; each sample was then mixed for 1 h. A shear blender with blending conditions of 2800 rpm at 160 °C was applied to attain homogeneity, as detailed in earlier studies [20]. Afterward, 100 gm of each mastic sample was stored in an airtight container for physical and morphological characterization.

2.3.2. Determination of the Physical Properties of Mastic

The conventional bitumen tests of penetration and softening point were performed to assess the physical properties of the prepared mastics. Those two tests may be considered a significant indicator of the stiffening effect of the fillers in mastic. Again, a conventional approach was taken from the Shell bitumen handbook to forecast the thermal susceptibility of the mastic samples in respect of the penetration index [21]. Such an index for mastics is based on their penetration value and softening point, as shown in Equation (1). A lower value of a binder’s penetration index indicates greater temperature susceptibility, whereas a higher value indicates more resistance to low-temperature cracking [22].
Penetration   Index   ( PI ) = 1952 500 log ( P e n 25 ) 20 S P 50 log ( P e n 25 ) S P 120
where   P e n 25 = Penetration value of the mastic at 25 °C, and   S P = Softening point (°C) of the mastic.

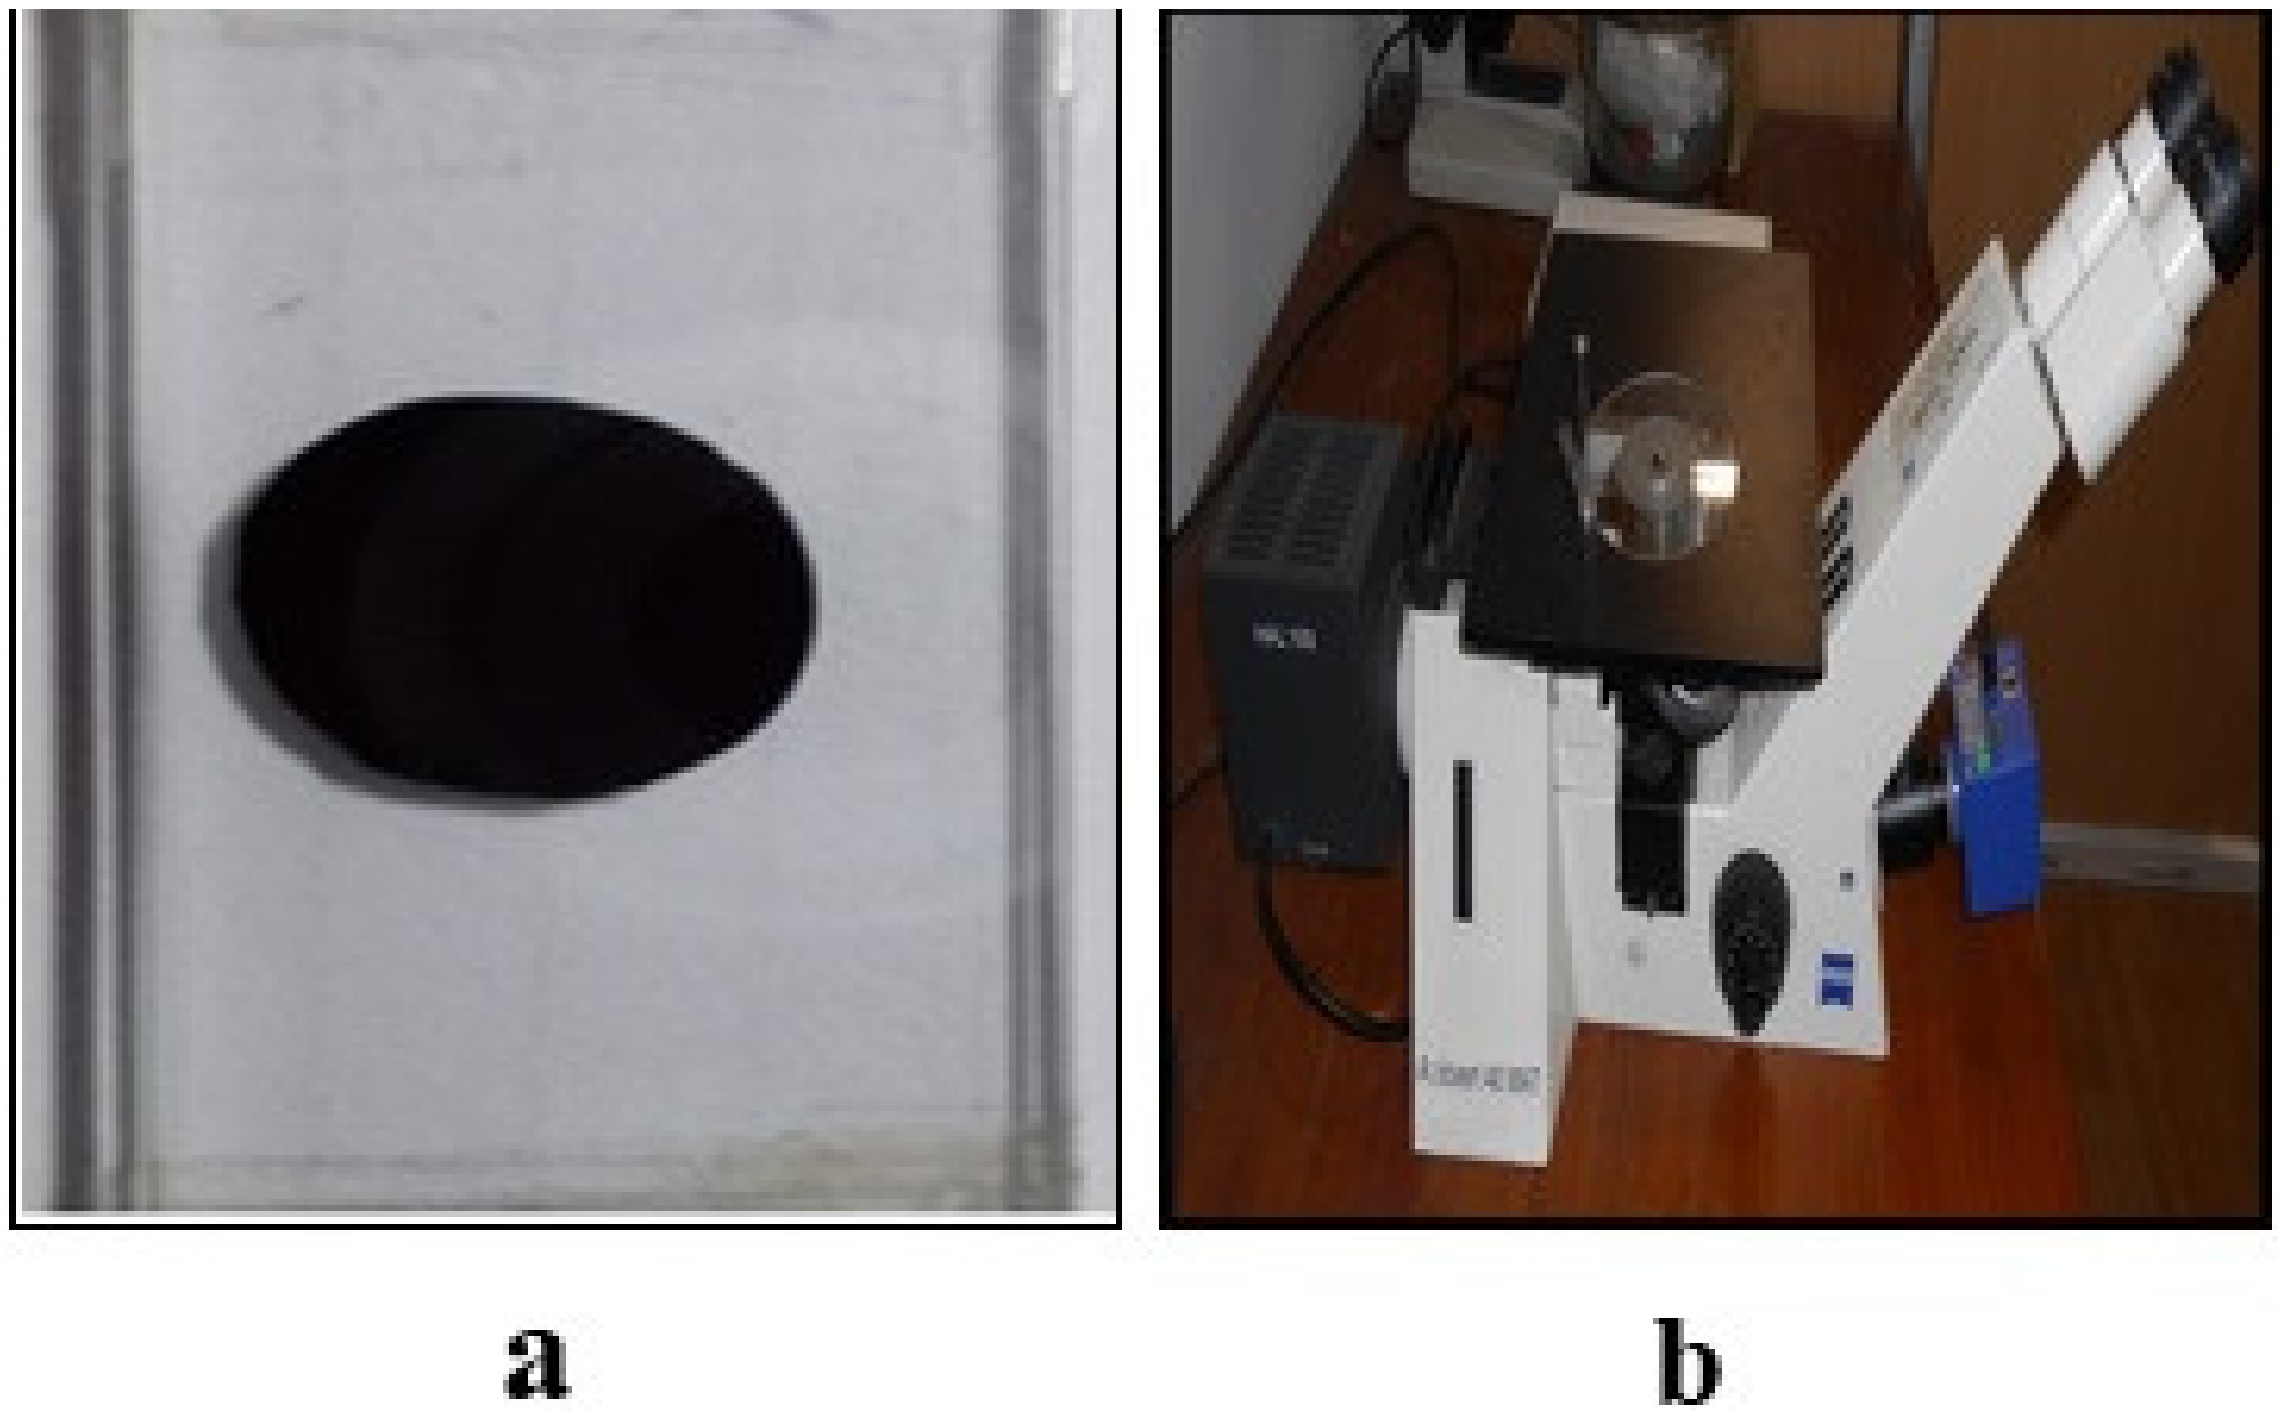
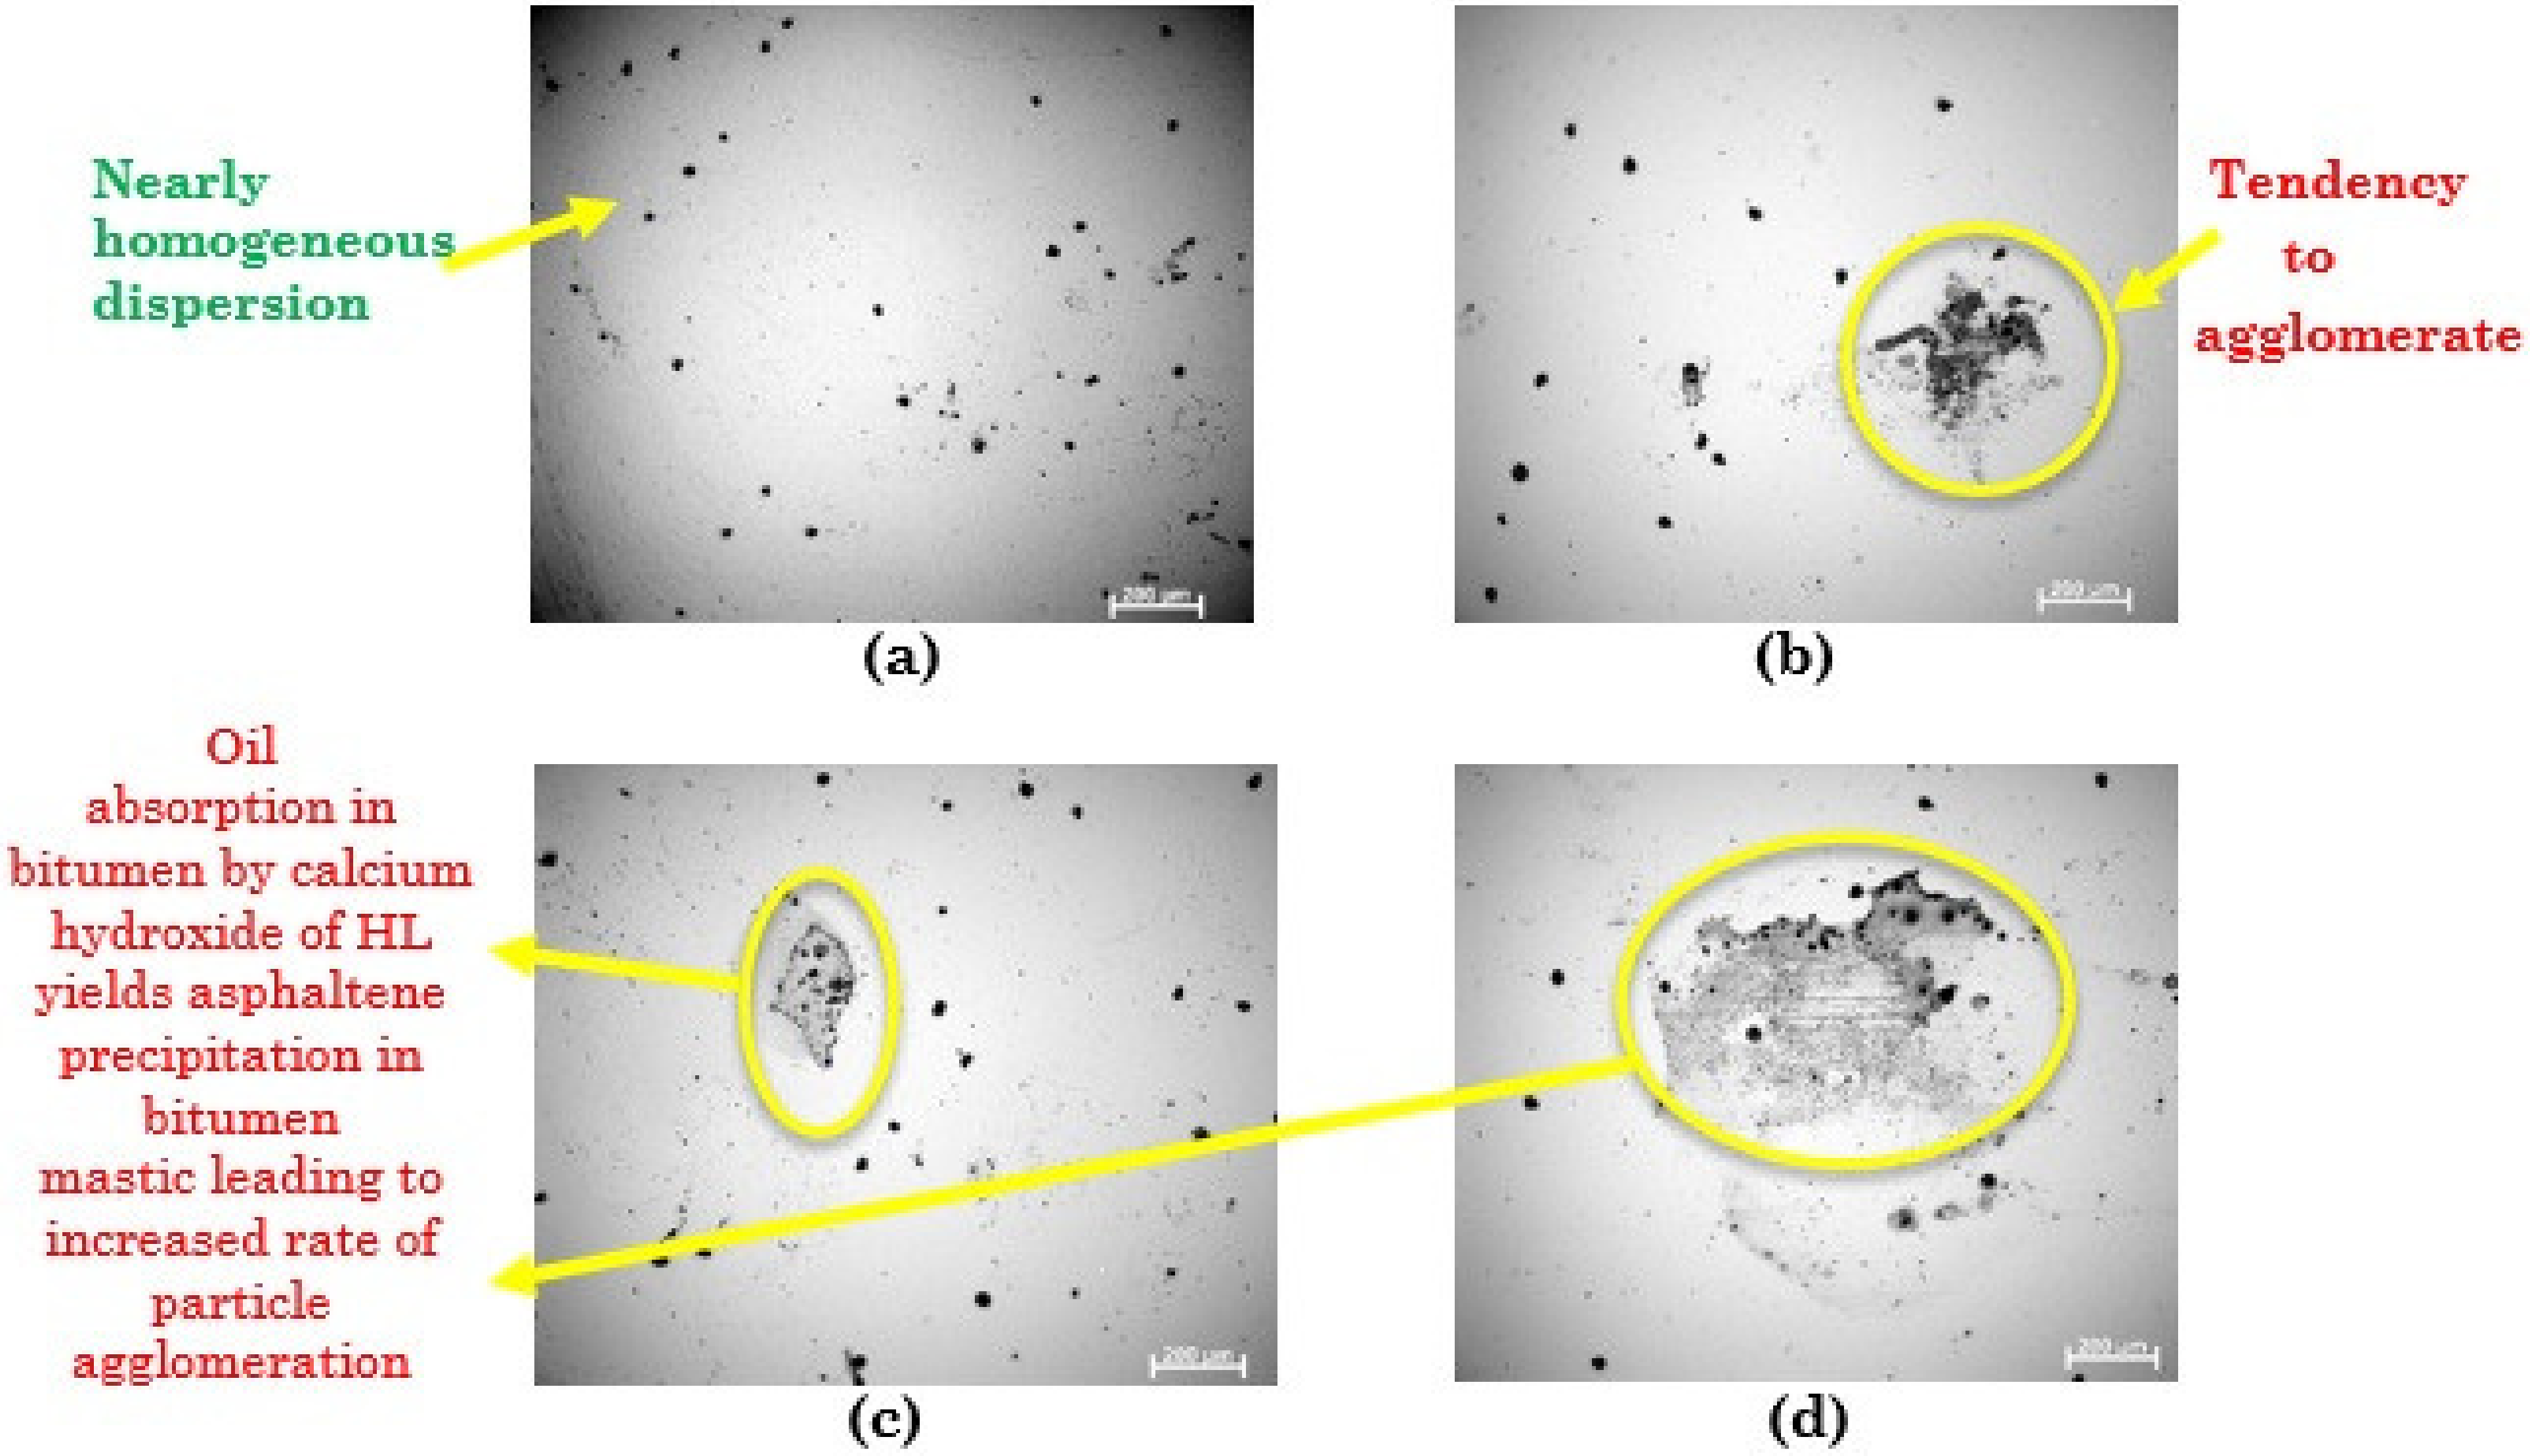
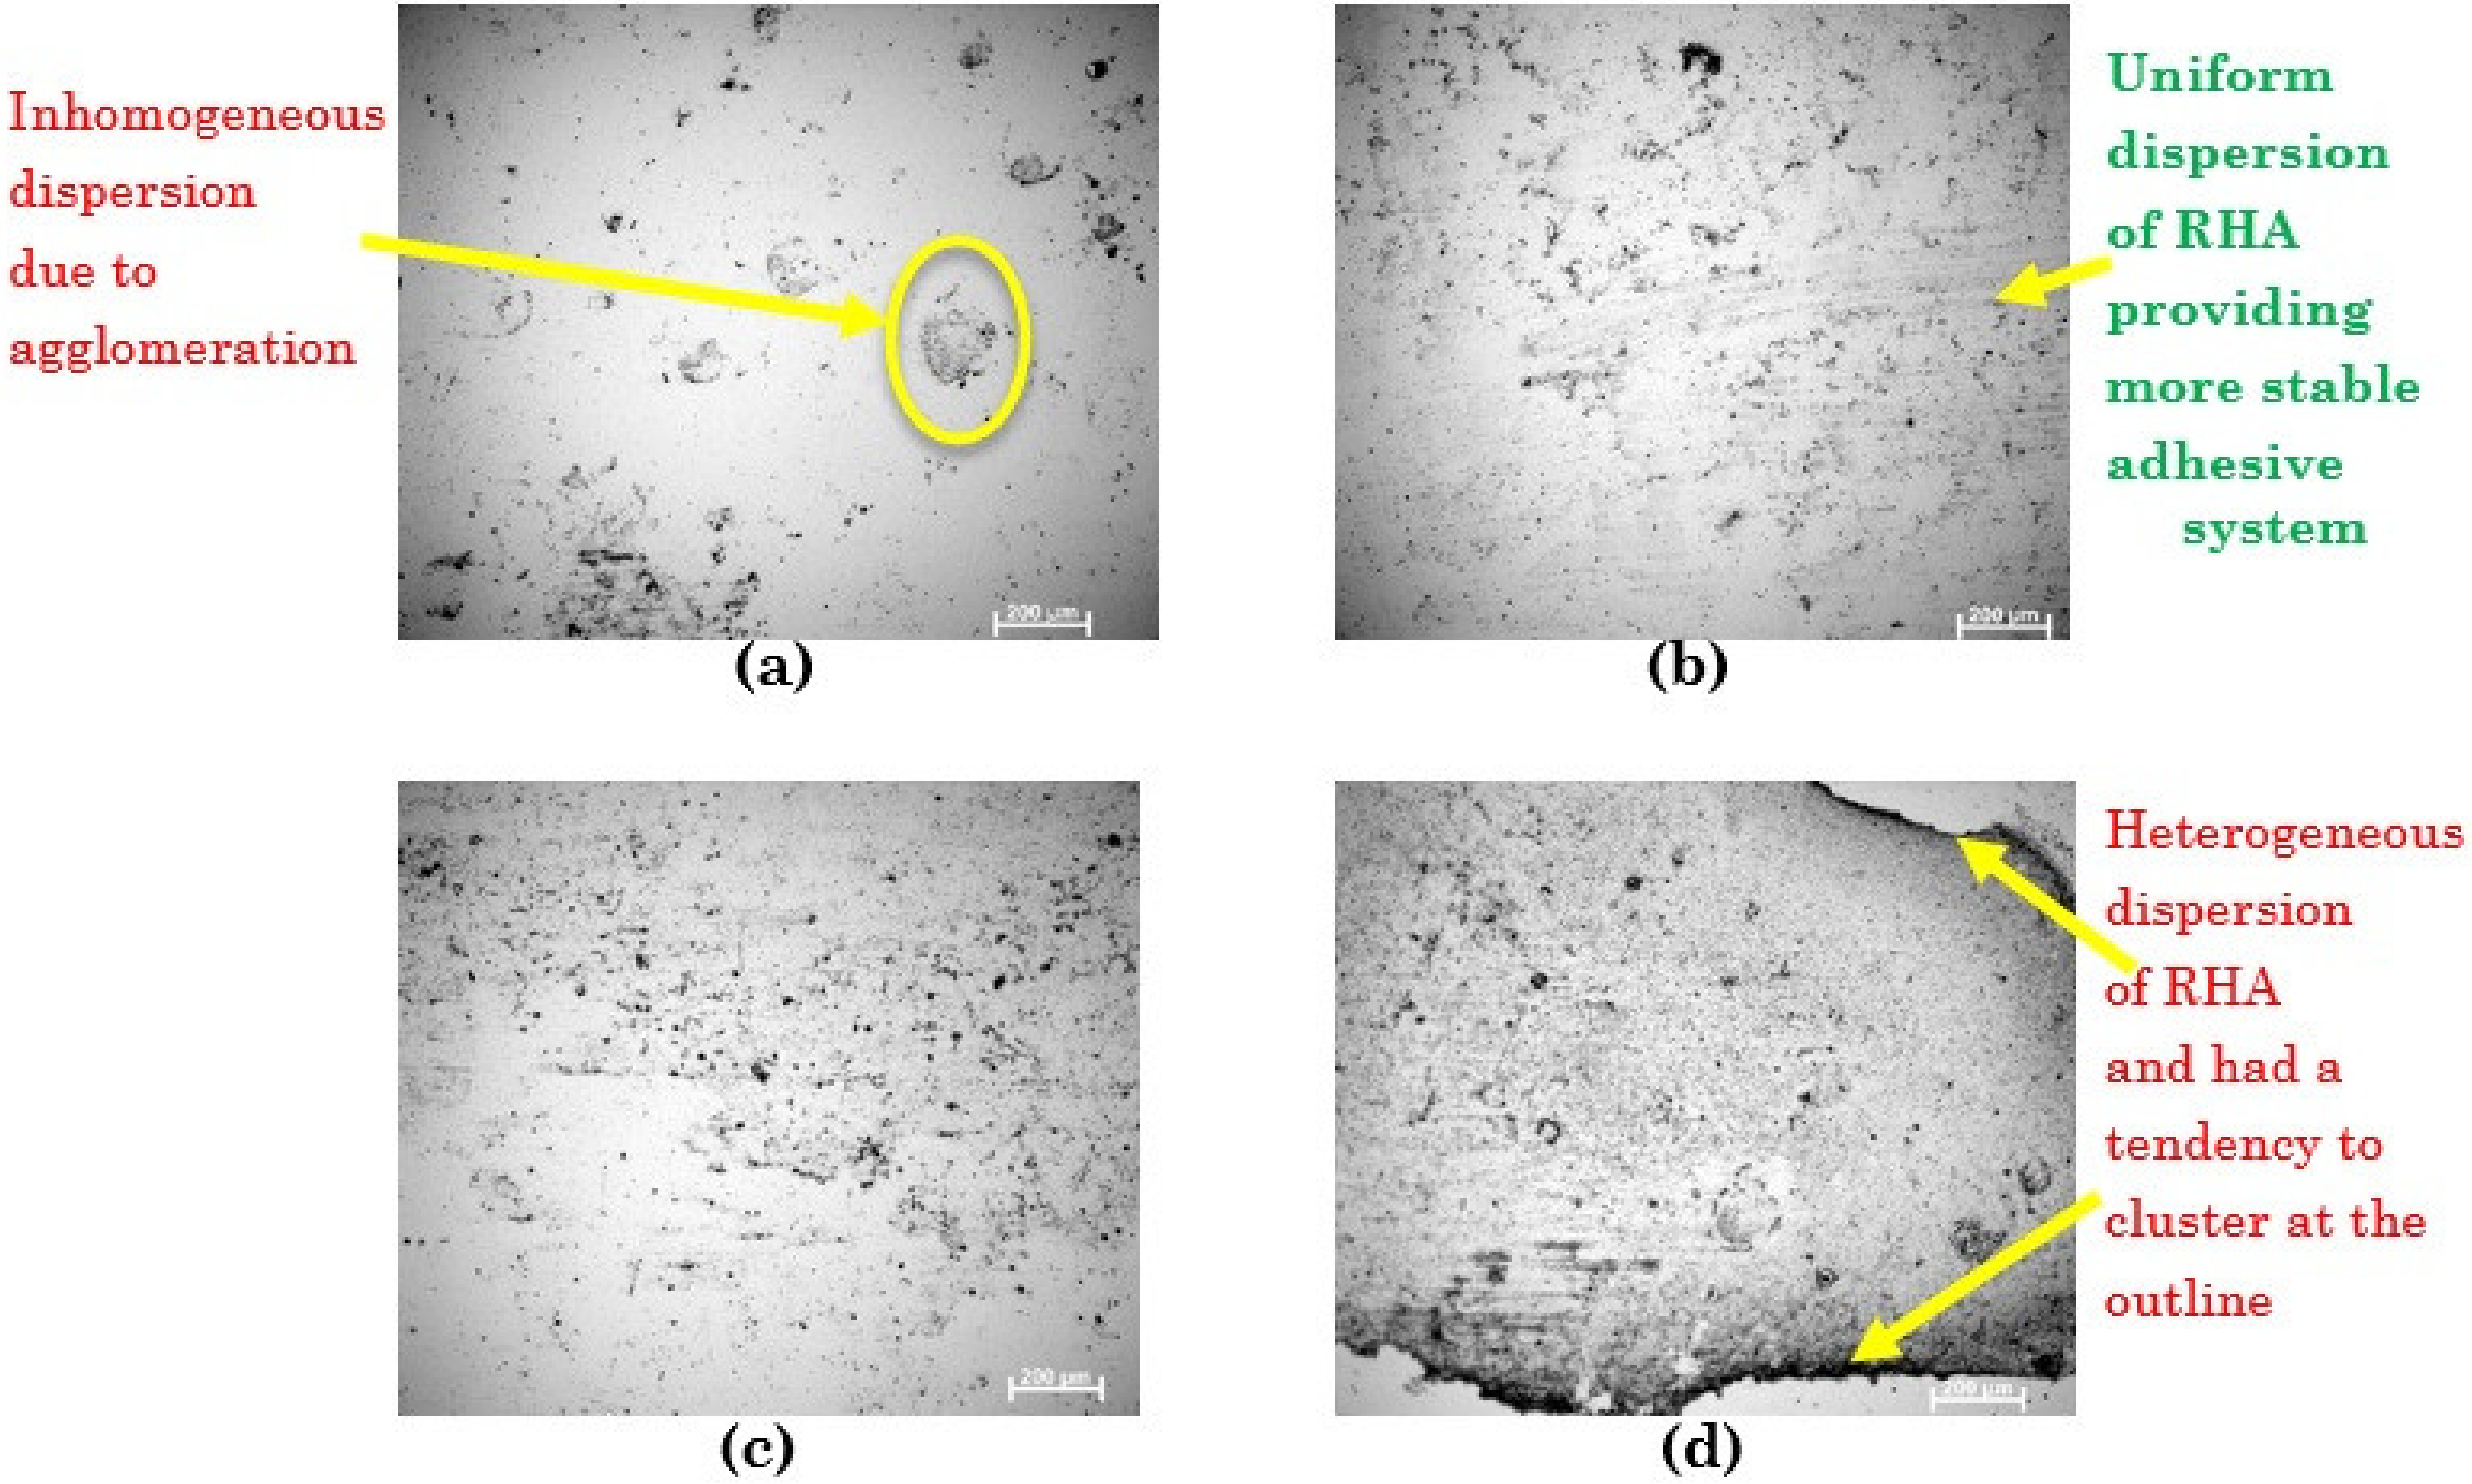
2.3.3. Morphological Analysis by Optical Microscopy Test

A Ziuss optical microscope was used to study the extent of dispersion of fillers in the binder. A droplet of warm mastic was crammed between two microscope slides that were then bound by adhesive tape at both ends and left to dry for a day in a dirt-free Petri dish (Figure 2a). Then, they were studied using an optical microscope (Figure 2b) with a 20× magnification power; the images were captured by Axiovision software. The photos of 16 numbered slides (2 replicates × 2 types of filler × 4 f/b ratios) were captured and considered for analysis.

2.3.4. Marshall and Volumetric Properties

The Marshall mix design method was used to evaluate the optimum bitumen content (OBC) of all mixes according to MS-2 [23] guidelines. For each mix, about 1200 g of aggregate was sieved at the chosen gradation (Table 2) with five bitumen contents (4.5–6.5%) and four filler contents (2%,4%, 6%, and 8% by the weight of aggregate). For each mix, 15 numbered samples (three for each bitumen content) were fabricated, and their volumetric properties, Marshall stability, and flow were calculated (ASTM D6927 [24]). The OBC of each mixture was considered as a binder percentage in the compacted samples with 4% air voids [25]. The air voids in the compacted specimens were measured according to ASTM D3203-17 [26]. The increase in filler content in the mix was achieved by reducing the fine aggregate fraction to maintain the required grading. In this study, the mix having 2% HL as filler was considered the conventional/control mix.

2.3.5. Cracking Resistance

The resistance to cracking of each mix was evaluated by measuring the average indirect tensile strength (ITS) of compacted samples by the ASTM D 6931-12 guidelines [27]. The cracking resistance of bituminous mixes was extensively examined with the help of the indirect tensile strength test [6,20]. According to the specification, testing was executed at 25 °C, and a compressive load was applied on compacted Marshall specimens (at 4% air voids) diametrically with steel strips at a continuous rate of 50.8 mm/min. Twenty-four samples were fabricated, and average ITS values for each mix were compared. The ITS was calculated using Equation (2):
I T S = 2000 P m a x π D T
where ITS = indirect tensile strength (kPa); P m a x   = peak load (N); D = the diameter of the samples (mm); and T = the thickness of the samples (mm).

2.3.6. Resistance to Moisture Damage

In this study, the resistance to moisture damage of the bituminous mixes was determined following AASHTO T283 [28]. After calculating the OBC, 48 Marshall samples were fabricated. Before casting each mix, the appropriate minimum specimen weight to reach the air voids of 7 ± 1.0% was achieved by trial and error. Each mixture was divided into two subgroups: dry and saturated. A partial vacuum was applied to the saturated specimens to achieve 55% to 80% saturation. Next, the samples were placed in a deep freezer at −18 ± 2 °C for 16 h. Then, the specimens were positioned under a 60 ± 1 °C water bath for 24 ± 1 h. Before the ITS test, the saturated specimens were located in an additional water bath at 25 ± 0.5 °C for two hours. The ITS of dry samples and the ITS of water-conditioned samples were measured at 25 °C. The ability of the bituminous mix to withstand the harmful effect of moisture was represented as the ratio of the ITS of the saturated specimens to the ITS of the dry samples, which is known as the tensile strength ratio (TSR). The TSR (expressed as a percent) was calculated using Equation (3).
T S R = I T S s a t u r a t e d I T S d r y × 100 %

2.3.7. Creep Resistance

As described in BS598-111 [29], the uniaxial static creep recovery test was used to measure the resistance to permanent deformation of bituminous mixes with different fillers. This test was performed by applying a static load to a specimen and measuring the resulting deformation with time. The reversible part of the total deformation was also recorded by removing the entire load and measuring deformation after a recovery time equal to the loading time. A set-up was fabricated at the transportation Engineering Laboratory, IIEST, Shibpur. This test was performed using the Marshall loading frame, a dial gauge with an accuracy of at least 0.001 mm, and a video camera for recording the dial gauge reading and time. In this test, a 10 kg load was applied to provide axial stress of 100 kg for 1 h on the sample, followed by unloading and a recovery time of 1 h, all at a test temperature of 27 °C.

3. Results and Discussion

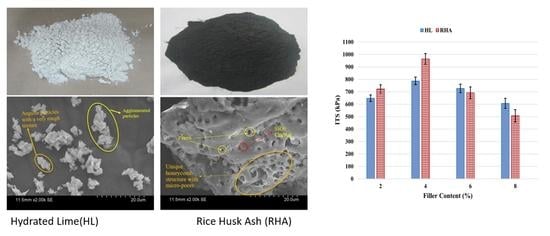
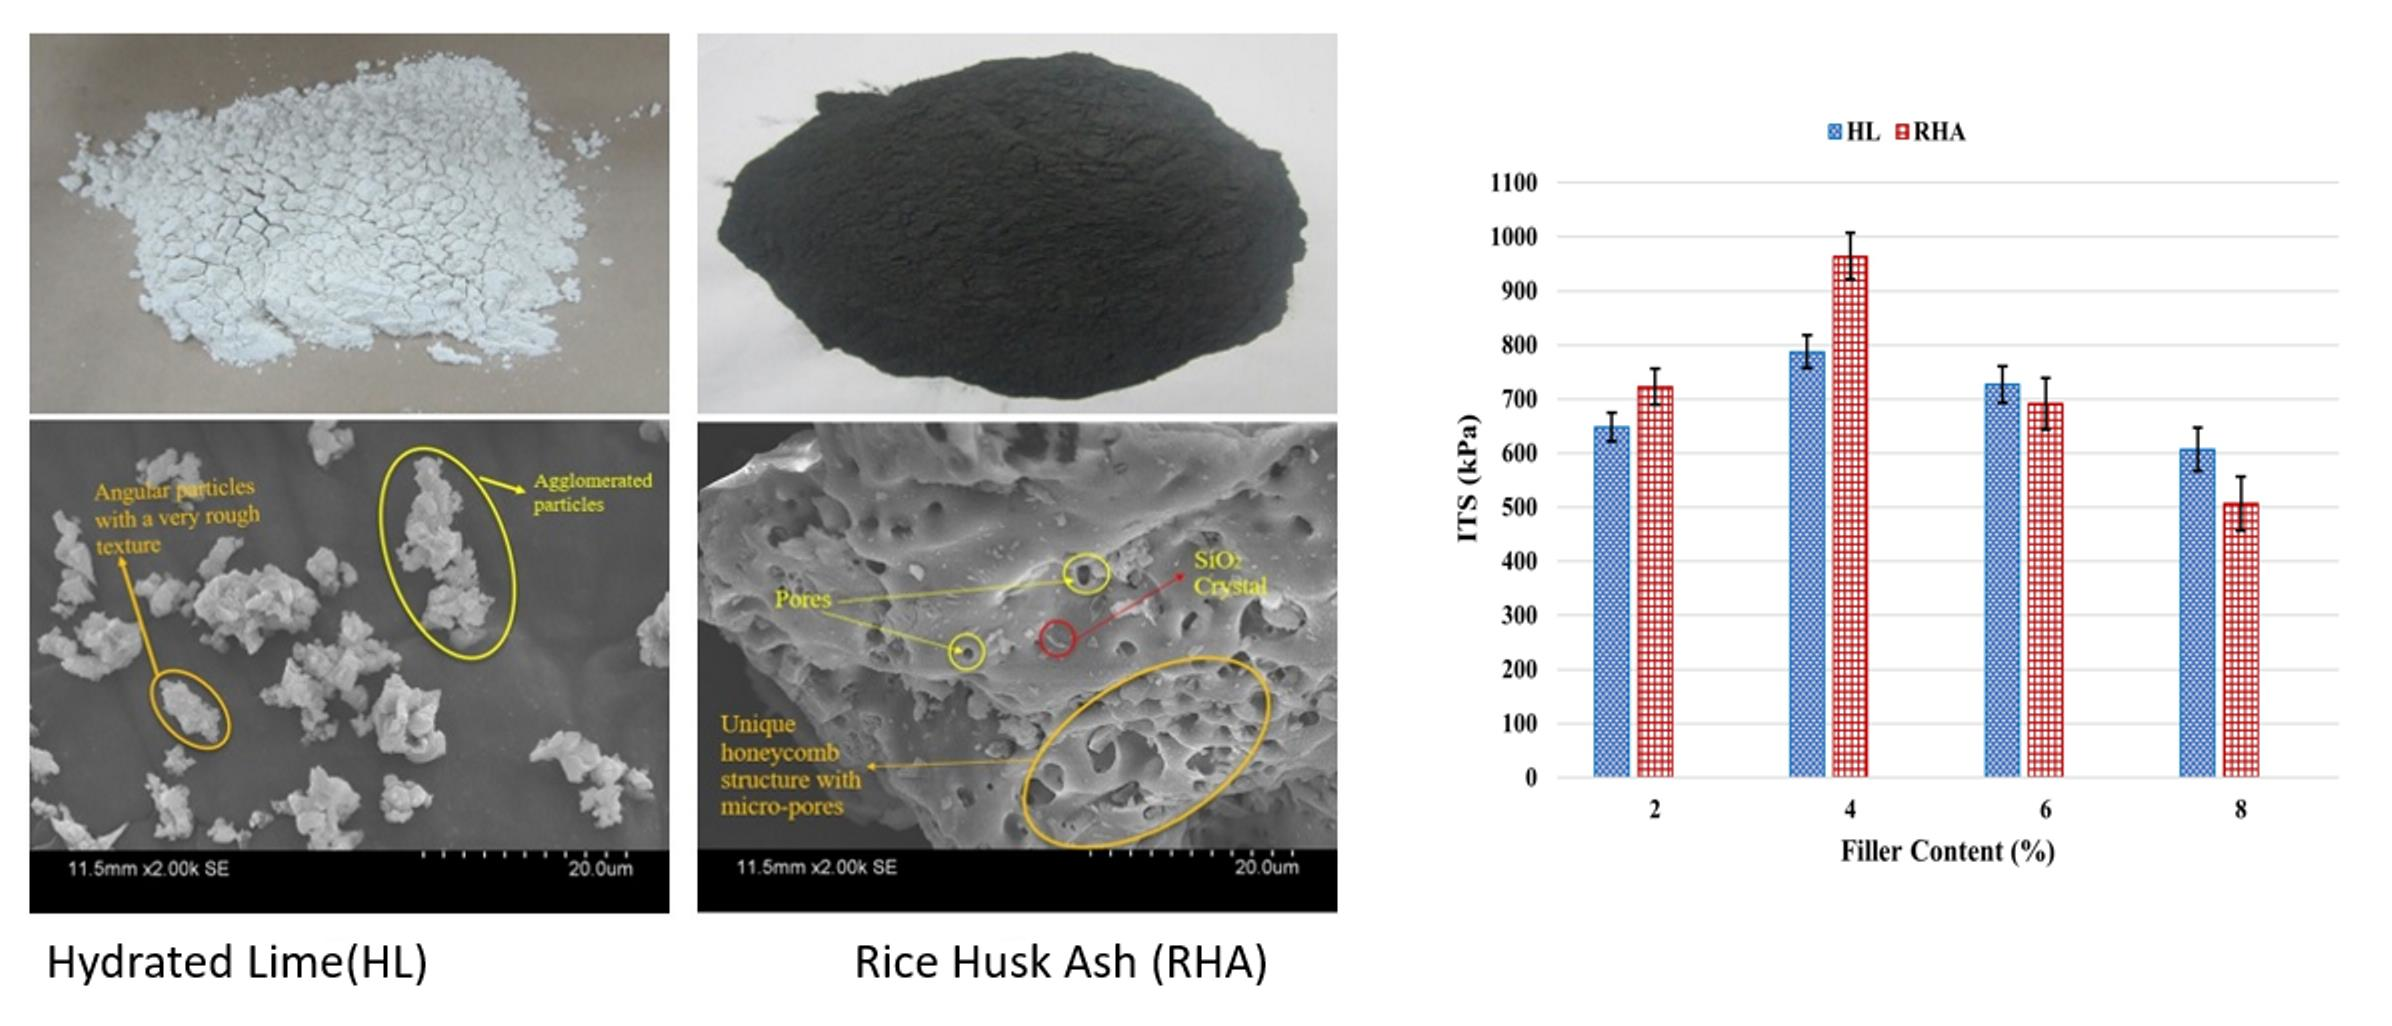
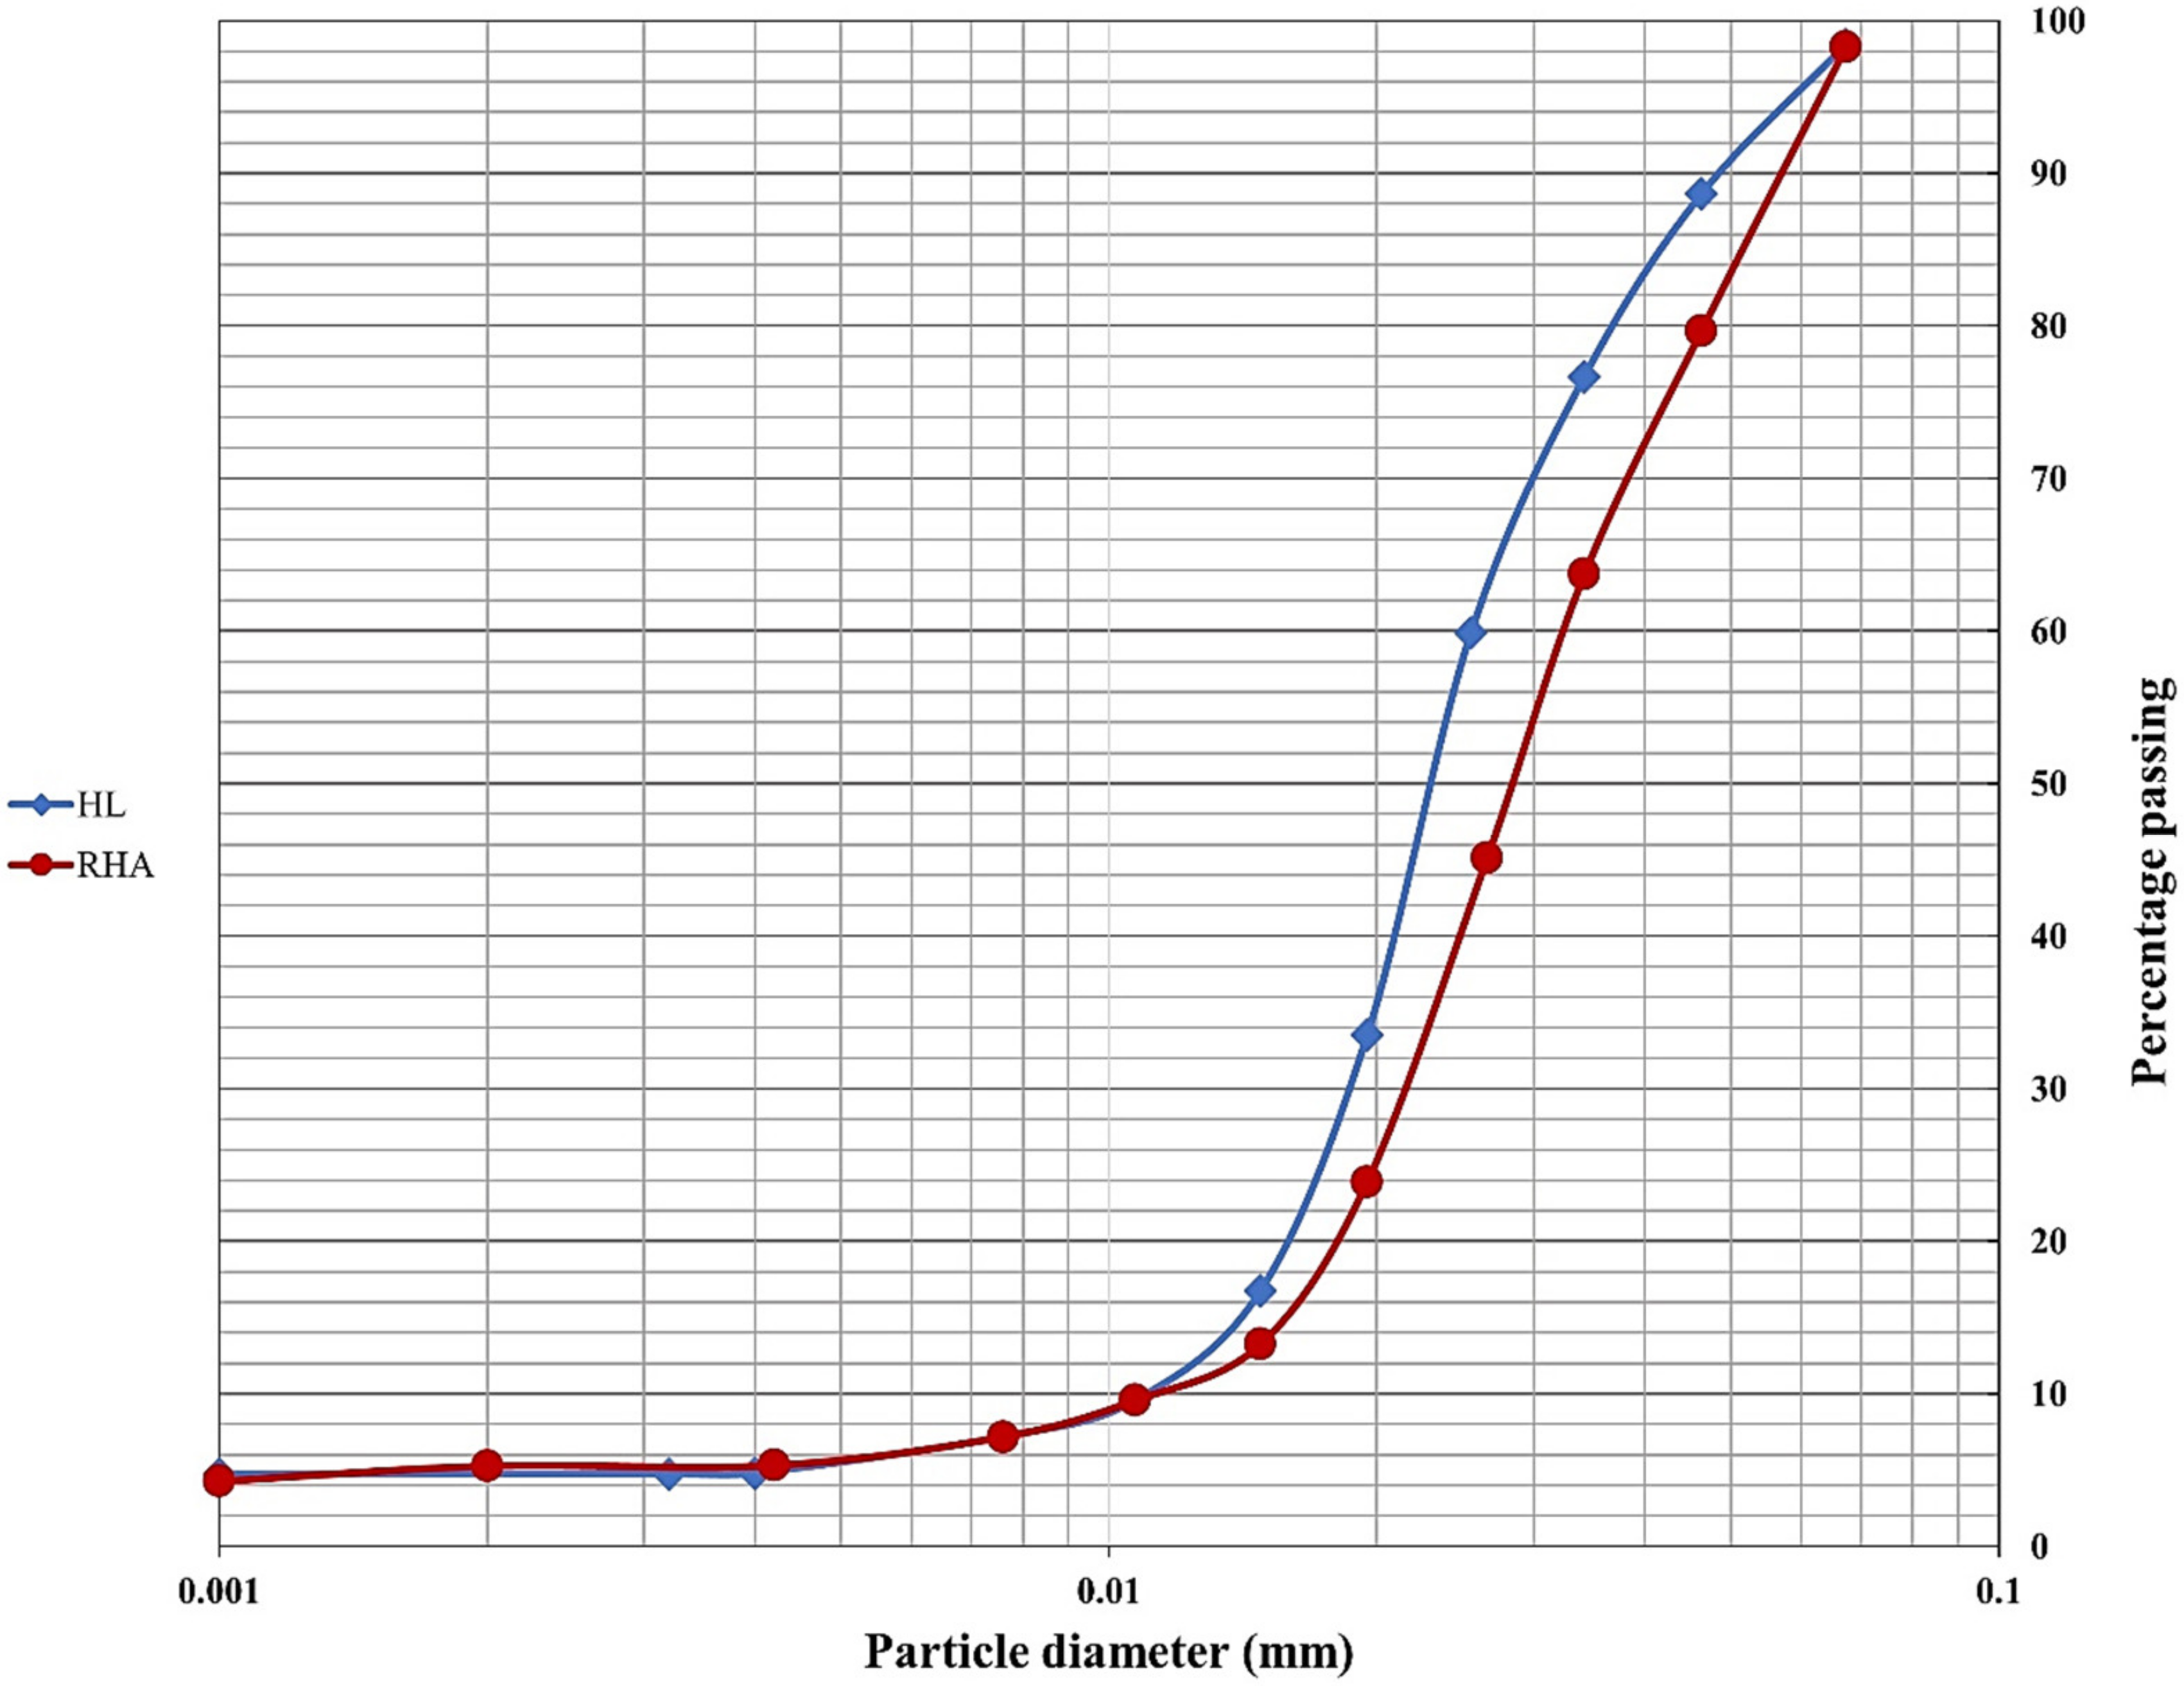
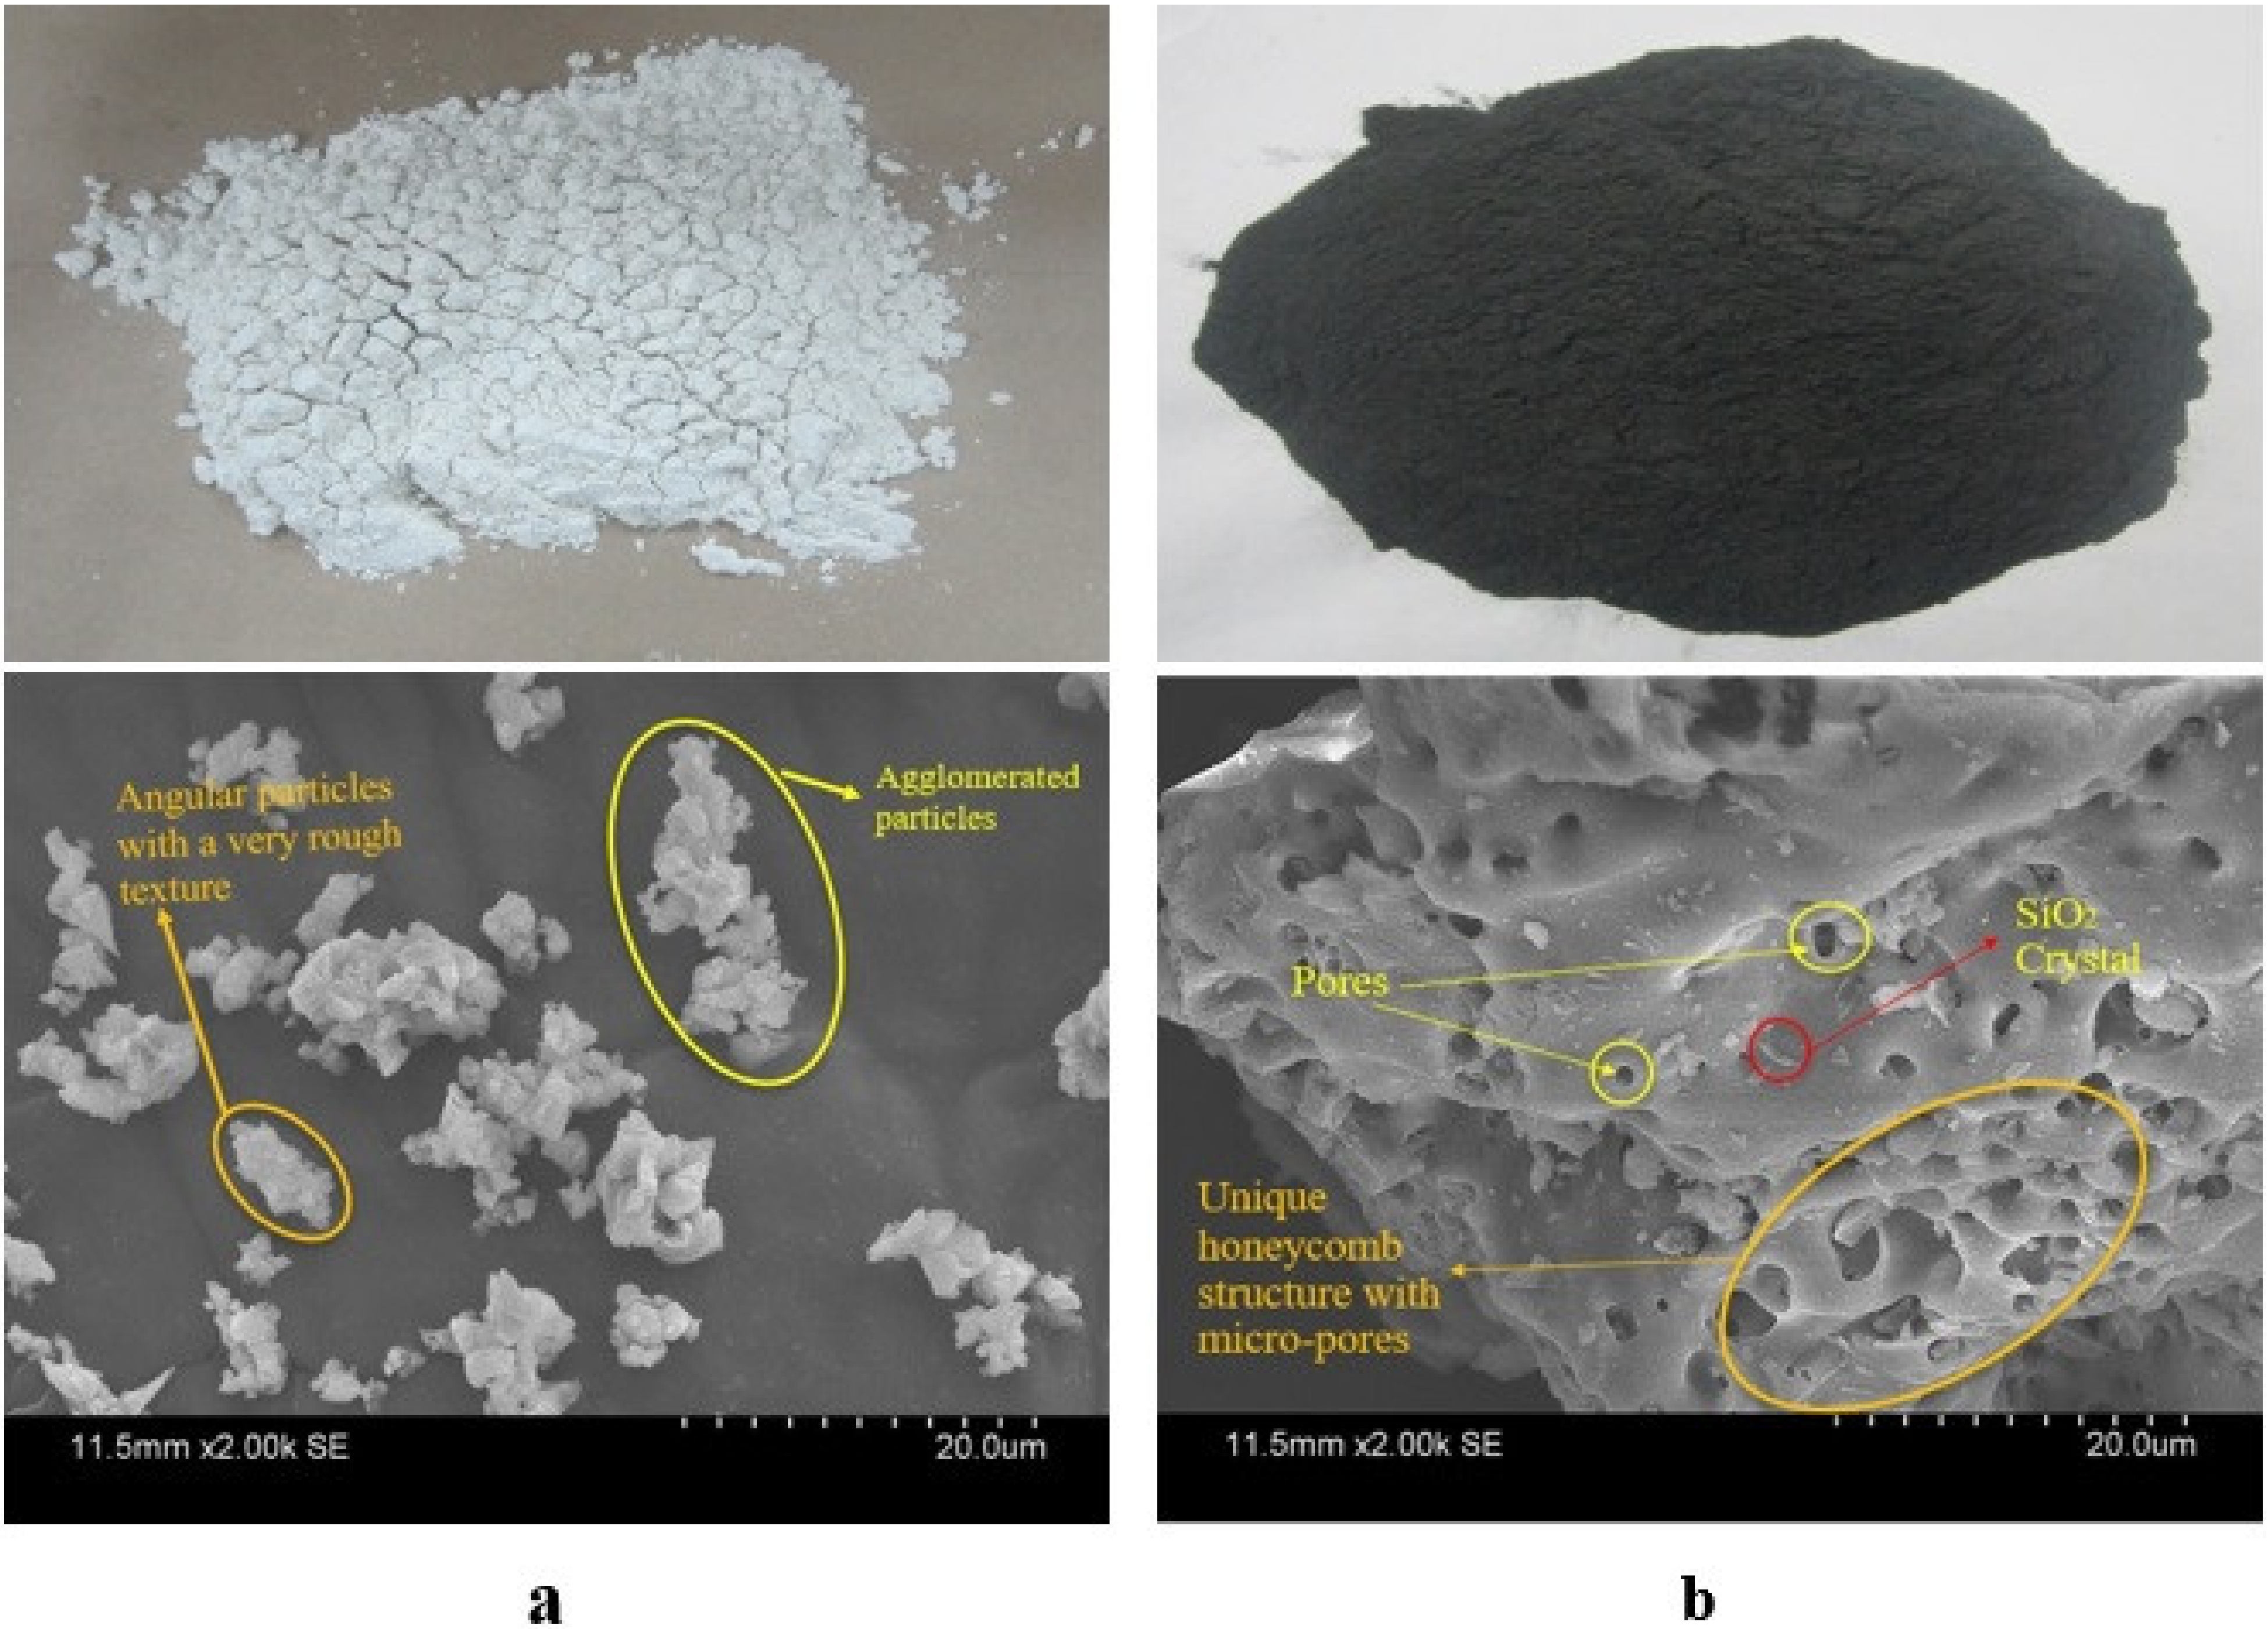
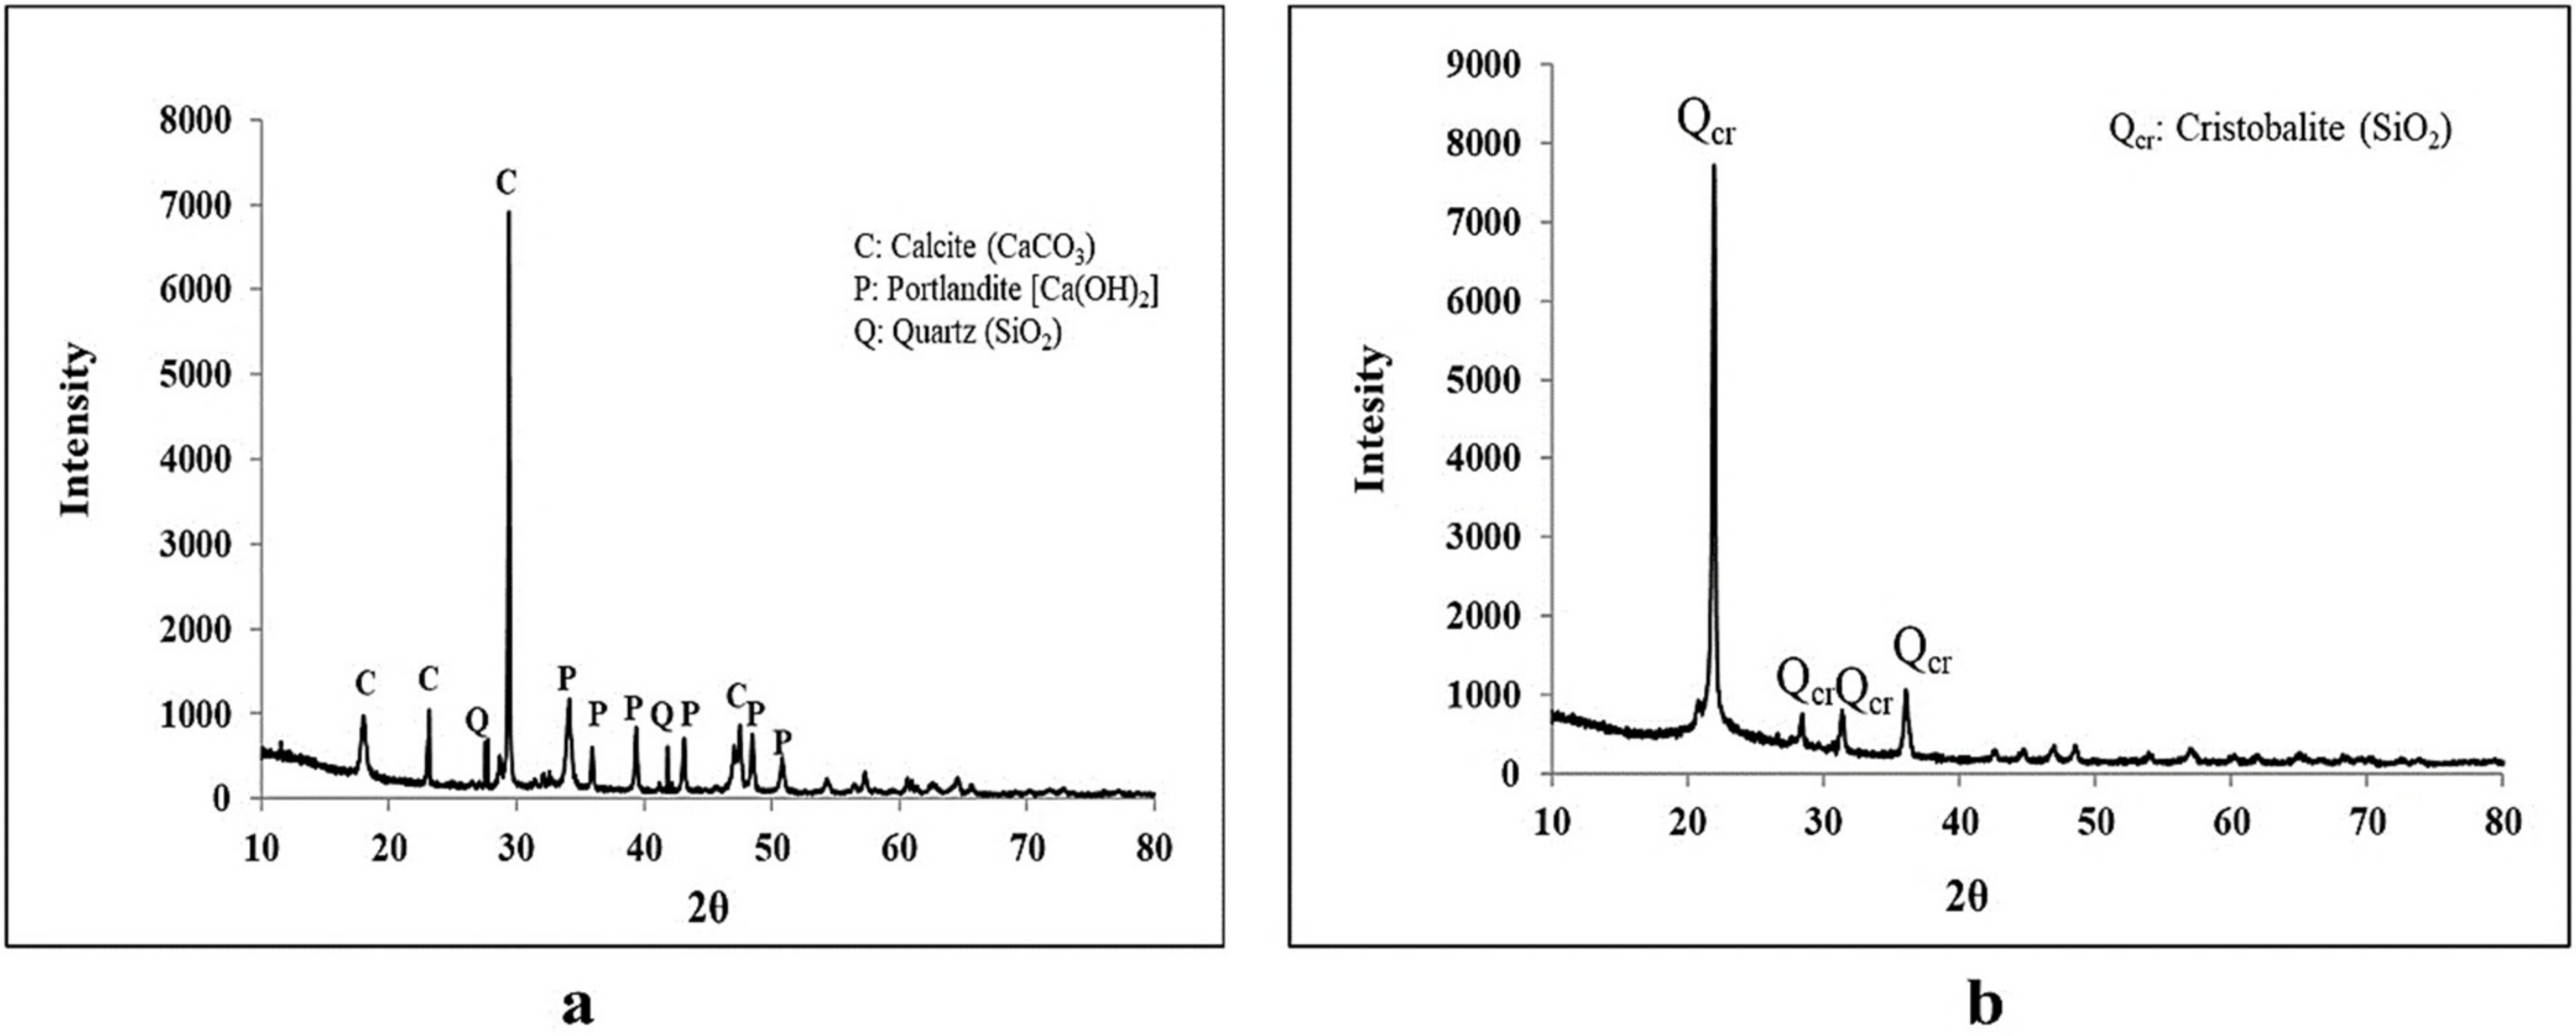
3.1. Filler Characterization

The characteristics of the considered fillers are shown in Table 2 and Figure 3, Figure 4 and Figure 5. The specific gravity of RHA (2.00) was marginally less than that of HL (2.15). RHA was a finer filler than HL; the FM of RHA (2.86) was less than the FM of HL (3.18). Earlier studies [3,30] stated that fillers that are finer in nature show a stronger physicochemical interaction with bitumen, thus providing higher stiffness and better moisture resistance. The UC values of RHA (2.92) and HL (2.33) indicated that both were uniformly graded fillers. As expected, the specific surface area of RHA (566.8 m2/kg) was larger than the specific surface area of HL (432.5 m2/kg).
Figure 4 shows the SEM images of the fillers. As shown in Figure 4a, HL usually has a rough texture with variations in sizes, and it has a proclivity toward agglomeration. Figure 4b shows that RHA has larger particles of irregular shape and is poriferous in nature. In the SEM image of RHA, a unique honeycomb structure can be seen. RHA particles range in size from 10 to 100 microns. Experience indicates that the cellular structure of RHA has been gradually broken-down during grinding, which can account for the RHA’s higher specific surface area compared to HL [12]. This is particularly evident in ashes derived from the uncontrolled RHA combustion processes, which can produce high carbon content and wide distributions of particle size [12].
A filler containing a high quantity of detrimental clay may swell when interacting with water and act as a partition between binder and aggregates, weakening the adhesion at the bitumen–aggregate interface [6]. There is no specific range for methylene blue value (MBV) given in India’s specifications. In Portugal’s specification, the highest allowable limit for MBV is 10 g/kg. The MBV values for HL (0.97 g/kg) and RHA (1.27 g/kg) were much lower than the permissible limit. XRD diffractograms of the studied fillers are shown in Figure 5. The HL composition had a prevalence of calcite and portlandite. These compounds are popularly known as anti-stripping agents and are generally found in HL and ordinary Portland cement. A small percentage of calcite was also found in RHA. Silica in the form of cristobalite and quartz was observed in all fillers but in different quantities. Silica in the form of cristobalite was observed in RHA. As shown in Table 2, the chemical characteristics of HL show a high proportion of CaO (approximately 72%), along with an LOI of 21.69%. RHA shows a composition similar to the F pozzolans [31], since the sum of Fe2O3, Al2O3, and SiO2 is more than 70%, and the LOI is 6.15%. Although there is no permissible limit for the LOI value, it would be more feasible to use fillers with a relatively low LOI in order to reduce the possible preoccupation of binders by unburned carbon particles [32].

3.2. Mastic Evaluation

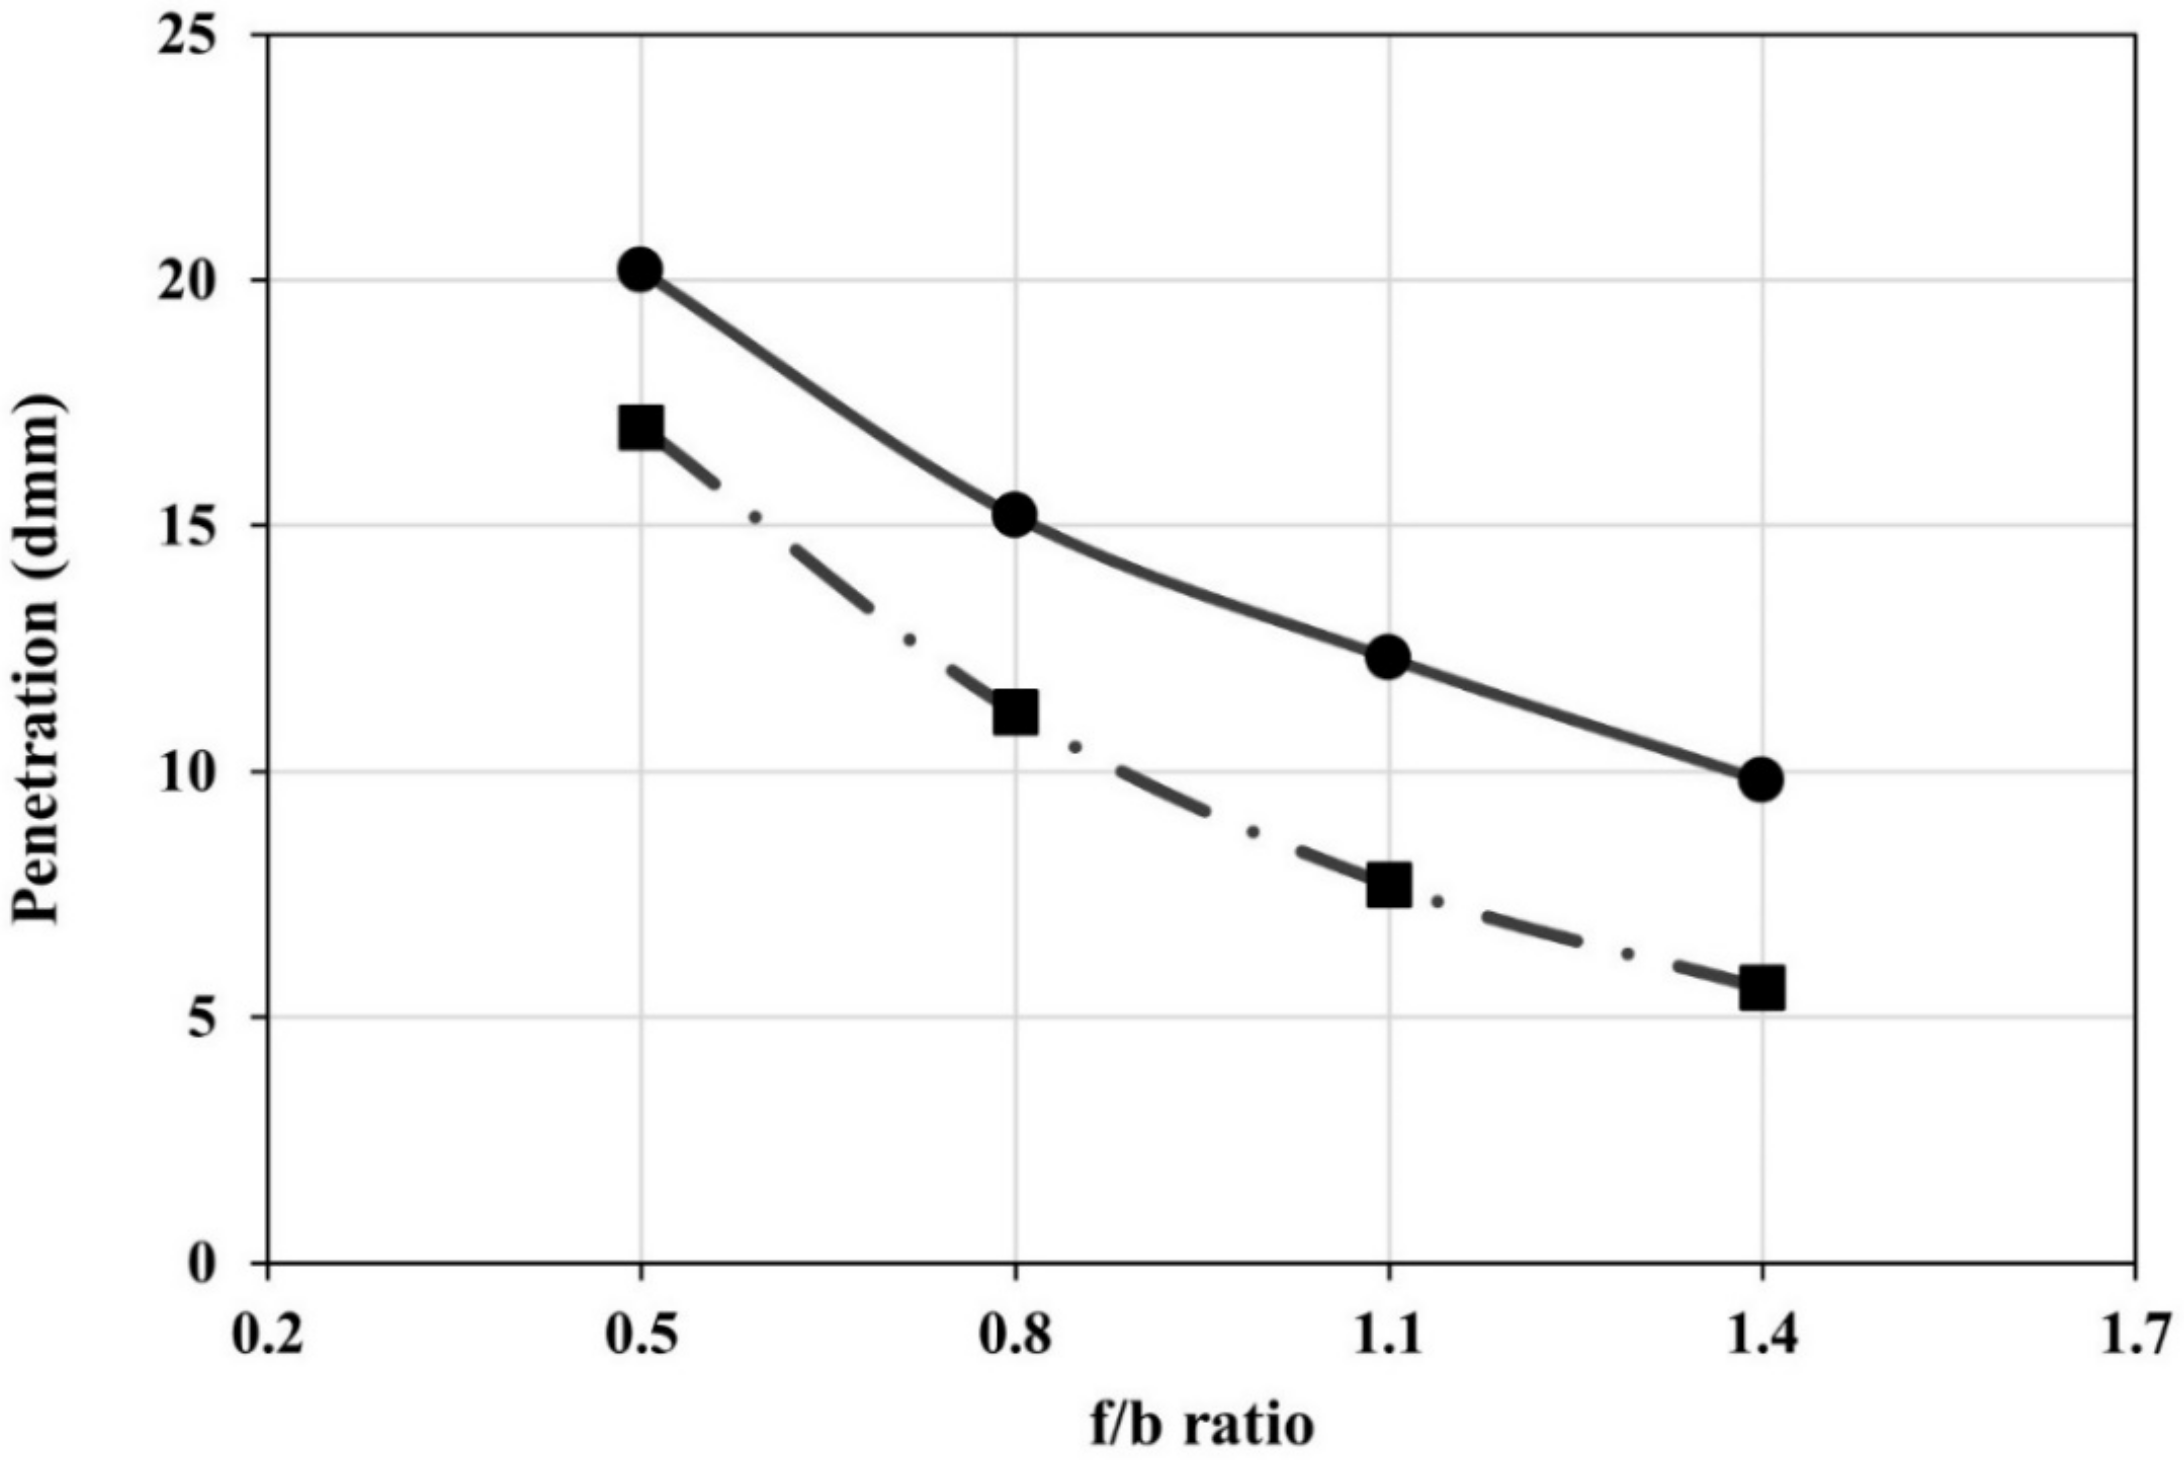
3.2.1. Physical Properties of Mastics

The change in physical properties of mastics prepared with various proportions of reference fillers is shown in Figure 6 and Figure 7. The penetration and the softening point are inversely co-related. The penetration value shows the hardness and consistency of the bituminous binder, and the softening point indicates the temperature at which the binder changes its phase. Figure 6 shows a continuous decreasing tendency in penetration value of the mastic blend, and Figure 7 shows an increasing drift in the softening point of the mastic blend. Compared to HL at the same f/b ratio of the mastic samples, RHA shows a lower penetration value and a higher softening point. This might be due to the lower density and higher specific surface area of RHA compared to HL. It is well-known that the inclusion of filler with fine particles makes a bituminous binder stiffer and improves the performance of the resultant mixtures under permanent deformation [33]. Further, a bituminous binder with a high softening point can resist deformation due to a temperature increase. The test results for softening point show that the mastic having RHA is an excellent solution for a hot climate such as India’s.
Figure 8 shows that the inclusion of RHA in binder increases the penetration index with an increase in the f/b ratio. At an f/b ratio of 0.8, the penetration index of bituminous mastic having either HL or RHA as filler lies within the specified range of −1 to +1 [34]. This indicates that the thermal susceptibility of the bitumen was improved by the addition of HL or RHA fillers. Therefore, it is possible to use those waste fillers for road construction in a hot climate; this is in line with observations from previous studies [12].

3.2.2. Morphological Analysis of Mastic

The mastic is the delicate phase of a bituminous mix; the affinity between filler and bitumen is vital for good performance of the bituminous mix [1]. The morphology of mastic made with HL or RHA at f/b ratios of 0.5, 0.8, 1.1, and 1.4 is shown in Figure 9 for HL and Figure 10 for RHA. The uniform dispersion of HL molecules in bitumen is shown at the f/b ratio of 0.5 (Figure 9a). HL is very active chemically and has a relatively low molecular weight, and it has a high relative concentration of reactive chemical functionality. HL also has a comparatively strong base and reacts with acid components such as carboxylic acid and 2-quinolone-type. Removal of these acid components from the bitumen matrix enhances the compatibility in the bitumen–filler system; this may account for the excellent stripping performance of the conventional mix. For HL at f/b ratios of 0.8, 1.1, and 1.4, as shown in Figure 9b–d, the HL particles tend to be clustered in the bitumen. Additionally, the absorption of bitumen’s oil fraction by calcium hydroxide in HL increases the rate of particle agglomeration, leading to asphaltene precipitation in the mastic. For RHA, accumulation was more likely to occur at the f/b ratio of 0.5; Figure 10a shows the heterogeneous dispersion of RHA particles in bitumen. RHA molecules had their best bonding arrangement in the mastic at the f/b ratio of 0.8; Figure 10b shows the homogeneous dispersion of RHA and adequate filling of the pores through absorption of the acid molecules of bitumen by siliceous nanoparticles of RHA, providing a steadier adhesive system [33]. This result parallels the mix performance, which suggests that RHA modification at the f/b ratio of 0.8 may significantly enhance the stiffness and resistance to moisture damage of the RHA-modified mix.

3.3. Performance of Bituminous Mixes

3.3.1. Marshall and Volumetric Properties

The change in average Marshall properties (air voids, voids in mineral aggregates (VMA), voids filled with bitumen (VFB), stability, and flow) of the mixes with OBCs are shown in Table 3. The conventional mix (HL at 2% filler content) has an OBC of 5.2%; the OBC at 4% filler content is lower at 5.17%, and then reaches 5.6% at 8% filler content. In contrast, the RHA-modified mixes display lower OBC in comparison with HL for filler content levels of 2%, 4%, and 8%. It should be noted that RHA shows nearly 5.9% lower OBC than the conventional mix when 4% filler is used. A similar trend was observed in earlier studies [12,30,33]. Compared to HL, RHA has larger particles, as shown in Figure 4. Nonetheless, RHA has a larger specific surface area than HL. This can be attributed to the mesoporous structure of RHA particles. However, the pores in RHA are not accessible to binder molecules [12], thus the OBC of RHA is lower. The range of pore diameters in RHA is 0.002 µm to 0.12 µm [35], while the average bitumen film thickness is typically 2–8 µm [36].
At 4% filler content, the peak stability of the HL mixture is 15.75 kN, while that of the RHA mixture is 17.25 kN. The superiority in stability values of RHA mixtures relative to HL mixtures can be attributed to the irregular particle shape of RHA giving rise to interlocking actions (see Figure 4b). This, in turn, may increase the shear strength and stiffness of the modified binder, which can increase resistance to the plastic flow of the mix.
All mixes have flow values within the desired range (Table 3). The VMA of all the mixes is well above the minimum requirement. RHA mixes have the lowest VMA values. The HL mixes have the greater VMA values, despite HL having small-sized particles. This result may be attributed to the clustered HL particles. All mixes have VFB values in the acceptable range as specified in the Indian Code (Table 3). RHA mixes have lower VFBs than the HL mixes and can be used in areas having hotter environments because of a low bleeding prospect [37].

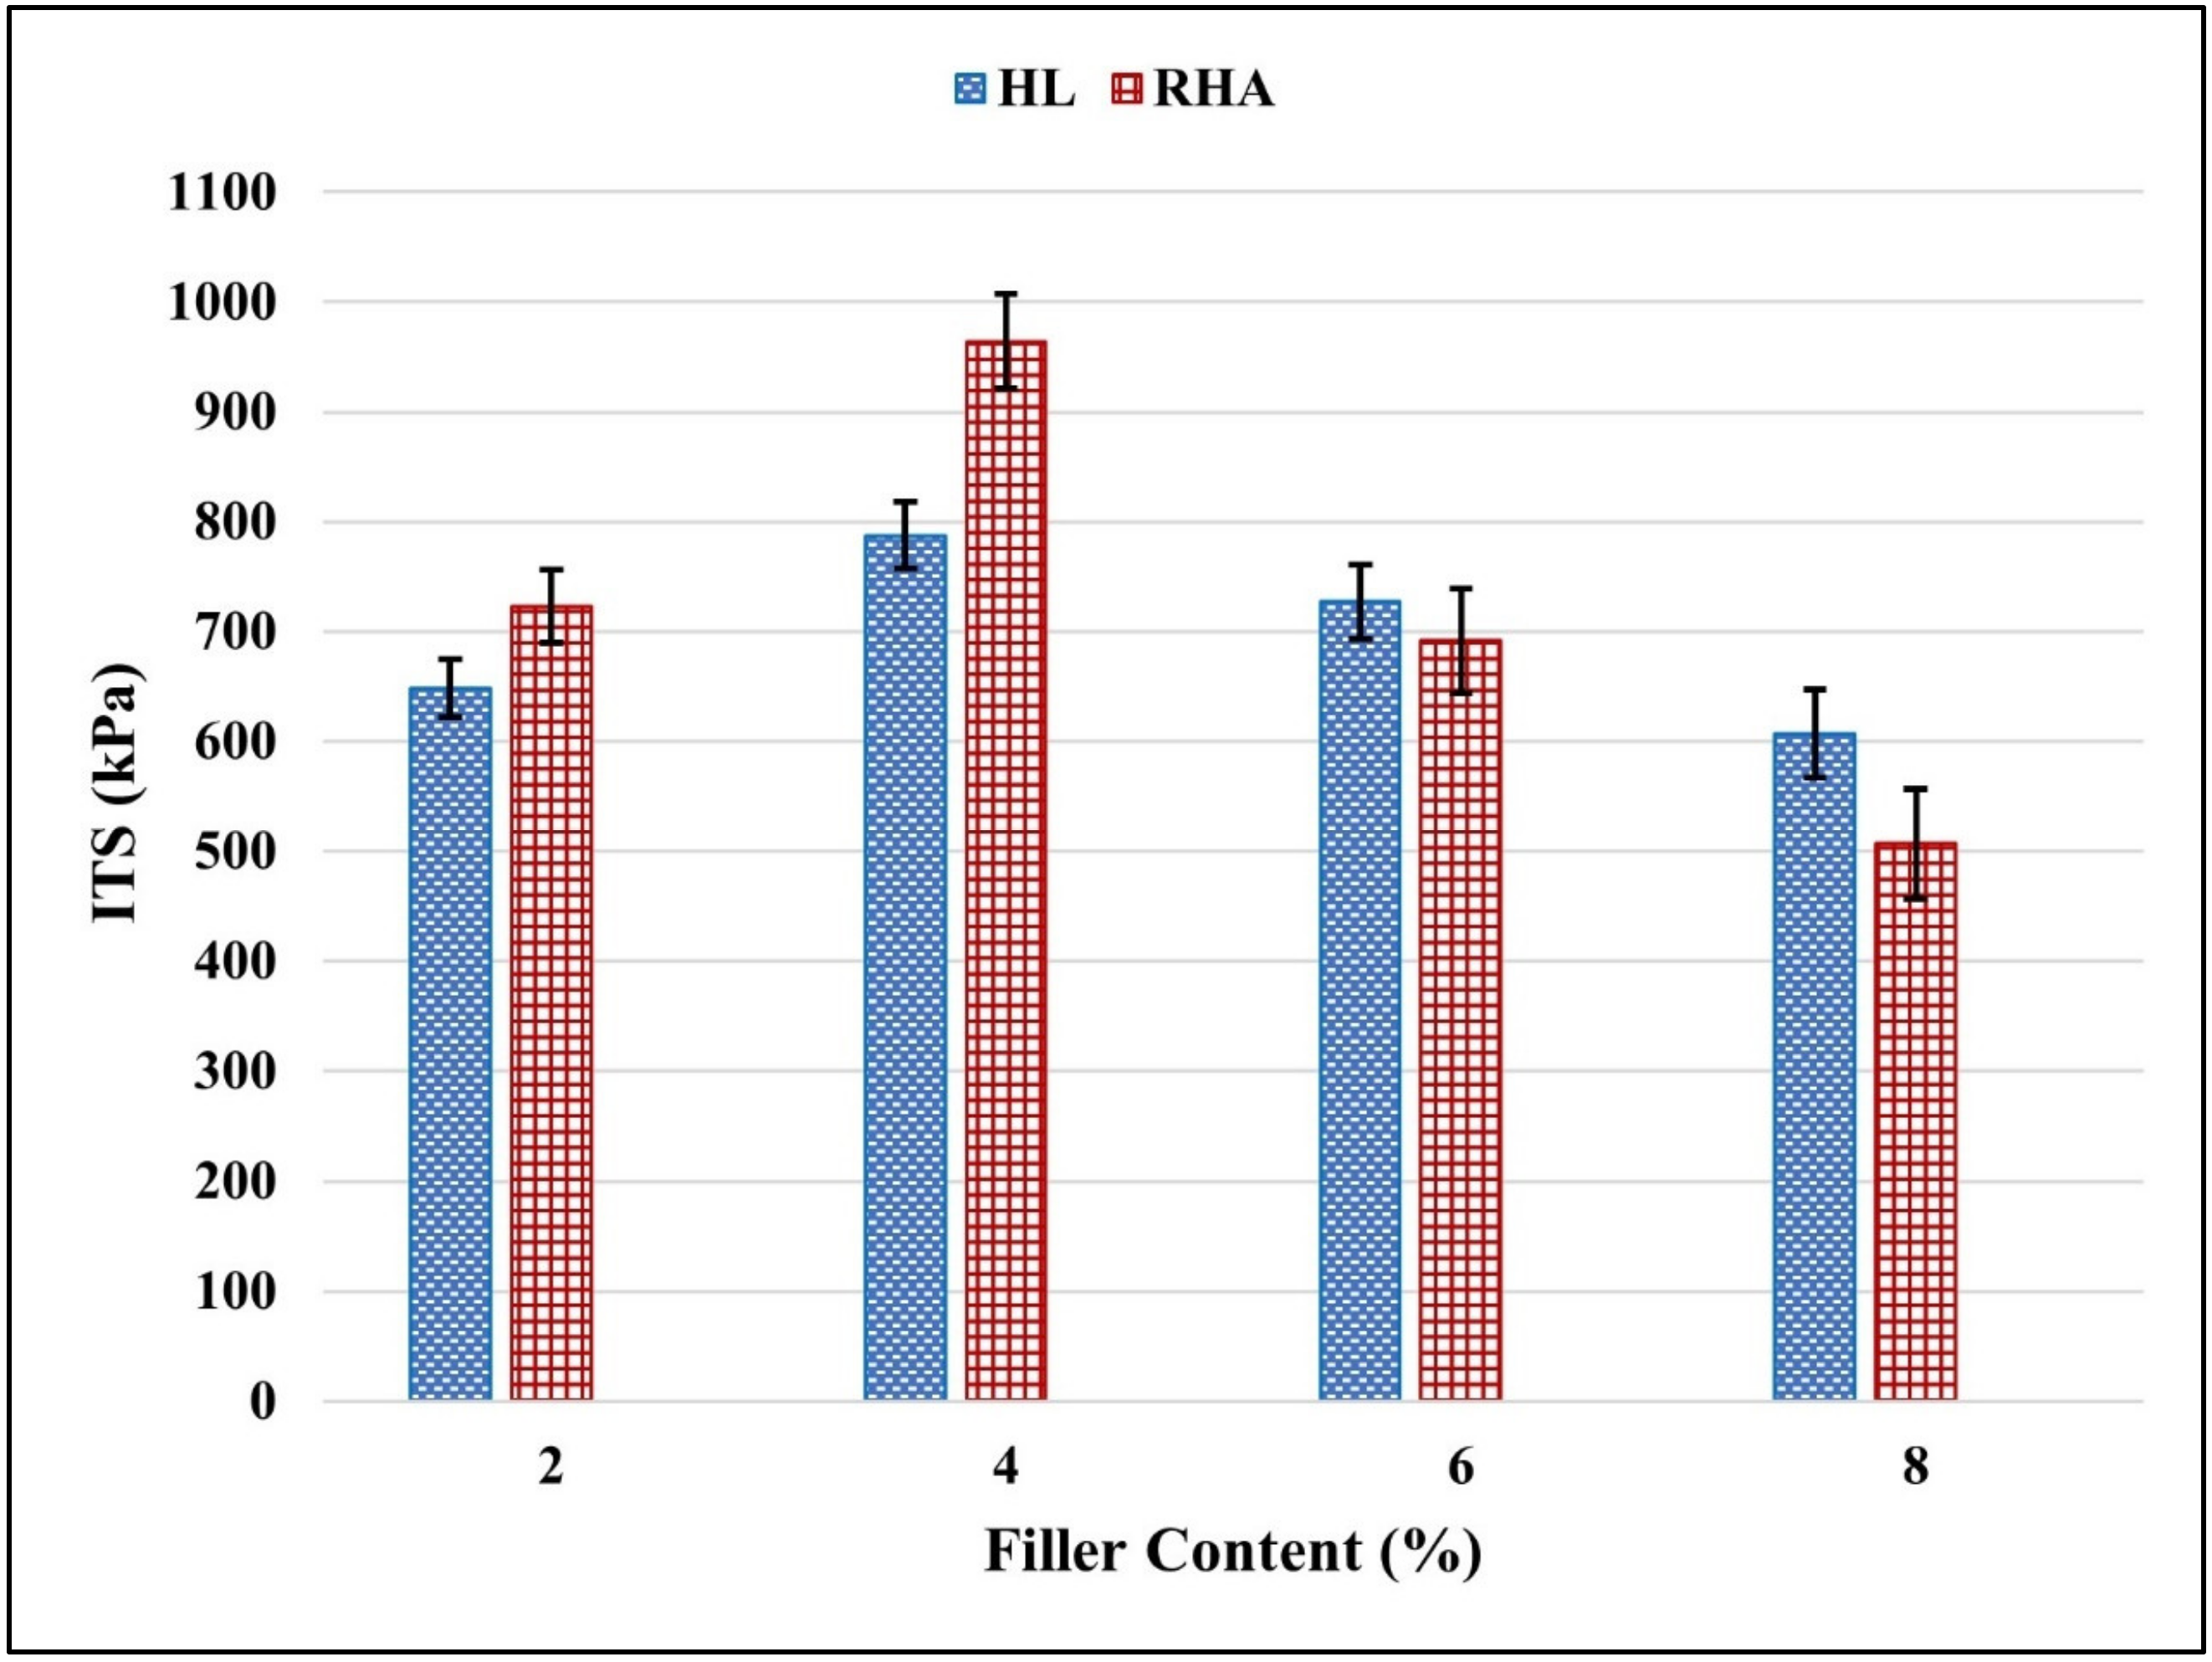
3.3.2. Cracking Resistance

Figure 11 shows the ITS values of the mixtures with various percentages of HL and RHA. As shown in Figure 11, the ITS increases with the rise in filler content and comes to a peak at 4% content. The conventional mix (HL at 2% filler) has an ITS value of 646 kPa, but the ITS of HL mix at 4% filler is 23.06% higher at 795 kPa compared to the conventional mix. Further, the RHA mix at 2% filler has an ITS value of 720 kPa; however, the ITS of RHA mix at 4% filler is 50.15% higher at 970 kPa compared the conventional mix. The higher ITS values of HL mix and RHA mix at 4% filler may be attributed to the fine nature of HL and RHA as indicated by their high specific surface areas [10,30]. However, further increments in filler content (6% and 8%) decrease the values of the said properties. This may be owing to the higher stiffness of modified mixes at increasing filler proportion. Since the HMA with high stiffness is prone to be more brittle and has less ability to bear tensile strength. The improvement in ITS value of RHA mixes may be attributed to the multilayer structure and micro-pores in RHA (see Figure 4b), which successfully enhance the cohesion and adhesion of the mastic, thereby helping to increase the cracking resistance of the mixture.

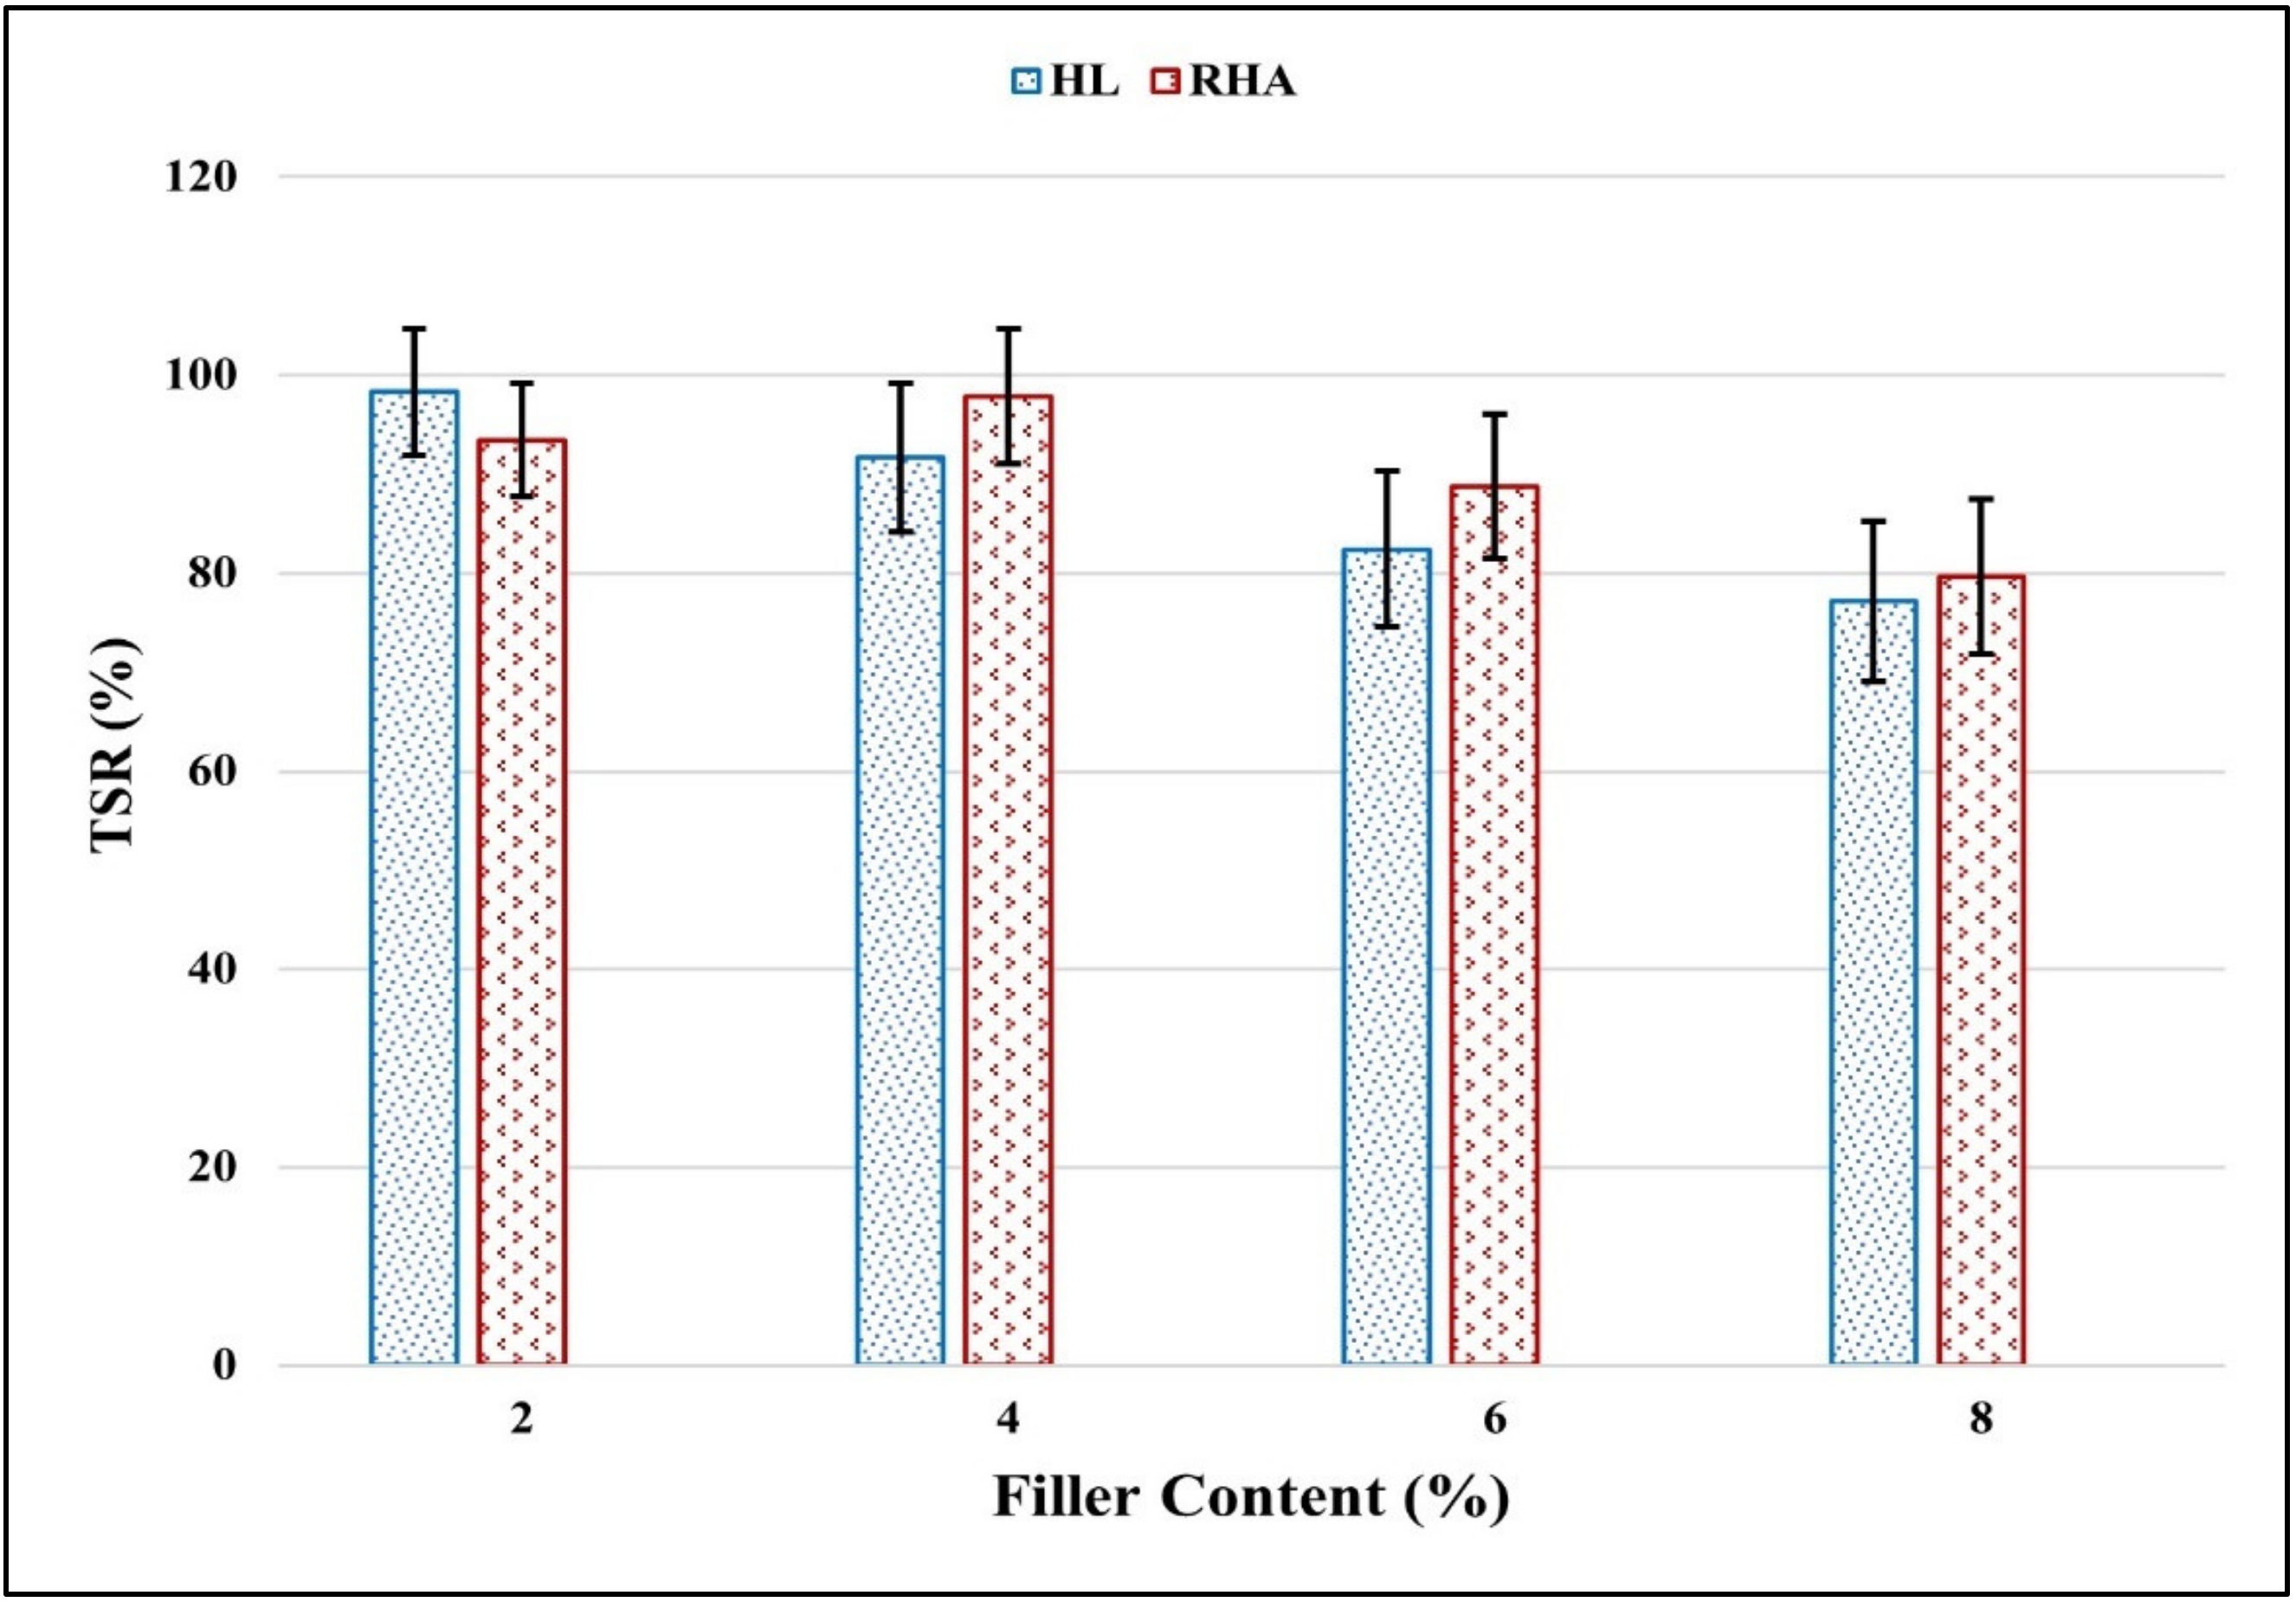
3.3.3. Resistance to Moisture Damage

Bituminous mixes with higher TSR values have better resistance to moisture damage. Figure 12 shows the TSR values of all mixes. According to the Indian Code, each bituminous mix should have a TSR of 80% or more [2]. All the mixtures met this requirement at 2%, 4%, and 6% filler. As expected, the conventional mix (HL at 2% filler) displays the maximum TSR value of 98.13% among all mixes. HL in this mix may enhance the mixture’s resistance to moisture damage by neutralizing the acidic compounds in bitumen [38]. Neutralizing the acidic compounds in bitumen helps prevent moisture from weakening the interfacial bond between bitumen and aggregate [39].
Nonetheless, at 4%, the RHA mix has a TSR value of 97.74%, which is almost equal to the 98.13% TSR of the control mix (HL at 2%). The acid components in bitumen (carboxylic acid and 2-quinolone-type) are responsible for weakening the ability to resist stripping at the bitumen–aggregate interface, especially for siliceous aggregates and the gathering of a layer of brush-like acid crystals at the bitumen–silica interface [39]. Due to the unique nature of RHA, it can act as a sink for acid compounds and prevent their crystallization at the surface of silica particles; this, in turn, helps prevent moisture damage. [39]. It has been reported that fillers with a high specific surface area help to prevent accumulation and crystallization of the acids at the bitumen–stone interface [40].
The size and surface chemistry of siliceous particles play a major role in their performance in asphalt; functionalized, surface-treated silica has been used to improve asphalt’s durability and moisture resistance [40,41]. In the case of RHA, the presence of carboxyl groups on the surface can promote interaction with bitumen compounds. It has been shown that modifying bitumen with nano clay (which includes silica platelets) promotes asphalt’s resistance to moisture damage [42]. Additionally, Fini et al. showed that active mineral powders can be used as modifiers in bitumen to control the migration of alkane acids to the interface of bitumen and aggregate, thereby improving the resistance to moisture damage [38].

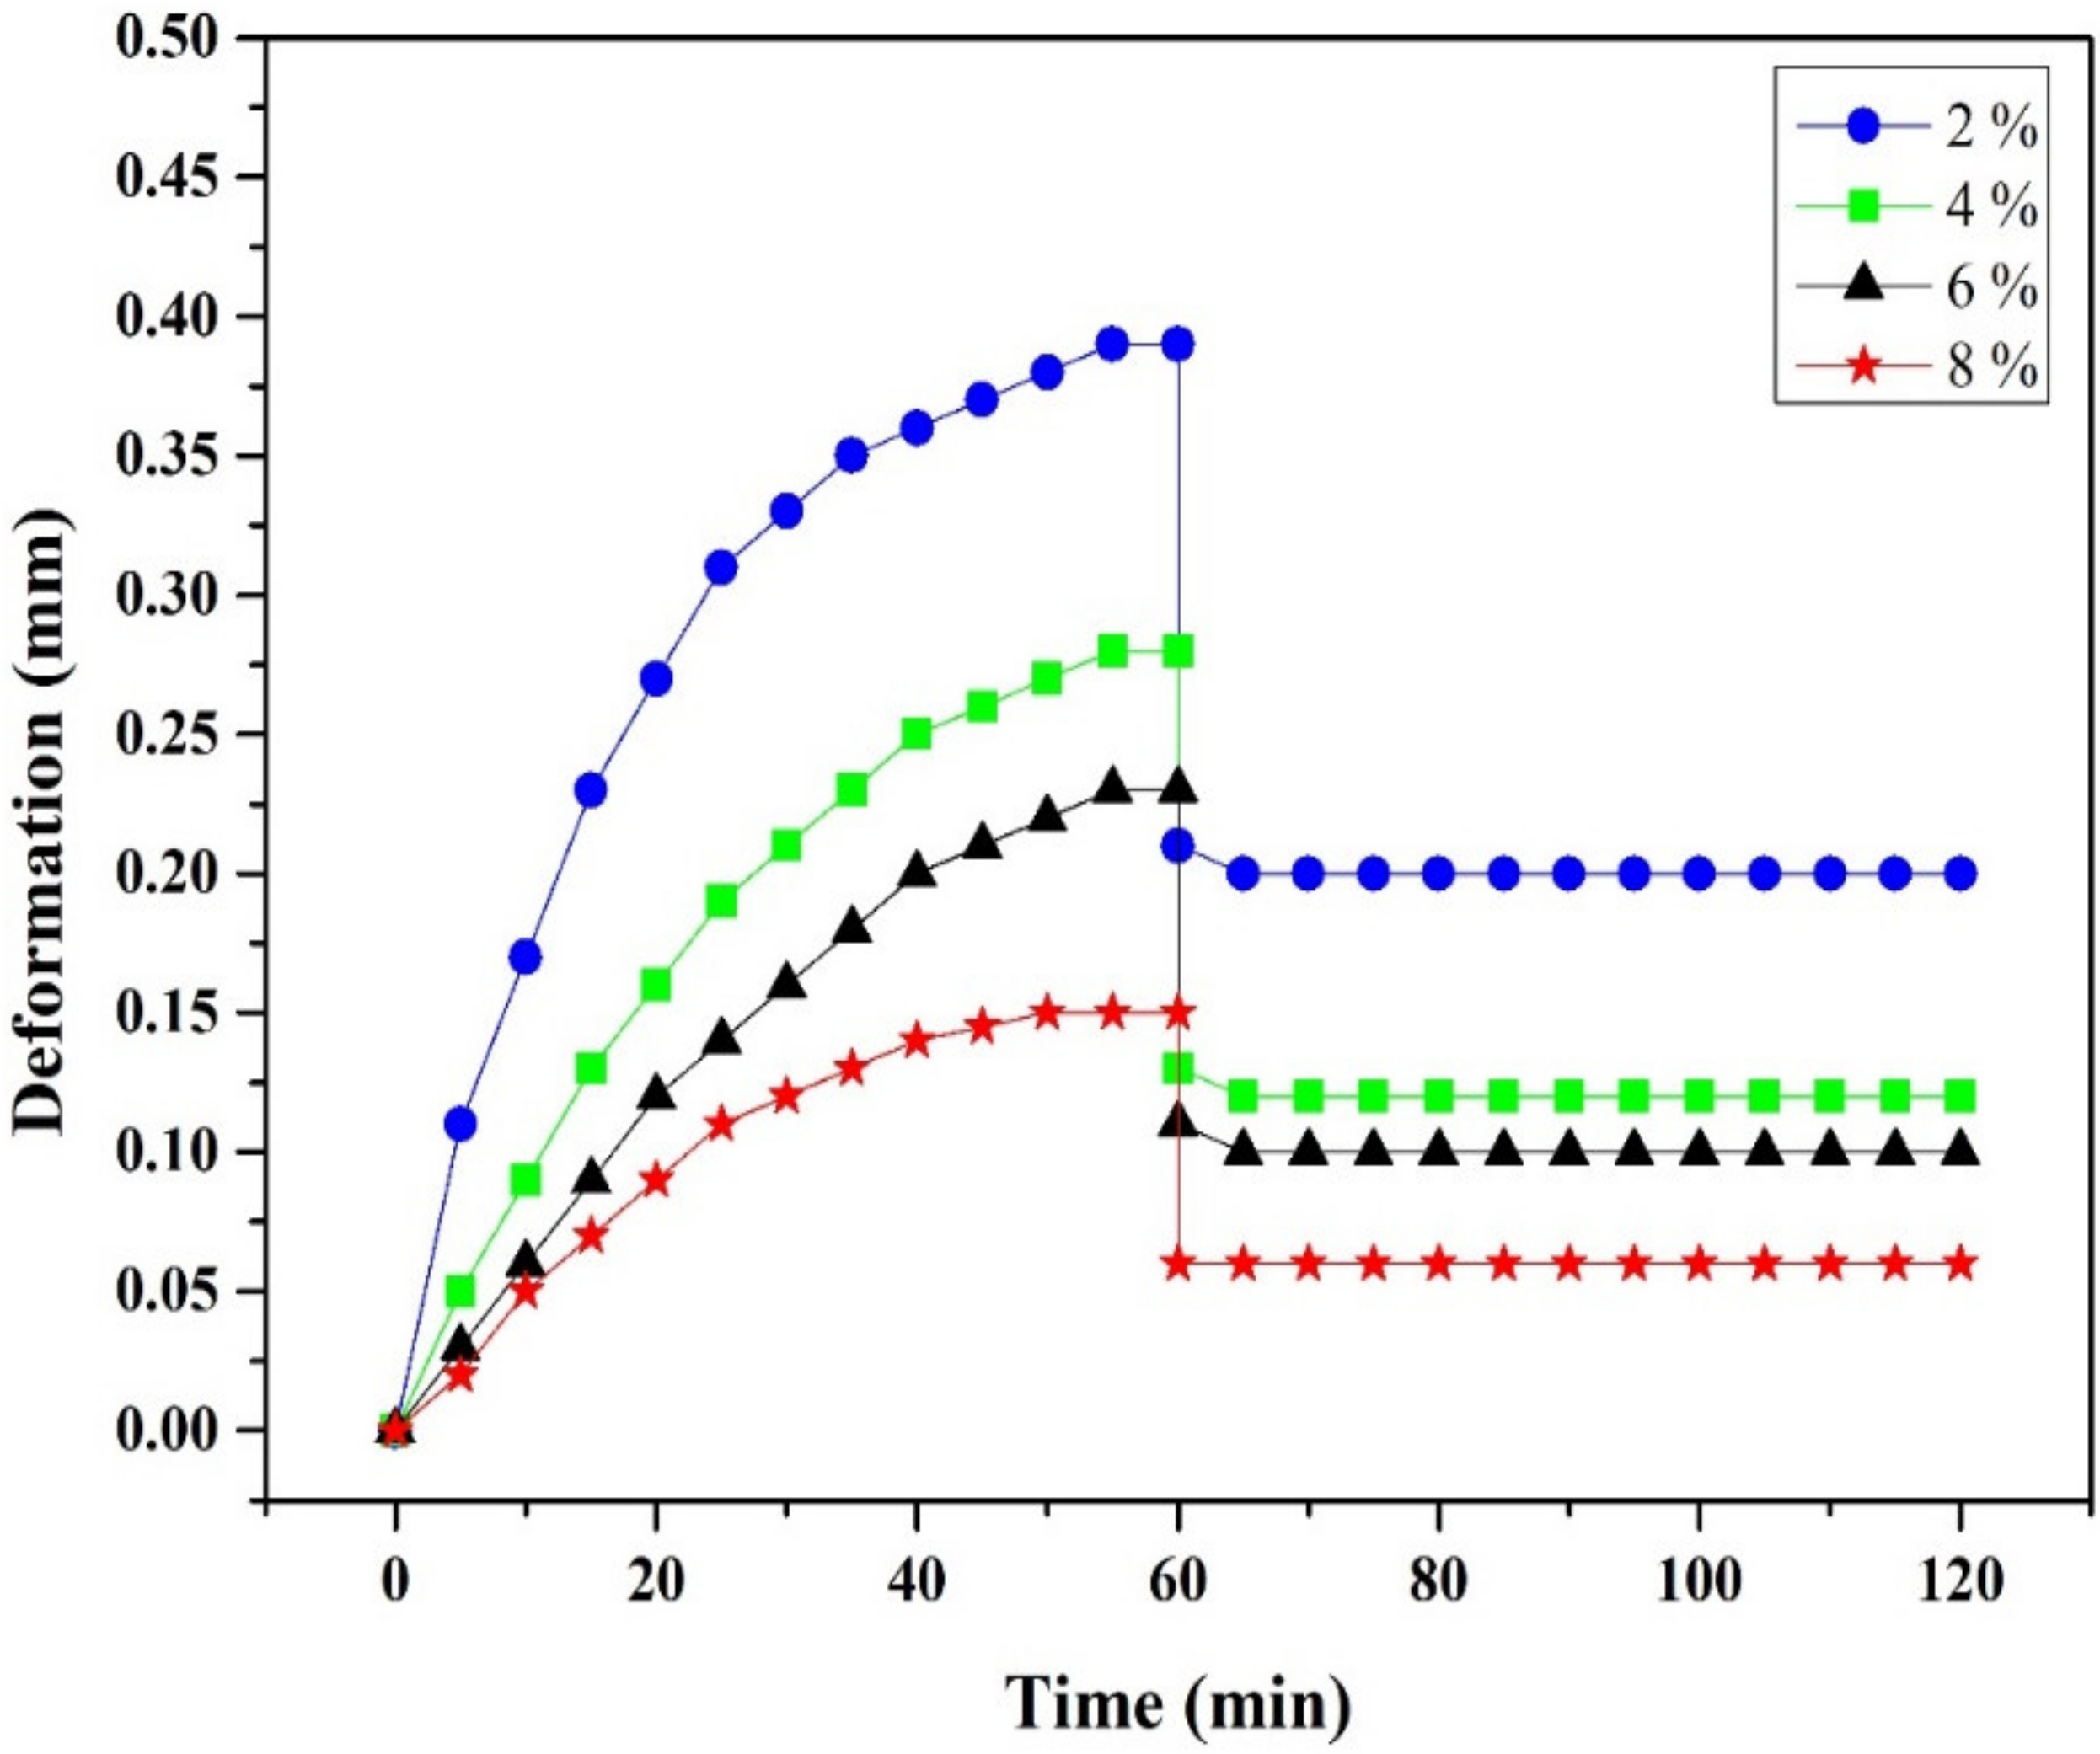
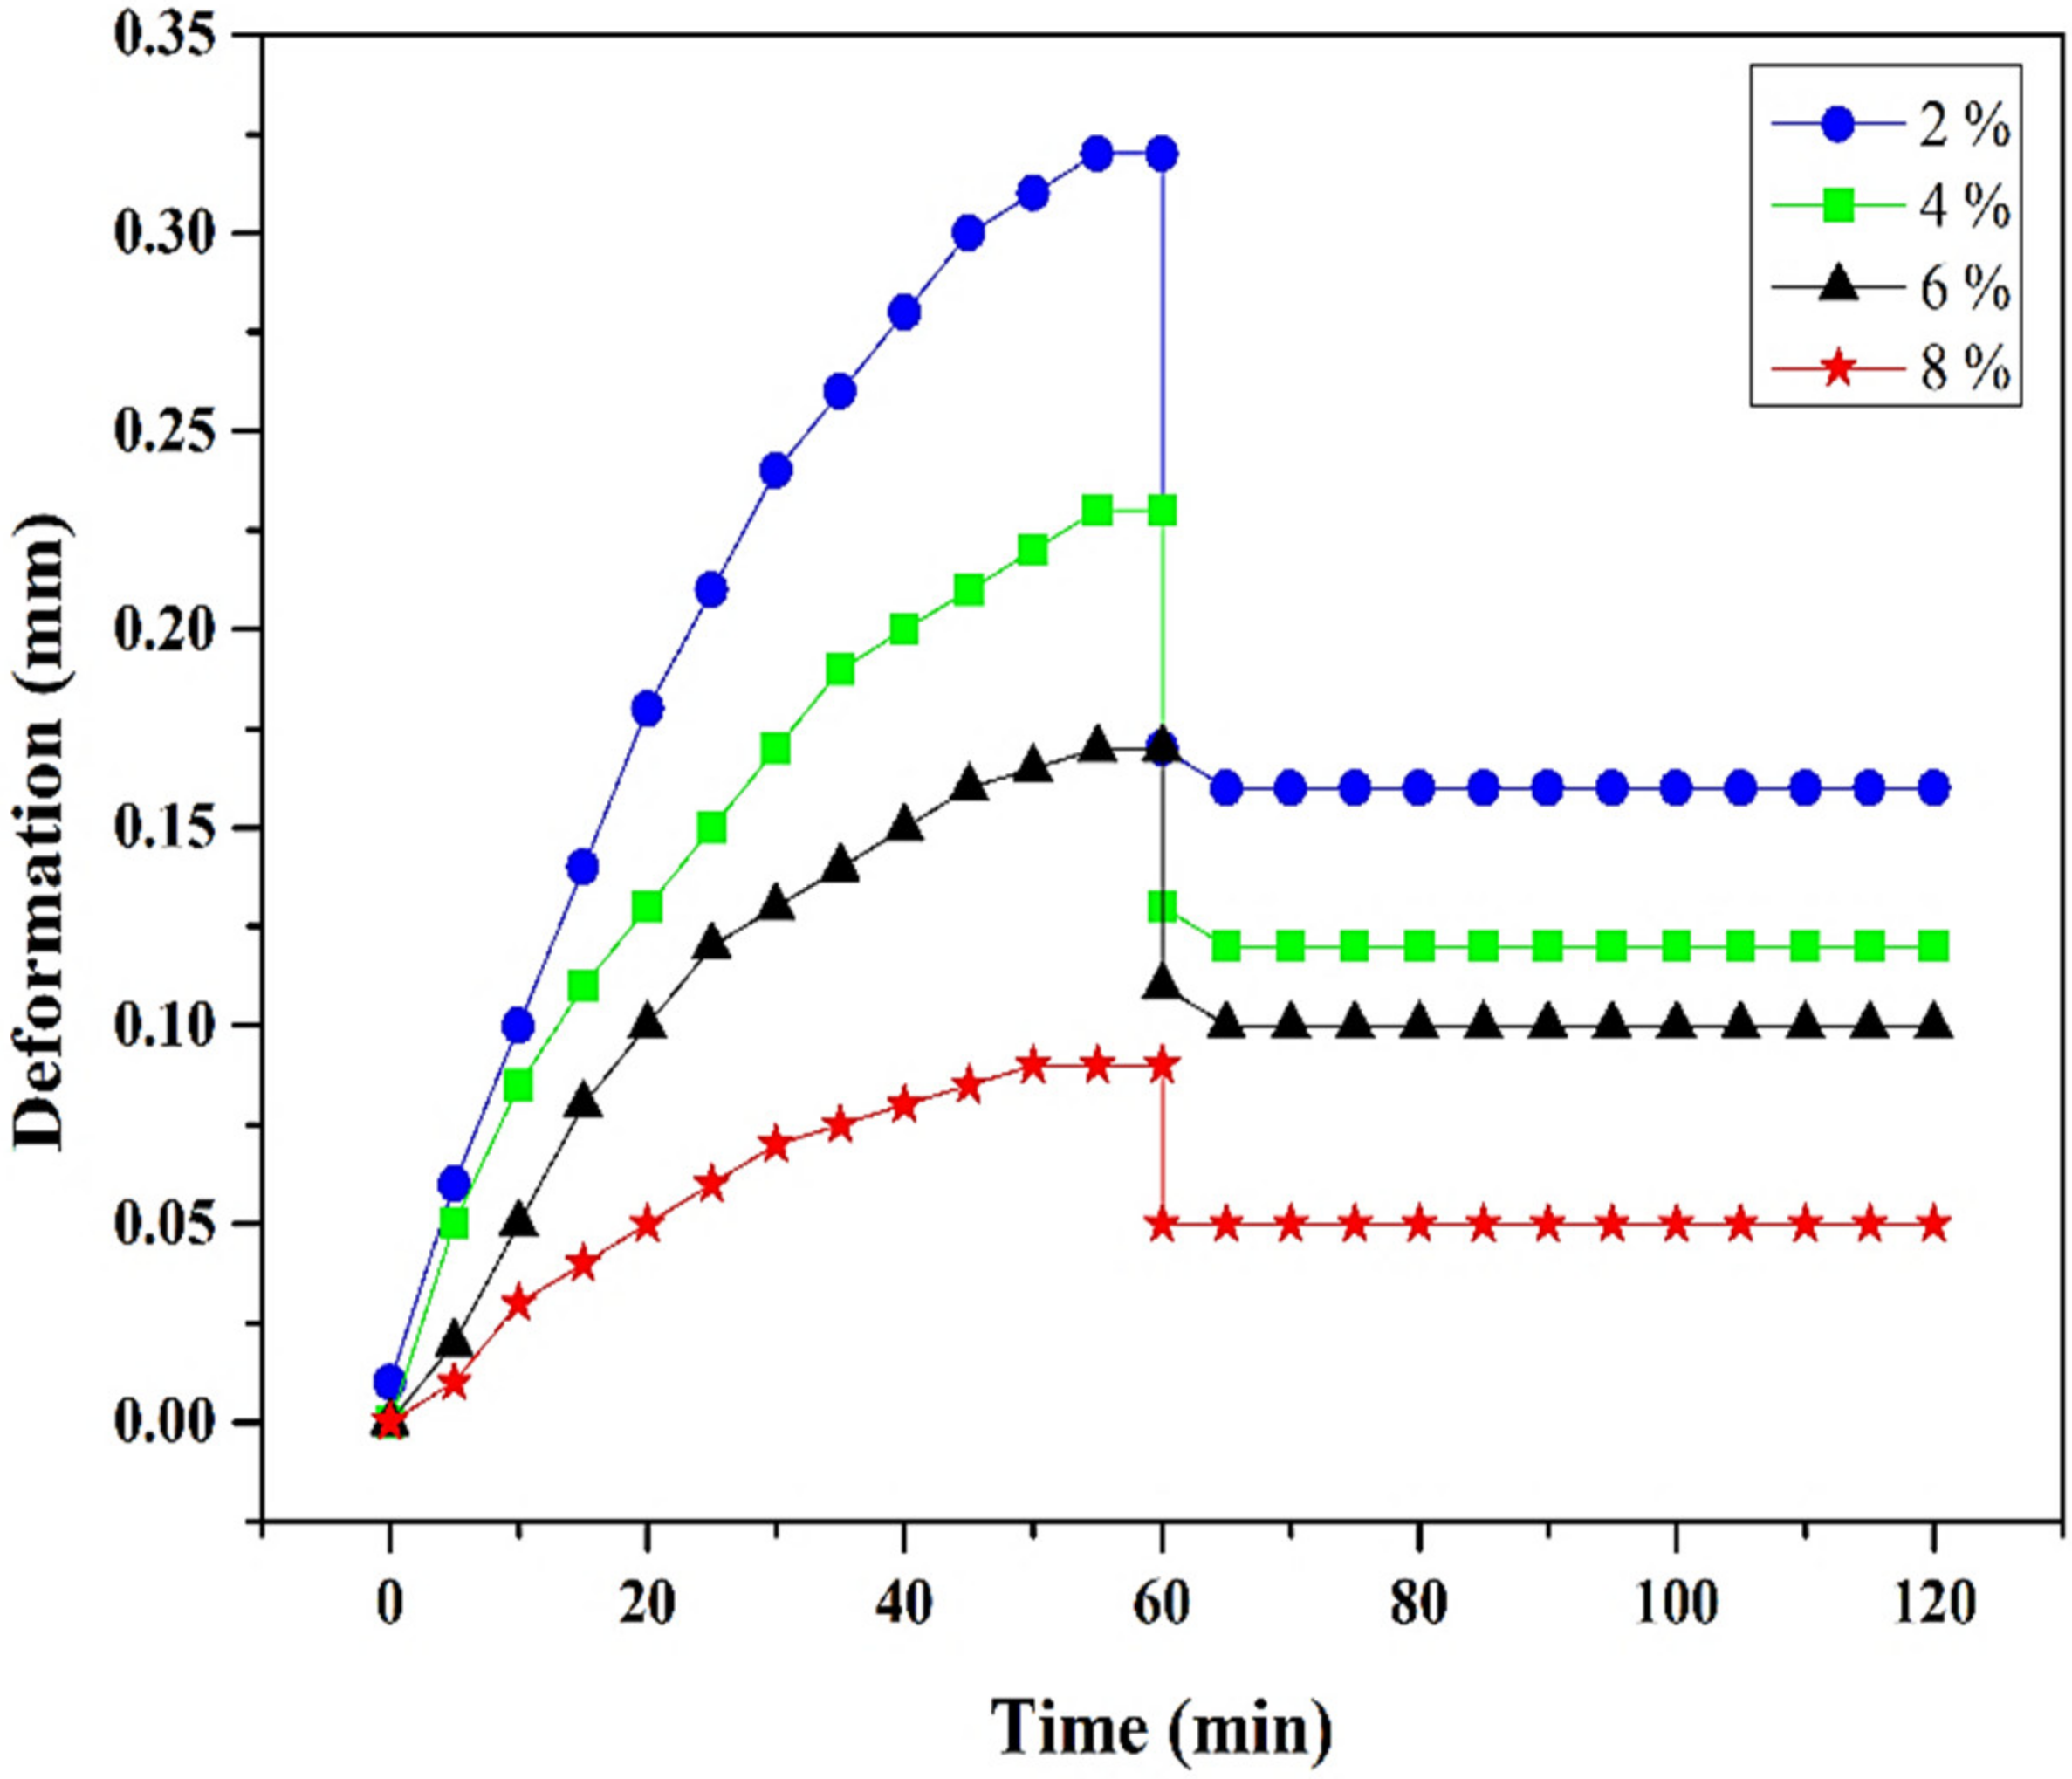
3.3.4. Creep Resistance

The test results for static creep recovery and permanent deformation are shown for HL mixes in Figure 13 and for RHA mixes in Figure 14. (Each reported test result is an average of three samples.) In the present study, creep and permanent deformation (due to sustained 10 kg load) for all the mixtures shows that the creep performance improved with increased filler content. This trend could be observed for both fillers at all percentages of filler. This is expected, since an increase in filler percentage increases the stiffness, thereby providing more resistance to deformation. At filler levels of 2%, 4%, 6%, and 8%, the respective permanent deformation of HL mixes was found to be 0.20, 0.13, 0.10, and 0.06 mm, and the respective permanent deformation of RHA mixes was found to be 0.16, 0.12, 0.07, and 0.04 mm. As shown in Figure 4b, RHA has a rough interior and exterior layer. Further, the RHA micro-particles contain three-dimensional micro-sheets and columnar SiO2 crystals, which might be attracted to base bitumen. In contrast, HL particles are more regular and uniform than RHA. Compared to HL, RHA could form a more stable and viscous three-dimensional meshed bonding system with bitumen, increasing the mixture’s resistance to permanent deformation [12].

3.4. Cost Analysis

The economic benefit from using RHA as filler was evaluated after comparing the material cost for the production of a 1.0 m3 of DBM grading-II (50 to 75 mm thickness) layer. Based on the performance of all the studied mixes, mixes up to 4% filler were considered in the cost analysis. The quantities of materials were calculated as per the mix design used in this study. Table 4 shows the present unit cost of each ingredient (coarse aggregate, fine aggregate, hydrated lime (HL), and bitumen) for production of dense bituminous macadam mixes according to the schedule of rates of the Public Works Department, West Bengal, India [43]. Since RHA is a waste material, RHA is freely available, apart from its transportation cost. Thus, the carrying cost for RHA was considered to be the same as for cement. RHA does not require any processing, since it mostly passed through a 75 µm sieve. RHA’s processing (labor) cost in the worst situation can be taken as 0.5% of the total cost needed to produce 1.0 m3 of DBM mix.
The results of the cost analysis clearly show that the mixes composed of 2% RHA or 4% RHA filler are economical compared to the conventional mix (2% HL). The significant parameter in the cost reduction is the lesser amount of bitumen consumed by RHA mixes. The cost comparison is also made by considering the increasing quantity of alternative filler (mixes with 2% RHA or 4% RHA) and observing that the cost of the mixes gradually decreases with the increase in filler content. Thus, the significant observation is that the total material cost of constructing 1.0 m3 of DBM layer using 4% RHA mix is nearly 5.06% lower than that of the conventional mix (2% HL) after satisfying all standard specifications. Apart from these monetary benefits, using RHA as a filler has environmental benefits such as saving a significant amount of valuable land from being used as landfill for discarded RHA.

4. Conclusions

This study examined the merits of replacing hydrated lime (HL) used in bituminous composites with rice husk ash (RHA) to reduce their carbon footprint and promote both construction sustainability and resource conservation. Based on the study results, these are the conclusions:
  • Mixtures containing RHA (up to 4%) were shown to have enhanced Marshall stabilities and volumetric characteristics compared to those containing HL.
  • The mixture containing 4% RHA had the lowest optimum binder content; this can be attributed to RHA’s physiochemical characteristics and particle size distribution.
  • Compared to the control mixture containing HL, the mixture containing RHA had a nearly 47% higher resistance to cracking and 40% higher resistance to permanent deformation. This was attributed to the RHA micro-particles containing three-dimensional micro sheets and columnar SiO2 crystals, forming a stable and viscous three-dimensional network with bitumen compared to the control mixture.
  • Resistance to moisture damage in mixtures containing RHA was found to be slightly better than that of mixtures containing HL. This can be attributed to the active silica in RHA and physiochemical characteristics of RHA, which can adsorb acidic compounds of bitumen, as shown by prior studies [38].
  • Mixtures containing RHA had lower carbon footprints than mixtures containing HL. In terms of production cost, mixtures containing RHA cost 5% less than the control mixture containing HL.
The study results showed that replacing HL by RHA had positive effects on the performance of bituminous composites while reducing their carbon footprint. Accordingly, the study outcomes promote construction sustainability and resource conservation.

Author Contributions

R.M. wrote original draft and performed data curation; T.K.R. assisted data interpretation and analysis. S.A. assisted with writing and revision of the manuscript. E.H.F. provided guidance with paper development, data interpretation, review & editing. All authors have read and agreed to the published version of the manuscript.

Funding

This research received no external funding.

Data Availability Statement

All data used in this study has been included in the manuscript.

Conflicts of Interest

The authors declare no conflict of interest.

References

  1. Mistry, R.; Karmakar, S.; Kumar Roy, T. Experimental evaluation of rice husk ash and fly ash as alternative fillers in hot-mix asphalt. Road Mater. Pavement Des. 2019, 20, 979–990. [Google Scholar] [CrossRef]
  2. MORTH (Ministry of Road Transport and Highways). Specifications for Road and Bridge Works (Fifth Revision); Indian Road Congress: New Delhi, India, 2013.
  3. Kandhal, P.S.; Lynn, C.Y.; Parker, F. Characterization Tests for Mineral Fillers Related to Performance of Asphalt Paving Mixes; NCAT Rep. No. 98-2; Auburn University: Auburn, AL, USA, 1998. [Google Scholar]
  4. Sargın, Ş.; Saltan, M.; Morova, N.; Serin, S.; Terzi, S. Evaluation of rice husk ash as filler in hot mix asphalt concrete. Constr. Build. Mater. 2013, 48, 390–397. [Google Scholar] [CrossRef]
  5. Lesueur, D.; Petit, J.; Ritter, H.J. The mechanisms of hydrated lime modification of asphalt mixtures: A state-of-the-art review. Road Mater. Pavement Des. 2013, 14, 1–16. [Google Scholar] [CrossRef]
  6. Choudhary, J.; Kumar, B.; Gupta, A. Application of waste materials as fillers in bituminous mixes. Waste Manag. 2018, 78, 417–425. [Google Scholar] [CrossRef] [PubMed]
  7. EEA (European Environment Agency). Air Pollutant Emission Inventory Guidebook; Technical Report No 9; European Environment Agency: Copenhagen, Denmark, 2009. [Google Scholar]
  8. FAOSTAT. 2014. Available online: http://www.fao.org/faostat/en/#data/QC/visualize (accessed on 16 June 2020).
  9. National Food Security Mission. 2016. Available online: https://nfsm.gov.in/StatusPaper/Rice2016.pdf (accessed on 23 June 2020).
  10. Mistry, R.; Kumar, T. Utilization of rice husk ash in hot mix asphalt concrete as mineral filler replacement. J. Indian Road Cong. 2015, 76, 13–17. [Google Scholar]
  11. Mehta, P.K. Testing and Correlation of Fly Ash Properties with Respect to Pozzolanic Behavior; University of California: Berkeley, CA, USA, 1984. [Google Scholar]
  12. Arabani, M.; Tahami, S.A. Assessment of mechanical properties of rice husk ash modified asphalt mixture. Constr. Build. Mater. 2017, 149, 350–358. [Google Scholar] [CrossRef]
  13. Arabani, M.; Tahami, S.A.; Taghipoor, M. Laboratory investigation of hot mix asphalt containing waste materials. Road Mater. Pavement Des. 2017, 18, 713–729. [Google Scholar] [CrossRef]
  14. ASTM D854-14; Standard Test Methods for Specific Gravity of Soil Solids by Water Pycnometer. ASTM: West Conshohocken, PA, USA, 2014.
  15. ASTM D422-63; Standard Test Method for Particle-Size Analysis of Soils. ASTM: West Conshohocken, PA, USA, 2007.
  16. IS 4031 (Part 2); Methods of Physical Tests for Hydraulic Cement (Determination of Fineness by Blaine Air Permeability Test). IS (Indian Standard): New Delhi, India, 1978.
  17. ASTM E986-04; Standard Practice for Scanning Electron Microscope Beam Size Characterization. ASTM: West Conshohocken, PA, USA, 2017.
  18. ASTM C837-09; Standard Test Method for Methylene Blue Index of Clay. ASTM: West Conshohocken, PA, USA, 2009.
  19. ASTM E1621-13; Standard Guide for Elemental Analysis by Wavelength Dispersive X-ray Fluorescence Spectrometry. ASTM: West Conshohocken, PA, USA, 2010.
  20. Mistry, R.; Roy, T.K. Performance evaluation of bituminous mix and mastic containing rice husk ash and fly ash as filler. Constr. Build. Mater. 2021, 268, 121187. [Google Scholar] [CrossRef]
  21. Zhang, J.; Wang, J.; Wu, Y.; Wang, Y.; Wang, Y. Evaluation of the improved properties of SBR/weathered coal modified bitumen containing carbon black. Constr. Build. Mater. 2009, 23, 2678–2687. [Google Scholar] [CrossRef]
  22. Price, A.; Yeargin, R.; Fini, E.; Abu-Lebdeh, T. Investigating effects of introduction of corncob ash into Portland cements concrete: Mechanical and thermal properties. Am. J. Eng. Appl. Sci. 2014, 7, 133–144. [Google Scholar] [CrossRef] [Green Version]
  23. Asphalt Institute. Mix Design Methods for Asphalt Concrete and Other Hot-Mix Types: Manual Series No. 2 (MS-2), 6th ed.; Asphalt Institute: Lexington, KY, USA, 1997. [Google Scholar]
  24. ASTM D6927-15; Standard Test Method for Marshall Stability and Flow of Asphalt Mixtures. ASTM: West Conshohocken, PA, USA, 2015.
  25. ASTM D3203–17; Standard Test Method for Percent Air Voids in, Compacted Asphalt Mixtures. ASTM: West Conshohocken, PA, USA, 2017.
  26. ASTM D6931-12; Indirect Tensile (IDT) Strength for Bituminous Mixtures. ASTM: West Conshohocken, PA, USA, 2012.
  27. T283; Resistance of Compacted Bituminous Mixture to Moisture Induced Damage. AASHTO: Washington, DC, USA, 1989.
  28. BS 598-111; Method for Determination of Resistance to Permanent Deformation of Bituminous Mixtures Subjected to Uniaxial Loading. British Standards Institution: London, UK, 1995.
  29. Choudhary, J.; Kumar, B.; Gupta, A.C. Feasible utilization of waste limestone sludge as filler in bituminous concrete. Constr. Build. Mater. 2020, 239, 117781. [Google Scholar] [CrossRef]
  30. ASTM C618; Standard Specification for Coal Fly Ash and Raw or Calcined Natural Pozzolan for Use in Concrete. ASTM: West Conshohocken, PA, USA, 2003.
  31. FHWA (Federal Highway Administration). User Guidelines for Waste and by Product Materials in Pavement Construction; FHWA Report 97148; Federal Highway Administration: Washington, DC, USA, 2016.
  32. Ameli, A.; Babagoli, R.; Norouzi, N.; Jalali, F.; Mamaghani, F.P. Laboratory evaluation of the effect of coal waste ash (CWA) and rice husk ash (RHA) on performance of asphalt mastics and Stone matrix asphalt (SMA) mixture. Constr. Build. Mater. 2020, 236, 117557. [Google Scholar] [CrossRef]
  33. Kütük-Sert, T.; Kütük, S. Physical and Marshall properties of borogypsum used as filler aggregate in asphalt concrete. J. Mater. Civ. Eng. 2013, 25, 266–273. [Google Scholar] [CrossRef]
  34. Read, J.; Whiteoak, D. Shell Bitumen Handbook, 5th ed.; Thomas Telford: Telford, UK, 2003. [Google Scholar]
  35. Srivastava, V.C.; Mall, I.D.; Mishra, I.M. Characterization of mesoporous rice husk ash (RHA) and adsorption kinetics of metal ions from aqueous solution onto RHA. J. Hazard. Mater. B 2006, 134, 257–267. [Google Scholar] [CrossRef] [PubMed]
  36. Kandhal, P.S.; Chakraborty, S. Effect of Asphalt Film Thickness on Short- and Long-Term Aging of Asphalt Paving Mixtures. Transp. Res. Rec. 1996, 1535, 83–90. [Google Scholar] [CrossRef]
  37. Tapkin, S. Mechanical Evolution asphalt-aggregate mixtures prepared with fly ash as a filler replacement. Can. J. Civ. Eng. 2008, 35, 27–40. [Google Scholar] [CrossRef]
  38. Fini, E.H.; Hung, A.M.; Roy, A. Active mineral fillers arrest migrations of alkane acids to the interface of bitumen and siliceous surfaces. ACS Sustain. Chem. Eng. 2019, 7, 10340–10348. [Google Scholar] [CrossRef]
  39. Oldham, D.; Mallick, R.; Fini, E.H. Reducing susceptibility to moisture damage in asphalt pavements using polyethylene terephthalate and sodium montmorillonite clay. Constr. Build. Mater. 2021, 269, 121302. [Google Scholar] [CrossRef]
  40. Karnati, S.R.; Oldham, D.; Fini, E.H.; Zhang, L. Application of Surface-Modified Silica Nanoparticles with Dual Silane Coupling Agents in Bitumen for Performance Enhancement. Constr. Build. Mater 2020, 244, 118324. [Google Scholar] [CrossRef]
  41. Mousavi, M.; Fini, E. Silanization Mechanism of Silica Nanoparticles in Bitumen Using 3-Aminopropyl Triethoxysilane (APTES) and 3-Glycidyloxypropyl Trimethoxysilane (GPTMS). ACS Sustain. Chem. Eng. 2020, 8, 3231–3240. [Google Scholar] [CrossRef]
  42. El Badawy, A.; Rahim, A. Evaluation of Nanoclay Additives for Improving Resistance to Moisture Damage in Hot Mix. 2023. Available online: https://rosap.ntl.bts.gov/view/dot/66358/dot_66358_DS1.pdf (accessed on 11 January 2023).
  43. WBPWD (West Bengal Public Works Department). Schedule of Rate for Road and Bridge Works-Vol III.; West Bengal Public Works Department: Kolkata, West Bengal, India, 2018.
Figure 1. Adopted gradation of DBM grading II mix.
Carbon 09 00037 g001
Figure 2. (a) Microscope slide having bituminous mastic (b) Optical microscope.
Carbon 09 00037 g002
Figure 3. Particle size distribution curves of fillers.
Carbon 09 00037 g003
Figure 4. Physical appearance and SEM image of (a) HL and (b) RHA.
Carbon 09 00037 g004
Figure 5. X-ray diffraction spectrum of (a) HL and (b) RHA.
Carbon 09 00037 g005
Figure 6. Variation in the penetration values of the mastic samples.
Carbon 09 00037 g006
Figure 7. Variation in the softening point value of the mastic samples.
Carbon 09 00037 g007
Figure 8. Evaluation of thermal susceptibility of bituminous mastic by penetration index.
Carbon 09 00037 g008
Figure 9. Optical micrograph of mastics with HL at f/b ratio of (a) 0.5, (b) 0.8, (c) 1.1, and (d) 1.4.
Carbon 09 00037 g009
Figure 10. Optical micrograph of mastics with RHA at f/b ratio of (a) 0.5, (b) 0.8, (c) 1.1, and (d) 1.4.
Carbon 09 00037 g010
Figure 11. ITS values of HL mixes and RHA mixes with different filler contents.
Carbon 09 00037 g011
Figure 12. TSR values of HL mixes and RHA mixes with different filler contents.
Carbon 09 00037 g012
Figure 13. Creep performance of mixes containing different percentages of HL.
Carbon 09 00037 g013
Figure 14. Creep performance of mixes containing different percentages of RHA.
Carbon 09 00037 g014
Table 1. Evaluated properties of studied aggregates.
PropertyValuesSpecified Limits [2]
Aggregate impact value17%max 27%
Los Angeles abrasion value20%max 35%
Water absorption value1.3%max 2%
Specific gravity
Coarse aggregate
2.862.5–3.0
Fine aggregate
2.71
Combined Flakiness and Elongation Index26.3%max 35%
Table 2. Characteristics of Fillers.
PropertyHLRHA
Specific Gravity2.152.00
FM3.182.86
UC 2.332.92
Specific surface area (m2/kg)431.5565.8
MBV (gm/kg)0.971.27
Particle shape and texture (SEM)Angular particles with uneven textureIrregular porous particles with very rough texture
Chemical composition
SiO23.2386.64
CaO72.421.88
Al2O30.411.66
Fe2O30.311.06
MgO0.460.97
K2O0.130.40
SO31.220.12
Loss on ignition (LOI)21.696.15
Table 3. Average Marshall and Volumetric Properties of the Mixes.
Filler TypeAmount of Filler
(%)
OBC
(%)
Marshall Stability (kN)Flow
(mm)
VMA
(%)
VFB
(%)
HL25.213.853.8216.1874.57
45.1715.753.7716.0772.59
65.3514.753.7916.3274.79
85.6014.183.9616.8274.85
RHA25.1514.53.6515.9370.44
44.9117.253.4815.6670.83
65.3816.623.7316.2173.34
85.4215.933.8216.573.87
Requirements (MORTH 2013)-9.00
(min)
2–413.00
(min)
65–75
Table 4. Comparison of Cost of Selected Mixes.
MaterialsWBPWD RatesQuantity in 1 m3 of Dense Bituminous Macadam Grade-II (50 to 75 mm) Thickness
2% HL4% HL2% RHA4% RHA
Coarse Aggregate (m3)1536.35/m30.9520.9480.9520.948
Fine Aggregate (m3)1167.10/m30.4830.4520.4830.452
Hydrated Lime (kg)7.50/kg448800
Rice Husk Ash (kg)0004488
Bitumen (kg)35.18/kg114.62113.96113.08107.8
Cost in (INR/m3) 6389665960055777
Transportation cost (INR/MT)84/MT003.6967.392
0.5% for processing (INR/m3) 00300289
Total Cost (INR/m3) 6389665963056066
Percentage saving in cost with respect to conventional mix
(2% HL) (%)
0−4.221.315.06
Disclaimer/Publisher’s Note: The statements, opinions and data contained in all publications are solely those of the individual author(s) and contributor(s) and not of MDPI and/or the editor(s). MDPI and/or the editor(s) disclaim responsibility for any injury to people or property resulting from any ideas, methods, instructions or products referred to in the content.

