
3D Variable Range Hopping Electrical Conduction of a Carbon from Polyaniline Vapor


Department of Materials Science, Faculty of Pure and Applied Sciences, University of Tsukuba, Tsukuba 305-8573, Ibaraki, Japan
C 2023, 9(1), 9; https://doi.org/10.3390/c9010009
Submission received: 19 December 2022
/
Revised: 8 January 2023
/
Accepted: 9 January 2023
/
Published: 12 January 2023
(This article belongs to the Special Issue Characterization of Disorder in Carbons (2nd Edition))
Abstract
:Carbon with a metallic reflection was prepared from polyaniline (PANI) vapor deposited on the inner quartz wall of a furnace. Electron probe microanalyzer analysis proved that the resultant contained carbon, oxygen, nitrogen, and sulfur atoms. A Dysonian line shape with paramagnetic properties was observed for the resulting carbon from PANI in the electron spin-resonance spectroscopy measurement. The resistance vs. temperature curve of the carbon indicated semiconductor-insulator properties in a low-temperature range. Electrical conduction in the carbon was carried out with 3D variable range hopping.

1. Introduction
Carbon materials have been paid much attention from the viewpoints of basic research and industrial applications. Many promising new forms of carbon have been found, such as fullerenes, carbon nanotubes, graphene, and carbon composites [1,2,3,4,5,6,7,8,9,10,11,12]. Active carbons have been employed as cleaners, battery electrodes, and capacitors. Carbons having nano-structures of spheres [13], nano-bubbles, and fibers were reported [14]. Carbonization of π-conjugated polymers has also been developed [15]. Carbonization of the polyaniline (PANI) in argon atmosphere also leads to the formation of carbon nanostructures. This may provide another method for preparing nano-carbon forms from conducting polymers, in addition to the preparation of fullerenes and graphenes.
PANI prepared in the presence of optically active camphor sulfonic acid shows a helical structure at the molecular level [16,17,18,19]. Nanofiber, nanotube, and hole structures [20] are observed under scanning electron microscopy (SEM) observations. During the research for the preparation of nano-carbons from polyanilines, a material with a crystal-like appearance has been observed in our lab, with metallic reflection, attached at the inner wall of a heating chamber. Vapor from PANI in the pyrolysis process was attached at the inner wall quartz cylinder and was carbonized. The low molecular weight PANI fractions in the form of vapor during the carbonization process deposited on the inner walls of the chamber and exhibited a macroscopic layered structure and a microcrystalline graphite structure. This is a new form of carbon from polyaniline. This method can produce graphite structures at relatively low temperatures (≤1000 °C). The one-step synthesis of the new carbon from polyaniline is simple and inexpensive. This method may be regarded as a new chemical vapor deposition (CVD) method to obtain layered carbons by carbonization of the vapor from conductive polymers.
PANI can be conveniently synthesized using sulfuric acid and ammonium persulfate (APS) in water. Aniline as a monomer is readily available as it is the most used raw material in the dye industry. Therefore, the preparation of the carbon from polyaniline is simply by carbonization, which can be easily and inexpensively performed.
This study investigates the carbon obtained from the PANI vapor. Electron spin resonance (ESR), infrared absorption (IR), and resistance measurements are carried out for evaluation of the character of the carbon.
2. Materials and Methods
Aniline (Wako Pure Chemical Industries, Japan) was first purified by distillation. (+)-CSA was purchased from Tokyo Kasei (TCI, Tokyo, Japan). IR absorption spectra were obtained with a JASCO FT-IR 550 spectrometer (JASCO, Hachioji, Japan). Ultraviolet-visible (UV-vis) spectra were recorded on a JASCO V-630 spectrophotometer. Optical microscopic images were captured with a Nikon ECLIPSE LV100 (Nikon, Tokyo, Japan). Electron spin resonance (ESR) measurements were carried out using a JEOL JES TE-200 spectrometer with 100 kHz modulation. The approximate spin concentration is estimated with CuSO4 as an internal standard. Transmission electron microscopy (TEM) observations were conducted with a JEM-2100 (JEOL, Akishima, Japan). Carbonization was carried out with the Electric Gold Furnace instrument, MIT Lincoln-Lab (Lexington, MA, USA) equipped with an Ishikawa temperature controller (Ishikawa Trading, Tokyo, Japan). Electron probe microanalyzer analysis (EPMA) was carried out with JEOL JXA-8100. Thermogravimetric (TG), derivative thermogravimetric (DTG), and differential thermal analysis (DTA) measurements were performed with an EXSTAR7000 (Seiko Instruments Inc., Chiba, Japan) at a scan rate of 20 °C/min. Resistance (R) vs. temperature (T) was obtained by the Physical Property Measurement System (PPMS, Oxford instruments, Abingdon-on-Thames, UK).
3. Experimental Section
3.1. Preparation of PANI-(+)-CSA
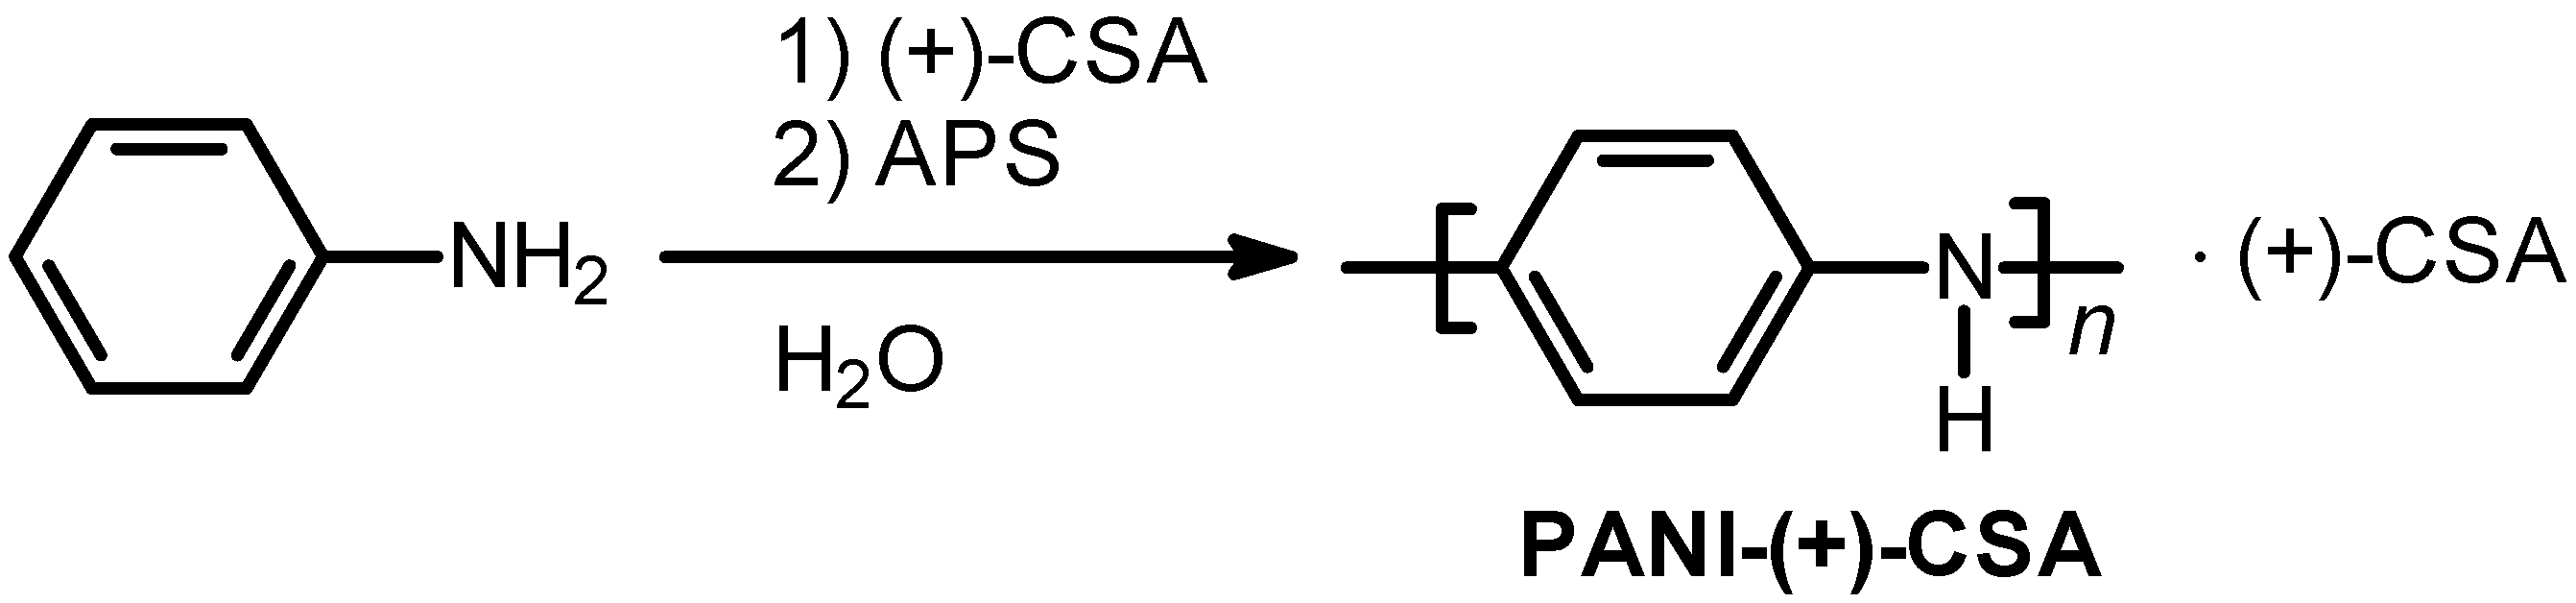
Scheme 1 shows the preparation of PANI as the precursor before carbonization. PANI can be synthesized in water as environmentally friendly, with no use of inert gas in the synthesis, and created from materials commonly used in industry. The polyaniline is simply carbonized in an electric furnace. The entire process, including polymer synthesis, can be performed in two steps (production of PANI and carbonization).
First, the synthesis of polyaniline doped with camphor sulfonic acid (PANI-(+)-CSA) was performed by the generally known method [21]. Aniline as a monomer was dissolved in a large volume of water, and (+)-camphor sulfonic acid ((+)-CSA) was subsequently added to the solution to form an aniline salt. Then, pre-cooled ammonium persulfate (APS) was added to the mixture at <5 °C (Scheme 1). After 12 h, the dark green solution was filtered. The collection followed by drying in a vacuum yielded PANI-(+)-CSA in powder form. Quantities for the polymerization, aniline (2 g), (+)-CSA (2 g), APS (2.5 g), and distilled water (200 mL).
3.2. Preparation of Carbon from PANI
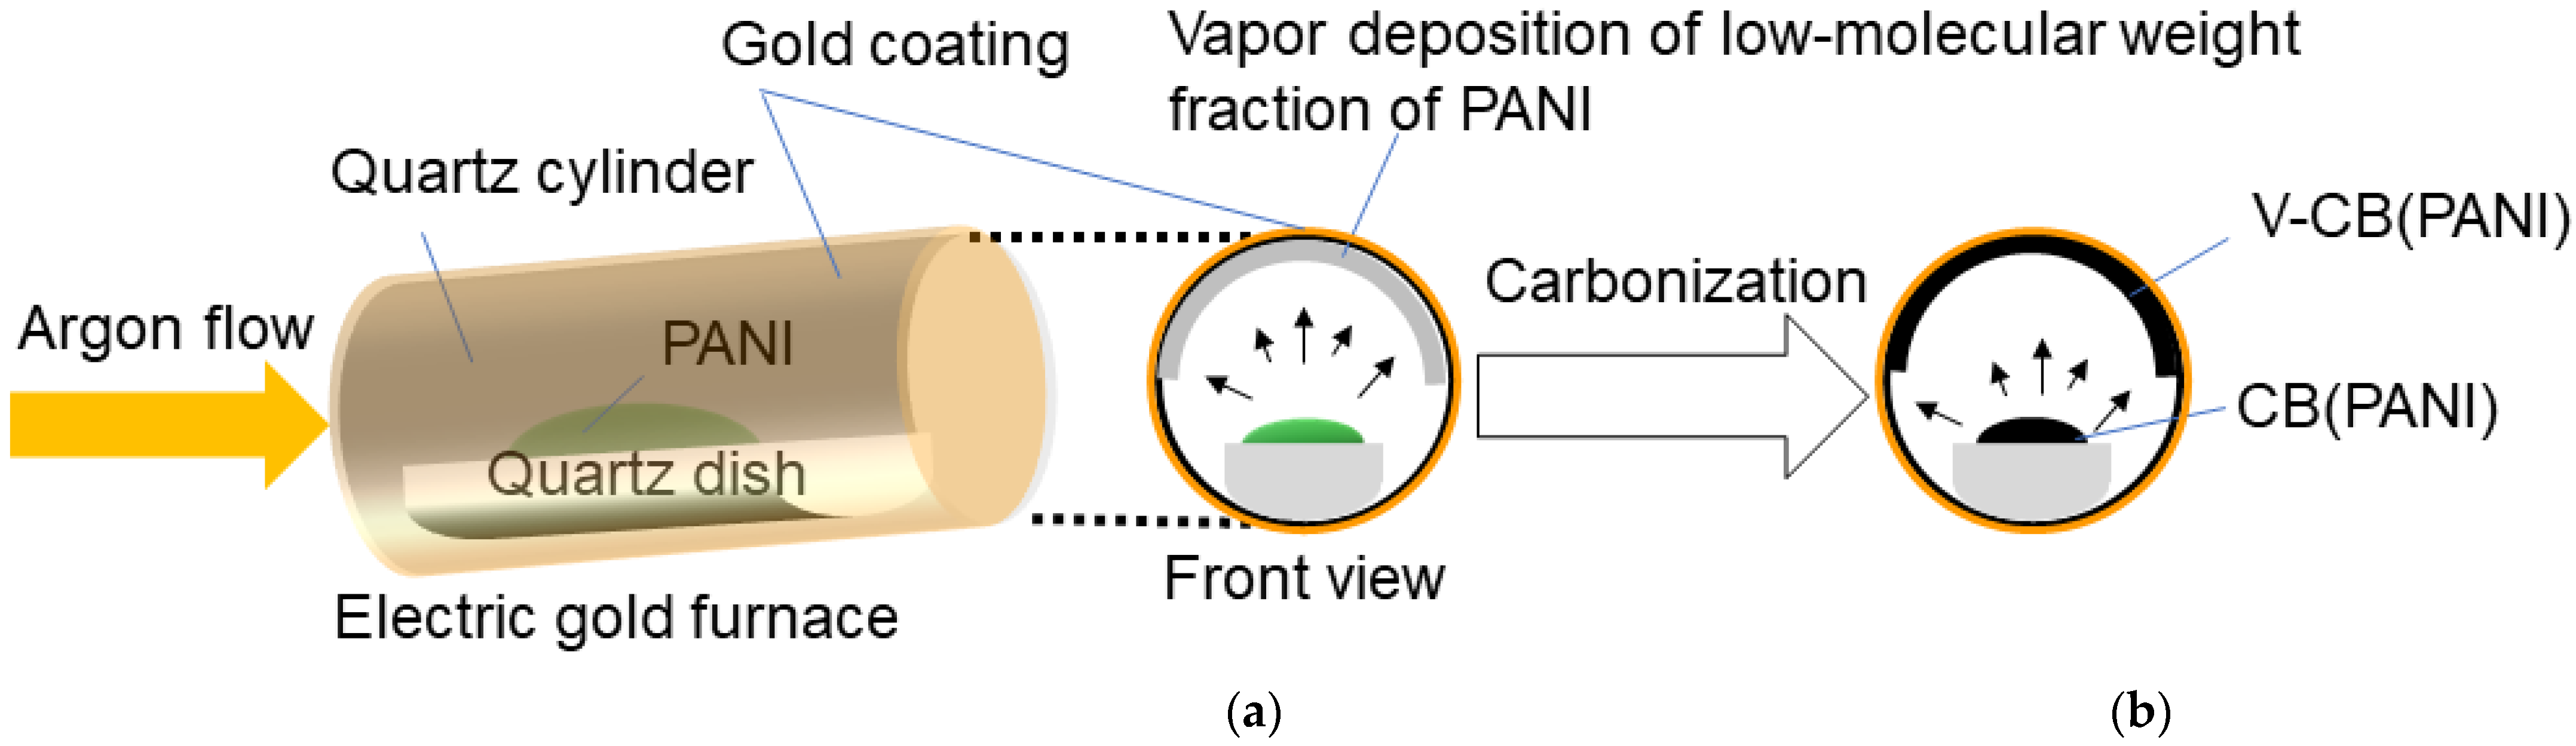
PANI-(+)-CSA was set in a quartz dish, and heated under argon flow for 5 h at 1000 °C with the gold furnace heating chamber, resulting in carbonized PANI-(+)-CSA. The carbons in the form of powder appeared on the quartz dish (Figure 1a), which is abbreviated as CB(PANI).
While the vapor consisting of low molecular materials from the PANI-(+)-CSA deposited inner wall of the quartz cylinder in the gold furnace (Figure 1b) was carbonized and deposited on the wall. This sample is abbreviated as V-CB(PANI), where V stands for vapor and CB carbon. V-CB(PANI) thus prepared was collected and transferred to a vial. The average fraction size appeared to be around 3 × 5 mm.
4. Results and Discussion
4.1. Thermogravimetric Analysis
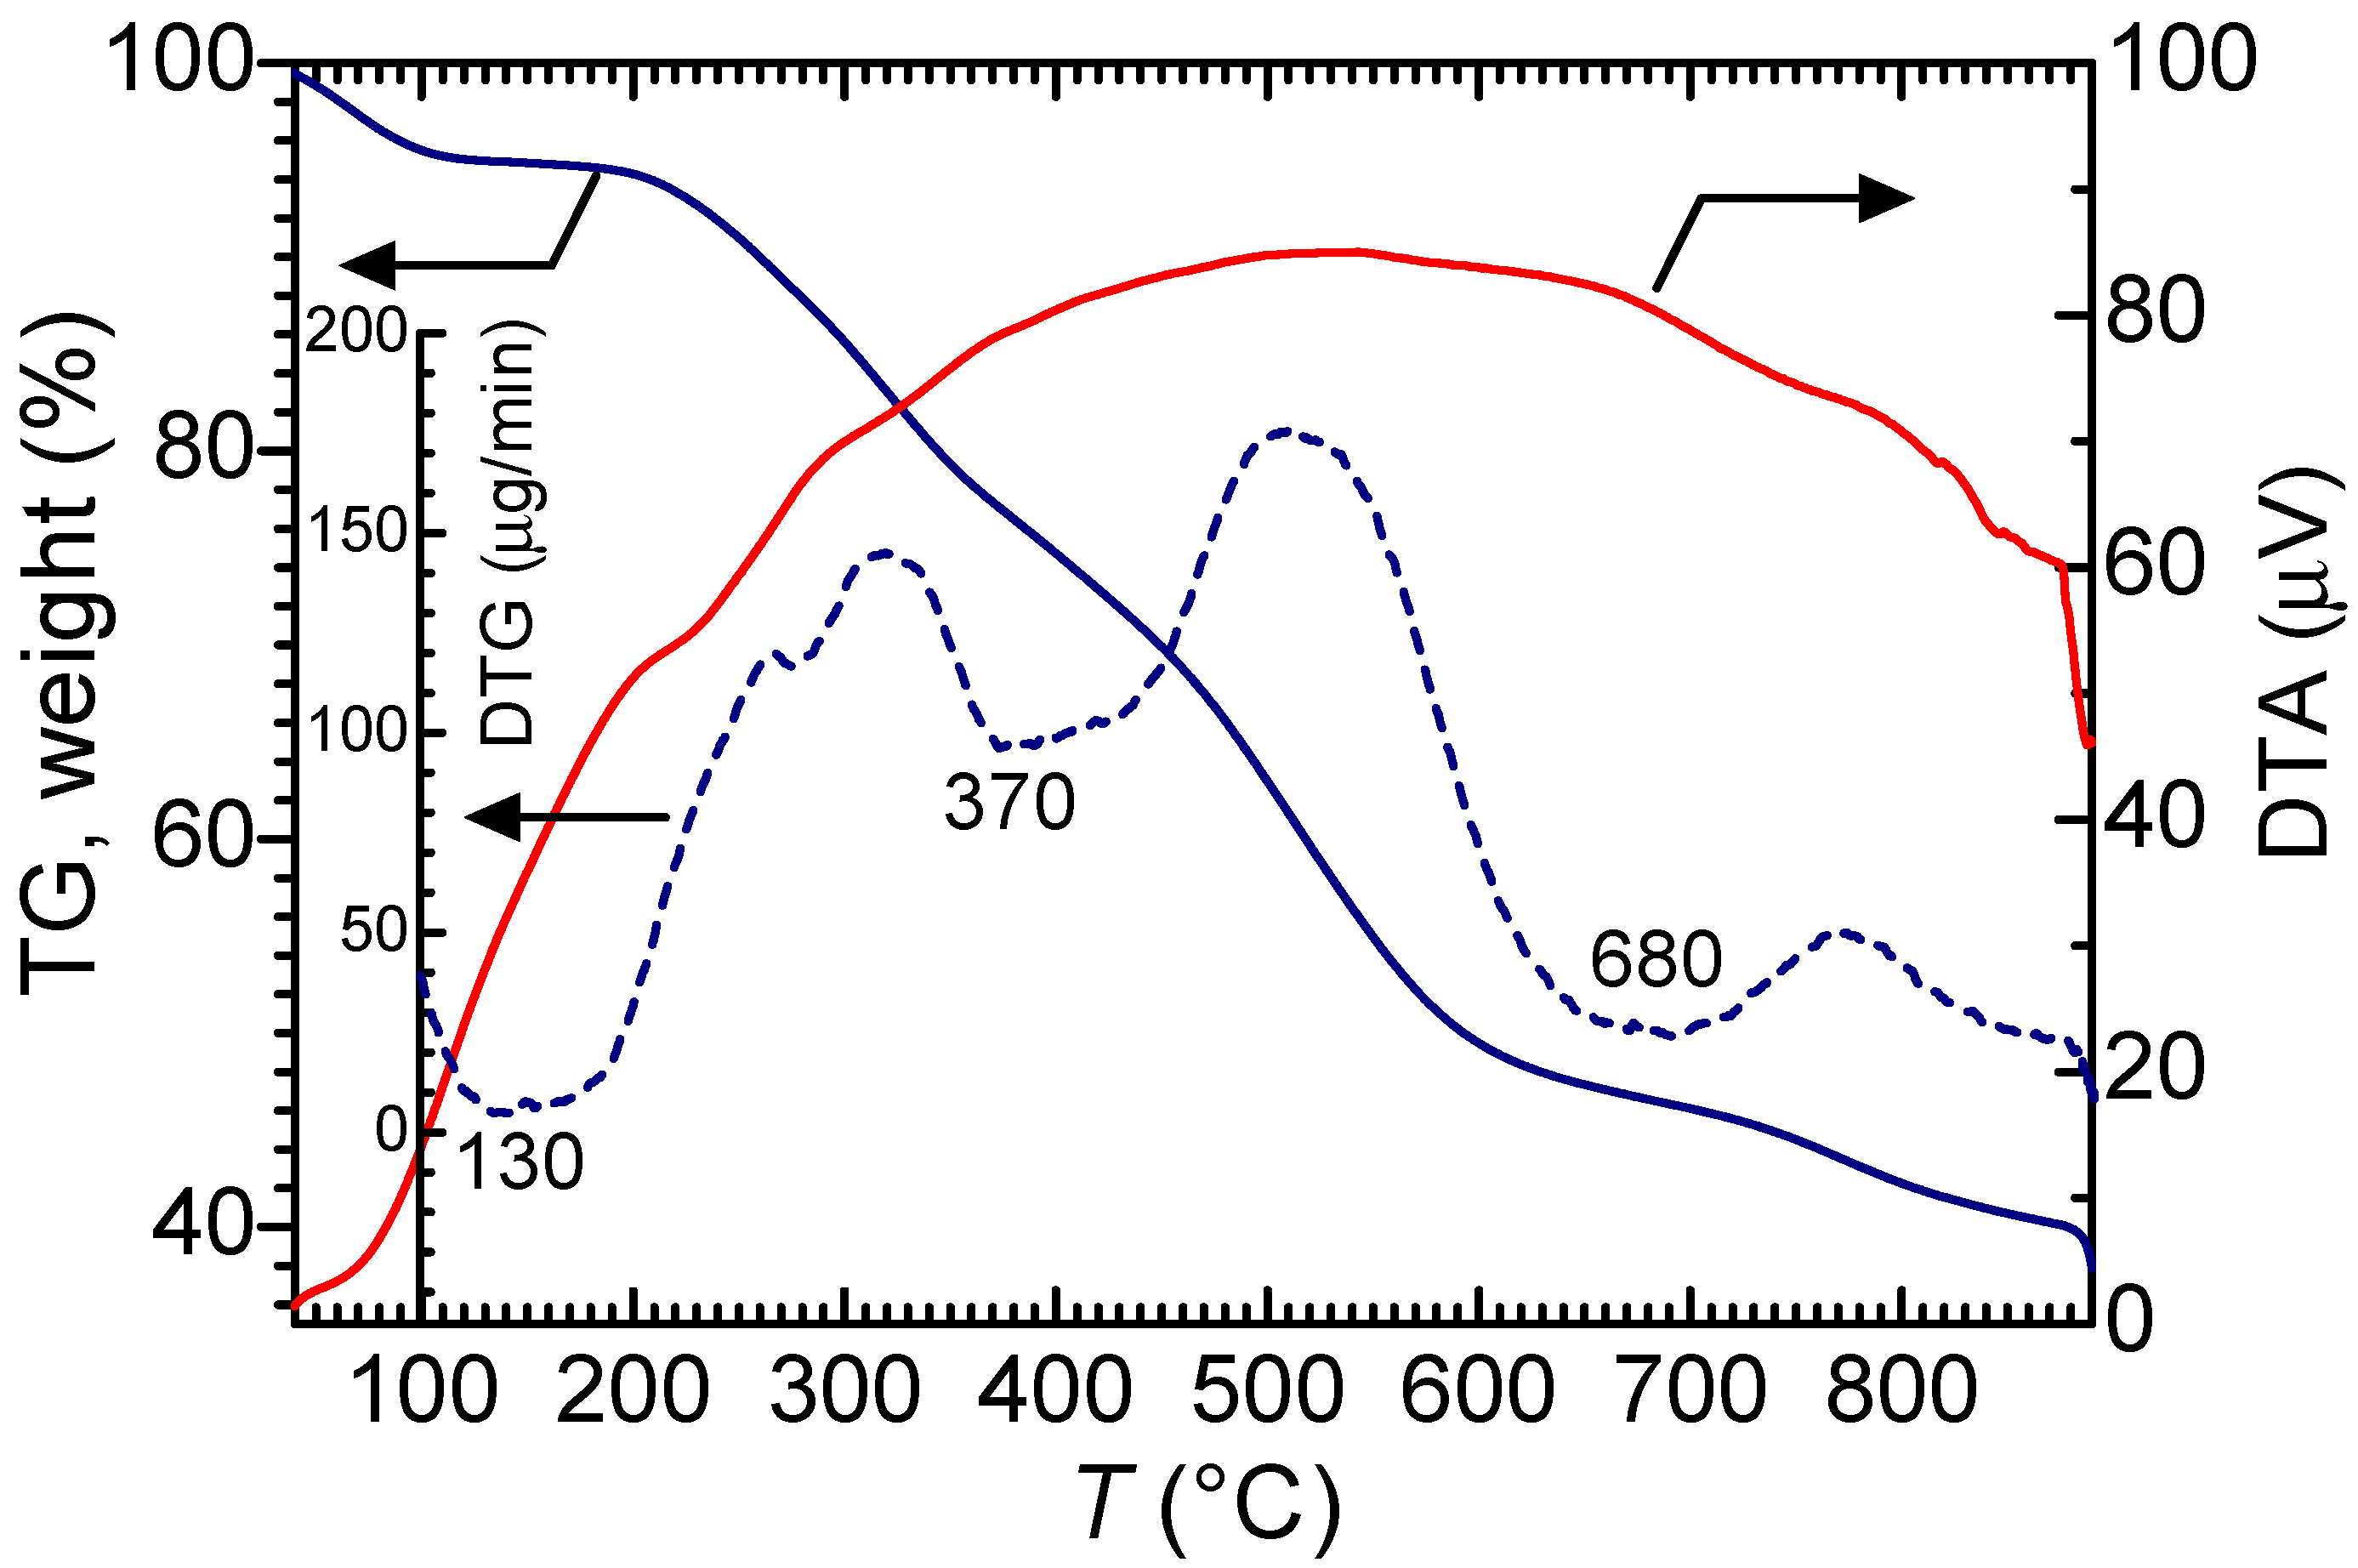
Figure 2 displayed the TG, the DTG, and the DTA measurement results for PANI-(+)-CSA. Inflection points corresponding to the weight loss were observed at 130, 370, and 680 °C, which values were estimated from the DTG. Carbonization of PANI-(+)-CSA resulted in 40% at 870 °C from the original PANI weight. The DTA curve indicates the out-gassing of the powder sample. A broad peak top was observed in the DTA, implying the carbonization was mainly carried out at 538 °C (Figure 2).
4.2. Surface Image
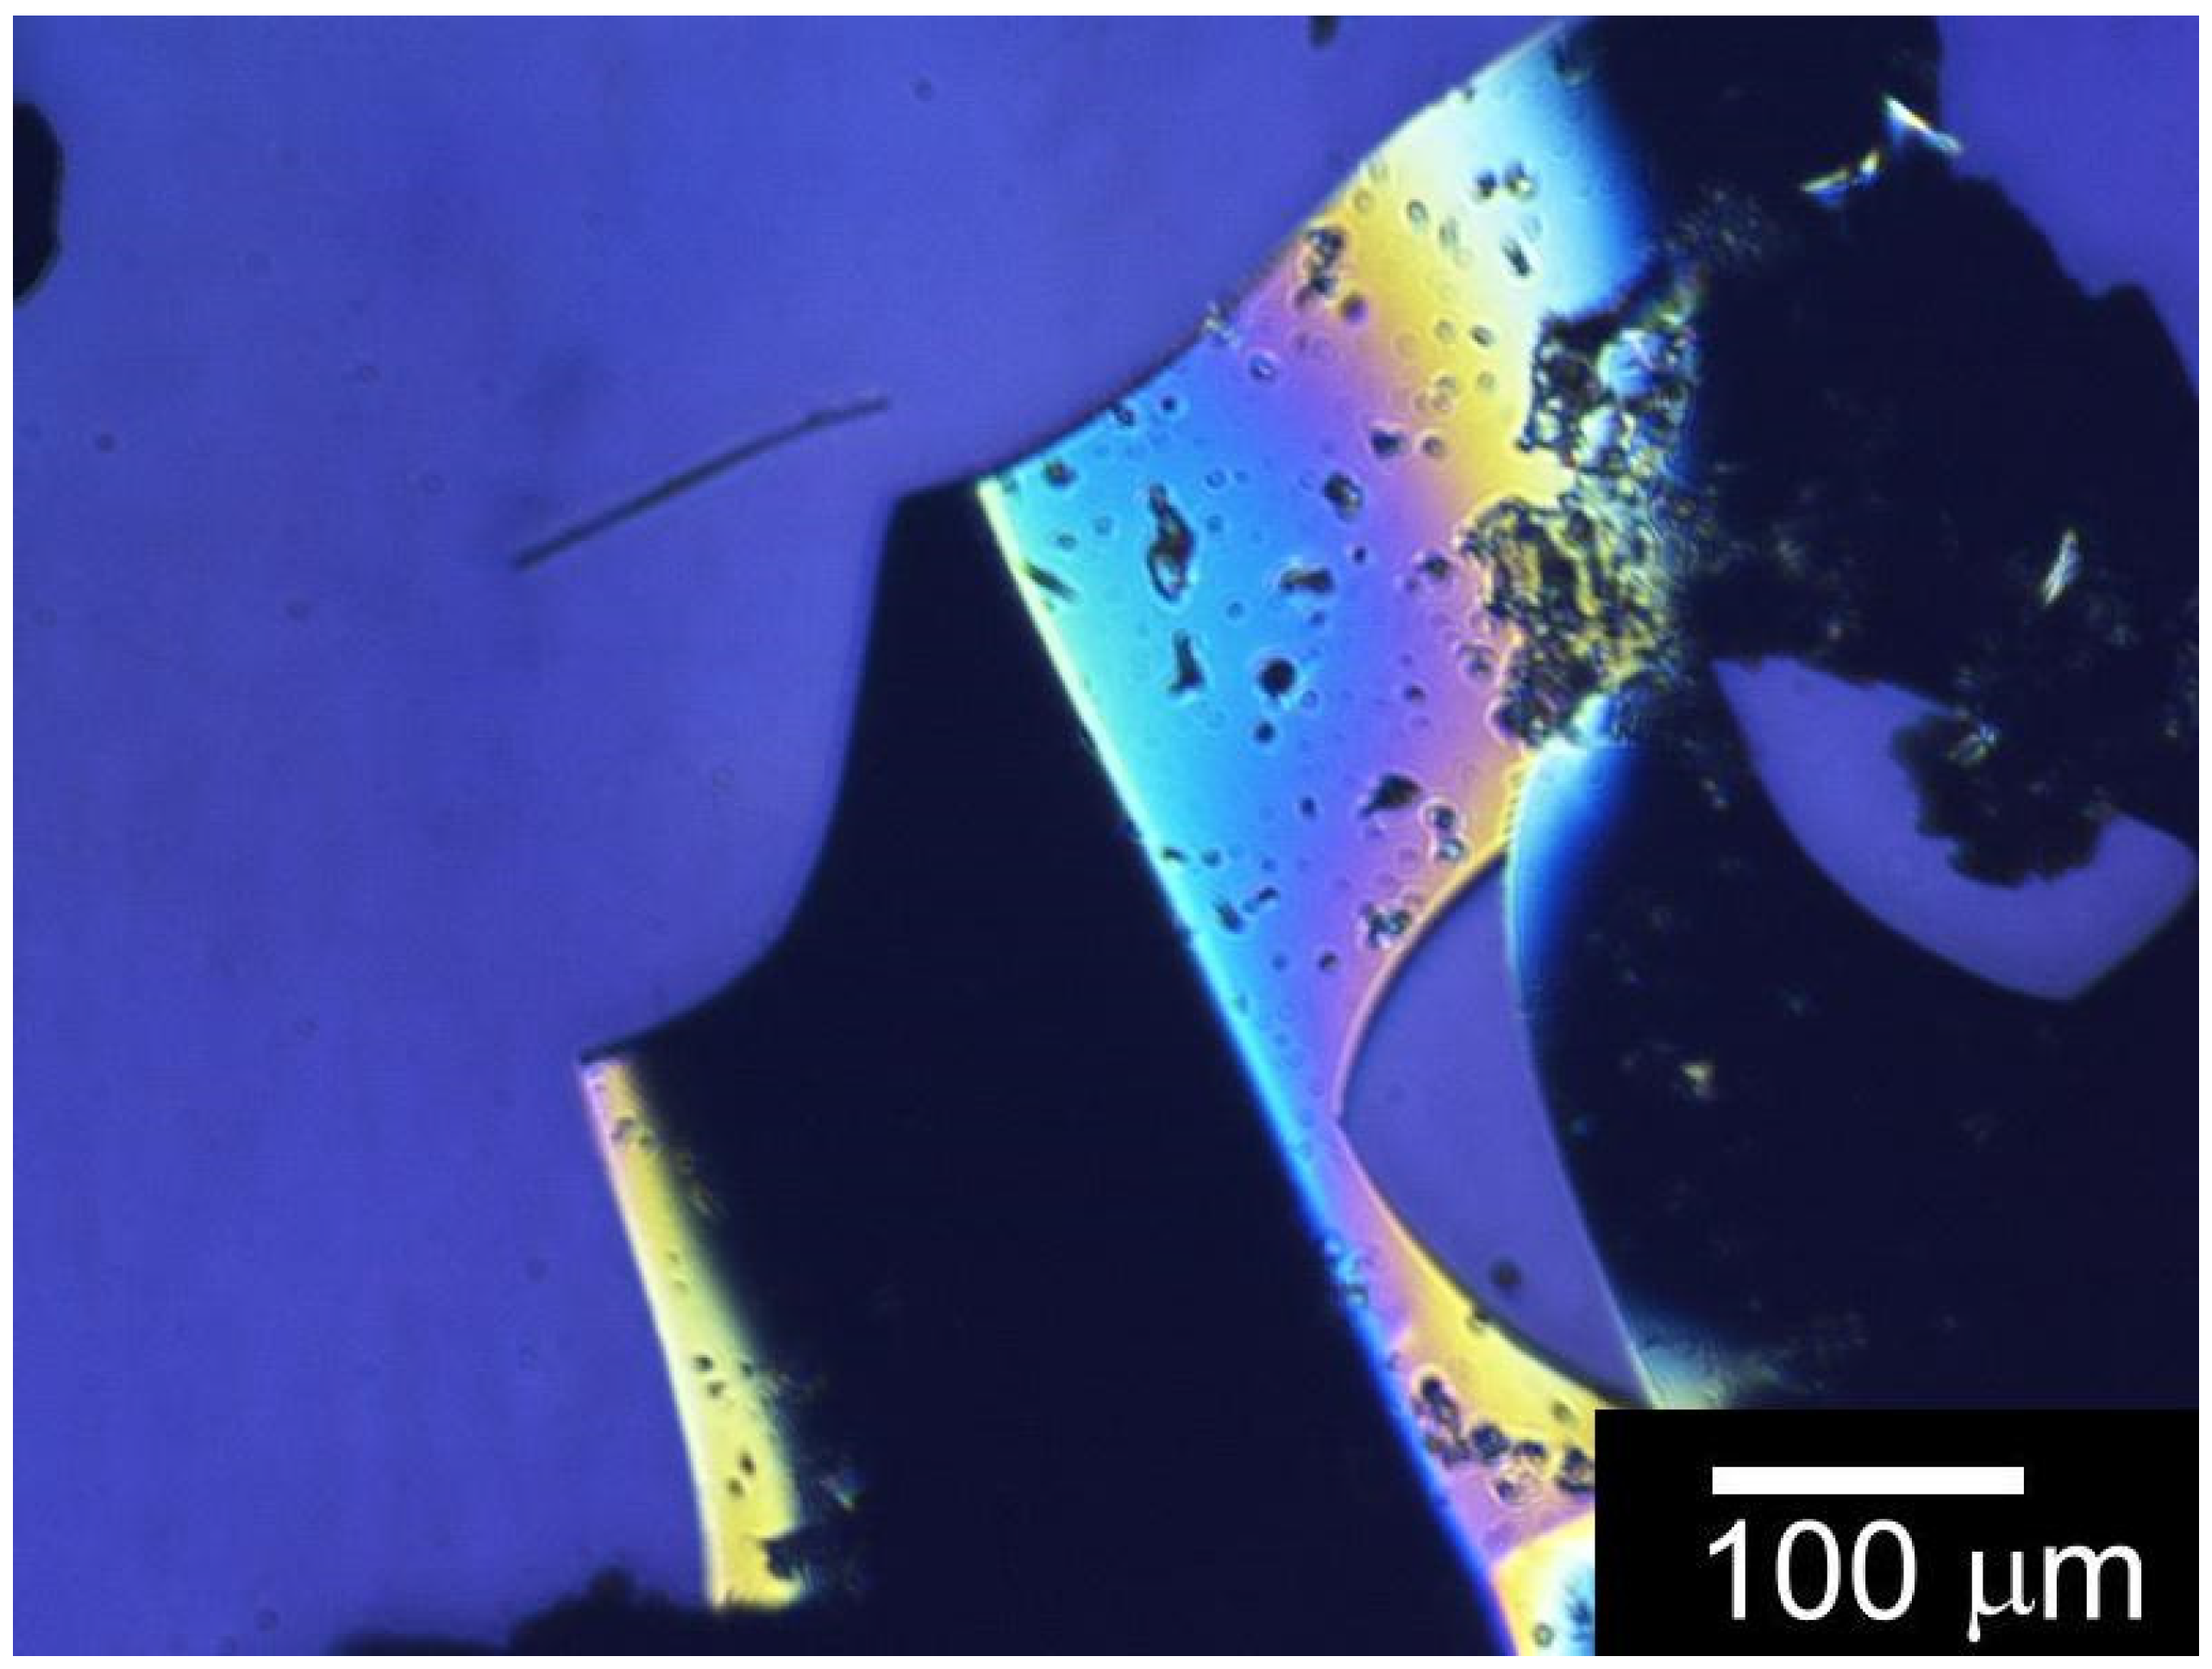
Figure 3 shows an optical microscopy image of V-CB(PANI) with reflection light. The surface of the V-CB(PANI) exhibits a silver-metallic light reflection with a rainbow color.
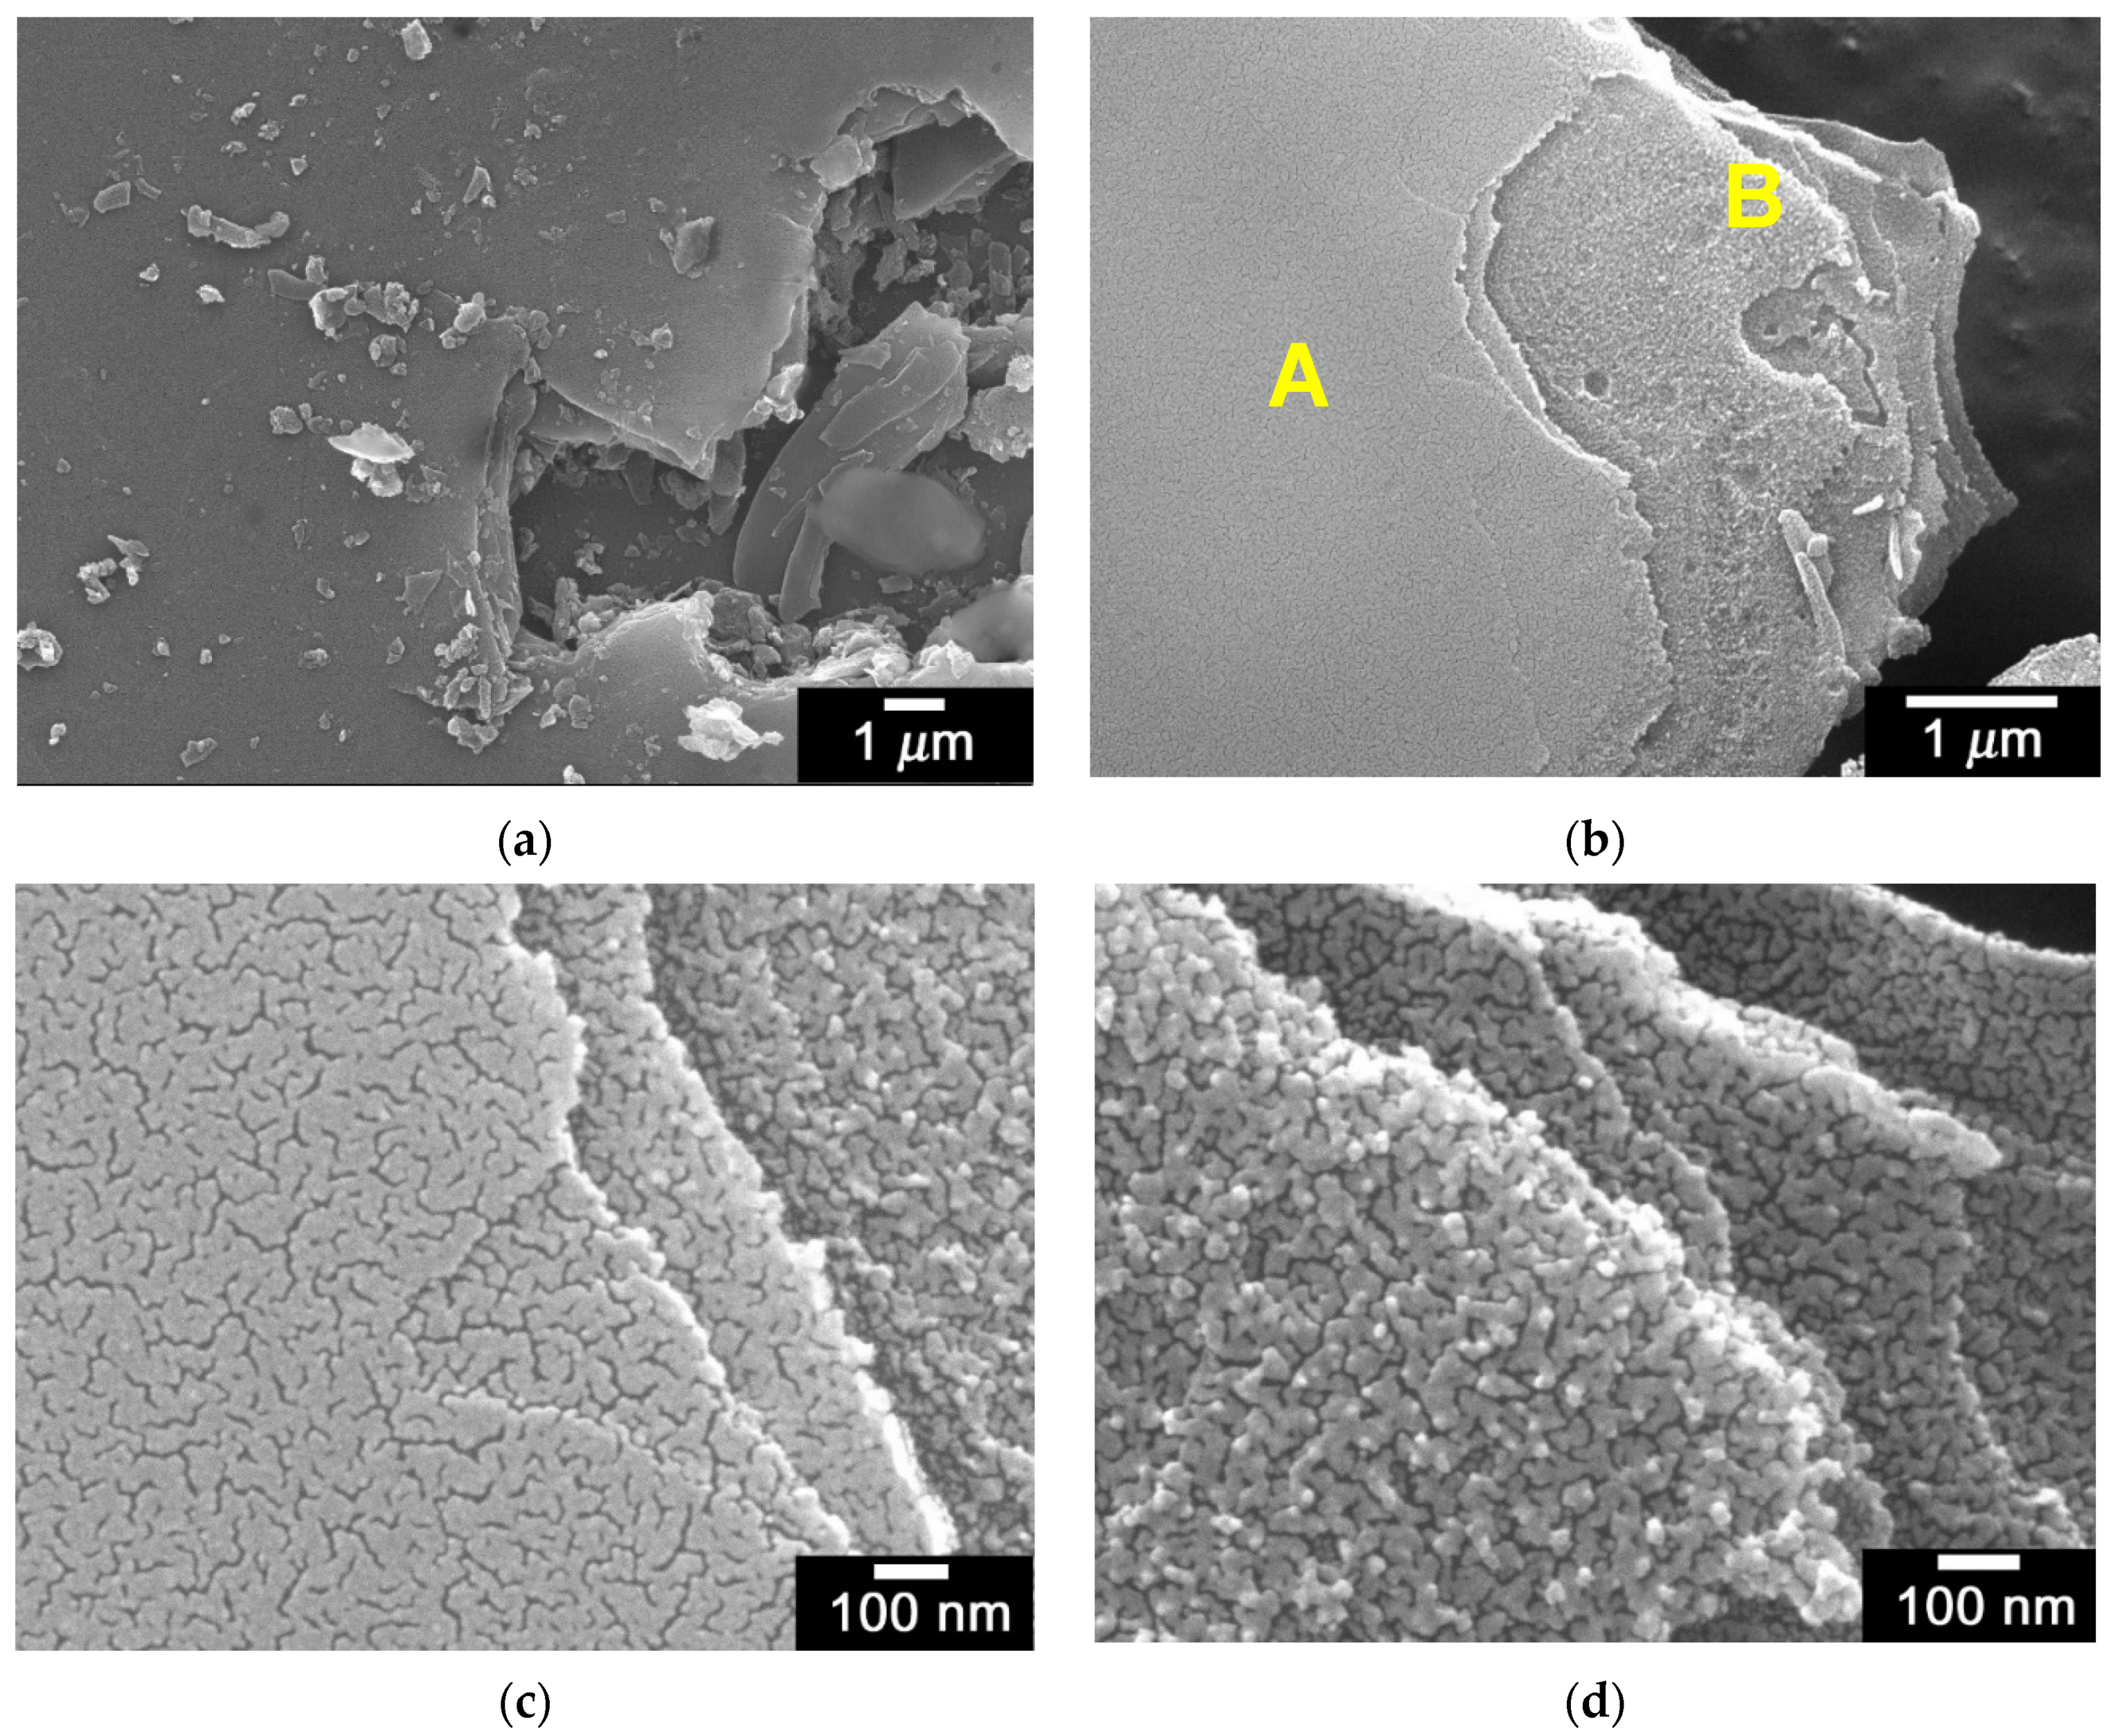
Figure 4 shows scanning electron microscopy (SEM) images of V-CB(PANI). The surface of V-CB(PANI) is smooth (Figure 4a,b(A)). However, the V-CB(PANI) consisted of a multilayer structure, as shown in Figure 4b. The magnification of Figure 4b(B) exhibited a cracked structure (Figure 4c). The bottom layers of the V-CB(PANI) showed fine structures. Finer particles were observed in the inner layer. (Figure 4d). Some holes were observed in the inner layer (Figure 4e). The yellow arrow in Figure 4f indicates the cross-sectional direction of the sample for the layer observation.
4.3. XRD
X-ray diffraction (XRD) profiles of PANI-(+)-CSA, CB(PANI), and V-CB(PANI) are displayed in Figure 6. Diffraction signals of CB(PANI) appeared at 2θ = 24.25 (3.67 Å), 42.88 (2.10 Å), and 79.22 (1.21 Å). Diffraction signals of V-CB(PANI) appeared at 2θ = 24.77 (3.59 Å), 42.88 (2.10 Å), and 79.22 (1.21 Å), indicating V-CB(PANI) has a periodic structure, such as graphite layer structure. This signal pattern is comparable to that of graphene oxide and multi-wall carbon nanotubes.
4.4. EPMA and XPS Analysis
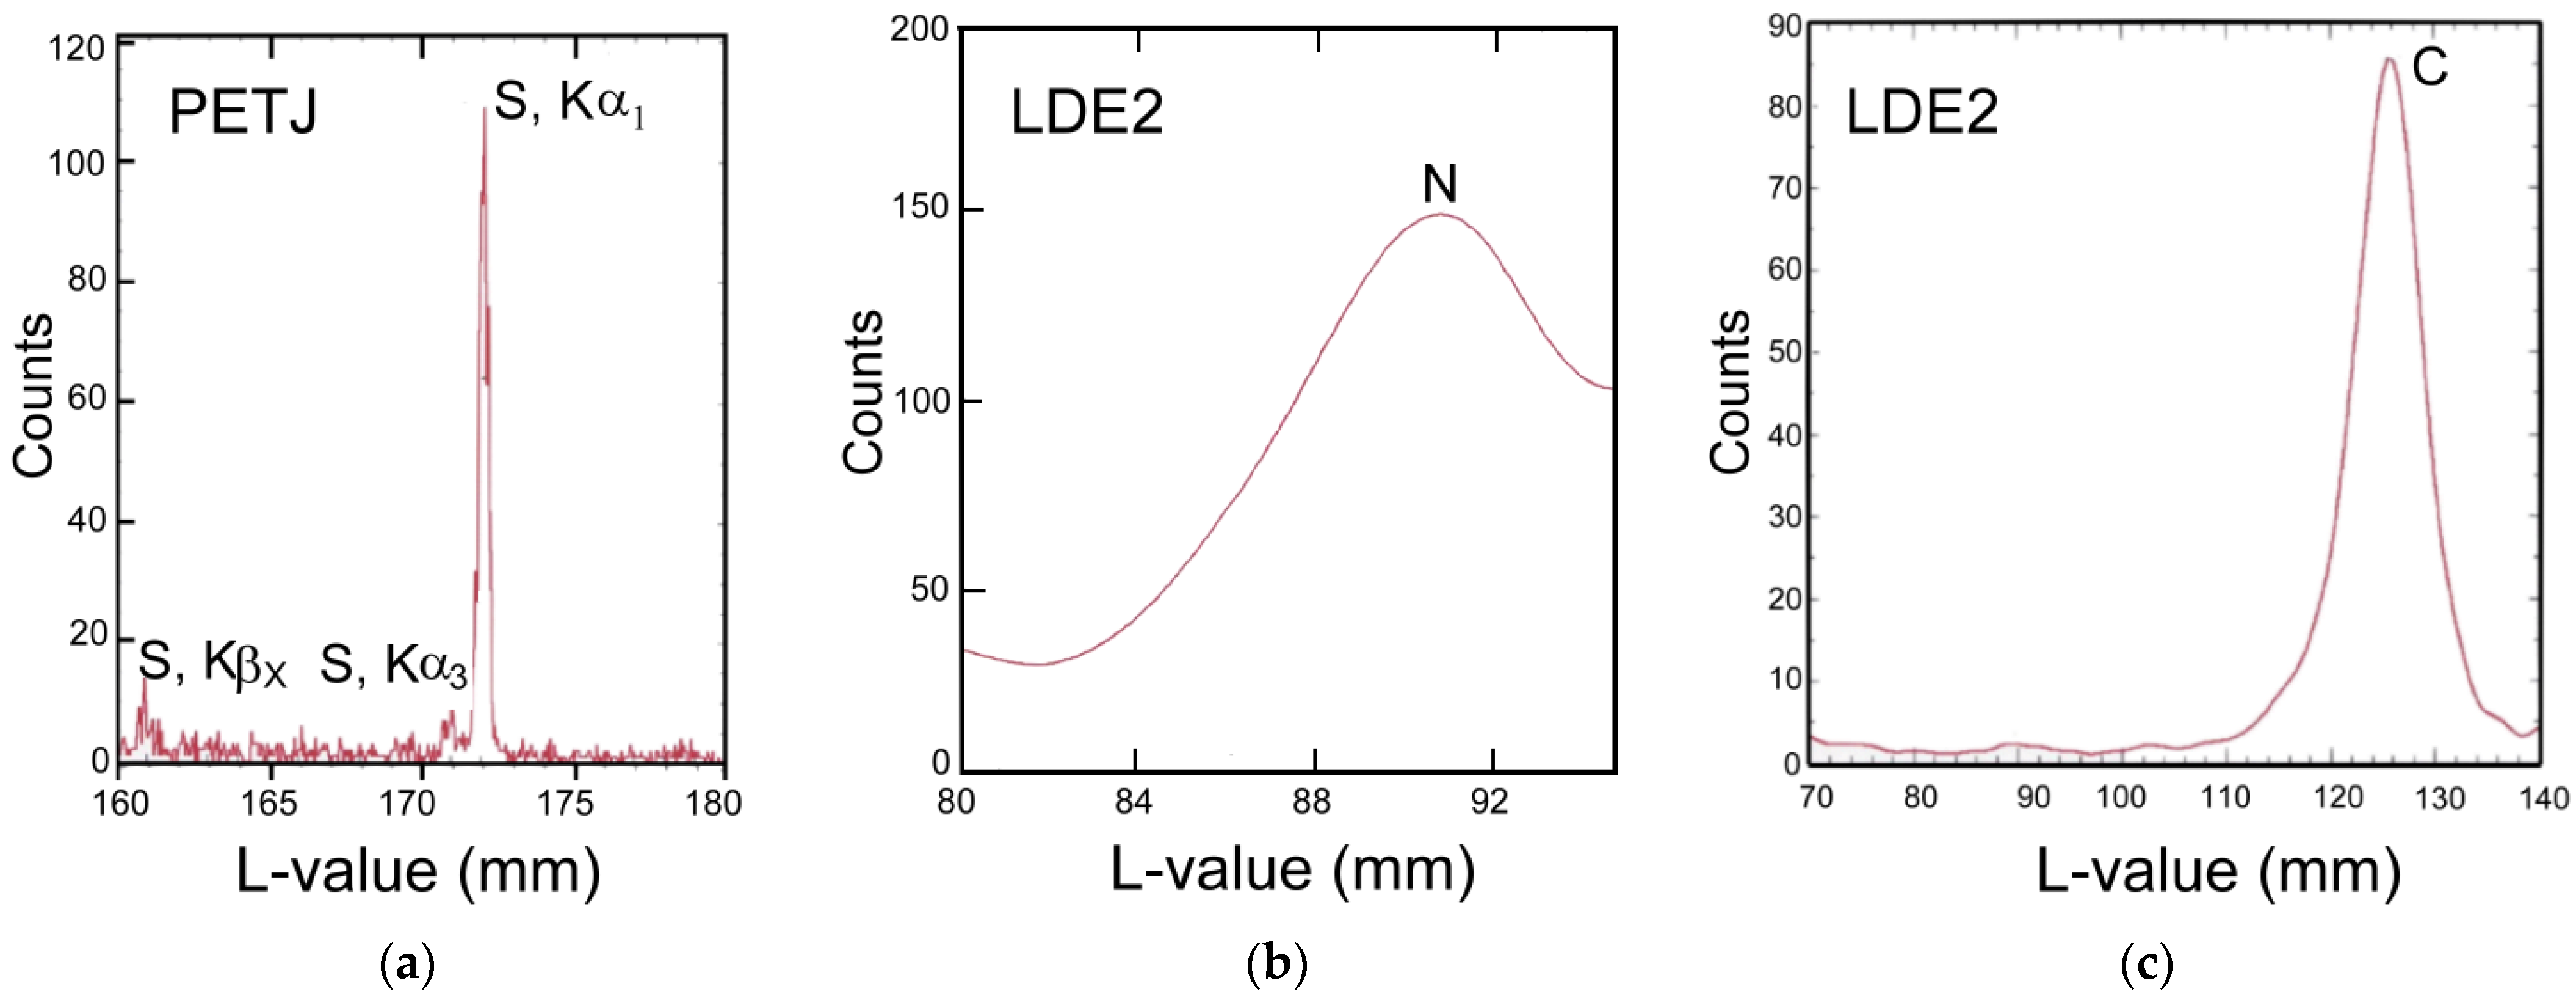
Electron probe micro-analyzer (EPMA) analysis was carried out for V-CB(PANI). Analysis with PETJ (PET = pentaerythritol) revealed that the sample contains sulfur (Figure 7a). Nitrogen and carbon were detected by the EPMA with LDE2 (LDE = artificial layered dispersive element crystals) as shown in Figure 7b. The EPMA result for the C atom exactly confirmed V-CB(PANI) consists of carbon (Figure 7c). Here, L is (2R/2d)nλ, 2R diameter of Rowland circle (mm), 2d spacing of analyzer crystal, n order of reflection, and λ wavelength (nm). These results indicate that V-CB(PANI) is a carbon-containing sulfur and nitrogen. The sulfur and the nitrogen come from (+)-camphor sulfonic acid and aniline units in the polymer, respectively. This result confirmed that the low molecular weight PANI, sulfur, and nitrogen vapors by pyrolysis were deposited on the quartz cylinder in the heating chamber and carbonized to form the carbon.
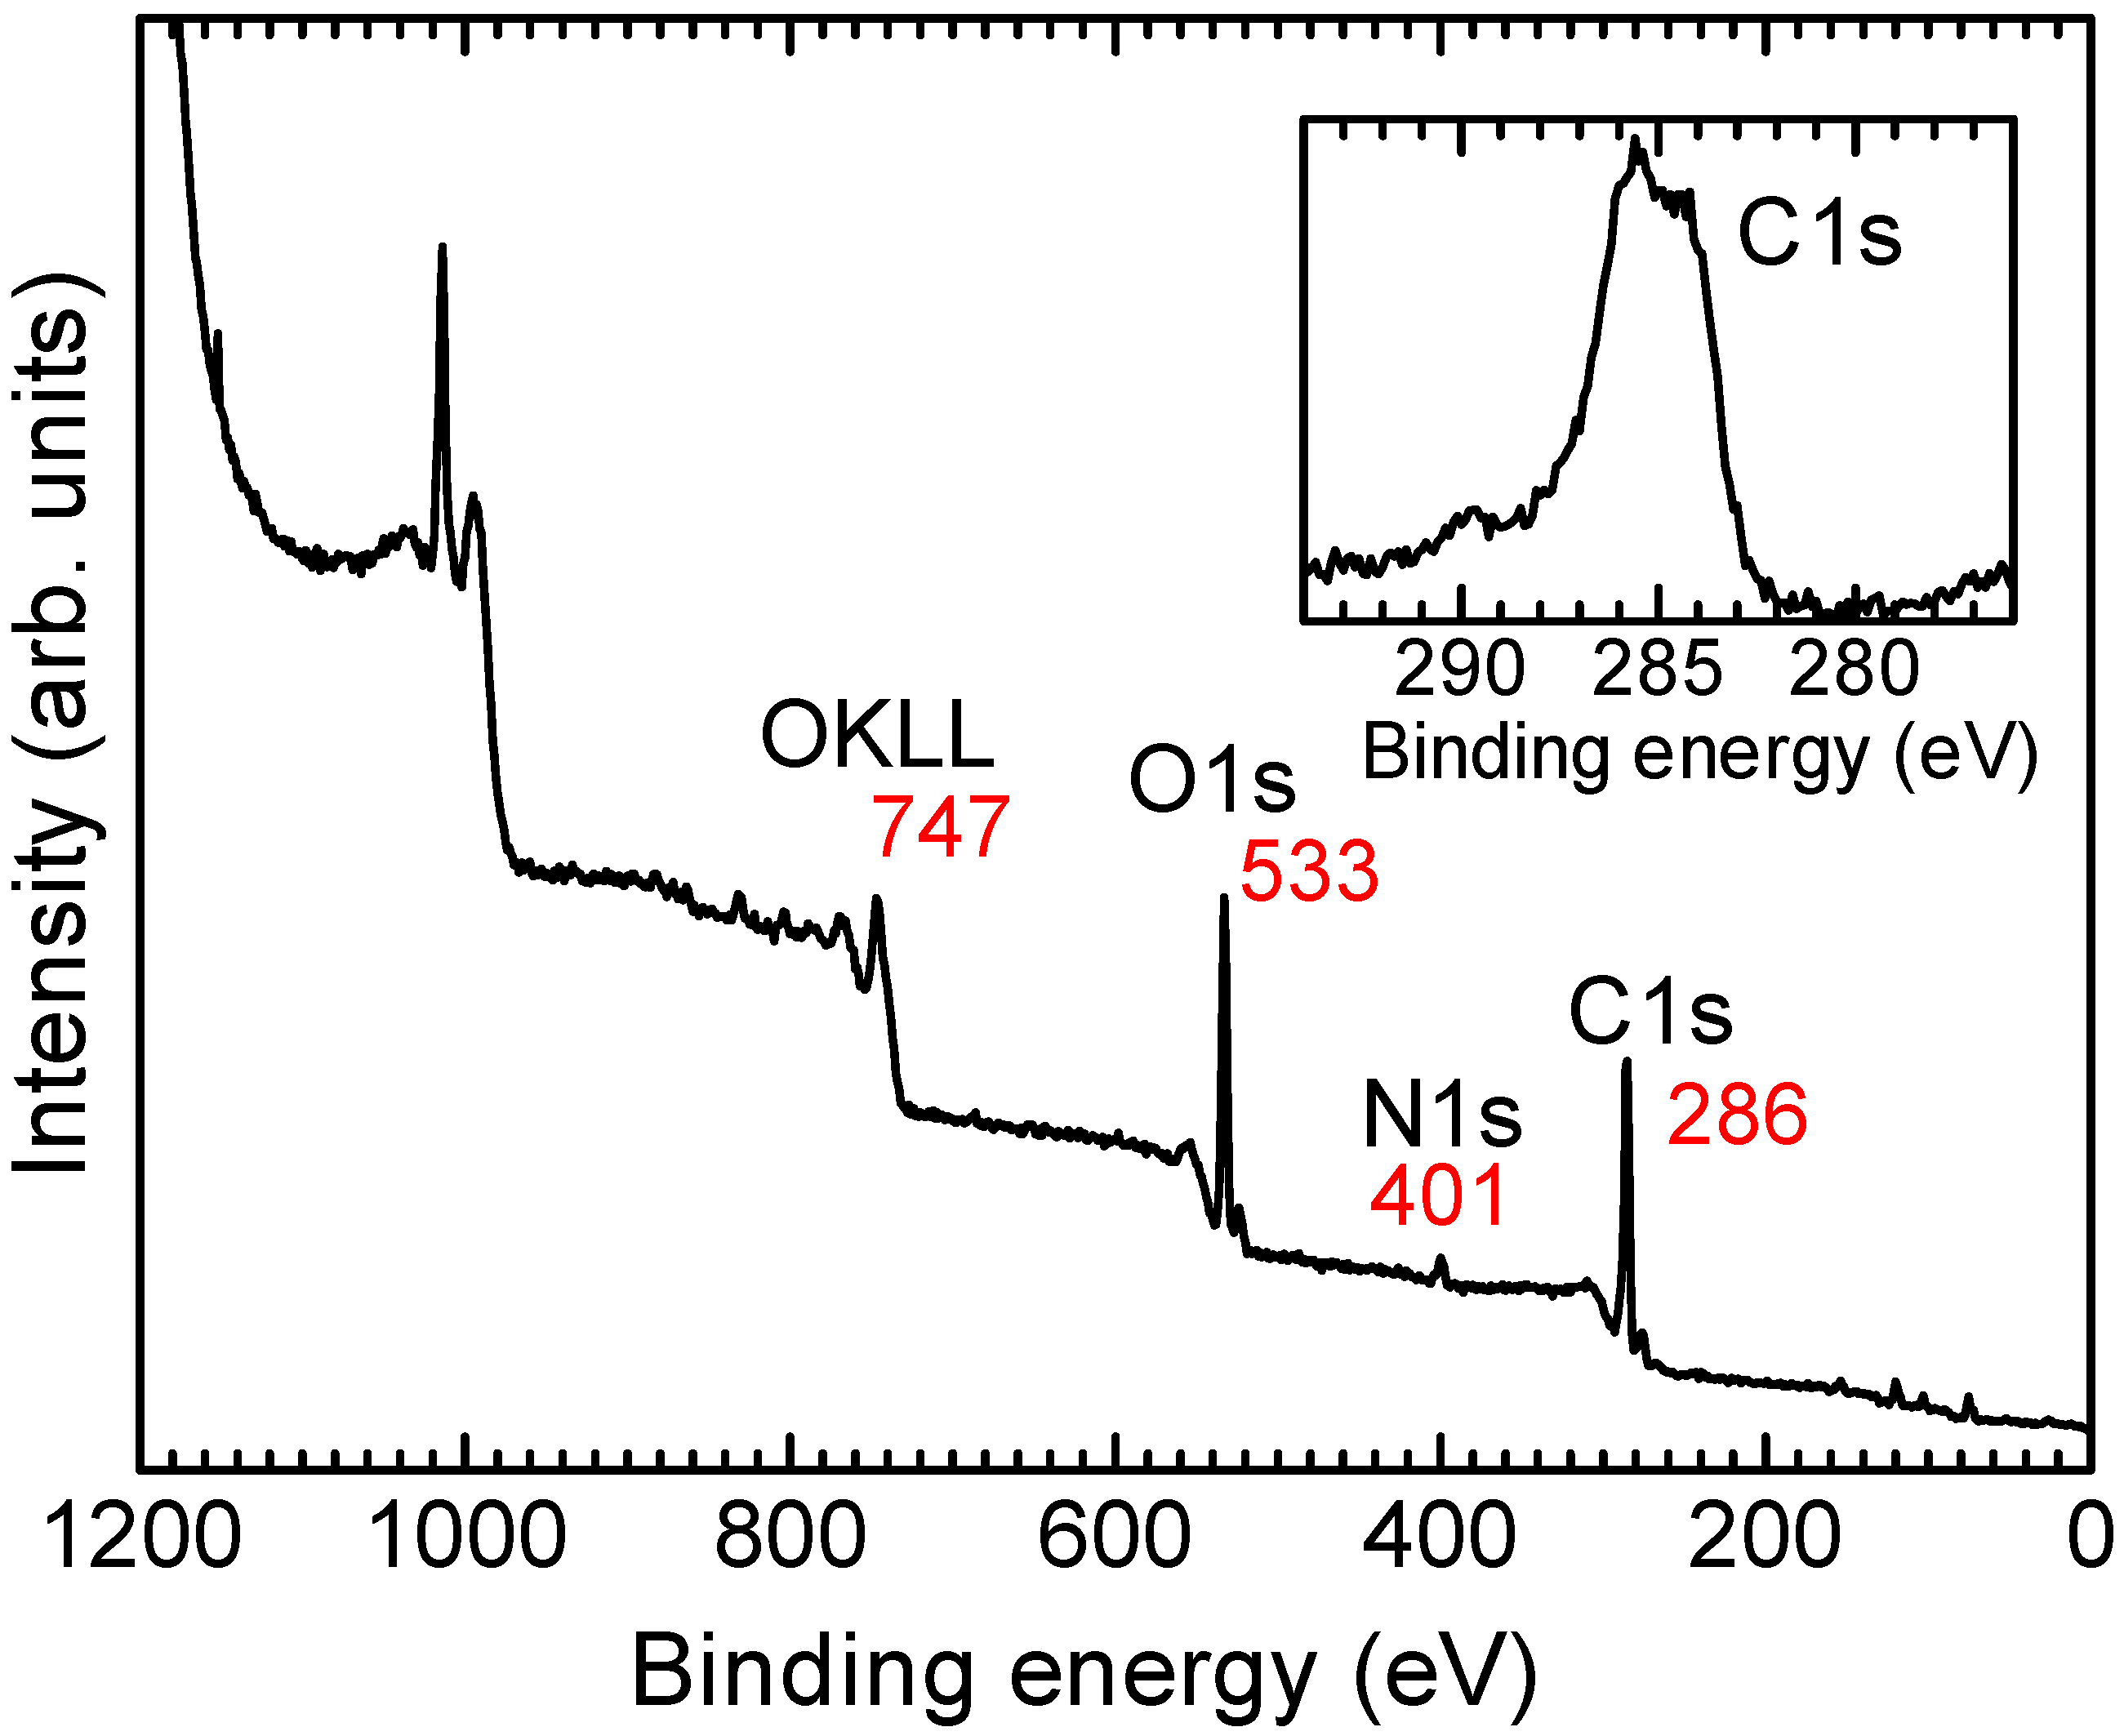
Figure 8 shows a wide scan result of the X-ray photoelectron spectroscopy (XPS) measurement for V-CB(PANI). The sample is mainly composed of carbon and nitrogen atoms, which signals appeared at 286 eV (C1s), 533 eV (O1S), and 747 eV (OKLL). The inset panel shows the magnification of low energy region for C1s signal. Nitrogen atoms were detected at a 401 eV (N1s). This XPS result corresponded to the EDS results.
4.5. IR and Raman Spectrum
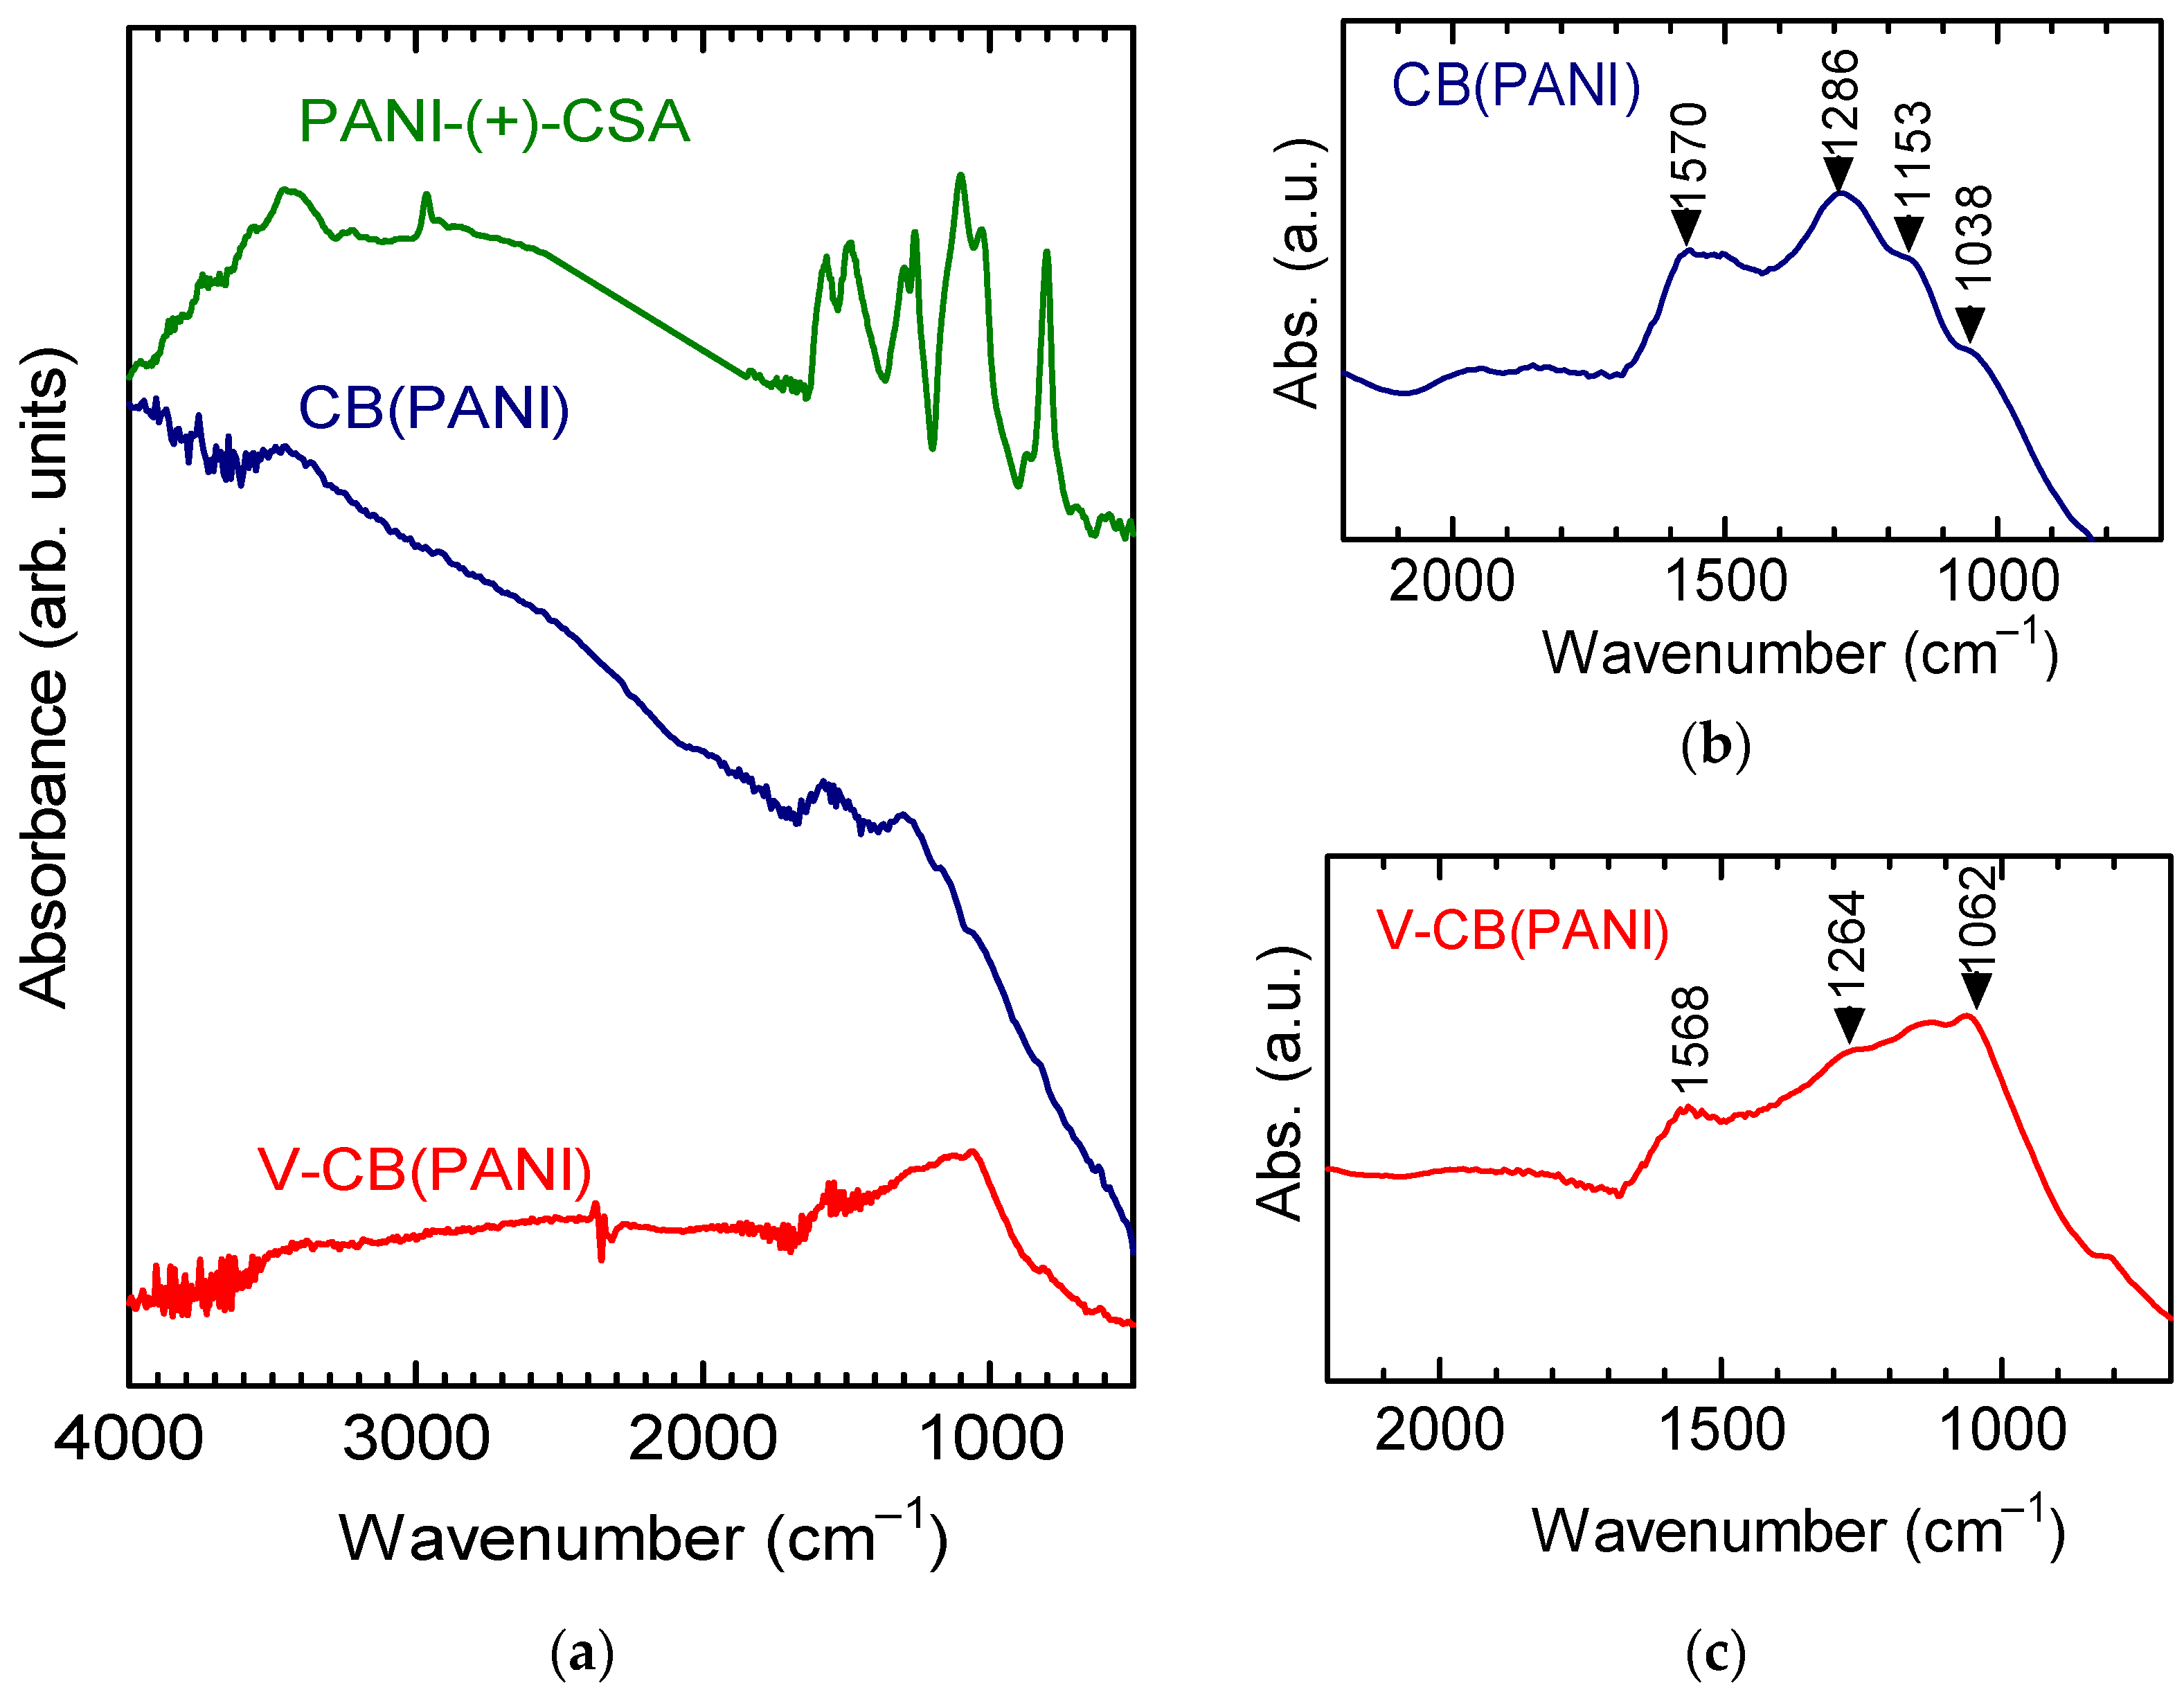
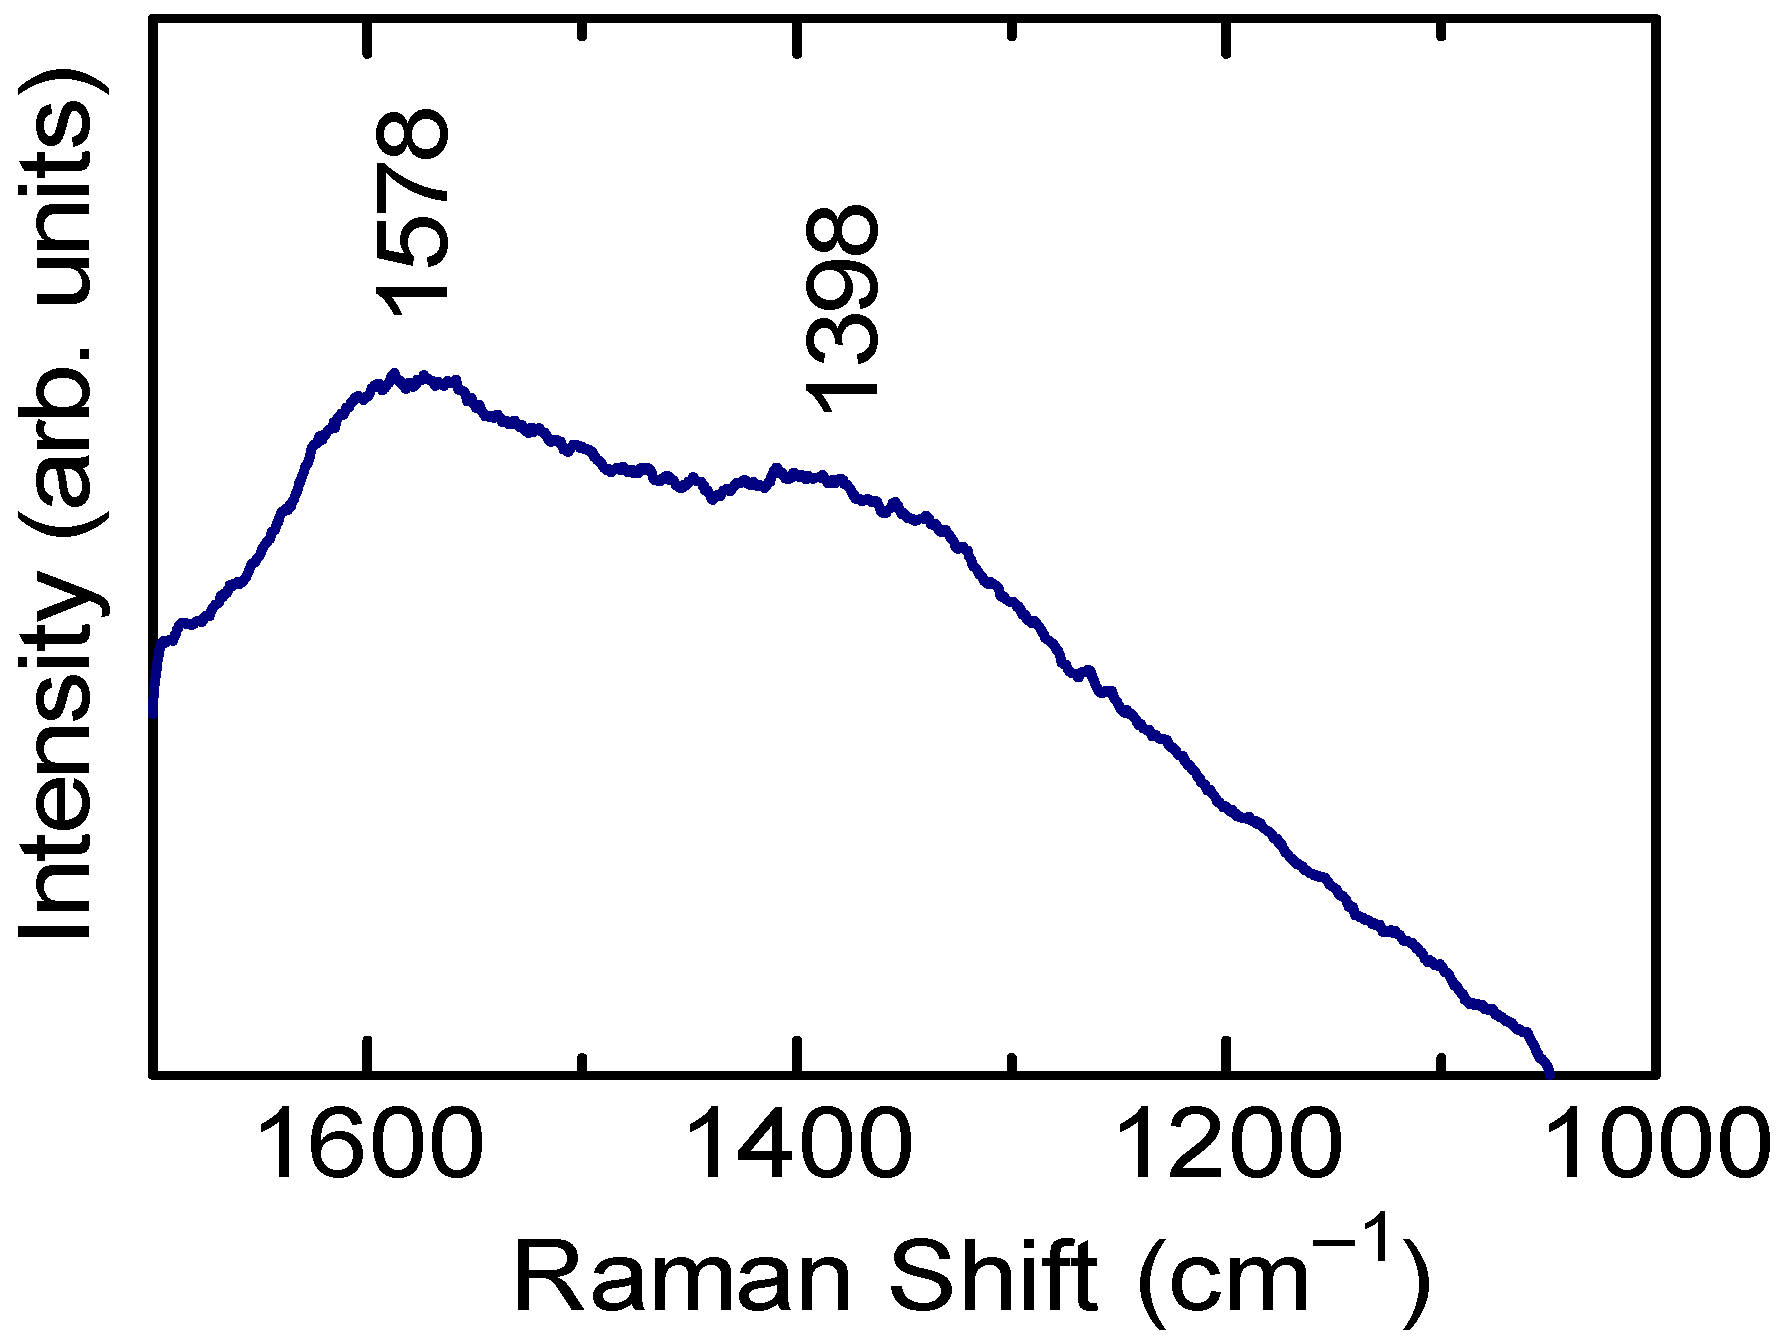
Infrared absorption spectroscopy (IR) measurements of PANI-(+)-CSA, CB(PANI), and V-CB(PANI) were carried out with the KBr method (Figure 9). PANI-(+)-CSA show absorptions at 1577, 1492, 1265, 1113, 1028, and 792 cm−1 (Figure 9a). However, CB(PANI) and V-CB(PANI) showed no absorption bands due to C=C stretching of benzenoid and the quinonoid structure derived from the PANI. Absorption at 1570 cm−1 of CB(PANI) and 1568 cm−1 of V-CB(PANI) was observed, which are ascribed to the aromatic structure of graphite related with G band of carbons, as shown in Figure 9b,c (magnification from Figure 9a). CB(PANI) shows an absorption band at 1286 and 1153, and 1038 cm−1, while V-CB(PANI) displayed an absorption band at 1264 and 1062 cm−1, which absorption bands can be related to the D band of the carbons. This result indicates V-CB(PANI) formed a graphite-like aromatic structure, and its chemical structure is different from that of CB(PANI). Figure 10 shows the Raman spectroscopy measurement result for V-CB(PANI). The two Raman shift signals at 1578 and 1398 cm−1 are assignable to the G band and the D band. The D-band is due to the phonon lattice vibration derived from sp2 carbons, suggesting the presence of defective structures in V-CB(PANI). This Raman shift suggests that the carbon is an sp2 carbon organized in aromatic units. The G band is broad, indicating a disorder structure at the spectroscopic level [22].
4.6. ESR
Electron spin resonance (ESR) measurements of V-CB(PANI) were carried out. The V-CB(PANI) showed an asymmetric Dysonian line shape with a g-value of 2.00329, as shown in Figure 11. The asymmetric factor A/B was 1.2. The microwave scan could not completely intrude into the sample because of conduction electrons on the surface as skin effect. Note that free electrons show a g-value of 2.00232. The present result indicates that unpaired electrons exist in V-CB(PANI). The electrons distribute either in the entire sample of V-CB(PANI) or the edge part.
4.7. Resistance
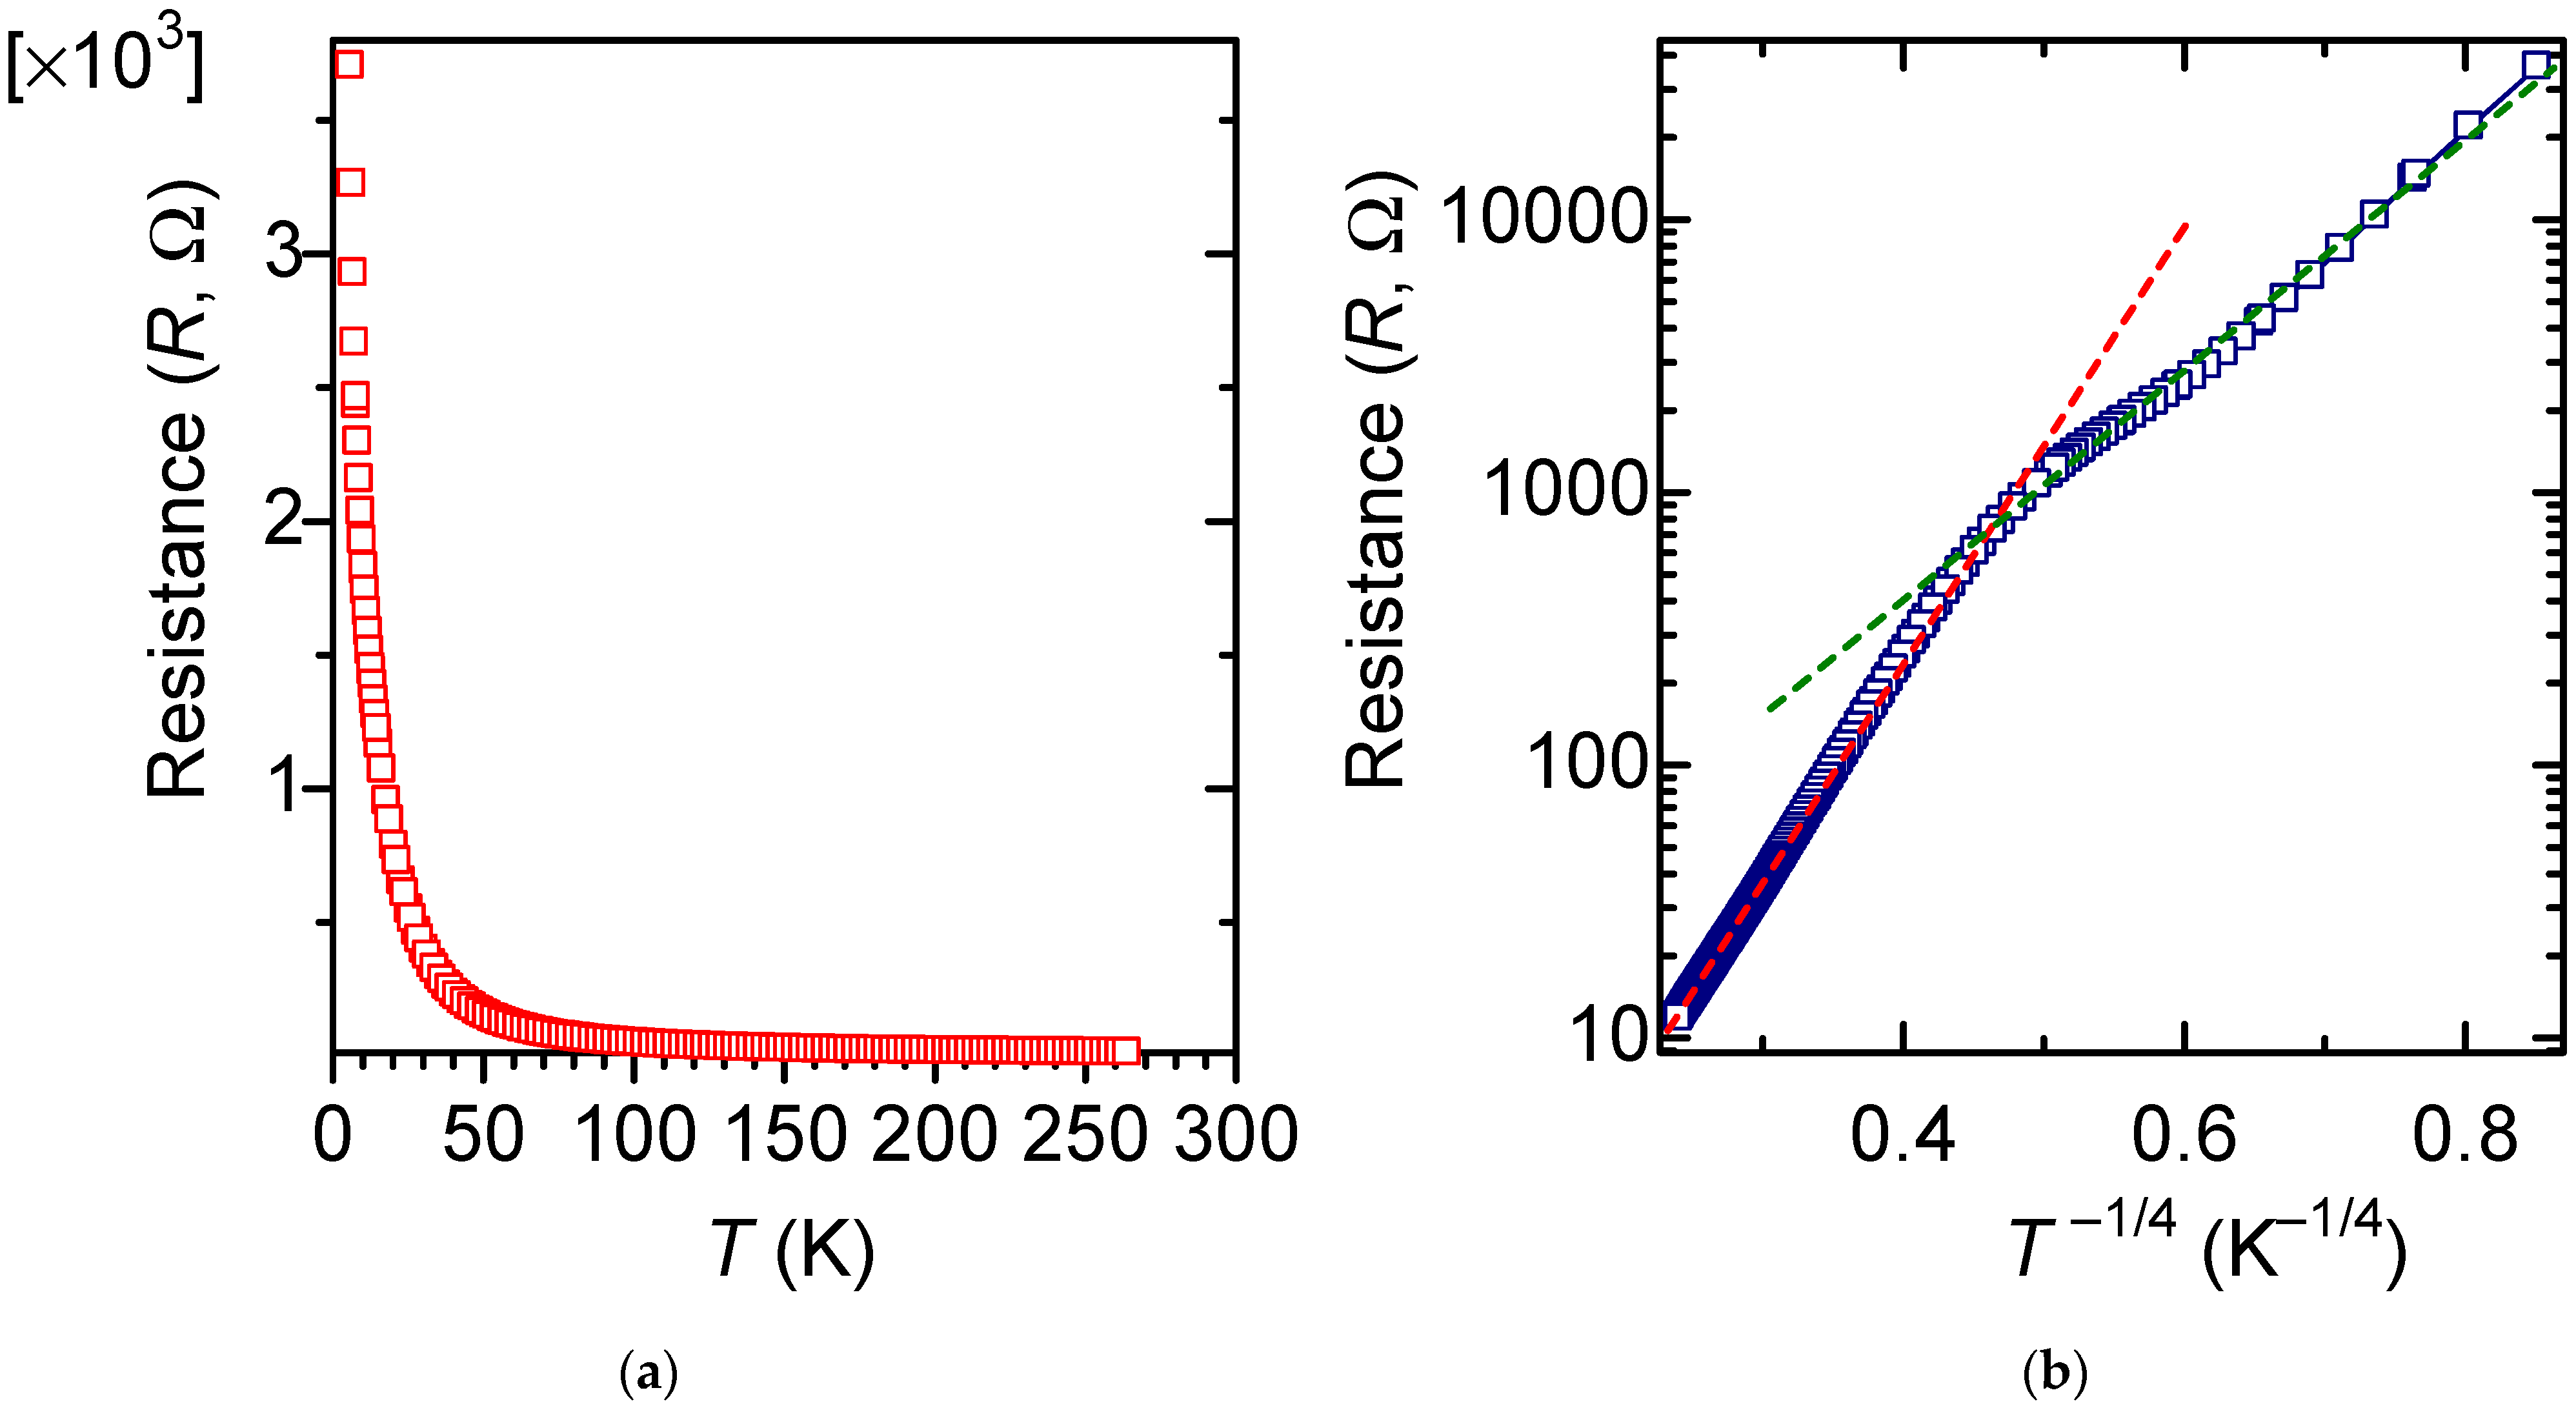
Figure 12 shows resistance (R) vs. temperature (T) for the V-CB(PANI). The resistance of V-CB(PANI) decreases with the increase of T (Figure 12a). The inflection point of the resistance was observable at ca. 30 K, where semiconductor−insulator transition occured. The metallic reflection from the surface may be related to plasma reflection, which is observable for conducting polymers such as polyacetylene. Also, the intense reflection from the surface of V-CB(PANI) might be derived from the sulfur atoms in the V-CB(PANI). In the case of pyrites showing gold color, the metallic reflection is not due to plasma reflection. The color of pyrites comes from intense absorption in the range of green to red. However, the metallic light reflection of V-CB(PANI) may be related to free electrons distributed on the surface, and optical absorption caused by the existence of sulfur in V-CB(PANI). Figure 12b shows R (ρ) as a function of T−1/4. Two linear increase ranges (red and green dotted lines) were observed. Here, 1/R is proportional to conductivity (1/R ∝ σ). Change in the lnR values (lnρ) in the two ranges were almost linear with respect to T−1/4 (d + 1 = 4 (Formula (1)), d = 3, three dimensions). TMott is certain temperature determined by Nevill Mott (Formula (2)), which depends on the energy distribution of the electronic and localized states, and d is the dimension of the electrical conduction.
kB, Boltzmann constant; N (EF), the density of states at the Fermi level; Lloc, the localization length.
ρ(T) =ρ(0)exp(TMott/T)−(1/d+1)
TMott = 16/(kBN(EF)L3loc)
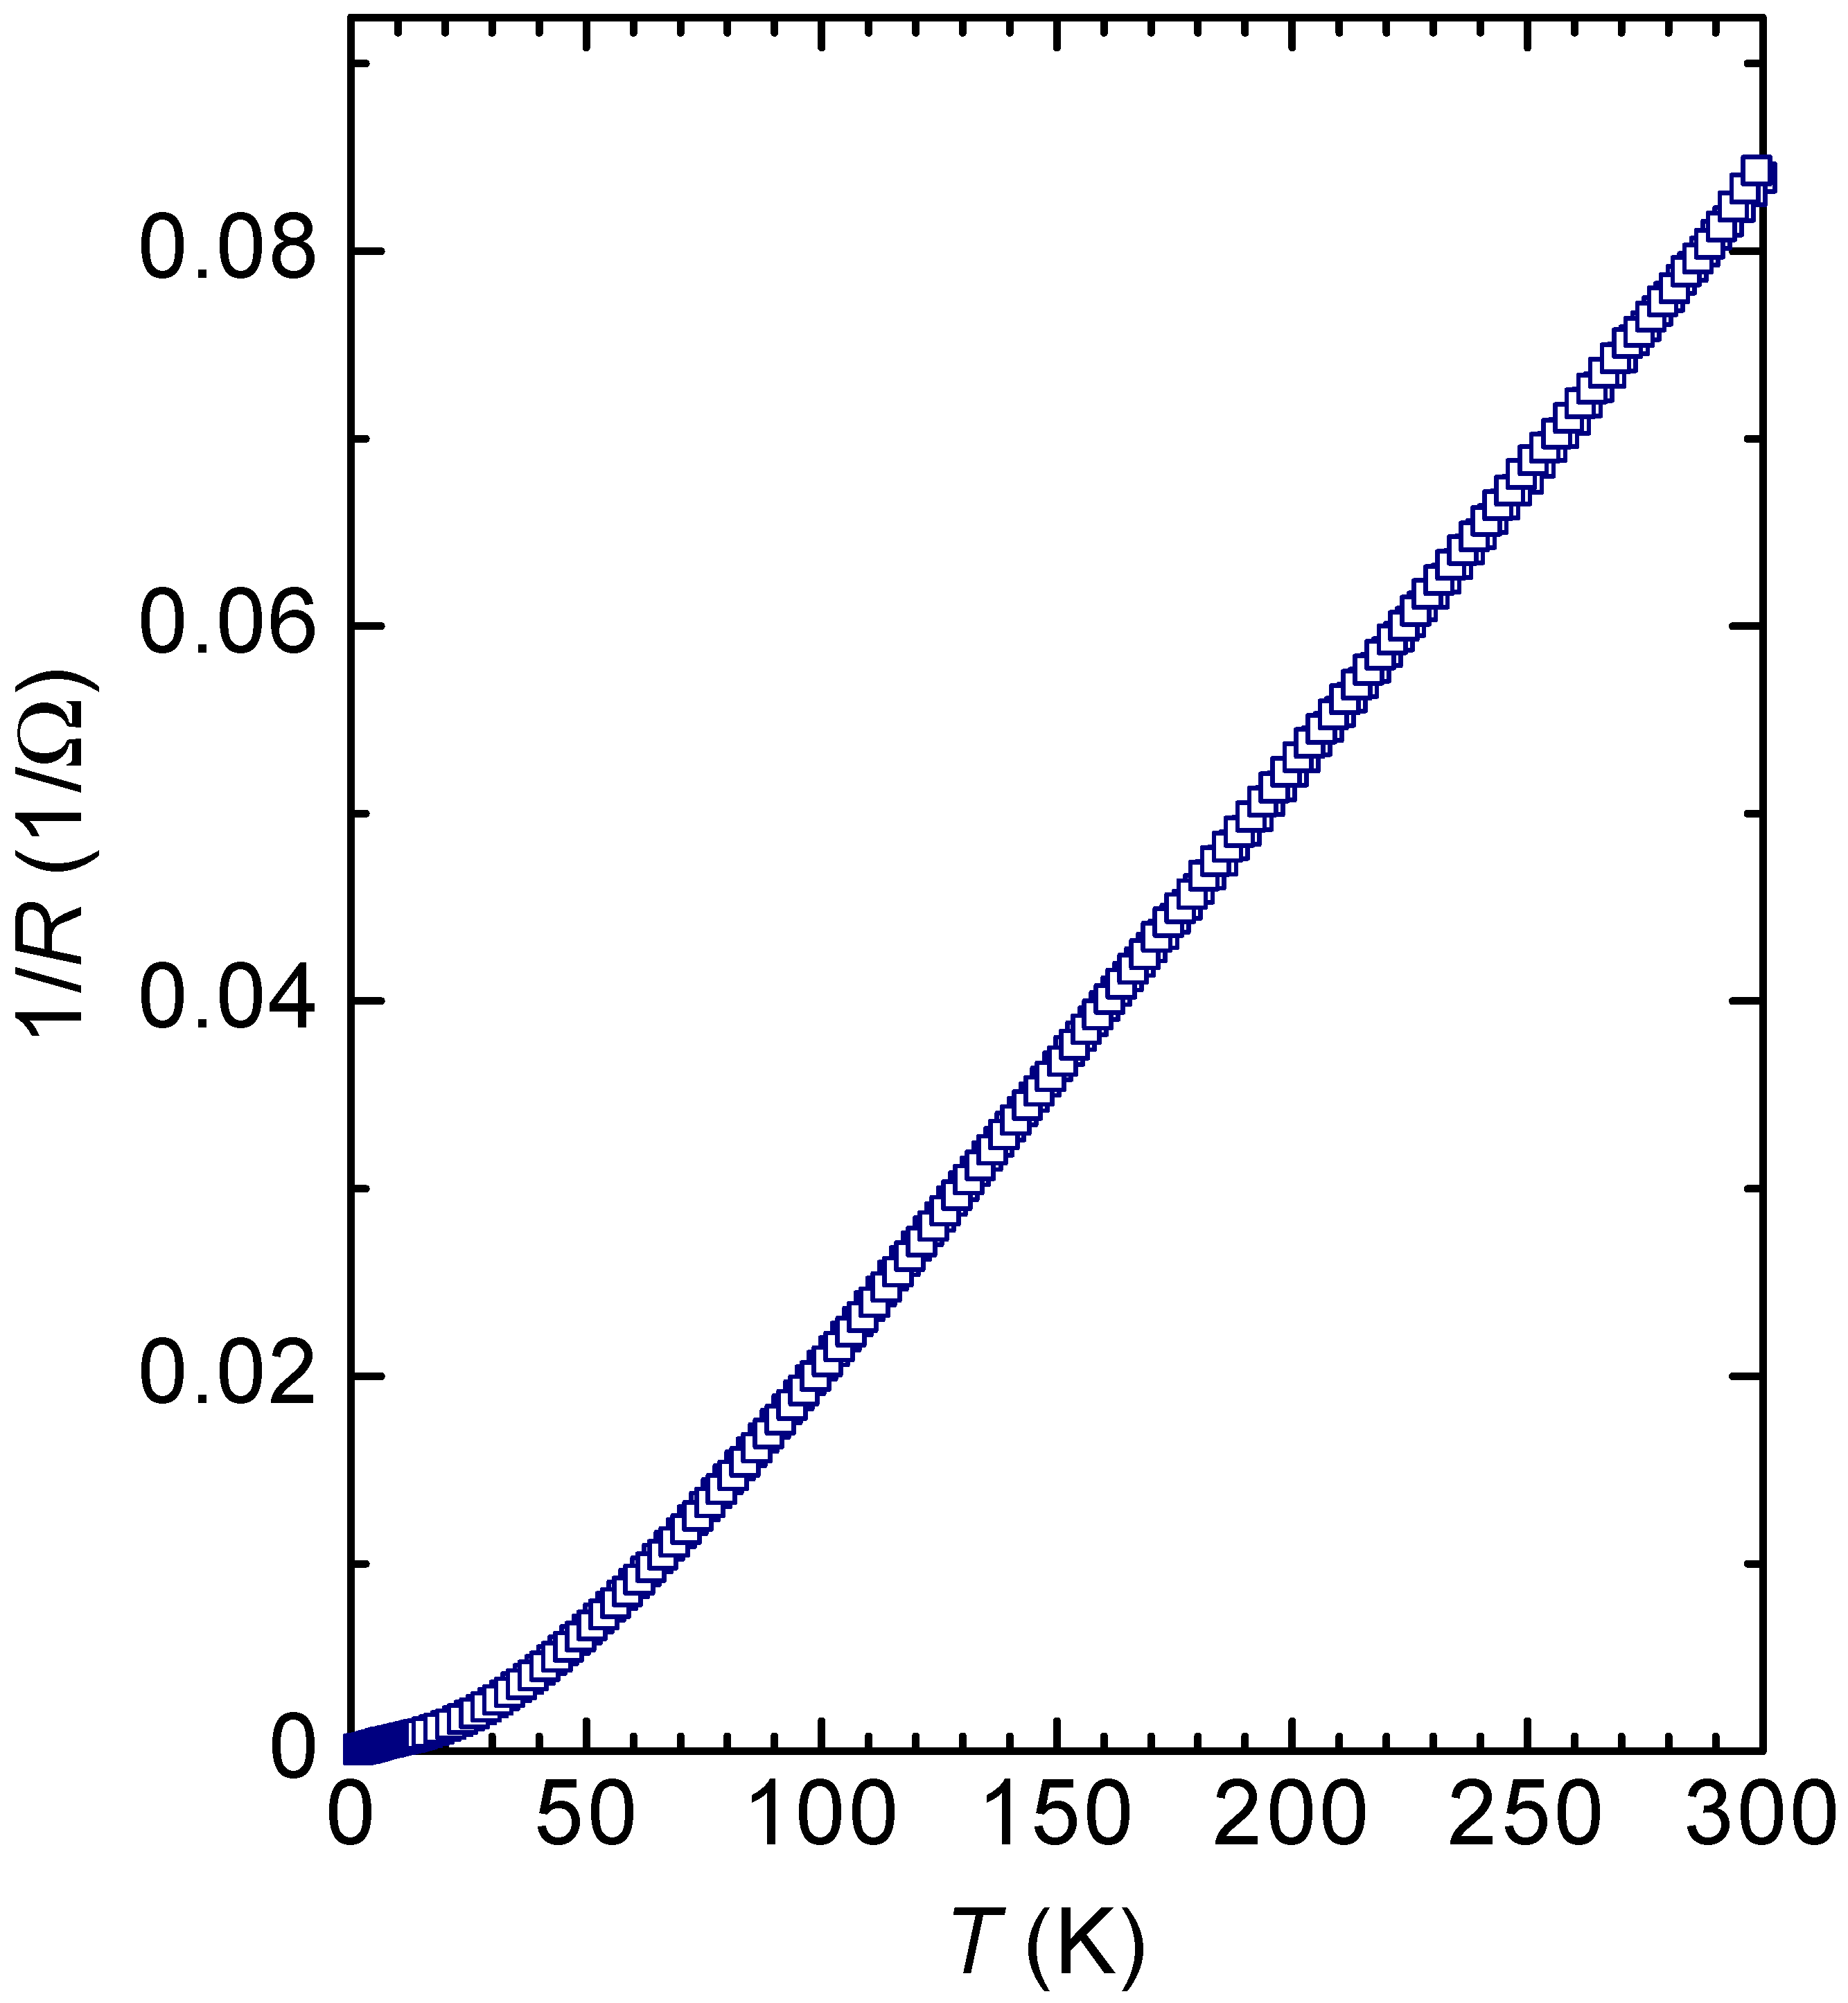
This result indicates the occurrence of the 3-dimensional variable range hopping (3D-VRH) of electrons in the V-CB(PANI) at low and high-temperature ranges [23,24]. Further, the 1/R value of V-CB(PANI) was proportional to T at >40 K as a semiconductor tendency (Figure 13). Low-temperature range in 1/R vs. T plots corresponds to the green dotted line in Figure 12b.
4.8. Applications for Synthesis of Poly(bithiophene)
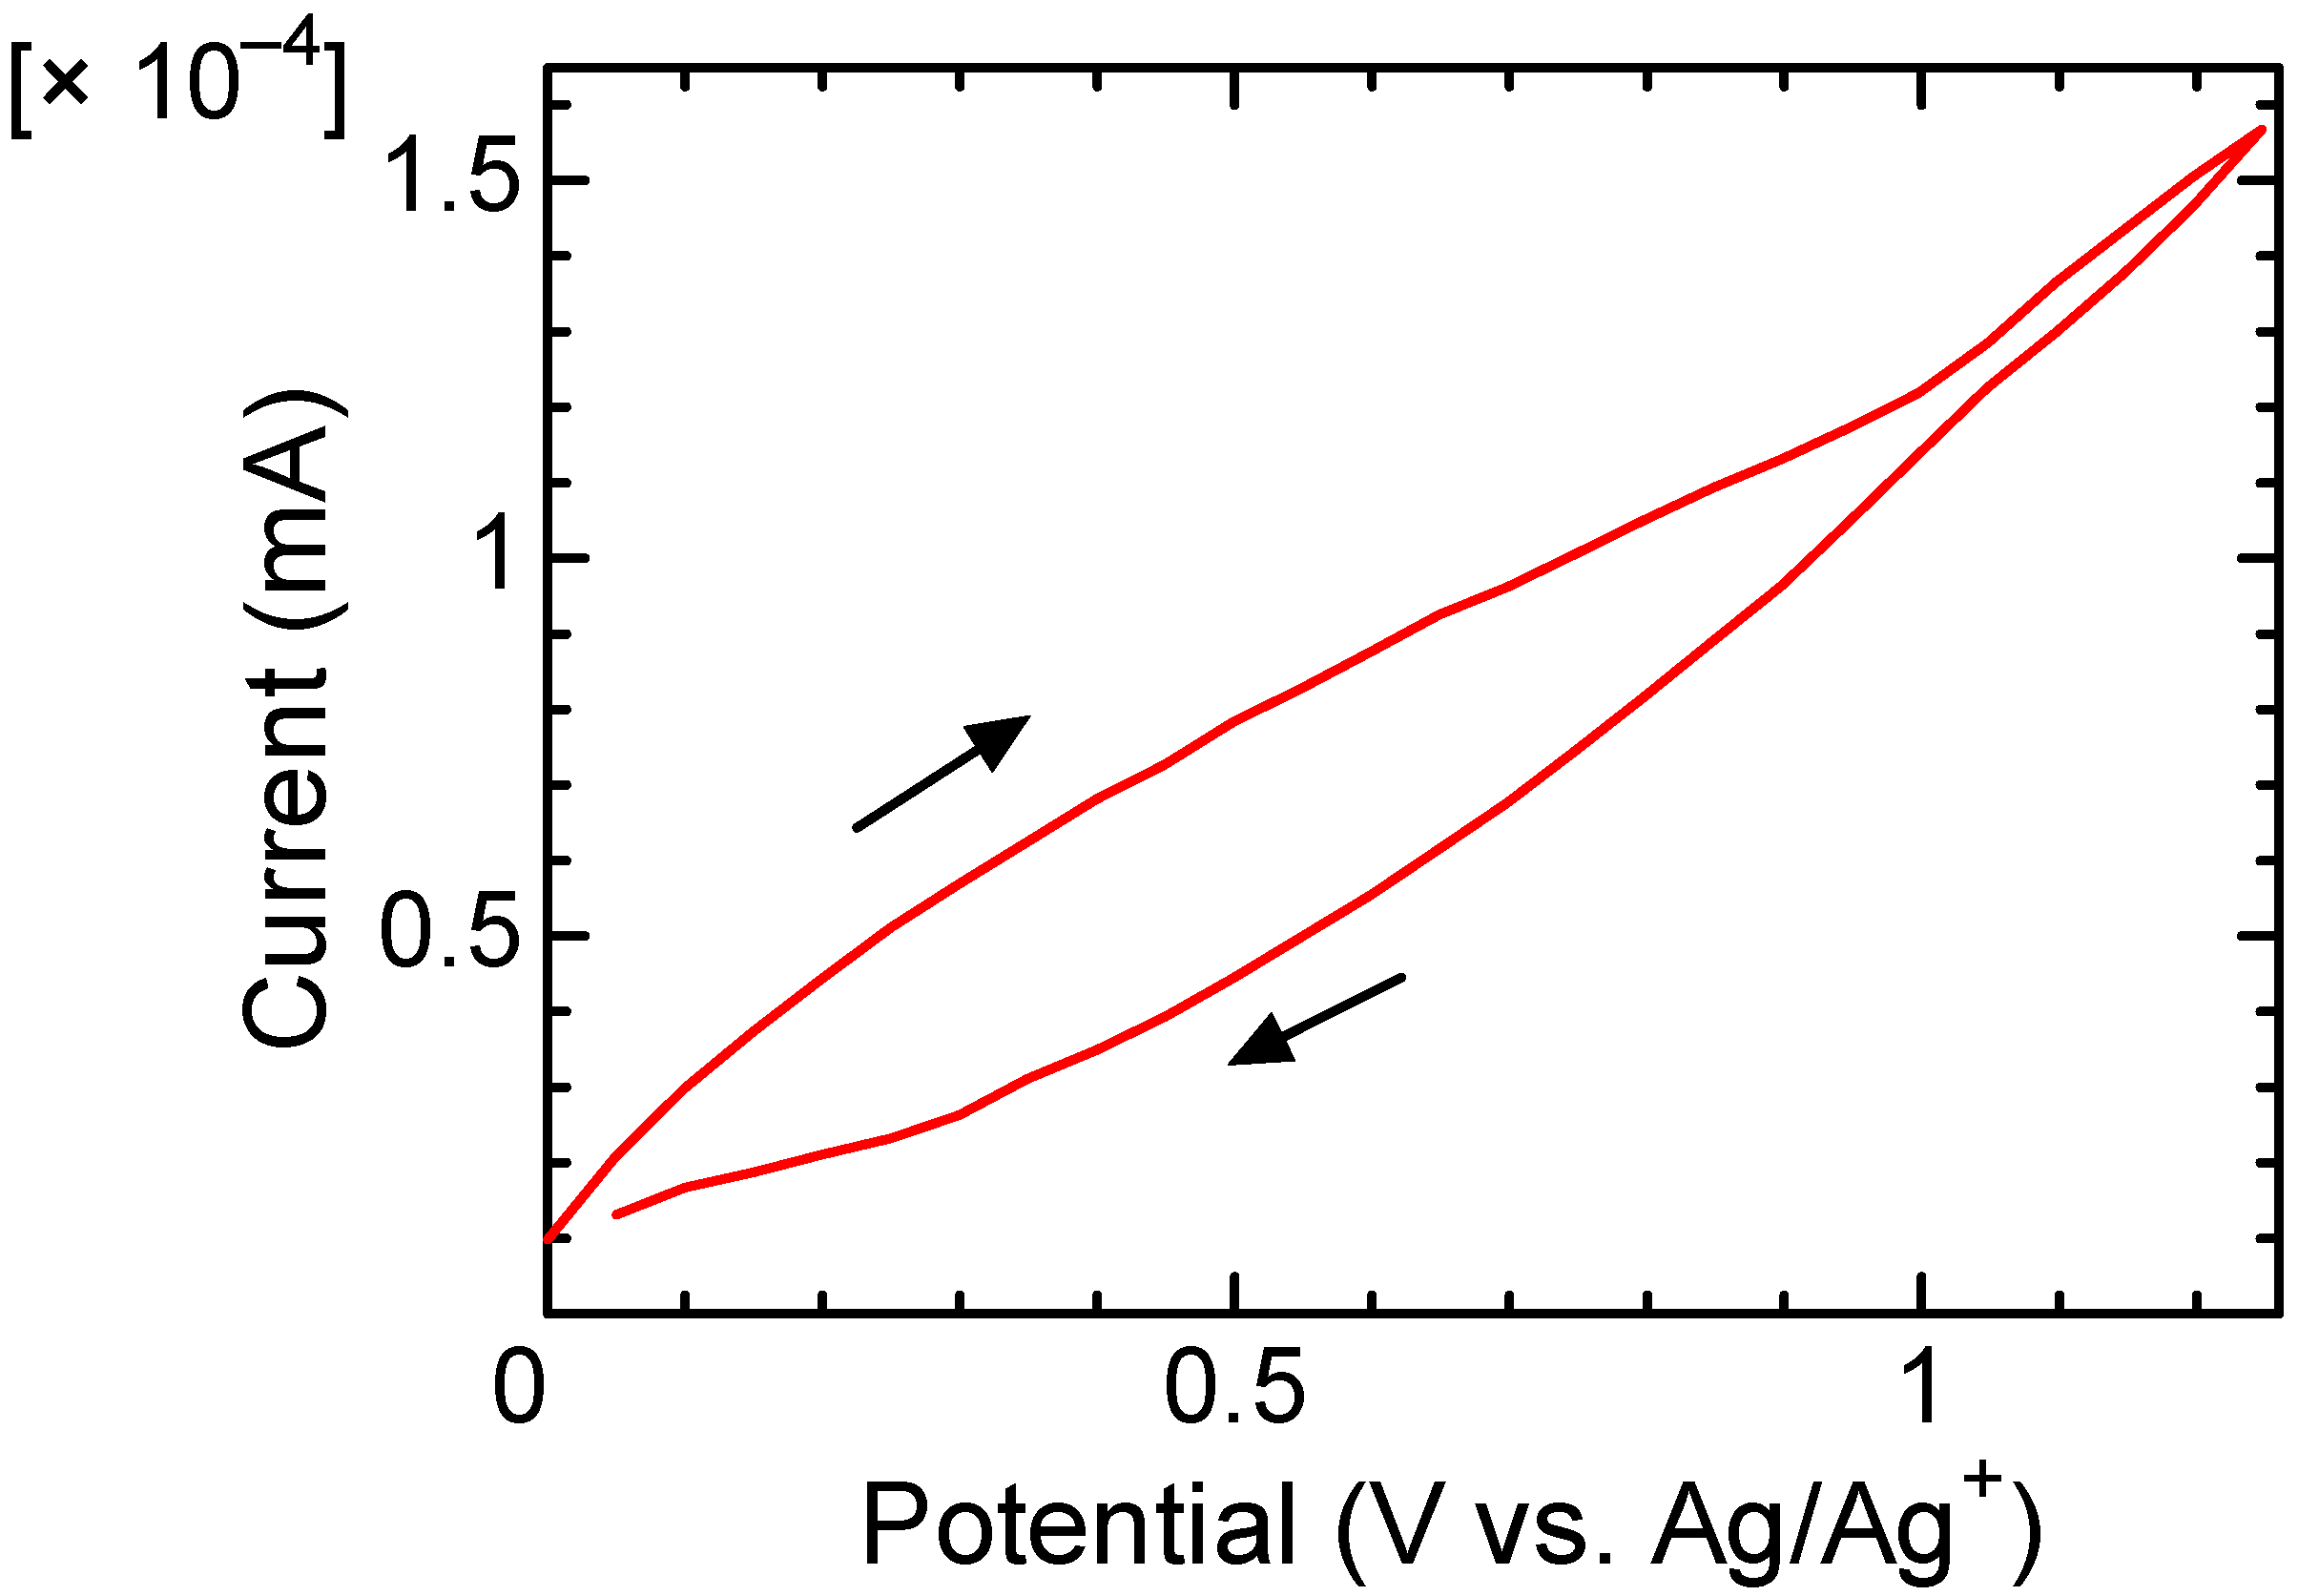
Polythiophene, a conductive polymer, can be synthesized using carbon as an electrode. The monomer then grows electrochemically by transferring the microstructure of the carbon surface. The resulting polymer is electrically active. This method afforded to create a C/conducting polymer composite in which the surface coloration can be electrochemically tuned by the electrochromism of the polymer. This could be further developed into new electrically conductive devices and sensors. Polymerization of bithiophene on the V-CB(PANI) was carried out with a cyclic voltammetry scan (vs. Ag/Ag+ reference electrode) for possible applications (Scheme 2). Figure 15 displayed the CV results during the polymerization of 0.01 M bithiophene in 0.1 M TBAP/acetonitrile solution. One scan for V-CB(PANI) yielded thin poly(bithiophene) layer on V-CB(PANI).
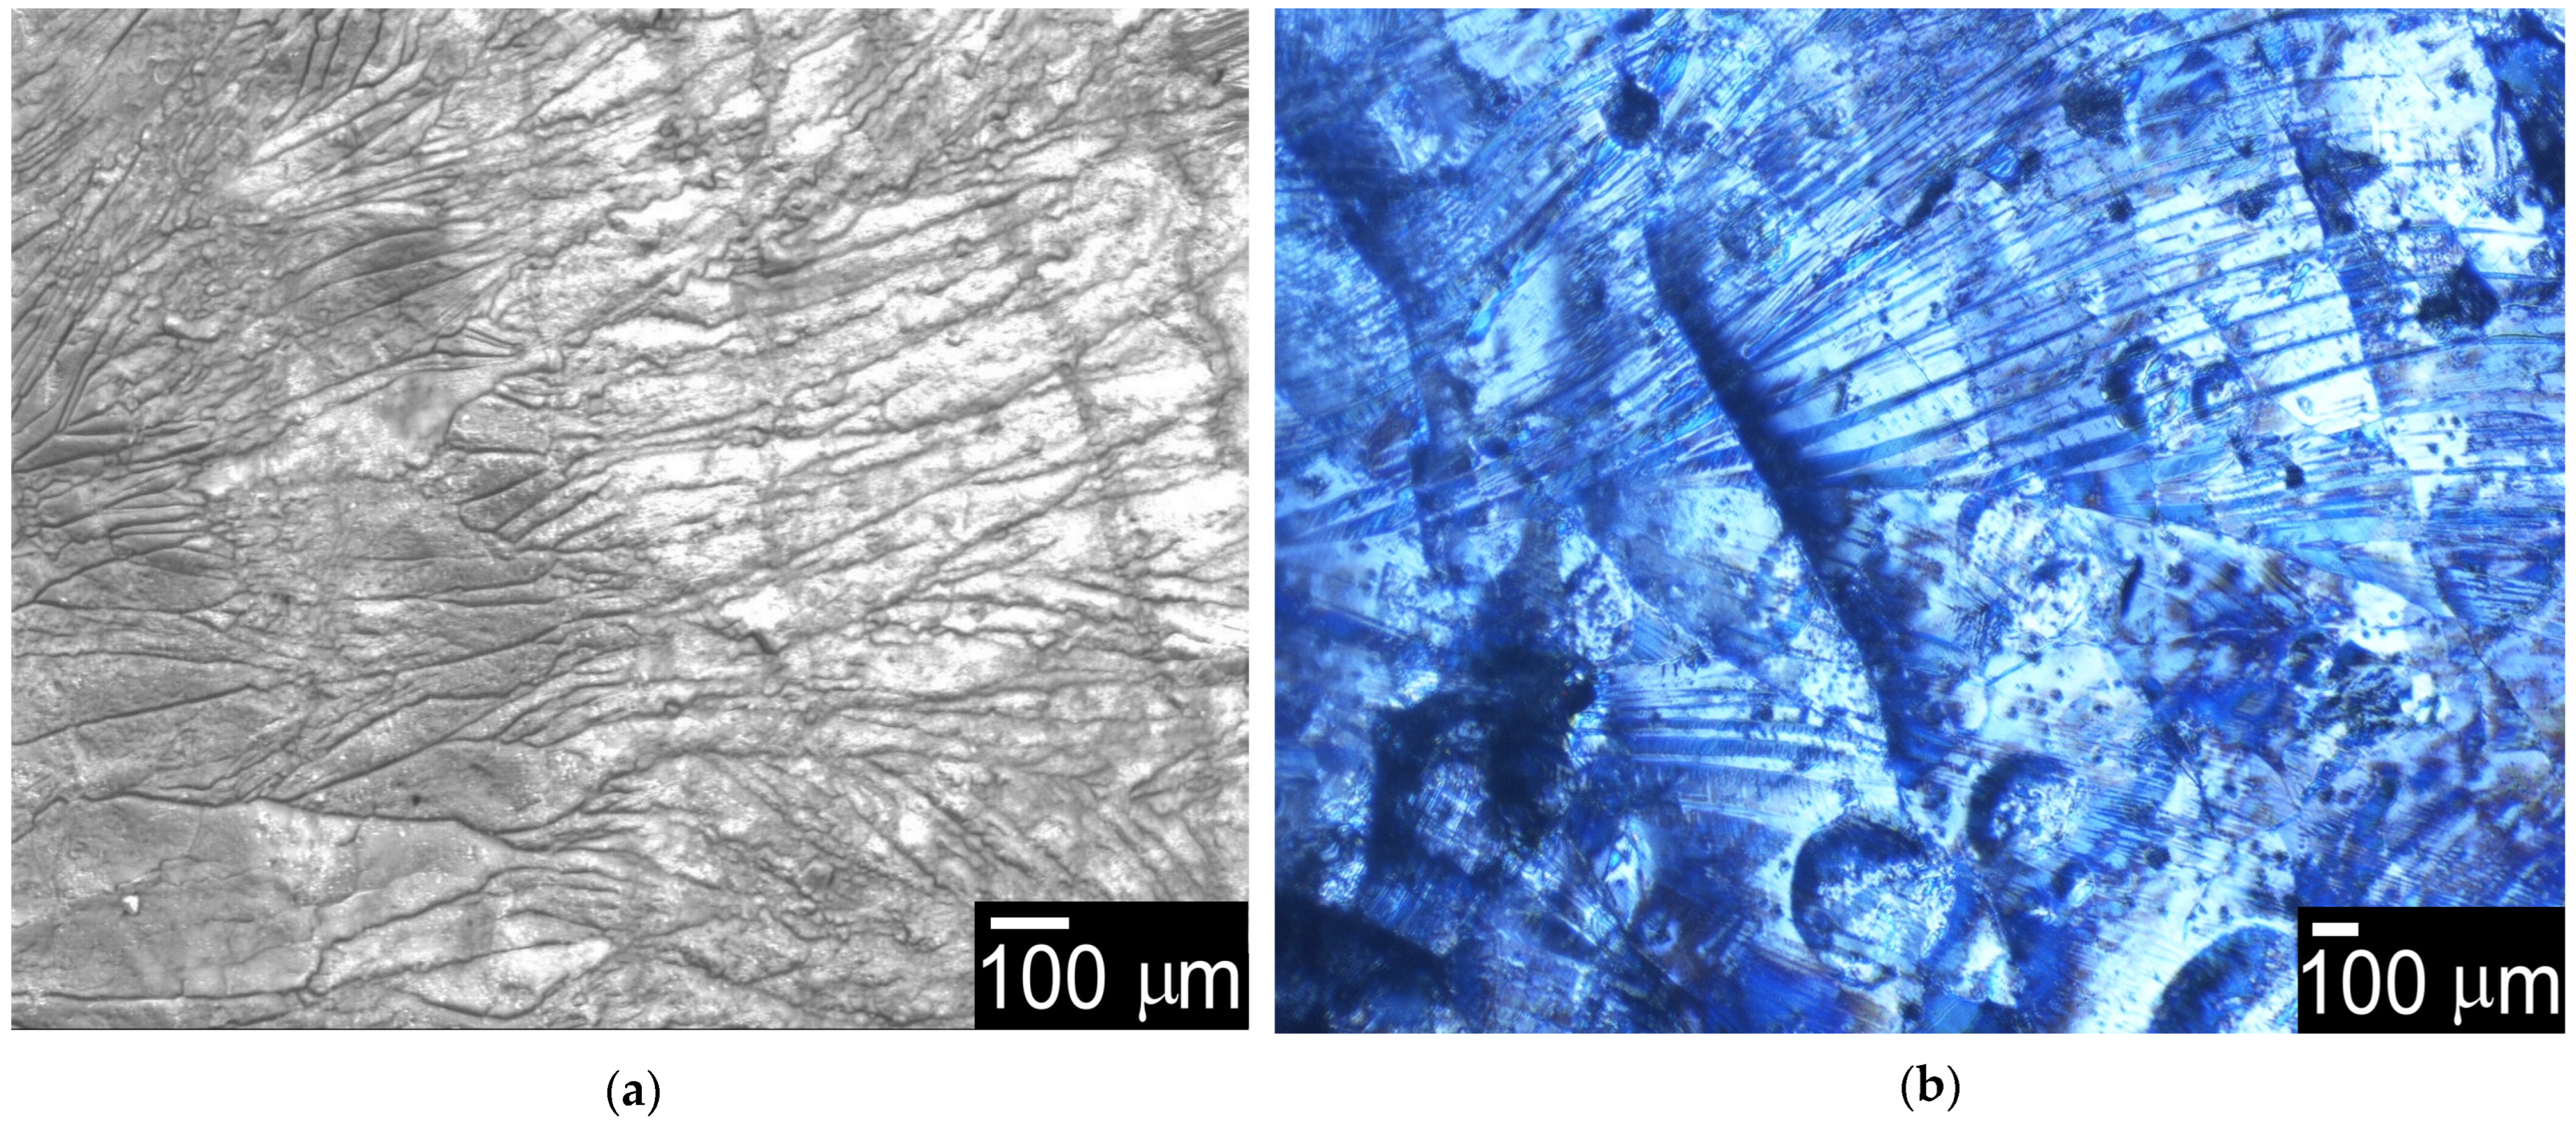
The SEM image of the resultant poly(bithiophene) on V-CB(PANI) is shown in Figure 16a. Fine lines on the surface were observed. Optical microscopy image for poly(bithiophene) on V-CB(PANI) displays further fine lines, indicating imprinting morphology from V-CB(PANI), as shown in Figure 16b. These results visually confirmed that V-CB(PANI) can function carbon electrode for the electrochemical polymerization and template.
5. Conclusions
Vapors from low-molecular weight PANI fractions underwent a carbonization process. The carbon having graphite structure showed visual metallic reflection. The V-CB(PANI) consisted of C, N, O, and S.
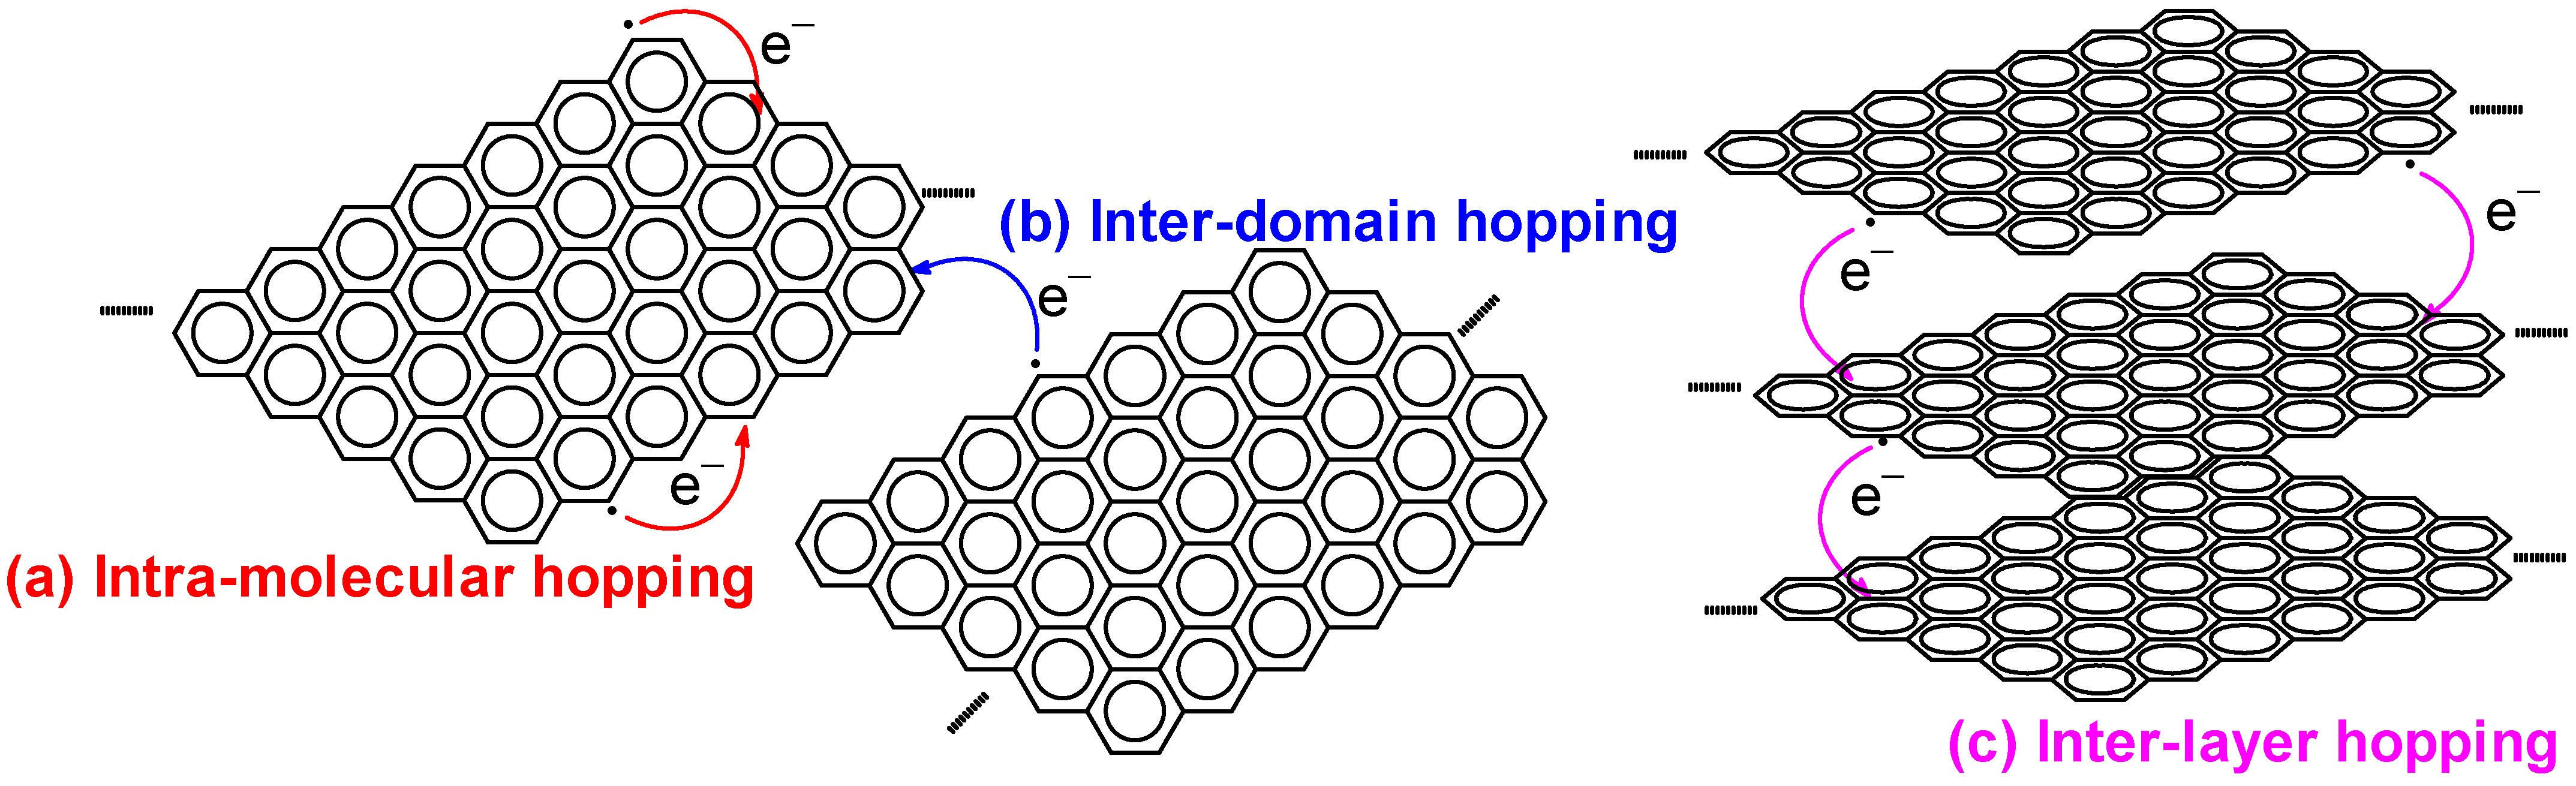
The graphite with layer structure can be produced in one process by carbonizing polyaniline oligomers that adhere as a vapor to the inner walls of the heating chamber. The ESR result showed the presence of unpaired electrons, suggesting the electrical conduction in the sample is due to the migration of paramagnetic unpaired electrons in addition to the delocalized electron movement in the graphite structure. The R vs. T measurement revealed that the sample exhibited Mott-type 3D-VRH. The VRH showed two different regions, one at low temperatures and the other at high temperatures. Intra-molecular conduction was dominant at the low-temperature range, while inter-domain and inter-layer electron hopping contributed to the electrical conduction in the high-temperature range. In this study, one-step synthesis of layered carbon from polyaniline oligomers, characterization of the structure, and evaluation of the electro-charge transportation were carried out. The resultant materials from the carbonization process may prove useful as a new form of solid carbon.
Funding
This research received no external funding.
Data Availability Statement
Not applicable.
Conflicts of Interest
The author declares no conflict of interest.
References
- Shinohara, H. My quest for nanocarbons. Mol. Sci. 2007, 1, A0008. [Google Scholar] [CrossRef] [Green Version]
- Schultz, H.P. Topological organic chemistry: Polyhedranes and prismanes. J. Org. Chem. 1965, 30, 1361–1364. [Google Scholar] [CrossRef]
- Nakamura, J.; Ito, J.; Natori, A. Structural bistability of the oxygen-adsorbed grapheme sheet. J. Phys. Conf. Ser. 2008, 100, 052019–052022. [Google Scholar]
- Kondo, T.; Honma, Y.; Oh, J.; Machida, J.; Nakamura, J. Edge states propagating from a defect of graphite: Scanning tunneling spectroscopy measurements. Phys. Rev. B 2010, 82, 153414. [Google Scholar] [CrossRef] [Green Version]
- Porfireva, A.; Begisheva, E.; Rogov, A.; Evtugyn, G. One-Step Electropolymerization of azure a and carbon nanomaterials for DNA-sensor assembling and doxorubicin biosensing. C 2022, 8, 75. [Google Scholar] [CrossRef]
- Aizawa, T.; Naka, H.; Nasu, T.; Nogami, Y. Packaging of vertically aligned graphite substrate by copper micro-rib structuring. C 2022, 8, 70. [Google Scholar] [CrossRef]
- Murata, H.; Nakajima, Y.; Saith, N.; Yashizawa, N.; Suemasu, T.; Toko, K. High-Electrical-conductivity multilayer graphene formed by layer exchange with controlled thickness and interlayer. Sci. Rep. 2019, 9, 4068. [Google Scholar]
- Martínez-Cartagena, M.E.; Bernal-Martínez, J.; Banda-Villanueva, A.; Lechuga-Islas, V.D.; Córdova, T.; Magaña, I.; Torres-Lubián, J.R.; Fernández-Tavizón, S.; Romero-García, J.; Rodríguez-Hernández, A.M.; et al. Easy synthesis of doped graphitic carbon nitride nanosheets as new material for enhanced DNA extraction from vegetal tissues using a simple and fast protocol. C 2022, 8, 68. [Google Scholar] [CrossRef]
- Wei, Y.; Hu, X.; Jiang, Q.; Sun, Z.; Wang, P.; Qiu, Y.; Liu, W. Influence of graphene oxide with different oxidation levels on the properties of epoxy composites. Compos. Sci. Technol. 2018, 161, 74–84. [Google Scholar] [CrossRef]
- Karbak, M.; Boujibar, O.; Lahmar, S.; Autret-Lambert, C.; Chafik, T.; Ghamouss, F. Chemical Production of graphene oxide with high surface energy for supercapacitor applications. C 2022, 8, 27. [Google Scholar] [CrossRef]
- Ashkinazi, E.; Fedorov, S.; Khomich, A.; Rogalin, V.; Bolshakov, A.; Sovyk, D.; Grigoriev, S.; Konov, V. Technology features of diamond coating deposition on a carbide tool. C 2022, 8, 77. [Google Scholar] [CrossRef]
- Gibot, P. Desensitization of nanothermites via the addition of highly electro-conductive carbon particles. C 2022, 8, 35. [Google Scholar] [CrossRef]
- Goto, H.; Yokoo, A.; Takeguchi, M.; Kawabata, K. Small carbon forms from polyaniline/metals. Int. Nat. J. Polym. Mater. Polym. Bio. Mater. 2013, 62, 426–432. [Google Scholar] [CrossRef]
- Goto, H.; Yokoo, A. Polyaniline Nanospheres synthesized in the presence of polyvinyl alcohol followed by preparation of carbon nanobeads structures. J. Disp. Sci. Tech. 2013, 34, 406–410. [Google Scholar] [CrossRef]
- Kijima, M.; Tanimoto, H.; Shirakawa, H.; Oya, A.; Liang, T.T.; Yamada, Y. Poly(phenylenebutadiynylene)s as a efficient carbonizing precursor. Carbon 2001, 39, 297–300. [Google Scholar] [CrossRef]
- Kane-Maguire, L.A.P.; MacDiarmid, A.G.; Norris, I.D.; Wallace, G.G.; Zheng, W. Facile preparation of optically active polyanilines via the in situ chemical oxidative polymerisation of aniline. Synth. Met. 1999, 106, 171–176. [Google Scholar] [CrossRef]
- Majidi, M.R.; Kane-Maguire, L.A.P.; Wallace, G.G. Enantioselective electropolymerization of aniline in the presence of (+)- or (−)-camphorsulfonate ion: A facile route to conducting polymers with preferred one-screw-sense helicity. Polymer 1994, 35, 3113–3115. [Google Scholar] [CrossRef]
- Majidi, M.R.; Kane-Maguire, L.A.P.; Wallace, G.G. Facile synthesis of optically active polyaniline and polytoluidine. Polymer 1996, 37, 359–362. [Google Scholar] [CrossRef]
- Li, W.; Wang, H.-L. Electrochemical Synthesis of Optically Active Polyaniline Films. Adv. Funct. Mater. 2005, 15, 1793–1798. [Google Scholar] [CrossRef]
- Komaba, K.; Goto, H. Ultrasonic helical coil electrochemical reactor for simultaneous electrolysis–sonification–electrochemical polymerization, and applications for pollen cleaning. Des. Mono. Poly. 2021, 24, 343–350. [Google Scholar] [CrossRef]
- Majidi, M.R.; Kane-Maguire, L.A.P.; Wallace, G.G. Chemical generation of optically active polyaniline via the doping of emeraldine base with (+)- or (−)-camphorsulfonic acid. Polymer 1995, 36, 3597–3599. [Google Scholar] [CrossRef]
- Merlen, A.; Buijnsters, J.G.; Pardanaud, C. A Guide to and review of the use of multiwavelength Raman spectroscopy for characterizing defective aromatic carbon solids: From graphene to amorphous carbons. Coatings 2017, 7, 153. [Google Scholar] [CrossRef]
- Mott, N.F.; Davis, E.A. Electronic Process in Non-Crystalline Materials, 2nd ed.; Oxford Univ. Press: Oxford, UK, 1971. [Google Scholar]
- Komaba, K.; Goto, H. Soliton excitations in liquid crystal polyacetylene. Mol. Cryst. Liq. Cryst. 2020, 703, 69–78. [Google Scholar] [CrossRef]
Scheme 1.
Synthesis of PANI-(+)-CSA via polymerization of aniline in the presence of (+)-camphor sulfonic acid, (+)-CSA; and APS, ammonium persulfate.
Scheme 1.
Synthesis of PANI-(+)-CSA via polymerization of aniline in the presence of (+)-camphor sulfonic acid, (+)-CSA; and APS, ammonium persulfate.

Figure 1.
Carbonization procedure of PANI-(+)-CSA in the gold furnace chamber. (a) Vapor deposition of low-molecular-weight PANI-(+)-CSA on the inside wall of the quartz cylinder in the gold furnace during the heating process; (b) Carbonization. V-CB(PANI), vapor-carbonized polyaniline; CB(PANI), carbonized polyaniline.

Figure 2.
Thermogravimetric (TG) analysis, derivative thermogravimetric analysis (DTG), and differential thermal analysis (DTA) analysis of PANI-(+)-CSA.
Figure 2.
Thermogravimetric (TG) analysis, derivative thermogravimetric analysis (DTG), and differential thermal analysis (DTA) analysis of PANI-(+)-CSA.

Figure 3.
Optical microscopy image of a carbonized material from PANI-(+)-CSA, abbreviated as V-CB(PANI).
Figure 3.
Optical microscopy image of a carbonized material from PANI-(+)-CSA, abbreviated as V-CB(PANI).

Figure 4.
Scanning electron microscopy (SEM) images of V-CB(PANI). (a) Surface, (b) layer structure (A, sample surface; B, inner layer); (c,d) Magnification of the inner layer; (e) Holes in the layer; (f) Cross-sectional orientation for layer observation of the sample.
Figure 4.
Scanning electron microscopy (SEM) images of V-CB(PANI). (a) Surface, (b) layer structure (A, sample surface; B, inner layer); (c,d) Magnification of the inner layer; (e) Holes in the layer; (f) Cross-sectional orientation for layer observation of the sample.


Figure 5.
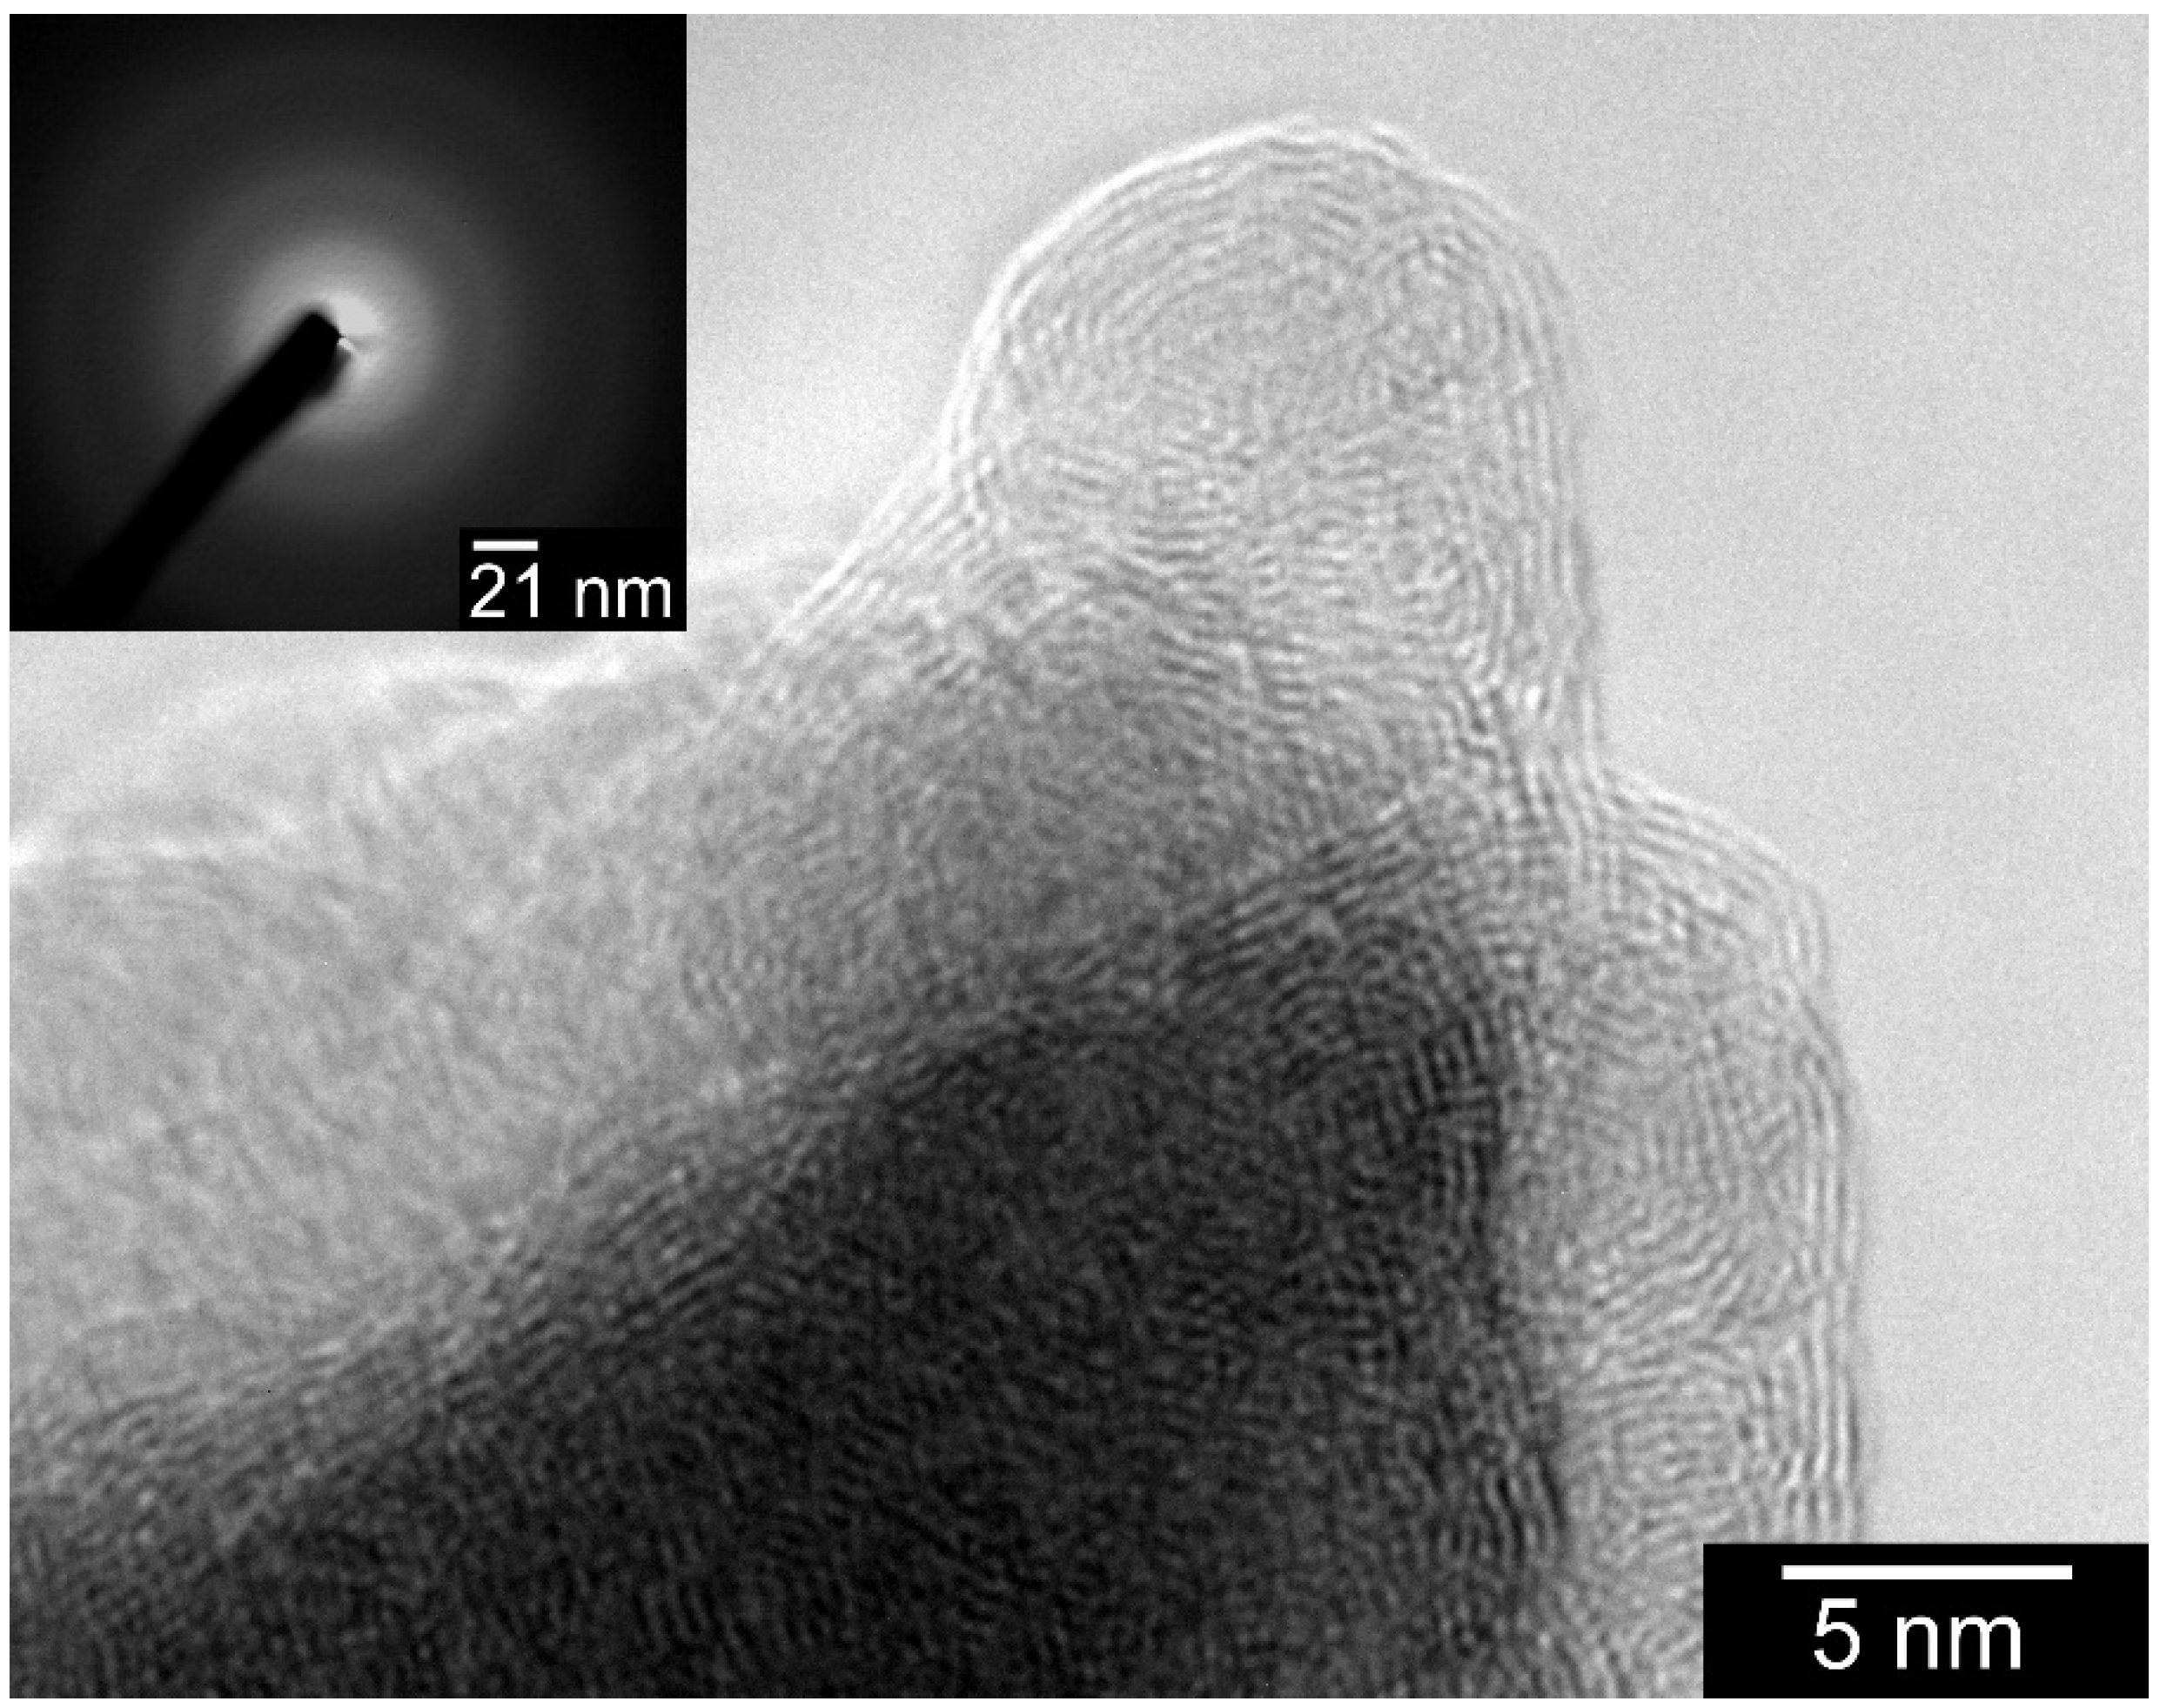
Transmission electron microscopy (TEM) image of V-CB(PANI). The inset panel shows the diffraction pattern of V-CB(PANI) obtained during the TEM observations.
Figure 5.
Transmission electron microscopy (TEM) image of V-CB(PANI). The inset panel shows the diffraction pattern of V-CB(PANI) obtained during the TEM observations.

Figure 6.
X-ray diffraction (XRD) profiles. (a) PANI-(+)-CSA; (b) CB(PANI); (c) V-CB(PANI).

Figure 7.
(a) Electron probe micro-analyzer (EPMA) measurement result of sulfur from V-CB(PANI); accelerating voltage = 3.0 kV; irradiation current = 3.94 × 10⁻⁹ Å, PETJ is the analyzing crystal, PET = pentaerythritol; (b) EPMA measurement result of nitrogen from V-CB(PANI), accelerating voltage = 15 kV, irradiation current = 2.355 × 10⁻⁷ Å, LDE2 is the analyzing crystal, LDE = artificial layered dispersive element crystals; (c) EPMA measurement results of carbon atoms; accelerating voltage = 3 kV; irradiation current = 3.949 × 10⁻⁹ Å, L-value is the distance from a spectrometer to the sample.

Figure 8.
X-ray photoelectron spectroscopy (XPS) result of V-CB(PANI). The itset panel shows he magnification of low energy region.
Figure 8.
X-ray photoelectron spectroscopy (XPS) result of V-CB(PANI). The itset panel shows he magnification of low energy region.

Figure 9.
Infrared absorption spectra of PANI-(+)-CSA, CB(PANI), and V-CB(PANI). (a) Absorptions at 500–4000 cm−1; (b) Magnification for the absorption of CB(PANI). (c) Magnification for the absorption of V-CB(PANI).
Figure 9.
Infrared absorption spectra of PANI-(+)-CSA, CB(PANI), and V-CB(PANI). (a) Absorptions at 500–4000 cm−1; (b) Magnification for the absorption of CB(PANI). (c) Magnification for the absorption of V-CB(PANI).

Figure 10.
Raman spectrum for V-CB(PANI).

Figure 11.
Electron spin resonance (ESR) result for m-CB(PANI).

Figure 12.
(a) Resistance (R) of V-CB(PANI) as a function of temperature (T); (b) R (lnR) of V-CB(PANI) as a function of T−1/4.
Figure 12.
(a) Resistance (R) of V-CB(PANI) as a function of temperature (T); (b) R (lnR) of V-CB(PANI) as a function of T−1/4.

Figure 13.
1/R (∝ σ) as a function of temperature, replotted from Figure 12a.
Figure 13.
1/R (∝ σ) as a function of temperature, replotted from Figure 12a.

Figure 14.
(a) Intra-molecular hopping; (b) Inter-domain hopping; (c) Inter-layer hopping in plausible structures.
Figure 14.
(a) Intra-molecular hopping; (b) Inter-domain hopping; (c) Inter-layer hopping in plausible structures.

Figure 15.
Electrochemical polymerization of bithiophene on V-CB(PANI) with the cyclic voltammetry method. Arrows indicate scanning directions.
Figure 15.
Electrochemical polymerization of bithiophene on V-CB(PANI) with the cyclic voltammetry method. Arrows indicate scanning directions.

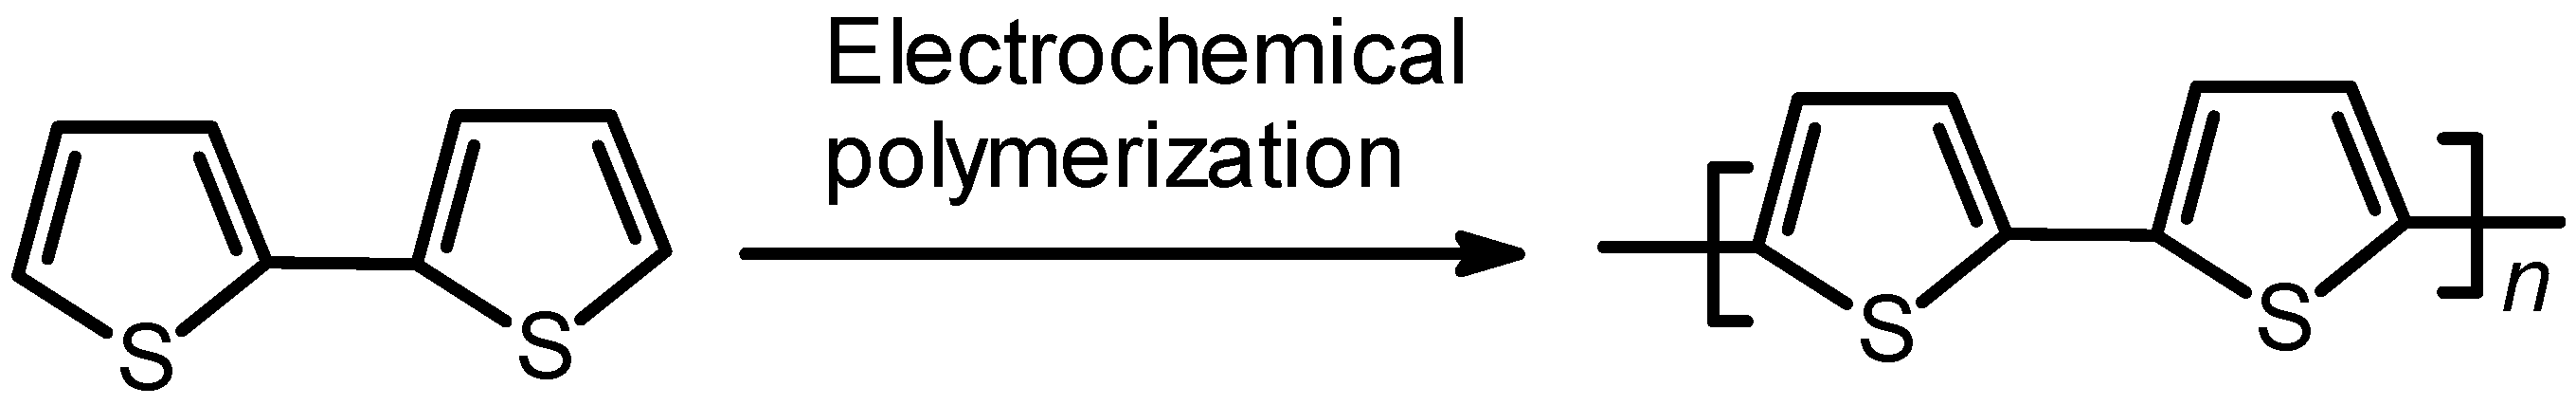
Scheme 2.
Electrochemical polymerization of bithiophene.

Figure 16.
(a) SEM image of poly(bithiophene) deposited on V-CB(PANI); (b) Optical microscopy image of poly(bithiophene) on V-CB(PANI).
Figure 16.
(a) SEM image of poly(bithiophene) deposited on V-CB(PANI); (b) Optical microscopy image of poly(bithiophene) on V-CB(PANI).

Disclaimer/Publisher’s Note: The statements, opinions and data contained in all publications are solely those of the individual author(s) and contributor(s) and not of MDPI and/or the editor(s). MDPI and/or the editor(s) disclaim responsibility for any injury to people or property resulting from any ideas, methods, instructions or products referred to in the content. |
© 2023 by the author. Licensee MDPI, Basel, Switzerland. This article is an open access article distributed under the terms and conditions of the Creative Commons Attribution (CC BY) license (https://creativecommons.org/licenses/by/4.0/).
Share and Cite
MDPI and ACS Style
Goto, H. 3D Variable Range Hopping Electrical Conduction of a Carbon from Polyaniline Vapor. C 2023, 9, 9. https://doi.org/10.3390/c9010009
AMA Style
Goto H. 3D Variable Range Hopping Electrical Conduction of a Carbon from Polyaniline Vapor. C. 2023; 9(1):9. https://doi.org/10.3390/c9010009
Chicago/Turabian StyleGoto, Hiromasa. 2023. "3D Variable Range Hopping Electrical Conduction of a Carbon from Polyaniline Vapor" C 9, no. 1: 9. https://doi.org/10.3390/c9010009
Note that from the first issue of 2016, this journal uses article numbers instead of page numbers. See further details here.