Article

Manganese Oxide Loaded Carbon Fiber for Solar Energy Harvesting and Oil Decomposition

1
Department of Mechanical Engineering, California State Polytechnic University Pomona, 3801 W Temple Avenue, Pomona, CA 91768, USA
2
Department of Electrical and Computer Engineering, California State Polytechnic University Pomona, 3801 W Temple Avenue, Pomona, CA 91768, USA
3
Department of Chemical and Biomolecular Engineering, University of California Los Angeles, 405 Hilgard Ave, Los Angeles, CA 90095, USA
4
Nanoscience Instruments & Nanoscience Analytical, Inc., 10008 S. 51st Street Suite 110, Phoenix, AZ 85044, USA
*
Author to whom correspondence should be addressed.
Submission received: 30 January 2023 / Revised: 19 February 2023 / Accepted: 22 February 2023 / Published: 26 February 2023
(This article belongs to the Special Issue Porous Carbon-Based Electrodes)

Abstract

:
In this work, a manganese oxide electrode, containing carbon nanofiber composites (MnO2/CNF), has been made through electrospinning, oxidization, and partial carbonization high-temperature treatment. Scanning electron microscopy (SEM) was used to observe the morphology of the nanofiber and analyze the composition of the fiber. The fiber size range and element distribution were determined. The oxide nanoparticles were modeled as electrorheological suspensions in the polyacrylonitrile polymer solution during electrospinning. The dielectrophoretic behavior of the particles subjected to non-uniform electric fields were analyzed and the motion of the oxide particles under the actions from fluctuating electric fields was investigated to explain the sporadic distribution of nanoparticles within the composite nanofibers. A photoactive anode was made from the composite nanofiber and the decomposition of spilled oil was performed under sunlight illumination. It was observed that the manganese oxide containing carbon nanofiber composite electrode can generate electricity and clean the spilled oil under sunlight. Both energy conversion and environment cleaning concepts were demonstrated.

1. Introduction

Manganese oxides are versatile transition metal oxides due to the multiple valence values of manganese. Depending on processing conditions, such as temperature, time, and atmosphere or oxygen partial pressure, manganese oxides may take the forms of MnO, Mn2O3, Mn3O4, Mn5O8, and MnO2 [1]. Important applications were reported on various manganese oxides. All forms of manganese oxides are good catalysts. Mn2O3 is an active combustion catalyst for propene and propane oxidation [2]. Mn3O4 serves as the catalyst for methane oxidation [3]. In addition to being a catalyst, MnO2 has been studied widely as an electrode material for supercapacitors because of its high electrochemical performance and low cost. It is not poisonous. In addition, the preparation of MnO2 is relatively easy. For example, the sol-gel method was used for producing MnO2 through the reduction of NaMnO4 with fumaric acid [4]. A hydrothermal synthesis approach was also used to synthesize manganese oxide (MnO2) nanorod for supercapacitor electrode fabrication [5]. The capacitance values were in the range of 72 to 168 F/g. Toupin, Brousse, and Bélanger [6] investigated the charge storage mechanism of MnO2 electrodes in aqueous electrolytes. It has been found that only a very thin layer of MnO2 is involved in the charge storage process.
Manganese oxide-containing composite nanomaterials are electroactive as well. They have been studied for energy storage [7,8,9,10,11,12]. In the work performed by Lin et al. [13], depositing manganese oxides including MnO, Mn2O3, and Mn3O4 at the surface of carbon nanofiber to make composite anode materials for rechargeable lithium-ion battery application was shown. These manganese oxide nanoparticles were directly electrodeposited onto carbon nanofibers to make the lithium battery anode. The composite anode showed enhanced electronic conductivity and reduced volume change during repeated lithium insertion/extraction. Since multivalent redox reactions can occur at the thin surface layer of manganese oxides to provide high reaction rates, supercapacitors can be made from manganese oxide-coated carbon nanofibers. As shown in [14], the manganese oxide MnO2 was deposited vertically aligned carbon nanofiber array to make supercapacitors. A 4-μm tall brush-like carbon structure was obtained by plasma-enhanced chemical vapor deposition of carbon on a conductive silicon substrate. The open space between the carbon nanofiber was around 300 nm. MnO2 film with a thickness of 15 nm was electrodeposited on the carbon nanofiber to form a three-dimensional structure that allows fast electrolyte access and a high redox reaction rate. Such coaxially coated hybrid supercapacitors reach a high value of super capacitance of 365 F/g. Barakat et al. [15] made manganese monoxide (MnO) in nanofiber form. Electrospun manganese acetate/poly(vinyl alcohol) nanofiber mats were hydrothermally treated in water steam at 400 °C for 3 h to eliminate the polymer and reduced the manganese acetate to manganese monoxide. After the polymer was decomposed into CO and H2, pure MnO nanofibers with good crystallinity were obtained.
Incorporating other metal oxides and manganese oxides into carbon fibers to improve the electrochemical properties was illustrated [16,17]. Electrospinning freestanding carbon nanofibers with bimetallic manganese-iron oxide were performed for flexible supercapacitor fabrication [16]. Polyacrylonitrile was used as the carbon source. To generate micropores in the carbon nanofibers, polymethyl methacrylate was used as the sacrificial template. In the literature [17], flexible, lightweight, and freestanding zinc-manganese oxide carbon nanofibers were made for application in portable electronic devices. The bending angle test confirmed the mechanical durability of the freestanding carbon nanofiber electrodes. The capacitance retention was 92% after 10,000 galvanostatic charge-discharge cycles.
Recent research on manganese oxide containing carbon nanofiber composites focuses on the applications for rechargeable lithium, zinc-air, and sodium batteries [18,19,20,21,22]. Rare research tasks can be found on using manganese oxides for environmental protection. Among the limited existing work, Elghamry et al. [23] investigated the bimetallic nickel/manganese phosphate-carbon nanofiber for the oxidation of formaldehyde in an alkaline medium. Poudel et al. [24] reported the research on interface engineering of MnFe2O3 on three-dimensional carbon nanofibers for the efficient adsorption of Cr(VI), Pb(II), and As(III) ions. A recyclable biomass carbon@ SiO2@ MnO2 aerogel with hierarchical structures for fast and selective oil-water separation was made [25]. However, there is no report on the biophotofuel cell using manganese oxide-carbon nanofiber as the photoactive electrode.
It is the objective of this work to make a biophoton electrode using manganese oxide-containing carbon nanofiber for energy harvesting from sunlight and decomposing the spilled oil simultaneously. As known, producing clean energy from biowaste and wastewater under the irradiation of solar rays and purifying the water for reuse generate significant research interests [26]. To build systems with such multiple functionalities, a new sustainable design strategy is needed. Nanostructured biophotofuel cell systems have been introduced for both energy generation and environment cleaning [27]. The major effort is on designing and fabricating novel biophotofuel cells consisting of nanocomposite electrodes as the photoactive anodes for biomass decomposition, and low hydrogen overpotential metals such as Pt, Pd, and Ru as cathodes for hydrogen generation [28]. The uniqueness of the system lies in the multiple functions of the fuel cells. It can generate electricity and produce hydrogen from bio-hazardous substances under sunshine [29]. Meanwhile, noxious gases such as ammonia released from biowaste can be decomposed at the photosensitive anodes and pure water can be generated for reuse at the cathodic zone [30]. In order to prepare such key components in the systems which allow electron-hole pair separation under irradiation, and decompose biomass, semiconducting substances such as pure and doped-TiO2 nanotubes were made into photosensitive electrodes with regularly aligned nanopores [31]. Due to the nanoporous array structure of the newly developed electrodes, high surface areas can be obtained. However, the manganese oxide containing carbon nanofiber photochemical fuel cells have not been studied. It is meaningful to test and validate the electricity and hydrogen generation from biomass under solar rays, noxious gas decomposition, and clean water regeneration using the manganese oxide containing carbon nanofiber electrode.
The scope of this paper is as follows. A novel manganese oxide containing carbon nanofiber electrode (MnO2/CNF) was prepared via electrospinning and oxidation followed by high-temperature treatment. Scanning electron microscopy was used to observe the morphology of the nanofiber and analyze the composition of the fiber. The fiber size range and element distribution were determined. A photoactive anode was made from the composite nanofiber and the decomposition of spilled oil was performed under sunlight illumination. Open circuit voltage measurement results indicate that the manganese oxide containing carbon nanofiber composite electrode can generate electricity and clean the spilled oil under sunlight. Both energy conversion and environment cleaning concepts were discussed.

2. Materials and Methods

2.1. Materials

There are several chemicals used for this experiment. Polyacrylonitrile (PAN) polymer with a molecular weight of 150,000 g/mol and chemical formula of (C3H3N)n was obtained from Scientific Polymer, Ontario, NY, USA. Dimethylformamide (DMF) with the formula C3H7NO was purchased from Alfa Aesar Thermo Scientific Chemicals, Ward Hill, Massachusetts, United States. The 10 mL polypropylene syringes with rubber plunger (BD Luer-Lok, Franklin Lakes, NJ) and Gauge 18 stainless steel blunt needles (0.84 mm ID × 100 mm in length) were brought from McMaster-Carr Supply Company, Elmhurst, IL, USA. Pure MnO2 powder with a nominal size of 50 nm and purity of 99.999% (Batch Number 20221006) was ordered from Yingtai Metal Materials Co, P.R. China through AliExpress.com. Olive oil (refined olive oil and 15% extra virgin olive oil with the Kirkland Signature brand) was purchased from Costco Wholesale, San Dimas, CA, USA.

2.2. Instruments

The electrospinning system was built using a Spellman Power Supply (Hauppauge, NY, USA) model CZE1000R as the high voltage direct current (DC) power source and a Fusion 200 modular two-channel infusion and withdrawal syringe pump made by Chemyx Inc., Stafford, TX, United States. An OTF-1200X-S-NT-LD compact split tube furnace with a single heating zone and programmable controller was purchased from MTI Corporation of Richmond, CA, USA for heat treatment on nanofiber samples. A model CHI440C Electrochemical Analyzer was purchased from CH Instruments, Austin, TX, USA. For nanofiber morphology observation and elemental analysis, two desktop scanning electron microscopes were used: Phenom XL Desktop SEM with FiberMetric software and Phenom Pharos G2 Desktop FEG-SEM with an integrated EDS and FiberMetric software from Thermo Fisher Scientific Corporation. A Luxor sputter coater supplied by Nanoscience Instruments Inc. was used for coating platinum thin film on composite nanofiber specimens.

2.3. Composite Nanofiber Processing

The electrospinning solution was made by mixing polyacrylonitrile (PAN) polymer, dimethylformamide (DMF), and MnO2 nanoparticle to form the polymer solution with nanoparticle suspension. In a typical experiment, a 10 wt.% polyacrylonitrile (PAN) polymer in dimethylformamide (DMF) solution was made by dissolving 0.500 g PAN polymer powder into 5.00 mL DMF at 60 degrees Celsius in a 25 mL glass beaker. Then, 0.100 g MnO2 nanoparticle was added into the beaker under continuous stirring. The selection of a 10 wt% manganese oxide content was based on the previously reported sol-gel spinning work on manganese oxide particles containing nanofiber as an energy storage electrode. It was demonstrated by Wang et al. [7] that a concentration of 15 wt% of manganese oxide precursor (manganese acetylacetonate) was an optimized amount because too high concentrations of manganese acetylacetonate led to very low mechanical properties of the particle containing nanofibers. To achieve the 10 wt.% MnO2, we added slightly more than 0.100 g, usually around 0.120 g to compensate for any loss during handling and electrospinning. After that, the solution was transferred into a 10 mL polypropylene syringe for electrospinning. The gauge 18 stainless steel needle was used as the injector. The DC voltage is ±15.0 kV. An aluminum collector roller with a diameter of 7.5 cm was grounded. The closest distance between the tip of the needle and the aluminum roller was about 10 cm. The pumping rate of the electrospinning was kept at 0.02 mL/min. Temperature and relative humidity during sample processing was monitored and it was maintained at 22 °C and 62 %, respectively. After electrospinning for 20 min, the nanofiber film in greyish color was obtained.

2.4. Oxidization, Stabilization, and Carbonization

The electrospun nanofiber film was dried and oxidized in an oven for 10 min at 280 degrees Celsius. The greyish color of the film changed to dark brown which is due to the oxidation and stabilization of the polyacrylonitrile in the nanofiber film.
The carbonized sample was made by partially carbonizing the previously produced nanofiber film (the manganese oxide-containing, pre-oxidized sample). The electrospun nanofiber was put into a glass tube with a 50 mm diameter. The glass tube with the nanofiber specimen was inserted into the OTF-1200X-S-NT-LD compact split tube furnace. Ar gas was purged into the quartz tube chamber to push air out. Then the temperature was increased to 600 degrees Celsius at a rate of 5 °C/min. The sample was kept at this treatment temperature for two hours to allow the nanofiber partially carbonized. After naturally cooling down to room temperature, the specimen was taken out of the furnace. The color of the nanofiber film changed from brown to black. This carbonized nanofiber film was cut into multiple specimens for an oil decomposition test and electron microscopic analysis.

2.5. Morphology Observation and Elemental Analysis

Electrospun samples were placed on conductive carbon tape (TED Pella, Redding, CA) and adhered to aluminum SEM sample mounts (Ted Pella, Redding, CA, USA). The Luxor sputter coater was used for coating platinum (Pt) thin film with a thickness of 3 nm in Ar plasma on composite nanofiber specimens prior to microstructure imaging. The Pt film increases the conductivity of the nanofiber and provides protection for the fiber from electron beam damage. The Pt coating was obtained in the Luxor sputter coater at a pressure of 10 Pa. The Phenom Pharos FEG-Desktop SEM was used for morphology observation, fiber size measurement, elemental analysis, and high-resolution images. Accelerated voltages ranged from 10 kV to 15 kV and magnifications ranged from 5000x to 100,000x. Fiber diameter was characterized using the FiberMetric software package (v2.3.4.0) with over 100 readings at a magnification of 10,000x.

2.6. Spilled Oil Decomposition Test under Sunlight

The partially carbonized nanofiber was peeled off from the aluminum foil substrate. The obtained freestanding composite nanofiber film was used as photosensitive anode material to build a biophoton fuel cell. A two-electrode fuel cell consisting of the composite nanofiber anode and a platinum wire cathode was made for the spilled oil decomposition and electricity generation under sunlight at the ambient temperature of 20 °C. The spilled oil decomposition and electricity generation were monitored by measuring the open circuit voltages of the fuel cell using the CHI440C Electrochemical Analyzer. In brief, an equal amount of olive oil and seawater were mixed to get an emulsion with a 1:1 oil-to-water mass ratio to simulate the spilled oil in an ocean environment. This mixed oil-water emulsion was poured into a plastic compartment and used as the electrolyte for the fuel cell. The distance between the two electrodes, Pt cathode, and composite nanofiber anode, was kept at 40 mm. Natural sunlight was allowed to shine on the photoanode first to set alight “On” state for 25 s. Then, the sunlight was blocked to generate an “Off” state for 25 s. The open circuit voltage, i.e., the voltage across the anode and cathode of the fuel cell was recorded by the CHI440C Electrochemical Analyzer. The open circuit voltage was measured as a function of time. The dynamic response data when the sunlight was “On” for 25 s and “Off” for 25 s were obtained to evaluate the oil decomposition behavior. For each data acquisition experiment, we repeated it at least five times to take the average values.

3. Results and Discussion

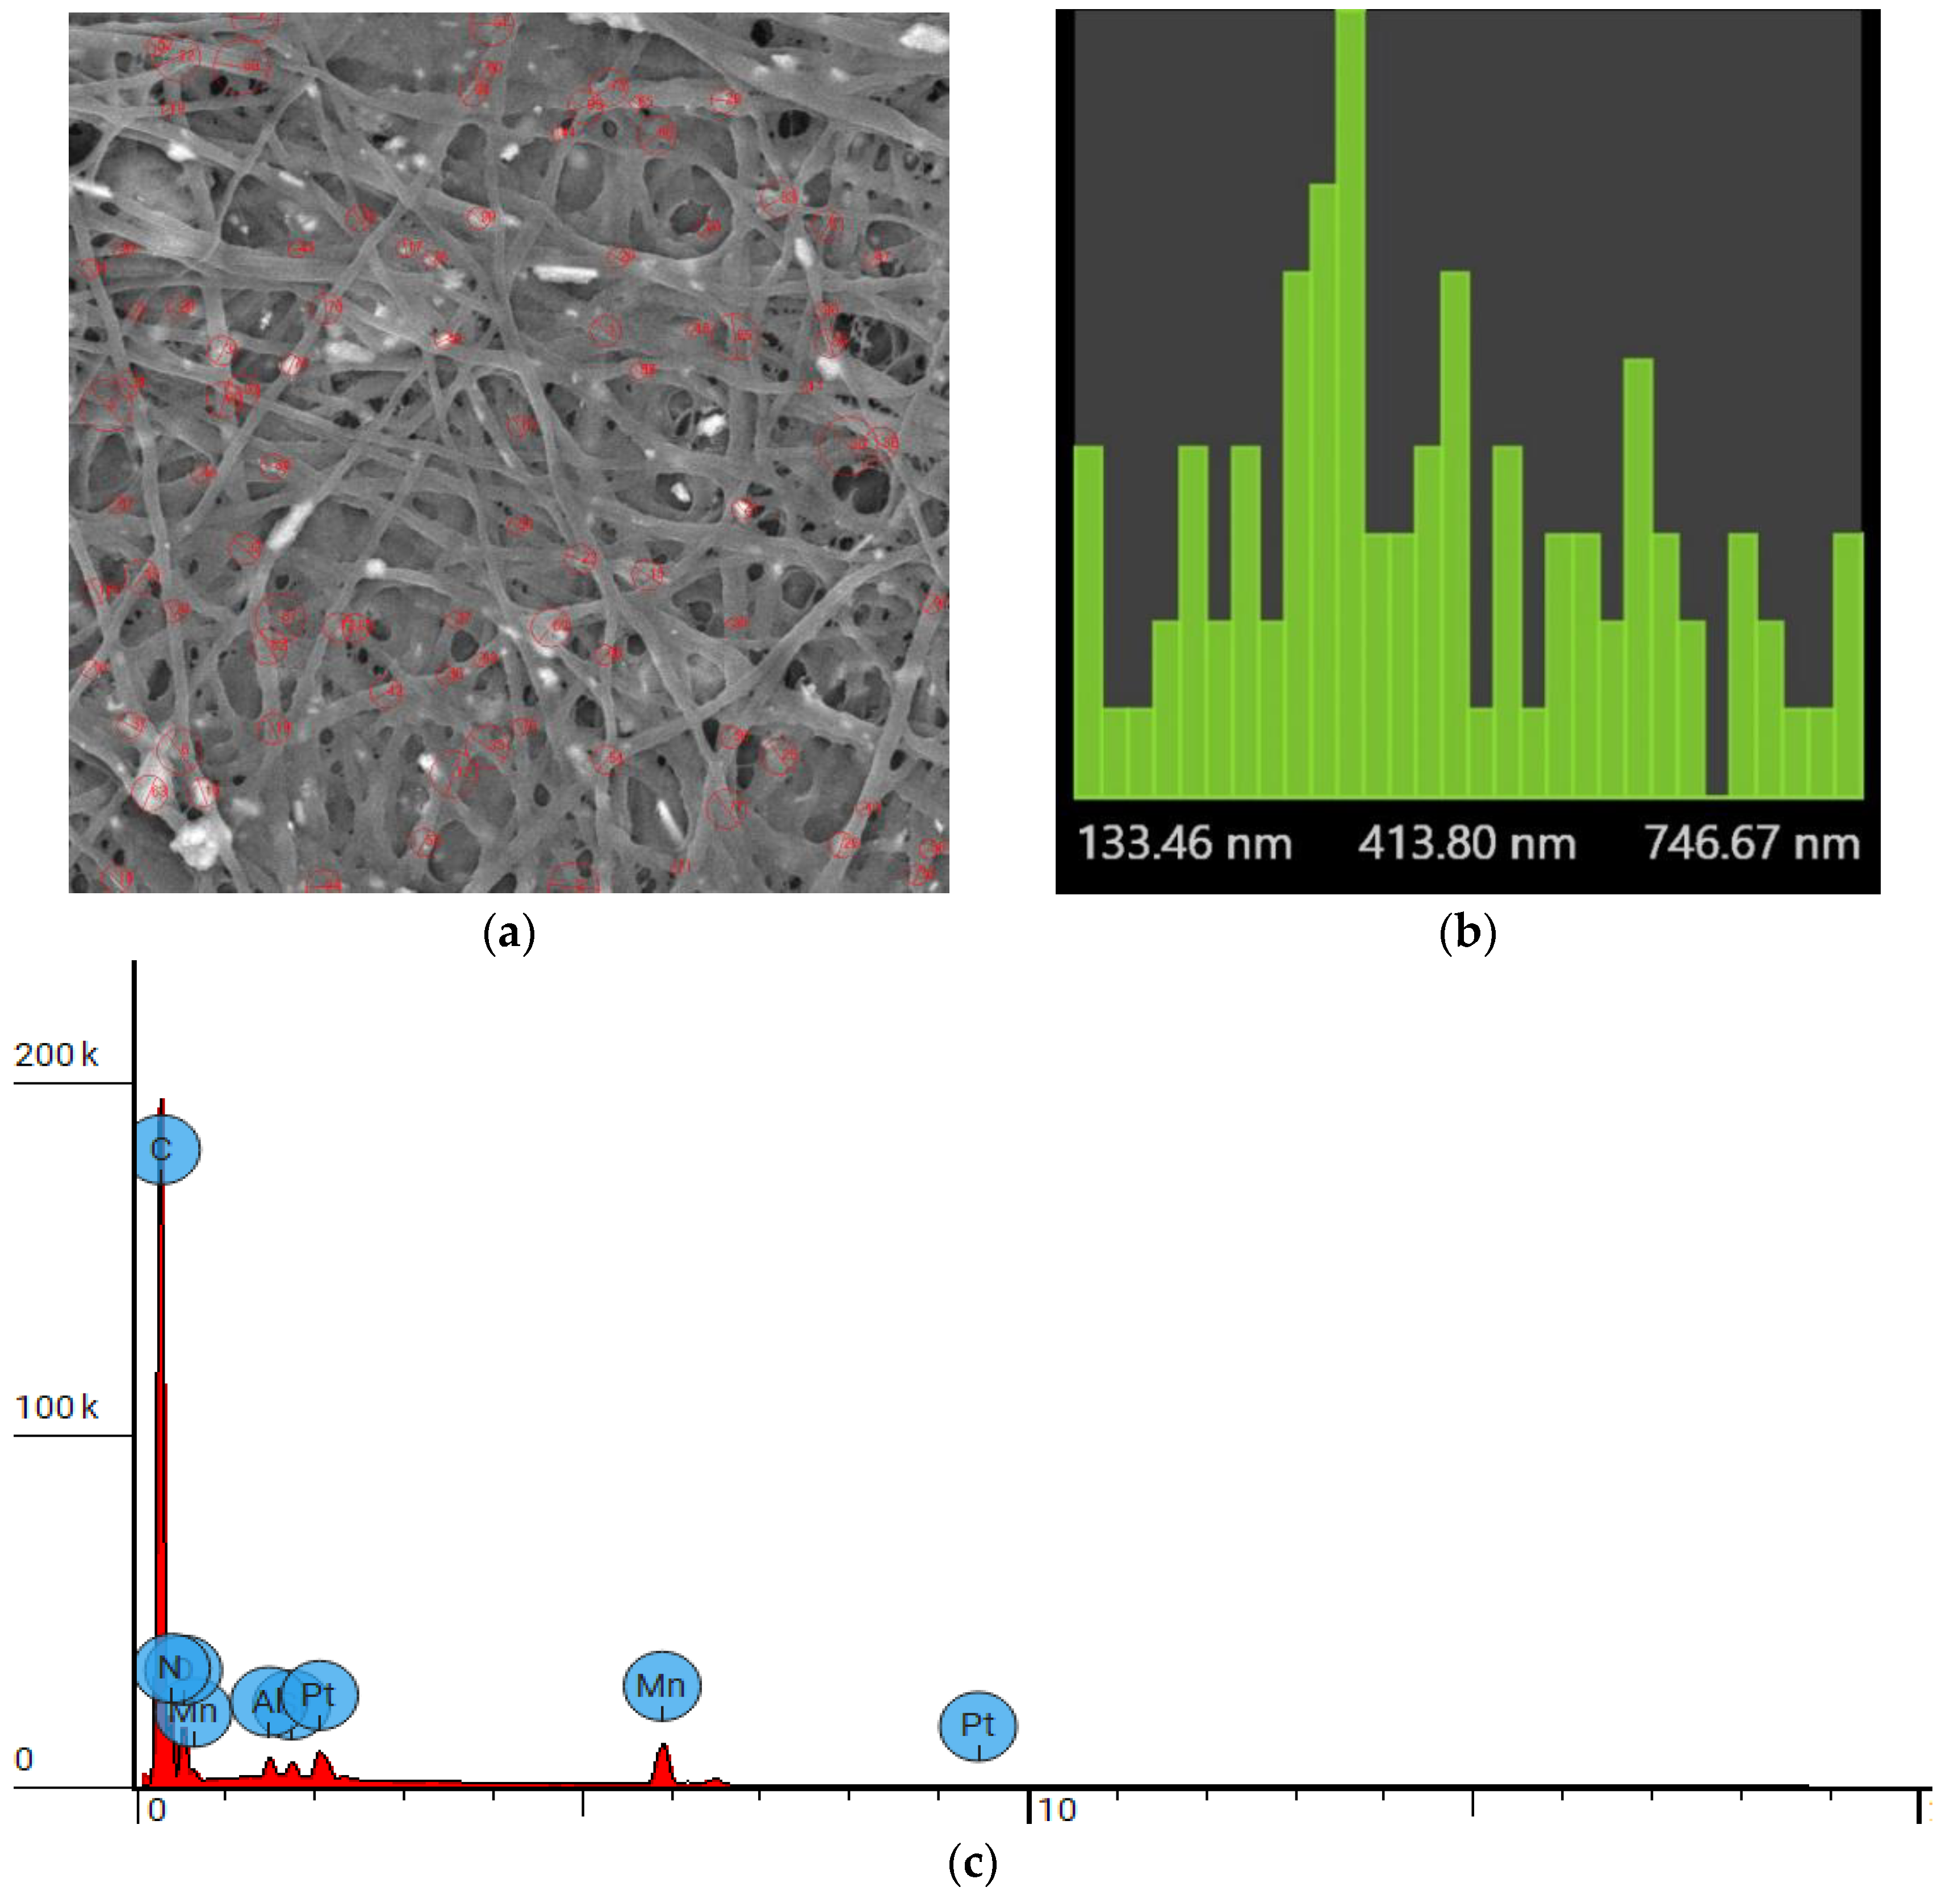
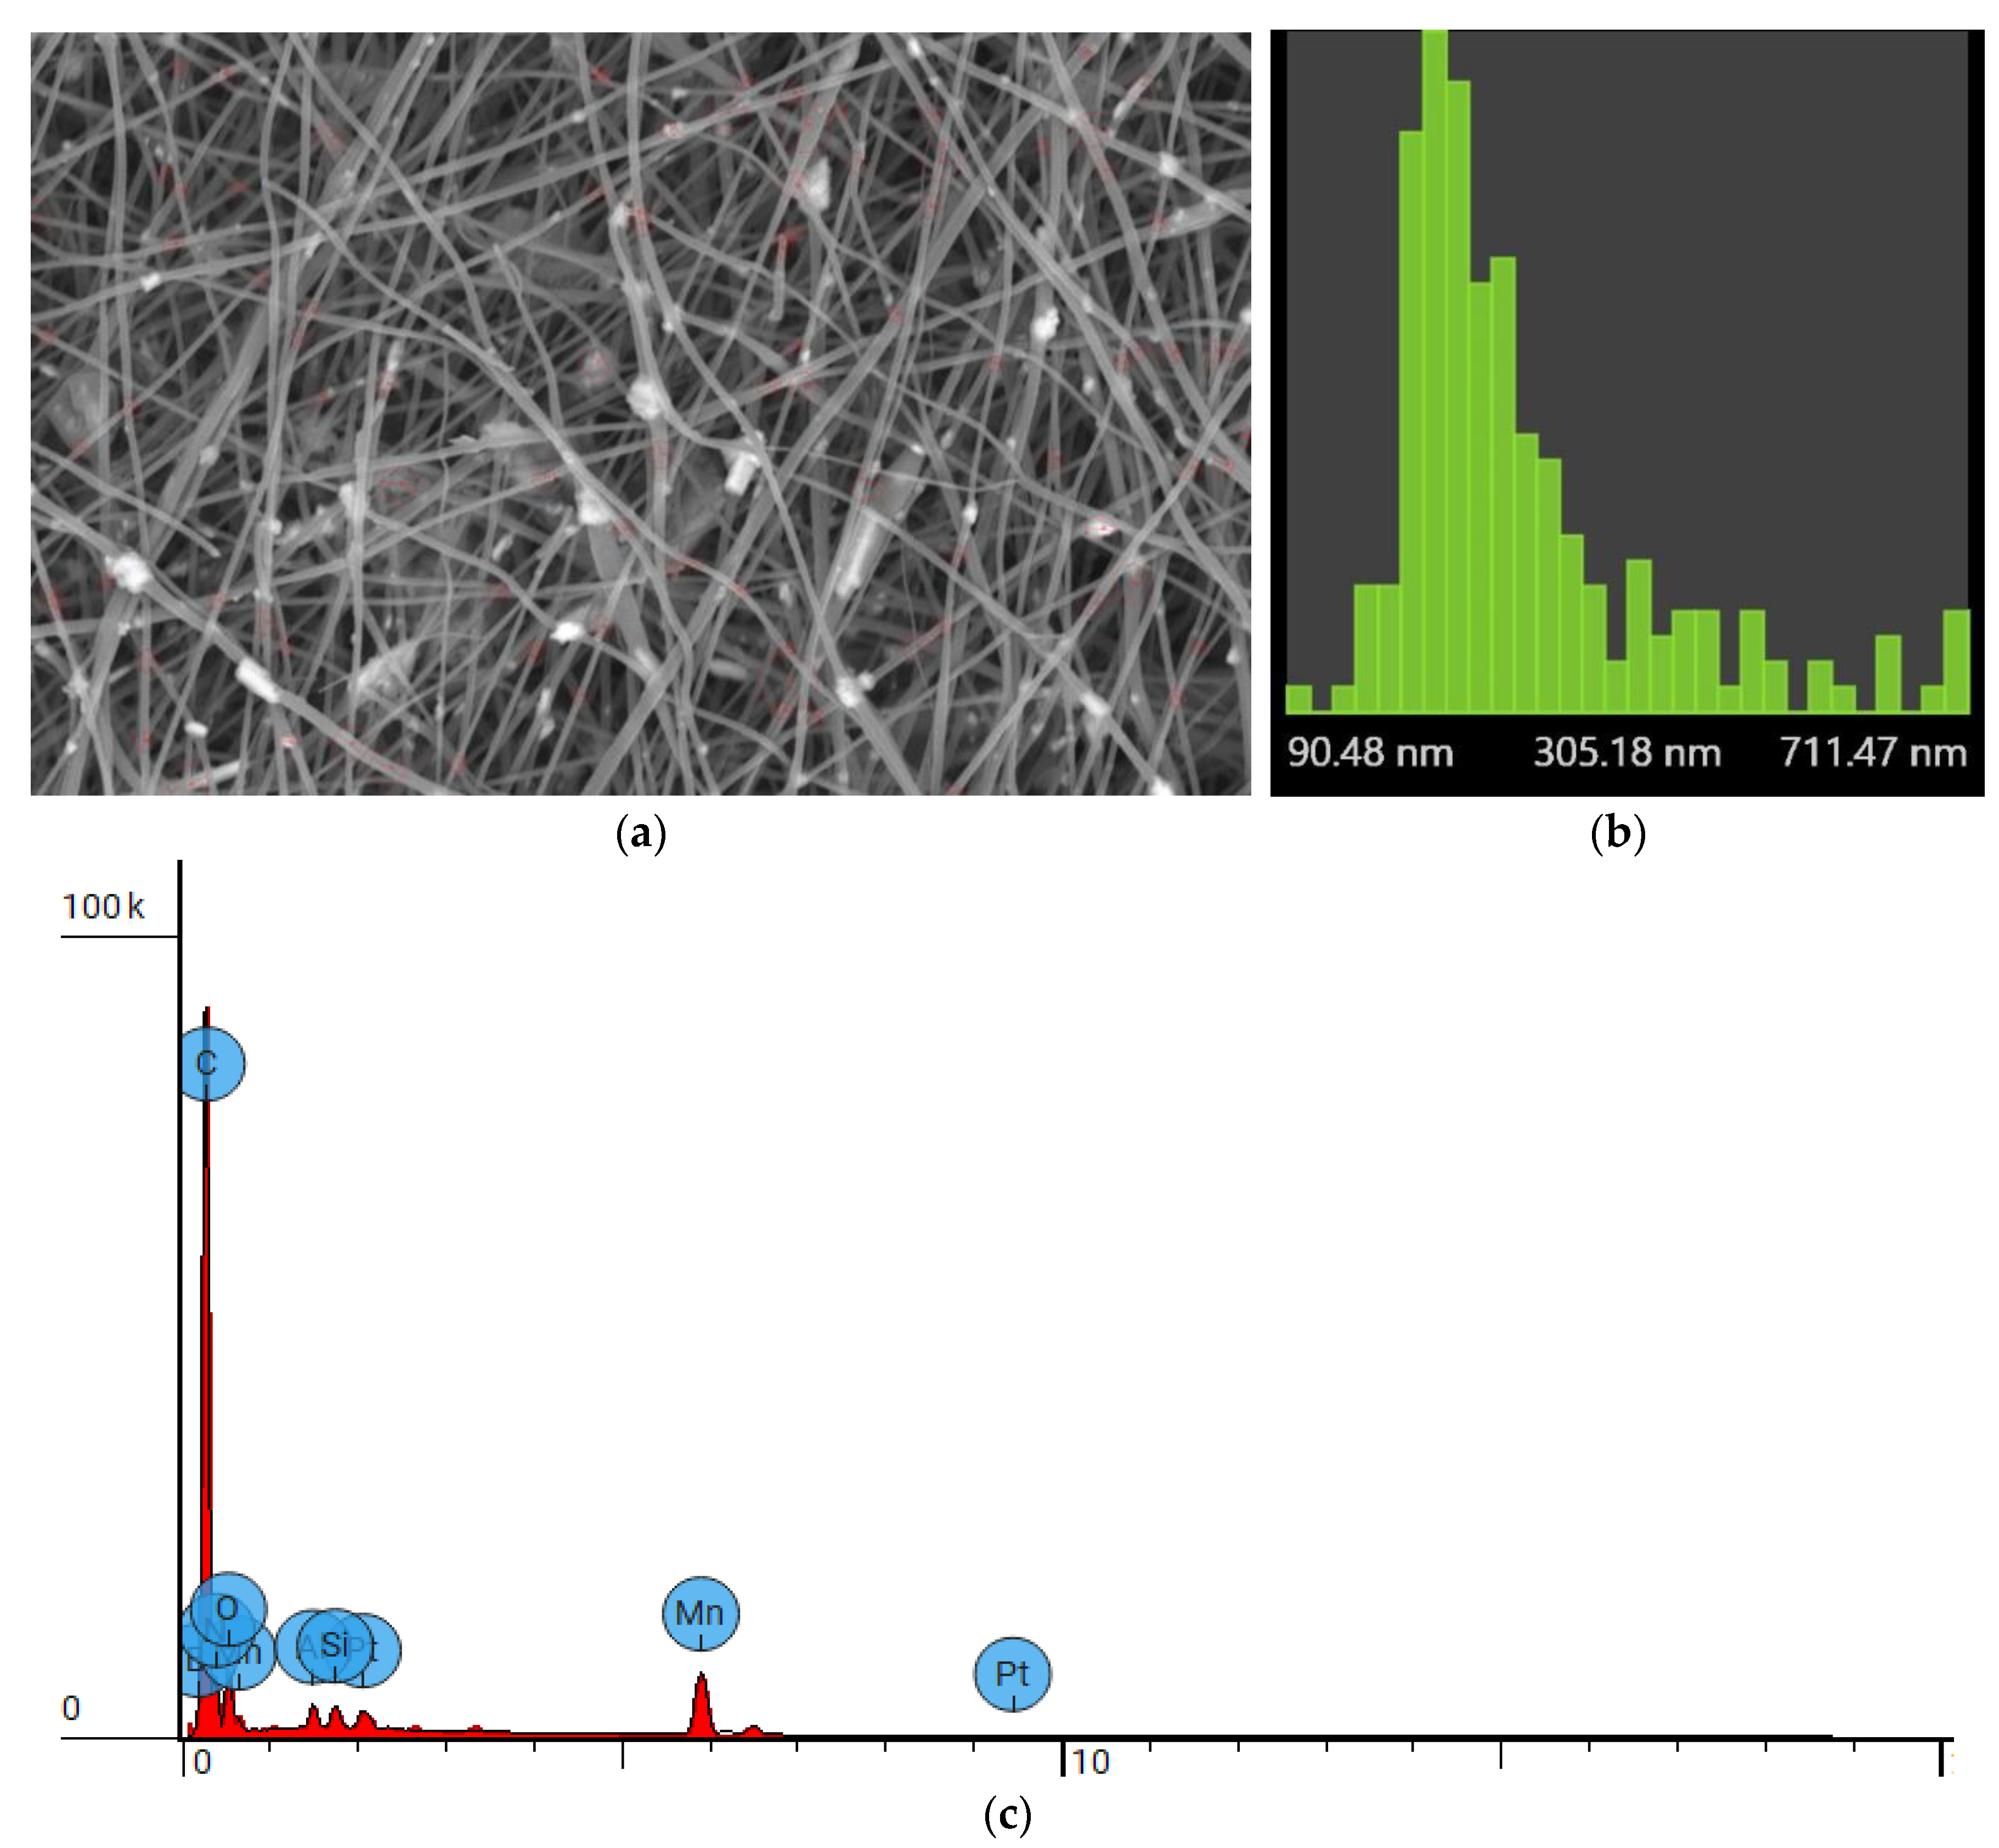
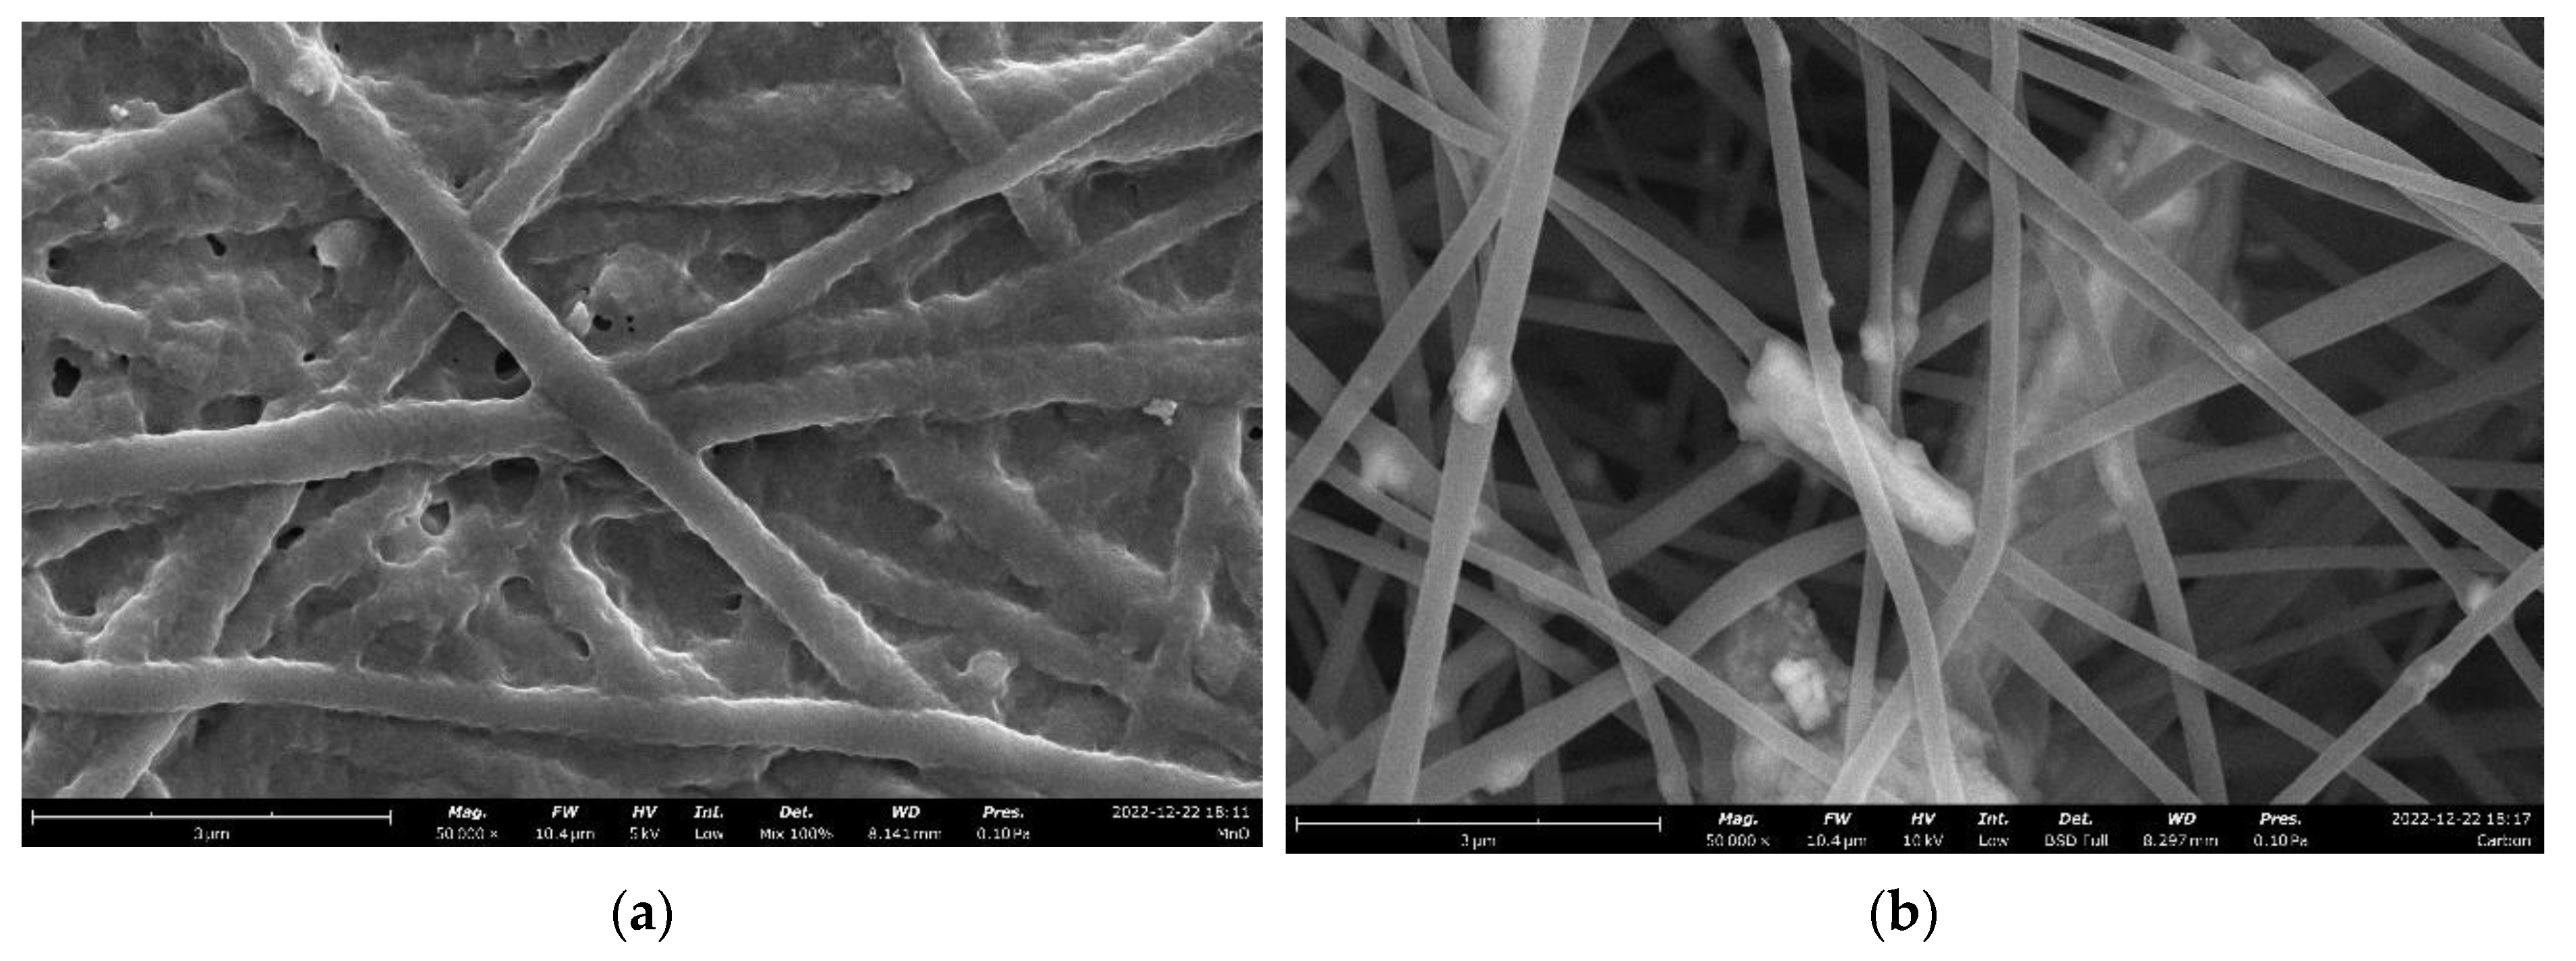
3.1. Morphology and Structures of Composite Nanofibers

Figure 1a, an image captured using the Phenom Pharos Desktop FEG-SEM shows the surface morphology of the as-spun polymer composite nanofibers after oxidization and stabilization. Size distribution analysis was carried out using the FiberMetric software. One hundred locations as marked by red circles in Figure 1a were used to determine the size distribution of the nanofibers. The results are shown by the histogram in Figure 1b. The maximum diameter is 747 nm. The minimum diameter is 134 nm. The mean value of diameters is 414 nm. X-ray diffraction energy dispersive spectrum (EDS) of the as-spun polymer composite nanofibers is illustrated in Figure 1c. The major elements, C and N, are from polyacrylonitrile (PAN). The oxygen element has two sources: oxygen from the MnO2 powder and oxygen from the oxidization and stabilization process. Si and Al are impurities from the electrospinning. Since silicone oil was used as the lubricant for the cylinder of the syringe, the chance of embedding Si-containing substances exists. Using aluminum foil as the substrate for nanofiber collection allows Al to go into the fiber. Finally, the Pt element is from the sputtered coating. The quantitative results of elemental analysis are given in Table 1.
Figure 2a, an image captured using the Phenom XL Desktop SEM shows the surface morphology of the partially carbonized composite nanofibers. Size distribution analysis was also performed using the FiberMetric software. One hundred locations as marked by red circles in Figure 2a were used to determine the size distribution of the composite carbon nanofibers. The results are shown by the histogram in Figure 2b. The maximum diameter is 712 nm. The minimum diameter is 91 nm. The mean value of diameters is 305 nm. X-ray diffraction energy dispersive spectrum (EDS) of the as-spun polymer composite nanofibers is illustrated in Figure 2c. Boron impurities could be from the glass tube during the heat treatment. The major elements, C and N, are from the cyclized compounds generated by the heat treatment on polyacrylonitrile (PAN). The oxygen element is mainly from the MnO2 as the atomic ratio of Mn to O is close to 1 to 2. Similar to the case of the as-spun nanofiber, Si and Al are impurities from the electrospinning process. There are two sources for Si. One is from the contact with glass during the high-temperature heat treatment. The other is from the silicone oil used for lubricating the cylinder of the syringe. Aluminum foil as the nanofiber collector and heat treatment supporting substrate caused Al into the partially carbonized nanofiber. The Pt element is sure from the sputtered platinum thin coating. Table 2 lists the elemental analysis results for the partially carbonized nanofiber specimen. The data in the last two columns refer to normal distribution results by removing the contribution by the Pt element.
It must be indicated that manganese oxide shows multiple forms due to the multiple valence values of the manganese ions. For example, in the work performed by Wang et al. [7], the nanoparticles are in the form of MnO from the sol-gel reaction followed by calcination at 600 °C. The composites exhibited good nanofibrous morphology with manganese oxide nanoparticles uniformly encapsulated by carbon nanofibers when the content of manganese oxide is only 15 wt.%, as can be seen from the cited images in Figure 3 [7].
The cited transmission electron microscopic (TEM) images of the composite nanofibers with the sample names of M15C (15% manganese oxide precursor compound), M30C (30% manganese oxide precursor compound), and M50C (50% manganese oxide precursor compound) were presented in Figure 3a–c, respectively. All three images confirmed the nanofibrous feature of the composites. The inset of Figure 3c is the corresponding selected area electron diffraction (SAED) pattern of the nanofiber. Figure 3d, a high-resolution transmission electron microscopic (HRTEM) image, reveals the manganese oxide nanocrystal with a typical lattice parameter shown. The hybrid nanofiber composites were used directly as freestanding anodes for lithium-ion batteries to evaluate their electrochemical properties. An optimized manganese oxide-carbon nanofiber composite with a low manganese oxide content can deliver a high reversible capacity, along with excellent mechanical properties for achieving high cycling stability and good rate capability [7].
In our work, the MnO2 nanoparticles were added directly into the PAN polymer followed by a short period of heat treatment at the same temperature of 600 °C. It is unlikely to change the oxidation state of manganese ions. This can be seen from the EDS results as described below.
From the EDS data as shown in Table 2, it can be seen that the atomic ratio of O to Mn is around 2 (O:Mn = 5.616:2.674 = 2.1002:1 → 2:1). Therefore, it is believed the MnO2 is still the dominant phase of manganese oxide within the carbon nanofibers. However, one should realize that the multiple valences of Mn ions could exist if the heat treatment time is long enough, or the treatment temperature is even higher. The reduction of carbon could lead to the formation of Mn3O4, Mn2O3, MnO, etc.
To examine the effect of heat treatment on the morphology evolution of the nanofiber from polymeric form to the partially carbonized sate, high-resolution images for both specimens were taken using the Phenom Pharos G2 Desktop FEG-SEM. Figure 4a, the SEM image for the as-spun nanofiber, illustrates the fusion of fibers at the contact areas. Figure 4b shows the image of the partially carbonized nanofiber. The comparison of the two SEM images shows that from the as-spun polymer state to the partially carbonized state, the nanofiber shrinker significantly. The fiber junction regions disappeared, and three-dimensional (3D) intern-connected pores formed.

3.2. Modeling the Distribution of Manganese Oxide Particles in Carbon Nanofibers

For co-electrospinning particle-polymer suspensions, the biggest challenge is how to disperse the particles uniformly within or at the polymer nanofibers. Typically, nanoparticles tend to form aggregates or clusters due to the requirement of minimizing their surface energies. However, during electrospinning, due to the electrical repulsive force and the shear forces from the fluid flow, the final distribution of manganese oxide nanoparticles within the nanofibers and at the surface of the nanofibers as shown in Figure 2a reveals the particle dispersion state. At higher magnification, the scanning electron microscopic (SEM) image taken from the spun manganese oxide nanoparticles and partially carbonized polyacrylonitrile (PAN) polymer microfibers (Figure 4b) shows some aggregated nanoparticle clusters. However, the separation of the nanoparticle clusters becomes the main feature. It is believed that such sporadic distribution of nanoparticles or particle clusters should come from the varying electric forces on the oxide particles. The fluctuation of electric repulsive force could promote the uniform distribution of the particles in the polymer nanofibers. We further hypothesize that the self-assembling of nanoparticles occurs under the lateral fluctuating electric field within the PAN polymer solution and/or nanofibers due to the bending instability of the polymer jets and nanofibers during electrospinning. The following modelling work may help understand the self-assembling-induced particle separation phenomena. The analytical model as described below could guide the manufacturing process by selecting the proper parameter for controlling the content and distribution of the oxide particles within the polymer nanofibers. Considering the dielectrophoresis of electrorheological suspensions subjected to non-uniform electric fields [32,33,34,35,36,37,38], we propose to model the motion of oxide particles under the actions of fluctuating electric fields as follows:
For the spun materials just leaving the Taylor cone, the front motion of the slurry is assumed to be one-dimensional. Defining the positive x-axis along the longitudinal direction of the electrospinning jet, the electric potential as a time-dependent function, φ(x, t), can be related to the electric field intensity, Γ, by its gradient, i.e.,
Γ = φ
The dipole moment of the polarized ith particle, pi, in an electric field with an oscillation frequency of ω is:
p i = 4 π ε 0 ε l r i 3 β ( ω ) Γ ,
where ri is the radius of the ith oxide particle; εo is the permittivity of the vacuum, εl is the permittivity of the polymer fluid; β(ω) is the frequency-dependent Clausius–Mossotti factor [34]:
β ( ω ) = ε p * ε l * ε p * + 2 ε l * ,
where ε p * is the complex permittivity of the particle; ε l * is the complex permittivity of the polymer.
The time-averaged interaction force between the ith and jth oxide particle can be computed [34]:
F D ,   i j = 3 4 π ε o ε l d 5 R e [ d i j ( p i · p j ) + ( d i j · p i ) p j * + ( d i j · p j ) p i * 5 d 2 d i j ( d i j · p i ) ( d i j · p j * ) ]
where pi denotes the dipole moment of particle i and dij is the displacement vector in the direction connecting the center of the ith particle to the center of the jth particle. The net electrostatic force acting on the ith particle is the sum of the interaction forces with all other particles and is given by
F D ,   i = i = 1 ,   i j N F D ,   i j ,
where N is the number of particles. The total electrostatic force: F E ,   i acting on the ith particle may be computed by vector addition of the dielectrophoretic and particle-particle interaction forces, i.e., The particle also experiences an electrostatic torque TE,i. Once the electric force FE,i, and the electrostatic torque TE,i are found, they can be used to determine the velocity of the ith particle Vi and its rotational velocity Ωi using the impulse and momentum principles. The velocity of the liquid jet Vl may be determined by solving the Navier-Stokes equation. Due to the spatial nonuniformity and the phase variation of the electric field, the relative velocity between the ith and jth particles Vrel = ViVj should have a non-zero solution. The separation between any of the two particles would increase with the electrospinning time t. This analysis is consistent with the results shown in SEM images of Figure 2a and Figure 4b. The above analysis is only qualitative. For quantitative analysis, numerical simulations are needed to determine more accurate results about the self-assembling behavior-induced spatial separation distances between oxide particles in the spun fibers.

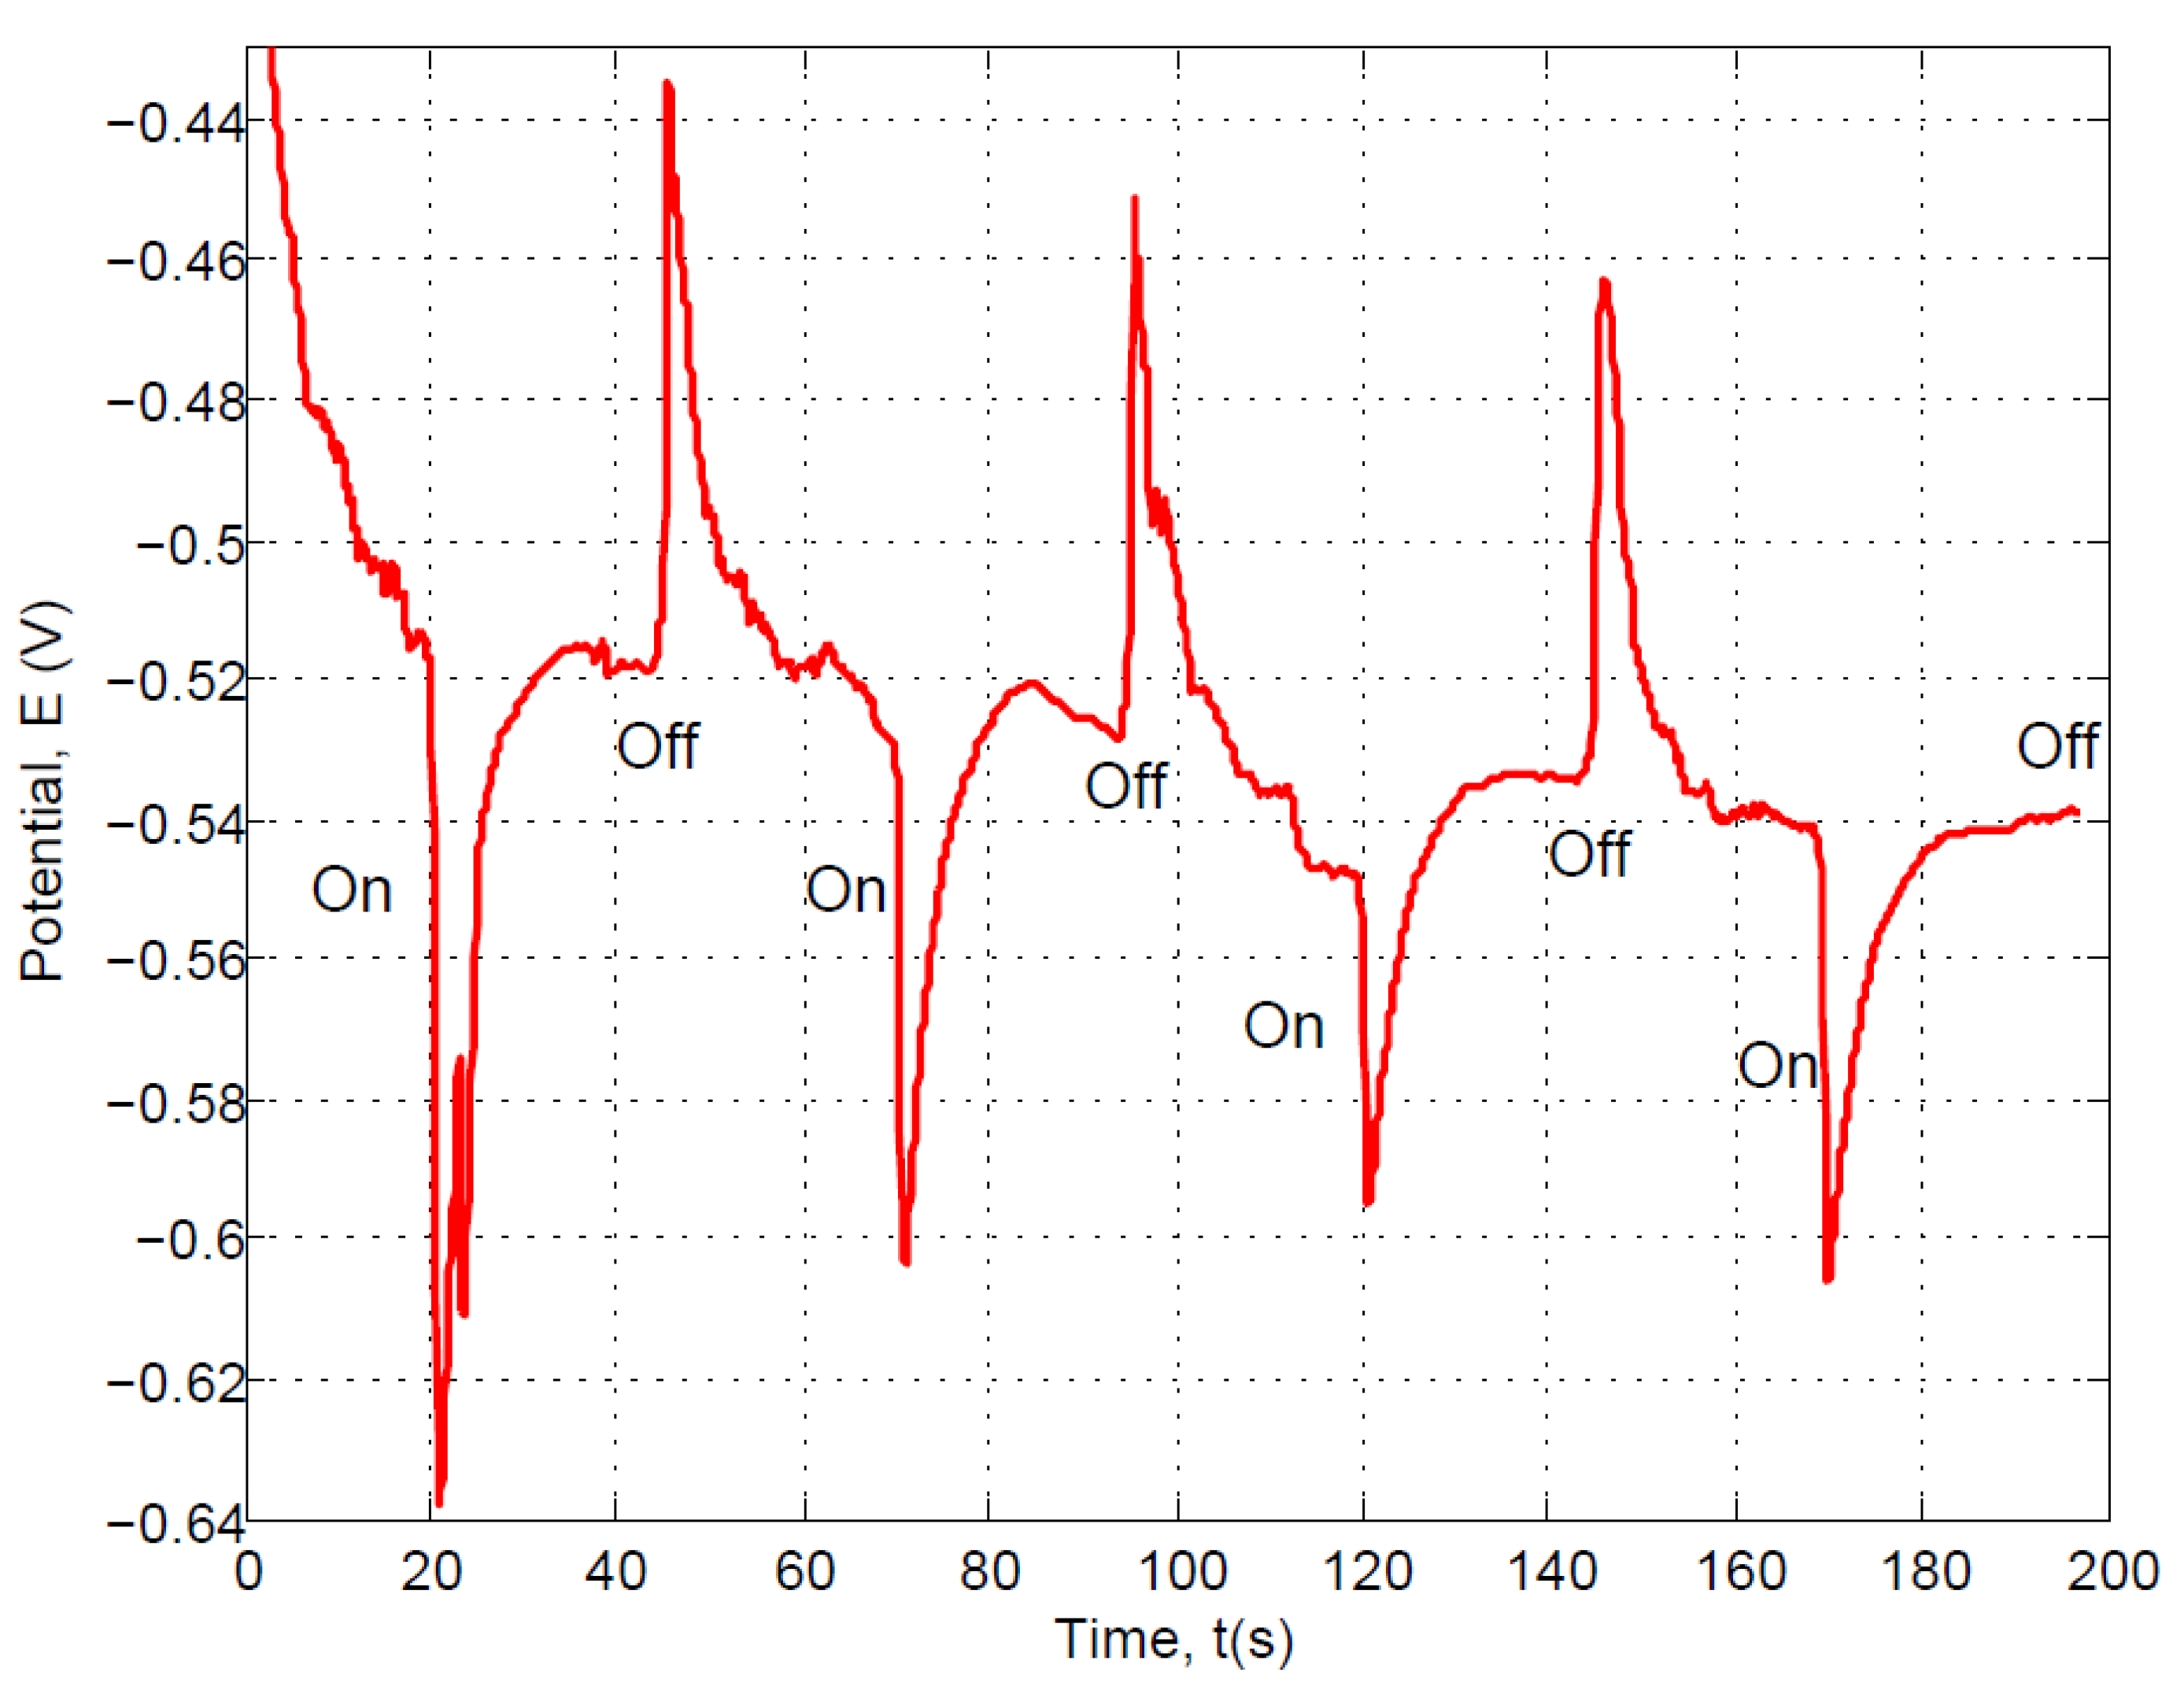
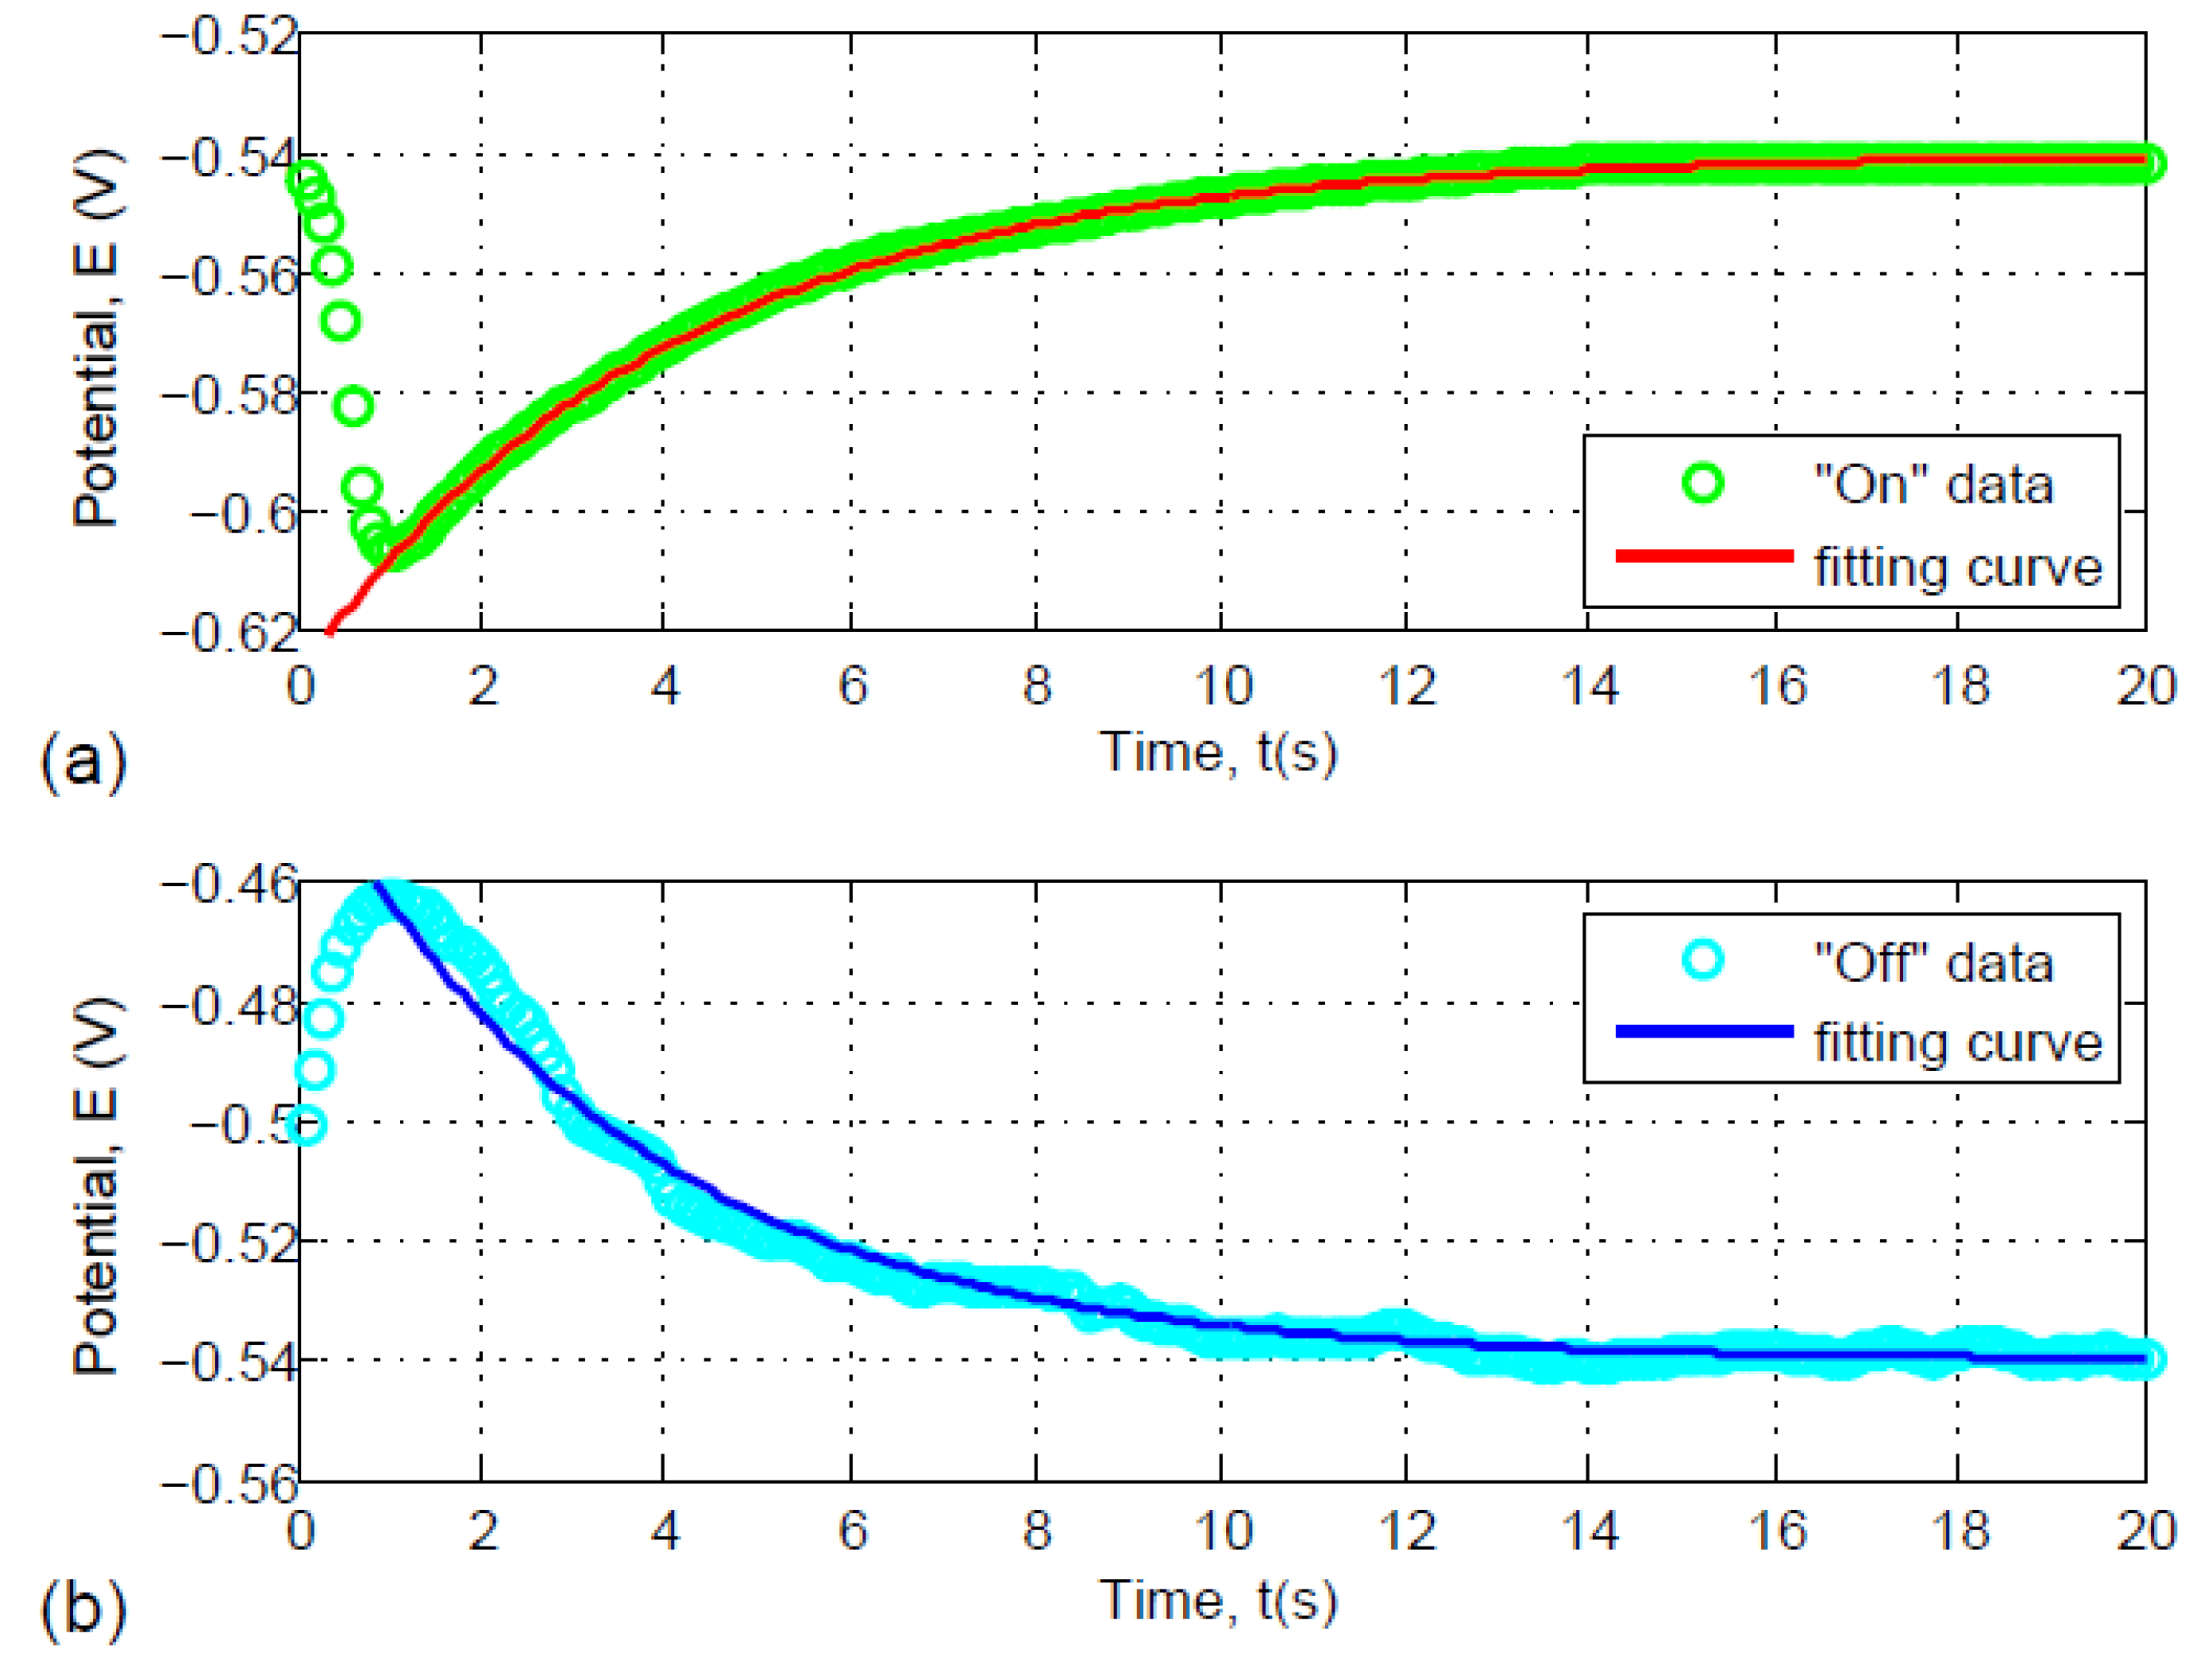
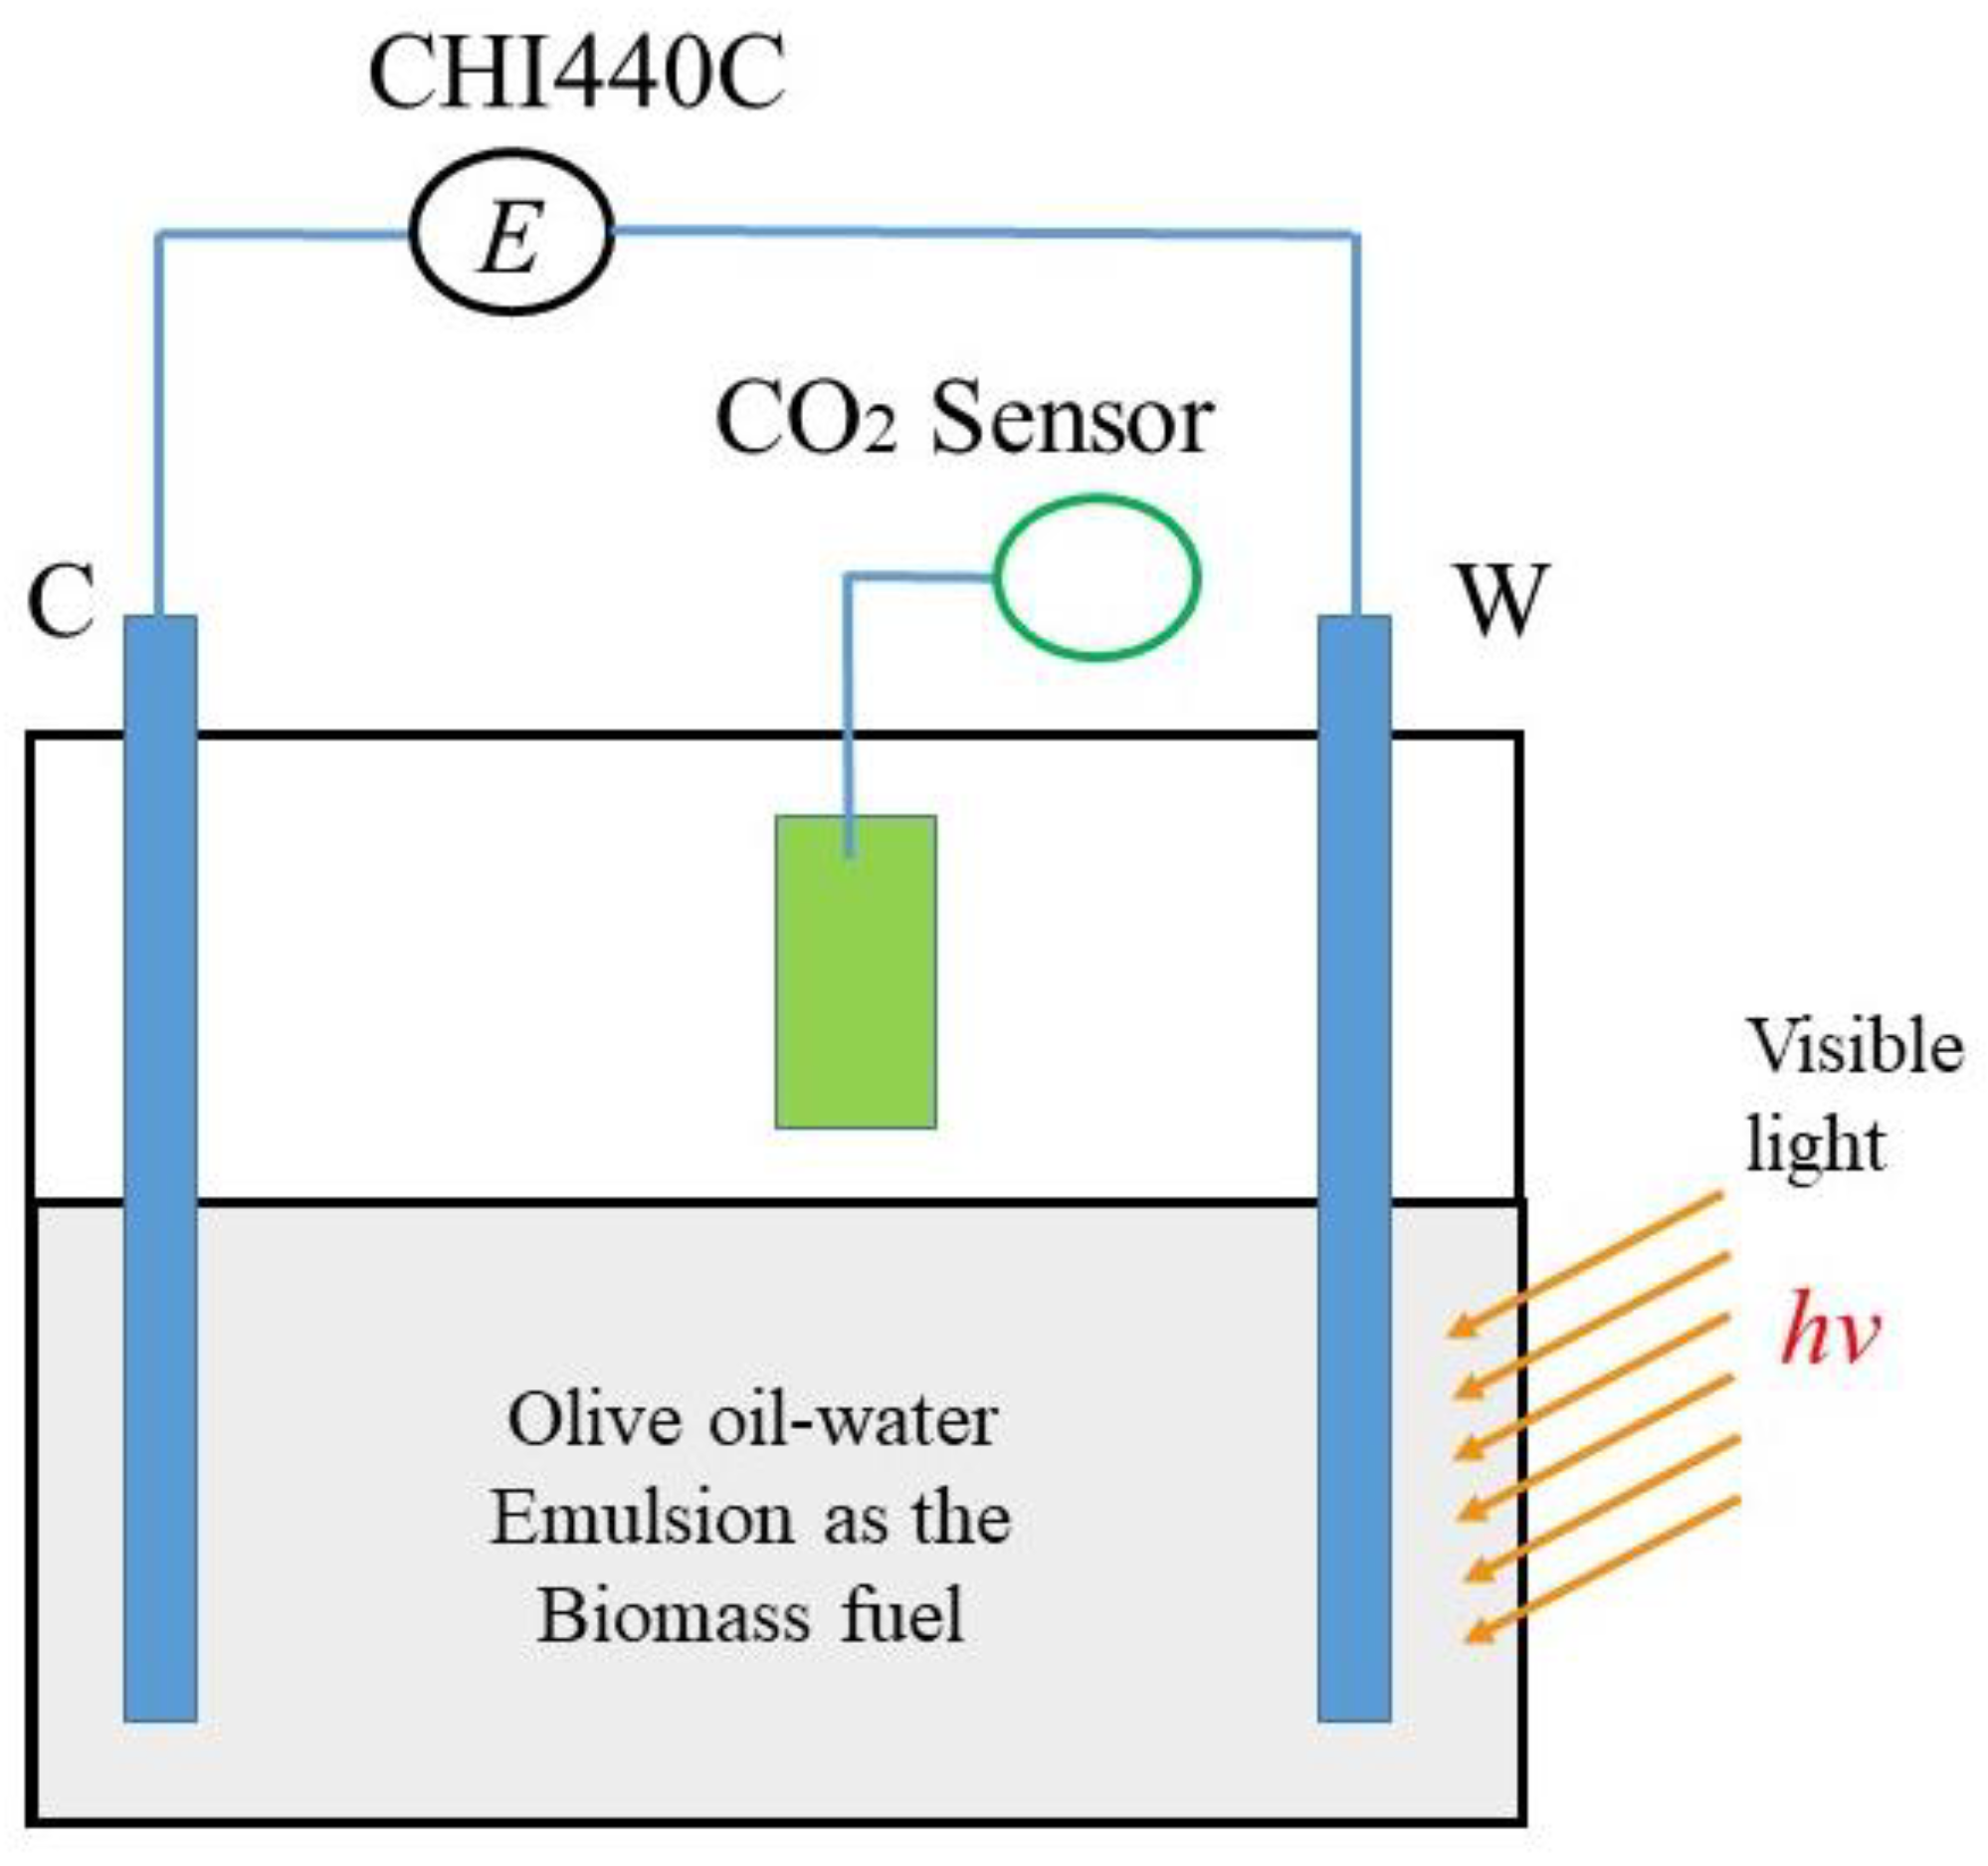
3.3. Photochemical Response of the Partially Carbonized Nanofiber Electrode

Figure 5 shows the open circuit potential (E) vs time (t) curve obtained from the test on the emulsion containing 5 mL olive oil and 5 mL seawater. If the sunlight is “On” for 25 s, the voltage at the photosensitive anode drops. When the sunlight is “Off” for 25 s, the voltage goes up as marked by several cycles in Figure 5. The dynamic response of the fuel cells to the sunlight may be analyzed as follows. When the sunlight is “On” (i.e., in the charging half-cycle), the change in the anode potential is about −100 mV. The voltage decrease is due to the accumulation of electrons at the anode. Since MnO2 is n-type semiconducting oxide, electron ejection occurs under solar energy excitation. The results in Figure 6 contains the data and fitting curves. The data were taken when the nanofiber electrode reached a stable response to the switching sunlight “On” for 25 s and “Off“ for 25 s during the tests. As shown in Figure 6a, the decrease in the voltage generated by solar energy is a function of the irradiation time, t, which may be expressed as:
E = E o A e t t 1 B
where A, B, and t1 are constants associated with the charging half-cycle, and Eo is the equilibrium potential. The values of A, B, and t1 can be determined by data fitting in the region from 20 to 45 s, from 70 to 90 s, from 120 to 145 s, or from 170 to 200 s. In this work, the equilibrium potential of the composite nanofiber anode showed a value of −0.54 V vs. Pt cathode. In the steady state, the values for A, B, and t1 can be found from the curve fitting of the data as shown in Figure 6a. When the data fitting was conducted, the transient state was ignored. In this case, the data in the period of 0 to 1 s were eliminated in the curve fitting because this spiking peak is dependent on the transport behavior of an electron in the nanofiber and the mass transport properties of ions in the electrolyte. After 1 s, the photon response of the electrode reached a steady state. From the data fitting curve, the results are determined as A = 0.06 V, B =4 s, and t1 =1.5 s. Substituting these values into Equation (6) yields:
E = 0.54 0.06 e t 1.5 4
when the sunlight is “Off” (i.e., in the discharging half-cycle), the positive shift in the potential as shown in Figure 6b is also a function of recovery or relaxation time, t, which is in the form as follows:
E = E o + C e t t 2 D
where C, D, and t2 are constants related to the discharging half-cycle. The values of C, D, and t2 can be obtained by data fitting in the region from 45 to 65 s, from 90 to 120 s, or from 145 to 165 s. The maximum voltage change is determined to be 80 mV from the results in Figure 5.
In the discharge cycle, it takes about 1 s to reach the steady state as can be seen in Figure 6b. So, the values for C, D, and t2 can be found from the curve fitting of the data as shown in Figure 6b. The results are C = 0.05 V, D =4 s, and t2 =2.5 s. Substituting these values into Equation (8) yields:
E = 0.54 + 0.05 e t 2.5 3.5
In the oil-seawater emulsion, the main photo-electrochemical reaction at the composite nanofiber photoanode is proposed as follows:
2kMnO2 + hν (sunlight) →k MnO2(h+) + kMnO2(e)
where k is an integer. h+ and e stand for hole and electron, respectively.
At the Pt cathode or in the emulsion near the cathode region, clean water generation is the main reaction [26,27].
O2 + 4e- + 4H+ → 2H2O
If the cathode region is sealed or oxygen-free, hydrogen generation becomes the main reaction. The measurement results reveal that the photodecomposition of the oil emulsion can generate electricity. In addition, the clean fuel, hydrogen, may be produced when the cell was air-tight or oxygen-free.
In the emulsion near the anode region, olive oil with a long carbon chain formula of R decomposes by the recombination with the hole [30].
R +n h+ → R1 + R2+ ∙∙∙ + Rn
where n is an integer. R1, R2, ∙∙∙, and Rn represent short molecular chain hydrocarbons. Eventually, these short molecular chain hydrocarbons could be converted into carbon dioxide in the emulsion near the anodic region. The decomposition of oil is assumed as the breakage of carbon chains to form short-chain substances. There are many reactions that could happen depending on the complexity of the oil compositions. Only shown here is the olive oil. However, even for this oil, many oxidative states could be there. The oil-water emulsion states could also be very complicated. Considering such complexities, we just used the simple carbon chain breakage reaction to show the idea. The information about the oxidation-reduction reactions of oil and other substances in the oil is not readily available. Therefore, more studies could be helpful to understand the oil decomposition mechanisms at the nanofiber anode surface under solar ray irradiation.
It is possible to get the data using a CO2 gas sensor. The configuration of the fuel cell and the carbon dioxide sensor is schematically shown in Figure 7. The results may show that when the sunlight is “Off”, the concentration of CO2 gas in the anode region of the fuel cell should be less than 700 ppm (the ambient concentration of CO2 gas in the atmosphere). After the sunlight is kept “On” for several minutes to hours, the photochemical reaction in the fuel cell achieves a steady state. Detectable CO2 gas should be produced. The monitored CO2 gas concentration should be increased and go up to 700 ppm. The rate of hydrogen formation may be determined by chronocoulometry, which is an indirect way to measure the hydrogen amount by the charge consumed at the cathode if the main reaction is hydrogen generation at the cathode of the photochemical fuel cell. The amount of hydrogen generated is related to the charge by Faraday’s Law. Each molar of hydrogen corresponds to the 96,500 C electric charge consumed. One molar of hydrogen takes about 22.4 L at room temperature and at the ambient atmospheric pressure of 1 atm. The volume of the photoelectrochemical fuel cell is about 10 mL. The hydrogen generated per unit volume thus can be determined. Preliminary measurements were conducted by this method [28,31]. More comprehensive work remains to be carried out in the future work.
The polarization test on the photoanode should be very helpful for determining the overpotential reaction rate. This preliminary study only showed the idea of electricity generation from sunlight by the manganese oxide-loaded carbon fiber anode. In view of the microstructure and composition analysis, Considering the manganese oxide could change to different ionic states, it would be helpful to use more characterization techniques, for example, XRD, TEM, localized EDS, XPS, band gap analysis, etc. on the manganese oxide nanoparticles in the composite carbon fibers.

4. Conclusions

Based on the processing and characterization of the manganese oxide containing composite nanofiber, the following conclusion can be drawn. Electrospinning allows the manganese oxide nanoparticles to disperse in the polyacrylonitrile nanofiber. The partial carbonization causes the diameter of the nanofiber to decrease by about 30%. Scanning electron microscopic analysis reveals that the as-spun nanofibers have an average diameter of over 410 nm. Such dimension is reduced to 305 nm after the partial carbonization treatment.
The oxide nanoparticles can be modeled as electrorheological suspensions in the polyacrylonitrile polymer solution during electrospinning. The dielectrophoretic behavior of the particles subjected to non-uniform electric fields allows the separation of nanoparticle clusters. This prevents the formation of large oxide particle aggregates in the composite nanofibers. The motion of the oxide particles under the resultant forces from fluctuating electric fields, gravitational fields, and rheological fields is the reason for the sporadic distribution of nanoparticles within the composite nanofibers.
The biophoton fuel cell consisting of the manganese oxide-loaded carbon nanofiber anode and platinum cathode shows a fast response to sunlight. It can convert solar energy into electricity and decompose the simulated spilled oil at the same time. The voltage change is −100 mV when the solar illumination is “On”. A positive 80 mV increase in the anode potential is obtained when the sunlight is blocked. Since the manganese dioxide nanoparticle in carbon nanofiber has a high sensitivity to photon energy, the composite fiber may also be made into flexible optical sensors.

Author Contributions

Y.X.G.; Conceptualization, Methodology, Investigation, Data curation, Formal analysis, Validation, Writing—original draft, Funding acquisition, Supervision, A.B.T.; Investigation, Writing—review & editing. A.R.; Investigation, Writing—review & editing, R.W.; Investigation. N.S.; Investigation. Z.Y.; Conceptualization, Methodology, Supervision, Validation. J.B.G.; Conceptualization, Methodology, Investigation, Data curation, Formal analysis, Validation, Writing –review & editing. D.D.; Investigation, Methodology, Data curation, Formal analysis, Validation, Writing—review & editing. F.J.C.; Investigation, Methodology, Data curation, Formal analysis, Validation, Writing—review & editing. All authors have read and agreed to the published version of the manuscript.

Funding

This research received funding from Oak Ridge Institute for Science and Education (ORISE) through an interagency agreement between the U.S. Department of Energy (DOE) and U.S. Department of Homeland Security (DHS) under DOE contract number DE-SC0014664.

Data Availability Statement

No additional data or codes are available.

Acknowledgments

“This research was performed under an appointment to the U.S. Department of Homeland Security (DHS) Science & Technology (S&T) Directorate Office of University Programs Summer Research Team Program for Minority Serving Institutions, administered by the Oak Ridge Institute for Science and Education (ORISE) through an interagency agreement between the U.S. Department of Energy (DOE) and DHS. ORISE is managed by ORAU under DOE contract number DE-SC0014664. All opinions expressed in this paper are the authors’ and do not necessarily reflect the policies and views of DHS, DOE, or ORAU/ORISE.” The support from the DHS Center of Excellence (COE): Arctic Domain Awareness Center (ADAC) at University of Alaska Anchorage, is also gratefully acknowledged.

Conflicts of Interest

The authors declare no conflict of interest.

References

  1. Dimesso, L.; Heider, L.; Hahn, H. Synthesis of nanocrystalline Mn-oxides by gas condensation. Solid State Ionics 1999, 123, 39–46. [Google Scholar] [CrossRef]
  2. Baldi, M.; Escribano, V.S.; Amores, J.M.G.; Milella, F.; Busca, G. Characterization of manganese and iron oxides as combustion catalysts for propane and propene. Appl. Catal. B Environ. 1998, 17, L175–L182. [Google Scholar] [CrossRef]
  3. Stobbe, E.R.; Boer, B.A.; Geus, J.W. The reduction and oxidation behaviour of manganese oxides. Catal. Today 1999, 47, 161–167. [Google Scholar] [CrossRef]
  4. Reddy, R.N.; Reddy, R.G. Synthesis and electrochemical characterization of amorphous MnO2 electrochemical capacitor electrode material. J. Power Sources 2004, 132, 315–320. [Google Scholar] [CrossRef]
  5. Subramanian, V.; Zhu, H.; Vajtai, R.; Ajayan, P.M.; Wei, B. Hydrothermal synthesis and pseudocapacitance properties of MnO2 nanostructures. J. Phys. Chem. B 2005, 109, 20207–20214. [Google Scholar] [CrossRef]
  6. Toupin, M.; Brousse, T.; Bélanger, D. Charge storage mechanism of MnO2 electrode used in aqueous electrochemical capacitor. Chem. Mater. 2004, 16, 3184–3190. [Google Scholar] [CrossRef]
  7. Wang, J.-G.; Yang, Y.; Huang, Z.-H.; Kang, F. MnO-carbon hybrid nanofiber composites as superior anode materials for lithium-ion batteries. Electrochim. Acta 2015, 170, 164–170. [Google Scholar] [CrossRef]
  8. Wayu, M. Manganese oxide carbon-based nanocomposite in energy storage applications. Solids 2021, 2, 232–248. [Google Scholar] [CrossRef]
  9. Mondal, K.; Kumar, R.; Sharma, A. Metal-oxide decorated multilayered three-dimensional (3D) porous carbon thin films for supercapacitor electrodes. Ind. Eng. Chem. Res. 2016, 55, 12569–12581. [Google Scholar] [CrossRef]
  10. Wu, D.; Xie, X.; Zhang, Y.; Zhang, D.; Du, W.; Zhang, X.; Wang, B. MnO2/carbon composites for supercapacitor: Synthesis and electrochemical performance. Front. Mater. 2020, 7, 2. [Google Scholar] [CrossRef] [Green Version]
  11. Sun, X.; Xu, T.; Bai, J.; Li, C. MnO2 nanosheets grown on multichannel carbon nanofibers containing amorphous cobalt oxide as a flexible electrode for supercapacitors. ACS Appl. Energy Mater. 2019, 2, 8675–8684. [Google Scholar] [CrossRef]
  12. Saito, Y.; Meguro, M.; Ashizawa, M.; Waki, K.; Yuksel, R.; Unaland, H.E.; Matsumoto, H. Manganese dioxide nanowires on carbon nanofiber frameworks for efficient electrochemical device electrodes. RSC Adv. 2017, 7, 12351–12358. [Google Scholar] [CrossRef] [Green Version]
  13. Lin, Z.; Ji, L.; Woodroof, M.D.; Zhang, X. Electrodeposited MnOx/carbon nanofiber composites for use as anode materials in rechargeable lithium-ion batteries. J. Power Sources 2010, 195, 5025–5031. [Google Scholar] [CrossRef]
  14. Liu, J.; Essner, J.; Li, J. Hybrid supercapacitor based on coaxially coated manganese oxide on vertically aligned carbon nanofiber arrays. Chem. Mater. 2010, 22, 5022–5030. [Google Scholar] [CrossRef]
  15. Barakat, N.A.M.; Park, S.J.; Khil, M.S.; Kim, H.Y. Preparation of MnO nanofibers by novel hydrothermal treatment of manganese acetate/PVA electrospun nanofiber mats. Mater. Sci. Eng. B 2009, 162, 205–208. [Google Scholar] [CrossRef]
  16. Samuel, E.; Aldalbahi, A.; El-Newehy, M.; El-Hamshary, H.; Yoon, S.S. Flexible and freestanding manganese/iron oxide carbon nanofibers for supercapacitor electrodes. Ceram. Int. 2022, 48, 18374–18383. [Google Scholar] [CrossRef]
  17. Joshi, B.; Samuel, E.; Kim, Y.; Kim, T.; El-Newehy, M.; Aldalbahi, A.; Yoon, S.S. Electrospun zinc-manganese bimetallic oxide carbon nanofibers as freestanding supercapacitor electrodes. Int. J. Energy Res. 2022, 46, 22100–22112. [Google Scholar] [CrossRef]
  18. Divya, P.; Prakash, N.G.; Ko, T.J.; Rosaiah, P. Metal/metal oxide (N-MnO/rGO) encapsulated carbon nanofiber composites for high-performance Li-ion batteries. J. Clust. Sci. 2023, 34. (early access). [Google Scholar] [CrossRef]
  19. Tandon, A.; Rani, S.; Sharma, Y. Designing the binder-free conversion-based manganese oxide nanofibers as highly stable and rate-capable anode for next-generation Li-ion batteries. ACS Appl. Energy Mater. 2022, 5, 6855–6868. [Google Scholar] [CrossRef]
  20. Alegre, C.; Busacca, C.; Di Blasi, A.; Cannilla, C.; Barbera, O.; Antonucci, V.; Lázaro, M.J.; Baglio, V. Electrospun MnCo2O4/carbon-nanofibers as oxygen electrode for alkaline zinc-air batteries. J. Energy Storage 2022, 55, 105404. [Google Scholar] [CrossRef]
  21. Haridas, A.K.; Sadan, M.K.; Kim, J.-H.; Lee, Y.; Ahn, J.-H. Electrospun Interconnected Bead-Like P2-NaxCoyMn(1−y)O2 (x = 0.66, y = 0.1) Cathode Material for Stable Sodium-Ion Storage. Batteries 2022, 8, 237. [Google Scholar] [CrossRef]
  22. Kongthong, T.; Poochai, C.; Sriprachuabwong, C.; Tuantranont, A.; Nanan, S.; Meethong, N.; Pakawatpanurut, P.; Amornsakchai, T.; Sodtipinta, J. Microwave-assisted synthesis of nitrogen-doped pineapple leaf fiber-derived activated carbon with manganese dioxide nanofibers for high-performance coin- and pouch-cell supercapacitors. J. Sci. Adv. Mater. Devices 2022, 7, 100434. [Google Scholar] [CrossRef]
  23. Elghamry, I.; Al-Jendan, S.A.; Saleh, M.M.; Abdelsalam, M.E. Bimetallic nickel/manganese phosphate-carbon nanofiber electrocatalyst for the oxidation of formaldehyde in alkaline medium. RSC Adv. 2022, 12, 20656–20671. [Google Scholar] [CrossRef]
  24. Poudel, M.B.; Shin, M.; Kim, H.J. Interface engineering of MIL-88 derived MnFe-LDH and MnFe2O3 on three-dimensional carbon nanofibers for the efficient adsorption of Cr(VI), Pb(II), and As(III) ions. Sep. Purif. Technol. 2022, 287, 120463. [Google Scholar] [CrossRef]
  25. Yuan, D.; Zhang, T.; Guo, Q.; Qiu, F.; Yang, D.; Ou, Z. Recyclable biomass carbon@SiO2@MnO2 aerogel with hierarchical structures for fast and selective oil-water separation. Chem. Eng. J. 2018, 351, 622–630. [Google Scholar] [CrossRef]
  26. Lianos, P. Production of electricity and hydrogen by photocatalytic degradation of organic wastes in a photoelectrochemical cell: The concept of the Photofuelcell: A review of a re-emerging research field. J. Hazard. Mater. 2011, 185, 575–590. [Google Scholar] [CrossRef]
  27. Kaneko, M.; Ueno, H.; Ohnuki, K.; Horikawa, M.; Saito, R.; Nemoto, J. Direct electrical power generation from urine, wastes and biomass with simultaneous photodecomposition and cleaning. Biosens. Bioelectron. 2007, 23, 140–143. [Google Scholar] [CrossRef]
  28. Gan, Y.X.; Gan, B.J.; Su, L. Biophotofuel cell anode containing self-organized titanium dioxide nanotube array. Mater. Sci. Eng. B 2011, 176, 1197–1206. [Google Scholar] [CrossRef]
  29. Marschall, R.; Klaysom, C.; Mukherji, A.; Wark, M.; Lu, G.Q.; Wang, L. Composite proton-conducting polymer membranes for clean hydrogen production with solar light in a simple photoelectrochemical compartment cell. Int. J. Hydrogen Energy 2012, 37, 4012–4017. [Google Scholar] [CrossRef]
  30. Cheng, H.; Qian, Q.; Wang, X.; Yu, P.; Mao, L. Electricity generation from carboxymethyl cellulose biomass: A new application of enzymatic biofuel cells. Electrochim. Acta 2012, 82, 203–207. [Google Scholar] [CrossRef]
  31. Gan, Y.X.; Gan, B.J.; Clark, E.; Su, L.; Zhang, L. Converting environmentally hazardous materials into clean energy using a novel nanostructured photoelectrochemical fuel cell. Mater. Res. Bull. 2012, 47, 2380–2388. [Google Scholar] [CrossRef]
  32. Kadaksham, J.; Singh, P.; Aubry, N. Manipulation of particles using dielectrophoresis. Mech. Res. Commun. 2006, 33, 108–122. [Google Scholar] [CrossRef]
  33. Kadaksham, A.T.J.; Singh, P.; Aubry, N. Dielectrophoresis of nanoparticles. Electrophoresis 2004, 25, 3625–3632. [Google Scholar] [CrossRef] [PubMed]
  34. Aubry, N.; Singh, P. Influence of particle-particle interactions and particles rotational motion in traveling wave dielectrophoresis. Electrophoresis 2006, 27, 703–715. [Google Scholar] [CrossRef]
  35. Jones, T.B. Electromechanics of Particles; Cambridge University Press: Cambridge, UK, 2009; pp. 139–180. [Google Scholar] [CrossRef]
  36. Wang, L.; Lu, J.; Marchenko, S.A.; Monuki, E.S.; Flanagan, L.A.; Lee, A.P. Dual frequency dielectrophoresis with interdigitated sidewall electrodes for microfluidic flow-through separation of beads and cells. Electrophoresis 2009, 30, 782–791. [Google Scholar] [CrossRef] [PubMed]
  37. Lewpiriyawong, N.; Yang, C. Continuous separation of multiple particles by negative and positive dielectrophoresis in a modified H-filter. Electrophoresis 2014, 35, 714–720. [Google Scholar] [CrossRef]
  38. Jia, Y.; Ren, Y.; Jiang, H. Continuous dielectrophoretic particle separation using a microfluidic device with 3D electrodes and vaulted obstacles. Electrophoresis 2015, 36, 1744–1753. [Google Scholar] [CrossRef]
Figure 1. (a) SEM image of the as-spun composite nanofiber, (b) histogram showing the nanofiber size distribution, (c) X-ray diffraction energy dispersive spectrum (EDS) of the as-spun nanofiber.
Carbon 09 00026 g001
Figure 2. (a) SEM image of partially carbonized composite nanofiber, (b) histogram showing the nanofiber size distribution, (c) energy dispersive spectrum of the partially carbonized nanofiber.
Carbon 09 00026 g002
Figure 3. Transmission electron microscopic (TEM) images of the (a) M15C, (b) M30C, and (c) M50C composite nanofibers. Inset is the corresponding selected area electron diffraction (SAED) pattern. (d) high-resolution transmission electron microscopic (HRTEM) image of the manganese oxide nanocrystal. Reproduced with permission from [7], © 2015 Elsevier Ltd.
Carbon 09 00026 g003
Figure 4. High magnification SEM images taken by Phenom Pharos G2 Desktop FEG-SEM showing (a) as-spun polymeric composite nanofiber, (b) partially carbonized composite nanofiber.
Carbon 09 00026 g004
Figure 5. Open circuit potential vs time for the manganese oxide-containing composite carbon nanofiber photoanode.
Carbon 09 00026 g005
Figure 6. Open circuit potential of the composite nanofiber anode vs time data and fitting curves: (a) light “On” cycle, (b) light “Off” cycle.
Carbon 09 00026 g006
Figure 7. Schematic showing energy generation and oil decomposition by the biophotofuel cell. The carbon dioxide sensor was placed above the cell close to the nanofiber photoanode. W-working electrode, C-counter electrode.
Carbon 09 00026 g007
Table 1. EDS elemental analysis results for the as-spun polymer composite nanofiber.
Atomic NumberElement SymbolElement NameAtomic Conc.Weight Conc.
6CCarbon54.76944.689
7NNitrogen34.52932.866
8OOxygen7.0067.615
13AlAluminum0.4920.902
14SiSilicon0.2630.501
25MnManganese2.68410.020
78PtPlatinum0.2573.407
Table 2. EDS elemental analysis results for the partially carbonized composite nanofiber.
Element NumberElement SymbolElement NameAtomic Conc.Weight Conc.Atomic Conc. Normd.Weight Conc. Normd.
5BBoron4.7443.6004.7503.655
6CCarbon55.27746.60055.33847.310
7NNitrogen30.91330.40030.94730.863
8OOxygen5.6096.3005.6166.396
13AlAluminum0.4230.8000.4230.812
14SiSilicon0.2540.5000.2540.508
25MnManganese2.67110.3002.67410.457
78PtPlatinum0.1101.5000.0000.000
Disclaimer/Publisher’s Note: The statements, opinions and data contained in all publications are solely those of the individual author(s) and contributor(s) and not of MDPI and/or the editor(s). MDPI and/or the editor(s) disclaim responsibility for any injury to people or property resulting from any ideas, methods, instructions or products referred to in the content.

