


Valorization of Exhausted Olive Pomace for the Production of a Fuel for Direct Carbon Fuel Cell


1
Laboratory of Systems Integration and Emerging Energies (LR21ES14), National Engineering School of Sfax (ENIS), University of Sfax, IPEIS Road Menzel Chaker km 0.5, P.O. Box 1172, Sfax 3018, Tunisia
2
Digital Research Center of Sfax, Technopole of Sfax, Sakiet Ezzit, P.O. Box 275, Sfax 3021, Tunisia
3
State Key Laboratory of Chemical Engineering, Tianjin University, Tianjin 300072, China
4
Tianjin Key Laboratory of Applied Catalysis Science and Technology, School of Chemical Engineering, Tianjin University, Tianjin 300072, China
5
Collaborative Innovation Center of Chemical Science and Engineering Tianjin, Tianjin 300072, China
6
Department of Chemical and Metallurgical Engineering, Aalto University, FI-00076 Aalto, Finland
*
Author to whom correspondence should be addressed.
C 2023, 9(1), 22; https://doi.org/10.3390/c9010022
Submission received: 1 December 2022
/
Revised: 26 January 2023
/
Accepted: 2 February 2023
/
Published: 14 February 2023
(This article belongs to the Special Issue Biomass—a Renewable Resource for Carbon Materials)
Abstract
:In this study, exhausted olive pomace (EOP) biochar prepared by carbonization at 400 °C is investigated as a fuel in a direct carbon fuel cell (DCFC) with an electrolyte-supported configuration. The feasibility of using the EOP biochar in the DCFC is confirmed, showing a maximum power density of 10 mW·cm−2 at 700 °C. This limited DCFC performance is compared with other biochars prepared under similar conditions and interrelated with various biochar physico-chemical characteristics, as well as their impact on the DCFC’s chemical and electrochemical reaction mechanisms. A high ash content (21.55%) and a low volatile matter (40.62%) content of the EOP biochar are among the main causes of the DCFC’s limited output. Silica is the major impurity in the EOP biochar ash, which explains the limited cell performance as it causes low reactivity and limited electrical conductivity because of its non-crystal structure. The relatively poor DCFC performance when fueled by the EOP biochar can be overcome by further pre- and post-treatment of this renewable fuel.
1. Introduction
The use of biomass and waste as fuel represents not only a feasible but also promising alternative to conventional fossil fuels. Electricity from biomass and waste has received attention in recent years. The main advantage of biomass energy-based electricity is that renewable fuel is often a byproduct, a residue, or a waste produced from different sources, such as wood residues, agricultural residues, or agro-industrial wastes and byproducts. In this context, the national Waste Management Agency estimates that Tunisia produces around six million tons of organic wastes per year, where 73% comes from household wastes, farms, and the agro-food industry, while 17% is due to olive oil pressing residues. Tunisia, as one of the world’s top five producers of olive oil, collects a huge amount (around 300.000 tons/year) of exhausted olive pomace (EOP) residues yearly. EOP is one of the main byproducts obtained from olive oil extraction, which represents an important economic sector in Mediterranean countries and specifically in Tunisia. This agro-industrial waste has a variable composition, depending on the olive variety and the olive oil processing methods. EOP consists of a lignocellulosic matrix with polyphenolic compounds, uronic acids, oily residues, water-soluble fats, proteins, water-soluble carbohydrates, and water-soluble phenolic substances [1,2], and it is rich in potassium and poor in phosphorus and micronutrients [2]. Nevertheless, the disposal of EOP is one of the major environmental problems due to its phytotoxicity and antimicrobial properties [3]. It also increases the hydrophobicity and the infiltration rate of soil and decreases the water retention rate [4,5]. However, thanks to its lignocellulosic structure, EOP can be directly combusted in boilers and furnaces [6,7,8], generating pollutant emissions and bad smells. Other applications for this material have been developed in recent years, such as the recovery of high-added-value compounds, including oligosaccharides, sugars (d-glucose and d-xylose), phenols compounds (antioxidants), bioethanol, xylitol, and furfural [9,10]. To date, thermochemical processes, such as pyrolysis, gasification, and hydrothermal carbonization (HTC), are in progress to eliminate the problem of uncontrolled emissions and to recover energy from EOP [11,12,13,14,15]. At a moderately high temperature (400–500 °C) under an inert atmosphere, carbonization (slow pyrolysis) appears as a promising way to convert EOP, mainly to biochar. Furthermore, recent experimentation of biochar in a DCFC system has proven to be a very attractive and eco-friendly technique for power generation, which has gained attention from scientists and engineers. Indeed, several carbon materials emitted from biomass have been examined as fuels in DCFC, which basically converts, at a high temperature (600–900 °C), the chemical energy stored in these biomass-based carbon materials to electricity through electrochemical oxidation reactions without a gasification or combustion process [16,17]. Compared to other fuel cell types, a DCFC system has a higher attainable efficiency (80%) for power generation and a lower emission of carbon dioxide per unit of the generated electricity [18]. In addition, such a system has an entropy term (ΔS) close to zero, explaining the 100% theoretical efficiency of the system [19]. DCFC can be categorized into three types according to the types of electrolyte materials employed: molten carbonates, molten hydroxides, and solid oxides. All of them require a high temperature (>800 °C) to achieve a promising DCFC performance. A DCFC based on solid oxide electrolyte is similar to a SOFC, but it is fed by solid carbon instead of hydrogen. Several studies have been conducted to analyze SOFCs’ short-term and even long-term durability, while few studies have been conducted to analyze DCFCs’ durability, with some studies being in an early stage. However, SOFCs suffer from poor robustness and durability in the presence of impurities, such as sulfur and chlorine [20,21]. DCFCs need to be durable in the presence of such impurities to effectively utilize solid carbon resources (such as coal, biomass, biochar, and wastes) as fuel. A test to achieve the maximum long-term durability for a DCFC was developed by Jiang et al. [22]. The cell was tested for 100 h in their study. It is noticeable that durability analyses of fuel cells have an important impact on the future of fuel cell technologies in terms of performance optimization and further development, commercialization, and deployment [23].
Several research works [24,25,26] tried to decrease the operating temperatures of DCFCs and SOFCs by using thinner electrolyte layers or employing low-temperature, solid ion-conducting materials. In this sense, a solid composite electrolyte composed of a molten salt phase, such as mixed carbonates, and an oxygen ion-conducting porous solid phase, such as samarium doped ceria (SDC), has been employed firstly for SOFCs and then adopted for DCFCs. The conductivity of this kind of composite electrolytes in an intermediate temperature (IT) range of 400 to 700 °C is around 10−2 to 1 S m−1 much higher than a conventional solid electrolyte in a solid oxide fuel cell and a molten electrolyte in a molten carbonate fuel cell (MCFC) [27]. The high conductivity of such a composite electrolyte has been explained by the enhancing effect of the co-ionic conduction in the two phases. SOFCs based on a composite electrolyte have shown remarkably good cell performance. Similarly, the operation of a DCFC at an intermediate temperature range (600–750 °C) has been investigated in order to overcome the problem of high temperatures [28].
One potential alternative electrolyte consisting of a mixture of samarium-doped ceria (SDC) and molten carbonate (Li2CO3/Na2CO3 in a mole ratio of 2:1) has received more attention, thanks to its double ionic conduction ability toward carbonate () and oxide () ions [17,19,28,29].
Anode reactions:
Cathode reactions:
When a DCFC is fueled by a biochar composed mainly of carbon, hydrogen, and oxygen (CxHyOz), other side reactions can take place within the anode. Indeed, it appears that the use of biochar as a direct fuel for DCFC systems demonstrates a peculiar behavior, notably within the anodic active electrochemical zone, regarding its heterogeneous elemental composition (CHO contents), and the presence of surface functional groups moves the anodic reaction mechanisms from a theoretically complete carbon oxidation reaction to a series of inter-related light gaseous and carbon oxidation reactions, apart from several side chemical reactions.
Effectively, through the biochar skeleton, various volatiles and light gases (CO, CO2, H2, and CH4) may be generated at a high temperature. The formed CO2 and H2O at the anodic active electrochemical reaction sites (AERS) can be directly used as a gasifying agent within the anode compartment and can further chemically react with solid carbon toward CO and H2 formation [29]:
Boudouard reaction:
Water shift reaction:
The latter reactions are strongly favored at a high temperature and present a key role in DCFC performance as their gaseous products (CO and H2) can easily diffuse and reach the reaction sites much more rapidly than solid carbon materials, contributing largely to power generation through the following reactions:
Based on these series of electrochemical reactions, the overall DCFC efficiency can be attributed mainly to CO and H2-AERS interactions, rather than to the extremely limited solid carbon-AERS contact [19,29,30,31].
Practically all the experimental and numerical studies on DCFC anode kinetic mechanisms affirmed that the hypothesized4-electron carbon electrochemical oxidation reaction (Equation (2)) is not sufficient to explain the recorded DCFC performance. The occurrence of a 2-electron CO oxidation (Equation (9)) and chemical Boudouard reaction (Equation (5)) is often illustrated. This chemical reaction is temperature and CO/CO2 content dependent. The reverse Boudouard reaction is known to be fast at 700 °C. However, in a molten carbonate medium, it exhibits a strange behavior. Its rate may be much slower. Meanwhile, the 2-electron CO oxidation (Equation (9)), which is a consequence of the occurrence of the reverse Boudouard reaction, is known to have a limited kinetic rate below 650 °C and a significantly accelerated rate starting from 700 °C. The backward sense of the latter electrochemical reaction can also possibly occur, increasing the CO concentration within the anode. In this sense, Chen et al. [32] developed a macro-homogeneous model to assess the kinetics of the three aforementioned reactions and their dependence on several properties, such as anodic bed thickness and carbon conductivity. They concluded that the electrochemical mechanism is approximately three times as fast as the chemical reverse Boudouard reaction near the anodic current collectors.
Various research studies have focused on the investigation of biomass-based carbon materials’ potential as fuels in DCFCs to reveal their efficacy as energy carriers. It has been found that both the performance and lifetime of DCFCs are notably affected by the physico-chemical properties of biomass-based carbon fuels [18,31,33]. Actually, the recorded low performance of biochar-fueled DCFCs hinders their further development.
Wang et al. [34] assessed the potential of reed biochar as a fuel in a direct carbon fuel cell based on a SDC-carbonate composite electrolyte and achieved the best maximum power density of about 378 mW·cm−2 at 750 °C to date. They obtained this promising performance after using a KCl-washing pre-treatment on the raw biomass before pyrolysis. The effect of KCl washing in raw reed increased the structural disorder degree of the biochar during the pyrolysis process, leading to a high oxidation activity of the reed biochar and, subsequently, a good DCFC performance. KCl is known as one of the chemical activating agents used in the preparation of activated carbons for energy storage applications, such as supercapacitors and batteries [35,36]. KOH, H2SO4, and ZnCl2 are other types of agents that can contribute to the activation of biomass precursors. These chemical agents ensure an increase in total porosity and micropore development, as well as an increase in the yield of the activation process. Gómez et al. [37] proposed a reaction mechanism, which was validated by mass spectroscopy analysis and thermodynamic calculations, to carry out activation through the use of a mixture of KOH and KCl. They concluded that the role of KCl consists of arise in the solubilization of carbonates that precipitate in its absence, hence lowering the contact between the liquid KOH and the carbon particles. They affirmed that the use of KCl as an additive results in the synthesis of activated carbons with lower amounts of KOH, which are, therefore, more available to be produced at large scales. Jayakumar et al. [38] achieved 360 mW·cm−2 at 700 °C with sugar char as a fuel when using a molten antimony anode. Cai et al. [39] used a biochar derived from orchid tree leaves as fuel. They showed that the high content of CaCO3 in the leaf biochar catalyzes the reverse Boudouard reaction and enhances the performance of DCFCs. Hao et al. [40] also found that carbon from magazine waste paper contains a high amount of magnesium calcite, which improves the thermal reactivity of the carbon materials. Chien and Chuang [41] used coconut coke as a fuel for an anode-supported DCFC and recorded a maximum power density of about 80 mW·cm−2 at 800 °C. They affirmed, through CO and CO2 pulse transient studies, that the increased cell performance was attributed to an increasing extent of electrochemical oxidation of CO, a product of the Boudouard reaction. Hao et al. [42] tested a DCFC with bamboo carbon as fuel and recorded a maximum power density of 156 mW·cm−2 at 650 °C. They concluded that the inherent impurities, such as calcite (CaCO3) and kaolinite (Al2Si2O5(OH)4), in the biochar might favor its thermal gasification and resulted in the enhanced performance of the intermediate-temperature DCFC. Elleuch et al. investigated almond shell (AS) [19] and olive wood (OW) [29] biochars as fuels in DCFCs supported by a 0.65 mmthick Ce0.8Sm0.2O1.9 (SDC)-carbonate composite electrolyte layer and recorded a maximum power density of 107 and 105 mW·cm−2, respectively, at 700 °C. They claimed that the high concentration of oxygen-containing groups is the main reason for the higher performance recorded, when compared to activated carbon. They also concluded that alkali and alkaline-earth metal oxides, such as K2O, Fe2O3, and CaO, worked as the active catalysts for the anodic reaction by decreasing the electrochemical activation polarization in the case of the AS biochar. It is known that gasification reactions take place below 800 °C [43], and the gasification of carbon fuel is the limiting factor of DCFC performance when operating at a higher temperature range. The kinetics of these reactions can be catalyzed using several catalysts. Meanwhile, it has become a consensus that the alkali metal, alkaline earth metal, and transition metal are effective catalysts for carbon gasification [44,45,46], which are widely used in coal gasification research to obtain a competitive reaction rate at a lower temperature.
Li et al. [43] tested Ni, K, and Ca catalysts and claimed that all of them are suitable gasification catalysts to accelerate the carbon gasification rate, reduce the reaction temperature of the DCFC, and, thus, improve the cell performance. Cui et al. [27] tested the effect of carbonate as a catalyst and affirmed that it can also play a catalytic role in carbon gasification reactions. Tang et al. [47] used gadolinium-doped ceria (GDC) mixed with silver as the anode to catalyze the electrochemical oxidation of CO, while a Fe-based catalyst was loaded on the carbon fuel to enhance the Boudouard reaction. They mentioned an enhancement of about 10 times higher than that of a cell without any catalyst. Recently, a strontium slag and its derived catalyst were successfully introduced with the carbon materials at the anode in order to enhance a DCFC’s performance by promoting the reverse Boudouard reaction [48]. Yu et al. [49] used corncob biochar as fuel and a single cell similar to the one used by Elleuch et al. [19,29], but with adding a printed anode layer (a mixture of NiO and SDC). They showed a maximum power density of 185 mW·cm−2 at 750 °C.
The main objective of the present research is to explore the electrochemical capability of EOP biochar as fuel in a direct carbon fuel cell (DCFC), using an experimental correlation between the DCFC’s power output and the physico-chemical properties of the fuel, in order to determine the main EOP biochar limiting properties when it is used as a fuel for DCFCs. A series of physico-chemical analyses are investigated for this purpose. Furthermore, the DCFC’s chemical/electrochemical mechanisms are predicted with respect to the EOP biochar’s physico-chemical properties and compared to similar DCFC configurations, which have successfully operated with other biochar fuels when prepared under the same conditions [19,29].
2. Materials and Methods
2.1. Raw Material
The exhausted olive pomace (EOP) used in the present study was recuperated from an extraction factory at Sfax city in Tunisia. The tested EOP sample is a mixture of residues of olive stones and olive pulp extracted from both traditional olive pressing and 3-phase centrifugation systems, followed by solvent extraction using n-hexane for olive pomace oil recovery.
The EOP was sieved using a 10–20 mesh (2.00 ± 0.85 mm) particle size. The sample of EOP was shipped to Galbraith Analytical Laboratory, (Knoxville, TN, USA), where it was analyzed to determine its elemental compositions and to estimate the high and low heating values. For the determination of lignin, cellulose, and hemicellulose, the first removal of soluble extractives was performed according to the standard TAPPI T-264 cm-97 [50]. Then, lignin and cellulose were determined according to the standard TAPPI T 222om-83 and TAPPI T 203 os-74, respectively [50], and holocellulose was determined according to Browning [51]. Hemicellulose concentration was calculated as the difference between holocellulose and cellulose. Ash content was determined according to the ASTM D 482. A proximate analysis (moisture and volatile matter) was performed using a Thermogravimetric Analyzer TGA Labsys (Setaram Instruments, Paris, France). About 20 mg of the sample was loaded into a platinum pan and heated at 20 °C min−1 until 600 °C under a nitrogen atmosphere (nitrogen flow rate of 40 mL·min−1). The weight loss from 30 to 150 °C was due to the moisture content; from 150 to 600 °C, it was due to the volatile matter content. The residual mass was assigned to a mixture of fixed carbon and ash. Fixed carbon was determined by the difference. The analytical results are summarized in Table 1.
The high heating value (HHV) of the EOP biomass feedstock is determined using the modified Dulong’s formula based on the following equation [52]:
where C, H, O, and N are the carbon, hydrogen, oxygen, and nitrogen contents (wt%), respectively.
The low heating value (LHV) is calculated as a function of the HHV and the hydrogen content [52]:
2.2. Carbonization Pilot Plant Description
The EOP carbonization was carried out in a pilot plant installed at ENIS, which is illustrated in Figure 1. It includes a metallic pyrolysis chamber connected to a combustor of recycled carbonization volatiles that are transported by two insulated gas channels. The combustor is connected to a heat exchanger, which heats the carbonization chamber through hot combustion gases. The carbonization temperature is controlled by a thermocouple. The carbonization chamber was filled with about 50 kg of the EOP and then underwent a first pre-heating step using a gasoline burner in order to carry out the drying phase of the EOP biomass. From a temperature of about 400 °C, the EOP biomass was decomposed, and the carbonization volatile gases, which were generated from the carbonization chamber and circulated through the insulated gas channel, replaced the gasoline and ensured the auto-feeding of the flame in the combustor. The EOP biochar was recuperated at the end of the carbonization experiment within the carbonization chamber. This carbonization experimental procedure took around 4 h.
2.3. Physico-Chemical Characterization of the EOP Biochar
Determining the elemental composition is a crucial analysis to be carried out for a biochar, which could be used, thereafter, as a fuel, to predict its heating capacity, combustion performance, and exhaust emissions. The percentages of C, H, N, and S (CHNS) of the biochar were determined using the Vario Micro Elementar CHNS system. The oxygen content was calculated by the difference.
The HHV of the biochar was calculated using Equation (11). The volatile matter, moisture, and ash content of the EOP biochar were determined using a thermogravimetric analysis and the ASTM D 482, respectively. XRF was carried out using the S4 Pioneer system in order to determine the chemical composition of the EOP biochar ash. X-ray diffraction (XRD) analysis was performed in order to identify the crystal structure of the EOP biochar, using a Philips X’pert Pro super Diffractometer with monochromatic Co Kα radiation in the 2θ range from 10° to 80° at a scanning rate of 2°·min−1. The layer dimension perpendicular to the basal plane, Lc, of the EOP biochar was obtained from the (002) reflection angle following the Debye–Scherrer equation, whereas the d-spacing was determined according to the Bragg formula, with n being equal to 1 and θ representing the (002) reflection angle [18].
The porous morphology of a biochar is an important property to investigate, considering its relationship to the surface area, the distribution of the pore’s diameter, its porosity, and the effect of these parameters on gaseous species absorption.
Representative SEM showing the primary particle sizes of the EOP biochar was recorded using a Hitachi S-4800 scanning electron microscope. In addition, an Autopore IV 9500 mercury porosimeter (Micrometrics, York, PA, USA) was used to measure the pore volume distribution, the surface area, and the porosity of the EOP biochar by measuring the amount of mercury penetrating into the sample pores [53].
The temperature-programmed oxidation analysis (TPO) of the EOP biochar sample was carried out using a thermobalance (NETZSCH STA, 449F3) with an air flow of about 80 mL·min−1 at the standard conditions of temperature and pressure (STP) and at a heating rate of 10 °C·min−1. The temperature ranged from room temperature to 1000 °C.
The EOP biochar’s chemical functional groups were identified by FTIR analysis using a Nicolet 380 spectrometer (Thermo-Scientific, Waltham, MA, USA) in the range of 4000–400 cm−1. The standard IR spectra of hydrocarbons were used to identify the functional groups of the biochar components.
2.4. Electrochemical Test of the EOP Biochar in Direct Carbon Fuel Cell
The direct carbon fuel cell (DCFC) used in this study was similar to the one employed in our previous works [19,29]. Samarium-doped ceria (SDC) combined with molten carbonate (MC) consisting of a Li2CO3/Na2CO3 (Chemical reagent, Tianjin, China) eutectic mixture in a mole ratio of 2:1 was used as the electrolyte material. The SDC sample (Ce0.8Sm0.2O1.9) was synthesized via an oxalate co-precipitation process. All the chemicals were used as received without further purification. The stock solution was made by mixing and dissolving 60.3913 g of cerium nitrate hexahydrate (Ce(NO3)3·6H2O, 99%, Chemical reagent, Tianjin, China) and samarium nitrate hexahydrate (Sm(NO3)3·6H2O) in 100 mL of distilled water. A total of 6.0624 g of samarium oxide (Sm2O3, 99.5%, Chemical reagent, Tianjin, China) was dissolved in 10 mL of nitric acid (Chemical reagent, Tianjin, China) and 15 mL of distilled water to obtain samarium nitrate. Aqueous oxalate acid solutions (H2C2O3·2H2O, Chemical reagent, Tianjin, China) with a concentration of 0.1 mol·L−1 were used as the precipitant. In a typical synthetic procedure, 550 mL of distilled water mixed with the oxalate acid solution (Chemical reagent, Tianjin, China) was dripped at a speed of 3 mL min−1 into the precipitant solution under 250 rpm vigorous stirring at room temperature to form a white precipitate. The resultant suspension, after homogenizing for 1 h, was filtered via suction filtration. The precipitate cake was washed repeatedly with distilled water and ethanol, followed by drying at 100 °C for 24 h to obtain the SDC precursor. The obtained SDC precursor was sintered at 700 °C for 2 h to form a pale yellow SDC powder (Ce0.8Sm0.2O1.9). The binary carbonate powder, i.e., Li2CO3/Na2CO3 in a mole ratio of 2:1, was prepared. The composite electrolyte material powder was obtained through mixing the two powders (carbonate powder and SDC powder) in a weight ratio of 3:7 by ball milling for 2 h.
The used composite cathode powder consisted of 30 wt% composite electrolyte and 70 wt% LixNi1−xO powders. The composite cathode powder was also prepared through 2 h ball mill mixing, sintering at 700 °C for 2 h, and grinding. The lithiated nickel oxide (LixNi1−xO) was prepared through 2 h ball mill mixing of NiO with lithium hydroxide monohydrate (LiOH·H2O, 90%, Chemical reagent, Tianjin, China) powders in a 1/1 mol% ratio, sintering at 700 °C for 2 h, and grinding. The fine NiO powder was produced through heating a proper amount of Ni(NO3)2·6H2O (99%, Chemical reagent, Tianjin, China) powder at 700 °C for 2 h until it combusted.
The SDC/MC powder (0.25 g) was first uniaxially pressed in a die at 1 MPa for 60 s to form yellow electrolyte discs. A total of 0.15 g of the composite cathode powder (LixNi1−xO-SDC/MC) was added using a 60-mesh sieve to the electrolyte discs. Then, a single isostatic pressing at 500 MPa (30 kpsi) was performed for 30 s to form the DCFC cell pellet. The cell pellet was then sintered at 700 °C for 2 h in air. The sintered DCFC pellet had a diameter of 13 mm and was 1 mm thick. Silver paste was brush painted on both sides of the pellet for the current collection. The experimental protocol of the DCFC pellet preparation is described in Figure 2.
The obtained pellet was mounted in a stainlesssteel cell holder (Figure 3) serving for the current collection and for gas distribution. The DCFC pellet was placed with the cathode downwards and then sealed into a tubular furnace controlled by a K-type thermocouple.
Typical carbon material loading was 300 mg for the EOP biochar fuel. The obtained EOP biochar from carbonization was ground and sieved between 40 and 60 meshes to fit the application condition as a fuel in a DCFC system. A sealant was cured in situ during the heating of the cell to isolate the cathode and anode chambers. The fuel chamber was continuously purged under nitrogen at a 100 mL·min−1 flow rate. The cell temperature was raised to 100 °C in an ambient air environment in order to ensure seal formation. Then, the inert gas purge was started, and the temperature was increased up to 700 °C. The cell was held at this temperature to assess the electrochemical performance of the DCFC fed by the EOP biochar. The cathode chamber was fed by a mixture of O2 (60 mL·min−1) and CO2 (120 mL·min−1). A Versastat 3 Potentiostat-Galvanostat equipped with the Versastudio software for automatic data collection was used to generate the DCFC cell polarization curves.
3. Results and Discussions
3.1. Feedstock Characterization
The physico-chemical properties of the EOP raw materials are significantly important for the assessment of their byproduct potential and quality. Proximate and ultimate analyses are among the easiest ways to study the fuel characteristic of solid materials. The results of these analyses are presented in Table 1.
The EOP biomass feedstock is mainly composed of carbon (39.45%) and oxygen (41.2%), with a low percentage of nitrogen (2.68%) and nearly no sulfur content (<0.8%). The EOP biomass composition aligns with other solid wastes reported in the literature [53].
Based on the elemental composition results, the approximate molar chemical formula of the EOP biomass is CH1.69O0.78N0.058.
The proximate analysis results show that the EOP contains 7.31%, 56.5%, 10.91%, and 25.28% of moisture, volatile matter, ash, and fixed carbon, respectively (Table 1). The values obtained from the proximate analysis are in the range reported for most agricultural and forest wastes [54,55].
The chemical analysis (Table 1) also shows that the EOP has higher lignin content (49%) than cellulose and hemicellulose contents (holocellulose) (40%). This finding is in line with that reported by Jauhiainen et al. in [5,9], which means that the EOP has a different nature then common biomasses and wastes.
The high heating value (HHV) of the EOP (14.43 MJ·kg−1) is also in the range of reported HHV for other biomass feedstocks (11–40 MJ·kg−1) cited in the literature and used as fuels [56].
3.2. EOP Biochar Characterization
In this section, the deep characterization of the physico-chemical and structural properties of the EOP biochar are presented, aiming to assess its possible application as a fuel in a DCFC system. The performance and the durability of DCFCs are dependent on biochar properties. Some properties appear as inhibitors, whereas others are favorable for the electrochemical conversion of biochar in DCFCs.
The ultimate analysis of the EOP biochar is also presented in Table 1 in comparison with the raw material. Carbon, as the main element in the obtained biochar (65.7%), is present in significantly high amount compared to the EOP biomass feedstock (39.45%). However, the oxygen (29.97%) content significantly decreases in comparison to the EOP raw material (41.2%). The low oxygen content in the EOP biochar sample is due to the dehydration and decarbonylation/decarboxylation reactions occurring during carbonization. The nitrogen and sulfur contents in the EOP biochar are low (0.89% and 0.08%, respectively) but still in an acceptable level for fuel application. Nitrogen and sulfur in the EOP biochar can be considered as impurities that may affect the DCFC performance negatively [57,58]. The atomic ratios of hydrogen to carbon (H/C) and oxygen to carbon (O/C) are considered to be important indicators of a fuel’s quality. It is observed that the H/C and O/C ratios of the EOP biochar are lower than those of the raw EOP biomass. These lower values are due to the increase in carbon content and the decrease in oxygen and hydrogen contents during carbonization due to dehydrogenative polymerization and dehydrative polycondensation reactions [58]. In fact, the low H/C ratio (0.62) of the EOP biochar is indicated on its structural modification, which shifts to a higher content of aromatic compounds that are more resistant to thermal degradation and, thus, remain recalcitrant [59].
When neglecting the biochar’s sulfur content, the approximate molar chemical formula of the biochar can be expressed as CH0.62O0.34N0.01.
On the basis of the dry biochar elemental composition, the HHV is calculated using Equation (11) and is found to be equal to 22.21 MJ·kg−1. The HHV of the EOP biochar is higher than the EOP biomass and most coals, confirming its potential use as an energy source.
The proximate analysis of the EOP biochar (Table 1) shows a high ash content (21%) and a low moisture content (1.38%). However, the volatile matter and fixed carbon contents of the EOP biochar are 46% and 31.62%, respectively. The EOP biochar exhibits a high content in ash (21.55%), compared to only 6.4% in the case of AS biochar [19] and 7.49% in the case of OW biochar [29]. The ash content increases after the carbonization of the EOP biomass (Table 1), which follows the same tendency of all carbonized biomasses. Considering the ash content, the literature has the unanimous idea that low ash content is desirable for biochar utilization as a fuel in DCFC systems. The mineral matter forming the ash reduces the lifetime of a DCFC by blocking the active reaction sites of the anode, but it is important to note that some mineral impurities, which derive from the biochar fuel source, are considered as inhibitors, while other minerals act as catalysts for the DCFC electrochemical and chemical reaction processes [19].
An analysis of ash composition is critically recommended in order to check if an EOP biochar falls under the IBI standards, which states that, “because of the known presence of heavy metals and organic pollutants in bio-solids, care must be taken during thermochemical conversion to avoid harmful air emissions as well as the accumulation of toxicants in the final carbonaceous skeleton of EOP biochar [60]”. In addition, the composition of minerals is crucial to analyze before using a biochar as a fuel in a DCFC system, as previously revealed. Rady et al. [61] mentioned that Al2O3 and SiO2 act as the main inhibitor for the DCFC electrochemistry. However, systematic studies on the effects of these species at various concentrations are required before they can be accurately categorized as either inhibitors or catalysts and to know the extent of their inhibitive or catalytic effects.
An investigation of the ash composition was carried out using XRF analysis; the results show that the EOP biochar contains a high amount of silica compared to the alkali and alkaline earth metals (Mg, Ca, K,…) (Table 2), together representing more than 30% of the ash composition. Si is the dominant compound in the EOP biochar (55.21%), followed by Ca (16.3%) and K (13.72%), but Al is present with a low percentage fraction of about 1.79%.
The high content of SiO2 may cause passivation in the DCFC and an instability in the electrochemical performance of the cell regarding its inhibitive character. This finding has been confirmed by Vutetakis et al. [62], who studied the effects of various mineral impurities on a fluidized bed DCFC and observed a sharp drop in current at high over-potentials, which was explained by the passivation of electrodes since a film was formed on their surfaces due to dissolved Al2O3, SiO2, and TiO2 from the coal ashes.
At a low gasification temperature (about 700 °C), it has been confirmed that a silica structure keeps its physical criteria but undergoes chemical changes through the presence of alkali metals [63]. In a biochar containing very high silica contents, such as rice husks and bagasse, alkali silicates may be formed through the reaction of silica with alkali metals. These resulting silicates are mesoporous with a limited surface area and can be induced in some other way to have a limited pore volume, as present in the residual biochar. It was also demonstrated that progressive heating of these silicates revealed the ability of trapping coke deposited within the pore media. As a result, the ash residuals showed significant organic contents, even after extensive additional oxidation in air [64].
Furthermore, alkali and alkaline earth metals are identified as effective catalysts for some chemical reaction mechanisms in several applications, such as gasification [64], insitu catalytic fast pyrolysis [65], and even in a DCFC application.
Indeed, the presence of alkali and alkaline earth metals promotes the water–gas shift reaction under the gasification process and enhances the yield of H2 and CO2. Additionally, they not only boost the breakage and decarboxylation/decarbonylation reaction of the thermally labile hetero atoms of tar, but they also enhance the thermal decomposition of heavier aromatics. These impurities could also significantly enhance the decomposition of levoglucosan. It has been proven that alkaline earth metals show greater effect than alkali metals for these series of decomposition reactions, as reported previously.
Figure 4 presents the X-ray diffraction (XRD) patterns of the EOP biochar, which was performed to investigate its crystallographic structure and disorder.
The pattern of the EOP is different from other biochars prepared under similar carbonization conditions [19,29] as it presents a series of sharp peaks at different diffraction angles, confirming the existence of high inorganic material content in the EOP biochar, including mainly silica (SiO2), sylvite (KCl), calcite (CaCO3), and dolomite (CaMg(CO3)2). The obtained XRD pattern of the EOP biochar sample has a similar trend to the XRD patterns reported by other researchers, who used a different feedstock, such as wood, grass, corn straw, peanut straw, and claimed that the high numbers of observed peaks is ascribed to various crystal components [66,67,68]. For example, peaks at 2θ = 20.88 and 25° were designated as silica, while the peak at 2θ = 50.18° was designated as feldspar in a raw silica sample [69]. Thus, a comparison of the EOP biochar pattern with the Powder Diffraction and Standards (PDF) was conducted to identify the corresponding peak of each mineral.
The XRD pattern of the EOP biochar indicates similarity in the broad peak corresponding to the (002) graphitic basal plane reflection of graphite. This peak exists at around 2θ = 25°, slightly shifting from the peak location of graphite commonly found at 26.5°, thus indicating the amorphous and turbostatic structure of the EOP biochar. The shift was also reported by Konsolakis et al. [31] when investigating the XRD patterns of biochars from pistachio shells, pecan shells, and sawdust.
The XRD arrangement for AS biochar [19], OW biochar [29], and corn cob biochar [49], in comparison to graphite, also demonstrate one distinct peak at 2θ = 29°, 26°, and 24°, respectively. This peak corresponds to the (002) reflection, and its presence has been revealed at comparatively lower values when compared to graphite, proving that the latter three biochar samples exhibit a crystallographically disordered structure similar to the EOP biochar investigated here.
In the case of the EOP biochar, this peak intensity is weak due to the overlap with the intensive peak of silica seen at the same diffraction angle range. This is expected due to the high content of silica present in the EOP biochar, as reported in Table 2. Meanwhile, this behavior was previously reported by Ahmad et al. [69] in their XRD analysis of date palm waste biochar and its derived composite made of the same biochar mixed with silica. The peak of (002) graphitic basal plane depicted in the case of the biochar pattern is totally removed in the case of the silica-composited biochar pattern.
The quantitative crystallite parameters of the EOP biochar, including the interplanar distance (d002) and the stacking height (Lc), are also shown in Table 3. The obtained value proves the turbostatic structure of the EOP biochar as the d002 value (0.3622 nm) is slightly higher than the graphite d002 value (0.36 nm), and the Lc (24.02 nm) is much higher than the Lc (13.8 nm) value assigned to graphite.
The electrochemical reactions taking place in the DCFC anode occur predominantly on the carbon surface, which is generally represented by the pore walls. A higher porosity of carbon materials implies an extended specific surface area and, subsequently, more available reaction sites for electrochemical reactions and better DCFC efficiency. This provides major advantages for the biochar over other fuels with a smooth surface area, such as graphite and raw biomass. In this context, the N2 BET adsorption technique was performed on the EOP biochar; unfortunately, the obtained result does not permit the prediction of its micro-structural properties. This could be due to the mesoporous and macroporous structure of the EOP biochar. Micropores will be filled in a single step over a narrow range of relative pressure before the formation of a monolayer coverage on the biochar surface. This will disturb the adsorption of N2 and, subsequently, does not give useful data. This EOP biochar porous structure may be related to the operating conditions of the carbonization experiment being carried out at 400 °C for four hours. It is evident that, as carbonization temperature increases, pore blocking substances are driven off or are thermally cracked, thus increasing the externally accessible surface area [70]. However, the extended carbonization holding time (4 h) used in this study can have the opposite effect since the reactions continue at the pore surface area, causing a decrease in micropores and a shift toward meso- and macropores [70].
The scanning electron microscopy (SEM) images of the EOP biochar sample are shown in Figure 5a,b. The SEM images of the biochar produced from EOP pyrolysis at 400 °C show a hardly visible porosity (Figure 5a). The presence of crystalline phases with cubic, tubular, and elongated shapes on the particle’s surfaces show that the particles are rough and grainy. The pore sizes are not uniform and are in the range of tens of nanometers to microns (Figure 5b).
The mercury intrusion porosimetry was used in this study as a complementary technique to obtain a better textural characterization of the EOP biochar. Figure 6 displays the log differential mercury intrusion volume as a function of the pore diameter of the EOP biochar. Indeed, the EOP biochar presents a porosity in the mesopore–macropore range; more specifically, it is an inter-particle porosity due to the high pore size diameter (6 nm up to 3000 nm) (Figure 5), at which the mercury intrusion occurs [71]. This finding is aligned with the SEM micrographs presented above. The pore structure and the pore size distributions are summarized in Table 3. The recorded relatively low surface area observed for the EOP biochar (52.495 m2·g−1) is probably due to the inorganic materials, mainly silica particles, that partially fill or block the micropores.
Temperature programmed oxidation (TPO) is an efficient tool to evaluate the relative activity of carbon oxidation. The weight loss curve of the EOP biochar is shown in Figure 7.
Based on the TPO results of EOP biochar, four stages are depicted, indicating the presence of four forms of carbons with different resistance to oxidation. The initial small weight loss below 150 °C is caused by the desorption of physiosorbed water within the EOP biochar and the oxidation of volatile organic C (Stage I). A small weight loss is observed below 380 °C due to the rapid release of combustion gases from the superficial oxygen functional groups (Stage II). This could be related to the oxidation of labile organic carbons, such as aliphatic carbon. In addition, a significant weight loss in the EOP biochar starts from 380 °C and ends at around 650 °C (Stage III). During this stage, the oxidation of recalcitrant organic carbons (predominantly formed by lignin and recalcitrant carbon, such as aromatic carbon) and refractory organic carbons (poly-condensed forms of aromatic carbon) occurs between 380 and 475 °C and between 475 and 650 °C, respectively. From 650 °C to 1000 °C, inorganic carbons (carbonates) are oxidized (Stage IV).
Compared to the TPO curves of graphite, the onset of stage III of the EOP biochar is much lower than that of graphite, which starts at 650 °C [72]. Moreover, the offset of this stage for EOP biochar ends earlier compared to graphite (850 °C). The enhanced thermal stability of the EOP biochar in air can be assigned to its lower graphitic degree and crystallinity, which confirms the findings observed in its XRD analysis.
FTIR spectroscopy was performed in order to analyze the surface functional groups of the EOP biochar, aiming to assess its stability. The EOP biochar FTIR spectrum is shown in Figure 8.
The broad band at 3400–3200 cm−1 indicates the presence of O-H stretching vibration. The bands at the region between 3000 and 2800 cm−1 are related to the presence of aliphatic C-H stretching vibrations. The bands at 1600–1500 cm−1 denote the presence of aromatic C=C ring stretching. The bands at 1405 cm−1 and 1318 cm−1 are assigned to the O-H bending vibrations in acid, alcohols, and phenol groups. The band at 1016 cm−1 indicates the C-O stretching vibrations in carbonyl compounds, such as alcohols, phenols, ester, ether, and acid. The bands at 900–600 cm−1 are related to the C-H bending vibrations in aromatic hydrocarbons. This analysis shows that the derived EOP biochar structure is mainly composed of aromatics, which explain the lower value of the H/C ratio reported in Table 1.
3.3. Feasibility Testing of the EOP Biochar as Fuel in DCFC
The direct carbon fuel cell voltage versus current density curve and the power density versus current density curve of the EOP biochar are shown in Figure 9, in comparison to the performances recorded for the DCFCs fed by biochars from almond shell (AS) [19] and olive wood (OW) [29] that were prepared under the same carbonization process.
The DCFC pellets used for testing the electrochemical performance of the EOP biochar sample are also the same as those used for the AS and OW biochar tests in terms of electrolyte and cathode materials, cell geometry, gas flow rates, and operating temperature (700 °C) [19,29]. On the basis of the experimental observation after the cell tests, in the case of the EOP biochar, the fuel utilization must be reduced in comparison to the case of the AS and OW biochars tested in previous works. This could be related to the high content of ash. This result is in agreement with the literature [73,74]. In the case of corn straw carbon, Li et al. [73] noted a better fuel utilization rate and a lower weight of remains after discharging in the DCFC anode, which contains only 1.6 wt% of ash.
The obtained results prove the feasibility of DCFC operation by using the EOP biochar as a fuel, showing an open circuit voltage of 0.8 V, a peak power density Pmax of about 10 mW·cm−2, and a limiting current density of 142 mA·cm−2 at 700 °C. The main useful criterion of the evaluation of DCFC electrochemical performance and quality is the achieved maximum power density. The recorded Pmax of about 10 mW·cm−2 in this study can be considered as promising if compared to the reported power densities of several biochars from pistachio shells (3.7 mW·cm−2), pecan shells (3.2 mW·cm−2), and sawdust (1.4 mW·cm−2),which were all tested in DCFCs at 700 °C [31]. Nevertheless, this performance appears so modest compared to those obtained by the AS and OW biochar-fed DCFCs reported in Figure 9, which exhibited a performance 10 times higher than that of the EOP biochar.
It is worth highlighting that four peculiar phenomena are observed in the recorded performance curve, including the low OCV value, the high activation loss at low current densities, the limited peak power density (Pmax), and the reduced limiting current density (ilim). We have to address the physico-chemical properties of the EOP-derived biochar sample that are certainly the cause of these phenomena, as previous characterization have demonstrated some peculiar properties when compared to other biochars prepared under the same carbonization conditions, such as AS and OW biochars [19,29]. This difference is certainly related to the raw biomass’s material properties and the kinetics of the complex chemical degradation reactions occurring during the carbonization process.
Several researchers proved that the overall DCFC efficiency is ascribed mainly to the gas–active electrochemical zone interactions, rather than to the extremely pure carbon–active electrochemical zone contact. The reverse Boudouard reaction (Equation (5)), which represents the main non-electrochemical reaction possible to occur at high DCFC temperatures (>700 °C), has a determining role in the DCFC performance as its gaseous product (CO) can readily diffuse within the active electrochemical reaction site at a considerably faster rate than solid carbon, contributing highly to the enhancement in the power output. In addition to CO gas, the in situ generation of hydrogen (H2) is another key point when the DCFC is fed by hydrogenated carbonaceous materials and is also a cause of the high values of DCFC power densities.
In this context, one of the carbonaceous material’s properties that can affect the Pmax recorded by DCFCs is the carbon content. A biochar containing low carbon generates low amounts of obstructive matters (CO and CO2), which potentially affects the pathways of chemical and electrochemical reactions occurring in the cell anode. The carbon content in the EOP biochar sample (65.7%) is lower than that of the AS biochar (71.8%) [19] and that of the OW biochar (84.07%) [29], which could be one of the causes of the limited performance recorded by the DCFC fed by the EOP biochar. Indeed, the EOP low carbon content may hinder and reduce the amount of CO2 and CO gases produced in situ at the anode compartment, subsequently limiting the extent of the CO electrochemical reactions within the anode of the DCFC (Equations (9) and (10)).
Additionally, another biochar property, which may explain the limited power density recorded in this case study, is related to the proximate composition, which has a direct effect on the evolved gases emitting off from the carbonaceous skeleton via thermal cracking reactions. Nevertheless, the literature shows that there is no consensus on the influence of biochar volatile matter content on DCFC performance. Chien et al. [75] reported that a high content of volatile matter causes a limitation in DCFC performance, while a medium volatile matter content is more appropriate for the use of a biochar as fuel in the DCFC. In contrast, Kaklidis et al. [30] affirmed that the volatile matter content greatly improves the electrochemical output of DCFCs.
Fuel ratio is a ratio of the amount of fixed carbon to volatile matter and is a distinctive feature of solid fuels, which can be used to categorize them as a coal rank according to the ASTM 388 [33]. Compared to the OW and AS biochars [19,29], which have a respective fuel ratio of about 0.563 and 0.245, the EOP biochar has a higher fuel ratio (0.897) as its fixed carbon is relatively high (about 36.45%), whereas the volatile matter is limited (40.62%). The improved fuel ratios of biochars are known to be significant, indicating greater combustion efficiencies and reduced pollutant emissions during the burning process of biochars, when compared to the burning of their raw forms. Contrarily, it appears that in the case of DCFCs, lower fuel ratio in the biochars is a preferred property for better cell output.
Additionally, the original lignocellulosic composition of the biomass can provide insight into the mass yield of the produced biochar through pyrolysis and, subsequently, its performance as a fuel in a DCFC system.
According to the DCFC performance recorded for the EOP biochar, the biomass composition is dominated by lignin, rather than by holocellulosic content, which is not preferred despite its potential in increasing the yields of the biochar. Correspondingly, the high ash content in the biomass favors charring reactions rather than devolatilization reactions [76], leading to an enhancement in the yield of the biochar.
Seeing that the objective is not focused on the biochar quantity produced from a biomass but rather its quality and potential to be electrochemically active, leading to a promising cell output, we notice that a biomass with a high lignin and ash content is not preferred in the production of a biochar fuel for DCFC systems.
Moreover, the crystallographic structure of carbonaceous materials is a key property over others that directly affects the electrical conductivity and the reactivity of biochars. A high degree of order in the structure provides enhanced electrical conductivity. We should keep in mind that when carbon is applied as fuel in a DCFC, the reactivity, which is known to be higher in non-graphitic structures, is more important than high electrical conductivity values [77]. It is often stated in the literature that the electrical conductivity of solid carbonaceous materials is not correlated with the DCFC power output, regardless of the diversity of anode configurations. Logically, higher electrical conductivity values are generally recorded for graphitic or crystalline structures of carbon materials, which should induce a reduced global DCFC ohmic resistance and, consequently, a better DCFC performance. Unfortunately, that has never been observed when these high-ordered carbon materials were employed as fuels in DCFC systems. The need for crystalline carbon materials was revealed when using carbon materials simultaneously as the anode, the current collector, and the fuel in a few DCFC configurations. In contrast, when using an anode current collector (silver for example) to collect electrons, the dependence of the cell performance on the electrical conductivity of carbon materials was more curtailed.
Meanwhile, the crystalline structure of solid carbon materials has often been measured using XRD analysis. Chien et al. [41] reported that a DCFC’s electric power generation and long-term stability have a strong correlation with the crystalline structure of solid carbons. A high power density and good stability are obtained when using less crystalline carbon, which is characterized by a broad (002) diffraction peak et 2θ = 20–30° on the XRD pattern.
In this study, the obtained XRD pattern of the EOP biochar demonstrates a high number of peaks, which is different to the AS [19] and OW [29] biochar patterns that exhibit only two peaks. As previously mentioned, the EOP biochar has a high ash content, which explains the diversity of peaks recorded as belonging to silica, dolomite, sylvite, etc. This represents one of the features of a low reactive carbon material and explains the low recorded peak power density value. Based on the limited performance recorded by the DCFC fed by the EOP biochar (Figure 9), it is shown that the biochar’s disordered structure is not sufficient to judge its potential as fuel in a DCFC system, but it is necessary to assess more of its content in terms of mineral crystalline materials.
More specifically, the presence of silica is a cause of the low EOP biochar reactivity and conductivity to electrons because the silica non-crystalline particles act as insulators to electron transfer and as inhibitors to electrochemical oxidation reactions.
As previously mentioned, the reactivity of carbon materials appears to be a key property affecting the maximum power value (Pmax) generated by the DCFC. This is evidenced through the results obtained by TPO analysis. The reactivity of the EOP biochar is also lower than that of the AS and OW biochars and can be considered as another reason for the limited DCFC performance shown in Figure 9; stage III of the EOP biochar’s TPO profile (Figure 6) starts at almost the same temperature as the AS and OW biochars but ends later at about 650 °C in comparison to 580 °C and 590 °C in the case of the AS and OW biochars, respectively.
Eom et al. [78] affirmed that the ratio of total oxygen to carbon, i.e., surface functional groups containing oxygen, has the dominant effect on the electrochemical reaction relative to the surface area in a DCFC. However, in our case, the EOP exhibits a higher O/C ratio, which means higher surface oxygen groups, compared to the AS and OW biochars [19,29], but the DCFC performance is comparatively limited. It is also known that when the amount of oxygen-containing surface groups increases remarkably, it favors a decrease in the electrical conductivity due to the preponderance of insulating effects caused by the functional groups on the surface [79].
Regarding the hybrid character of the DCFC anode, which allows the simultaneous electrochemical conversion of both solid carbon and reformed gaseous fuels (CO and H2), an analysis of the nature of the surface oxygenated functional groups, apart from their extent, enables an estimation of their production potential of the gaseous species mentioned above and, subsequently, allows an assessment of their contribution to the complex reaction scheme of anode chemistry and electrochemistry. The FTIR spectrum of the EOP biochar (Figure 8) indicates the absence of the peak of C=O at about 1700–1710 cm−1, which reflects the absence of carbonyl, carboxyl, lactone, and anhydride groups within the surface chemical structure of the EOP biochar. These oxygen functional groups are known to contribute to the generation of CO and CO2 gases within the anode and, thus, cause the occurrence of several chemical reactions, such as the water–gas shift reaction, the Boudouard reaction, the water shift reaction, and the methanation reaction. Elleuch et al. [29] proposed a chemical mechanism of OW biochar devolatilization within a DCFC anode and showed that CO2 evolves from the decomposition of carboxylic acid functionality at low temperatures and/or lactones at high temperatures, while CO arises from carbonyls at high temperatures.
On the other hand, the EOP biochar’s FTIR spectrum (Figure 8) shows the presence of C-O single-bond groups ascribed to the high content of phenols and ethers. These groups are more difficult to decompose but are able to produce CO and CO2 at very high temperatures in the presence of catalysts. In conclusion, it seems that the existence of C=O bonds is preferred over C-O bonds for the easiest way to generate gases within the anode of a DCFC and for the further electrochemical contribution of these gases to the DCFC electrochemistry; these bonds are absent in the case of the EOP biochar. Moreover, the high O/C content indicates the extended availability of surface oxygen groups, although this information remains not informative. We need to identify the chemical functional groups that are known to be easily decomposed, such as carbonyl groups.
The DCFC fed by the EOP biochar delivers a limited current density, which is also correlated with its distinct physico-chemical properties. HHV is a fuel property that indicates the chemical energy density that will be converted into electricity through DCFC systems. The HHV of the EOP biochar is higher than that of the EOP raw biomass due to the conversion of oxygenated compounds into carbonaceous hydrocarbons, which reduces the oxygen content in the biochar and increases the carbon content. As shown in Figure 9, the limiting current density delivered by the DCFC fueled by the EOP biochar (142 mA·cm−2) is so low compared to that of the AS biochar (450 mA·cm−2) and the OW biochar (550 mA·cm−2). The HHV also follows the same trend: OW biochar (27.31 MJ·kg−1) [29] > AS biochar (24.7 MJ·kg−1) [19] > EOP biochar (22.21 MJ·kg−1). It is, thus, evident that the higher the biochar energy density is, the higher the current density delivered by the cell is; however, there is a high disproportion between the ordered HHV values and the decrease in the limiting current density.
In order to investigate this behavior between the HHV and the limiting current of the cell, we selected another biochar (corn cob, noted as CC) tested in a similar DCFC system by Yu et al. [49]. The results illustrated in Figure 10a show that the limiting current density recorded by the DCFC follows a polynomial trend as a function of the biochar’s HHVs, according to the following equation:
ilim = −14.955 HHV2 + 821.23 HHV − 10,723 with R2 = 0.9962. This correlation could predict the DCFC’s output when applying different types of carbon materials as fuel in similar DCFC operating conditions (700 °C) and materials.
As the biochar’s HHVs range from 22 to 32.5 MJ·kg−1, we used the previously mentioned polynomial law to assess the dependency between the biochar’s property HHV and its impact on the cell’s current output. The obtained curve (Figure 10b) shows that the biochar has a HHV ranging between 24 and 30 MJ·kg−1, resulting in a promising DCFC current density (higher than 400 mA·cm−2).
The electrochemical reactions in a DCFC system occur predominantly on the carbon surface represented by the pores walls. Consequently, a higher porosity results in a larger surface area. It is known that a high interfacial surface enlarges the availability of sites for electrochemical reactions and, consequently, leads to an increase in the electron flux generated via the electrochemical reactions of the DCFC.
Figure 6 shows the distribution of the pore diameter within the EOP biochar, which is similar to that of the AS and OW biochars but different from derived biochars from agricultural wastes, which are often considered to be entirely microporous (D < 2 nm). The presence of the meso–macroporosity in the EOP biochar helps ameliorate the mass transport and the kinetic processes, which results in the promising current density output recorded when testing the EOP biochar (142 mA·cm−2).
The surface area of a wooden biochar is about 131.4 m2·g−1 [17], which is limited but higher than that of the analyzed EOP biochar (52.495 m2·g−1). These surface area values are in good agreement with those reported in the literature, especially with the fact that these samples have resulted from a carbonization process with no further activation step [71]. We should also notice that the AS and OW biochars exhibit very limited specific surface areas in the range between 30 and 40 m2 g−1, which is in a comparable range with that of the EOP biochar sample.
There is a strong correlation between the pore volume and surface area measurements based on N2 adsorption, but the use of pore volume may be preferable due to the low surface area values in the case of biochar obtained from carbonization [41].
The total pore volume of the EOP biochar is three and two times lower than the OW and AS biochars, respectively. Similarly, its porosity is very limited (about 36%). This may be caused by the high content of silica within the EOP biochar sample, which hinders its porousness and leads to the limited current density (ilim) delivered by the DCFC (Figure 9). The ilim also depends on the diffusion ability of species, which appears to be restricted in this case. Porousness could, thus, be enhanced by removing silica from the biochar, which can be transformed into activated carbon when exposed to higher temperature.
The open circuit voltage (OCV) of the DCFC fed by the EOP biochar is lower than the theoretical OCV value (ca. 1.02 V) of the DCFC. This low OCV is not related to the low densification of the composite electrolyte, which is proven through an SEM investigation of the electrolyte after the test, as shown in Figure 11. In Figure 11a, the porous structure of the DCFC pellet at room temperature is clearly observed. The composite electrolyte and the cathode layers indicate different morphologies. A large particle size distribution ranging from 90 to 500 nm and from 45 to 312 nm for the LixNi1−xO cathode particles and the composite electrolyte particles, respectively, are obtained. This is not the case in the second micrograph of the DCFC pellet obtained after the electrochemical test (Figure 11b). After the DCFC test, it becomes difficult to distinguish between the pellet layers (cathode/electrolyte). Additionally, a distinction of the SDC particles from the carbonate phase is not possible because the SDC particles are coated completely by the solidified carbonate, which has once melted, proving the fact that the electrolyte is well densified and prevents the cathode gas from leaking through during the DCFC electrochemical test. The composite electrolyte provides the pathways for the transfer of both oxide and carbonate ions. Thus, the nature of the fuel may be the cause of this OCV tendency. This behavior is different from that recorded in our previous studies using the AS [19] and OW [29] biochars. This deviation can be ascribed to the distinct and complex schemes of chemical and electrochemical reactions occurring within the anodic side, yielding a lower concentration of reactive gaseous species (CO and H2) (Figure 12).
The limited OCV value is, thus, another proof of the previously outlined finding related directly to the reduced formation of gases as fuels due to the absence of carbonyl groups at the surface functionalities of the EOP biochar. This is aligned with the results reported by Kaklidis et al. [30], who clearly correlated the CO formation rate obtained under open circuit conditions with the achieved DCFC electrochemical performance and proved that the overall chemical and electrochemical processes are driven by the CO shuttle mechanism.
Furthermore, it appears that other physico-chemical properties of the biochar, such as the mineral composition, strongly affect the gas phase/surface chemical reactions and the charge transfer phenomena, modifying the anode gas composition and, subsequently, the recorded OCV.
In the case of DCFC application, the research work by Li and co-workers [43], who studied the effect of several metallic oxides common to coal ash on the electrochemical performance of DCFCs through the addition of a fixed amount (8%) of the oxides of calcium, magnesium, iron, aluminum, and silica impregnated in activated carbon (AC),confirmed that MgO, CaO, and Fe2O3 act as catalysts for the electrochemical process of DCFCs [43]. Elleuch et al. [29] analyzed an OW biochar’s performance as a fuel in a DCFC system and affirmed that CaO and K2O act as catalysts for the anodic electrochemical mechanism of the cell. The same catalytic effect of the latter alkali and alkaline metals (K2O and CaO) was also revealed in the case of an AS biochar-fed DCFC, which is considered one of the main positive characters of the biochar, leading to the promising performance. We should also notice that these minerals are able to catalyze several devolatilization reactions occurring within the biochar skeleton, such as the Boudouard reaction and the water–gas shift reaction.
In this study, the EOP biochar’s content of K2O (13.72 wt%) and CaO (16.31 wt%) minerals in the inorganic fraction of the ash is far different to both the OW and AS biochars, which were previously affirmed as promising fuels in DCFCs [19,29]. This difference is primarily related to the biomass essence.
Additionally, the catalytic contribution of these metals to the DCFC’s electrochemical and the biochar’s devolatilization reactions seems to be curtailed by a high content of silica in the EOP biochar. This is in agreement with other research works on gasification catalysts, which concluded that the catalytic effect of metals, such as (K), was reduced by the reaction with silica to form silicate during gasification, rather than to the accelerated devolatilization reactions [64].
Another peculiarity observed in the I–V curve of the DCFC fed by the EOP biochar (Figure 9) is related to the pronounced activation polarization. This voltage loss results from the difficulties encountered by reactive species (solid carbon, CO, and H2) when carrying out electrochemical reactions at lower current densities. The limited kinetics of reactions is also related to the physico-chemical properties of the biochar. Biochar porousness will curtail the reaction sites, and a high silica content will hinder the diffusion of species on the one hand and contribute to the insulation of some of the available reaction sites on the other hand. Altogether, these explain the high activation polarization taking place during the operation of the DCFC fed by the EOP biochar.
4. Conclusions
In this work, the electrochemical performance of a biochar produced from EOP biomass carbonization at 400 °C was examined as a fuel in a DCFC system supported by a 0.6 mm-thick Ce0.8Sm0.2O1.9 (SDC)-carbonate composite electrolyte layer. The cell exhibits a maximum power density of about 10 mW·cm−2 and a limiting current density of about 142 mA·cm−2 at 700 °C, which is limited if compared to the AS and OW biochar-fed DCFCs prepared under similar conditions. The OCV is about 0.87 V lower compared to the DCFC’s theoretical voltage. This is ascribed to the various formed gases emitted from the porous biochar structure, which plays a key role in the DCFC’s performance apart from the solid carbon skeleton. Even though the electro-oxidation of solid carbon and volatile gases has a significant effect on the performance of the DCFC, the contribution of each one has not been fully assessed. The physico-chemical and structural properties of the EOP biochar were analyzed using elemental and proximate analyses, mercury porosimetry, scanning electron microscopy, X-ray diffraction, FTIR analysis, and X-ray fluorescence analysis. The thermogravimetric analysis under a normal air atmosphere enables the conclusions about the thermal stability and reactivity of the EOP biochar. On the basis of this extensive characterization study, a direct correlation between the EOP biochar’s physico-chemical characteristics and the power output is revealed.
The carbon, oxygen, ash (impurities), and volatile matter contents; the porosity and surface area; the presence of carbonyl/carboxylic groups; and the disorder of the carbon structure exert a pronounced impact on the electrochemical performance of the EOP biochar-fed DCFC.
An enhanced electrochemical reactivity of the EOP biochar in the DCFC system could be achieved by first removing silica from the biochar using a demineralization pre-treatment, followed by activation.
The present research investigated the positive and negative properties affecting the performance of a biochar as fuel in a DCFC. The major conclusions show that a promising biochar fuel for DCFCs is one that comes from a biomass feedstock with a high HHV, a high holocellulose/lignin ratio, and, especially, a low ash content, without looking at its mineral composition.
Author Contributions
Experimental work and writing—original draft preparation: N.G. and A.E.; review and supervision: A.E., K.H. and Y.L. All authors have read and agreed to the published version of the manuscript.
Funding
This research was funded by the Ministry of Higher Education and Scientific Research of Tunisia in the framework of the ERANETMED2-72-251, Medwaste project.
Data Availability Statement
Additional details of the experiments and data may be asked via email to the corresponding authors.
Acknowledgments
This research is supported by the Tunisian Ministry of Higher Education and Scientific Research in the framework of the ERANETMED2-72-251, Medwaste project. The financial support of the NSF of China under contract number21120102039, the support of the Tianjin Municipal Science and Technology commission under contract number 13JCZDJC26600, the support of the Program of Introducing Talents to the University Disciplines under file number B06006, the support of the Program for Chengjiang Scholars and Innovative Research Teams in Universities under file number IRT 0641, and the support of the Ministry of Education of China under contract number 20130032120023 are also gratefully acknowledged.
Conflicts of Interest
The authors declare no conflict of interest.
References
- Saviozzi, A.; Levi-Minzi, R.; Cardelli, R.; Biasci, A.; Riffaldi, R. Suitability of moist olive pomace as soil amendment. Water Air Soil Pollut. 2001, 128, 13–22. [Google Scholar] [CrossRef]
- Alburquerque, J.A.; Gonzálvez, J.; García, D.; Cegarra, J. Agrochemical characterization of “alperujo”, a solid by-product of the two-phase centrifugation method for olive oil extraction. Bioresour. Technol. 2004, 91, 195–200. [Google Scholar] [CrossRef] [PubMed]
- Gómez-Muñoz, B.; Hatch, D.J.; Bol, R.; García-Ruiz, R. The Compost of Olive Mill Pomace: From a Waste to a Resource—Environmental Benefits of Its Application in Olive Oil Groves. In Sustainable Development—Authoritative and Leading Edge Content for Environmental Management; Curkovic, S., Ed.; In Tech: Rijeka, Croatia, 2012; pp. 449–484. ISBN 9789535106821. [Google Scholar]
- Zabaniotou, A.A.; Kalogiannis, G.; Kappas, E.; Karabelas, A.J. Olive residues (cuttings and kernels) rapid pyrolysis product yields and kinetics. Biomass Bioenergy 2000, 18, 411–420. [Google Scholar] [CrossRef]
- Jauhiainen, J.; Conesa, J.A.; Font, R.; Martín-Gullón, I. Kinetics of the pyrolysis and combustion of olive oil solid waste. J. Anal. Appl. Pyrolysis 2004, 72, 9–15. [Google Scholar] [CrossRef]
- Naik, S.N.; Goud, V.V.; Rout, P.K.; Dalai, A.K. Production of first and second generation biofuels: A comprehensive review. Renew. Sustain. Energy Rev. 2010, 14, 578–597. [Google Scholar] [CrossRef]
- Volpe, M.; D’Anna, C.; Messineo, S.; Volpe, R.; Messineo, A. Sustainable production of bio-combustibles from pyrolysis of agro-industrial wastes. Sustainability 2014, 6, 7866–7882. [Google Scholar] [CrossRef]
- Miranda, T.; Nogales, S.; Román, S.; Montero, I.; Arranz, J.I.; Sepúlveda, F.J. Control of several emissions during olive pomace thermal degradation. Int. J. Mol. Sci. 2014, 15, 18349–18361. [Google Scholar] [CrossRef] [PubMed]
- Miranda, I.; Simões, R.; Medeiros, B.; Nampoothiri, K.M.; Sukumaran, R.K.; Rajan, D.; Pereira, H.; Ferreira-Dias, S. Valorization of lignocellulosic residues from the olive oil industry by production of lignin, glucose and functional sugars. Bioresour. Technol. 2019, 292, 121936. [Google Scholar] [CrossRef] [PubMed]
- Cuevas, M.; García, J.F.; Hodaifa, G.; Sánchez, S. Oligosaccharides and sugars production from olive stones by autohydrolysis and enzymatic hydrolysis. Ind. Crops Prod. 2015, 70, 100–106. [Google Scholar] [CrossRef]
- Pütün, A.E.; Uzun, B.B.; Apaydin, E.; Pütün, E. Bio-oil from olive oil industry wastes: Pyrolysis of olive residue under different conditions. Fuel Process. Technol. 2005, 87, 25–32. [Google Scholar] [CrossRef]
- Chouchene, A.; Jeguirim, M.; Khiari, B.; Zagrouba, F.; Trouvé, G. Thermal degradation of olive solid waste: Influence of particle size and oxygen concentration. Resour. Conserv. Recycl. 2010, 54, 271–277. [Google Scholar] [CrossRef]
- Özveren, U.; Özdoǧan, Z.S. Investigation of the slow pyrolysis kinetics of olive oil pomace using thermo-gravimetric analysis coupled with mass spectrometry. Biomass Bioenergy 2013, 58, 168–179. [Google Scholar] [CrossRef]
- Parascanu, M.M.; Sánchez, P.; Soreanu, G.; Valverde, J.L.; Sanchez-Silva, L. Environmental assessment of olive pomace valorization through two different thermochemical processes for energy production. J. Clean. Prod. 2018, 186, 771–781. [Google Scholar] [CrossRef]
- Dinc, G.; Yel, E. Self-catalyzing pyrolysis of olive pomace. J. Anal. Appl. Pyrolysis 2018, 134, 641–646. [Google Scholar] [CrossRef]
- Cao, D.; Sun, Y.; Wang, G. Direct carbon fuel cell: Fundamentals and recent developments. J. Power Source 2007, 167, 250–257. [Google Scholar] [CrossRef]
- Ahn, S.Y.; Eom, S.Y.; Rhie, Y.H.; Sung, Y.M.; Moon, C.E.; Choi, G.M.; Kim, D.J. Utilization of wood biomass char in a directcarbon fuel cell (DCFC) system. Appl. Energy 2013, 105, 207–216. [Google Scholar] [CrossRef]
- Cherepy, N.J.; Krueger, R.; Fiet, K.J.; Jankowski, A.F.; Cooper, J.F. Direct Conversion of Carbon Fuels in a Molten CarbonateFuel Cell. J. Electrochem. Soc. 2005, 152, A80–A87. [Google Scholar] [CrossRef]
- Elleuch, A.; Boussetta, A.; Yu, J.; Halouani, K.; Li, Y. Experimental investigation of direct carbon fuel cell fueled by almond shell biochar: Part I. Physico-chemical characterization of the biochar fuel and cell performance examination. Int. J. Hydrogen Energy 2013, 38, 16590–16604. [Google Scholar] [CrossRef]
- Heneka, M.J.; Ivers-Tiffée, E. Degradation of SOFC single cells under severe current cycles. Proc. Electrochem. Soc. 2005, 2005, 534–543. [Google Scholar] [CrossRef]
- Yamaji, K.; Ishiyama, T.; Bagarinao, K.D.; Kishimoto, H.; Horita, T.; Yokokawa, H. Evaluation of Impurity Levels in Cathods of Seven Different SOFCS tacks and Modules before and after Long-Term Operation. ECS Meet. Abstr. 2017, MA2017-03, 177. [Google Scholar] [CrossRef]
- Jiang, C.; Ma, J.; Arenillas, A.; Bonaccorso, A.D.; Irvine, J.T.S. Comparative study of durability of hybrid direct carbon fuelcells with anthracite coal and bituminous coal. Int. J. Hydrogen Energy 2016, 41, 18797–18806. [Google Scholar] [CrossRef]
- Alenazey, F.; Alyousef, Y.; Alotaibi, B.; Almutairi, G.; Minakshi, M.; Cheng, C.K.; Vo, D.V.N. Degradation Behaviors of Solid Oxide Fuel Cell Stacks in Steady-State and Cycling Conditions. Energy Fuels 2020, 34, 14864–14873. [Google Scholar] [CrossRef]
- Xia, C.; Li, Y.; Tian, Y.; Liu, Q.; Wang, Z.; Jia, L.; Zhao, Y.; Li, Y. Intermediate temperature fuel cell with adoped ceria-carbonate composite electrolyte. J. Power Source 2010, 195, 3149–3154. [Google Scholar] [CrossRef]
- Zhao, Y.; Xia, C.; Wang, Y.; Xu, Z.; Li, Y. Quantifying multi-ionic conduction through doped ceria-carbonate composite electrolyte by a current-interruption technique and product analysis. Int. J. Hydrogen Energy 2012, 37, 8556–8561. [Google Scholar] [CrossRef]
- Jia, L.; Tian, Y.; Liu, Q.; Xia, C.; Yu, J.; Wang, Z.; Zhao, Y.; Li, Y. A direct carbon fuel cell with (molten carbonate)/(doped ceria) composite electrolyte. J. Power Source 2010, 195, 5581–5586. [Google Scholar] [CrossRef]
- Cui, C.; Li, S.; Gong, J.; Wei, K.; Hou, X.; Jiang, C.; Yao, Y.; Ma, J. Review of molten carbonate-based direct carbon fuel cells. Mater. Renew. Sustain. Energy 2021, 10, 1–24. [Google Scholar] [CrossRef]
- Mejdoub, F.; Elleuch, A.; Halouani, K. Assessment of the intricate nickel-based anodic reactions mechanism within a methanol fed solid oxide fuel cell based on a co-ionic conducting composite electrolyte. J. Power Source 2019, 414, 115–128. [Google Scholar] [CrossRef]
- Elleuch, A.; Halouani, K.; Li, Y. Investigation of chemical and electrochemical reactions mechanisms in a direct carbon fuel cell using olive wood char coal as sustainable fuel. J. Power Source 2015, 281, 350–361. [Google Scholar] [CrossRef]
- Kaklidis, N.; Kyriakou, V.; Garagounis, I.; Arenillas, A.; Menéndez, J.A.; Marnellos, G.E.; Konsolakis, M. Effect of carbon type on the performance of a direct or hybrid carbon solid oxide fuel cell. RSC Adv. 2014, 4, 18792–18800. [Google Scholar] [CrossRef]
- Konsolakis, M.; Kaklidis, N.; Marnellos, G.E.; Zaharaki, D.; Komnitsas, K. Assessment of biochar as feedstock in a direct carbon solid oxide fuel cell. RSC Adv. 2015, 5, 73399–73409. [Google Scholar] [CrossRef]
- Chen, C.C.; Selman, J.R. Anode modeling of a molten-carbonate based direct carbon fuel cell. J. Power Source 2017, 353, 312–322. [Google Scholar] [CrossRef]
- Jafri, N.; Wong, W.Y.; Doshi, V.; Yoon, L.W.; Cheah, K.H. A review on production and characterization of biochars for application in direct carbon fuel cells. Process Saf. Environ. Prot. 2018, 118, 152–166. [Google Scholar] [CrossRef]
- Wang, J.; Fan, L.; Yao, T.; Gan, J.; Zhi, X.; Hou, N.; Gan, T.; Zhao, Y.; Li, Y. A High-Performance Direct Carbon Fuel Cell with Reed Rod Biocharas Fuel. J. Electrochem. Soc. 2019, 166, F175–F179. [Google Scholar] [CrossRef]
- Shama, P.; Singh, D.; Minakshi, M.; Quadsia, S.; Ahuja, R. Activation-Induced Surface Modulation of Biowaste-Derived Hierarchical Porous Carbon for Supercapacitors. ChemPlus Chem. 2022, 87, e202200126. [Google Scholar]
- Wickramaarachchi, K.; Minakshi, M.; Aravindh, S.A.; Dabare, R.; Gao, X.; Jiang, Z.T.; Wong, K.W. Repurposing N-Doped Grape Marcfor the Fabrication of Supercapacitors with Theoretical and Machine Learning Models. Nanomaterials 2022, 12, 1847. [Google Scholar] [CrossRef]
- Gómez, I.C.; Cruz, O.F.; Silvestre-Albero, J.; Rambo, C.R.; Escandell, M.M. Role of KCl in activation mechanisms o KOH-chemically activated high surface area carbons. J. CO2 Util. 2022, 66, 102258. [Google Scholar] [CrossRef]
- Jayakumar, A.; Küngas, R.; Roy, S.; Javadekar, A.; Buttrey, D.J.; Vohs, J.M.; Gorte, R.J. A direct carbon fuel cell with a molten antimony anode. J. Energy Environ. Sci. 2011, 4, 4133–4137. [Google Scholar]
- Cai, W.; Zhou, Q.; Xie, Y.; Liu, J. A facile method of preparing Fe-loaded activated carbon fuel for direct carbon solid oxide fuel cells. Fuel 2015, 159, 887–893. [Google Scholar] [CrossRef]
- Hao, W.; Mi, Y. Evaluation of waste paper as a source of carbon fuel for hybrid direct carbon fuel cells. Energy 2016, 107, 122–130. [Google Scholar] [CrossRef]
- Chien, A.C.; Chuang, S.S.C. Effect of gas flow rates and Boudouard reactions on the performance of Ni/YSZ anode supported solid oxide fuel cells with solid carbon fuels. J. Power Source 2011, 196, 4719–4723. [Google Scholar] [CrossRef]
- Hao, W.; He, X.; Mi, Y. Achieving high performance in intermediate temperature direct carbon fuel cells with renewable carbon as a fuel source. J. Appl. Energy 2014, 135, 174–181. [Google Scholar] [CrossRef]
- Li, X.; Zhu, Z.; De Marco, R.; Bradley, J.; Dicks, A. Evaluation of raw coals as fuels for direct carbon fuel cells. J. Power Source 2010, 195, 4051–4058. [Google Scholar] [CrossRef]
- Kacprzak, A.; Kobyłecki, R.; Włodarczyk, R.; Bis, Z. Efficiency of non-optimized direct carbon fuel cell with molten alkaline electrolyte fueled by carbonized biomass. J. Power Source 2016, 321, 233–240. [Google Scholar] [CrossRef]
- Wang, C.Q.; Liu, J.; Zeng, J.; Yin, J.L.; Wang, G.L.; Cao, D.X. Significant improvement of electro oxidation performance of carbon in molten carbonates by the introduction of transition metal oxides. J. Power Source 2013, 233, 244–251. [Google Scholar] [CrossRef]
- Sequeira, C.A.C. Carbon Anode in Carbon History. Molecules 2020, 25, 4996. [Google Scholar] [CrossRef]
- Tang, Y.; Liu, J. Effect of anode and Boudouard reaction catalysts on the performance of direct carbon solid oxide fuel cells. Int. J. Hydrogen Energy 2010, 35, 11188–11193. [Google Scholar] [CrossRef]
- Han, T.; Wu, Y.; Xie, Z.; Wang, Y.; Xie, Y.; Zhang, J.; Xiao, J.; Yu, F.; Yang, N. A novel Boudouard reaction catalyst derived from strontium slag for enhanced performance of direct carbon solid oxide fuel cells. J. Alloys Compd. 2022, 895, 162643. [Google Scholar] [CrossRef]
- Yu, J.; Zhao, Y.; Li, Y. Utilization of corn cob biochar in a direct carbon fuel cell. J. Power Source 2014, 270, 312–317. [Google Scholar] [CrossRef]
- Technical Association of the Pulp and Paper Industry. TAPPI Test Methods; TAPPI: Atlanta, GA, USA, 2012. [Google Scholar]
- Browning, B. Methods of Wood Chemistry; Interscience Publishers: New York, NY, USA, 1967. [Google Scholar]
- Perry, R.H.; Chilton, C.H. Chemical Engineers’ Handbook, 5th ed.; Cecil, H., Perry, J.H., Eds.; McGraw-Hill: New York, NY, USA, 1973. [Google Scholar]
- Grioui, N.; Halouani, K.; Zoulalian, A.; Halouani, F. Experimental Study of Thermal Effect on Olive Wood Porous Structure During Carbonization. Maderas. Cienc. Tecnol. 2007, 9, 15–28. [Google Scholar] [CrossRef]
- Liang, Y.; Cheng, B.; Si, Y.; Cao, D.; Jiang, H.; Han, G.; Liu, X. Thermal decomposition kinetics and characteristics of Spartina alterniflora via thermogravimetric analysis. Renew. Energy 2014, 68, 111–117. [Google Scholar] [CrossRef]
- Ma, Z.; Chen, D.; Gu, J.; Bao, B.; Zhang, Q. Determination of pyrolysis characteristics and kinetics of palm kernel shell using TGA-FTIR and model-free integral methods. Energy Convers. Manag. 2015, 89, 251–259. [Google Scholar] [CrossRef]
- García, G.B.; Calero De Hoces, M.; Martínez García, C.; Cotes Palomino, M.T.; Gálvez, A.R.; Martín-Lara, M.Á. Characterization and modeling of pyrolysis of the two-phase olive mill solid waste. Fuel Process. Technol. 2014, 126, 104–111. [Google Scholar] [CrossRef]
- Cooper, J.F. Direct Conversion of Coal and Coal-Derived Carbon in Fuel Cells. In Proceedings of the 2nd International Conference on Fuel Cell Science, Engineering and Technology, Rochester, NY, USA, 14–16 June 2004; ASME: New York, NY, USA, 2004; pp. 375–385. [Google Scholar]
- De Filippis, P.; Di Palma, L.; Petrucci, E.; Scarsella, M.; Verdone, N. Production and Characterization of Adsorbent Materials from Sewage Sludge by Pyrolysis. Chem. Eng. Trans. 2013, 32, 205–210. [Google Scholar]
- Choudhury, N.D.; Chutia, R.S.; Bhaskar, T.; Kataki, R. Pyrolysis of jute dust: Effect of reaction parameters and analysis of products. J. Mater. Cycles Waste Manag. 2014, 16, 449–459. [Google Scholar] [CrossRef]
- Di Blasi, C. Heat, Momentum and mass transport through a shrinking biomass particle exposed to thermal radiation. Chem. Eng. Sci. 1996, 51, 1121–1132. [Google Scholar] [CrossRef]
- Rady, A.C.; Giddey, S.; Badwal, S.P.S.; Ladewig, B.P.; Bhattacharya, S. Review of fuels for direct carbon fuel cells. Energy Fuels 2012, 26, 1471–1488. [Google Scholar] [CrossRef]
- Vutetakis, D.G.; Skidmore, D.R.; Byker, H.J. Electrochemical Oxidation of Molten Carbonate-Coal Slurries. J. Electrochem. Soc. 1987, 134, 3027–3035. [Google Scholar] [CrossRef]
- Joyce, J.; Dixon, T.; Diniz Da Costa, J.C. Characterization of sugarcane waste biomass derived chars from pressurized gasification. Process Saf. Environ. Prot. 2006, 84, 429–439. [Google Scholar] [CrossRef]
- Nzihou, A.; Stanmore, B.; Sharrock, P. A review of catalysts for the gasification of biomass char, with some reference to coal. Energy 2013, 58, 305–317. [Google Scholar] [CrossRef]
- Mahadevan, R.; Adhikari, S.; Shakya, R.; Wang, K.; Dayton, D.; Lehrich, M.; Taylor, S.E. Effect of Alkali and Alkaline EarthMetals on in-Situ Catalytic Fast Pyrolysis of Lignocellulosic Biomass: A Micro-reactor Study. Energy Fuels 2016, 30, 3045–3056. [Google Scholar] [CrossRef]
- Bourke, J.; Manley-Harris, M.; Fushimi, C.; Dowaki, K.; Nunoura, T.; Antal, M.J. Do all carbonized charcoals have the same chemical structure? Ind. Eng. Chem. Res. 2007, 46, 5954–5967. [Google Scholar] [CrossRef]
- Keiluweit, M.; Nico, P.S.; Johnson, M.G.; Kleber, M. Dynamic Molecular Structure of Plant Biomass-derived Black Carbon (Biochar)-Supporting Information. Environ. Sci. Technol. 2010, 44, 1247–1253. [Google Scholar] [CrossRef] [PubMed]
- Yuan, J.H.; Xu, R.K.; Zhang, H. The forms of alkalis in the biochar produced from crop residues at different temperatures. Bioresour. Technol. 2011, 102, 3488–3497. [Google Scholar] [CrossRef] [PubMed]
- Ahmad, M.; Ahmad, M.; Usman, A.R.A.; Al-Faraj, A.S.; Abduljabbar, A.; Ok, Y.S.; Al-Wabel, M.I. Date palm waste-derived biochar composites with silica and zeolite: Synthesis, characterization and implication for carbon stability and recalcitrant potential. Environ. Geochem. Health 2017, 41, 1687–1704. [Google Scholar] [CrossRef]
- Rafiq, M.K.; Bachmann, R.T.; Rafiq, M.T.; Shang, Z.; Joseph, S.; Long, R.L. Influence of pyrolysis temperature on physico-chemical properties of corn stover (zeamays L.) biochar and feasibility for carbon capture and energy balance. PLoS ONE 2016, 11, e0156894. [Google Scholar] [CrossRef] [PubMed]
- Sigmund, G.; Hüffer, T.; Hofmann, T.; Kah, M. Biochar total surface area and total pore volume determined by N2 and CO2 physisorption are strongly influenced by degassing temperature. Sci. Total Environ. 2017, 580, 770–775. [Google Scholar] [CrossRef]
- Li, X.; Zhu, Z.; DeMarco, R.; Bradley, J.; Dicks, A. Modification of coal as a fuel for the direct carbon fuel cell. J. Phys. Chem. A 2010, 114, 3855–3862. [Google Scholar] [CrossRef]
- Li, J.; Wei, B.; Wang, C.; Zhou, Z.; Lu, Z. High performance and stable La0.8 Sr0.2 Fe0.9 Nb0.1 O3-δ anode for direct carbon solid oxide fuel cells fueled by activated carbon and corn straw derived carbon. Int. J. Hydrogen Energy 2018, 43, 12358–12367. [Google Scholar] [CrossRef]
- Wu, H.; Xiao, J.; Hao, S.; Yang, R.; Dong, P.; Han, L.; Li, M.; Yu, F.; Xie, Y.; Ding, J.; et al. In-situ catalytic gasification ofkelp-derived biochar as a fuel for direct carbon solid oxide fuel cells. J. Alloys Compd. 2021, 865, 158922. [Google Scholar] [CrossRef]
- Chien, A.C.; Arenillas, A.; Jiang, C.; Irvine, J.T.S. Performance of Direct Carbon Fuel Cells Operated on Coal and Effect of Operation Mode. J. Electrochem. Soc. 2014, 161, F588–F593. [Google Scholar] [CrossRef]
- Mohan, D.; Pittman, C.U.; Steele, P.H. Pyrolysis of wood/biomass for bio-oil: A critical review. Energy Fuels 2006, 20, 848–889. [Google Scholar] [CrossRef]
- Hoffmann, V.; Jung, D.; Zimmermann, J.; Correa, C.R.; Elleuch, A.; Halouani, K.; Kruse, A. Conductive carbon materials from the hydrothermal carbonization of vineyard residues for the application in electrochemical double-layer capacitors(EDLCs) and direct carbon fuel cells(DCFCs). Materials 2019, 12, 1703. [Google Scholar] [CrossRef] [PubMed]
- Eom, S.; Ahn, S.; Rhie, Y.; Choi, G.; Kim, D. Effect of Coal Gases on Electrochemical Reactions in the Direct Carbon Fuel CellSystem. J. Clean Energy Technol. 2015, 3, 72–77. [Google Scholar] [CrossRef] [Green Version]
- Adinaveen, T.; Vijaya, J.J.; Kennedy, L.J. Comparative Study of Electrical Conductivity on Activated Carbons Prepared from Various Cellulose Materials. Arab. J. Sci. Eng. 2016, 41, 55–65. [Google Scholar] [CrossRef]
Figure 1.
Schematic diagram of the EOP biomass carbonization plant.

Figure 2.
Experimental protocol of DCFC pellet preparation.

Figure 3.
Operation mode of the DCFC.

Figure 4.
XRD patterns of the EOP biochar.

Figure 5.
Scanning electron micrographs (SEM) of the EOP biochar: (a) at 100 μm resolution and (b) at 5 μm resolution.
Figure 5.
Scanning electron micrographs (SEM) of the EOP biochar: (a) at 100 μm resolution and (b) at 5 μm resolution.

Figure 6.
Log differential intrusion as a function of the pore diameter of the EOP biochar.

Figure 7.
Temperature programmed oxidation (TPO) of the EOP biochar.

Figure 8.
FTIR spectrum of the EOP biochar sample.

Figure 9.
(a) I–V and (b) I–P curves of the DCFC powered by the EOP biochar at 700 °C, compared to those of the DCFCs powered by AS biochar [19] and OW biochar [29].

Figure 10.
Evolution of (a) experimentally recorded current densities and (b) modeled polynomial current densities delivered by the DCFC system as a function of the biochar’s HHVs.
Figure 10.
Evolution of (a) experimentally recorded current densities and (b) modeled polynomial current densities delivered by the DCFC system as a function of the biochar’s HHVs.

Figure 11.
Scanning electron micrograph of the electrolyte structure: (a) before cell testing at room temperature and (b) after cell testing at T = 700 °C.
Figure 11.
Scanning electron micrograph of the electrolyte structure: (a) before cell testing at room temperature and (b) after cell testing at T = 700 °C.

Figure 12.
Presentation of the anodic reaction mechanisms of the EOPbiochar as a fuel in the DCFC.


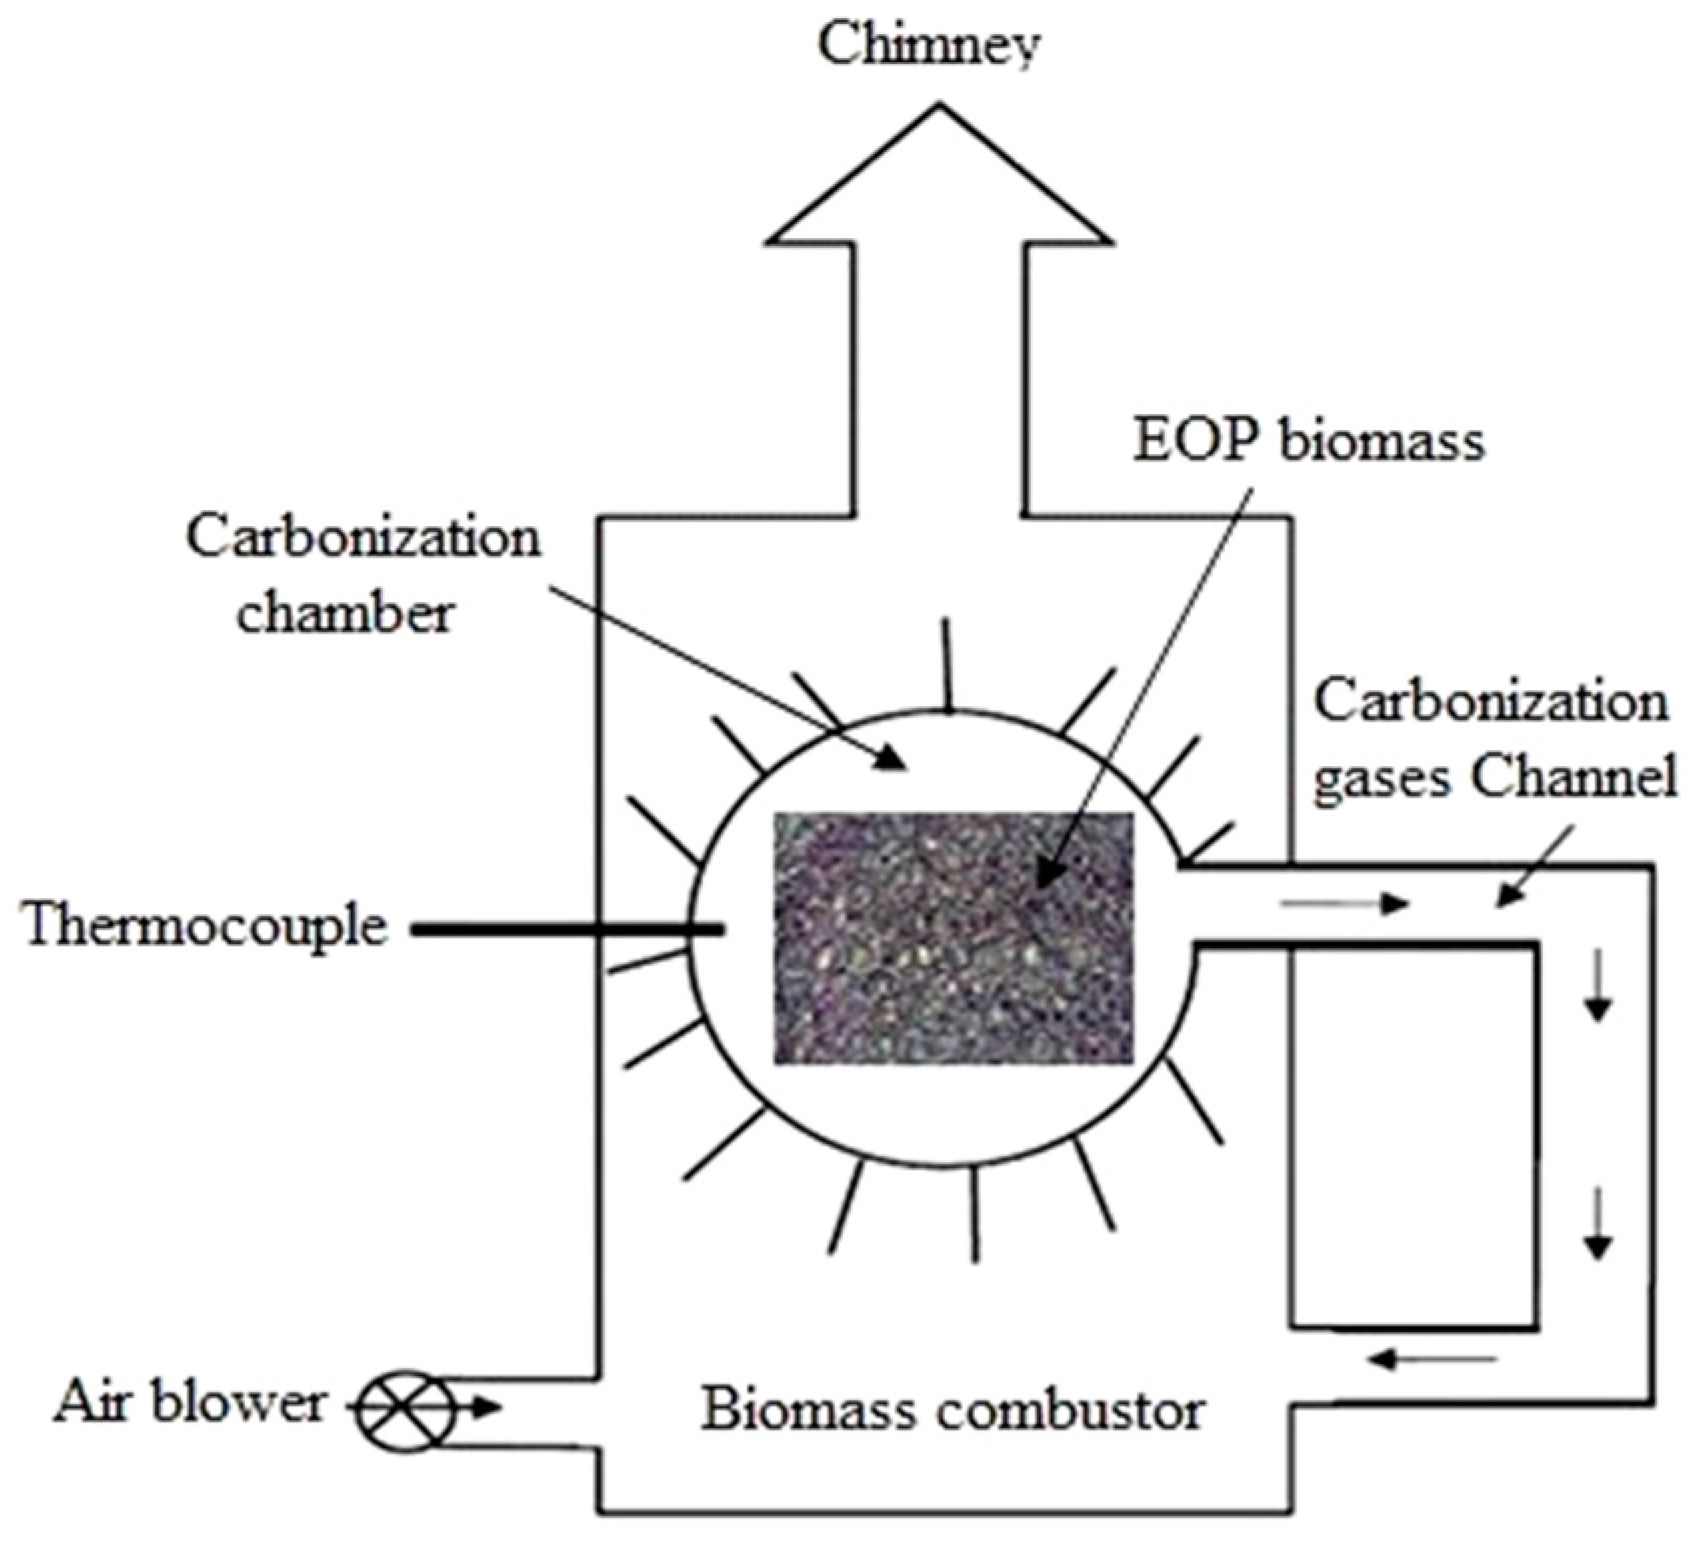
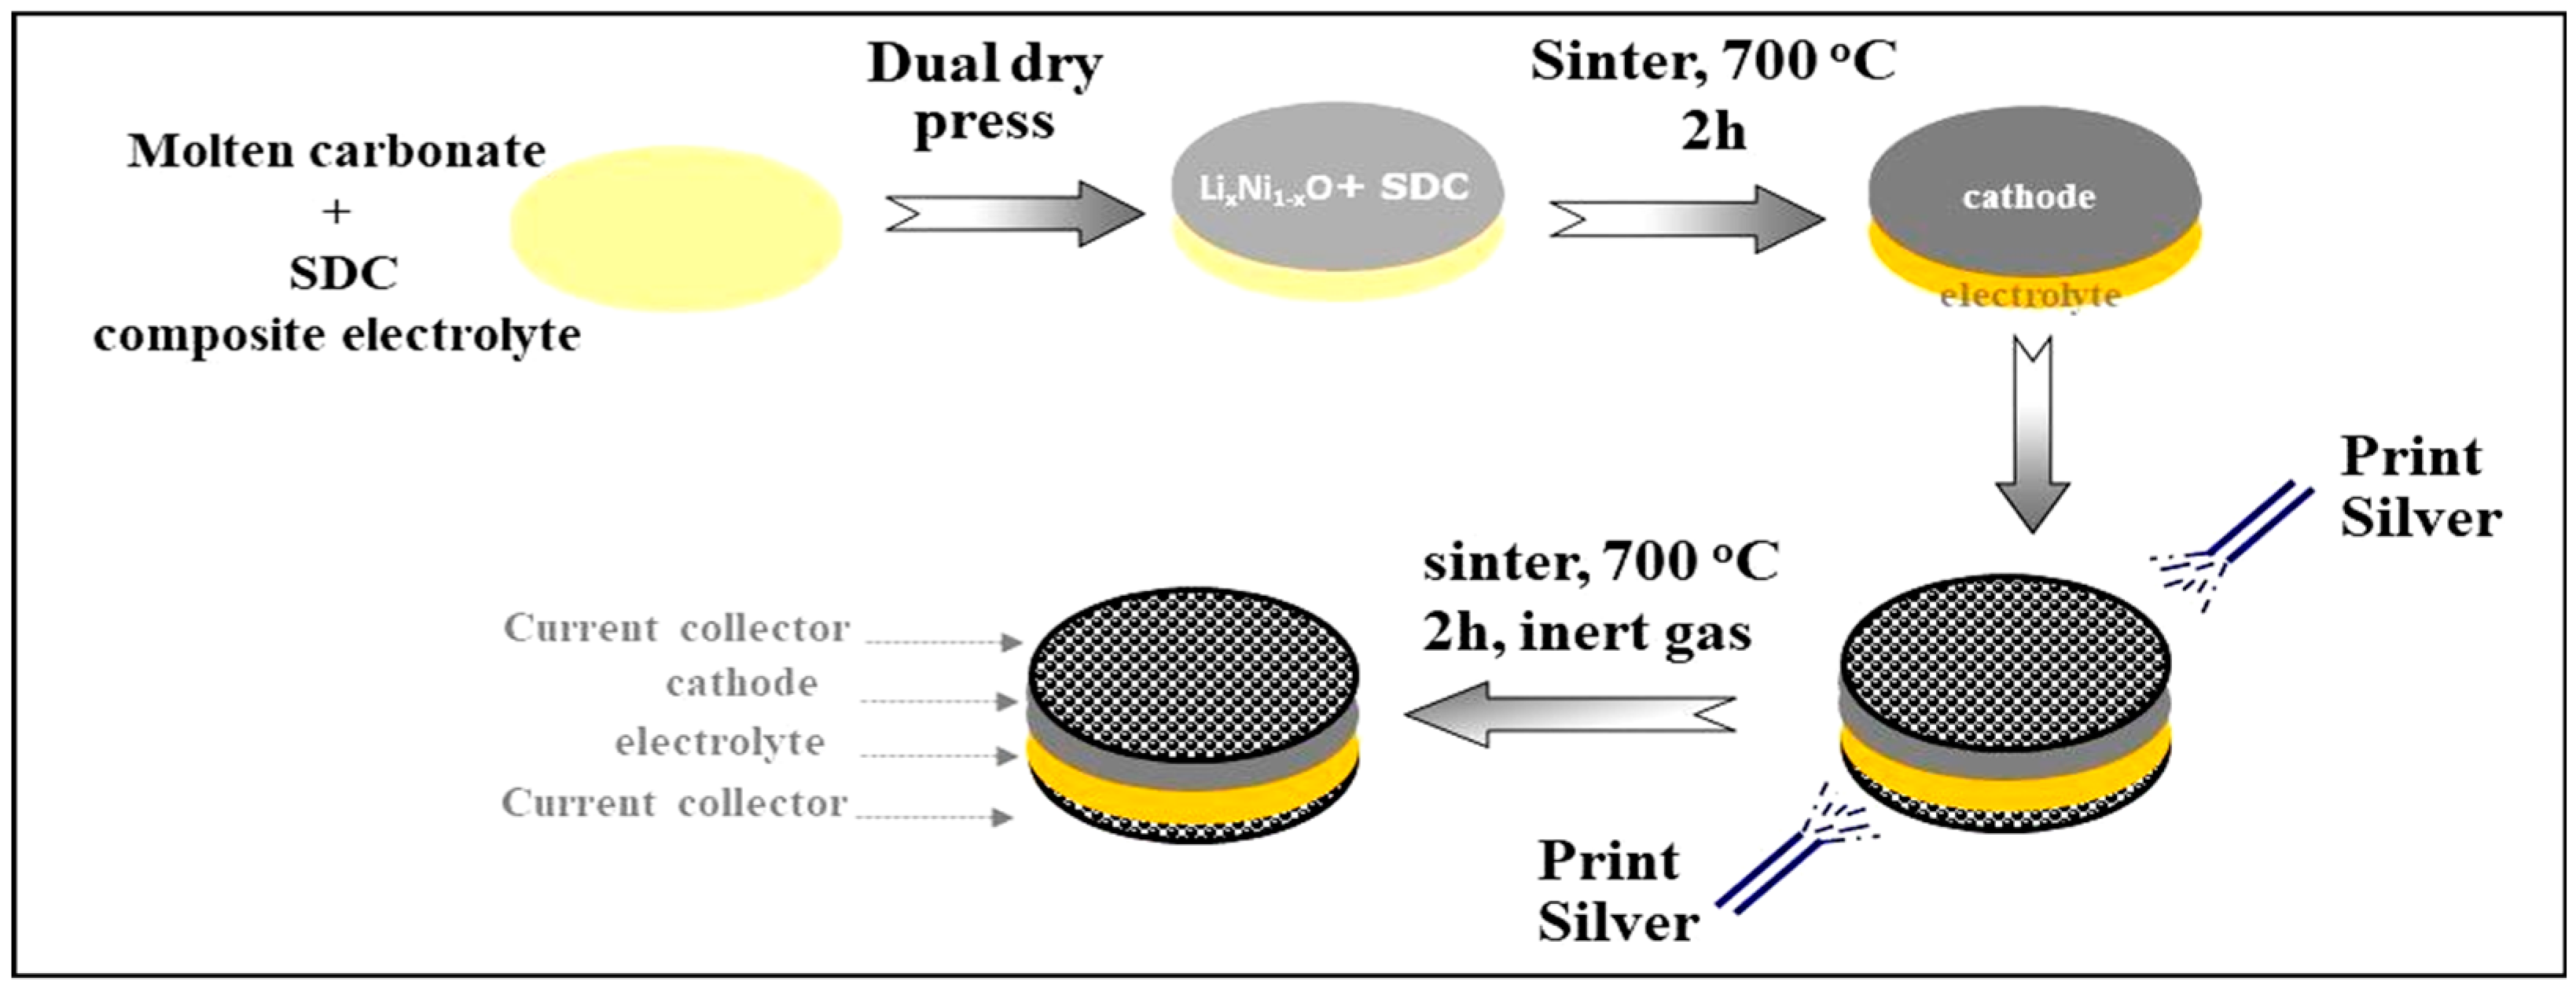
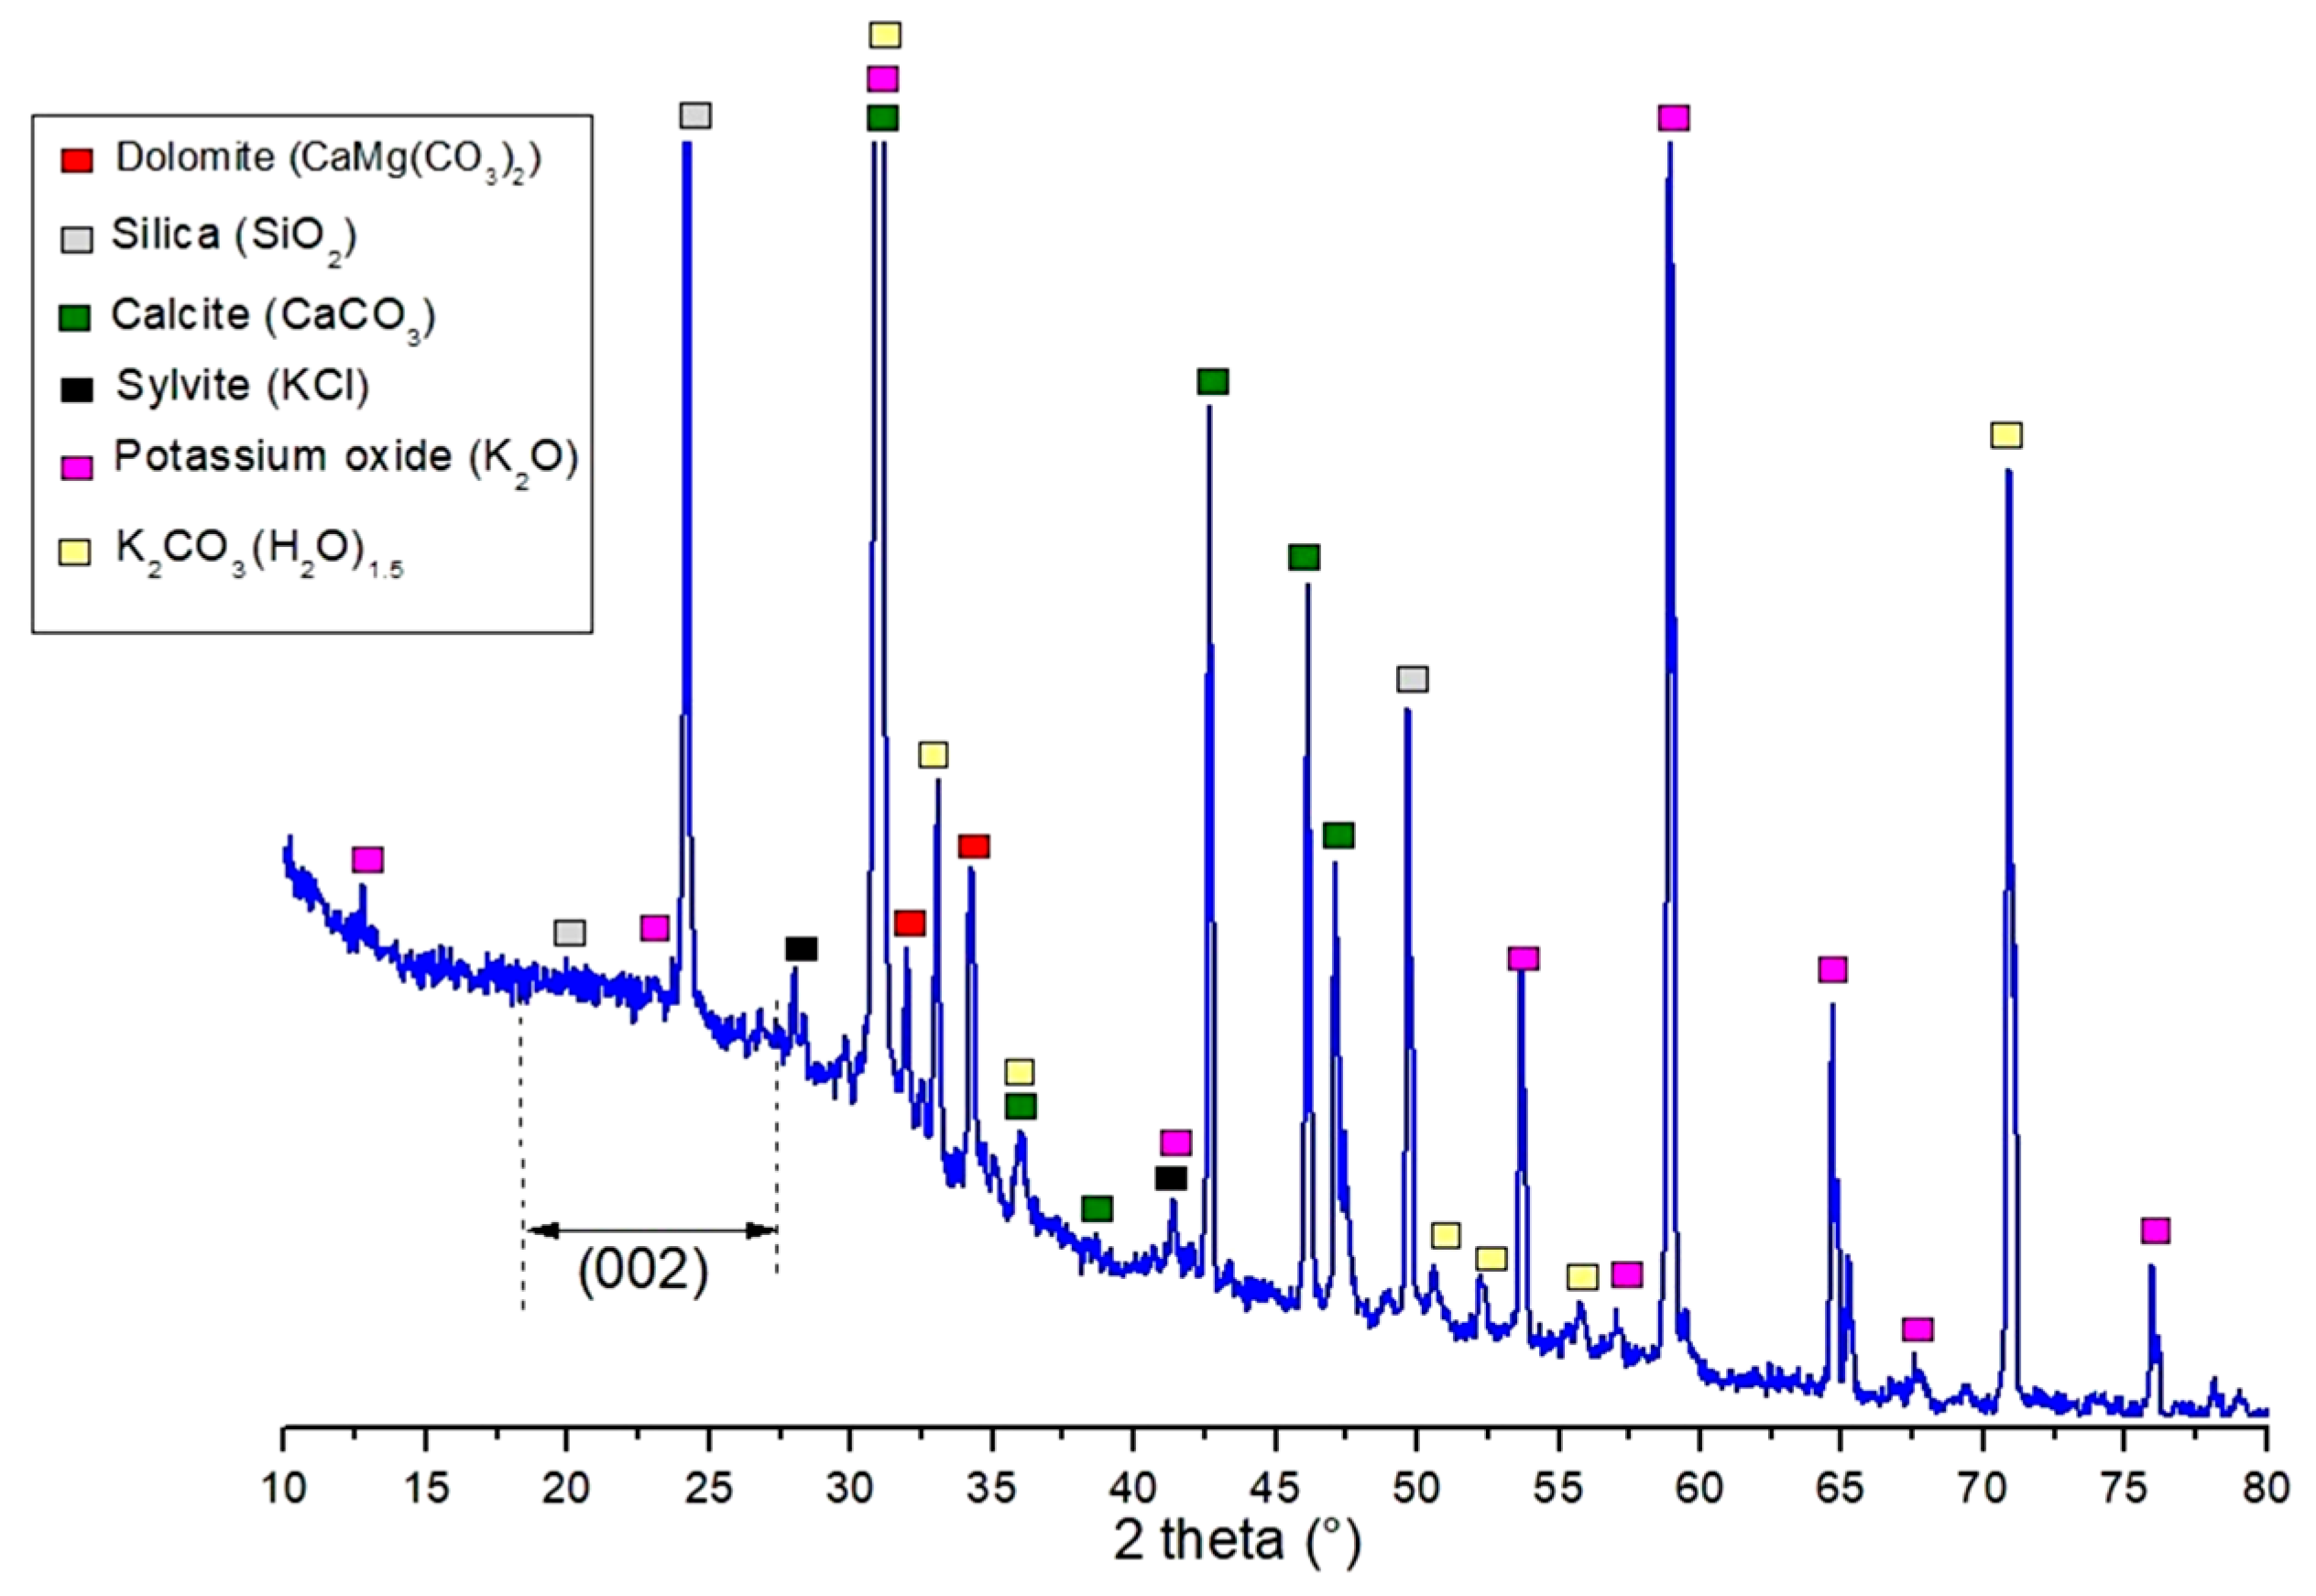
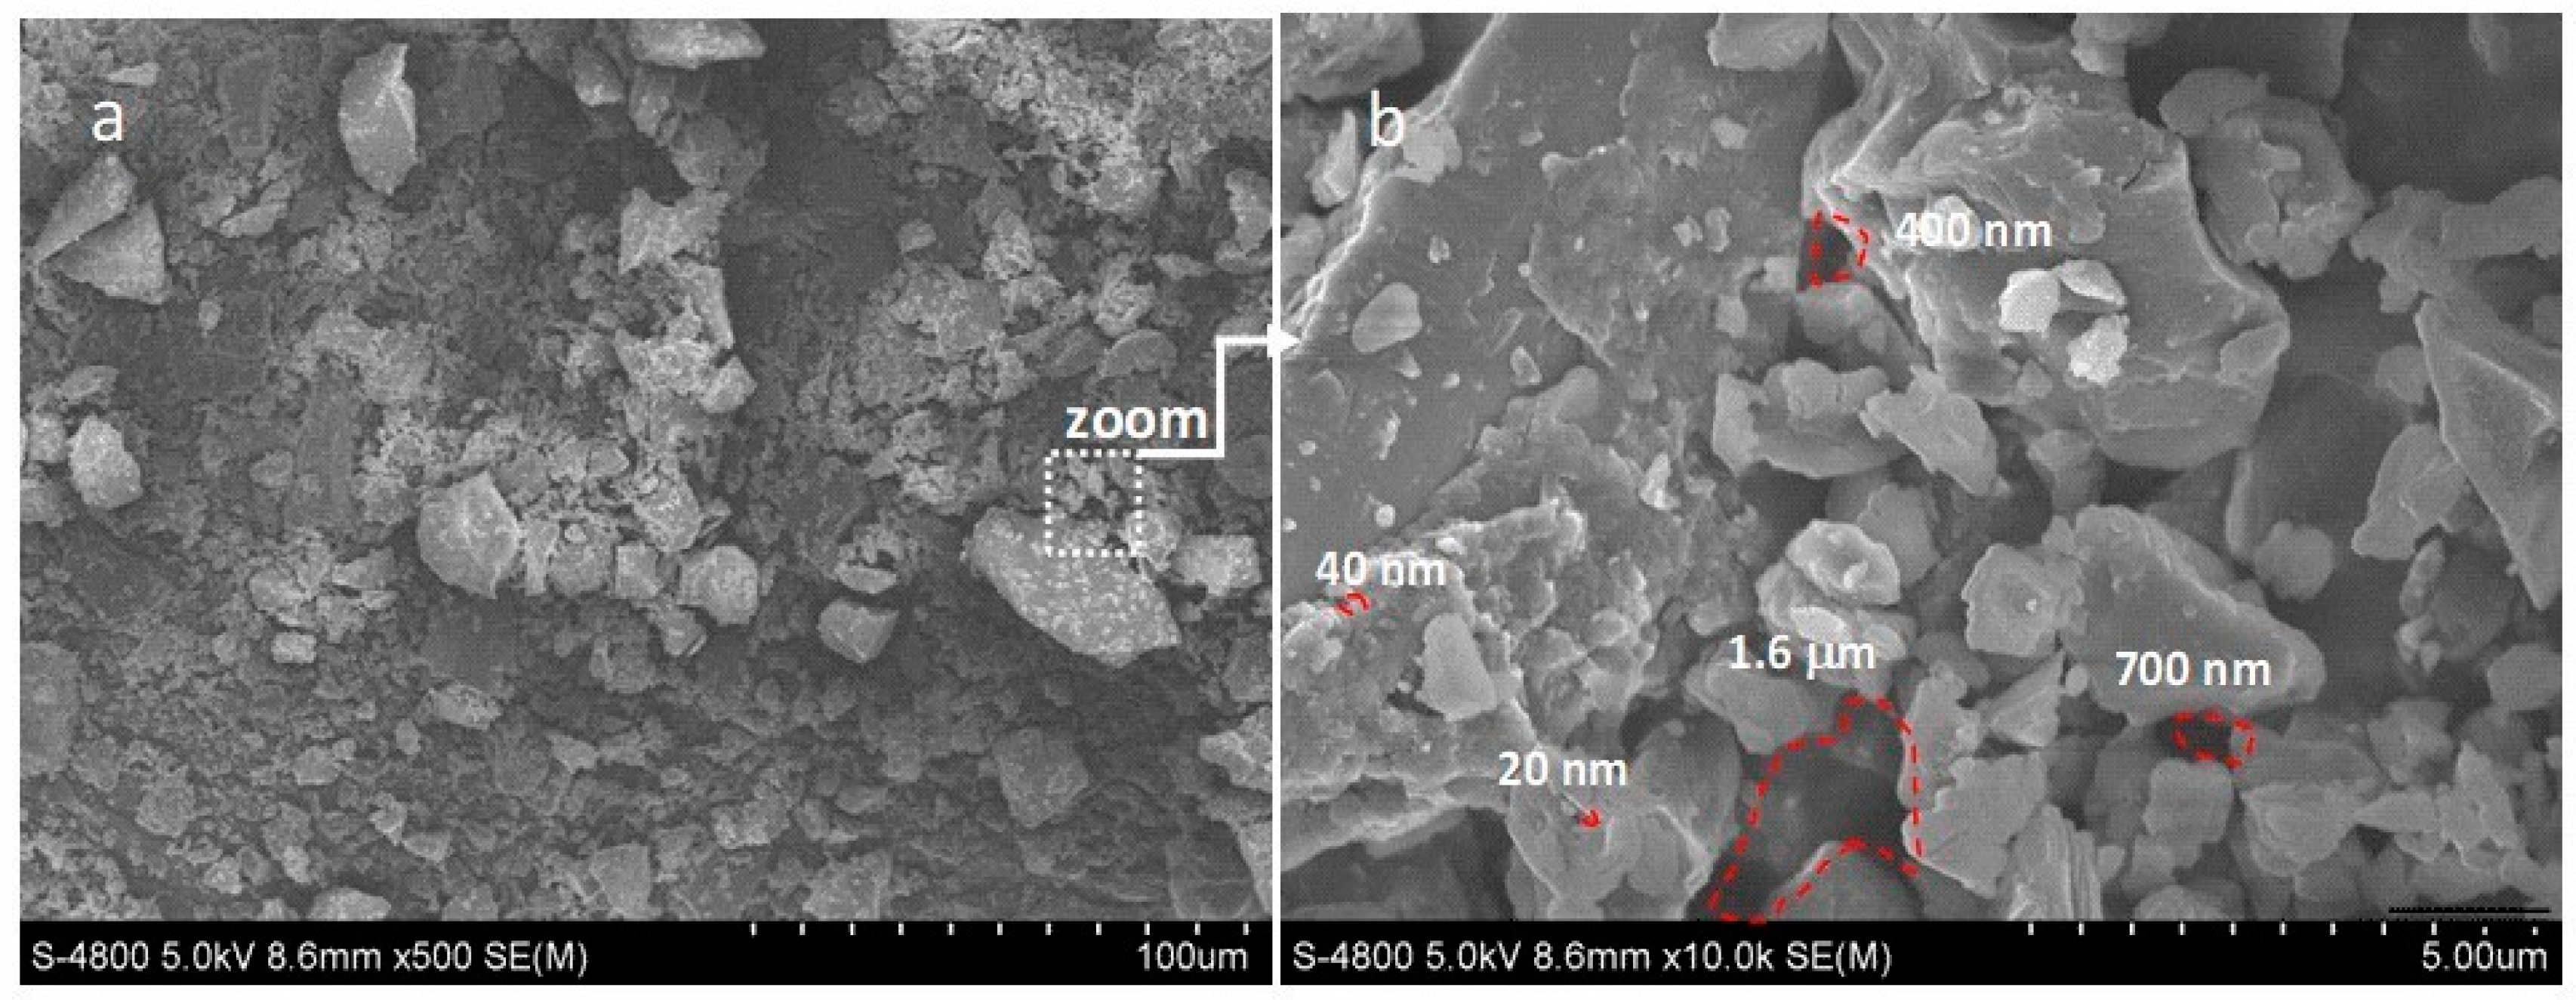
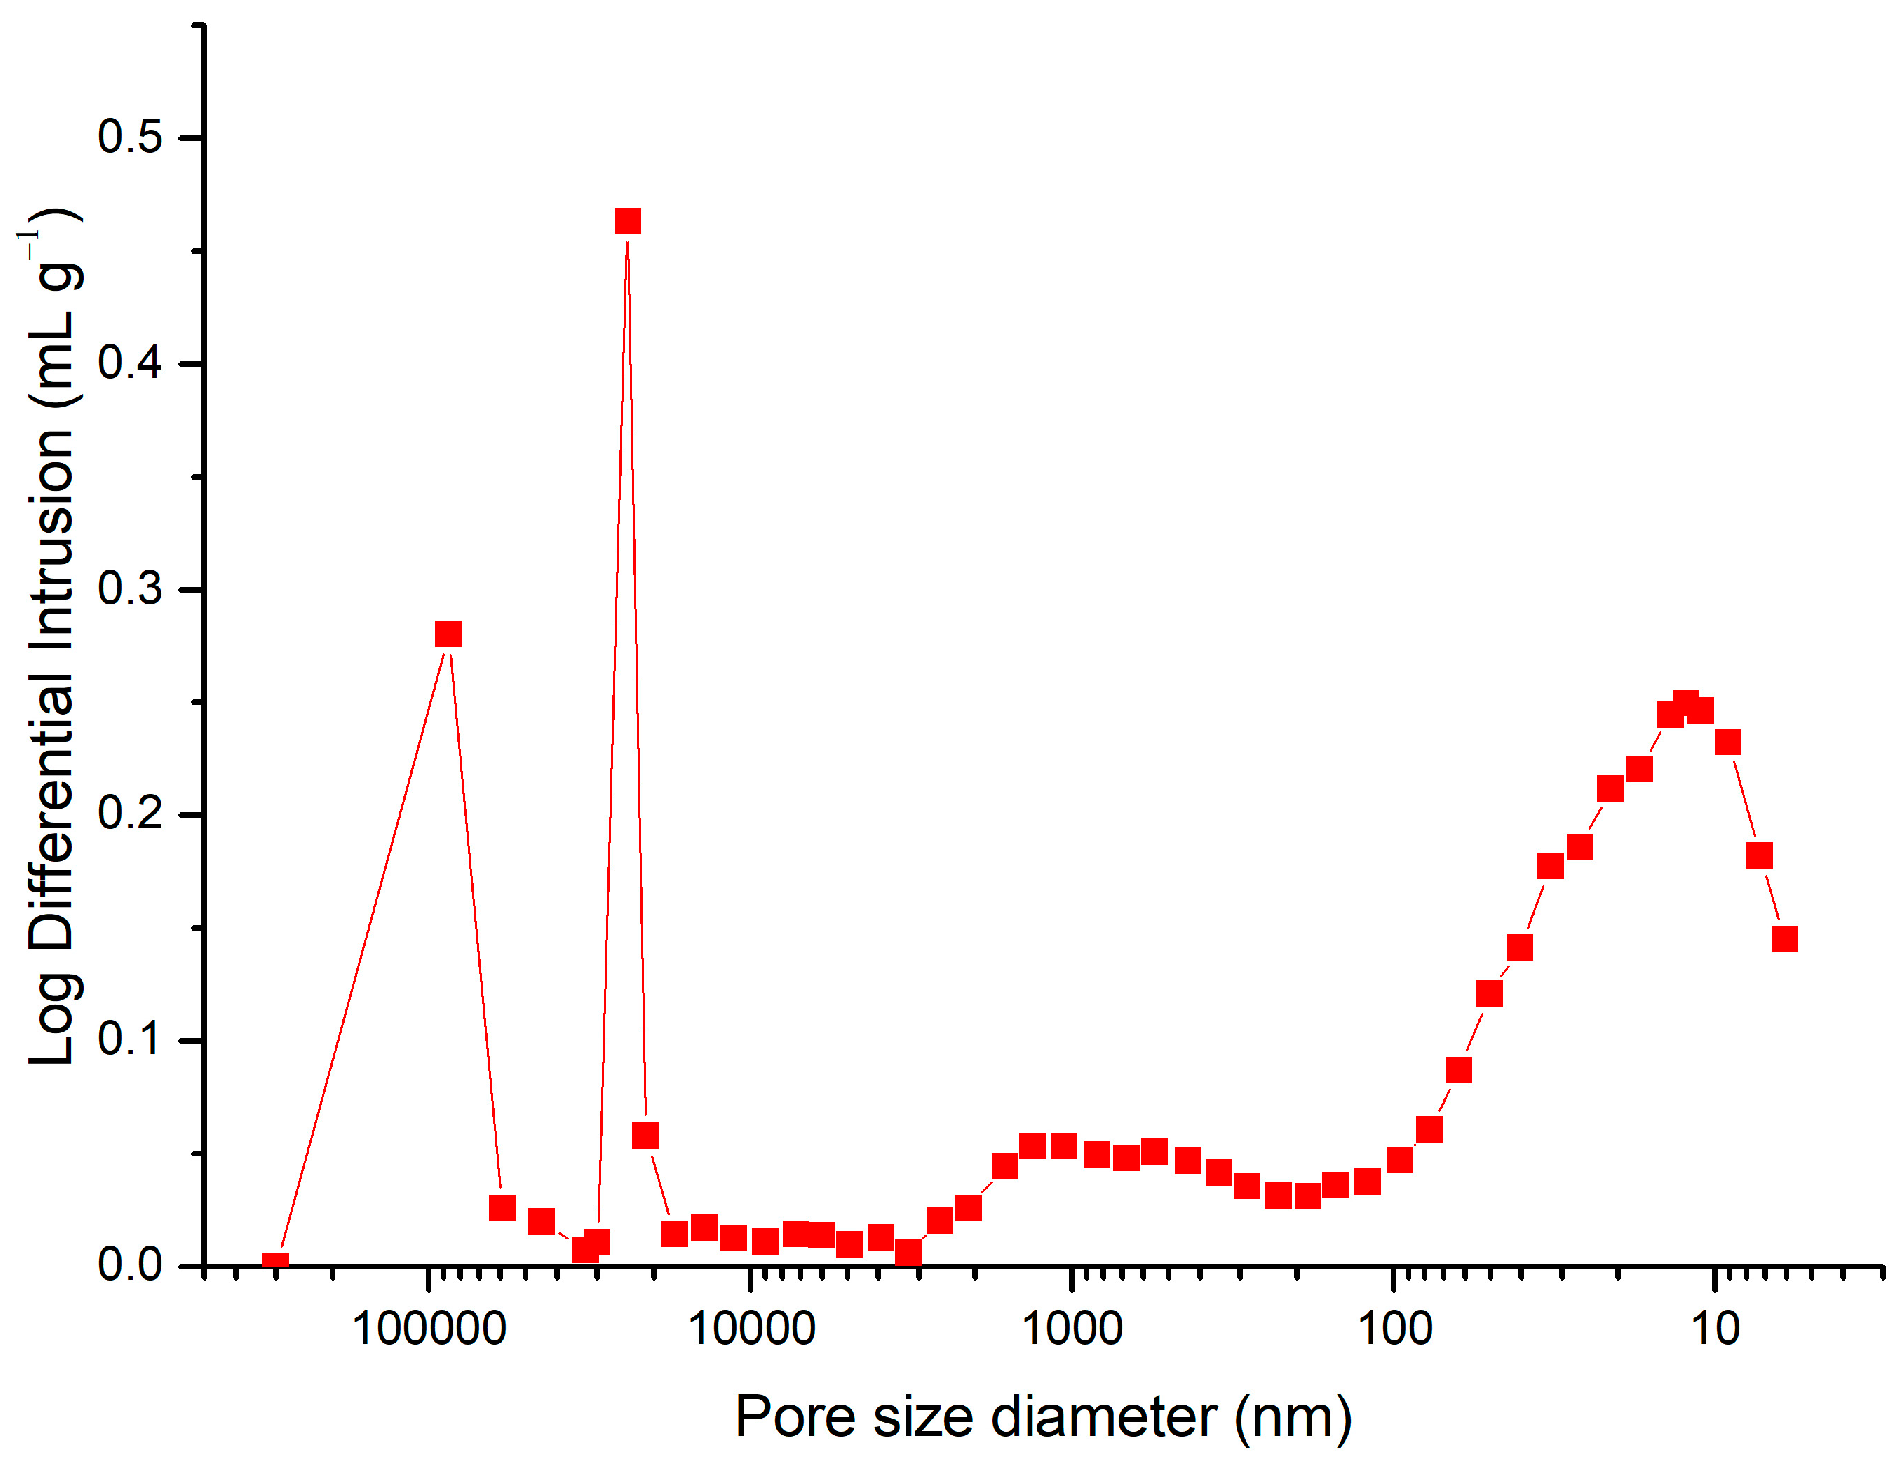
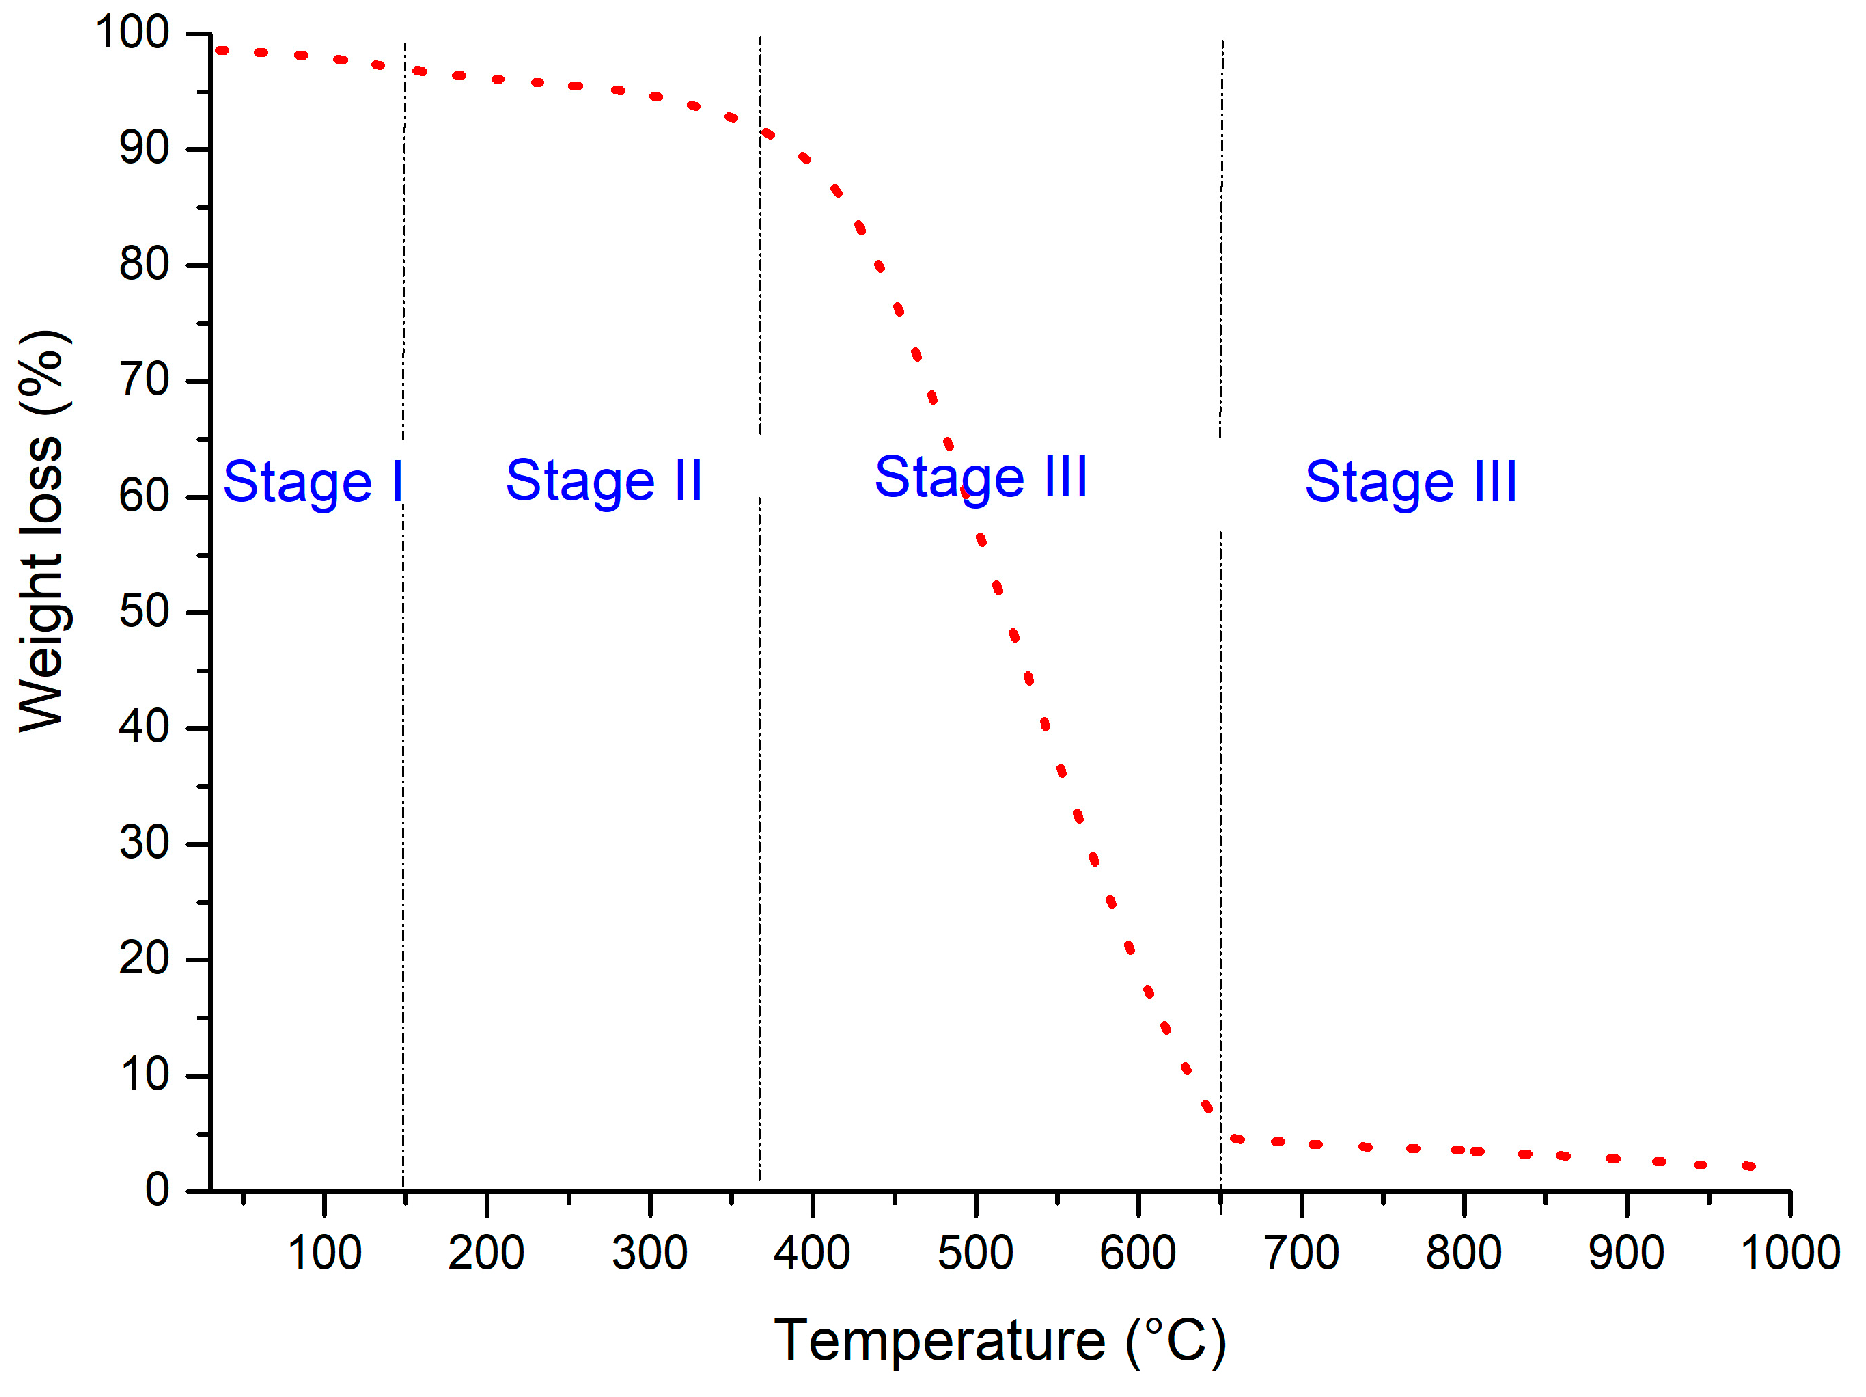
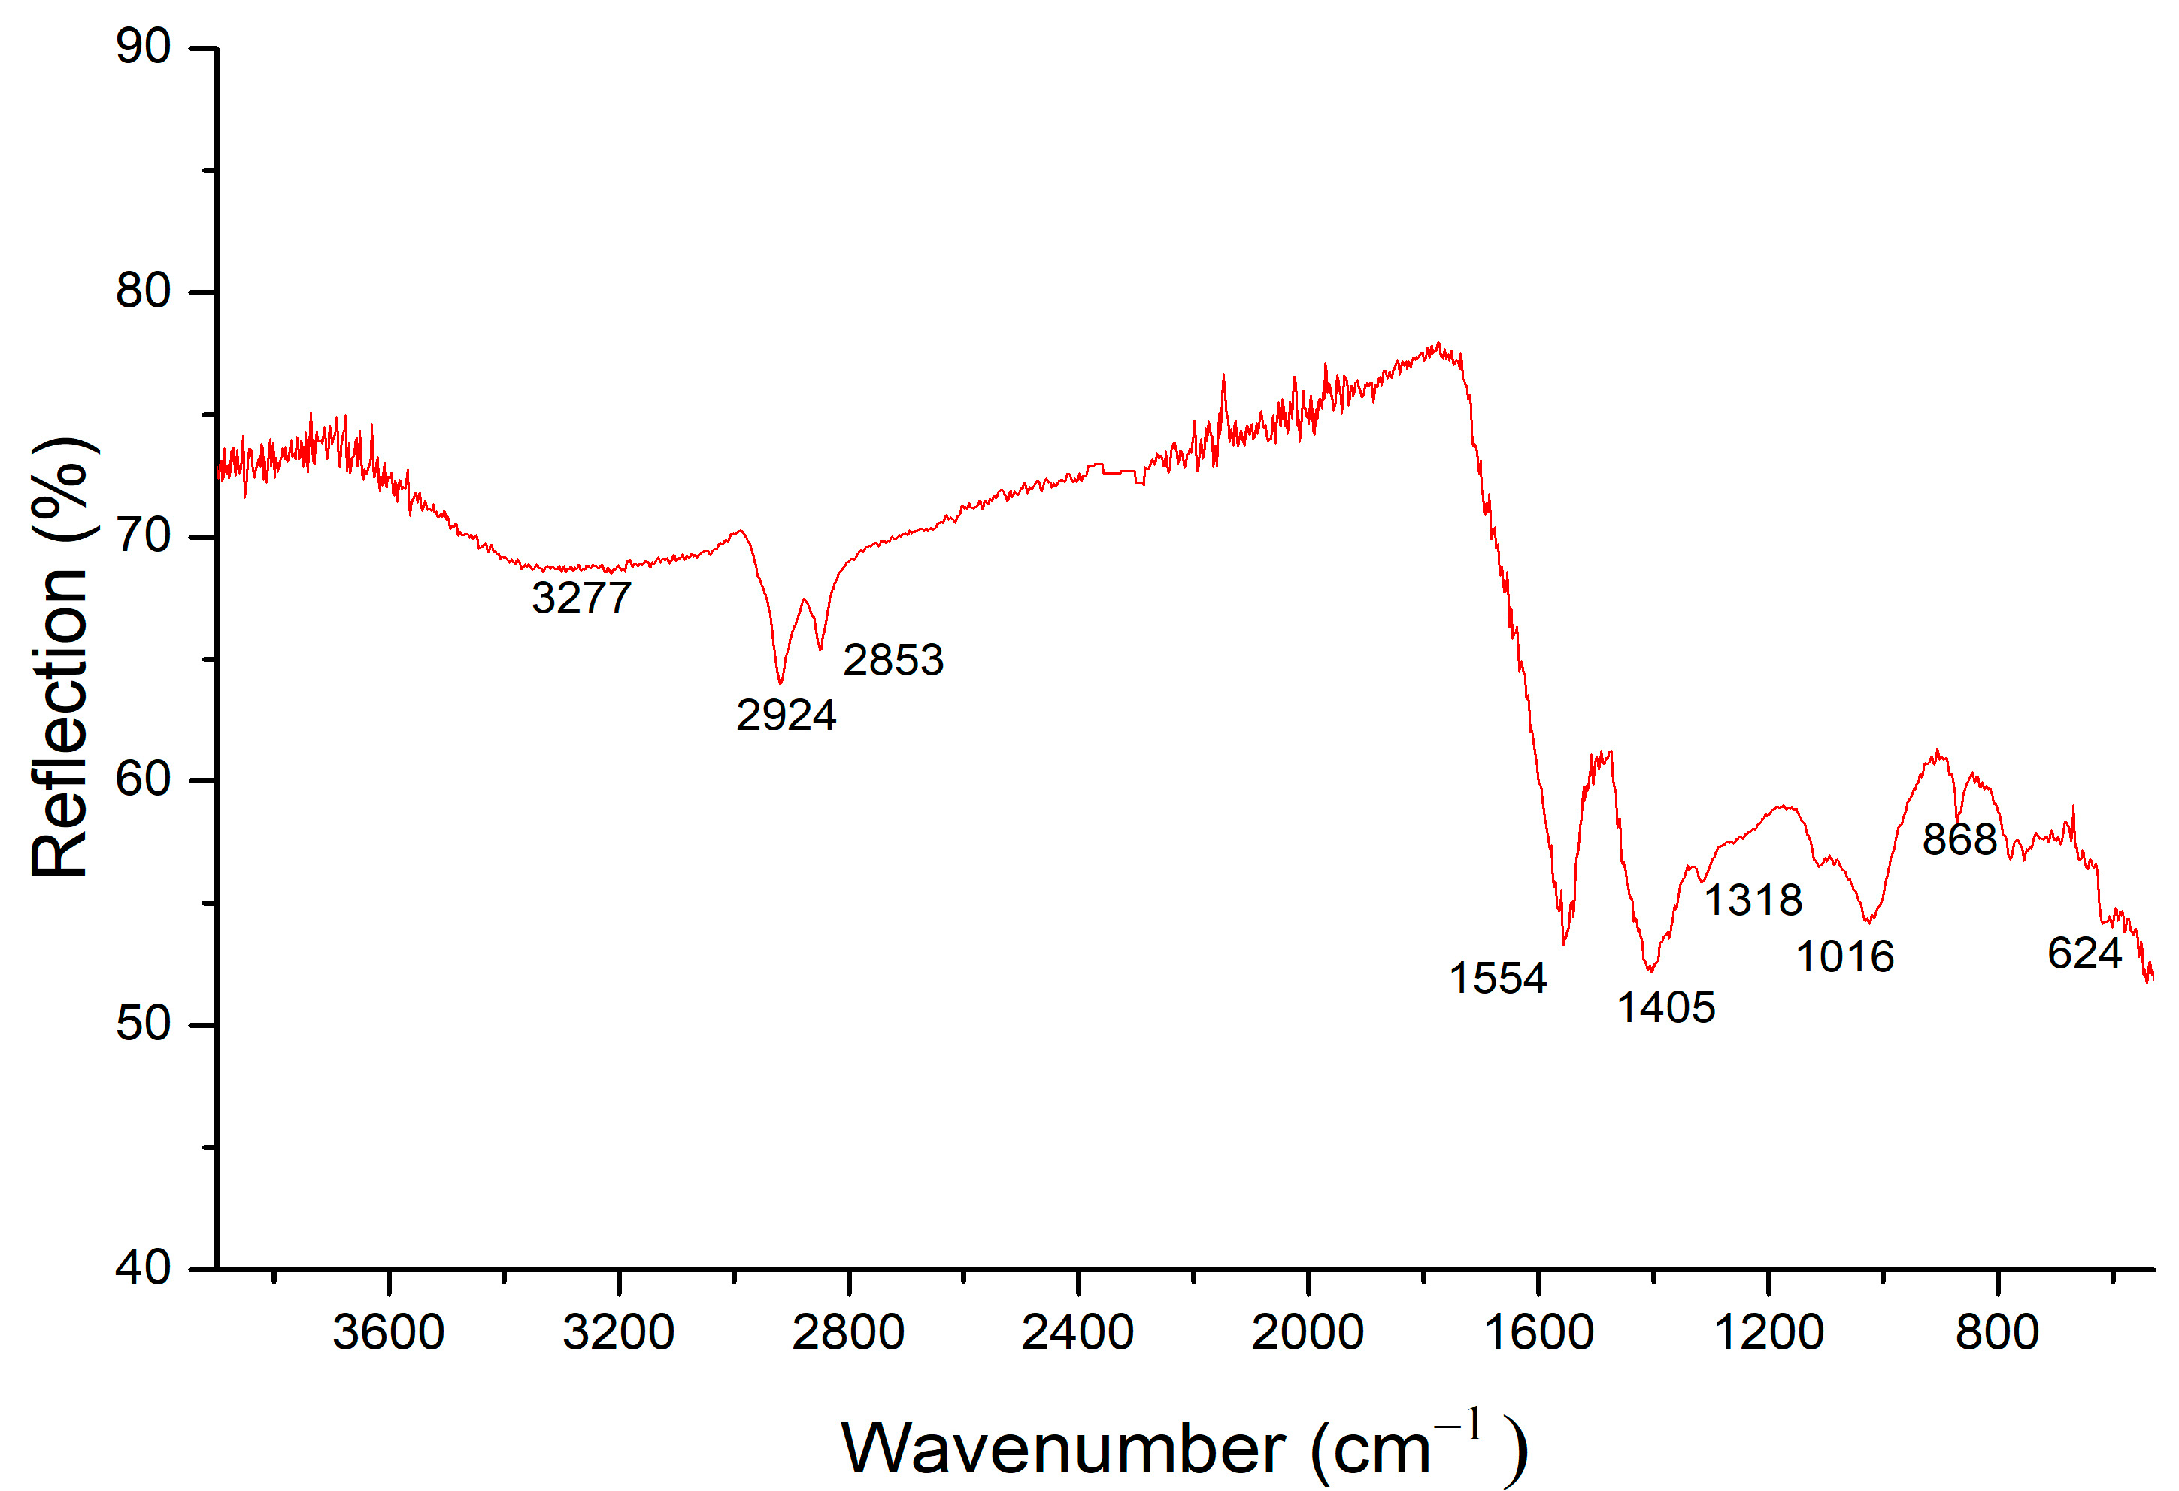
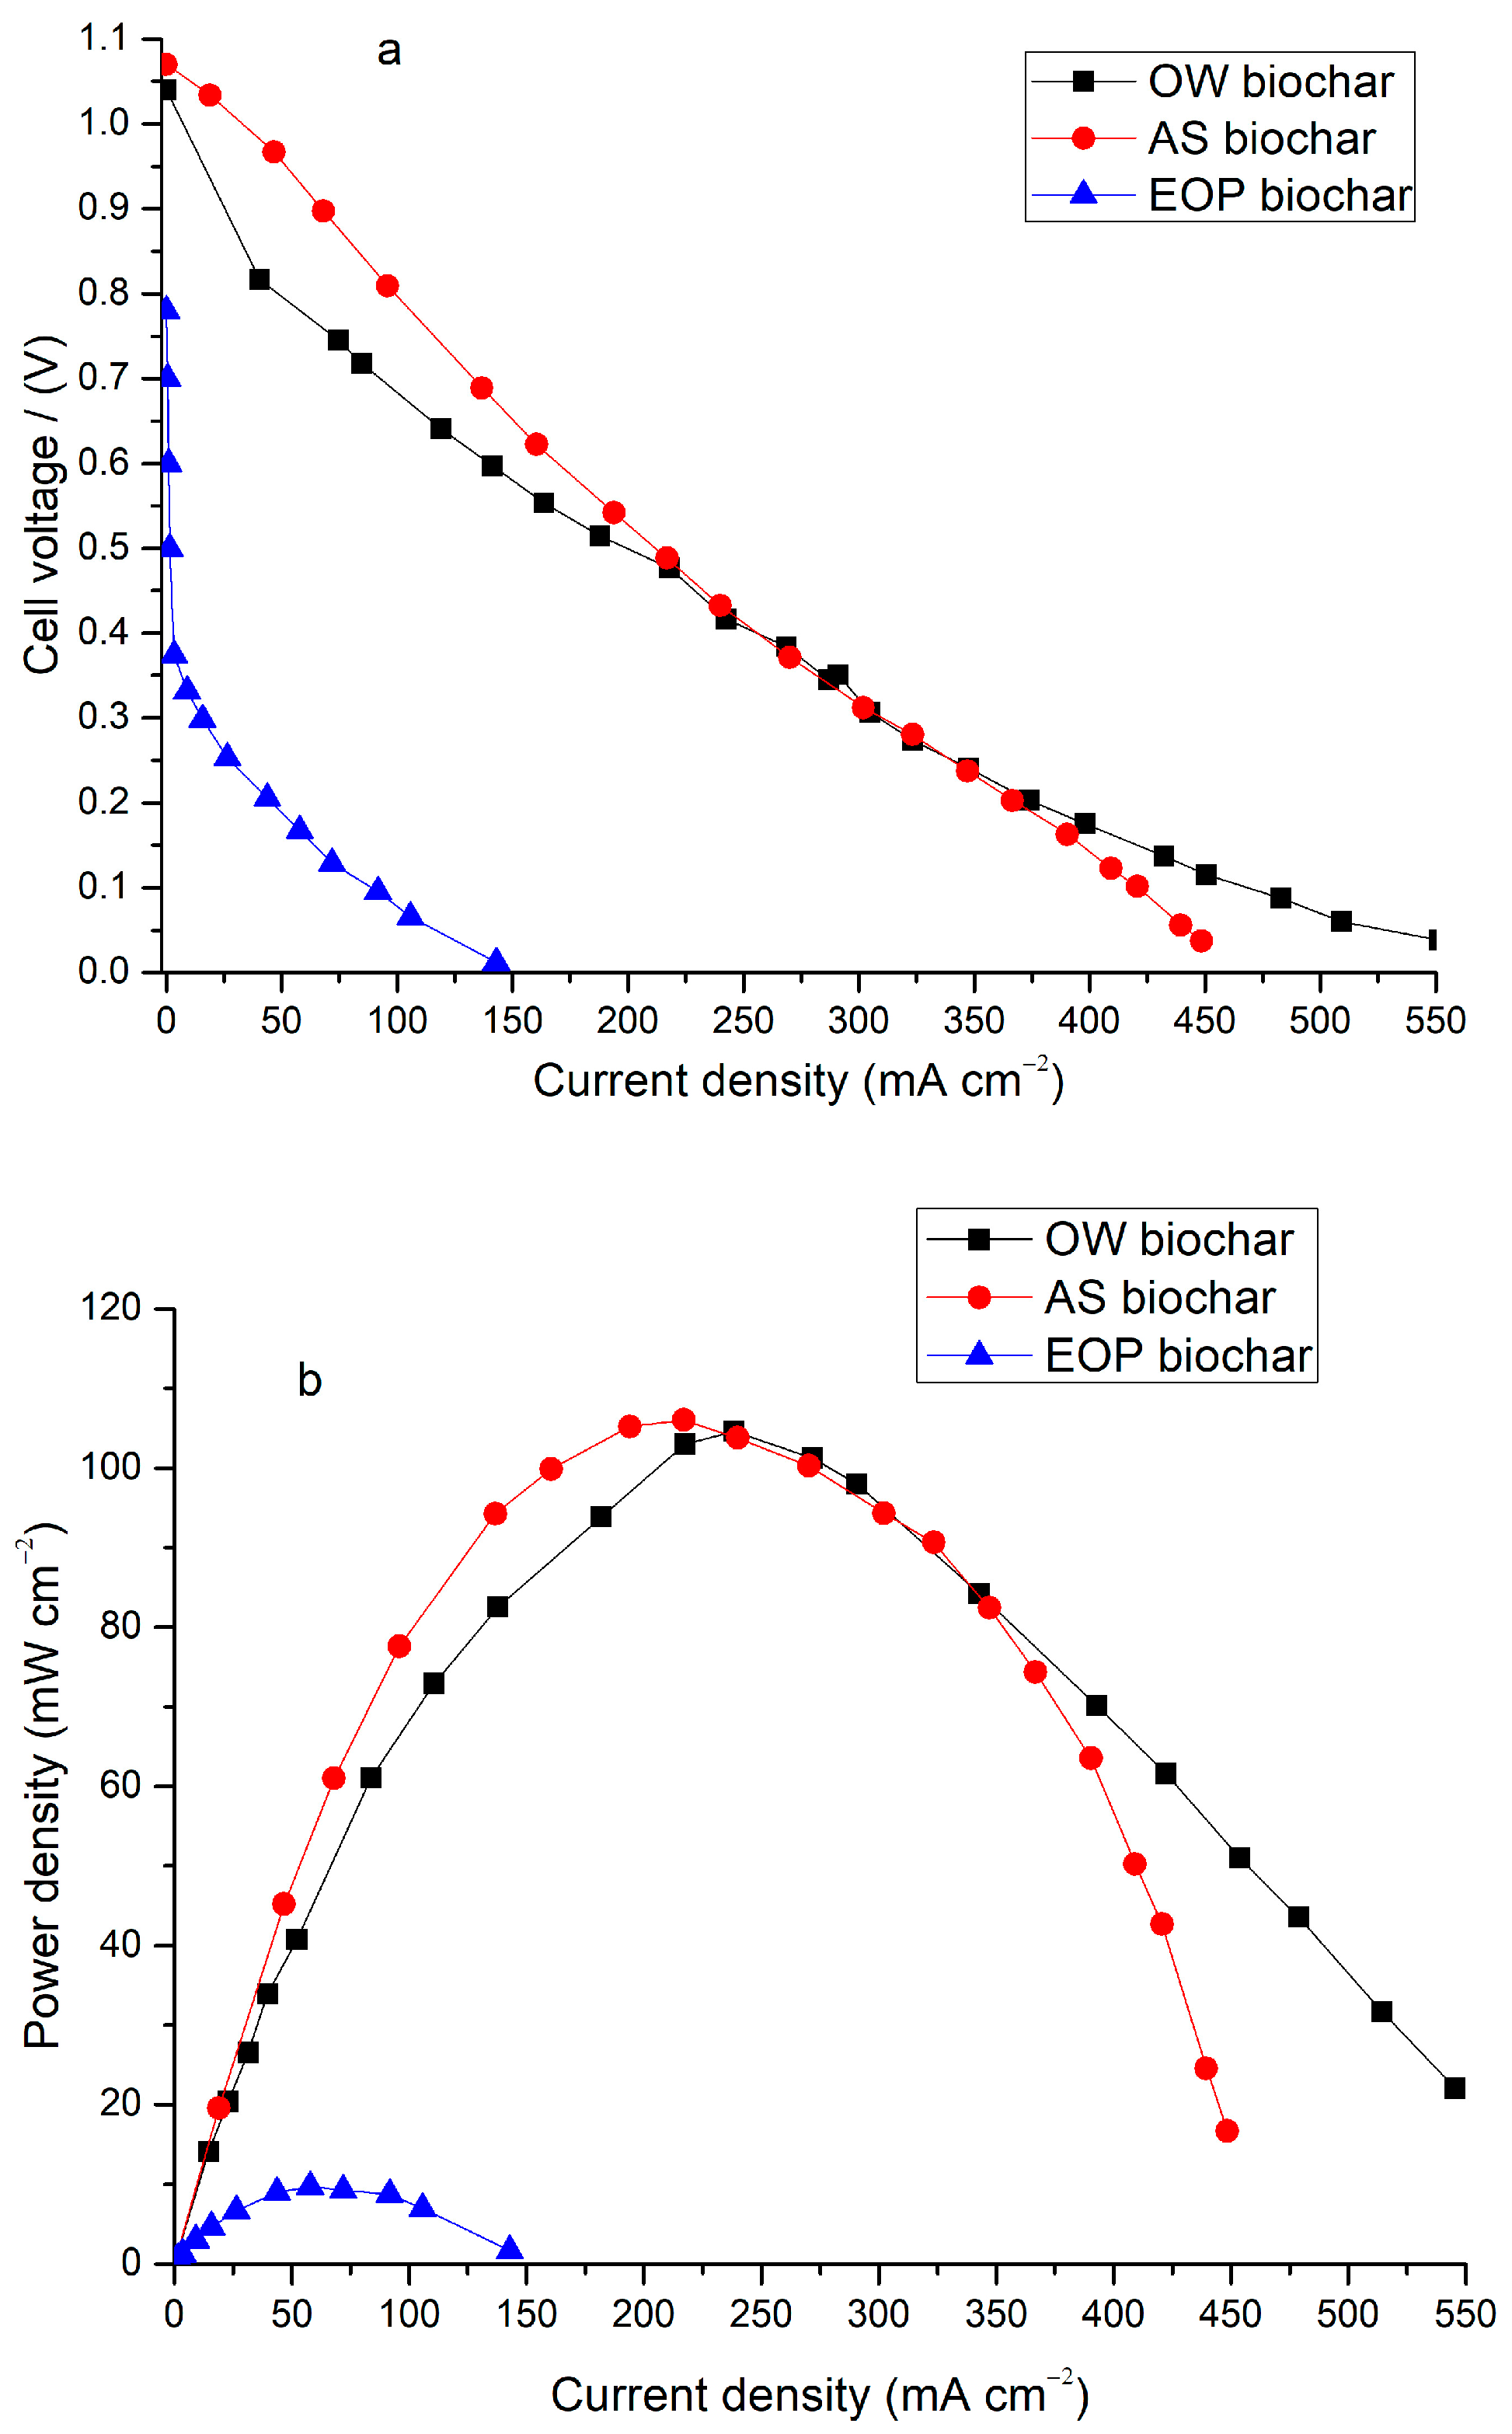
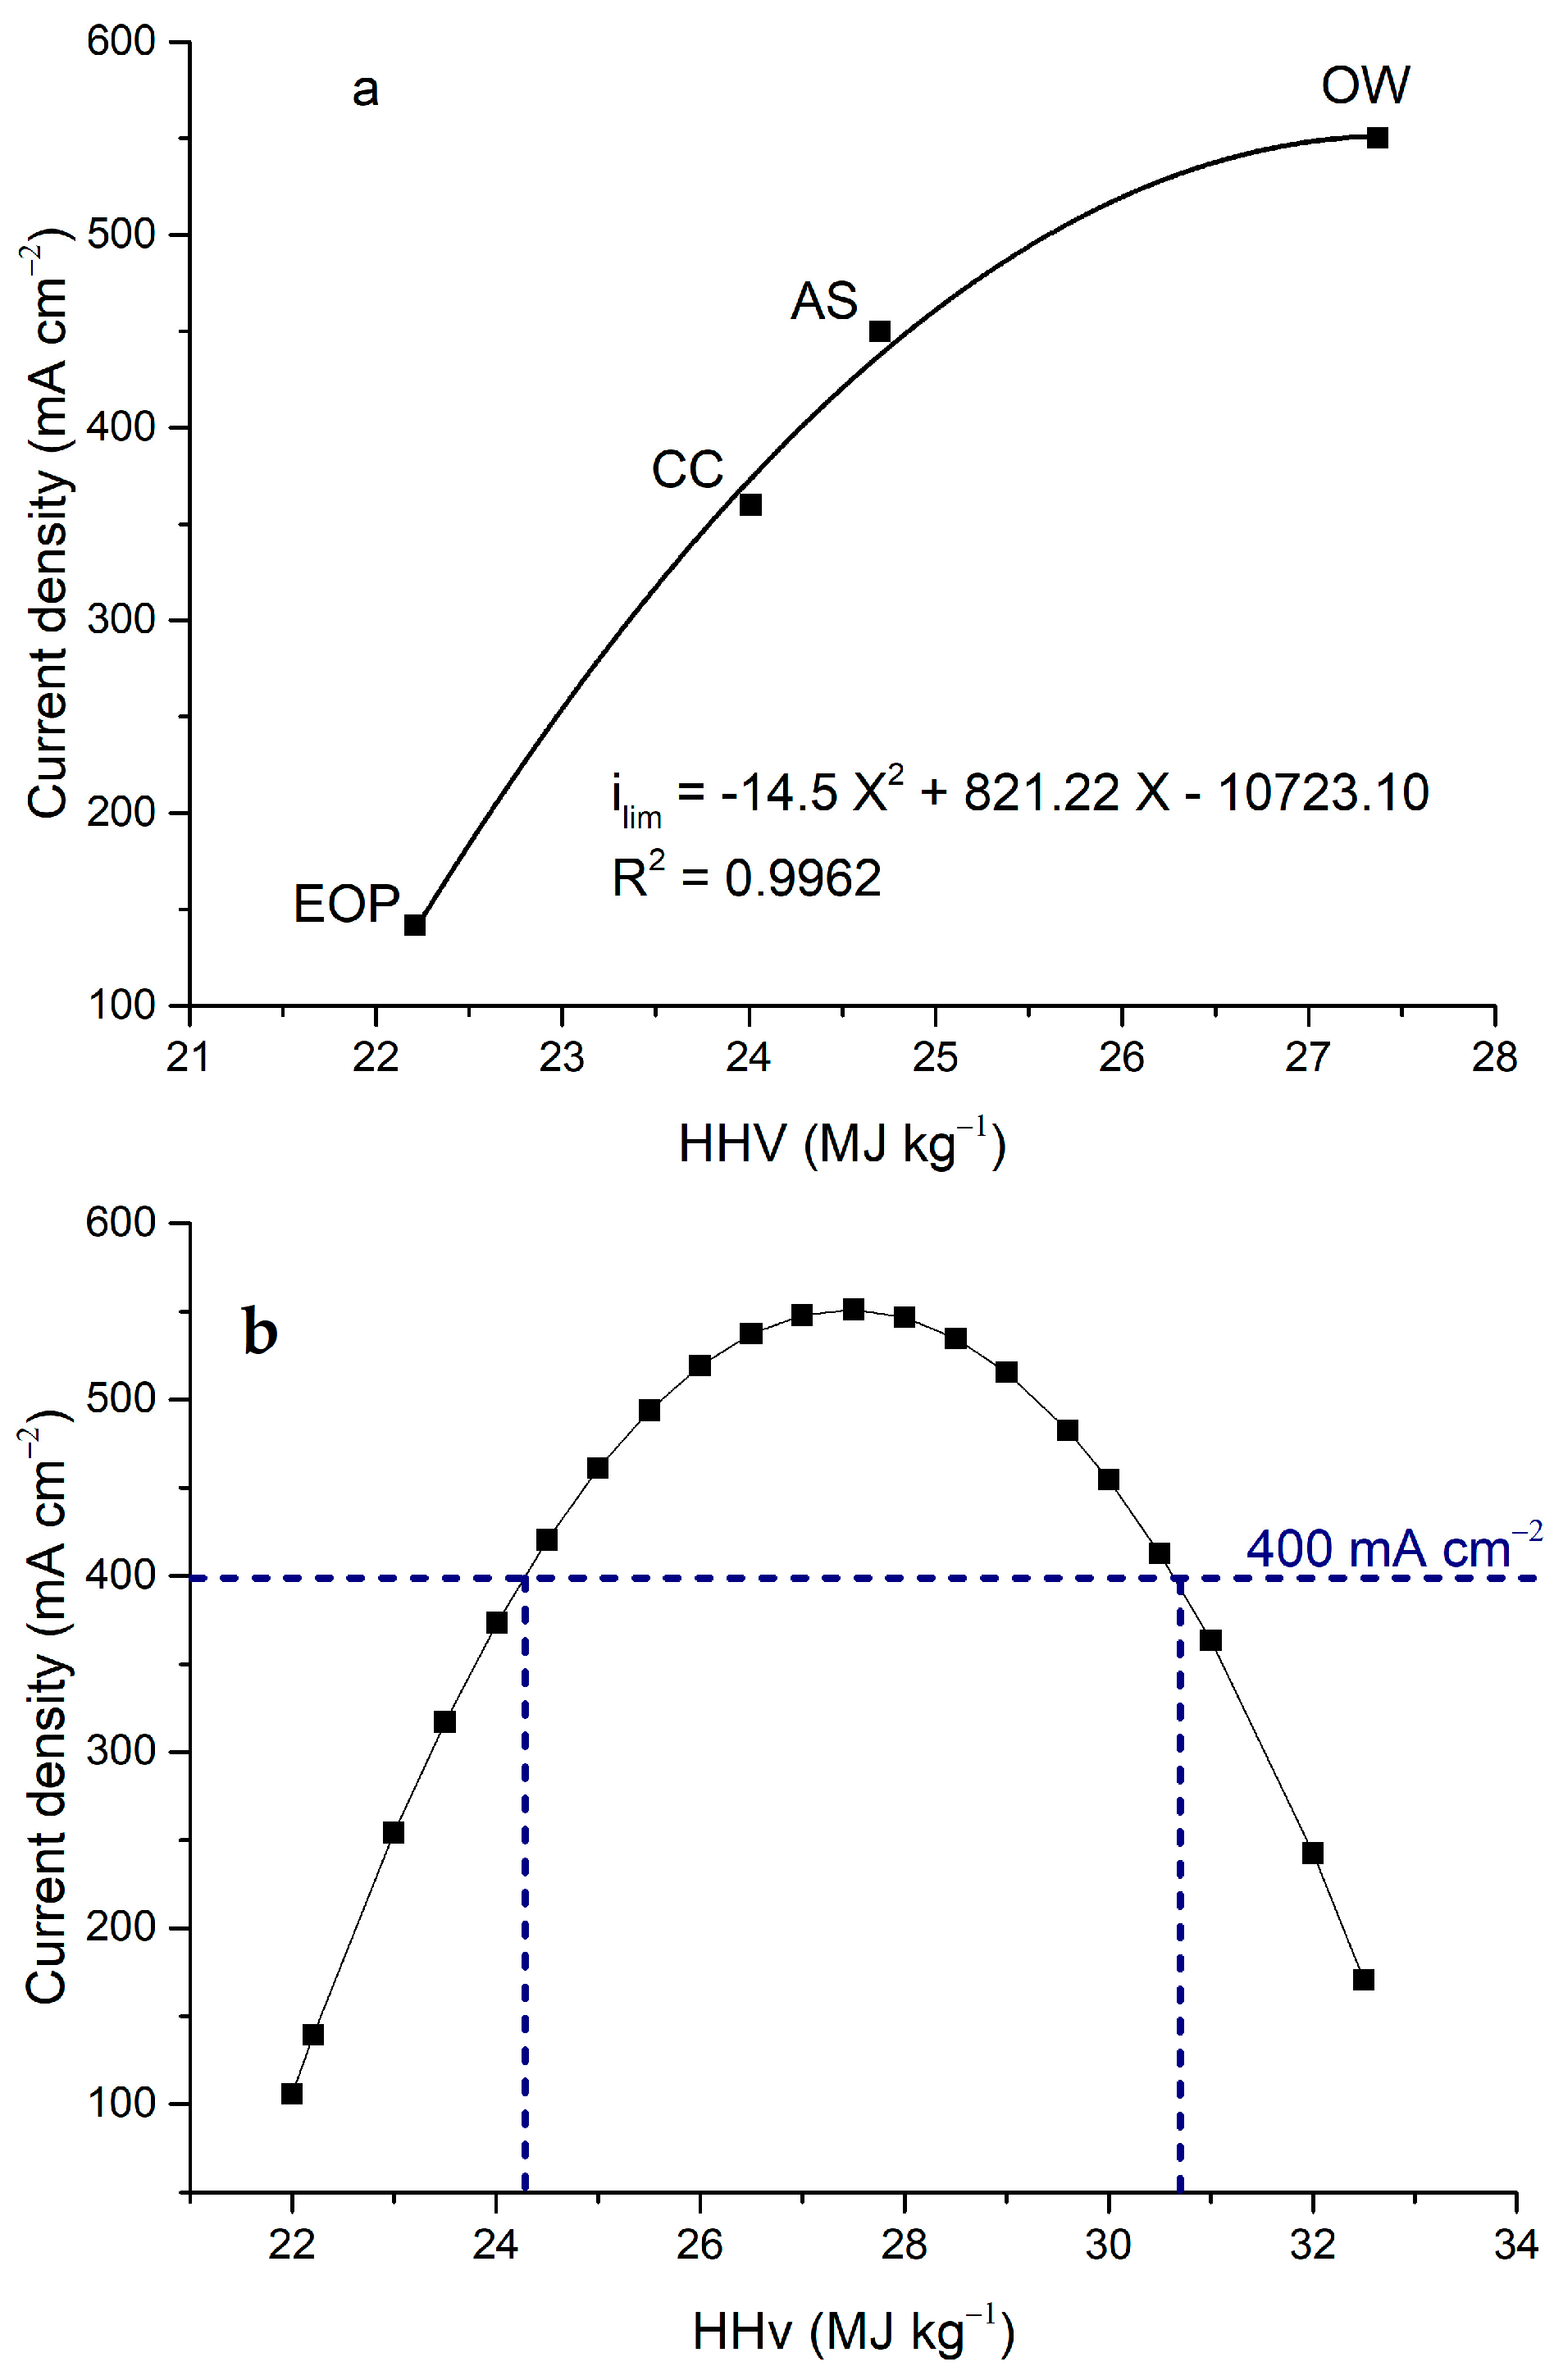
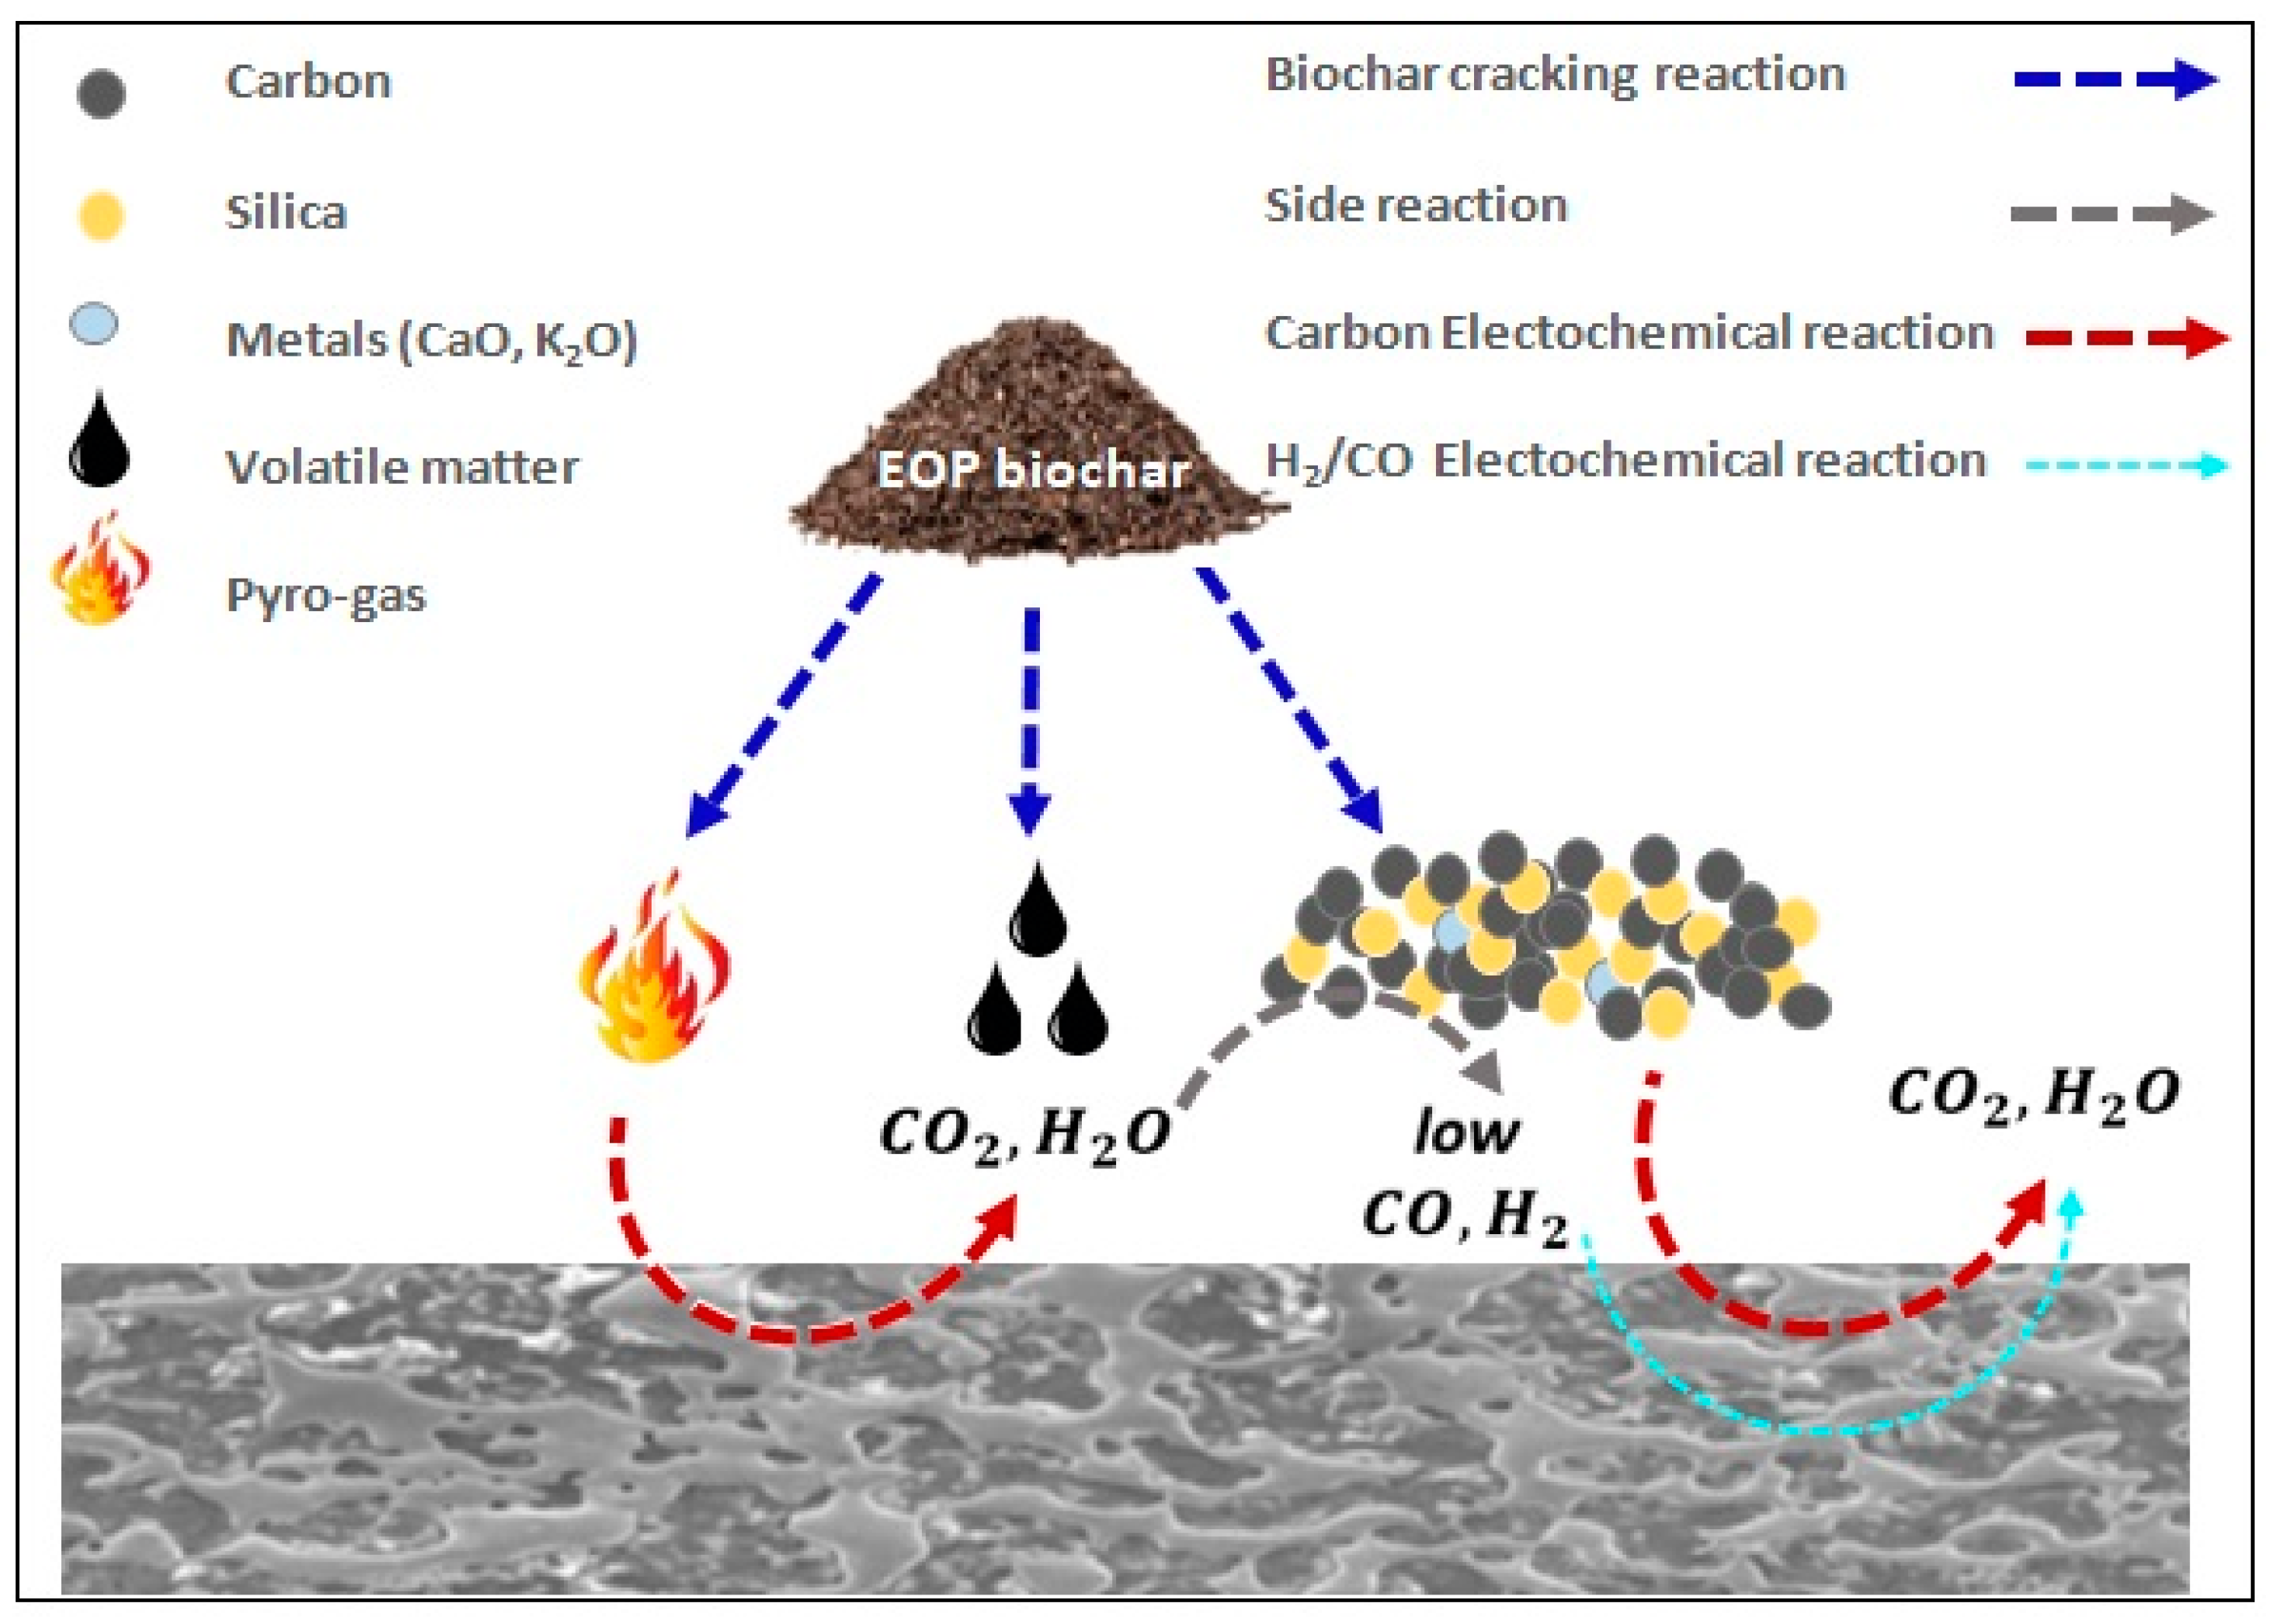
Table 1.
Proximate and elemental analysis of the EOP raw material and its derived biochar.
| Analysis | Sample | EOP Raw Material | EOP Biochar |
|---|---|---|---|
| Proximate analysis (%) | Moisture | 7.31 | 1.38 |
| Ash | 10.91 | 21.55 | |
| Fixed carbon ** | 25.28 | 36.45 | |
| Volatile matter | 56.5 | 40.62 | |
| Ultimate analysis * (%) | C | 39.45 | 65.7 |
| H | 5.58 | 3.4 | |
| N | 2.68 | 0.88 | |
| S | <0.8 | 0.08 | |
| O ** | 41.2 | 29.93 | |
| Molar formula | CH1.69 O0.78N0.058 | CH0.62O0.34N0.01 | |
| Lignocellulosic material composition | Hemicellulose (%) | 13 | |
| Cellulose (%) | 27 | ||
| Lignin (%) | 49 | ||
| High heating value (HHV. MJ kg−1) | 14.43 | 22.21 | |
| Low heating value (LHV. MJ kg−1) | 13.21 | 21.47 | |
* Dry basic. ** By difference.
Table 2.
Mineral composition of the EOP biochar ashes obtained using XRF analysis.
| Non-Organicelemental Composition (%) | EOP Biochar |
|---|---|
| MgO | 0.96 |
| Al2O3 | 1.79 |
| SiO2 | 55.21 |
| P2O5 | 3.33 |
| SO3 | 2.06 |
| K2O | 13.72 |
| CaO | 16.31 |
| Fe2O3 | 3.93 |
| SrO | 0.40 |
| Cl | 1.98 |
| TiO2 | 0.30 |
Table 3.
Summarized properties of the EOP biochar sample.
| EOP Biochar | |
|---|---|
| Crystalline parameters | |
| d002 (nm) | 0.3622 |
| Lc (nm) | 24.02 |
| Hg porosimetry analysis | |
| Specific surface area (m2·g−1) | 52.495 |
| Total pore volume (cm3·g−1) | 0.4866 |
| Porosity (%) | 36 |
| Average pore diameter (nm) | 37.1 |
| Bulk density (g·cm−3) | 0.75521 |
| Apparent density (g·cm−3) | 1.1879 |
| Energy density (GJ·m−3) | 27.97 |
Disclaimer/Publisher’s Note: The statements, opinions and data contained in all publications are solely those of the individual author(s) and contributor(s) and not of MDPI and/or the editor(s). MDPI and/or the editor(s) disclaim responsibility for any injury to people or property resulting from any ideas, methods, instructions or products referred to in the content. |
© 2023 by the authors. Licensee MDPI, Basel, Switzerland. This article is an open access article distributed under the terms and conditions of the Creative Commons Attribution (CC BY) license (https://creativecommons.org/licenses/by/4.0/).
Share and Cite
MDPI and ACS Style
Grioui, N.; Elleuch, A.; Halouani, K.; Li, Y. Valorization of Exhausted Olive Pomace for the Production of a Fuel for Direct Carbon Fuel Cell. C 2023, 9, 22. https://doi.org/10.3390/c9010022
AMA Style
Grioui N, Elleuch A, Halouani K, Li Y. Valorization of Exhausted Olive Pomace for the Production of a Fuel for Direct Carbon Fuel Cell. C. 2023; 9(1):22. https://doi.org/10.3390/c9010022
Chicago/Turabian StyleGrioui, Najla, Amal Elleuch, Kamel Halouani, and Yongdan Li. 2023. "Valorization of Exhausted Olive Pomace for the Production of a Fuel for Direct Carbon Fuel Cell" C 9, no. 1: 22. https://doi.org/10.3390/c9010022
Note that from the first issue of 2016, this journal uses article numbers instead of page numbers. See further details here.