Article

Computed Tomography-Assisted Study of the Liquid Contrast Agent’s Spread in a Hydrogel Phantom of the Brain Tissue

by
Anastasia S. Vanina
1,
Alexander V. Sychev
2,
Anastasia I. Lavrova
3,4,
Pavel V. Gavrilov
3,
Polina L. Andropova
5,
Elena V. Grekhnyova
1,
Tatiana N. Kudryavtseva
1 and
Eugene B. Postnikov
6,7,*
1
Laboratory of Organic Synthesis, Kursk State University, Radishcheva St. 33, Kursk 305000, Russia
2
Research Center for Condensed Matter Physics, Kursk State University, Radishcheva St. 33, Kursk 305000, Russia
3
Saint-Petersburg State Research Institute of Phthisiopulmonology, Lygovsky Av. 2–4, Saint-Petersburg 191036, Russia
4
Faculty of Medicine, Saint-Petersburg State University, Universitetskaya Emb 7–9, Saint-Petersburg 199034, Russia
5
N. P. Bechtereva Institute of the Human Brain, Russian Academy of Sciences, Akad. Pavlov St. 9, Saint-Petersburg 197376, Russia
6
Department of Theoretical Physics, Kursk State University, Radishcheva St. 33, Kursk 305000, Russia
7
Institute of Physics, Saratov State University, Astrakhanskaya St. 83, Saratov 410012, Russia
*
Author to whom correspondence should be addressed.
Fluids 2023, 8(6), 167; https://doi.org/10.3390/fluids8060167
Submission received: 19 April 2023 / Revised: 22 May 2023 / Accepted: 23 May 2023 / Published: 26 May 2023
(This article belongs to the Section Non-Newtonian and Complex Fluids)

Abstract

:
Studying transport processes in the brain’s extracellular space is a complicated problem when considering the brain’s tissue. Tests of corresponding physical and mathematical problems, as well as the need for materials with cheap but realistic properties to allow for testing of drug delivery systems, lead to the development of artificial phantom media, one kind of which is explored in this work. We report results from quantifying the spread of a standard contrast agent used in clinical computed tomography, Iopromide, in samples of collagen-based hydrogels. Its pure variant as well as samples supplied with lipid and surfactant additives were explored. By comparing to solutions of the diffusion equation which reproduce these data, the respective diffusion coefficients were determined. It was shown that they are relevant to the range typical for living tissue, grow with elevation in the lipid content and diminish with growth in surfactant concentration.

1. Introduction

During the last decade, there has been a great deal of attention given to the transport processes in the brain’s interstitial system [1,2]; the respective extracellular space was even called the final frontier of neuroscience [3]. This space between neuronal and glial cells has an extremely complex topology and is filled with so-called interstitial liquid (ISL), which plays an essential role in supporting the processes of cells’ nutrition, waste clearance and the transfer of ions, metabolites, etc.
At the same time, the movement of the ISL itself [4] as well as the ISL-supported transport of solutes within the brain’s parenchyma are still not completely understood; models which address these processes are sometimes controversial. In particular, one can note the question of the proportion of hydrodynamic-like (glymphatic, see [5] for a review of the current state of the art) and diffusive [6,7] kinds of transports.
This question is vital for the development of intracerebral drug delivery, which can be realized in the infusional way, or via the interface between either the ISL and the blood–brain barrier or the ISL and the cerebrospinal fluid (see [8,9,10] for comprehensive modern reviews).
Another aspect of the problem which requires understanding is determining how fluid is transported to the brain’s interstitial space, as shown by brain perfusion when solutes are taken up into the brain’s parenchyma from cerebral vasculature crossing the blood–brain barrier. Accessing this property relates to drug delivery [11], the treatment of brain injury [12] and diagnostic purposes [13]. Among the latter, it is worth highlighting the computed tomography (CT) technique [14,15], which allows for identification of stroke occurrence, quantification of the blood–brain barrier permeability and characterization of tumours, pathological disruption of local cell density, structural features, etc.
At the same time, the development of physical and mathematical models aimed at the quantitative interpretation of experimentally and clinically registered data on the perfusive flows require the existence of reference materials, which play the role of brain tissue phantoms but have more clearly defined controlled properties [16,17]. The typical media used for this purpose [18,19,20,21,22] include gels of different natures such as those formed by agarose, gelatin, synthetic elastomeric materials and different kinds of hydrogels.
Recently, hydrogel-based materials have looked especially attractive [23,24,25,26] due to their bio-compatibility, possibility to form scaffolds for cellular cultures and suitability to be used as organoid-mimicking structures and medication-filled implants for intracranial medication delivery.
To study fluid transport properties in a medium resembling the brain’s parenchyma, we recently proposed using a collagen-based hydrogel phantom [27,28], which reasonably closely mimics structural, mechanical and solute transport properties of brain tissue. However, the experiments, which studied fluorescent markers in the phantom, were carried out using sequences of two-dimensional photos depicting the spread of fluorescent markers in either a pure hydrogel or in a hydrogel with non-homogenized localized inclusion of lipids. At the same time, a more realistic picture of the solute spread in the brain tissue should be three-dimensional, due to the realistic non-flat topology of this organ. Among experimental techniques which allow for obtaining such pictures, the method of computed tomography is one of the most powerful and widely applied in biomedical studies. In this regard, one can note the recently emerging interest in the application of phantom media for computed tomography research as well [29,30]. The goal of adjusting the properties of phantoms to the properties of biological tissues demands exploration of the phantoms’ compositions. This is aimed at achieving better reproducibility of mechanical and transport properties, keeping in mind that composition-modifying additives should be biocompatible.
Another issue is the determination of the type of diffusion-like transport in such media, which can differ from conventional (Gaussian, Fickian) diffusion, as detected in several experiments directly operating within the brain’s parenchyma (see [6] and references therein for review). Several kinds of anomalous diffusion were detected in biological hydrogels, e.g., in [31], and tissue-mimicking hydrogel phantoms based on, e.g., agarose or hyaluronic acid [32,33].
Thus, the main goal of the present work was a more detailed study of fluid transport processes in hydrogel-based phantoms which mimic the brain’s tissue. As the first task, we considered forming a variety of hydrogel modifications by using two kinds of additives: surfactants and lipids, both uniformly distributed within the bulk of samples. Surfactants are known as agents which modify the structure of hydrogels since they affect the gelation process [34,35]. Notably, structural properties, such as porosity, tortuosity, polymer network structure, etc., affect the permeability of the phantom for fluid flow. Thus, these additions allowed us to simulate the typical changes in the structure and permeability of the brain’s interstitial space in normal and pathological conditions. Simultaneously, lipids are valuable constituents of the brain’s tissue [36], and their introduction made the phantom more realistic from a biological point of view. In contrast to the previous work [28], where lipid inclusions were highly inhomogeneous, herein we used a uniform distribution, intending this ”phantom tissue” to be a reproduction as a whole.
To obtain transport characteristics of the fluid spread, including their dependence on the presence of the additives mentioned above, results obtained with CT usage were considered. CT provides an opportunity to obtain a 3D picture which characterizes the spatial distribution of a liquid contrast medium at large scales of volume, which is almost impossible with conventional optical methods. In this case, it was possible to choose the best regions to obtain the measurements for comparison with the results of mathematical modeling. Finally, we discuss an opportunity for using the proposed kind of hydrogels as phantoms for CT calibration purposes in clinical medical practice.

2. Materials and Methods

Here, we considered a hydrogel with a matrix formed from collagen extracted from the skin of North African sharp-toothed catfish Clarias gariepinus. The detailed procedure of its preparation was reported earlier [28]. However, the previous study investigated either pure collagen hydrogel or its version with macroscopic lipid inclusion. In the present work, additional samples containing homogenized lipid and surfactant components were synthesized.
To simulate the lipid component, soy lecithin and a non-ionic surfactant—Plantacare 810 UP (BASF, Ludwigshafen, Germany) —were used. Soy lecithin is a complex mixture of phospholipids, glycolipids, triglycerides, sterols and small amounts of fatty acids, carbohydrates and sphingolipids. The Plantacare 810 UP surfactant is a decanoyl/caprylyl polyglucoside, with an alkyl radical consisting of 8 to 10 carbon atoms. It is water-soluble and capable of micelle formation in solutions with concentrations greater than 5 mmol / L [37].
Lecithin and Plantacare 810 UP were added to the collagen hydrogel in amounts of 10, 20 and 30% of the initial collagen weight (dry matter basis). Lecithin was pre-dispersed in water using an IL100-6/1 ultrasonic disperser with an operating emission frequency of 23,500 Hz, using 75% of the maximal output power of 630 W . An opalescent liquid (dispersed system) was obtained, which was then mixed with collagen gel, glycerol and glutaric aldehyde. Plantacare 810 UP was dissolved in water while stirring, resulting in a colorless clear solution with a higher viscosity than water. The resulting solution was also mixed with collagen gel, glycerol and glutaric aldehyde.
The spread of a solution of liquid iodinated X-ray contrast agent, Iopromide (chemical formula C 18 H 24 I 3 N 3 O 8 ; the same solution was used for experiments dealing with all variations of the hydrogel), was studied by computed tomography (CT) with a Canon AQUILION ONE 320 CT scanner (Canon Medical Systems Corporation, Otawara, Japan) in the following regime: tube peak voltage (KVP: kilovolt in peak) 135 kVp , X-ray ube current 20 mA and exposure 7 mAs . The minimum detector size was 0.5 mm , which was refined to 0.25 mm using the dimensionless spiral pitch factor equal to 0.638. The obtained data were processed with eFilm Lite v. 4.1.0 (Merge Healthcare, Chicago, IL, USA) RadiAnt DICOM Viewer v. 2022.1.1 (Medixant, Poznań, Poland) software and post-processed with ImageJ v. 1.54d (NIH, Bethesda, MD, USA) to quantify the radii of spread. Numerical simulations of the respective mathematical model of liquid spread were carried out with MATLAB R2014b (The MathWorks, Inc., Natick, MA, USA), using the standard solver of partial differential equations pdepe.

3. Results

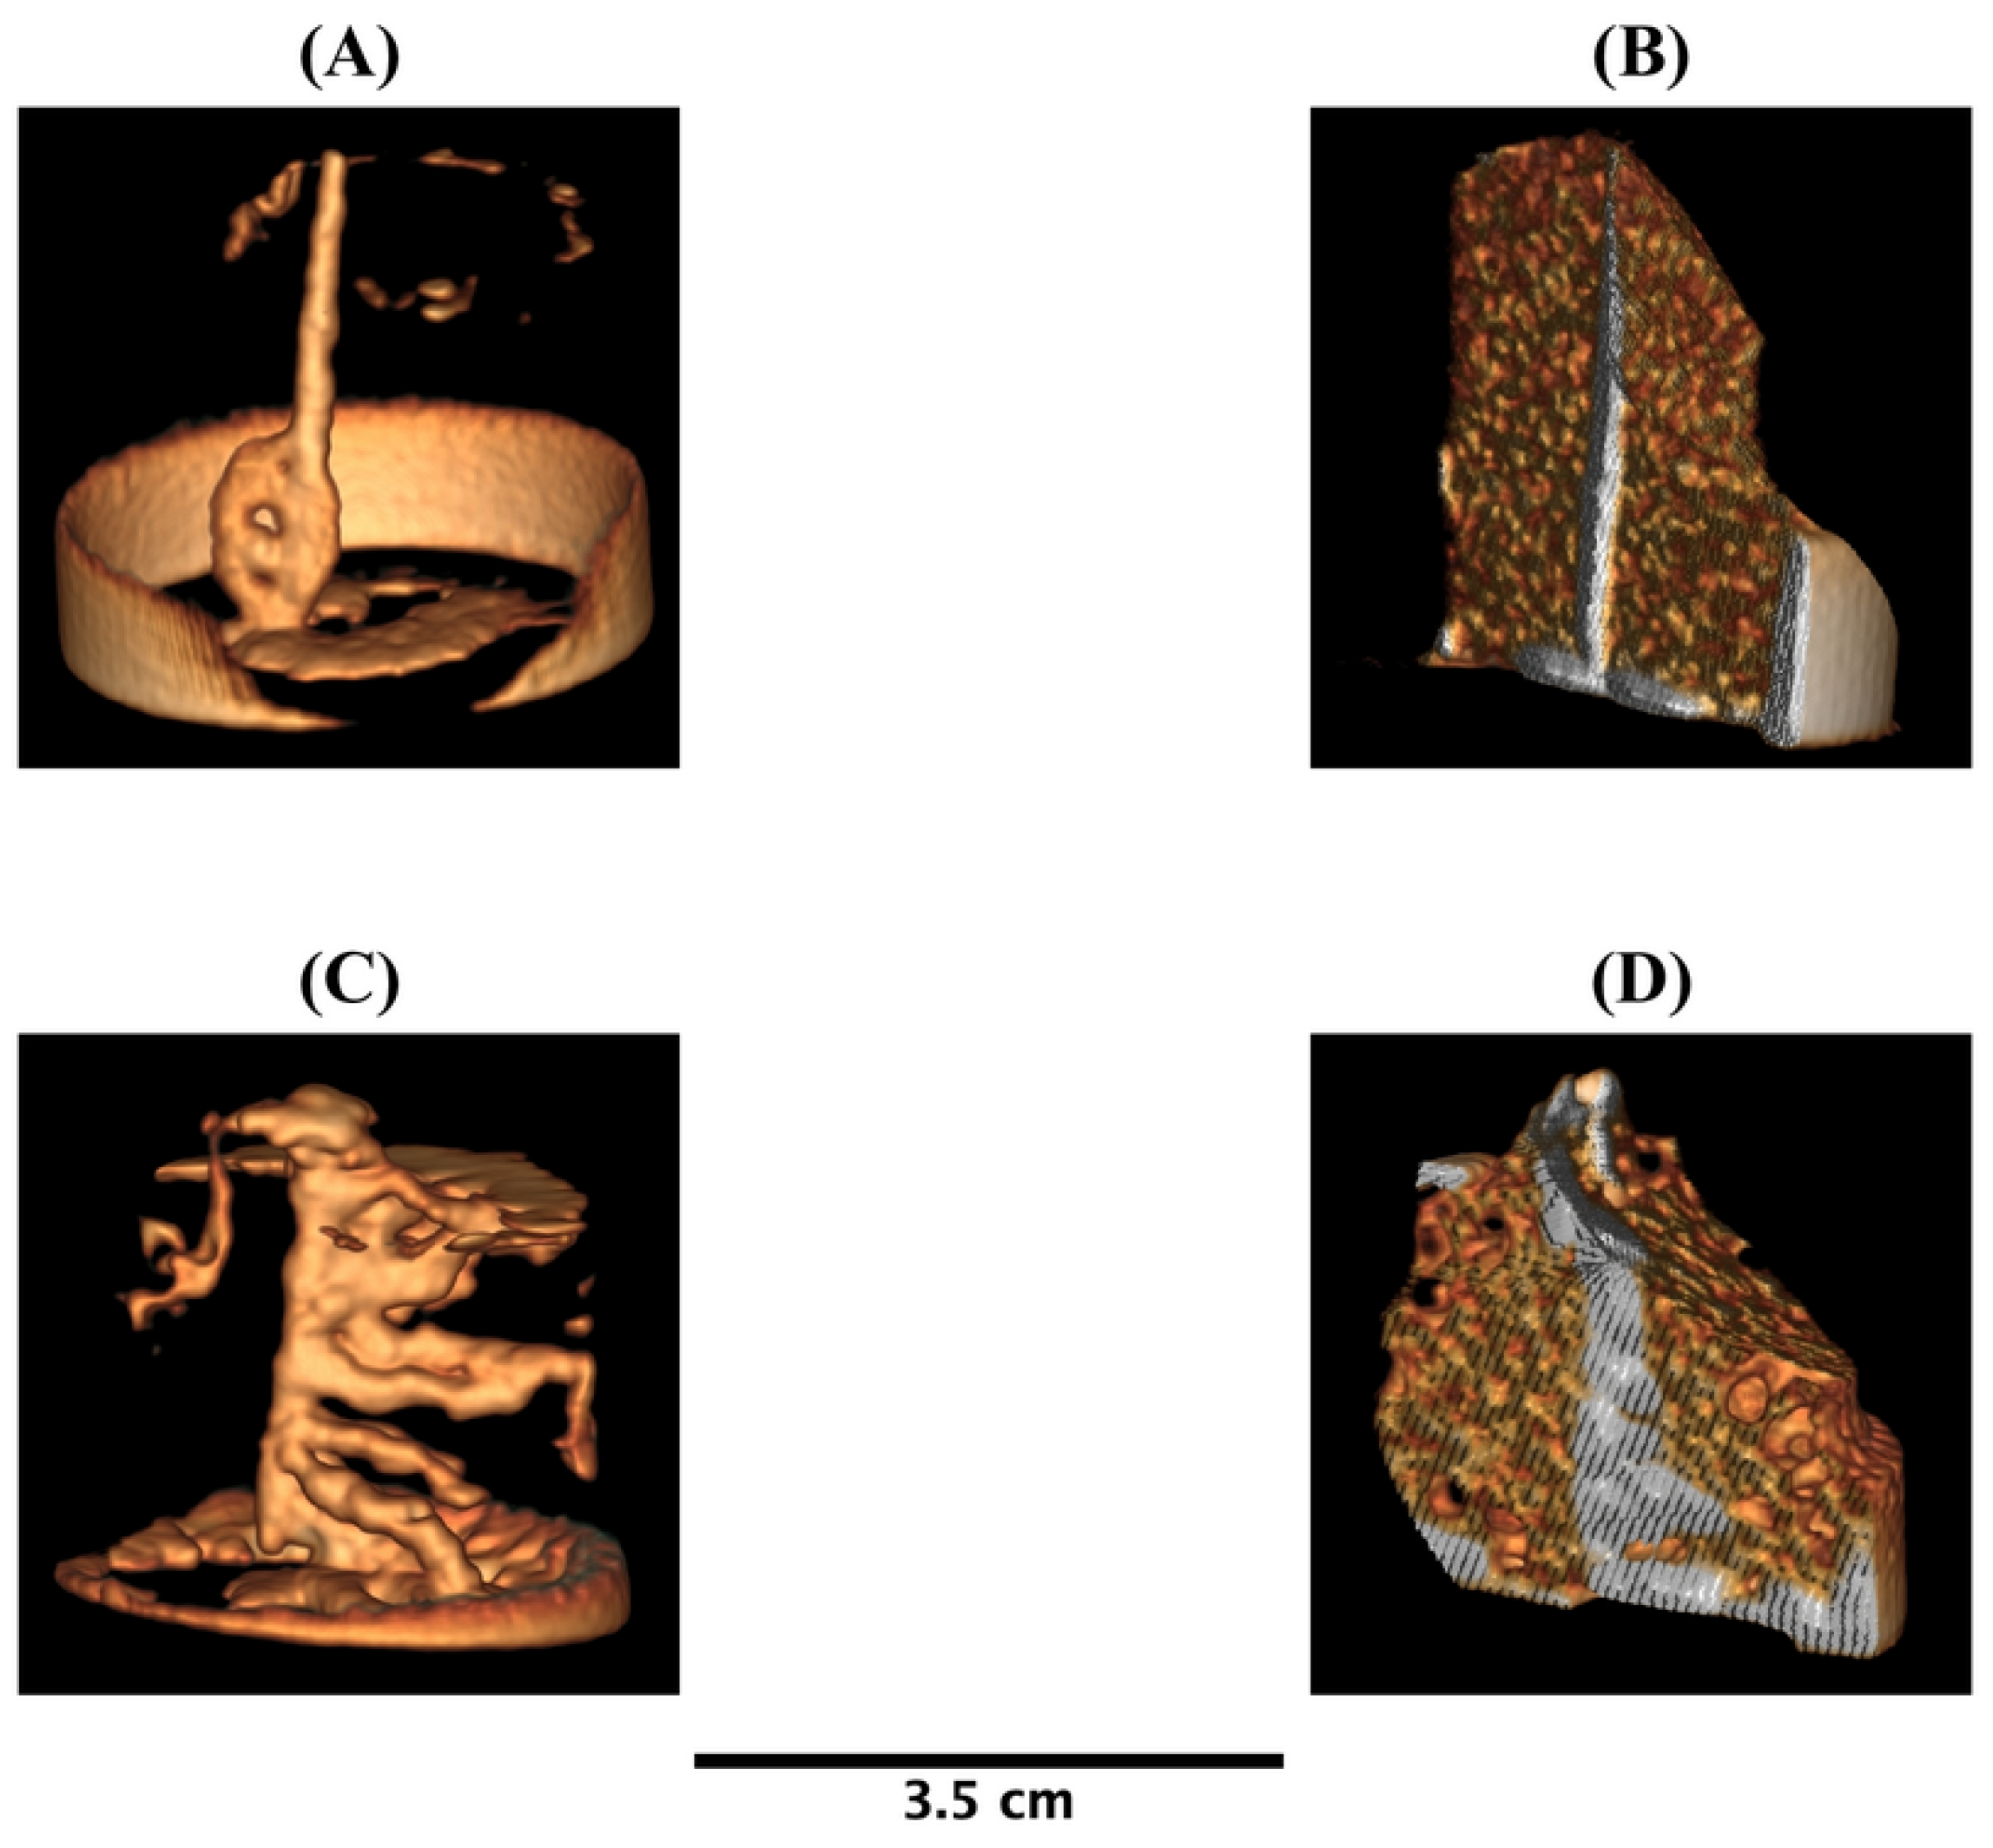
3.1. Computed Tomography Results
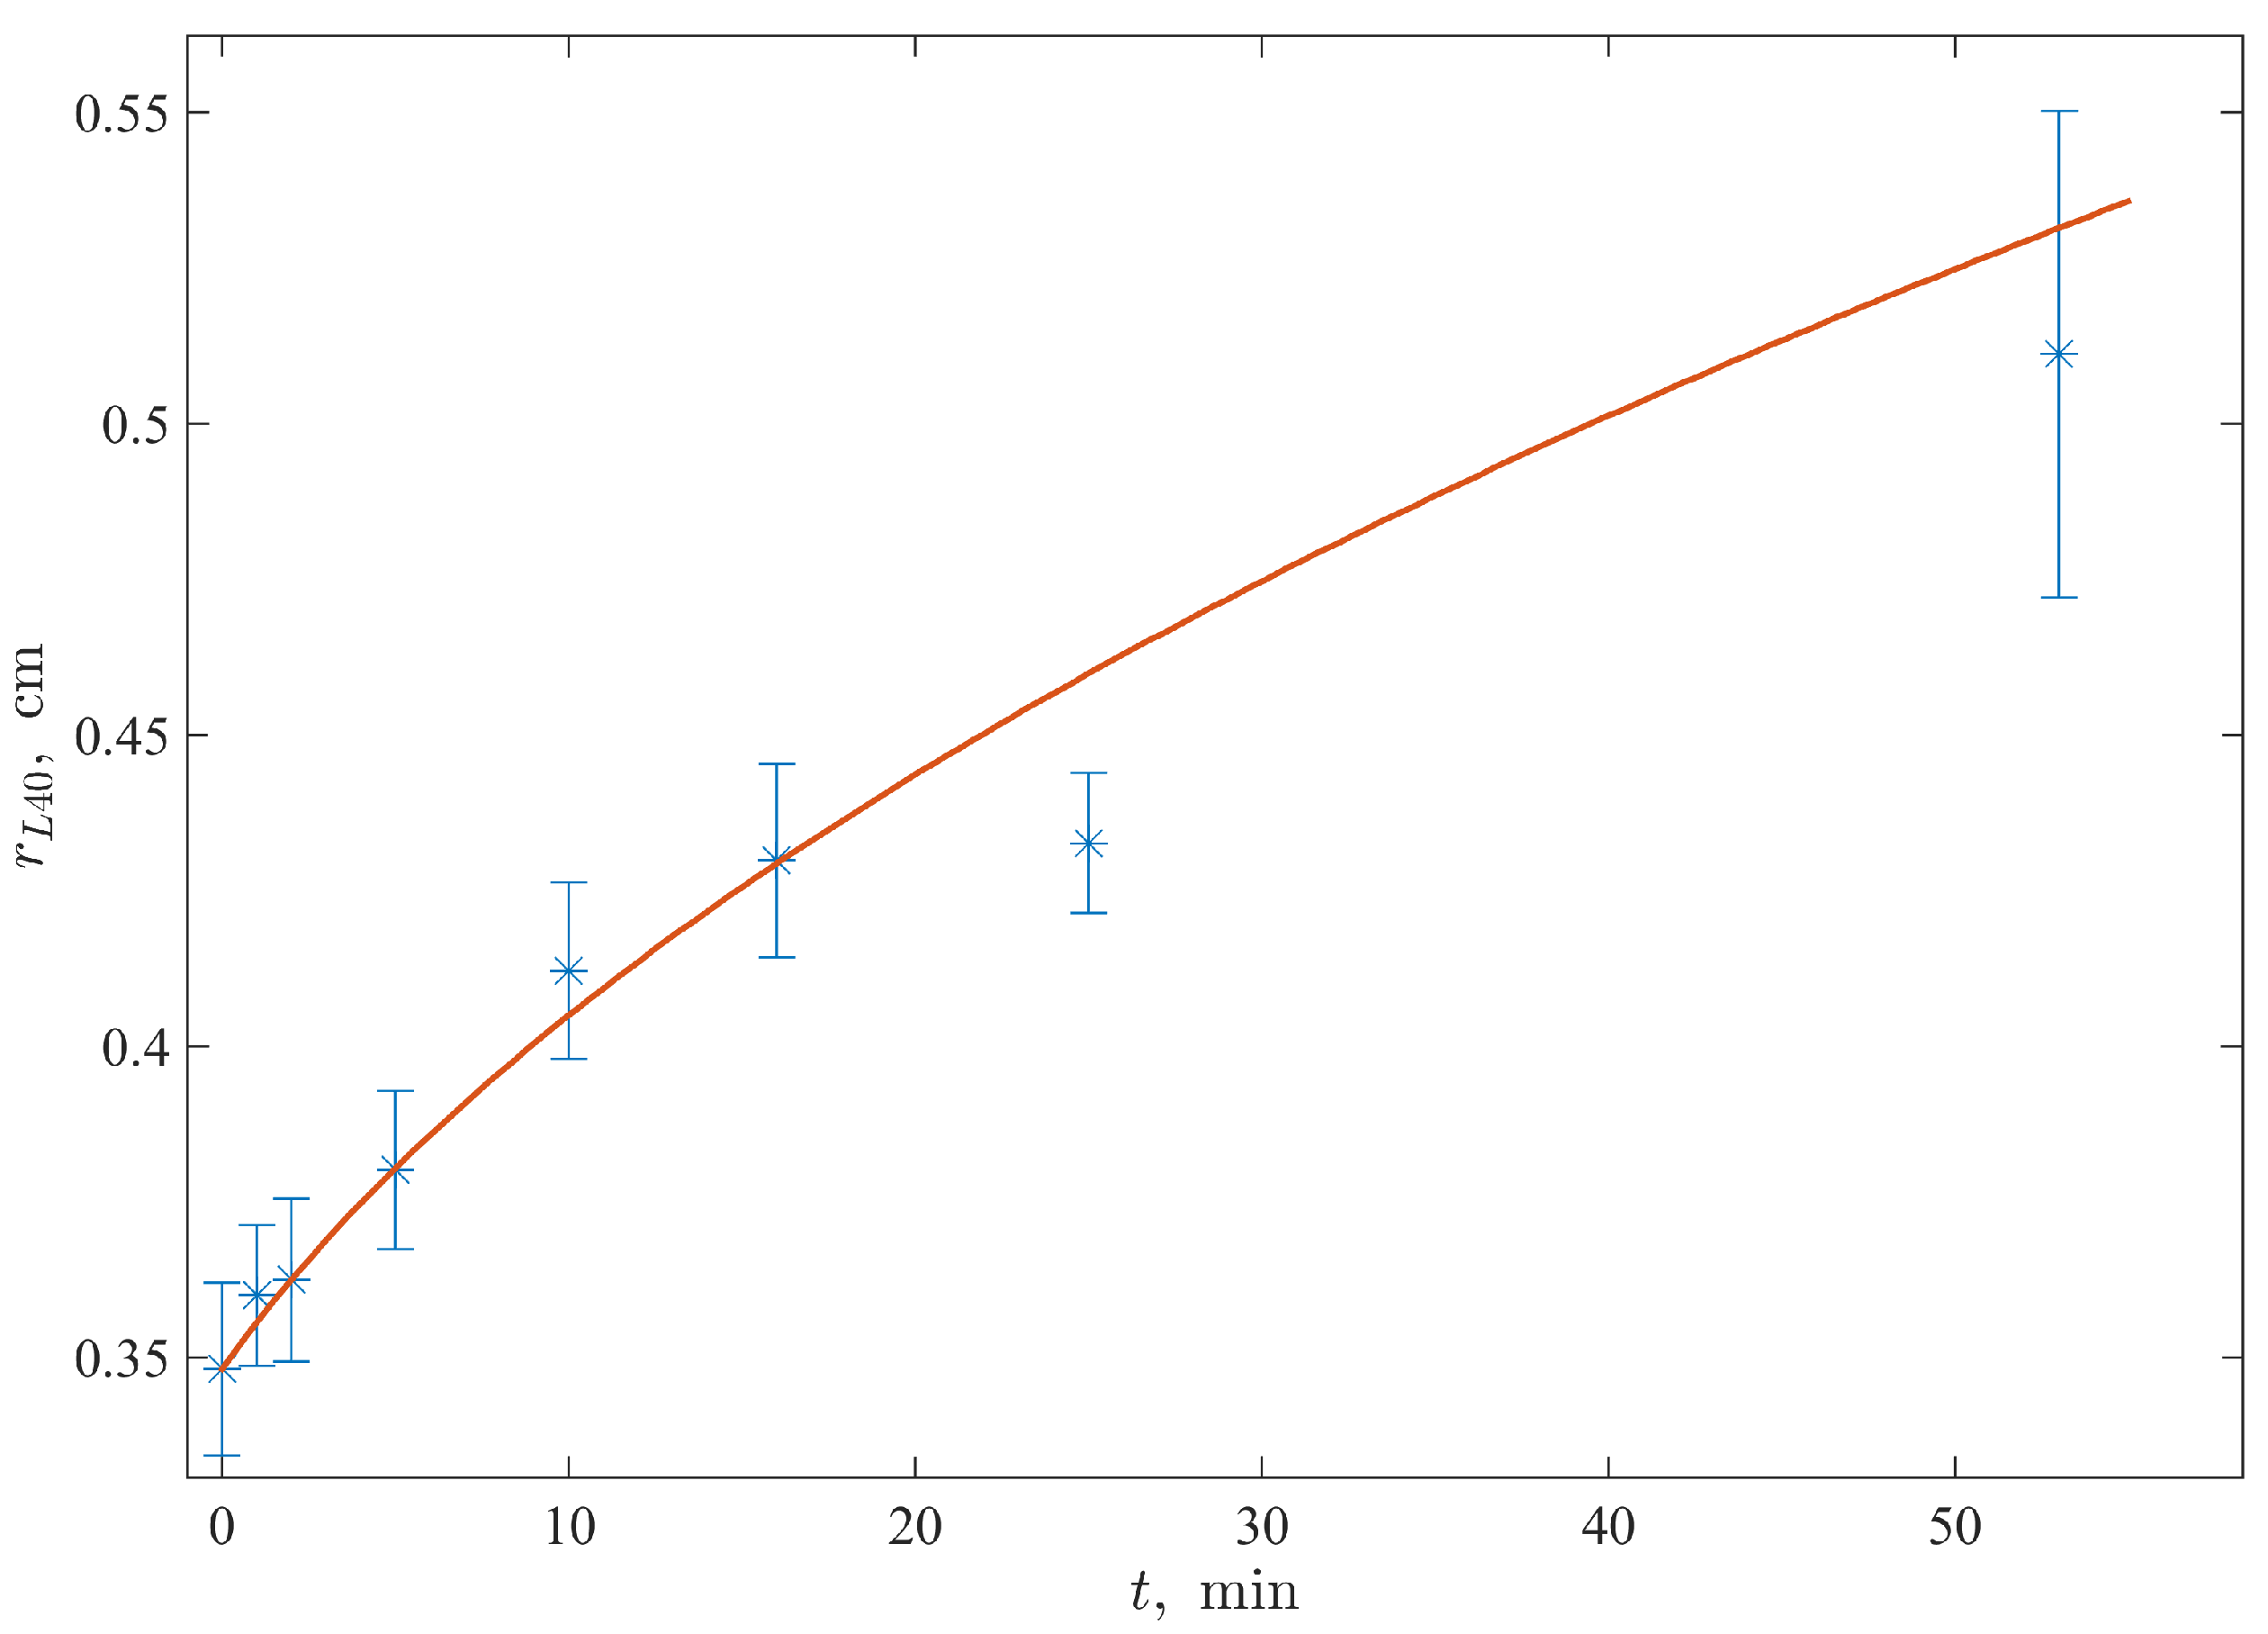
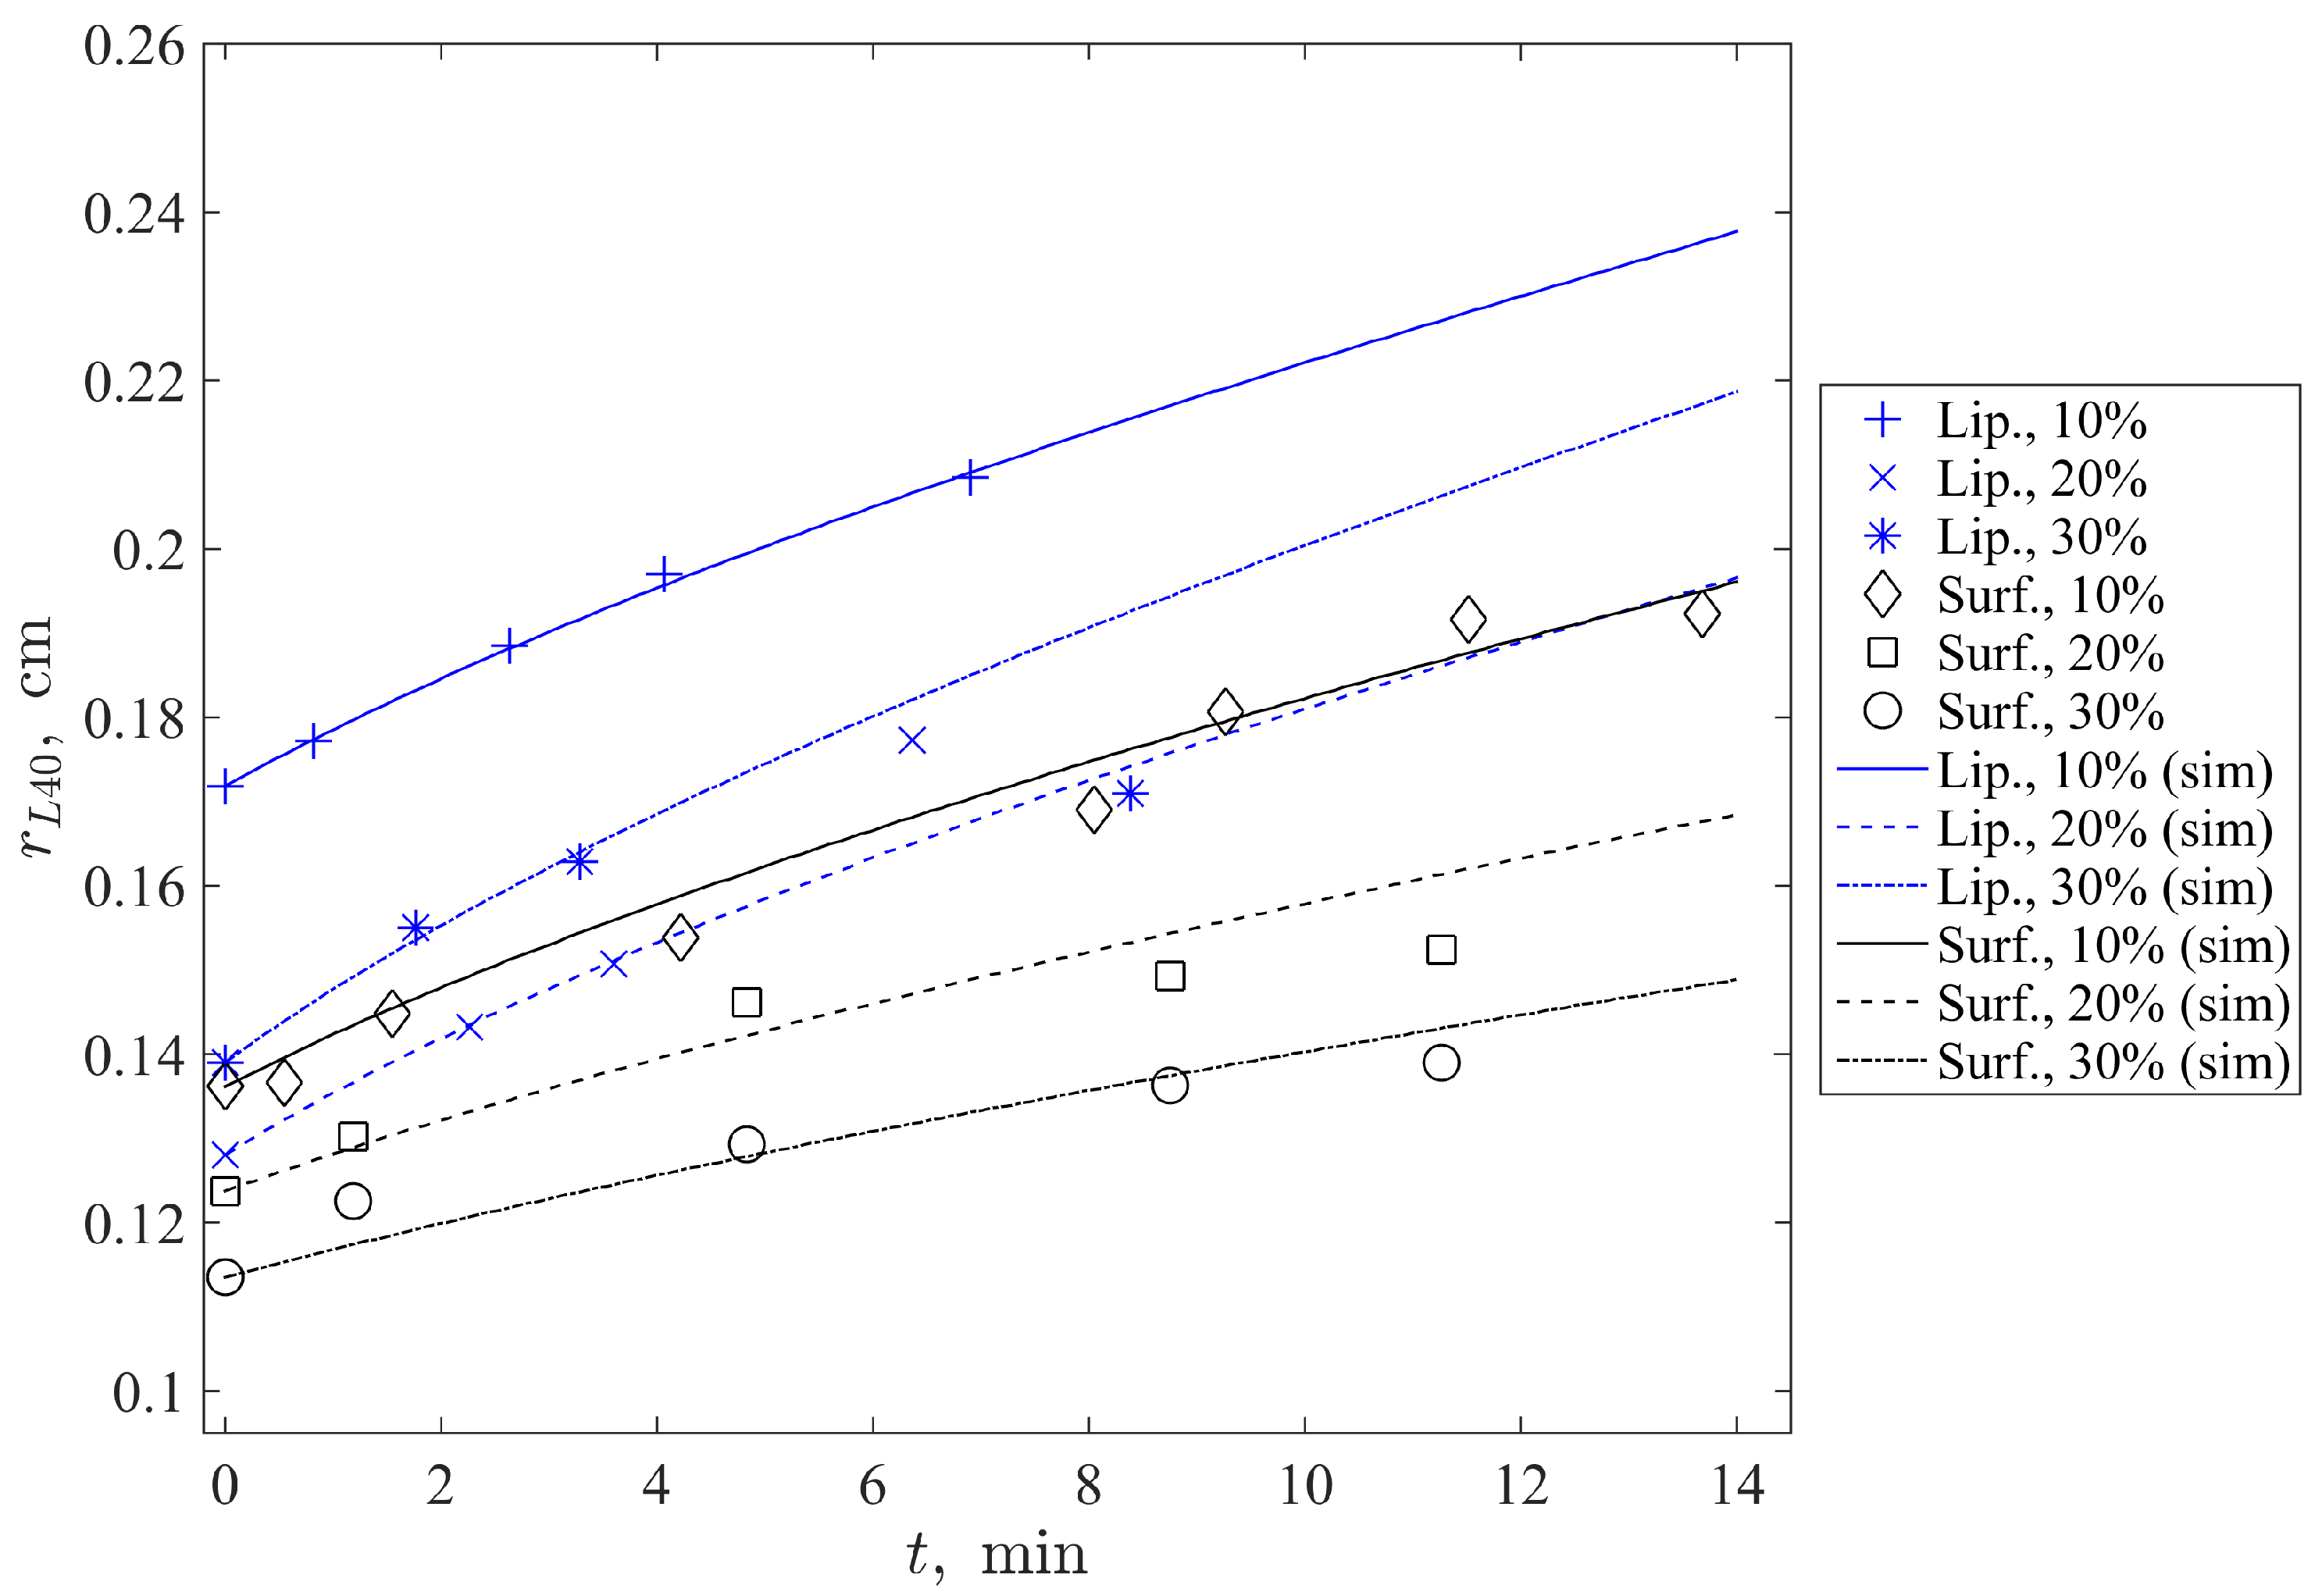
Two series of measurements, formed from CT slices which were able to produce a 3D picture, were carried out. The first one operated with the CT-assisted determination of Iopromide’s spread in the hydrogel phantom without special additives (the same kind of medium which was considered in the works [27,38] with respect to the 2D projection of a fluorescence marker spread). The second series addressed hydrogel samples with additives. The contrast agent was introduced into a sample with a thin needle, which was removed thereafter. In such a way, a liquid-filled cylindrical channel was formed; it played the role of the initial source of the leakage, similar to a vessel which disrupts the blood–brain barrier. It should be pointed out that, for samples with high lipid content, there was a fast percolation into the surrounding medium after injection, which was followed by slow diffusion thereafter. On the contrary, the cases of pure collagen-based hydrogel and, especially, surfactant-containing hydrogels were characterized by the formation of a compact channel formed by a needle and filled with the liquid contrast agent, which slowly diffused into the surrounding medium. Figure 1 demonstrates the most illustrative examples of the mentioned behavior. In Figure 1A,B, one can see a contrast cylinder which penetrated through almost the whole height of the cylindrical hydrogel sample without disturbances to its shape (the widened “bulb” emerged only around the sample’s bottom, where the needle’s outlet created extra outflow pressure). The case of the highest lipid content, shown in Figure 1C,D, resulted in the emergence of side branches which penetrated the hydrogel through the routes of easy spread in its porous structure. However, it should be noted that this tree-like structure was only formed during the injection; one can determine sufficiently long intervals to produce a stable thin cylindrical shape and, thereafter, consider local diffusive widening. Contrast distribution shapes for the rest of the concentration spectrum are between these extreme cases.
Exploring the series of CT images, the widths (diameters) of the spreading contrast regions (in the regime of the window’s level and L = 40 , W = 90 in Hounsfield units) typical for the brain investigations were determined for several cross-sections of locally cylindrical patterns for each time moment of sequential scans. The corresponding radii, averaged over several measurements, as well as standard deviations are shown in Figure 2 in the case of the pure collagen-based hydrogel. One can see a retarding growth of the radius which looks typical for a diffusive spread.
Taking into account the growing uncertainty in the data because of the further parameter quantification and numerical simulations, the data for the cases of hydrogels with lipid and surfactant additives were determined for shorter time ranges. The respective averaged radii are shown as different markers in Figure 3. Their standard deviations are not indicated there, so as not to overload the picture with overlapping errorbars. Their typical ranges were 0.05 cm and 0.03 cm for hydrogels with lipids and surfactants, respectively.

3.2. Modeling

The typical sequence of processes consists of a fast spread of the contrast liquid in a thin layer around the channel formed by the needle at the injection, which is followed by a more slow process. This corresponds to the picture observed earlier during the photometric video registration of the fluorescent marker spread in one such hydrogel [38]. However, this first stage is too fast to be registered by computed tomography. This takes a few seconds, but a single run of CT scanning requires at least tens of seconds. In addition, as has been demonstrated in the work [38], the beginning of the subsequent diffusive-type process, which can have a Brownian yet non-Gaussian character [6,39], also takes a limited time interval, after which the homogenization occurs. The latter implies that the region covered by the spreading agent significantly overcomes the characteristic sizes of the medium’s local inhomogeneities. This situation corresponds to the spatial resolution of the CT at the time scale of its operation and, in this case, the homogenization of local diffusivities, which allows the possibility of introducing one effective diffusion coefficient.
This argues that the time intervals considered during this experiment allowed application of the standard diffusion equation as the modeling approach. The respective mathematical model was formulated as the axially-symmetric partial differential equation:
u t = D r r r u r ,
where D is the effective diffusion coefficient mentioned above.
The initial condition was u 0 ( r ) = u ( 0 , r ) = 1 tanh ( r r m i n ) / σ , with σ = 0.1 cm . The boundary conditions were as follows: the Dirichlet boundary condition, u ( r m i n ) = u 0 ( r m i n ) , and the Neumann (no flux) boundary condition, r u r = r m a x . The reason for the former was the excess value of the contrast concentration introduced in the needle-formed channel; the relatively weak diffusion in the hydrogel did not diminish it significantly. In addition, the contrast substance, bound to the medium, did not change the registered intensity. Accordingly, r m i n = 0.69 cm was chosen as the average radius of the contrast-formed spot. The second boundary condition was stated for the radius r m a x = 2 cm , corresponding to the sample’s radius. Note that, during the time interval of the experimental run, no significant amount of the contrast reached this boundary; therefore, it was automatically fulfilled.
To compare the spread dynamics given by the solution to Equation (1) with the experimental widening of the contrast spot, we chose a cut-off (c-o) value of the solution equal to u c - o = 0.2 (in arbitrary units). The temporal evolution of the radial coordinate corresponding to this value, defined by solving u ( r L 40 ( t ) , t ) = u c - o , gave the desired change of the radius as a function of time. Note that this cut-off value was approximately equal to twice the ratio of the chosen CT level ( L = 40 ) to the window’s width ( W = 90 ). After this, the rescaling r L 40 ( t ) ( r L 40 ( 0 ) r m i n ) r L 40 ( t ) was applied to explore the correspondence to the experimental data. The latter procedure was required because the exact boundary of the source channel and the exact correspondence between the CT levels and u c - o could not be determined technically.
The solid line in Figure 2 is the solution best-adjusted to the experimental data for the collagen-based hydrogel without lipid and surfactant additives. One can see that the course of the curve satisfactorily reproduces the sequence of experimental data, especially for the time intervals less than 20 min , although, even for time intervals greater than 50 min , the curve is within the range of data uncertainty.
This case corresponded to a value of effective diffusivity equal to D = 9.5 × 10 6 cm 2 / s . This value is comparable with the range experimentally determined in the living brain’s tissue for not very high-molecular-weight drug and marker compounds [40,41,42], although 2–4 times exceeds the most typical representative values.
Figure 3 represents the results of using the same procedure to fit solutions of the diffusion equation (Equation (1)) to the CT data obtained for samples with lipid and surfactant additives. The markers indicate average radii of the CT contrast spread location (penetration lengths) at the same cut-off level of CT intensity, L = 40 , as in Figure 2. The errorbars are not shown because they could overcomplicate the picture; they have the same range as in Figure 2 for the same respective time intervals, i.e., single-side standard deviations do not exceed 0.03 cm .
One can see the generally satisfactory correspondence (except some a small number of obvious outliers, which may originate from encountering local inhomogeneities in the medium) to the data. The resulting effective diffusion coefficients determined in such a way are summarized in Table 1.
One can see that elevation of the lipid content led to fast growth of the diffusivity, which started to significantly surpass typical values for brain tissue. This fact could originate from the emergence of the system’s porosity, as seen in Figure 1D, where a coarse-meshed structure is visible. This is also supported by the long-range percolation of the contrast solution at the stage of injection (see Figure 1C). On the contrary, the growth in surfactant content led to diminished diffusivity (and the fine-meshed structure, as seen in Figure 1B). For the concentrations of 20–30%, the diffusion coefficient was reduced to the values typical for, for example, sucrose and glucose in the living brain.

4. Discussion

The applied experimental procedure resembles the conditions of intraparenchymal drug delivery in clinical procedure [10]. On the other hand, the principal difference between the present experimental approach and previous studies [27,28] consists of two features. The first one is the three-dimensionality of data obtained via computed tomography. This method allows for explicit observation of the pattern of marker spread, in contrast to the photography-based 2D imaging of the distribution of the fluorescent markers, which merged signals from different depths. In particular, the vessel-like channels of the fast initial spread are revealed in the hydrogel’s bulk. Simultaneously, an accurate spatial characterization of such patterns ensures the reliability of choosing intervals where the process can be considered as a radial diffusion, as is crucial for building simple models based on the axially symmetric partial differential equation. The latter, together with the experimental data, allowed us to find the desired diffusion coefficients and discuss their dependence on the hydrogel’s composition. The latter, used in this work, differs from the case considered in the work [28], where macroscopic non-uniform inclusions of lipid components were considered to affect non-classic features of a fluorescent marker’s spread. CT deals with a coarse spatiotemporal resolution, i.e., it is not suitable for investigation of individual tracers in gels as e.g., in the work [31], or a short-time behavior, as in [38]. As such, the main focus of the present work is on the homogenized diffusive properties of the medium with respect to the spread of a liquid contrast medium.
In addition, the conditions of the experiments resemble, to a certain extent, another issue related to the study of liquid contrast flows in the brain. Recently, mechanical thrombectomy has become the standard treatment in acute stroke for cerebral revascularization in certain patients with large vessel occlusion. The phenomenon of contrast staining, which, presumably, originates from increased permeability of the blood–brain barrier, leads to iodine extravasation, detected by computed tomography. Associated extravasation of blood out of the cerebral vascular network and intraparenchymal haemorrhage can result in adverse clinical and functional outcomes [43]. On the other hand, contrast extravasation may result from degradation of the basal lamina, which is essentially a structural barrier that prevents extravasation of blood cell elements from microvessels [44]. Thus, the creation of phantoms, which can simulate different spread types of liquid contrast which are dependent on the varying permeability of the initial contrast-filled channel, may play the role of a physical test system for computed tomography in this field of study.
The difference in the behavior of the gel samples obtained using soy lecithin and Plantacare 810 UP non-ionic surfactant can be attributed to the inferred composition of the interstitial fluid model—the fluid present in the pores of the formed and cross-linked collagen gel.
In the case of water-soluble lecithin, we were dealing with two dispersed systems: collagen gel and lecithin dispersion in water. It can be assumed that, in the process of freezing and formation of the porous structure, the dispersed system formed by lecithin broke down, with the lecithin particles coagulating on the surface of the collagen fragments. Thus, only low-molecular weight compounds remained in the fluid that was simulating the interstitium, which did not impede the spreading of the radiopaque compound.
In the case of non-ionic surfactant Plantacare 810 UP used in concentrations significantly higher than the critical concentration for micelle formation (4–12 times), one should expect the presence of thermodynamically stable micelles of various structures in the model interstitial fluid. At such concentrations of surfactant in the solution which simulated interstitial fluid, micelles of various structures—from spherical Hartley–Rebinder micelles, with an association number equal to about 50 molecules, to micelles with higher association numbers, e.g., Debye’s cylindrical and disk-shaped micelles and McBain’s lamellar micelles—may be present. The presence of these molecular associates increases the viscosity of the liquid and prevents the spread of the radiopaque compound in the model intercellular space. The difference in the behavior of the gel samples obtained using soy lecithin and Plantacare 810 UP non-ionic surfactant can be attributed to the inferred composition of the interstitial fluid model as the fluid present in the pores of the formed and cross-linked collagen gel.
Thus, the obtained results and well-developed approach, in general, open certain opportunities for testing computational models which simulate substance diffusion and fluid flows in the brain tissue related to, e.g., the perfusion processes [45], the leakage to the interstitial space due to the opening of the blood–brain barrier [46], the flow-induced drug delivery [47,48], etc. The possibility to control tortuosity, permeability and topology of the collagen matrix by changing the concentration of effect-inducing chemicals may result in the formation of a line of reference media related to this goal. In addition, the a priori knowledge of chemical composition and the possibility to dissect and analyze samples after experiments with the contrast agent spread provide, together, a principal opportunity for directly converting CT signal to concentration, as is demanded by such models [49,50].
Finally, it should be pointed out that hydrogels can play the role of a natural scaffold for growing neuronal cells, i.e., the knowledge of their support for fluid transport is vital for developing biomedical systems in vitro within the concept of “Organ-on-a-Chip” [51].

5. Conclusions

In this work, we have studied the spreading dynamics in brain-mimicking collagen-based gels of a liquid contrast agent widely used in clinical practice for computed tomography examinations.
Samples with different inclusions, i.e., lipids and surfactants, were used to better resemble the specific features of the living tissue examined in vitro and in vivo. Exploring 3D pictures, in contrast to the optical methods considered in our previous work, allowed clear isolation of and distinguishing between the leakage and the diffusive spread in such a complex medium. We have shown that the contrast’s propagation depends on the type of inclusions and their concentrations. In particular, the elevation of lipid concentrations results in the mimicking of channel-like contrast spread, which resemble the consequences of lesions in a stroke-damaged brain, while highly concentrated surfactant additions allow for formation of phantom systems which resemble the drug/marker diffusion into the interstitial space from vessels after the blood–brain barrier’s disruption.
Although the spatiotemporal resolution of computed tomography does not allow for access to fast and highly stochastic processes, it was shown that it provides an opportunity to characterize the conventional diffusive spread and test the built mathematical model, in order to determine the desired coefficients of diffusion. The diffusion coefficients, obtained both from models and experiments, could be twice as high for samples with lipid inclusions than for those with surfactants and fit the range typical for the spread of chemicals and drugs in the brain.
Thus, we can conclude that the proposed method for creating an adjustable collagen-based phantom and studying the fluid transport within it can be used in further studies of brain physiology processes, which is one of the top tasks of modern neuroscience.

Author Contributions

Conceptualization, E.B.P., A.I.L. and T.N.K.; methodology, E.B.P., A.I.L., E.V.G. and T.N.K.; validation, A.S.V., A.V.S. and E.V.G.; formal analysis, A.V.S. and E.B.P.; investigation, A.S.V., A.V.S., A.I.L., P.V.G., P.L.A. and E.B.P.; resources, E.V.G., T.N.K., A.I.L. and P.V.G.; data curation, P.V.G. and A.V.S.; writing—original draft preparation, E.B.P., A.I.L. and T.N.K.; writing—review and editing, E.B.P. and A.I.L.; visualization, E.B.P.; supervision, E.B.P. All authors have read and agreed to the published version of the manuscript.

Funding

This work was supported by the Russian Science Foundation, project #22-15-00143.

Data Availability Statement

The original CT recordings can be provided by the corresponding author on reasonable request.

Conflicts of Interest

The authors declare no conflict of interest.

References

  1. Lei, Y.; Han, H.; Yuan, F.; Javeed, A.; Zhao, Y. The brain interstitial system: Anatomy, modeling, in vivo measurement, and applications. Prog. Neurobiol. 2017, 157, 230–246. [Google Scholar] [CrossRef] [PubMed]
  2. Shetty, A.K.; Zanirati, G. The Interstitial System of the Brain in Health and Disease. Aging Dis. 2020, 11, 200–211. [Google Scholar] [CrossRef] [PubMed]
  3. Nicholson, C.; Hrabětová, S. Brain Extracellular Space: The Final Frontier of Neuroscience. Biophys. J. 2017, 113, 2133–2142. [Google Scholar] [CrossRef] [PubMed]
  4. Chatterjee, K.; Carman-Esparza, C.M.; Munson, J.M. Methods to measure, model and manipulate fluid flow in brain. J. Neurosci. Methods 2020, 333, 108541. [Google Scholar] [CrossRef] [PubMed]
  5. Hladky, S.B.; Barrand, M.A. The glymphatic hypothesis: The theory and the evidence. Fluids Barriers CNS 2022, 19, 9. [Google Scholar] [CrossRef]
  6. Postnikov, E.B.; Lavrova, A.I.; Postnov, D.E. Transport in the Brain Extracellular Space: Diffusion, but Which Kind? Int. J. Mol. Sci. 2022, 23, 12401. [Google Scholar] [CrossRef]
  7. Tønnesen, J.; Hrabĕtová, S.; Soria, F.N. Local diffusion in the extracellular space of the brain. Neurobiol. Dis. 2023, 177, 105981. [Google Scholar] [CrossRef]
  8. Nance, E.; Pun, S.H.; Saigal, R.; Sellers, D.L. Drug delivery to the central nervous system. Nat. Rev. Mater. 2022, 7, 314–331. [Google Scholar] [CrossRef]
  9. Gu, Z.; Chen, H.; Zhao, H.; Yang, W.; Song, Y.; Li, X.; Wang, Y.; Du, D.; Liao, H.; Pan, W.; et al. New insight into brain disease therapy: Nanomedicines-crossing blood–brain barrier and extracellular space for drug delivery. Expert Opin. Drug Deliv. 2022, 19, 1618–1635. [Google Scholar] [CrossRef]
  10. Jamal, A.; Yuan, T.; Galvan, S.; Castellano, A.; Riva, M.; Secoli, R.; Falini, A.; Bello, L.; Rodriguez y Baena, F.; Dini, D. Insights into infusion-based targeted drug delivery in the brain: Perspectives, challenges and opportunities. Int. J. Mol. Sci. 2022, 23, 3139. [Google Scholar] [CrossRef]
  11. Smith, Q.R. Brain Perfusion Systems for Studies of Drug Uptake and Metabolism in the Central Nervous System. In Models for Assessing Drug Absorption and Metabolism; Pharmaceutical Biotechnology; Springer: Boston, MA, USA, 1996. [Google Scholar] [CrossRef]
  12. Rossi, S.; Picetti, E.; Zoerle, T.; Carbonara, M.; Zanier, E.R.; Stocchetti, N. Fluid management in acute brain injury. Curr. Neurol. Neurosci. Rep. 2018, 18, 74. [Google Scholar] [CrossRef] [PubMed]
  13. Wintermark, M.; Sesay, M.; Barbier, E.; Borbély, K.; Dillon, W.P.; Eastwood, J.D.; Glenn, T.C.; Grandin, C.B.; Pedraza, S.; Soustiel, J.F.; et al. Comparative overview of brain perfusion imaging techniques. Stroke 2005, 36, e83–e99. [Google Scholar] [CrossRef] [PubMed]
  14. Miles, K.A. Brain perfusion: Computed tomography applications. Neuroradiology 2004, 46, s194–s200. [Google Scholar] [CrossRef] [PubMed]
  15. Zeng, D.; Zeng, C.; Zeng, Z.; Li, S.; Deng, Z.; Chen, S.; Bian, Z.; Ma, J. Basis and current state of computed tomography perfusion imaging: A review. Phys. Med. Biol. 2022, 67, 18TR01. [Google Scholar] [CrossRef] [PubMed]
  16. Kamphuis, M.E.; Greuter, M.J.W.; Slart, R.H.J.A.; Slump, C.H. Quantitative imaging: Systematic review of perfusion/flow phantoms. Eur. Radiol. Exp. 2020, 4, 15. [Google Scholar] [CrossRef]
  17. McGarry, C.K.; Grattan, L.J.; Ivory, A.M.; Leek, F.; Liney, G.P.; Liu, Y.; Miloro, P.; Rai, R.; Robinson, A.P.; Shih, A.J.; et al. Tissue mimicking materials for imaging and therapy phantoms: A review. Phys. Med. Biol. 2020, 65, 23TR01. [Google Scholar] [CrossRef] [PubMed]
  18. Chen, Z.J.; Gillies, G.T.; Broaddus, W.C.; Prabhu, S.S.; Fillmore, H.; Mitchell, R.M.; Corwin, F.D.; Fatouros, P.P. A realistic brain tissue phantom for intraparenchymal infusion studies. J. Neurosurg. 2004, 101, 314–322. [Google Scholar] [CrossRef]
  19. Pomfret, R.; Miranpuri, G.; Sillay, K. The substitute brain and the potential of the gel model. Ann. Neurosci. 2013, 20, 118–122. [Google Scholar] [CrossRef]
  20. Rauti, R.; Renous, N.; Maoz, B.M. Mimicking the brain extracellular matrix in vitro: A review of current methodologies and challenges. Isr. J. Chem. 2020, 60, 1141–1151. [Google Scholar] [CrossRef]
  21. Axpe, E.; Orive, G.; Franze, K.; Appel, E.A. Towards brain-tissue-like biomaterials. Nat. Commun. 2020, 11, 3423. [Google Scholar] [CrossRef]
  22. Bouattour, Y.; Sautou, V.; Hmede, R.; El Ouadhi, Y.; Gouot, D.; Chennell, P.; Lapusta, Y.; Chapelle, F.; Lemaire, J.J. A Minireview on Brain Models Simulating Geometrical, Physical, and Biochemical Properties of the Human Brain. Front. Bioeng. Biotechnol. 2022, 10, 818201. [Google Scholar] [CrossRef] [PubMed]
  23. Forte, A.E.; Galvan, S.; Manieri, F.; Rodriguez y Baena, F.; Dini, D. A composite hydrogel for brain tissue phantoms. Mater. Des. 2016, 112, 227–238. [Google Scholar] [CrossRef]
  24. Lovett, M.L.; Nieland, T.J.F.; Dingle, Y.T.L.; Kaplan, D.L. Innovations in 3D tissue models of human brain physiology and diseases. Adv. Funct. Mater. 2020, 30, 1909146. [Google Scholar] [CrossRef]
  25. Mohapatra, S.; Mirza, M.; Hilles, A.R.; Zakir, F.; Gomes, A.C.; Ansari, M.J.; Iqbal, Z.; Mahmood, S. Biomedical application, patent repository, clinical trial and regulatory updates on hydrogel: An extensive review. Gels 2021, 7, 207. [Google Scholar] [CrossRef] [PubMed]
  26. Kasai, R.D.; Radhika, D.; Archana, S.; Shanavaz, H.; Koutavarapu, R.; Lee, D.Y.; Shim, J. A review on hydrogels classification and recent developments in biomedical applications. Int. J. Polym. Mater. Polym. Biomater. 2022, 2022, 1–11. [Google Scholar] [CrossRef]
  27. Vanina, A.S.; Sychev, A.V.; Grekhnyova, E.V.; Postnikov, E.B. A collagen network-based hydrogel phantom for testing models of the metabolite transport in the brain parenchyma. In Proceedings of the 2022 Fourth International Conference Neurotechnologies and Neurointerfaces (CNN), Kaliningrad, Russia, 14–16 September 2022; pp. 212–214. [Google Scholar] [CrossRef]
  28. Vanina, A.S.; Sychev, A.V.; Lavrova, A.I.; Gavrilov, P.V.; Andropova, P.L.; Grekhnyova, E.V.; Kudryavtseva, T.N.; Postnikov, E.B. A hydrogel-based phantom of the brain tissue aimed at modelling complex metabolic transport processes. Eur. Phys. J. Spec. Top. 2022, 2022, 1–9. [Google Scholar] [CrossRef]
  29. Dong, Y.C.; Bouche, M.; Uman, S.; Burdick, J.A.; Cormode, D.P. Detecting and monitoring hydrogels with medical imaging. ACS Biomater. Sci. Eng. 2021, 7, 4027–4047. [Google Scholar] [CrossRef]
  30. Riberdy, V.; Ruiz, E.; Hoekstra, N.; Struik, G.; Pignol, J.P. Comparison of visibility of iodinated hydrogel and gadolinium-modified hyaluronic acid spacer gels on computed tomography and onboard imaging. Phys. Imaging Radiat. Oncol. 2022, 21, 48–53. [Google Scholar] [CrossRef]
  31. Cherstvy, A.G.; Thapa, S.; Wagner, C.E.; Metzler, R. Non-Gaussian, non-ergodic, and non-Fickian diffusion of tracers in mucin hydrogels. Soft Matter 2019, 15, 2526–2551. [Google Scholar] [CrossRef]
  32. Metzler, R. Brownian motion and beyond: First-passage, power spectrum, non-Gaussianity, and anomalous diffusion. J. Stat. Mech. Theory Exp. 2019, 2019, 114003. [Google Scholar] [CrossRef]
  33. Sekar, M.P.; Suresh, S.; Zennifer, A.; Sethuraman, S.; Sundaramurthi, D. Hyaluronic Acid as Bioink and Hydrogel Scaffolds for Tissue Engineering Applications. Acs Biomater. Sci. Eng. 2023. [Google Scholar] [CrossRef] [PubMed]
  34. Nele, V.; Wojciechowski, J.P.; Armstrong, J.P.K.; Stevens, M.M. Tailoring gelation mechanisms for advanced hydrogel applications. Adv. Funct. Mater. 2020, 30, 2002759. [Google Scholar] [CrossRef]
  35. Haque, M.A.; Kurokawa, T.; Nakajima, T.; Kamita, G.; Fatema, Z.; Gong, J.P. Surfactant induced bilayer-micelle transition for emergence of functions in anisotropic hydrogel. J. Mater. Chem. B 2022, 10, 8386–8397. [Google Scholar] [CrossRef] [PubMed]
  36. Dawson, G. Measuring brain lipids. Biochim. Biophys. Acta BBA Mol. Cell Biol. Lipids 2015, 1851, 1026–1039. [Google Scholar] [CrossRef]
  37. Pankova, Y.P.; Dremuk, A.P.; Kienskaya, K.I. Study of the process of micellization in aqueous solutions of alkylpolyglucosides and surfactant mixtures based on it. Butlerov Commun. 2018, 55, 66–72. [Google Scholar]
  38. Lavrova, A.I.; Sychev, A.V.; Vanina, A.S.; Grekhnyova, E.V.; Postnikov, E.B. Accessing random diffusivity in a hydrogel-based brain’s paranchyma phantom. In Proceedings of the 2022 7th International Conference on Intelligent Informatics and Biomedical Science (ICIIBMS), Nara, Japan, 24–26 November 2022; Volume 7, pp. 243–244. [Google Scholar] [CrossRef]
  39. Postnikov, E.B.; Chechkin, A.; Sokolov, I.M. Brownian yet non-Gaussian diffusion in heterogeneous media: From superstatistics to homogenization. New J. Phys. 2020, 22, 063046. [Google Scholar] [CrossRef]
  40. Pardridge, W.M. Brain Drug Targeting. The Future of Brain Drug Development; Cambridge University Press: Cambridge, UK, 2001. [Google Scholar]
  41. Fenstermacher, J.; Kaye, T. Drug “Diffusion” within the Brain. Ann. N. Y. Acad. Sci. 1988, 531, 29–39. [Google Scholar] [CrossRef]
  42. Wolak, D.J.; Thorne, R.G. Diffusion of macromolecules in the brain: Implications for drug delivery. Mol. Pharm. 2013, 10, 1492–1504. [Google Scholar] [CrossRef]
  43. Whitney, E.; Khan, Y.R.; Alastra, A.; Schiraldi, M.; Siddiqi, J. Contrast extravasation post thrombectomy in patients with acute cerebral stroke: A review and recommendations for future studies. Cureus 2020, 12, e10616. [Google Scholar] [CrossRef]
  44. Hamann, G.F.; Okada, Y.; del Zoppo, G.J. Hemorrhagic transformation and microvascular integrity during focal cerebral ischemia/reperfusion. J. Cereb. Blood Flow Metab. 1996, 16, 1373–1378. [Google Scholar] [CrossRef]
  45. Peladeau-Pigeon, M.; Coolens, C. Computational fluid dynamics modelling of perfusion measurements in dynamic contrast-enhanced computed tomography: Development, validation and clinical applications. Phys. Med. Biol. 2013, 58, 6111. [Google Scholar] [CrossRef] [PubMed]
  46. Rogatina, K.V.; Namykin, A.A.; Postnov, D.E. Vascular mesh and diffusive bells: 2D modeling of blood-brain barrier leakage. Proc. SPIE 2019, 11067, 245–250. [Google Scholar] [CrossRef]
  47. Zhan, W.; Alamer, M.; Xu, X.Y. Computational modelling of drug delivery to solid tumour: Understanding the interplay between chemotherapeutics and biological system for optimised delivery systems. Adv. Drug Deliv. Rev. 2018, 132, 81–103. [Google Scholar] [CrossRef] [PubMed]
  48. Stine, C.A.; Munson, J.M. Convection-enhanced delivery: Connection to and impact of interstitial fluid flow. Front. Oncol. 2019, 9, 966. [Google Scholar] [CrossRef]
  49. Ingrisch, M.; Sourbron, S. Tracer-kinetic modeling of dynamic contrast-enhanced MRI and CT: A primer. J. Pharmacokinet. Pharmacodyn. 2013, 40, 281–300. [Google Scholar] [CrossRef]
  50. Romain, B.; Rouet, L.; Ohayon, D.; Lucidarme, O.; d’Alché Buc, F.; Letort, V. Parameter estimation of perfusion models in dynamic contrast-enhanced imaging: A unified framework for model comparison. Med. Image Anal. 2017, 35, 360–374. [Google Scholar] [CrossRef]
  51. Spitz, S.; Ko, E.; Ertl, P.; Kamm, R.D. How Organ-on-a-Chip Technology Can Assist in Studying the Role of the Glymphatic System in Neurodegenerative Diseases. Int. J. Mol. Sci. 2023, 24, 2171. [Google Scholar] [CrossRef]
Figure 1. Examples of the distributions of the X-ray contrast liquids after leakage from the initial channel (the scale bar shows the size of all samples): (A,B) are the cases of hydrogel with 30% addition of surfactant, and (C,D) are the cases of hydrogel with 30% addition of lipid components. Subplots (A,C) highlight the distribution of the contrast medium only ( L = 287 , W = 332 in Hounsfield units), while (B,D) depict the combined image of the contrast distribution and the surrounding hydrogel ( L = 40 , W = 90 in Hounsfield units, which is the range typical to the brain’s studies); the sample’s cylinder is partially sliced for better visibility.
Fluids 08 00167 g001
Figure 2. The average radii of the CT contrast spread location (penetration lengths) at the cut-off level of intensity L = 40 (asterisks supplied with errorbars denoting the standard deviations) in comparison with the results of mathematical modeling of the radial diffusion (red curve).
Fluids 08 00167 g002
Figure 3. Average experimental radial spread distances (penetration lengths) of Iopromide in hydrogel samples (markers) with different concentrations of lipid and surfactant additives, shown in comparison to the numerical simulations obtained by solving the diffusion equation (curves).
Fluids 08 00167 g003
Table 1. Effective diffusion coefficients of Iopromide in collagen-based hydrogels without and with additives at different concentrations.
AdditivePercentage, % D , 10 6 cm 2 / s
None 9.5
Lipids10%9.5
Lipids20%11.2
Lipids30%13.2
Surfactant10%9.2
Surfactant20%6.5
Surfactant30%5.0
Disclaimer/Publisher’s Note: The statements, opinions and data contained in all publications are solely those of the individual author(s) and contributor(s) and not of MDPI and/or the editor(s). MDPI and/or the editor(s) disclaim responsibility for any injury to people or property resulting from any ideas, methods, instructions or products referred to in the content.

