
Performance of DBD Actuator Models under Various Operating Parameters and Modifications to Improve Them


Abstract
:1. Introduction
2. DBD Actuator Models
2.1. Shyy Model
2.2. Suzen Model
2.3. Dörr and Kloker Model
3. Numerical Setup
4. Results and Discussion
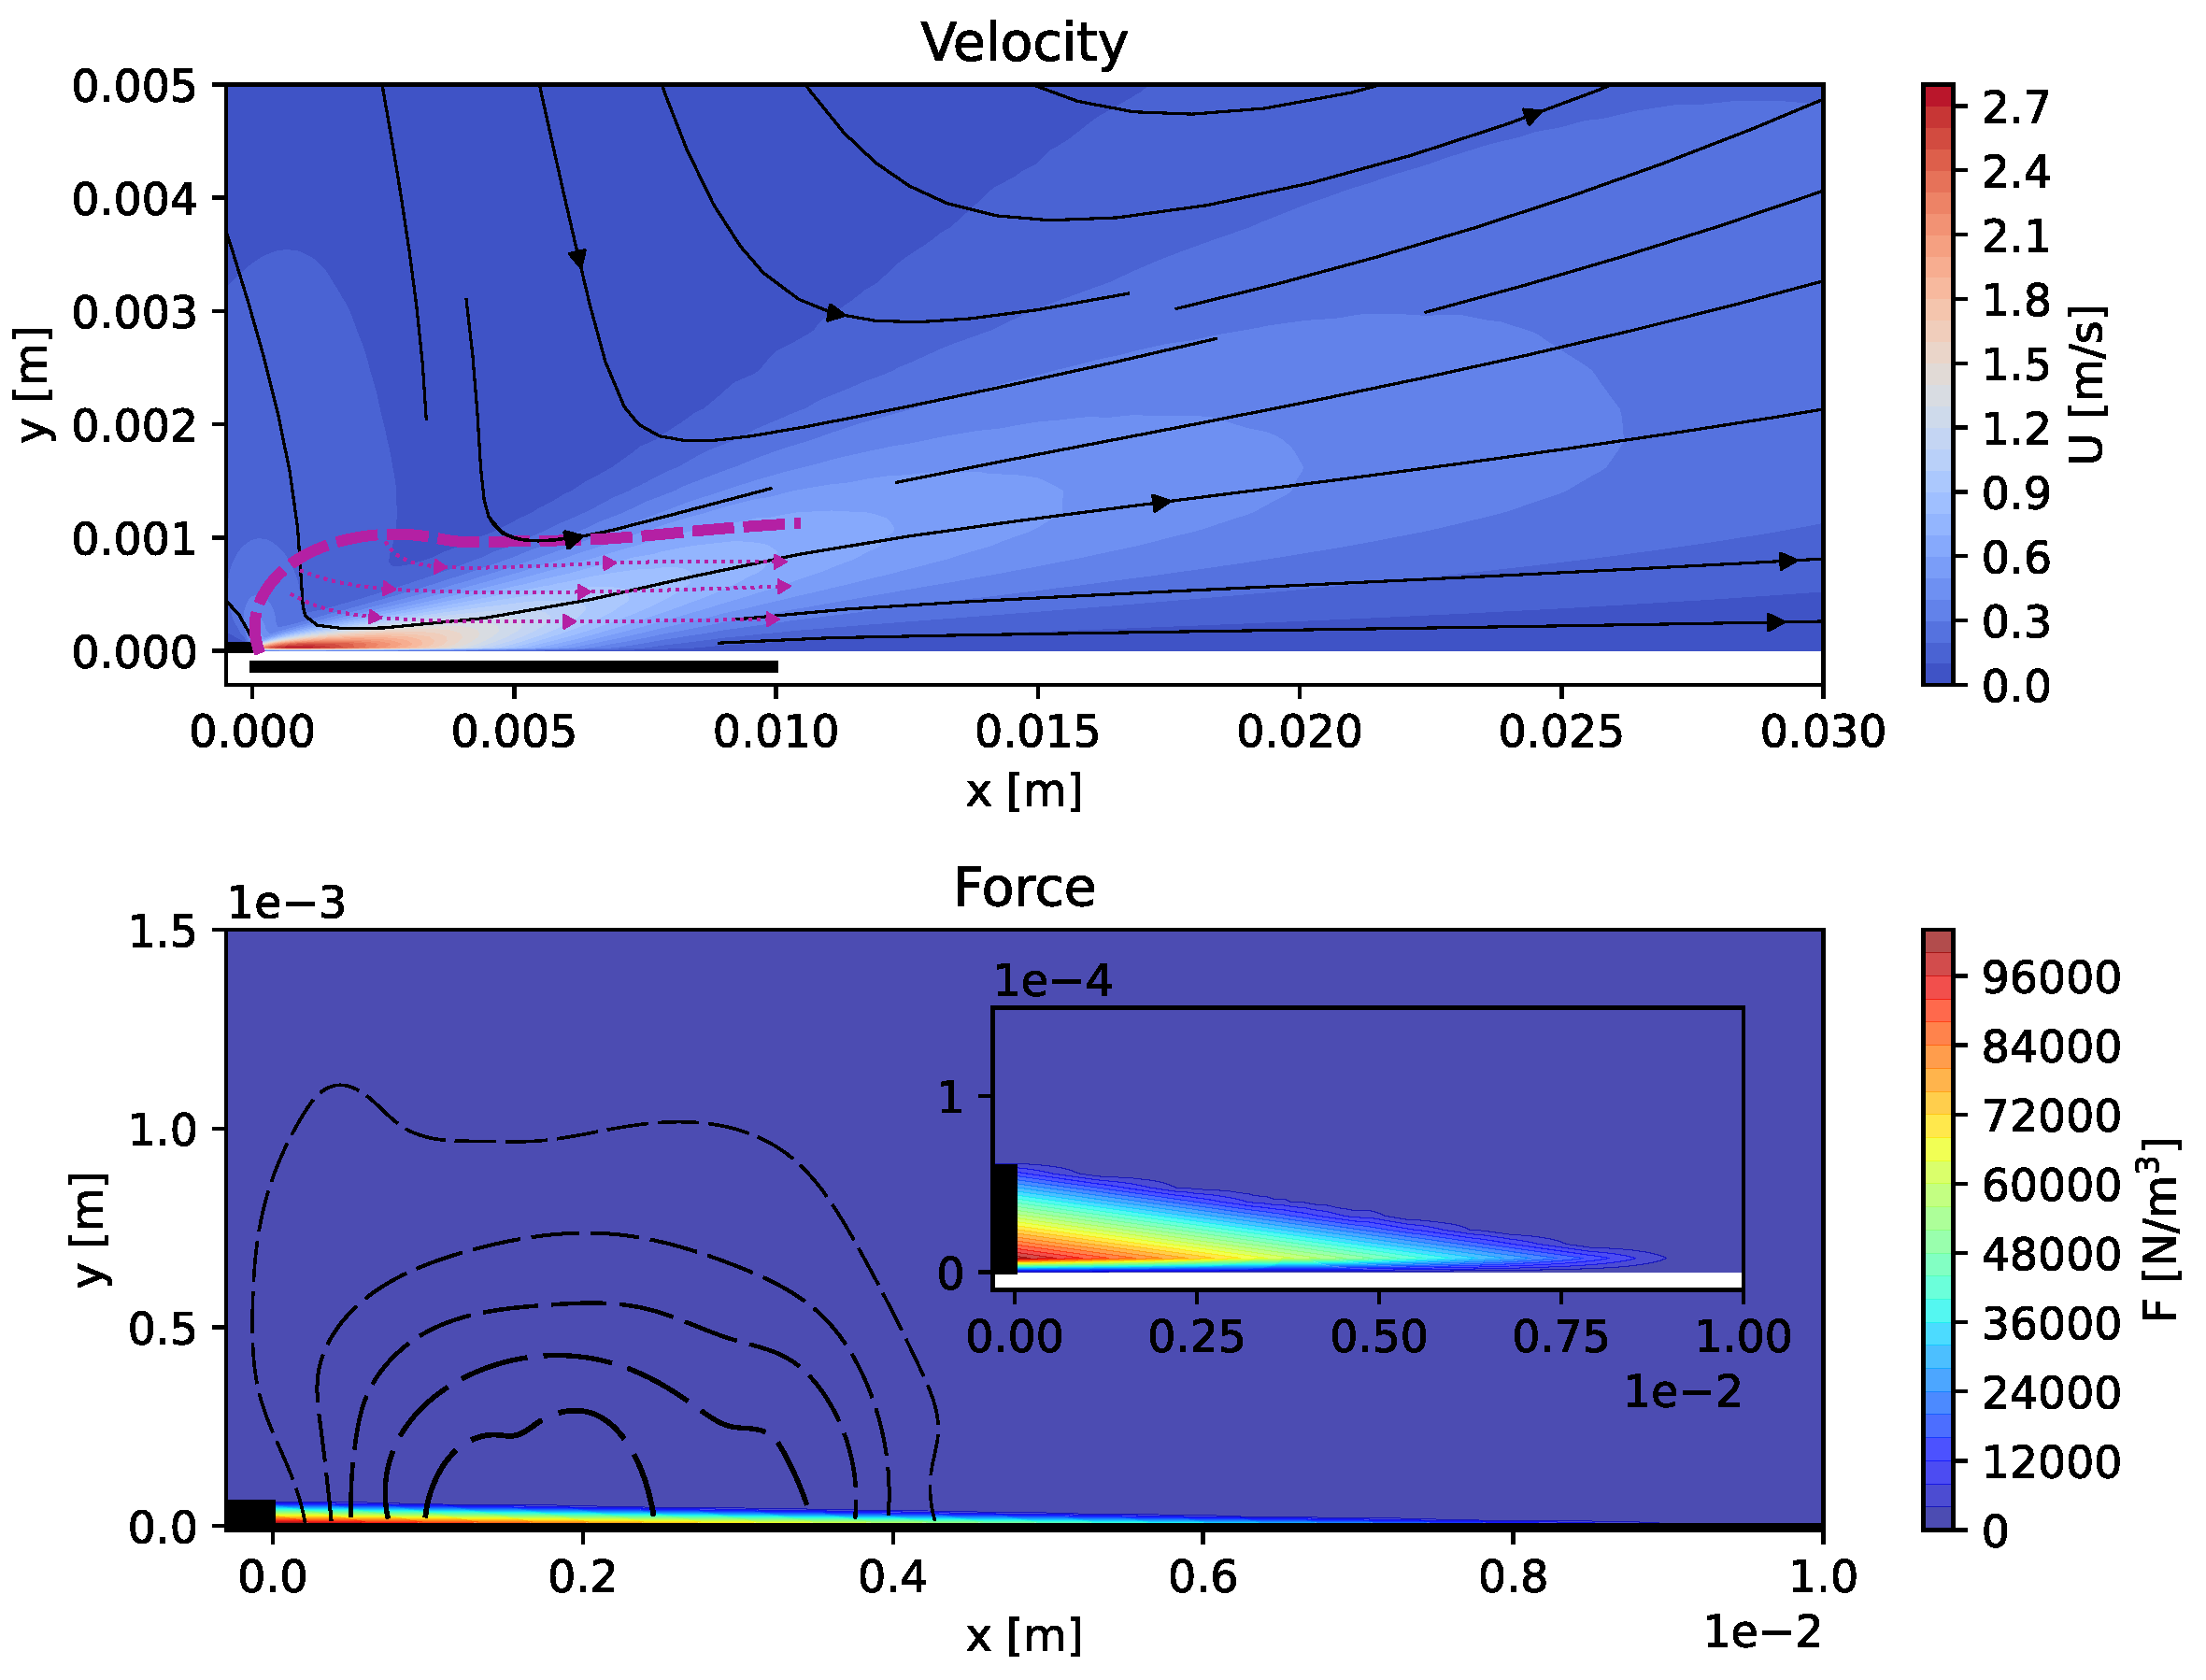
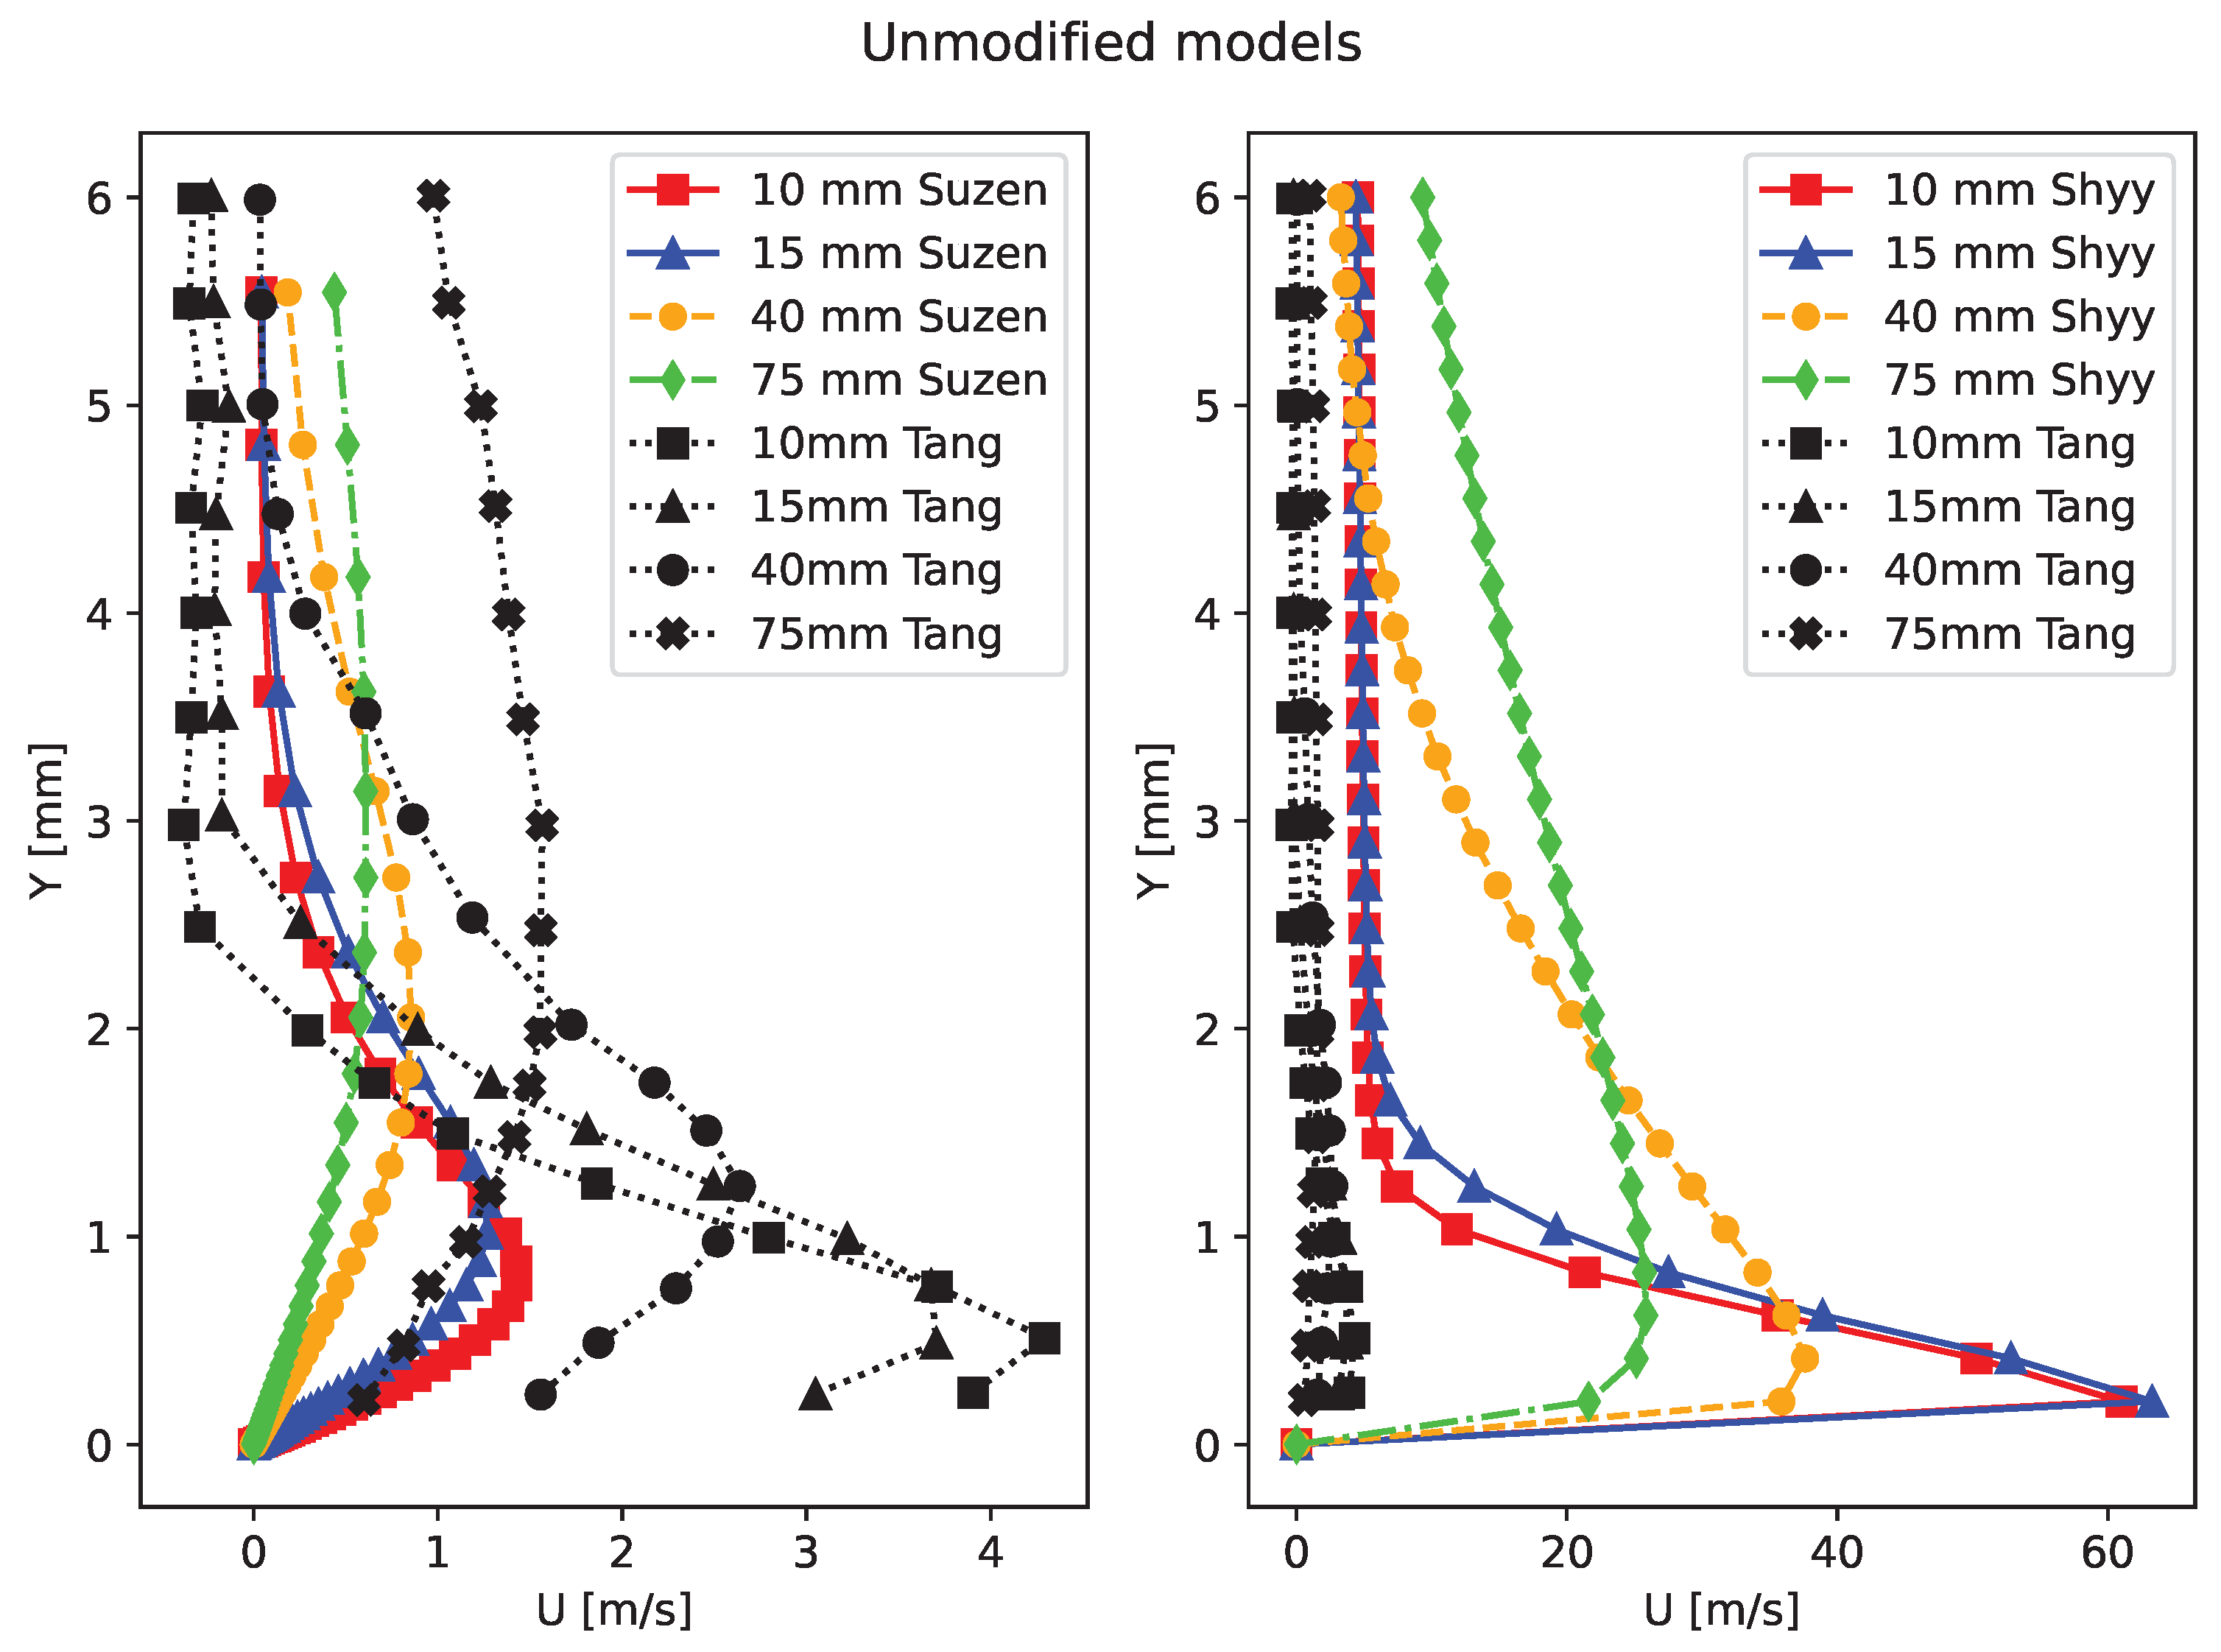
4.1. Case 1 Results
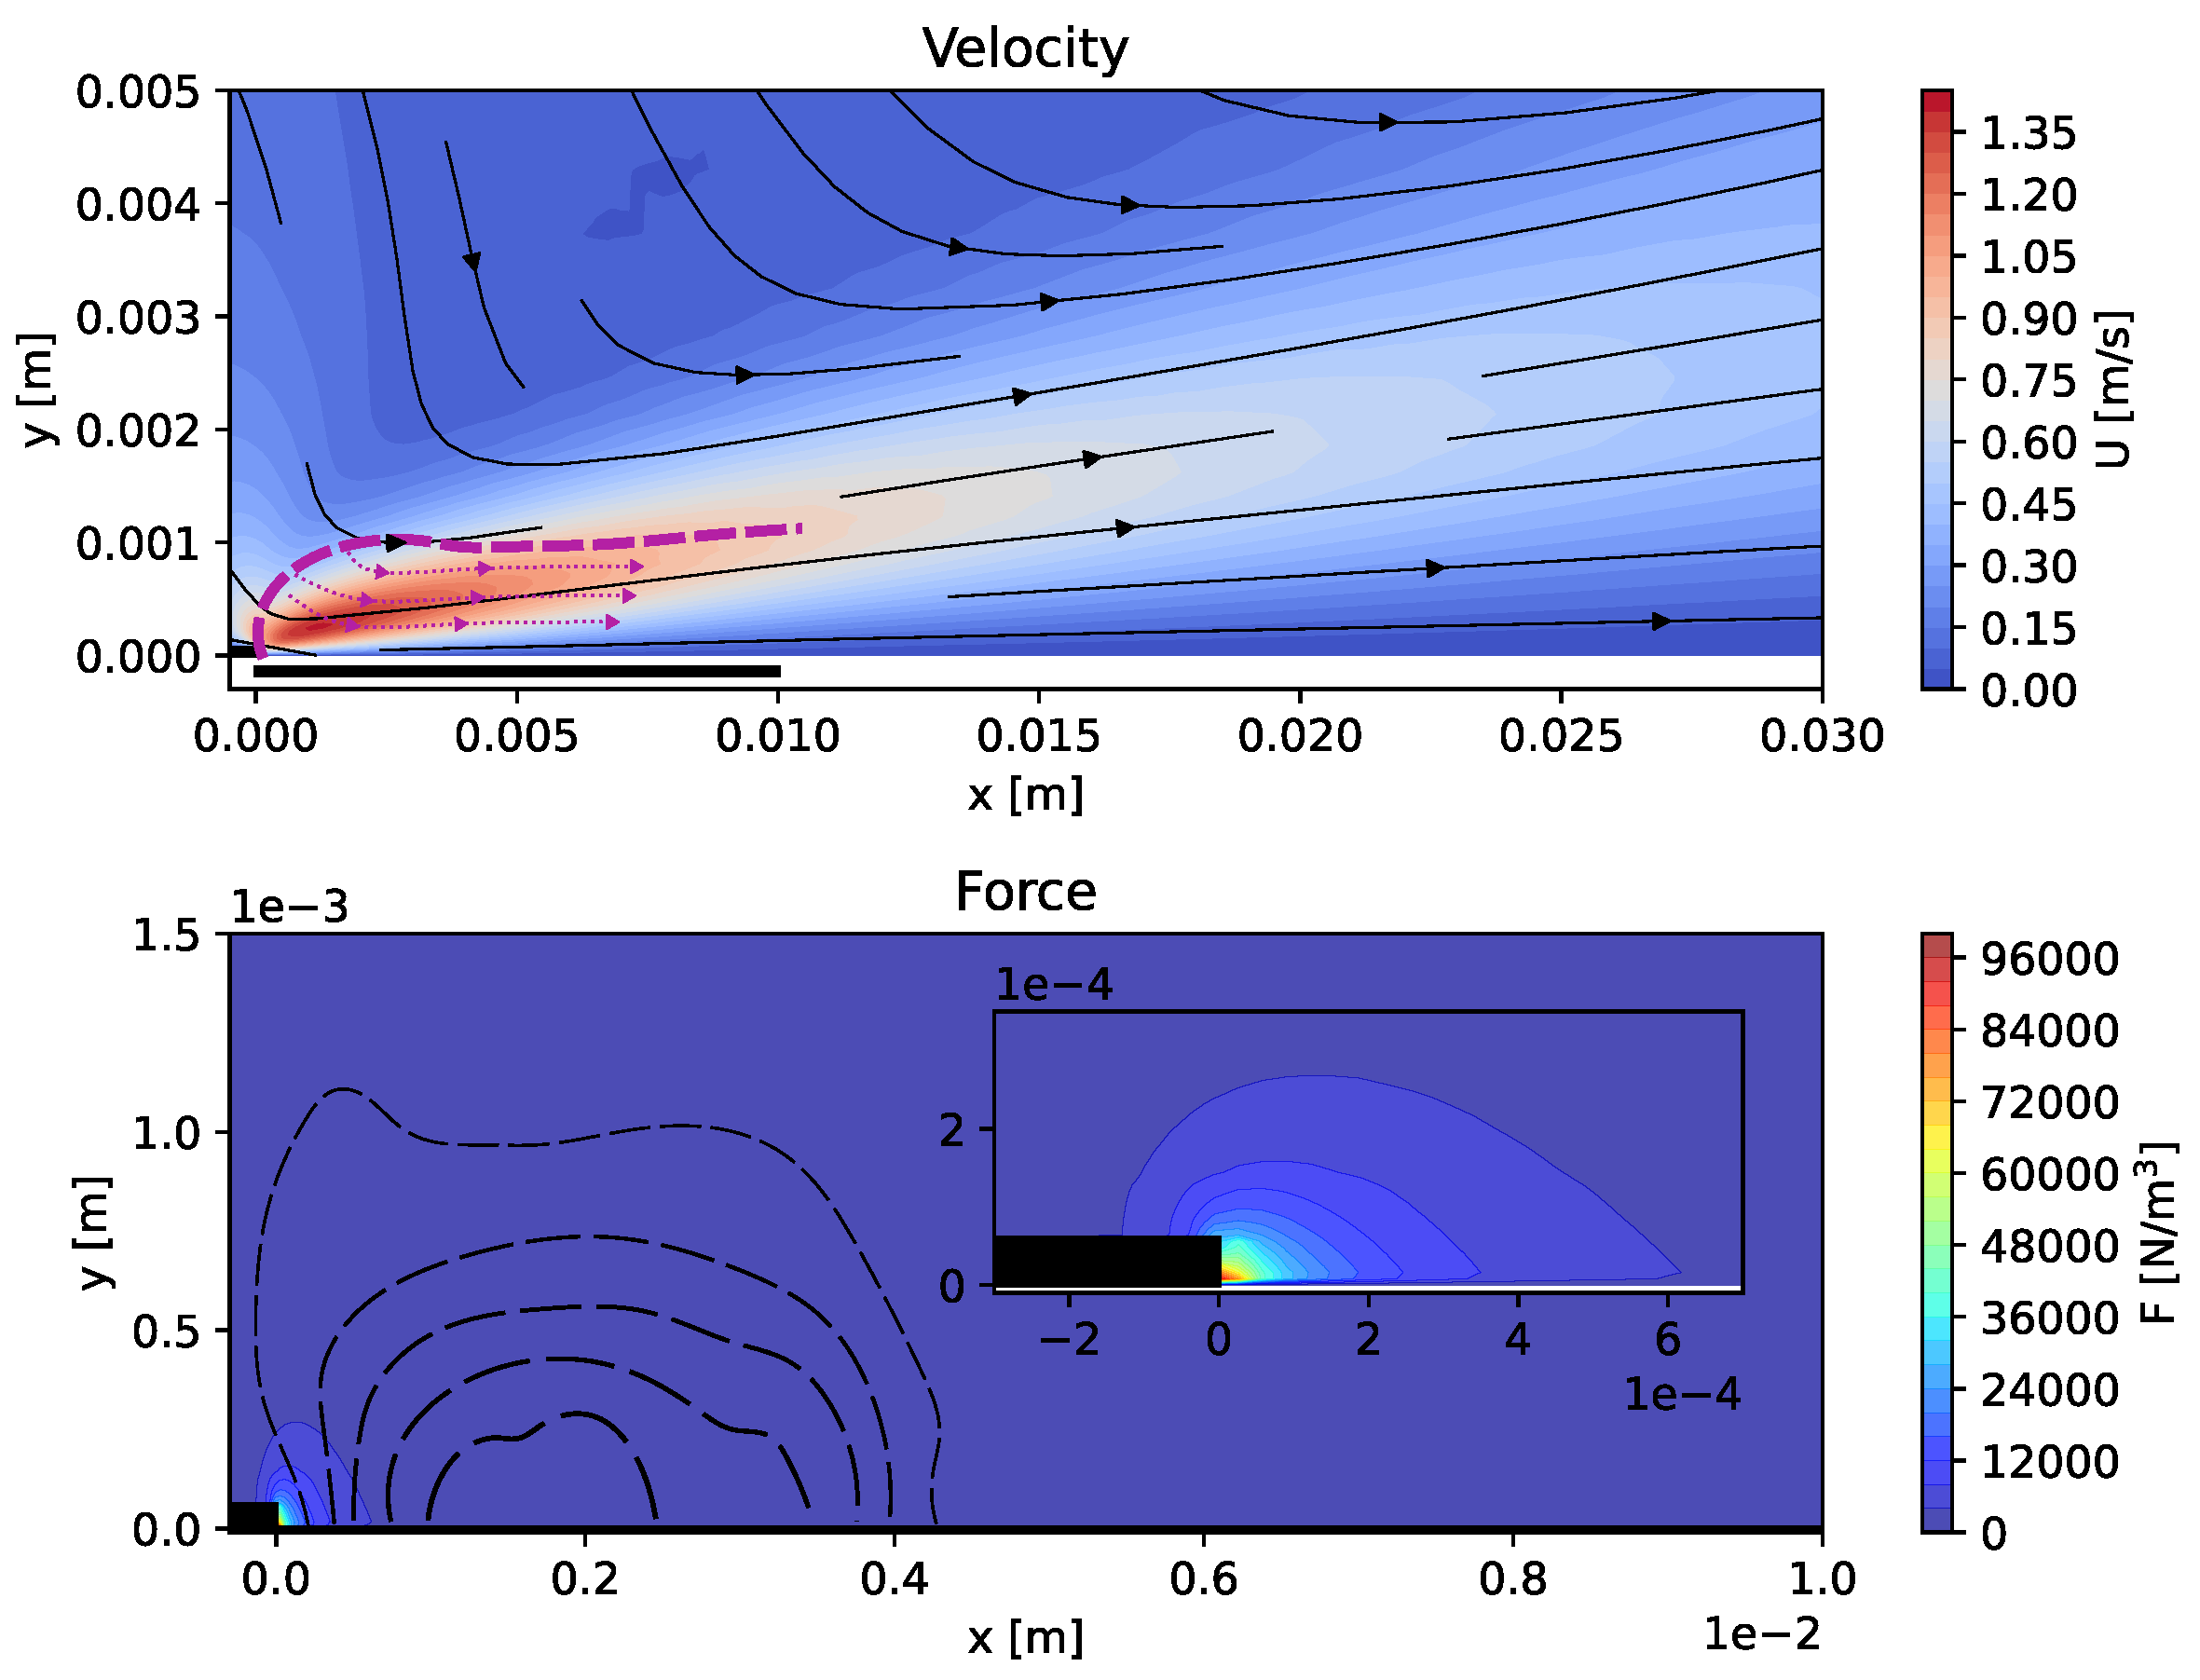
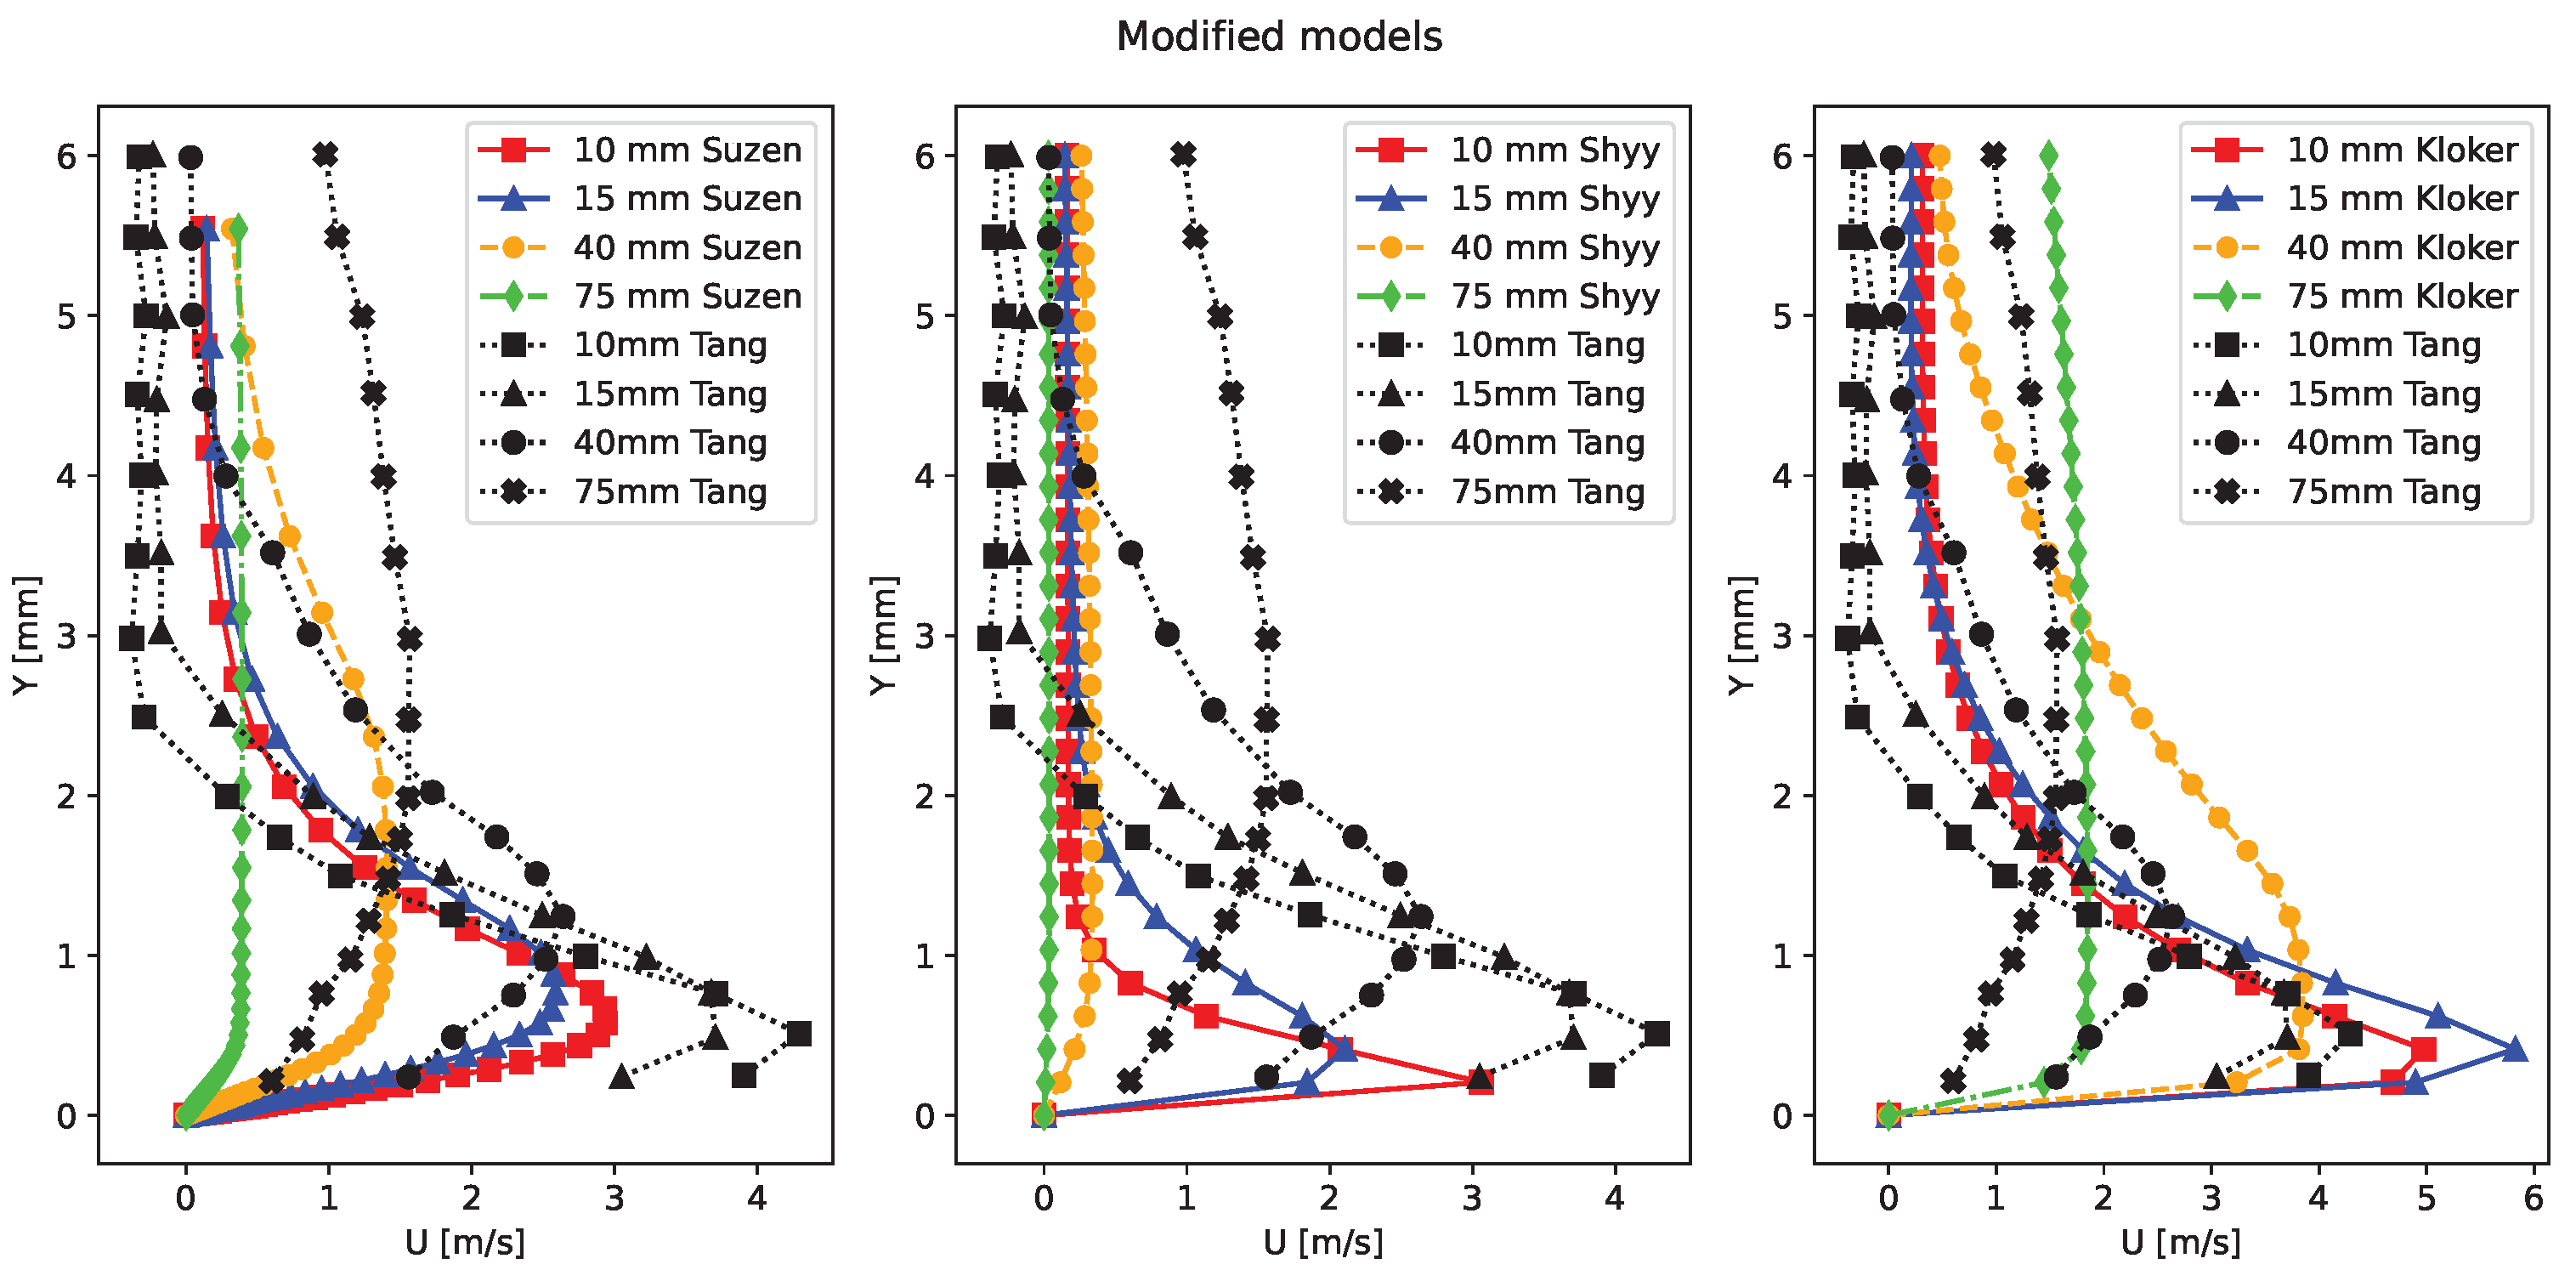
4.2. Case 2 Results
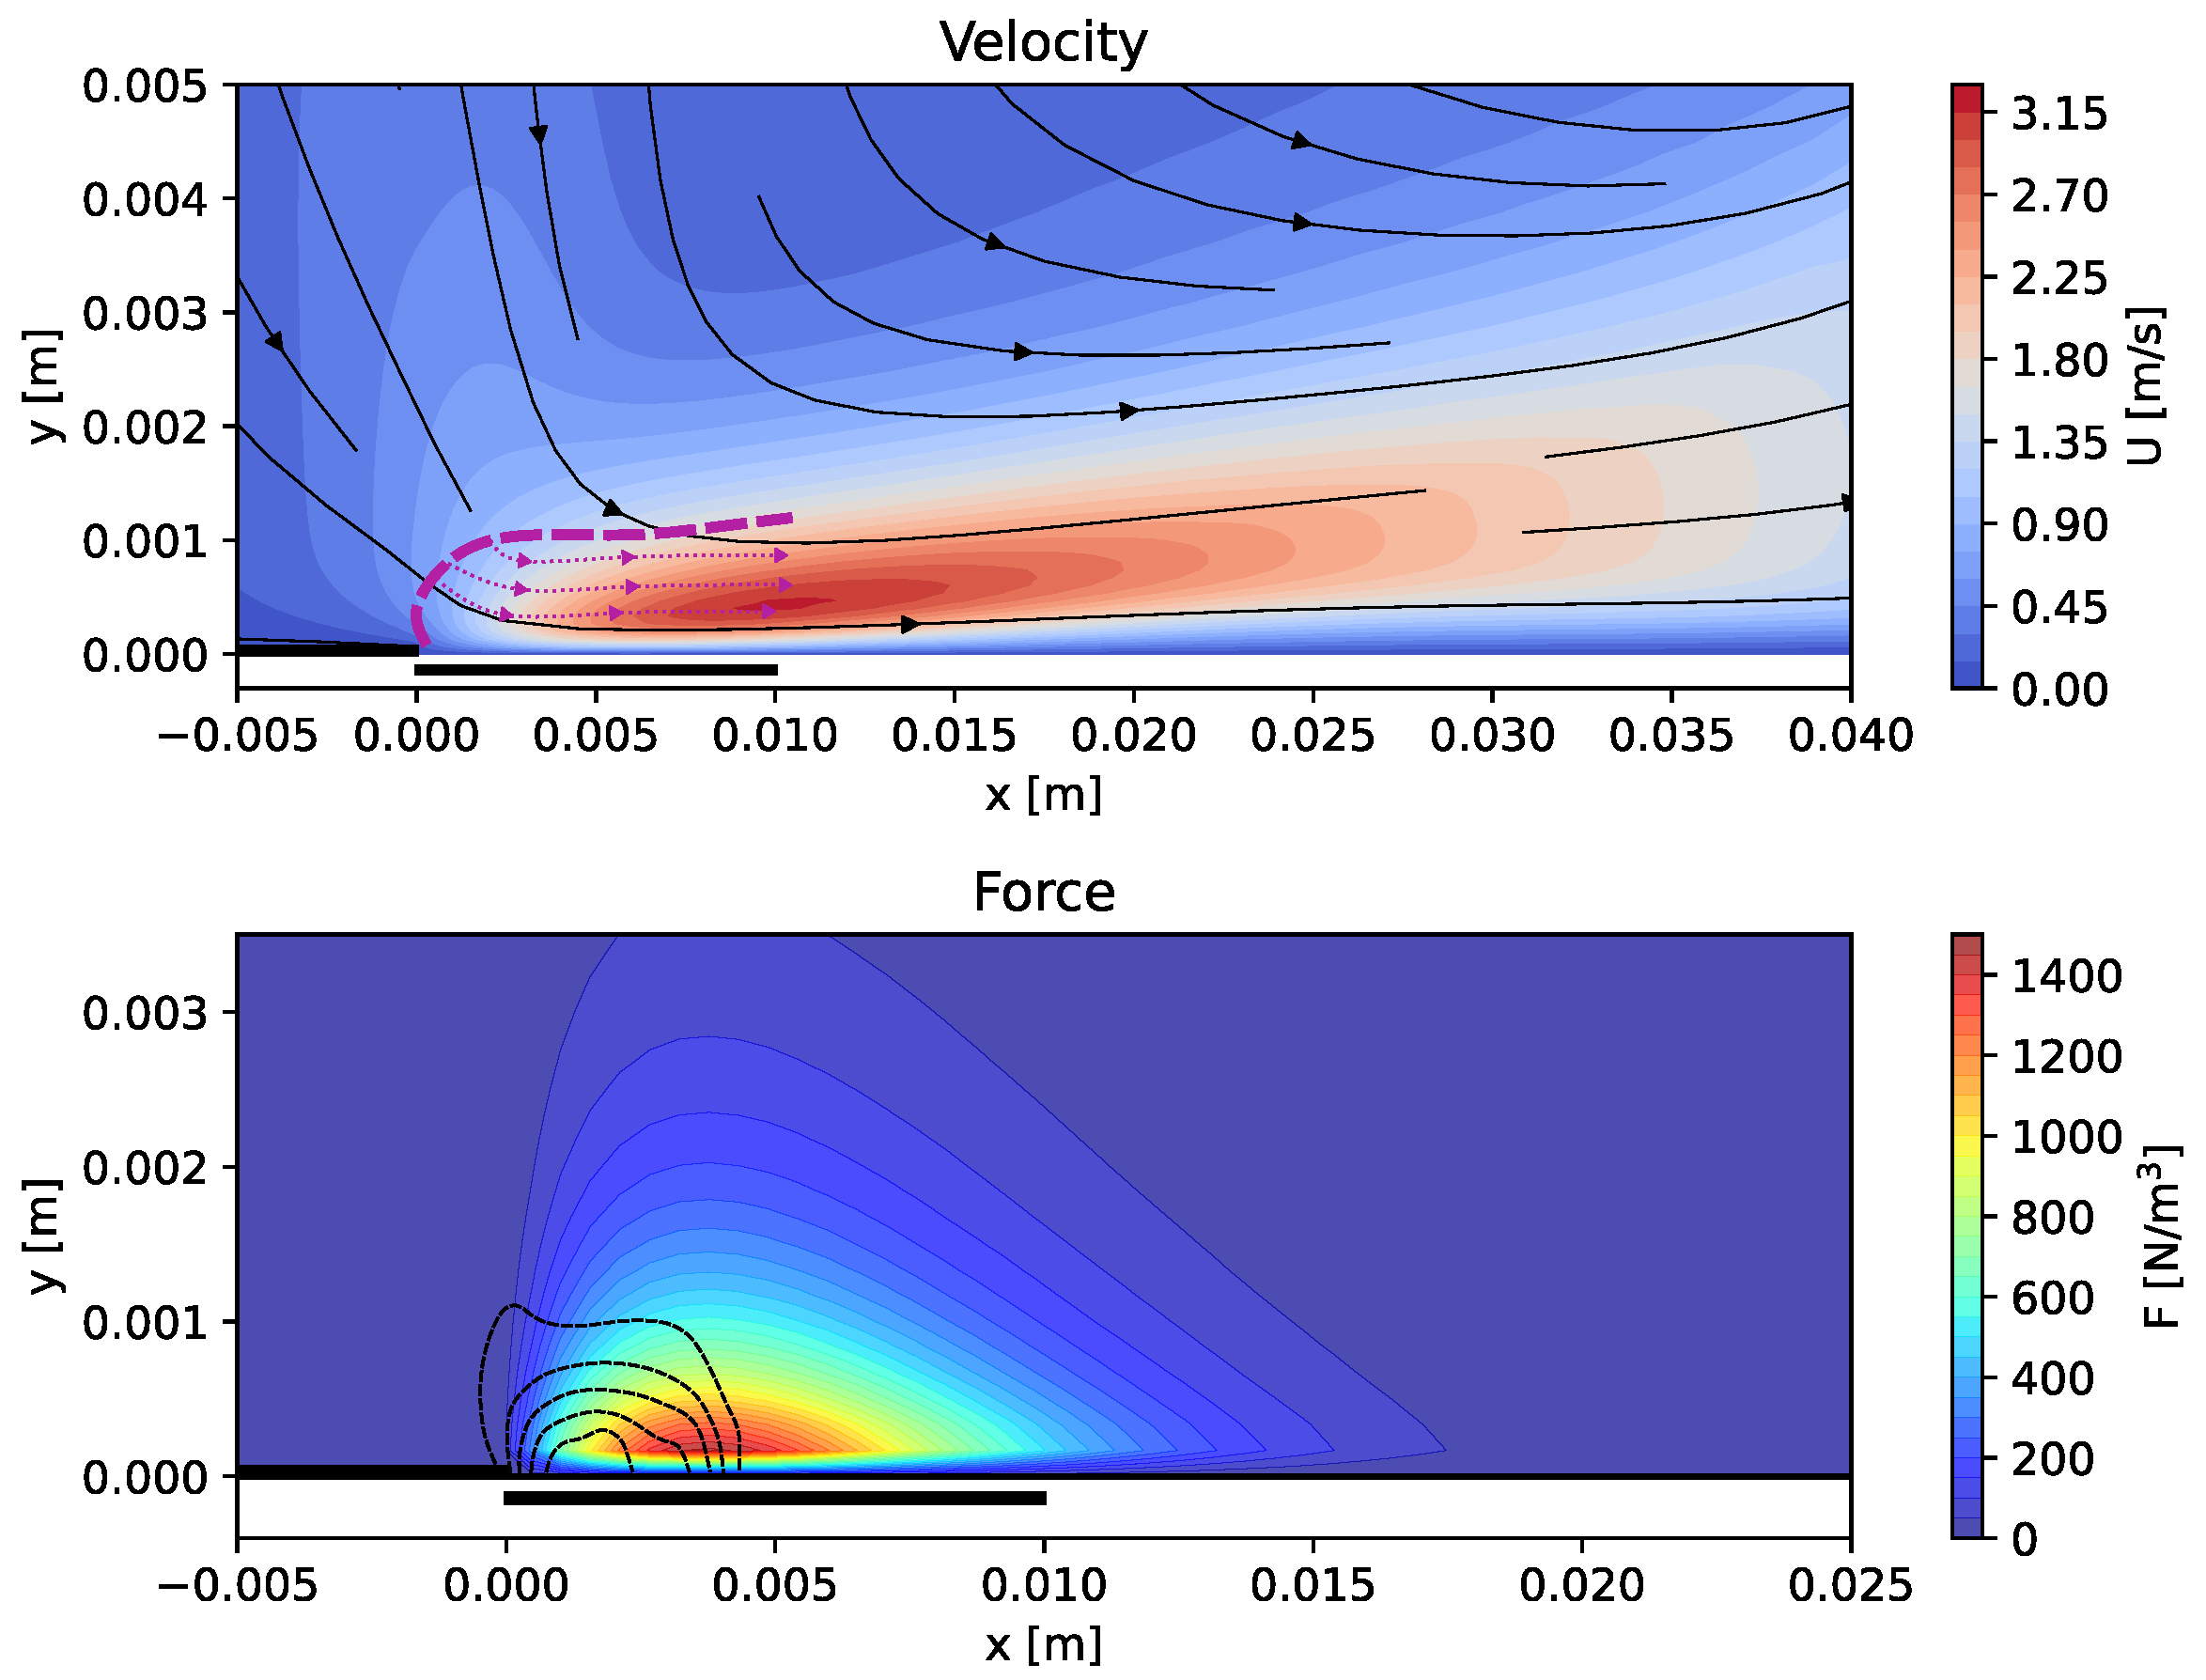
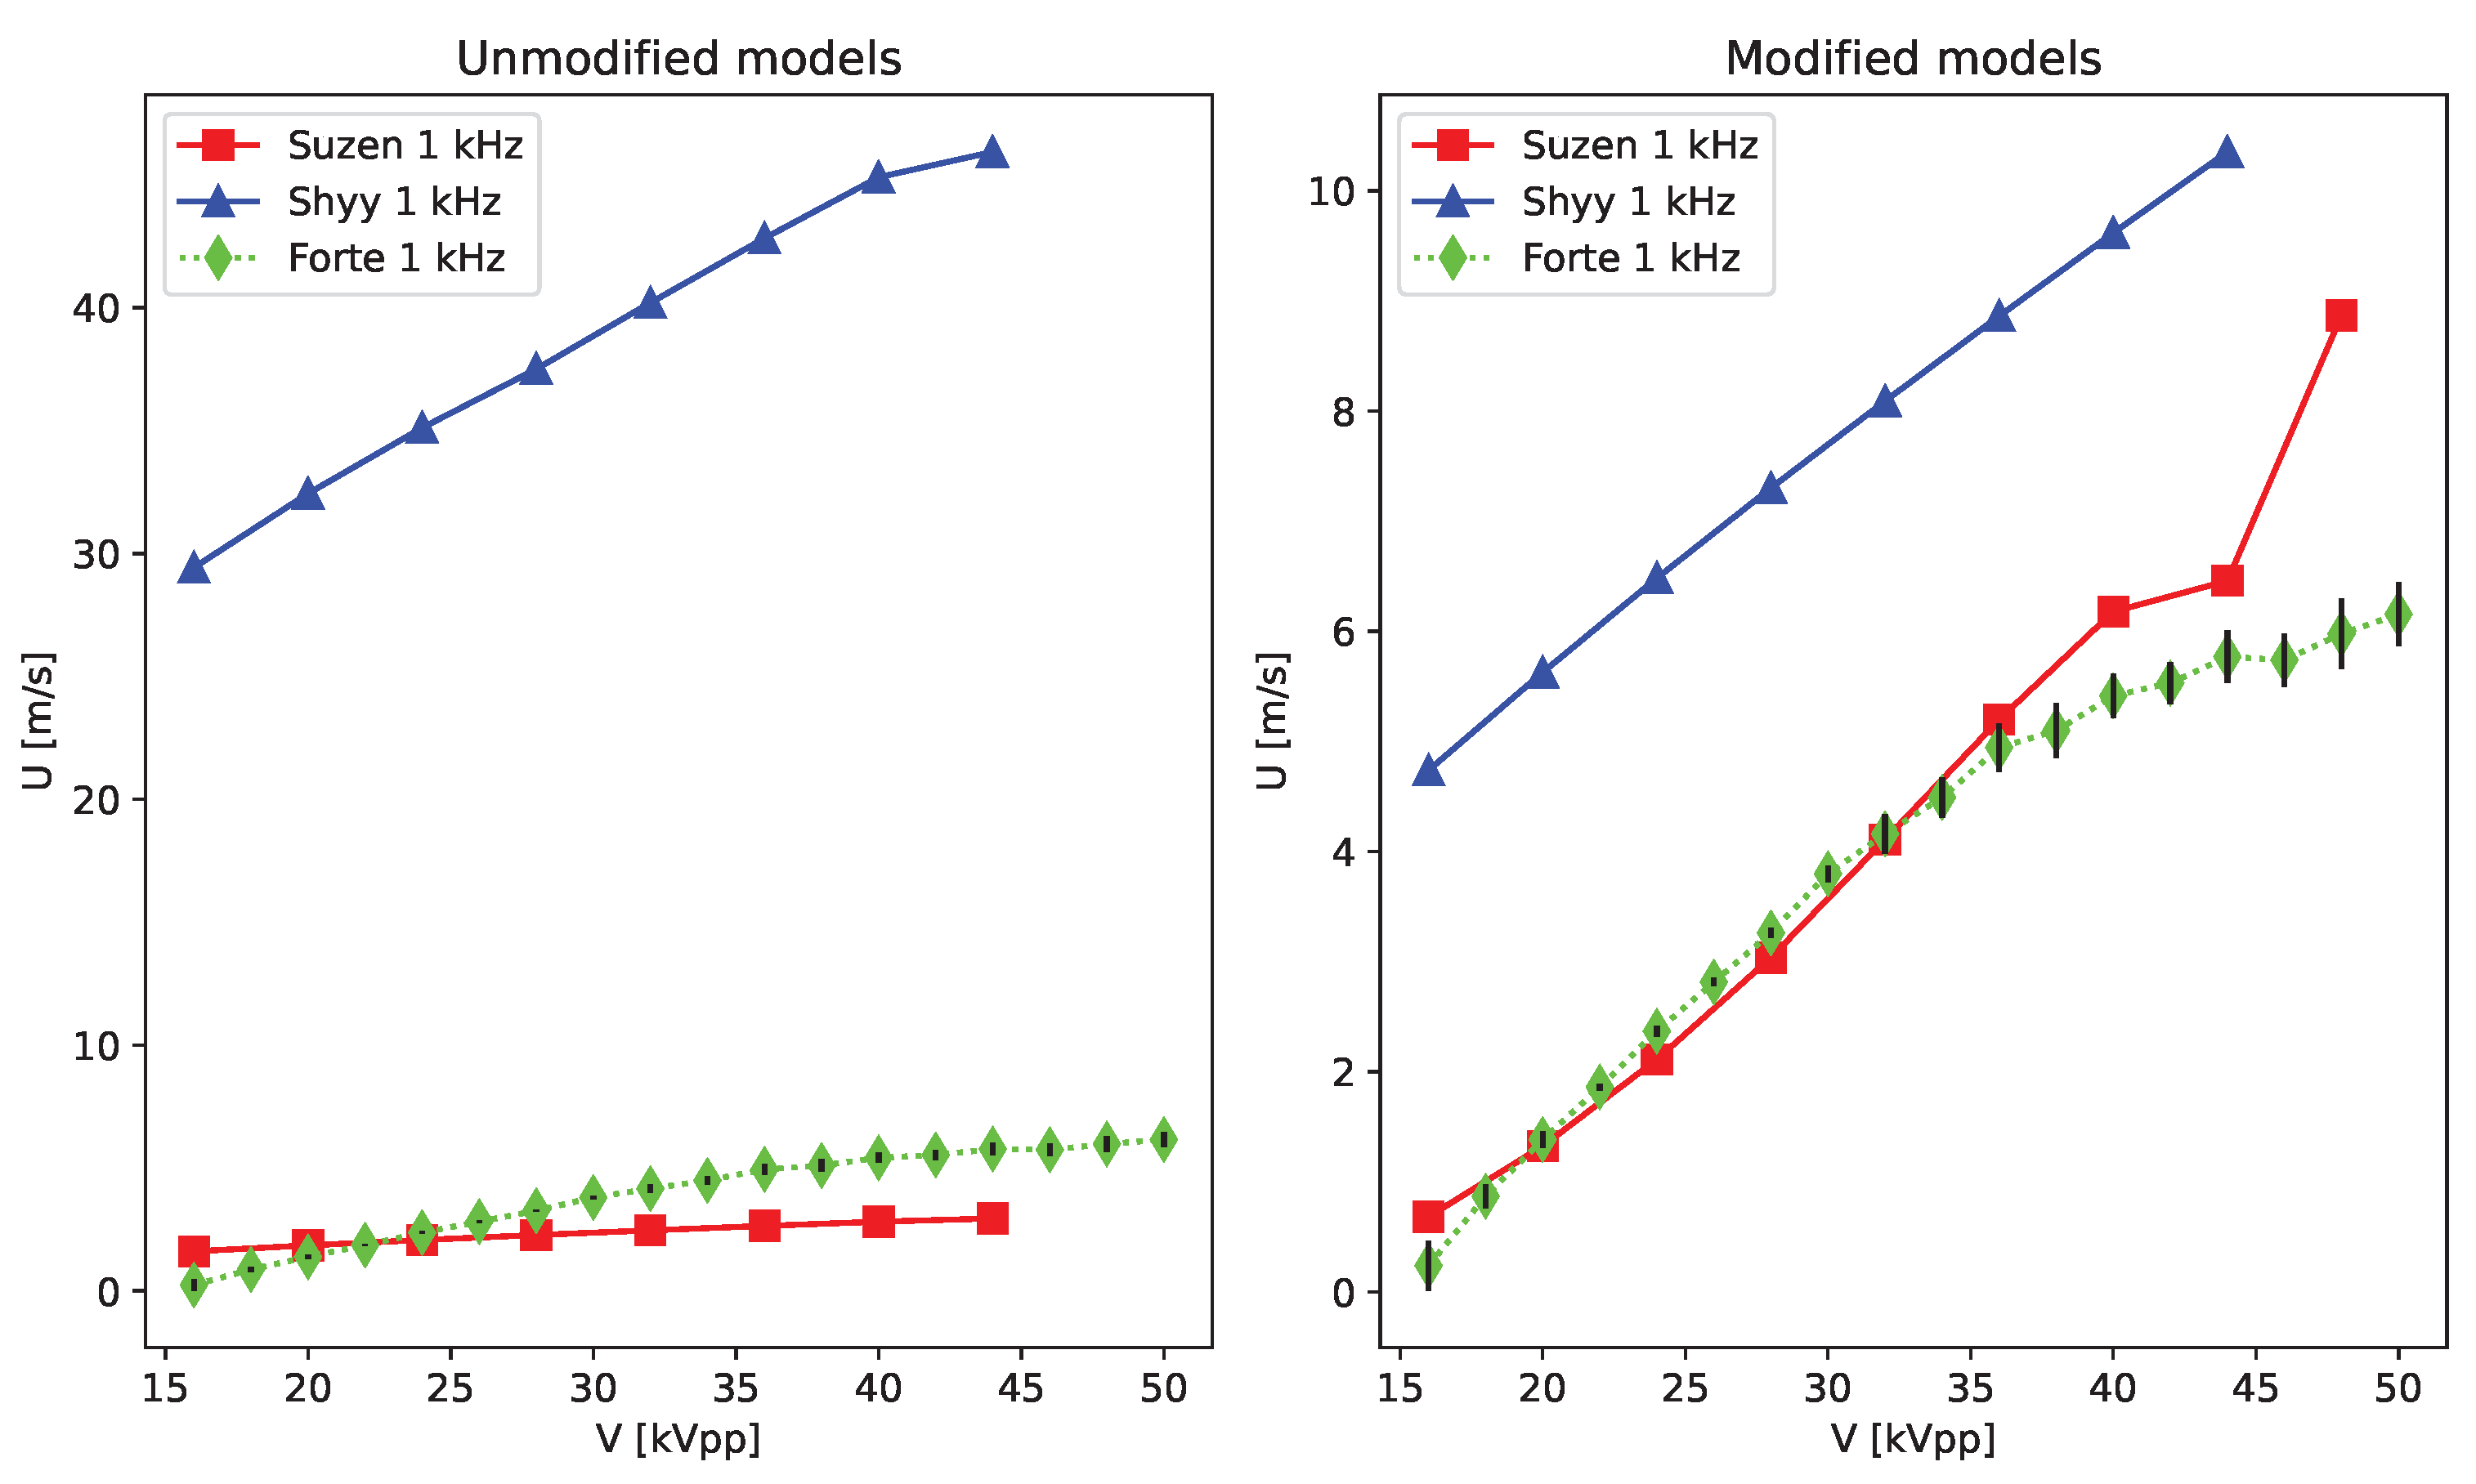
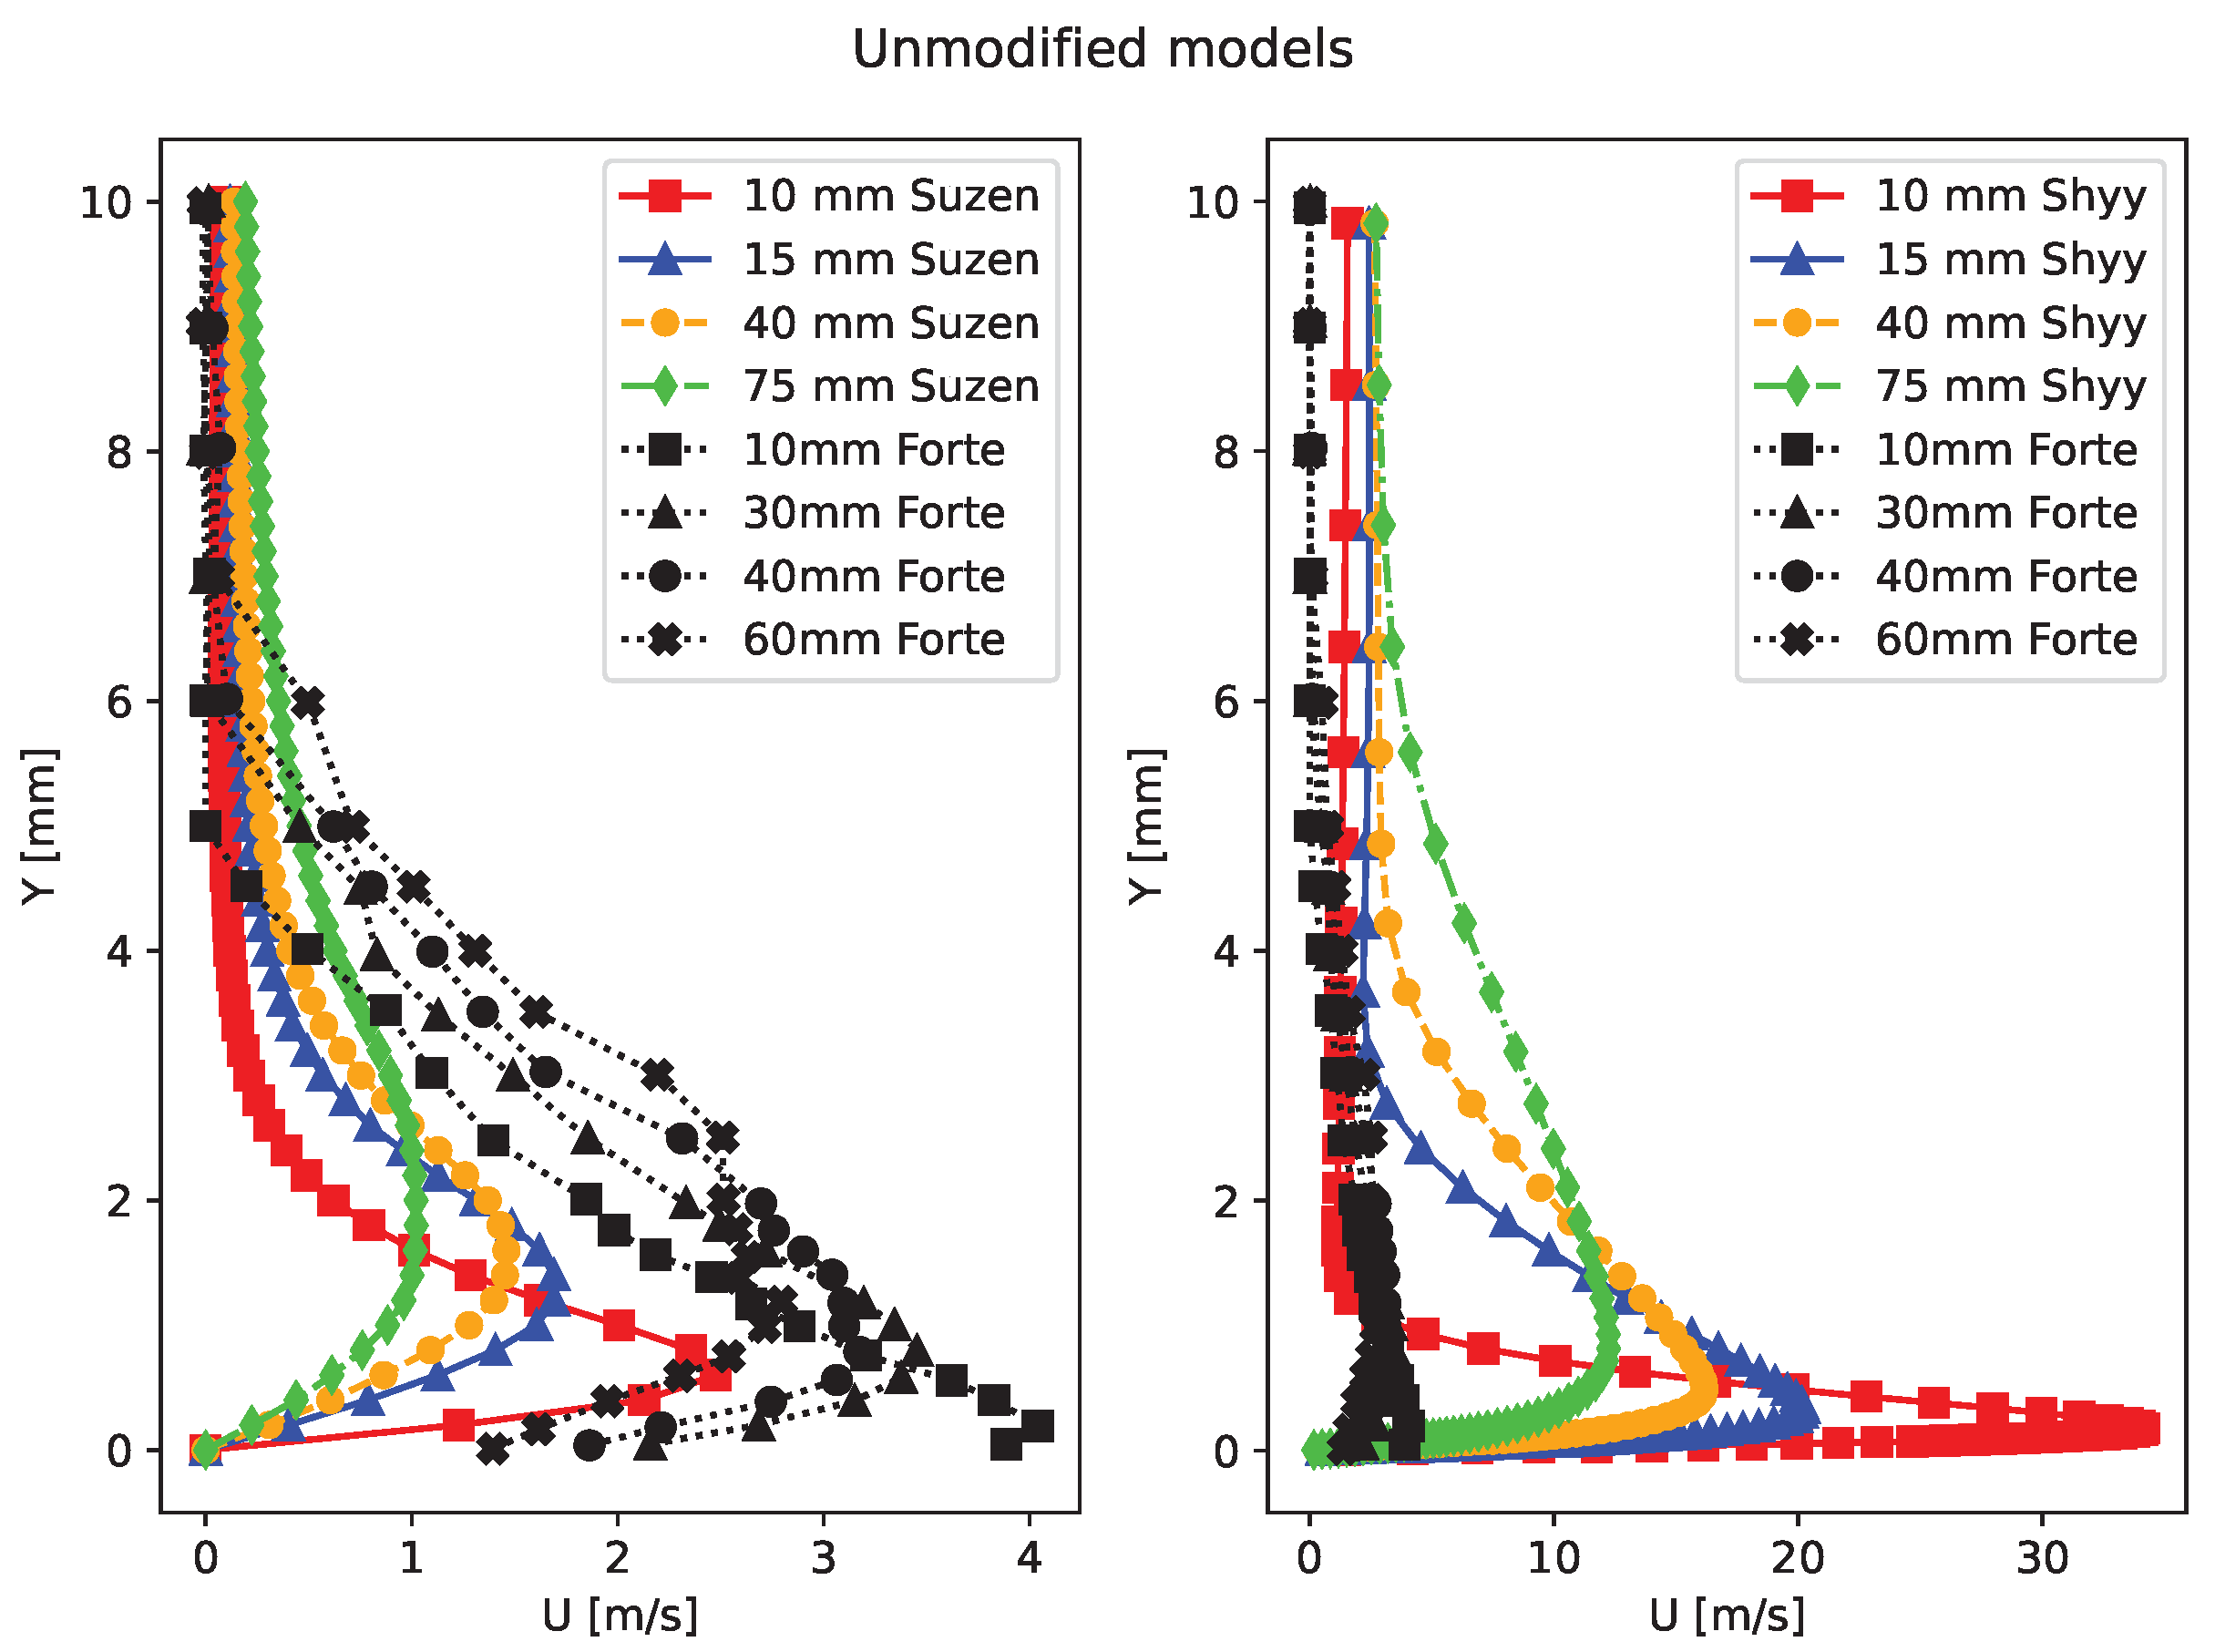
4.3. Case 3 Results
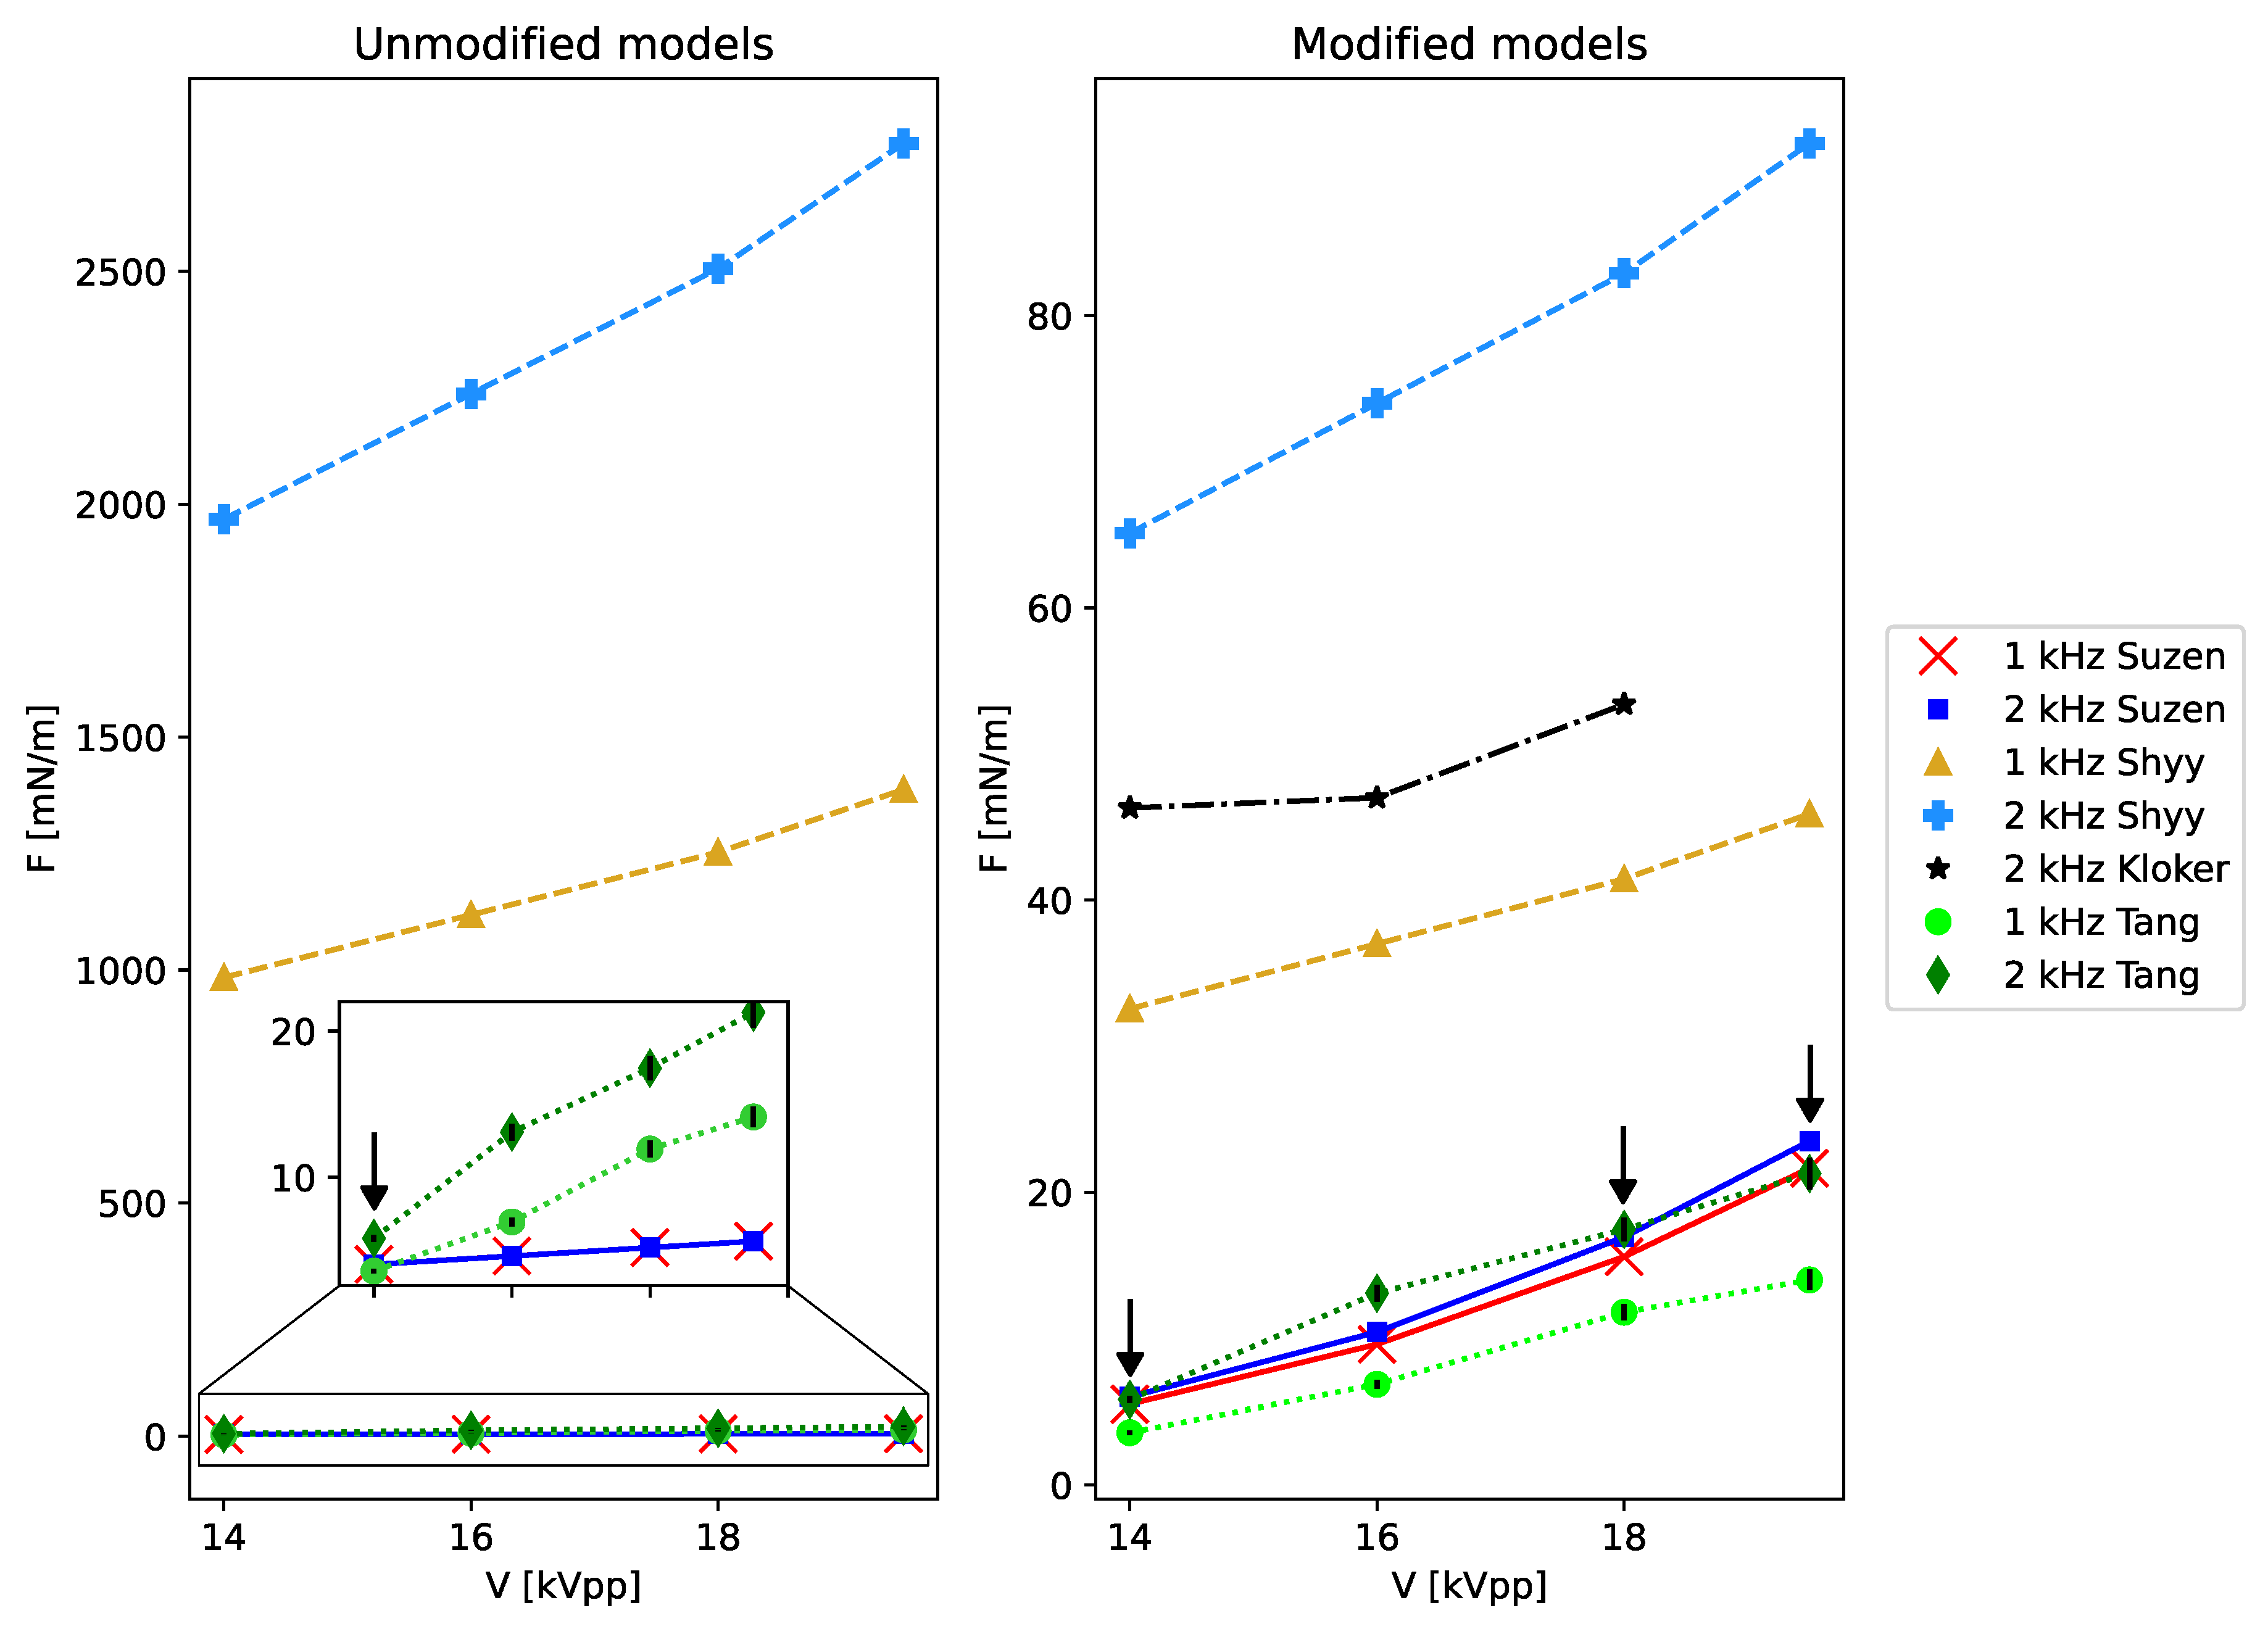
4.4. Discussion
- To calibrate the Suzen model, the maximum charge density can be adjusted to bring the velocity profiles closer to the reference value. This is not an optimal procedure, but allows for fine tuning.
- For cases where data are available to use the Dörr and Kloker model, small corrections can be made by shifting the initial position of the force upstream over the x-axis so that the jet forms in the correct location. Since the velocity is overestimated, applying a lower force will make it lower, this can be achieved by reducing the length of the force to 0.75–0.8 of the lower electrode () length.
5. Conclusions
Author Contributions
Funding
Data Availability Statement
Conflicts of Interest
References
- Corke, T.C.; Thomas, F.O. Active and passive turbulent boundary-layer drag reduction. AIAA J. 2018, 56, 3835–3847. [Google Scholar] [CrossRef]
- Duong, A.H.; Corke, T.C.; Thomas, F.O. Characteristics of drag-reduced turbulent boundary layers with pulsed-direct-current plasma actuation. J. Fluid Mech. 2021, 915. [Google Scholar] [CrossRef]
- He, C.; Corke, T.C.; Patel, M.P. Plasma flaps and slats: An application of weakly ionized plasma actuators. J. Aircr. 2009, 46, 864–873. [Google Scholar] [CrossRef]
- Meng, X.; Hu, H.; Yan, X.; Liu, F.; Luo, S. Lift improvements using duty-cycled plasma actuation at low Reynolds numbers. Aerosp. Sci. Technol. 2018, 72, 123–133. [Google Scholar] [CrossRef]
- Wei, B.; Wu, Y.; Liang, H.; Su, Z.; Li, Y. Flow control on a high-lift wing with microsecond pulsed surface dielectric barrier discharge actuator. Aerosp. Sci. Technol. 2020, 96, 105584. [Google Scholar] [CrossRef]
- Ogawa, T.; Asada, K.; Tatsukawa, T.; Fujii, K. Computational Analysis of the Control Authority of Plasma Actuators for Airfoil Flows at Low Angle of Attack. In Proceedings of the AIAA Scitech 2020 Forum, Orlando, FL, USA, 6–10 January 2020; p. 0578. [Google Scholar] [CrossRef]
- Dörr, P.C.; Kloker, M.J. Numerical investigations on Tollmien–Schlichting wave attenuation using plasma-actuator vortex generators. AIAA J. 2018, 56, 1305–1309. [Google Scholar] [CrossRef]
- Moralev, I.; Sherbakova, V.; Selivonin, I.; Bityurin, V.; Ustinov, M. Effect of the discharge constriction in DBD plasma actuator on the laminar boundary layer. Int. J. Heat Mass Transf. 2018, 116, 1326–1340. [Google Scholar] [CrossRef]
- Moralev, I.; Popov, I.; Selivonin, I.; Ustinov, M. Stochastic forcing of the 2D boundary layer by DBD plasma actuator. J. Phys. Conf. Ser. 2021, 2100, 012001. [Google Scholar] [CrossRef]
- Yarusevych, S.; Kotsonis, M. Effect of local DBD plasma actuation on transition in a laminar separation bubble. Flow Turbul. Combust. 2017, 98, 195–216. [Google Scholar] [CrossRef]
- Michelis, T.; Yarusevych, S.; Kotsonis, M. On the origin of spanwise vortex deformations in laminar separation bubbles. J. Fluid Mech. 2018, 841, 81–108. [Google Scholar] [CrossRef] [Green Version]
- Liu, Y.; Kolbakir, C.; Hu, H.; Hu, H. A comparison study on the thermal effects in DBD plasma actuation and electrical heating for aircraft icing mitigation. Int. J. Heat Mass Transf. 2018, 124, 319–330. [Google Scholar] [CrossRef]
- Liu, Y.; Kolbakir, C.; Starikovskiy, A.Y.; Miles, R.; Hu, H. An experimental study on the thermal characteristics of NS-DBD plasma actuation and application for aircraft icing mitigation. Plasma Sources Sci. Technol. 2019, 28, 014001. [Google Scholar] [CrossRef] [Green Version]
- Meng, X.; Hu, H.; Li, C.; Abbasi, A.A.; Cai, J.; Hu, H. Mechanism study of coupled aerodynamic and thermal effects using plasma actuation for anti-icing. Phys. Fluids 2019, 31, 037103. [Google Scholar] [CrossRef] [Green Version]
- Abdollahzadeh, M.; Rodrigues, F.; Nunes-Pereira, J.; Pascoa, J.; Pires, L. Parametric optimization of surface dielectric barrier discharge actuators for ice sensing application. Sens. Actuators A Phys. 2022, 335, 113391. [Google Scholar] [CrossRef]
- Wasala, S.; Peng, S.H.; Yao, H.D.; Davidson, L. Airframe noise reduction for a wing-flap configuration using dbd plasma actuators. In Proceedings of the 25th AIAA/CEAS Aeroacoustics Conference, Delft, The Netherlands, 20–23 May 2019; p. 2576. [Google Scholar] [CrossRef]
- da Silva, G.P.G.; Eguea, J.P.; Croce, J.A.G.; Catalano, F.M. Slat aerodynamic noise reduction using dielectric barrier discharge plasma actuators. Aerosp. Sci. Technol. 2020, 97, 105642. [Google Scholar] [CrossRef]
- Yu, J.; Wang, Z.; Chen, F.; Yan, G.; Wang, C. Large Eddy Simulation of the Elliptic Jets in Film Cooling Controlled by Dielectric Barrier Discharge Plasma Actuators with an Improved Model. J. Heat Transf. 2018, 140, 122001. [Google Scholar] [CrossRef]
- Huang, Y.; Zhang, Z.; He, K.; Yan, X. Enhanced Film Cooling Effect Downstream of a Cylindrical Hole Using SDBD and DBD-VGs Plasma Actuations. In Proceedings of the Turbo Expo: Power for Land, Sea, and Air; American Society of Mechanical Engineers: New York, NY, USA, 2021; Volume 84973, p. 27. [Google Scholar] [CrossRef]
- Ebrahimi, A.; Movahhedi, M. Power improvement of NREL 5-MW wind turbine using multi-DBD plasma actuators. Energy Convers. Manag. 2017, 146, 96–106. [Google Scholar] [CrossRef]
- Griffith, D.T.; Fine, N.E.; Cooney, J.A.; Rotea, M.A.; Iungo, G.V. Active Aerodynamic Load Control for Improved Wind Turbine Design. In Proceedings of the Journal of Physics: Conference Series; IOP Publishing: Bristol, UK, 2020; Volume 1618, p. 052079. [Google Scholar] [CrossRef]
- Omidi, J.; Mazaheri, K. Aerodynamic Enhancement and Improving the Performance of a Six-Megawatt DOWEC Wind Turbine by Micro-Plasma Actuator. Int. J. Mech. Sci. 2021, 195, 106228. [Google Scholar] [CrossRef]
- Benmoussa, A.; Páscoa, J.C. Cycloidal rotor coupled with DBD plasma actuators for performance improvement. Aerosp. Sci. Technol. 2021, 110, 106468. [Google Scholar] [CrossRef]
- Zhang, H.; Wu, Y.; Li, Y. Mechanism of compressor airfoil boundary layer flow control using nanosecond plasma actuation. Int. J. Heat Fluid Flow 2019, 80, 108502. [Google Scholar] [CrossRef]
- De Giorgi, M.G.; Motta, V.; Suma, A.; Laforì, A. Comparison of different plasma actuation strategies for aeroelastic control on a linear compressor cascade. Aerosp. Sci. Technol. 2021, 117, 106902. [Google Scholar] [CrossRef]
- Wang, Y.; Zhang, H.; Wu, Y.; Li, Y.; Zhu, Y. Compressor airfoil separation control using nanosecond plasma actuation at low Reynolds number. AIAA J. 2022, 60, 1171–1185. [Google Scholar] [CrossRef]
- Chen, C.; Che, X.; Zheng, T.; Chen, Q.; Li, L.; Li, X. Experimental study on dielectric barrier discharge plasma-assisted combustion for nozzle. In Proceedings of the Journal of Physics: Conference Series; IOP Publishing: Bristol, UK, 2019; Volume 1300, p. 012037. [Google Scholar] [CrossRef] [Green Version]
- Ferrero, A.; Pastrone, D. Plasma Actuator–Assisted Rocket Nozzle for Improved Launcher Performance. AIAA J. 2019, 57, 1348–1354. [Google Scholar] [CrossRef]
- Yadala Venkata, S.; Hehner, M.; Serpieri, J.; Benard, N.; Kotsonis, M. Swept-wing transition control using AC-DBD plasma actuators. In Proceedings of the 2018 Flow Control Conference, Atlanta, Georgia, 25–29 June 2018; p. 3215. [Google Scholar] [CrossRef] [Green Version]
- Sekimoto, S.; Kato, H.; Fujii, K.; Yoneda, H. In-Flight Demonstration of Stall Improvement Using a Plasma Actuator for a Small Unmanned Aerial Vehicle. Aerospace 2022, 9, 144. [Google Scholar] [CrossRef]
- Almuina Pica, D.E.; Keener, K.; Lubitz, W.D. Control of Crosswind Force on Aircraft Vertical Tail Models using Plasma Actuators. In Proceedings of the AIAA SCITECH 2022 Forum, San Diego, CA, USA, 3–7 January 2022; p. 0832. [Google Scholar] [CrossRef]
- Wang, C.C.; Wen, C.P. Aerodynamic drag reduction for a truck model using DBD plasma actuators. Adv. Mech. Eng. 2022, 14, 16878132221087852. [Google Scholar] [CrossRef]
- Houser, N. Manufacturing of Dielectric Barrier Discharge Plasma Actuators for Degradation Resistance. Ph.D. Thesis, University of Toronto, Toronto, ON, USA, 2013. [Google Scholar]
- Kriegseis, J.; Simon, B.; Grundmann, S. Towards in-flight applications? a review on dielectric barrier discharge-based boundary-layer control. Appl. Mech. Rev. 2016, 68, 020802. [Google Scholar] [CrossRef]
- Roy, S.; Gaitonde, D. Modeling surface discharge effects of atmospheric RF on gas flow control. In Proceedings of the 43rd AIAA Aerospace Sciences Meeting and Exhibit, Reno, NV, USA, 10–13 January 2005; p. 160. [Google Scholar] [CrossRef]
- Font, G.; Morgan, W. Plasma discharges in atmospheric pressure oxygen for boundary layer separation control. In Proceedings of the 35th AIAA Fluid Dynamics Conference and Exhibit, Toronto, ON, Canada, 6–9 June 2005; p. 4632. [Google Scholar] [CrossRef]
- Likhanskii, A. Particle-in-cell modeling of the pulsed DBD plasma actuator. In Proceedings of the 40th Fluid Dynamics Conference and Exhibit, Chicago, IL, USA, 28 June–1 July 2010; p. 5101. [Google Scholar] [CrossRef]
- Abdollahzadeh, M.; Pascoa, J.; Oliveira, P. Implementation of the classical plasma–fluid model for simulation of dielectric barrier discharge (DBD) actuators in OpenFOAM. Comput. Fluids 2016, 128, 77–90. [Google Scholar] [CrossRef]
- Orlov, D.; Corke, T. Numerical simulation of aerodynamic plasma actuator effects. In Proceedings of the 43rd AIAA Aerospace Sciences Meeting and Exhibit, Reno, NV, USA, 10–13 January 2005; p. 1083. [Google Scholar] [CrossRef]
- Adamiak, K. Quasi-stationary modeling of the DBD plasma flow control around airfoil. Phys. Fluids 2020, 32, 085108. [Google Scholar] [CrossRef]
- Roth, J.R. Aerodynamic flow acceleration using paraelectric and peristaltic electrohydrodynamic effects of a one atmosphere uniform glow discharge plasma. Phys. Plasmas 2003, 10, 2117–2126. [Google Scholar] [CrossRef]
- Shyy, W.; Jayaraman, B.; Andersson, A. Modeling of glow discharge-induced fluid dynamics. J. Appl. Phys. 2002, 92, 6434–6443. [Google Scholar] [CrossRef]
- Suzen, Y.; Huang, G.; Ashpis, D. Numerical simulations of flow separation control in low-pressure turbines using plasma actuators. In Proceedings of the 45th AIAA Aerospace Sciences Meeting and Exhibit, Reno, NV, USA, 8–11 January 2007; p. 937. [Google Scholar] [CrossRef] [Green Version]
- Dörr, P.; Kloker, M. Numerical investigation of plasma-actuator force-term estimations from flow experiments. J. Phys. D Appl. Phys. 2015, 48, 395203. [Google Scholar] [CrossRef]
- Forte, M.; Jolibois, J.; Pons, J.; Moreau, E.; Touchard, G.; Cazalens, M. Optimization of a dielectric barrier discharge actuator by stationary and non-stationary measurements of the induced flow velocity: Application to airflow control. Exp. Fluids 2007, 43, 917–928. [Google Scholar] [CrossRef]
- Kotsonis, M.; Ghaemi, S.; Veldhuis, L.; Scarano, F. Measurement of the body force field of plasma actuators. J. Phys. D Appl. Phys. 2011, 44, 045204. [Google Scholar] [CrossRef] [Green Version]
- Tang, A.; Vaddi, R.S.; Mamishev, A.; Novosselov, I.V. Empirical relations for discharge current and momentum injection in dielectric barrier discharge plasma actuators. J. Phys. D Appl. Phys. 2021, 54, 245204. [Google Scholar] [CrossRef]
- Wang, Z.; Hu, X.; Mao, J.; Lan, W.; Hui, Z.; Li, S. Study on vehicle drag reduction simulation based on Suzen–Huang model. Phys. Plasmas 2021, 28, 063512. [Google Scholar] [CrossRef]
- Omidi, J.; Mazaheri, K. Improving the performance of a numerical model to simulate the EHD interaction effect induced by dielectric barrier discharge. Int. J. Heat Fluid Flow 2017, 67, 79–94. [Google Scholar] [CrossRef]
- Wilke, J.B. Aerodynamische Strömungssteuerung mittels dielektrischer Barriereentladungs-Plasmaaktuatoren: 22 Tabellen. Ph.D. Thesis, DLR, Institute of Aerodynamics and Flow Technology, Göttingen, Germany, 2009. [Google Scholar]
- Albrecht, T.; Weier, T.; Gerbeth, G.; Metzkes, H.; Stiller, J. A method to estimate the planar, instantaneous body force distribution from velocity field measurements. Phys. Fluids 2011, 23, 021702. [Google Scholar] [CrossRef]
- Maden, I.; Maduta, R.; Kriegseis, J.; Jakirlić, S.; Schwarz, C.; Grundmann, S.; Tropea, C. Experimental and computational study of the flow induced by a plasma actuator. Int. J. Heat Fluid Flow 2013, 41, 80–89. [Google Scholar] [CrossRef]
- Bernal-Orozco, R.; Arias-Montano, A.; Huerta-Chávez, O. Separated-Flow Control Simulation with a Periodic Excitation by SDBD Plasma Actuator at Re = O(205). J. Aerosp. Eng. 2020, 33, 05020003. [Google Scholar] [CrossRef]
- Hofkens, A. Determination of the body force generated by a plasma actuator through numerical optimization. Ph.D. Thesis, Delft University of Technology, Delft, The Netherlands, 2016. [Google Scholar]
- Celik, I.B.; Ghia, U.; Roache, P.J.; Freitas, C.J. Procedure for estimation and reporting of uncertainty due to discretization in CFD applications. J. Fluids Eng. Trans. ASME 2008, 130, 078001. [Google Scholar] [CrossRef] [Green Version]
- Thomas, F.O.; Corke, T.C.; Iqbal, M.; Kozlov, A.; Schatzman, D. Optimization of dielectric barrier discharge plasma actuators for active aerodynamic flow control. AIAA J. 2009, 47, 2169. [Google Scholar] [CrossRef] [Green Version]
- Corke, T.C.; Post, M.L.; Orlov, D.M. Single dielectric barrier discharge plasma enhanced aerodynamics: Physics, modeling and applications. Exp. Fluids 2009, 46, 1–26. [Google Scholar] [CrossRef]
- Chen, D.; Asada, K.; Sekimoto, S.; Fujii, K.; Nishida, H. A high-fidelity body-force modeling approach for plasma-based flow control simulations. Phys. Fluids 2021, 33, 037115. [Google Scholar] [CrossRef]


| Coefficient | |||||||
|---|---|---|---|---|---|---|---|
| Value | 55 | 8 | 10 | 34 | 2.7 | 0.7 | 80 |
| Coefficient | Case 1 | Case 2 |
|---|---|---|
| 450 | 180 | |
| 8 | 8 | |
| 10 | 10 | |
| 85 | 85 | |
| 2.7 | 2.7 | |
| 0.7 | 0.7 | |
| 2500 | 2500 |
| Mesh | Cells | h [m] | [m/s] | [N/m] | |
|---|---|---|---|---|---|
| 1 Fine | 9934 | 6.67 × 10⁻⁶ | 0.00453083 | 1.5789 | 0.004449 |
| 2 Medium | 5616 | 1.0 × 10⁻⁵ | 0.00331336 | 1.5662 | 0.004441 |
| 3 Coarse | 2164 | 1.5 × 10⁻⁵ | 0.0171494 | 1.4738 | 0.004264 |
| Convergence | p | [%] | [%] | [%] | ||||
|---|---|---|---|---|---|---|---|---|
| 1.4993 | 1.5 | Monotonic | 4.88 | 1.5810 | 0.8058 | 0.1290 | 0.1614 | |
| 1.4993 | 1.5 | Monotonic | 7.69 | 0.0044 | 0.1758 | 0.0082 | 0.0102 |
| Parameters | Case 1 | Case 2 | Case 3 |
|---|---|---|---|
| Voltage 1 | 8 kV to 16 kV | 14 kV to 19.5 kV | 16 kV to 52 kV |
| Frequency | 2 kHz | 2 kHz | 1 kHz |
| 10 mm | 15 mm | 10 mm | |
| 10 mm | 25 mm | 20 mm | |
| 60 m | 50 m | 100 m | |
| 60 m | 50 m | 100 m | |
| 110 m | 330 m | 2 mm | |
| 0 | 0 | 0 | |
| 3.4 | 3.4 | 3.0 | |
| Reference | Kotsonis et al. [46] | Tang et al. [47] | Forte et al. [45] |
Disclaimer/Publisher’s Note: The statements, opinions and data contained in all publications are solely those of the individual author(s) and contributor(s) and not of MDPI and/or the editor(s). MDPI and/or the editor(s) disclaim responsibility for any injury to people or property resulting from any ideas, methods, instructions or products referred to in the content. |
© 2023 by the authors. Licensee MDPI, Basel, Switzerland. This article is an open access article distributed under the terms and conditions of the Creative Commons Attribution (CC BY) license (https://creativecommons.org/licenses/by/4.0/).
Share and Cite
Bernal-Orozco, R.A.; Carvajal-Mariscal, I.; Huerta-Chavez, O.M. Performance of DBD Actuator Models under Various Operating Parameters and Modifications to Improve Them. Fluids 2023, 8, 112. https://doi.org/10.3390/fluids8040112
Bernal-Orozco RA, Carvajal-Mariscal I, Huerta-Chavez OM. Performance of DBD Actuator Models under Various Operating Parameters and Modifications to Improve Them. Fluids. 2023; 8(4):112. https://doi.org/10.3390/fluids8040112
Chicago/Turabian StyleBernal-Orozco, Raul Alberto, Ignacio Carvajal-Mariscal, and Oliver Marcel Huerta-Chavez. 2023. "Performance of DBD Actuator Models under Various Operating Parameters and Modifications to Improve Them" Fluids 8, no. 4: 112. https://doi.org/10.3390/fluids8040112