Article

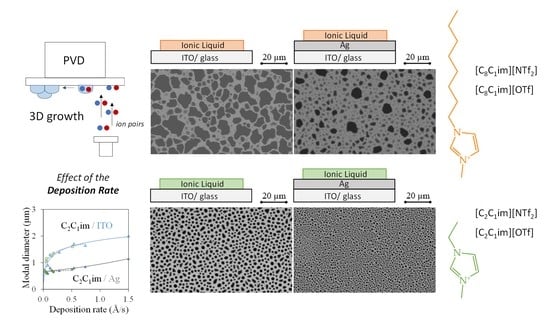
Influence of the Deposition Rate and Substrate Temperature on the Morphology of Thermally Evaporated Ionic Liquids

by
Rita M. Carvalho
1,
Cândida Neto
2,
Luís M. N. B. F. Santos
1,
Margarida Bastos
1 and
José C. S. Costa
1,*
1
CIQUP, Institute of Molecular Sciences (IMS), Department of Chemistry and Biochemistry, Faculty of Science, University of Porto, Rua do Campo Alegre s/n, P4169-007 Porto, Portugal
2
Faculty of Science, University of Porto, Rua do Campo Alegre s/n, P4169-007 Porto, Portugal
*
Author to whom correspondence should be addressed.
Fluids 2023, 8(3), 105; https://doi.org/10.3390/fluids8030105
Submission received: 26 February 2023 / Revised: 19 March 2023 / Accepted: 20 March 2023 / Published: 22 March 2023
(This article belongs to the Special Issue Contact Line Dynamics and Droplet Spreading)

Abstract

:
The wetting behavior of ionic liquids (ILs) on the mesoscopic scale considerably impacts a wide range of scientific fields and technologies. Particularly under vacuum conditions, these materials exhibit unique characteristics. This work explores the effect of the deposition rate and substrate temperature on the nucleation, droplet formation, and droplet spreading of ILs films obtained by thermal evaporation. Four ILs were studied, encompassing an alkylimidazolium cation (CnC1im) and either bis(trifluoromethylsulfonyl)imide (NTf2) or the triflate (OTf) as the anion. Each IL sample was simultaneously deposited on surfaces of indium tin oxide (ITO) and silver (Ag). The mass flow rate was reproducibly controlled using a Knudsen cell as an evaporation source, and the film morphology (micro- and nanodroplets) was evaluated by scanning electron microscopy (SEM). The wettability of the substrates by the ILs was notably affected by changes in mass flow rate and substrate temperature. Specifically, the results indicated that an increase in the deposition rate and/or substrate temperature intensified the droplet coalescence of [C2C1im][NTf2] and [C2C1im][OTf] on ITO surfaces. Conversely, a smaller impact was observed on the Ag surface due to the strong adhesion between the ILs and the metallic film. Furthermore, modifying the deposition parameters resulted in a noticeable differentiation in the droplet morphology obtained for [C8C1im][NTf2] and [C8C1im][OTf]. Nevertheless, droplets from long-chain ILs deposited on ITO surfaces showed intensified coalescence, regardless of the deposition rate or substrate temperature.

Graphical Abstract

1. Introduction

Ionic liquids (ILs) are a family of materials typically formed by a large organic cation and an organic/inorganic anion. Most of the studied ILs are liquids at room temperature (RTILs) [1,2,3,4,5,6]. Their low melting points derive from the asymmetry of the cation-anion pairs and the dispersion of charges, which altogether have an impact on the supramolecular structure, stabilizing the ionic liquid (IL), mainly by entropic factors [5,6,7,8,9]. ILs have received special attention because of their applications in different areas, such as electrochemistry (in the electrodeposition of metals), as gas sensors and biosensors, as additives (lubricants and detergents), or as “designer solvents” [4,10,11,12,13,14,15]. In some of these applications, the ILs have to interact with solid surfaces. Hence, it is important to study the behavior of the IL at interfaces in order to design better applications based on solid grounds [9,12,16,17,18,19]. ILs can be divided into different groups based on the identity of the cation and the anion: alkylammonium, dialkylimidazolium, phosphonium, and N-alkylpyridinium-based ILs are widely used as cations. Tetrafluoroborate (BF4), hexafluorophosphate (PF6), bis-trifluoromethanesulfonimide (NTf2), and trifluoromethanesulfonate (OTf) are some typical ILs’ anions. The conjugation of different cation-anion pairs creates ILs with different physicochemical properties. Nevertheless, most ILs share some common traits such as high viscosity, ionic conductivity, very low vapor pressure, high thermal and chemical stability, and an unusual wetting behavior [1,2,3,11,12,14,15,20,21,22,23,24,25]. Structurally, ILs have a network made of polar (where the electrostatic energy is concentrated) and non-polar (leading to nanostructuration at a molecular level) domains. Both polar and non-polar domains influence the bulk and surface properties of the ILs. The main interactions between the cation and anion are electrostatic, together with other weaker intermolecular interactions such as hydrogen bonds or van der Waals forces [1,2,4,11,26,27,28,29]. The segregation of the cation in distinct domains is highly dependent on the alkyl side chain length: for shorter alkyl chains, the non-polar domains are less relevant to the structural organization, whereas for larger alkyl chains, both domains have a significant impact on the structural organization of the ILs [1,2,3,9,23,30,31,32,33].
This work characterizes the production of ILs’ micro- and nanodroplets (precursor of thin films of ILs) by vacuum thermal evaporation—one of the physical vapor deposition (PVD) methods [9,34,35,36,37]. The thin IL films are the result of the deposition of multiple monolayers (ML), and their morphology is highly dependent on the nanostructuration of the ILs, the methodology used to deposit the material, and the substrate characteristics [9,35,38,39]. The process of formation of IL films by PVD methods starts with the arrival of the ion pairs at the surface, with specific kinetic energy and subsequent adsorption in energetically stable places, creating clusters. This first step is called nucleation and is strongly influenced by the minimum free area of nucleation (MFAN), which in turn is dependent on the interactions between the IL and the substrate [9,35,40,41,42,43]. The higher the substrate-IL affinity, the lower MFAN. The progress of deposition leads to an increase in the number of clusters/nanodroplets formed, which tend to merge into larger droplets. These coalescence processes can occur in two ways (details are presented in the scheme of Figure S1 as Supplementary Material, SM): the coalescence of native clusters (first order of coalescence) or the coalescence of clusters previously coalesced (second order of coalescence). The processes of nucleation and growth are influenced by the wettability of the substrate to the ILs. Spherical IL droplets are formed when surfaces solvophobic to the ILs are used [9,34,35,40,41,42,43]. The shape of the droplets can be analyzed to evaluate the affinity of the ILs to a solid surface and, consequently, the wetting behavior of the film. In a macroscopic and ideal scenario (an inert and smooth substrate), Young’s equation can be used to evaluate the contact angle, which is correlated with the different interfacial tensions of the system, according to Equation (1):
cos ( θ c ) = γ ( s - v ) γ ( s - l ) γ ( l - v )
where θ c is the contact angle, γ ( s - v ) is the solid-vapor interfacial tension, γ ( s - l ) is the solid-liquid interfacial tension, and γ ( l - v ) is the liquid-vapor interfacial tension. This contact angle evaluation must be carried out with some care for nanoscale droplets. We are far from the ideal situation because of the surface roughness of the substrates, which affects the surface energy and, consequently, the wetting behavior of ILs at the nanoscale [9,34,35,44,45,46,47,48,49,50]. The morphological characterization of IL droplets and a prediction of their contact angles can be experimentally performed by high-precision techniques such as scanning electron microscopy (SEM) and atomic force microscopy (AFM) [9,34,35,36,37,43,46]. Microdroplets of ILs with contact angles between 15 and 20 degrees have been reported [9]. The influence of different substrates in the nucleation and growth of different ILs has been studied by different groups. The adsorption and molecular arrangement of the first ML of ILs on metal surfaces were proven to be very dependent on the chemical structure of the IL, the interfacial tension IL-substrate, and the surface roughness [39,51,52,53,54]. Adventitious carbon contamination in the surfaces might also play a relevant role in the nucleation process [48,55,56,57]. Some studies on the mesoscopic scale report IL droplet formation on a wide range of solid substrates [35,47,54,58,59,60,61,62]. For large thicknesses, there is no particular time-dependent growth behavior of IL films after their deposition [9,46,63]. On the other hand, some post-deposition treatments can change the film morphology. For instance, the droplet coalescence is induced by external interferences, such as plasma surface treatments [34,36,43,64,65].
In our recent research, we examined the droplet spreading of various classes of ILs that were thermally evaporated on different substrates using both a constant deposition rate and substrate temperature [9,46]. As such, no in-depth study has been conducted on the effects of varying deposition parameters. Therefore, in this work, we studied the influence of the deposition rate and substrate temperature on the nucleation and growth of different ILs deposited by the PVD method on two common solid surfaces: indium tin oxide (ITO) and silver (Ag). The samples analyzed were alkylimidazolium-based ILs with different cation alkyl chain lengths (C2C1im and C8C1im) and two different anions (NTf2 and OTf). The molecular structure of the cation-anion pairs ([C8C1im][NTf2], [C8C1im][OTf], [C2C1im][NTf2], and [C2C1im][OTf]) studied is presented in Figure 1. The deposition of films was performed by a customized procedure of PVD using Knudsen effusion cells as the evaporation sources [9,35,38,46]. Different mass flow rates were obtained by changing the temperature of the evaporation source and/or the orifice of the Knudsen effusion cell. Moreover, different temperatures of the substrate were employed, and for each IL, the deposition occurred simultaneously on the surfaces of ITO and Ag. For all experiments, the ILs were obtained with a constant thickness of 40 ML to investigate the morphology, shape, and droplet size distribution for the same amount of IL deposited at different experimental conditions. The morphology of the samples was analyzed by scanning electron microscopy (SEM), which provided detailed information on the shape and size of the micro- and nanodroplets formed. A tendency for 3D growth (island growth) was observed for all the examined films. For the same amount of IL, a very similar dependence of the droplet size distribution on the deposition rate was found for [C2C1im][NTf2] and [C2C1im][OTf]. Intrinsically, the droplets formed by PVD of these ILs have a lower tendency to coalesce by second order mechanisms when compared to the long-chain imidazolium-based ILs, as reported for ITO/glass surfaces in recent works [9,34,35,36,46]. However, their first order coalescence mechanisms were intensified when higher mass flow rates were used. For [C8C1im][NTf2] and [C8C1im][OTf], there was no significant effect of the deposition rate on the morphology of the droplets. Hence, even at very low mass flow rates, the second order coalescence processes of the droplets were found to be self-induced by the inherent wetting behavior of these ILs. The experimental results further showed that the substrate temperature had a less significant impact on the nucleation and growth of all studied ILs deposited on the Ag surfaces. The higher adhesion of the IL droplets on this surface avoids their aggregation, even with the increase in the substrate temperature.

2. Materials and Methods
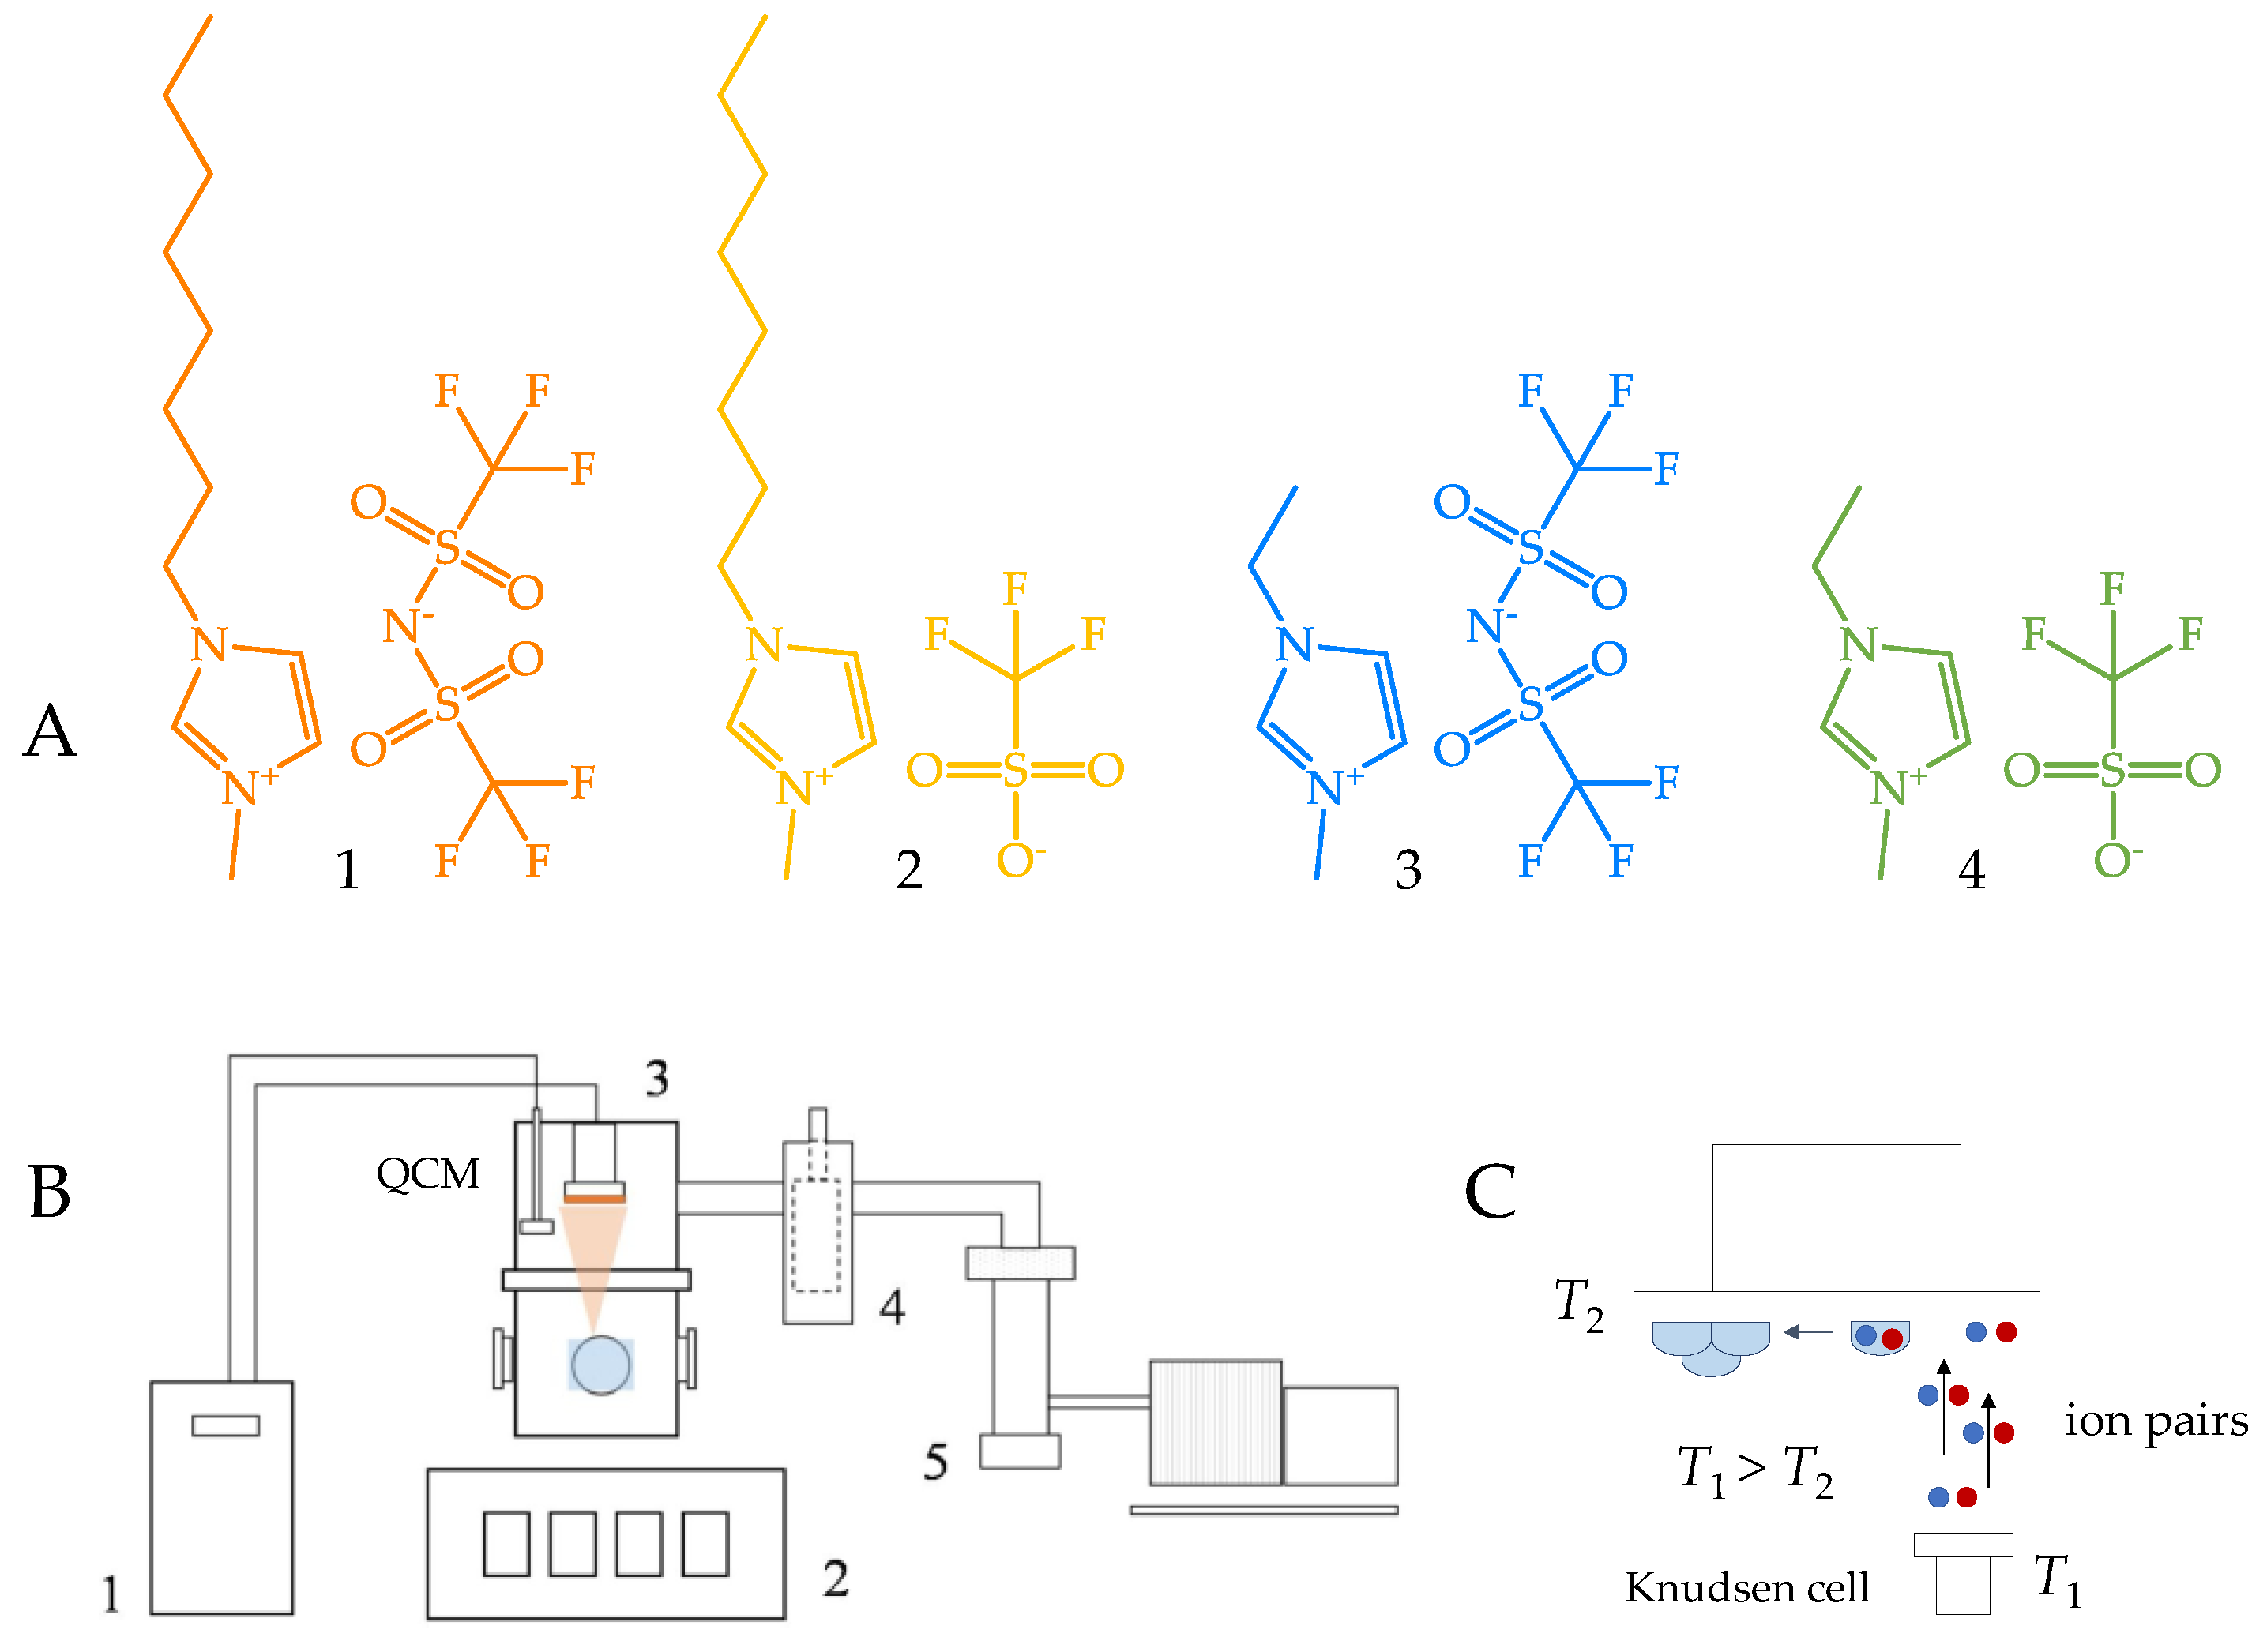
2.1. Samples

The ILs studied in this work are constituted by an alkylimidazolium cation ([CnC1im]) and by the triflate (OTf) or the bis[(trifluoromethyl)sulfonyl]imide (NTf2) anions: 1-ethyl-3-methylimidazolium bis[(trifluoromethyl)sulfonyl]imide, ([C2C1im][NTf2]); 1-octly-3-methylimidazolium bis[(trifluoromethyl)sulfonyl]imide, ([C8C1im][NTf2]); 1-ethyl-3-methylimidazolium triflate, ([C2C1im][OTf]); and 1-octly-3-methylimidazolium triflate, ([C8C1im][OTf]). The IL samples were purchased from IoLiTec with a state purity higher than 99%. Prior to the deposition of IL films, the possible volatile contaminations were removed by thermal evaporation under reduced pressure (p < 0.1 Pa) at T = 423 K.

2.2. Substrates

Each sample was deposited on surfaces of indium tin oxide (ITO)/glass and silver (Ag)/ITO/glass by using substrate supports developed in our laboratory. The ITO/glass substrates are constituted by a glass substrate (dimensions of 10 mm × 10 mm × 1.1 mm) coated with a thin film of ITO (≈180 nm of thickness). The substrates were commercialized by the Präzisions Glas & Optik GmbH supplier. Before any deposition, the substrates were cleaned by typical procedures using high-purity ethanol in an ultrasonic bath. The substrates were further dried with pure argon and stored in a desiccator. The Ag/ITO/glass surfaces were prepared by sputter deposition of Ag films on the ITO/glass substrates. A Cressington 108 Auto Sputter Coated instrument was used for sputtering the metallic film. An Ag target (purity > 99.9%) was employed, and a plasma of argon ions was used to bombard the cathode and release the Ag atoms of the target. High-purity (>99.995%) argon was used as the sputter gas, and the sputtering process was performed through a current discharge of 40 mA. The Ag films were obtained with a thickness of ≈100 nm. After the deposition of the metallic film, the substrates were handled under an inert atmosphere to minimize contaminations (e.g., carbon contamination).

2.3. Thin-Film Deposition

The evaporation process of the ILs and consequent formation of films was carried out by a customized system of PVD developed in our laboratory [35,38]. The experimental procedure consists of a vacuum thermal evaporation methodology based on the Knudsen effusion technique. Details of the deposition method are presented in Figures S2–S4 (SM). The process occurs in a low-pressure environment (p < 10−4 Pa), facilitating the evaporation of the ion pairs and subsequent condensation on the substrates. The Knudsen effusion cells (evaporation sources) allow good control of the mass flow rate effused. These cells are divided into three main parts: the cell lid, the cell body, and a disk with an orifice. The mass flow rate on the substrate surface and the film thickness are monitored by a quartz crystal microbalance (QCM, Inficon model STM-2). Equation (2) shows the relation between the mass flow rate on the substrate surface (Φsubstrate), the mass flow rate from the Knudsen cell orifice (ΦKnudsen cell), and a geometric factor (g). ΦKnudsen cell is obtained by the derivation of the Knudsen equation, where p is the equilibrium vapor pressure, ωo is the transmission probability factor, M is the molar mass of the effused vapor, T is the evaporation temperature, m is the mass of the compound, and Ao is the area of Knudsen cell orifice [9,38,43,46].
Φ substrate = g · Φ Knudsen   cell = g · p · ω o · M 2 π RT = g · m A o · t
The effusion time was monitored in each experiment, in order to obtain the intended film thickness (40 ML). To study the influence of the evaporation temperature (Tevap.) and the resulting mass flow rate in the morphology of the IL droplets and their size distribution, the ILs were evaporated at different temperature intervals: Tevap. = (473 ± 5) K; Tevap. = (503 ± 10) K; Tevap. = (533 ± 5) K. For the first study, the substrate temperature (Tsubst.) was kept constant, at Tsubst. = (283.2 ± 0.2) K. Tsubst. was controlled by regulating the temperature of a refrigerated liquid bath (Huber Minichiller). The circulating bath was used to refrigerate a copper tube where the substrate’s support system (Figure S4) is attached. For each Tevap., the mass flow rate was also changed by using two different orifice diameters in the Knudsen effusion cells: 2 or 3 mm. Additional experiments were performed by removing the disk containing the orifice, using only the cell body (diameter of 10 mm), to maximize the mass flow rate. To study the influence of Tsubst. in the nucleation and growth mechanisms of ILs (second study), each sample was evaporated under similar experimental conditions (Tevap. = (533 ± 5) K, but only with an orifice diameter of 2 mm), but three different Tsubst. were used: Tsubst. = (273.2 ± 0.2) K; Tsubst. = (283.2 ± 0.2) K; Tsubs. = (298.2 ± 0.2) K. Additional experiments were performed without thermal regulation of the substrate temperature. All details concerning the experimental setup (evaporation temperature, vapor pressure, deposition rate, and time of deposition) used for the deposition of films are presented in Tables S1 and S2 as SM. For the deposition of IL films, ITO/glass and Ag/ITO/glass substrates were rapidly introduced into the vacuum chamber that was degassed at ≈10−4 Pa. Each IL film was obtained with a thickness of 40 ML. An estimation of the height (h) of 1 ML can be performed according to Equation (3), where M is the molar mass, ρ is the density of the IL, and N A is the Avogadro’s constant. For the studied ILs, [C2C1im][NTf2], [C8C1im][NTf2], [C2C1im][OTf], and [C8C1im][OTf], 1 ML corresponds to a height of 0.75 nm, 0.84 nm, 0.68 nm, and 0.78 nm, respectively [9,36,39,43,46].
h = M ( N A × ρ ) 3

2.4. Morphological Characterization

The morphological characterization of the films was performed by a compact scanning electron microscope (SEM, Hitachi, FlexSEM 1000). With this technique, it was possible to obtain detailed micrographs of the IL microdroplets (deposited on ITO and Ag surfaces) at different magnifications (800×, 1600×, and 4000×) by using a backscattered electron detector (BSE). SEM imaging of samples deposited on ITO and Ag surfaces was obtained by employing accelerating voltages of 3 kV and 5 kV, respectively. The detector used a working distance between 6 and 9 mm. Afterwards, a deep analysis of the micrographs was made by the ImageJ software (version 1.52a) [66], in order to study the shape, surface coverage, and size distribution of the microdroplets formed.

3. Results

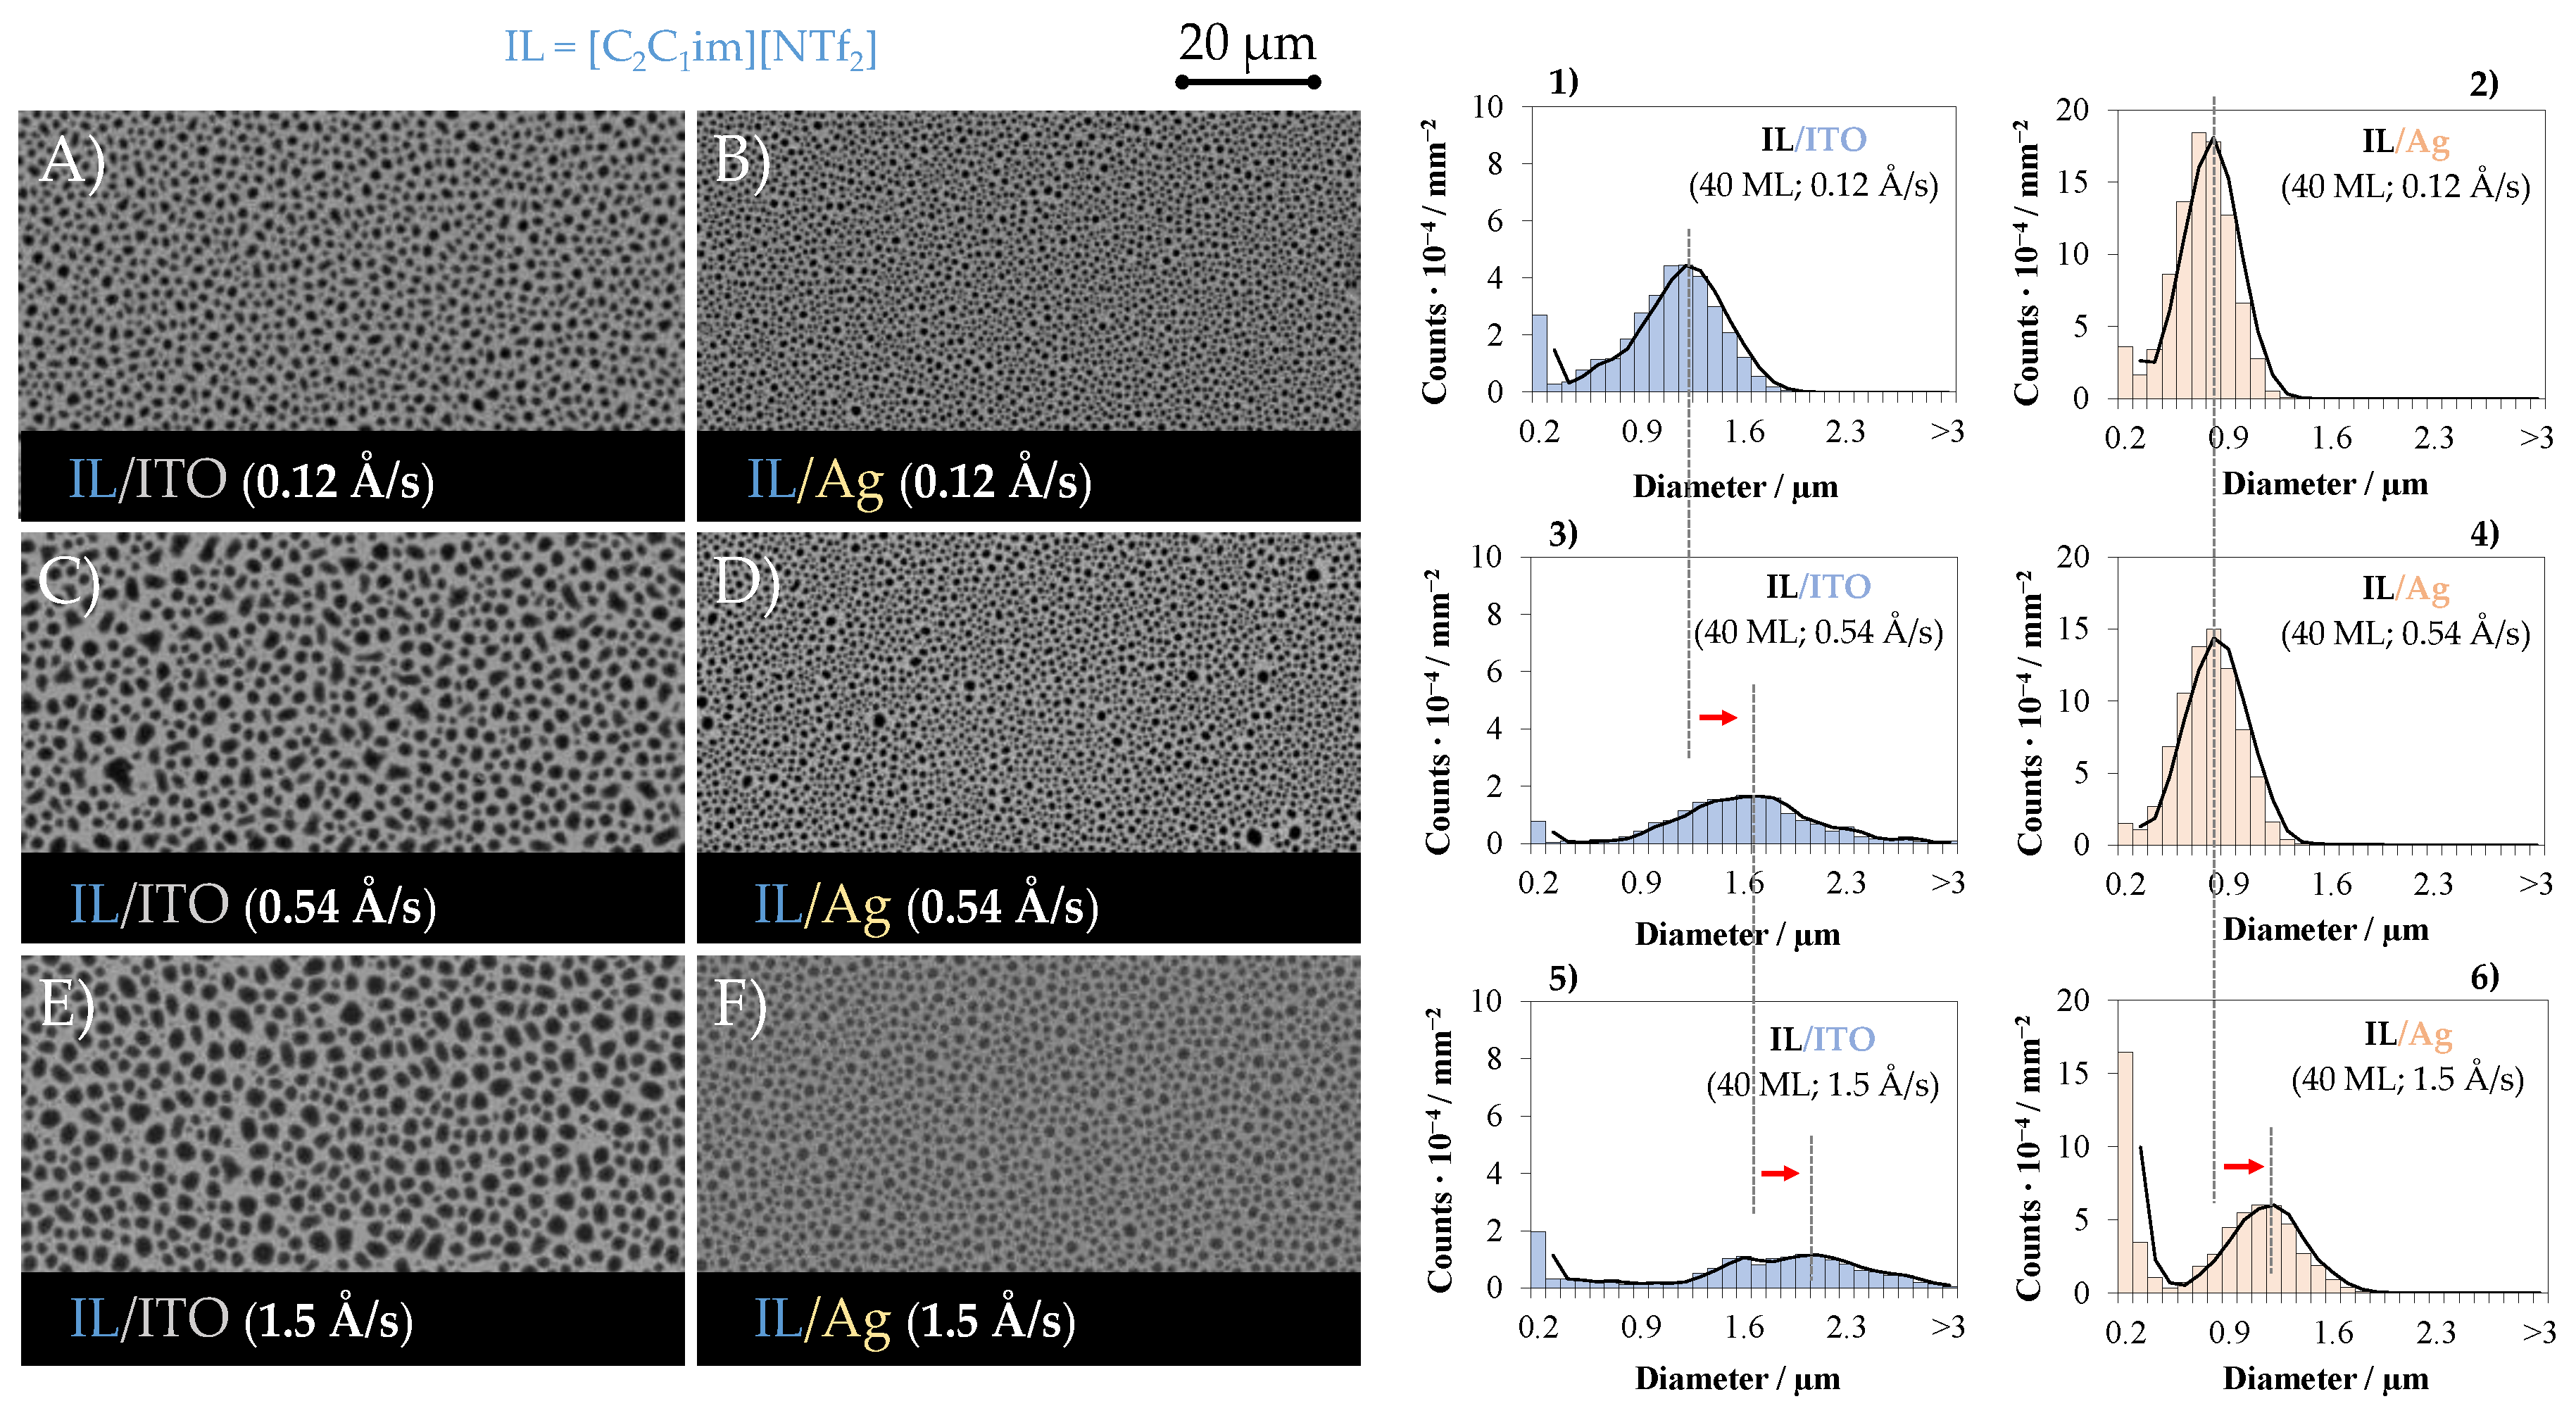
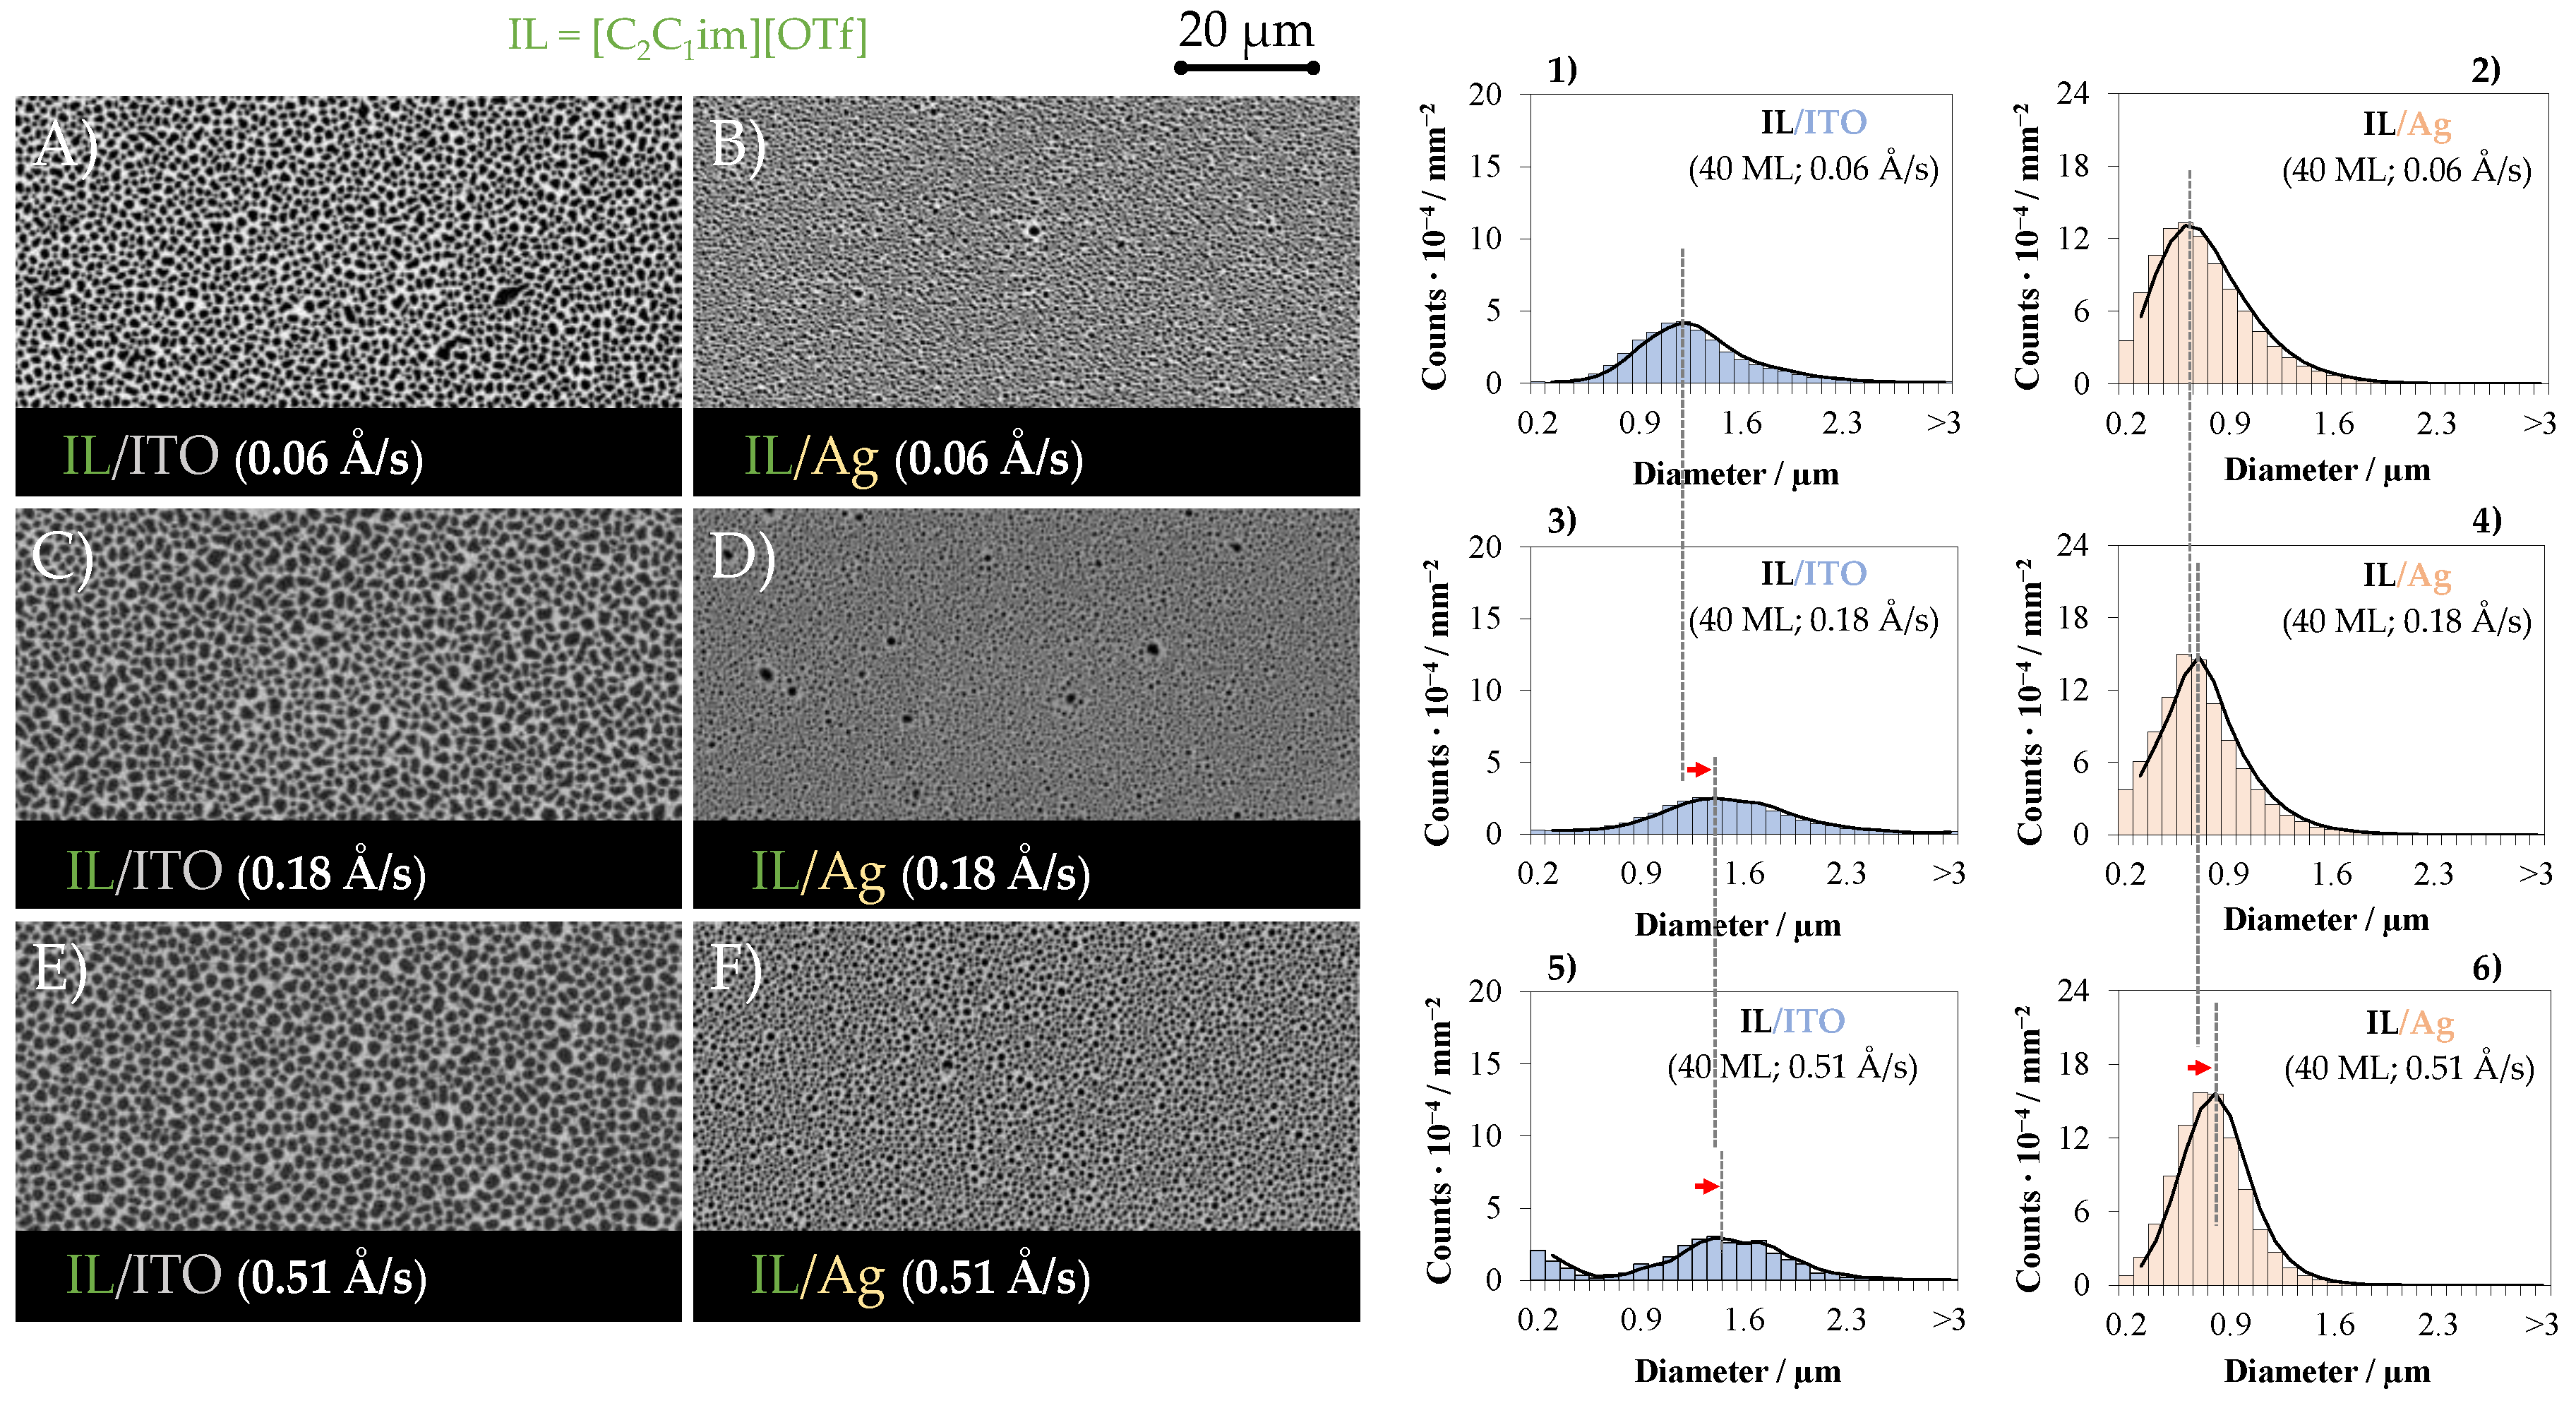
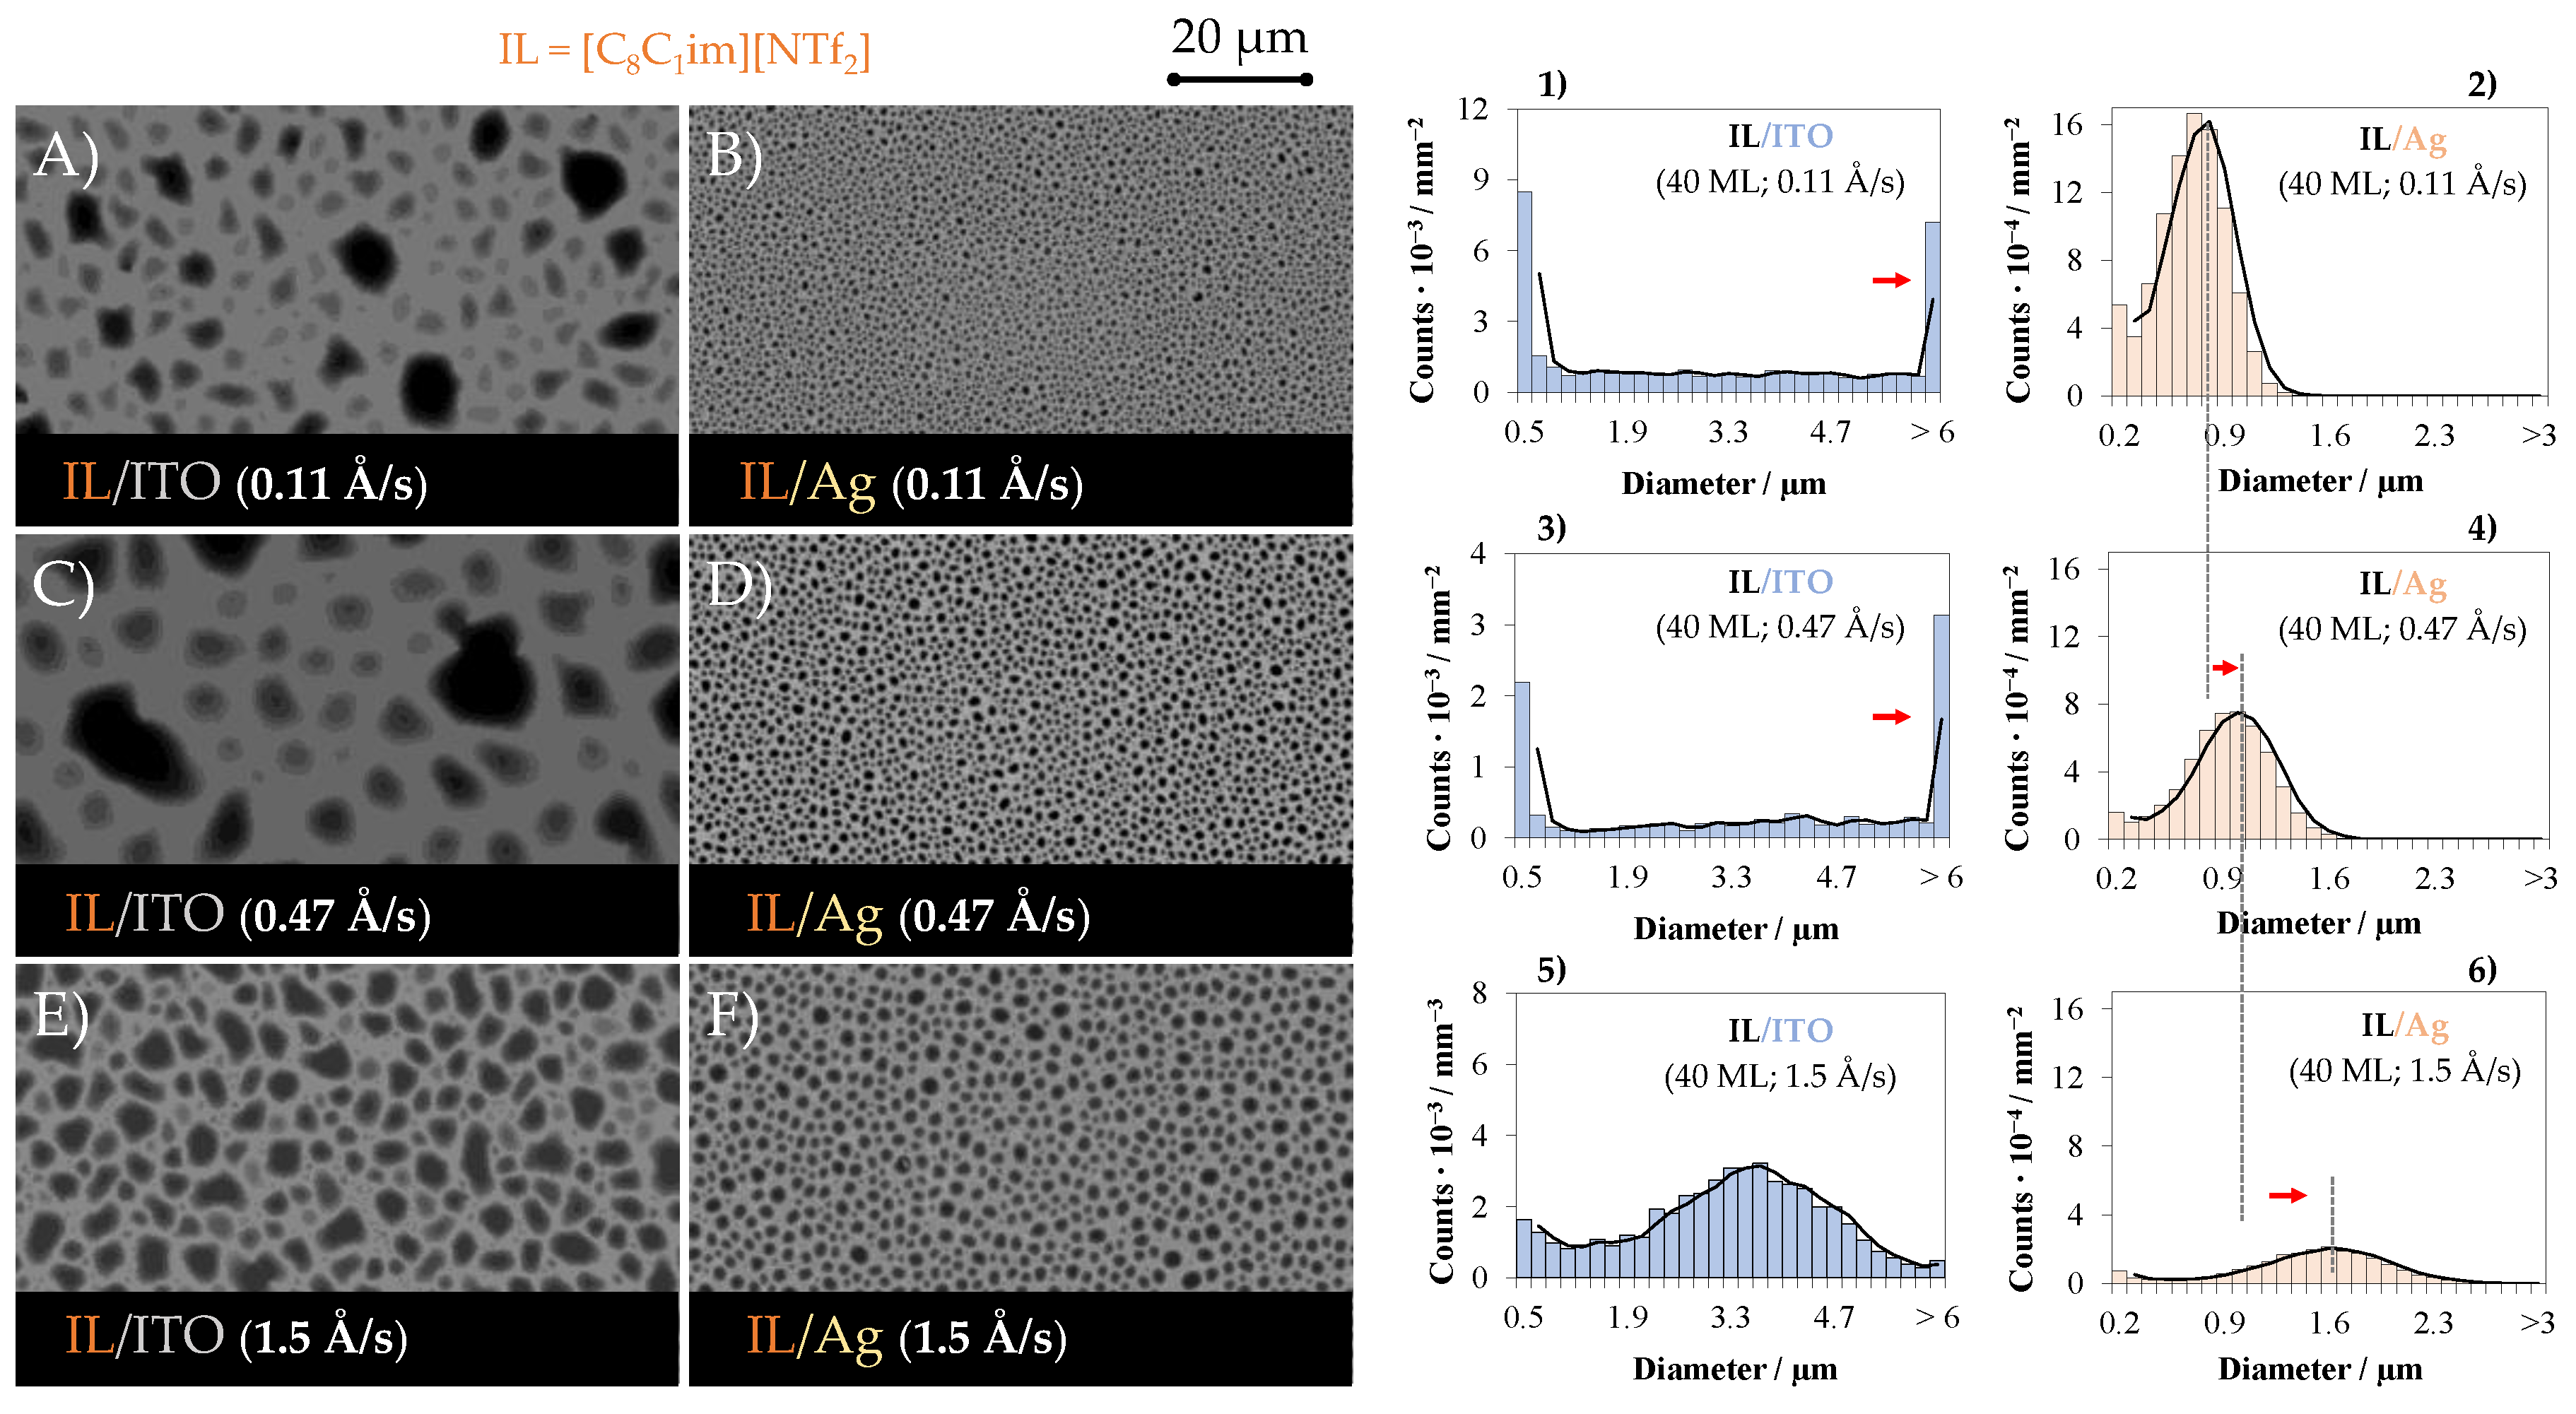
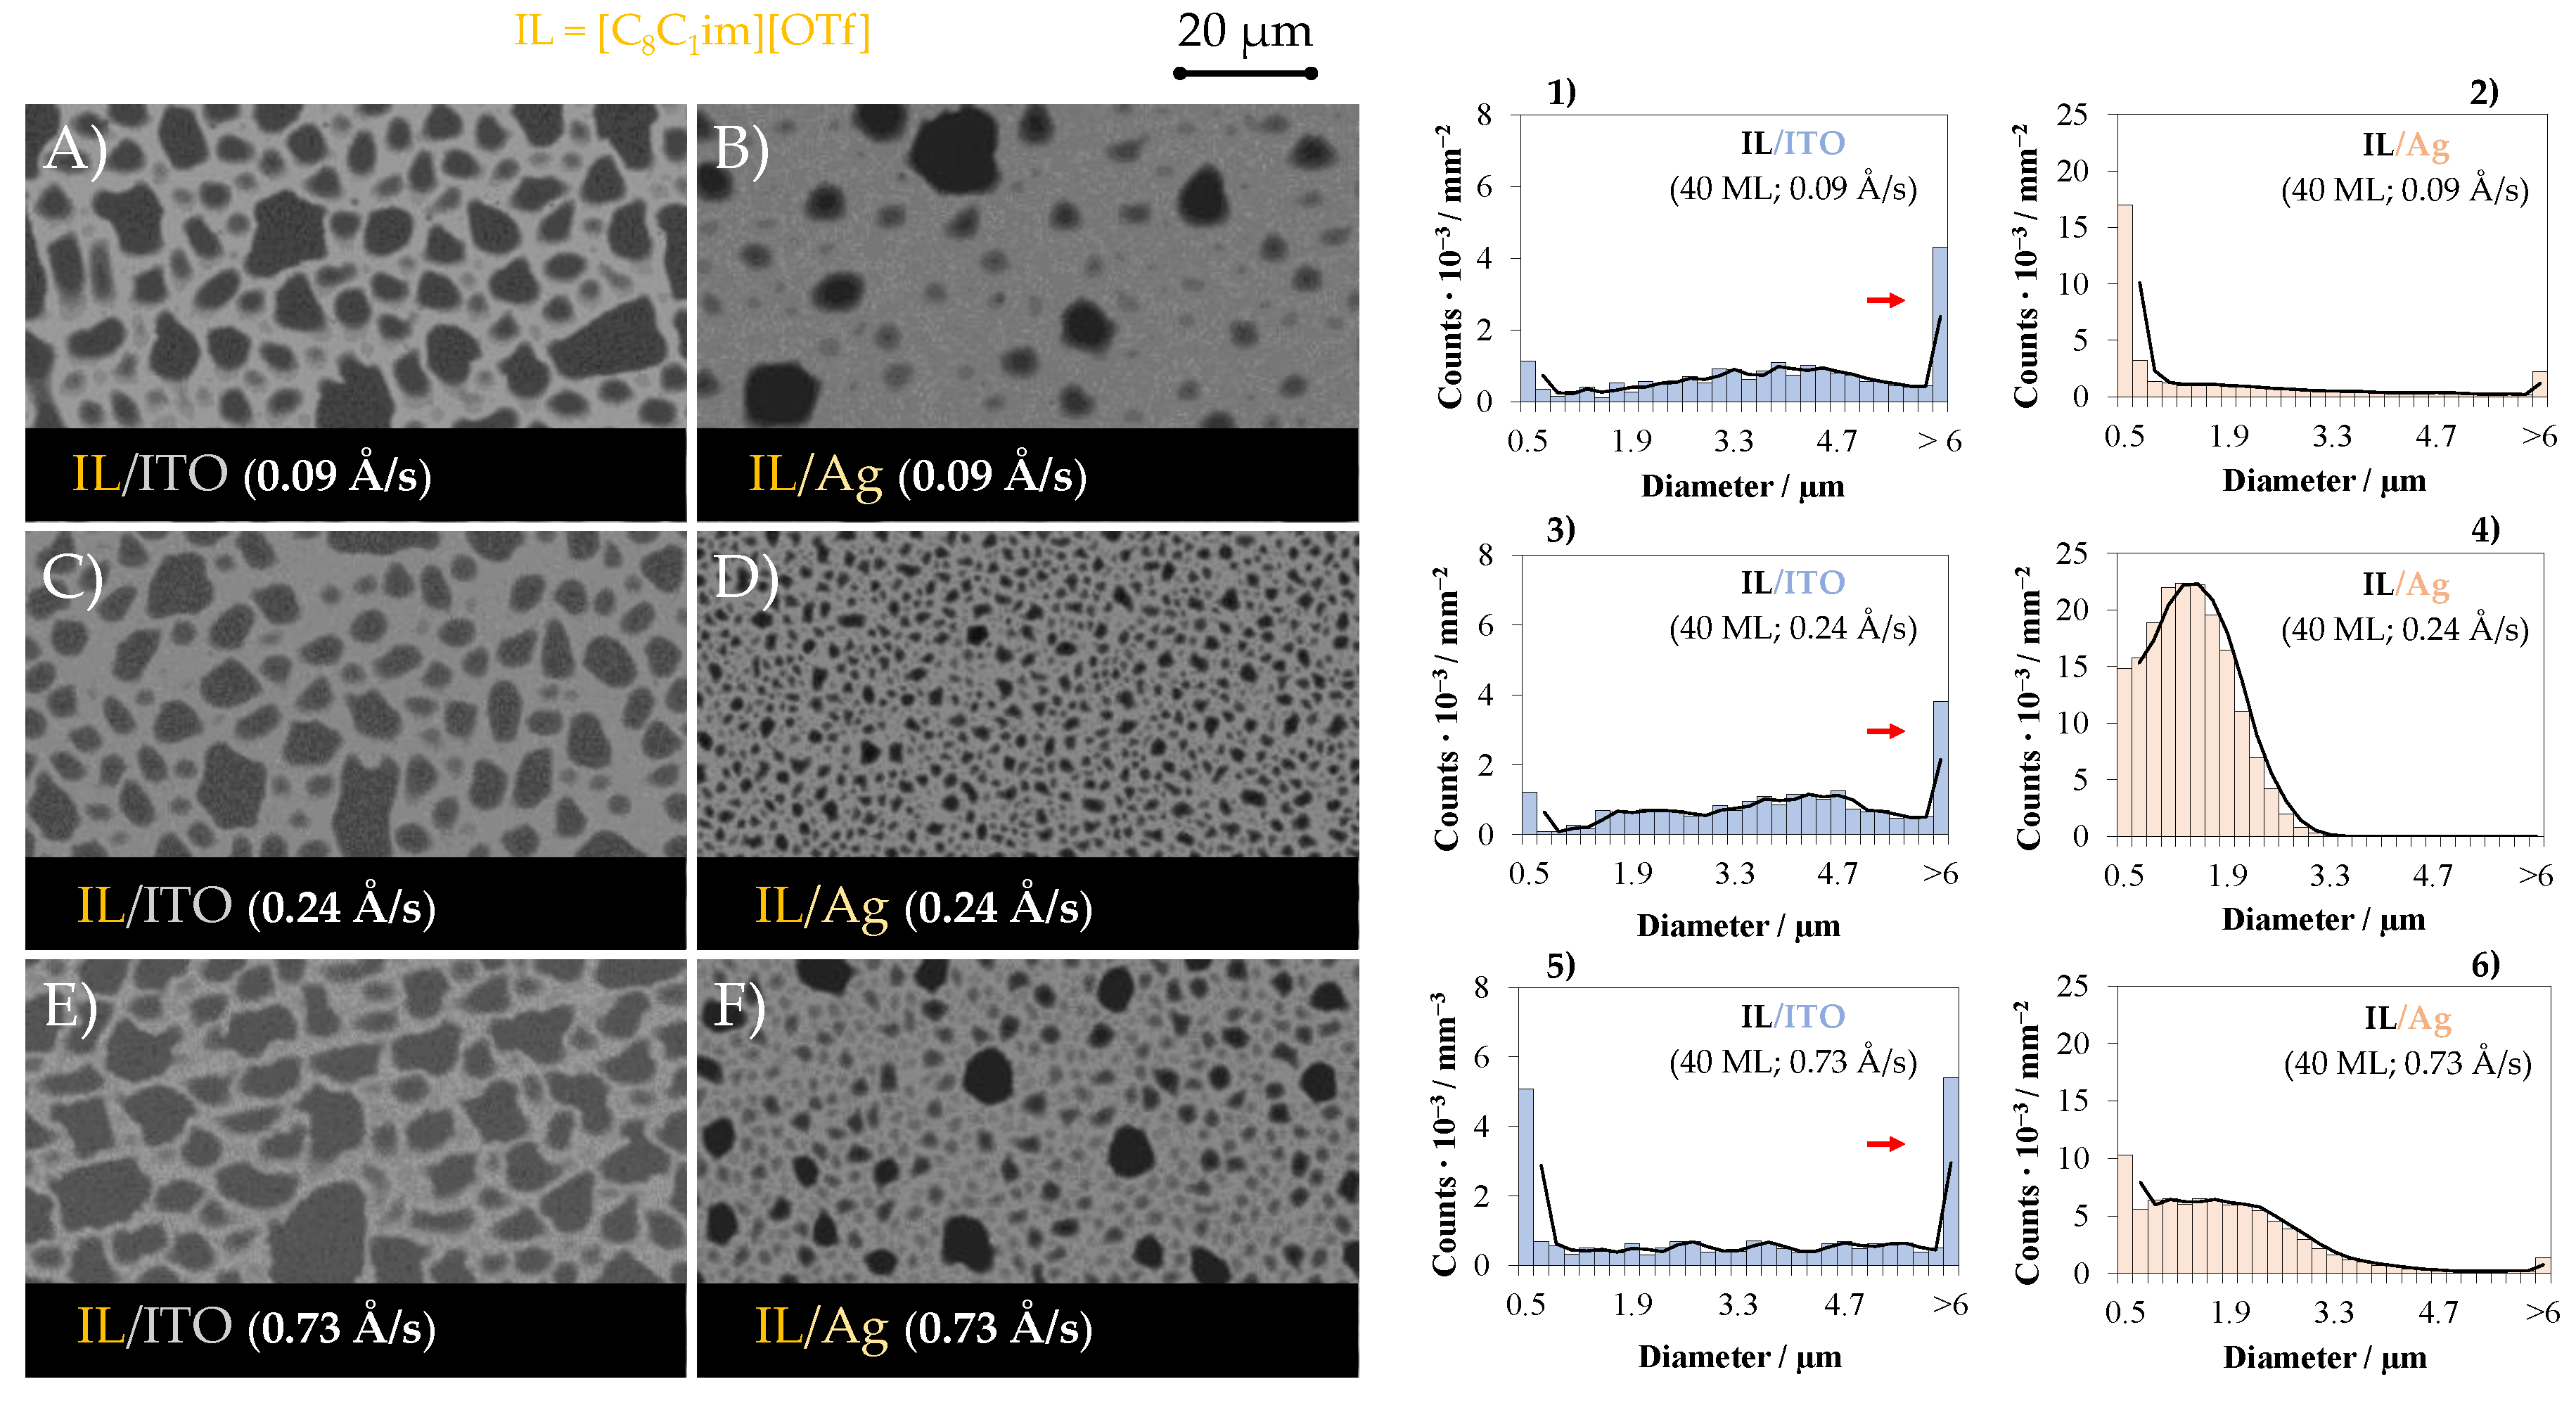
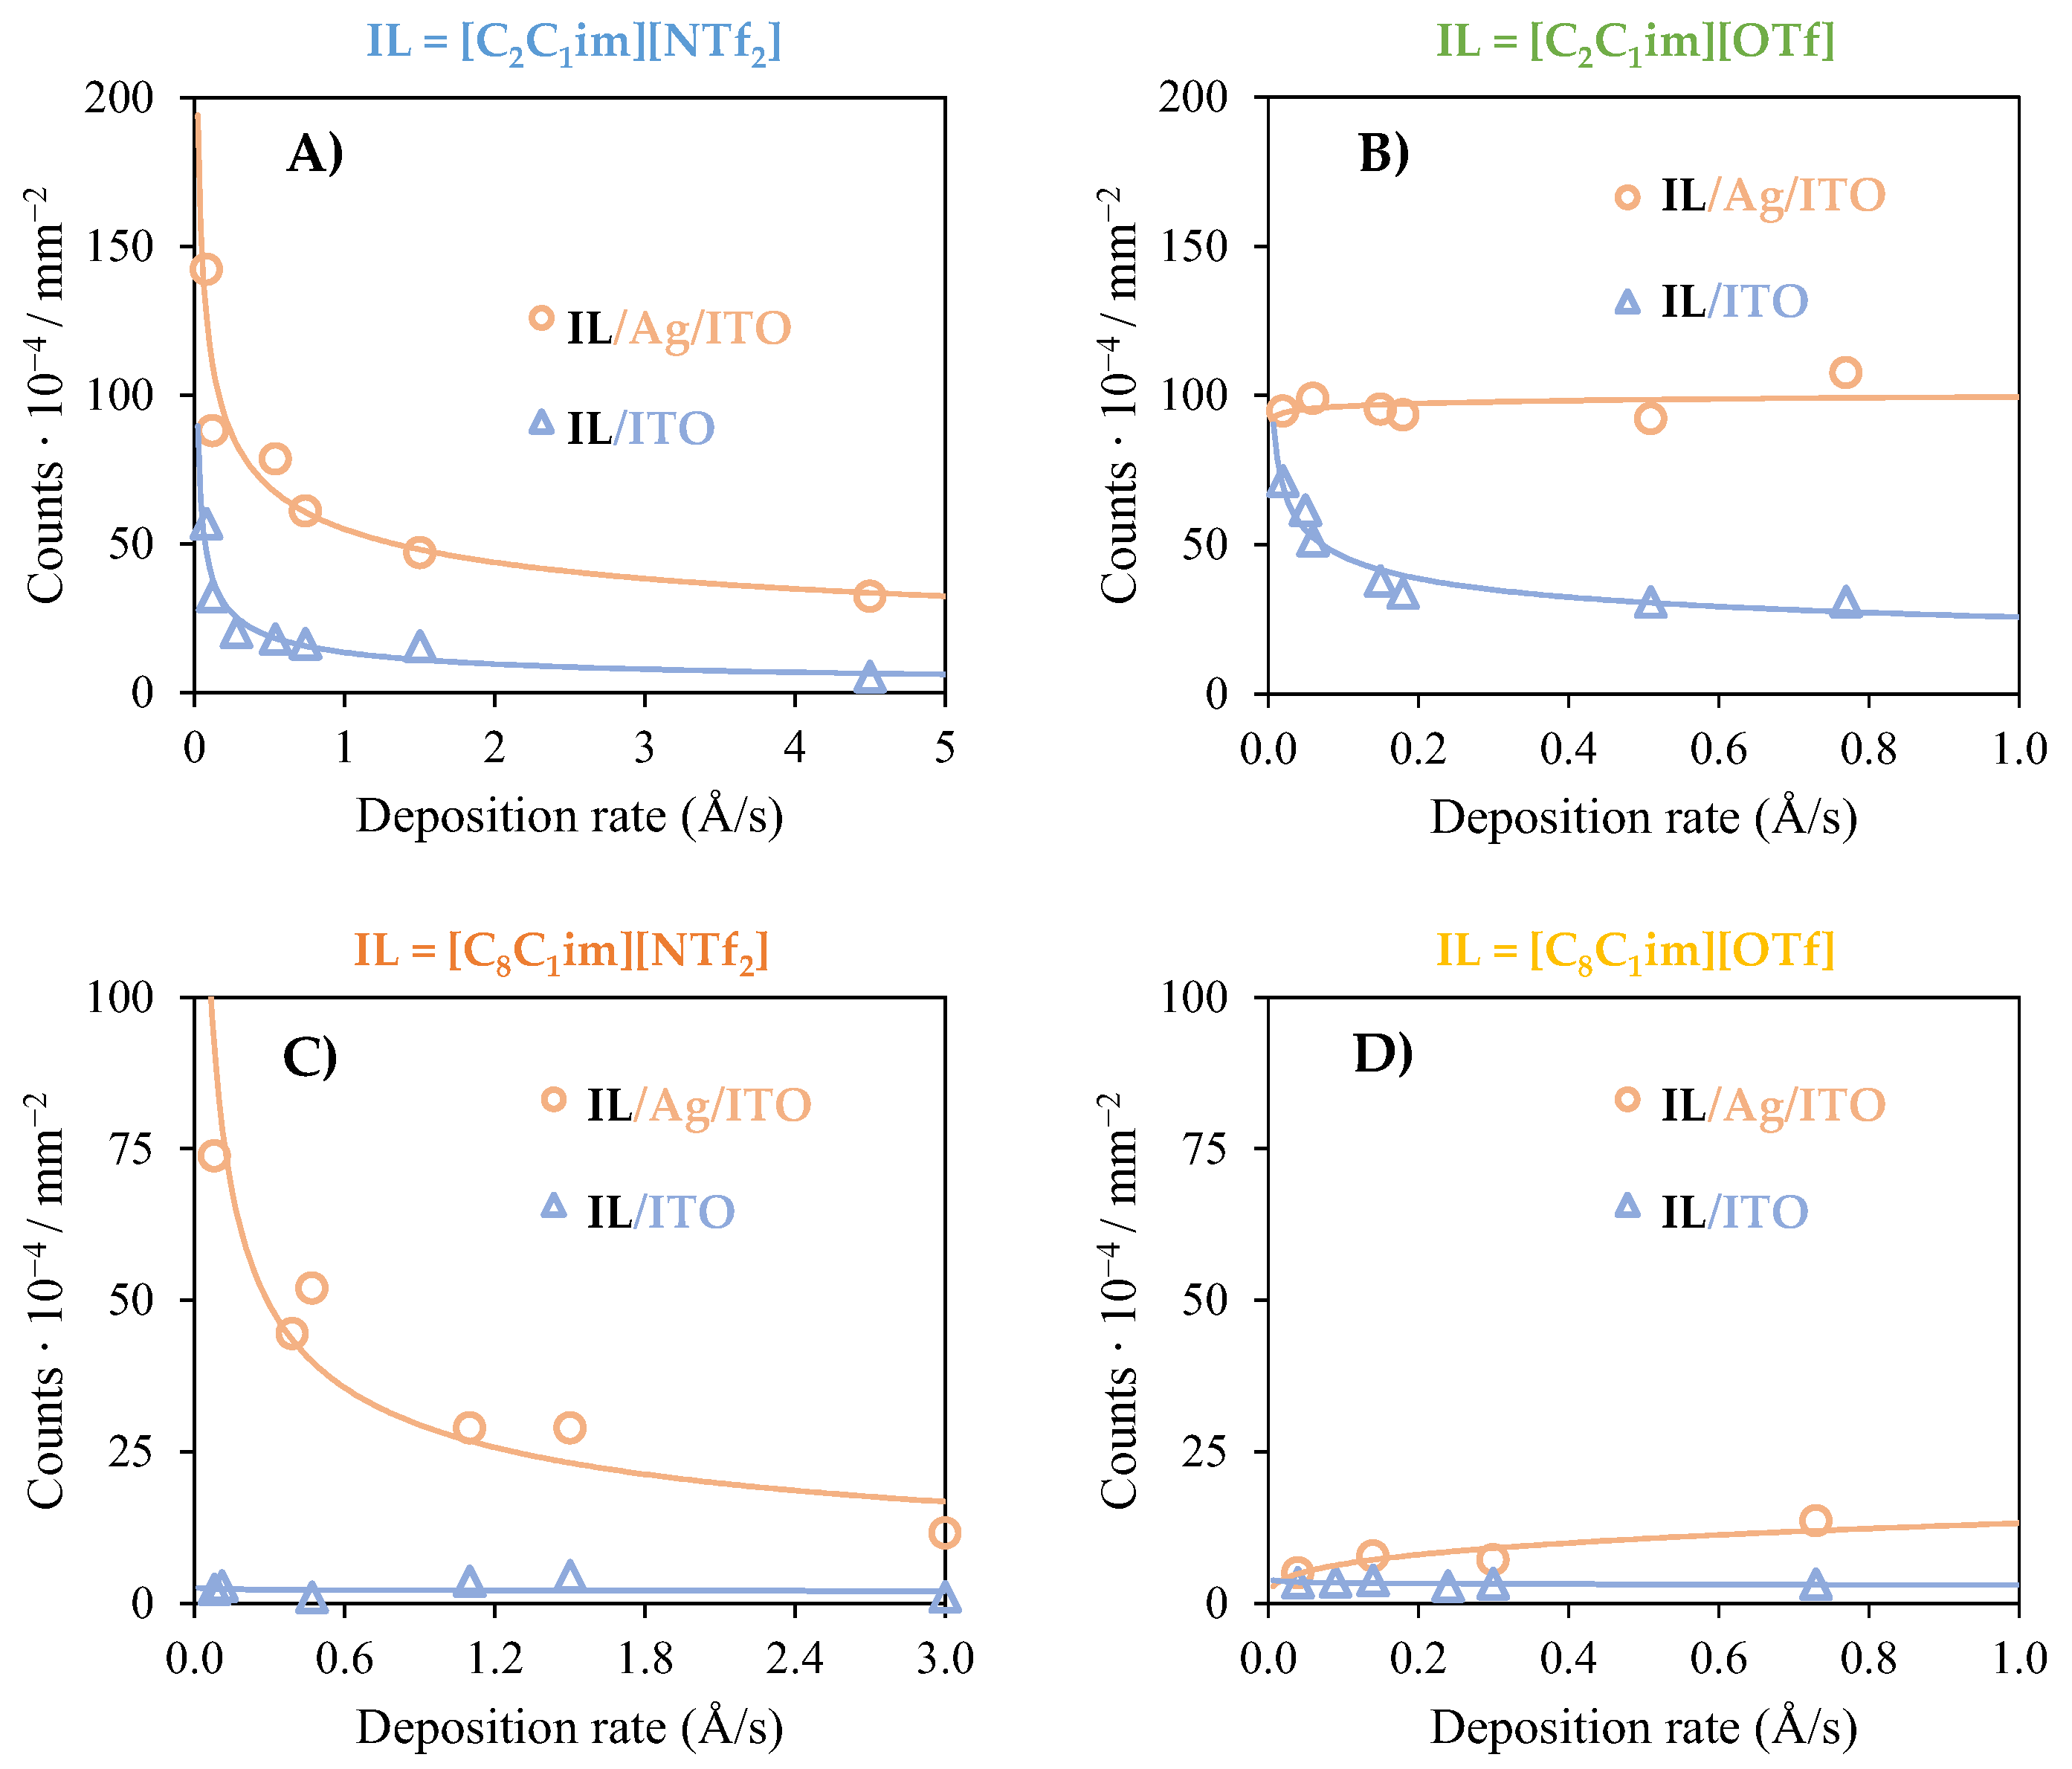
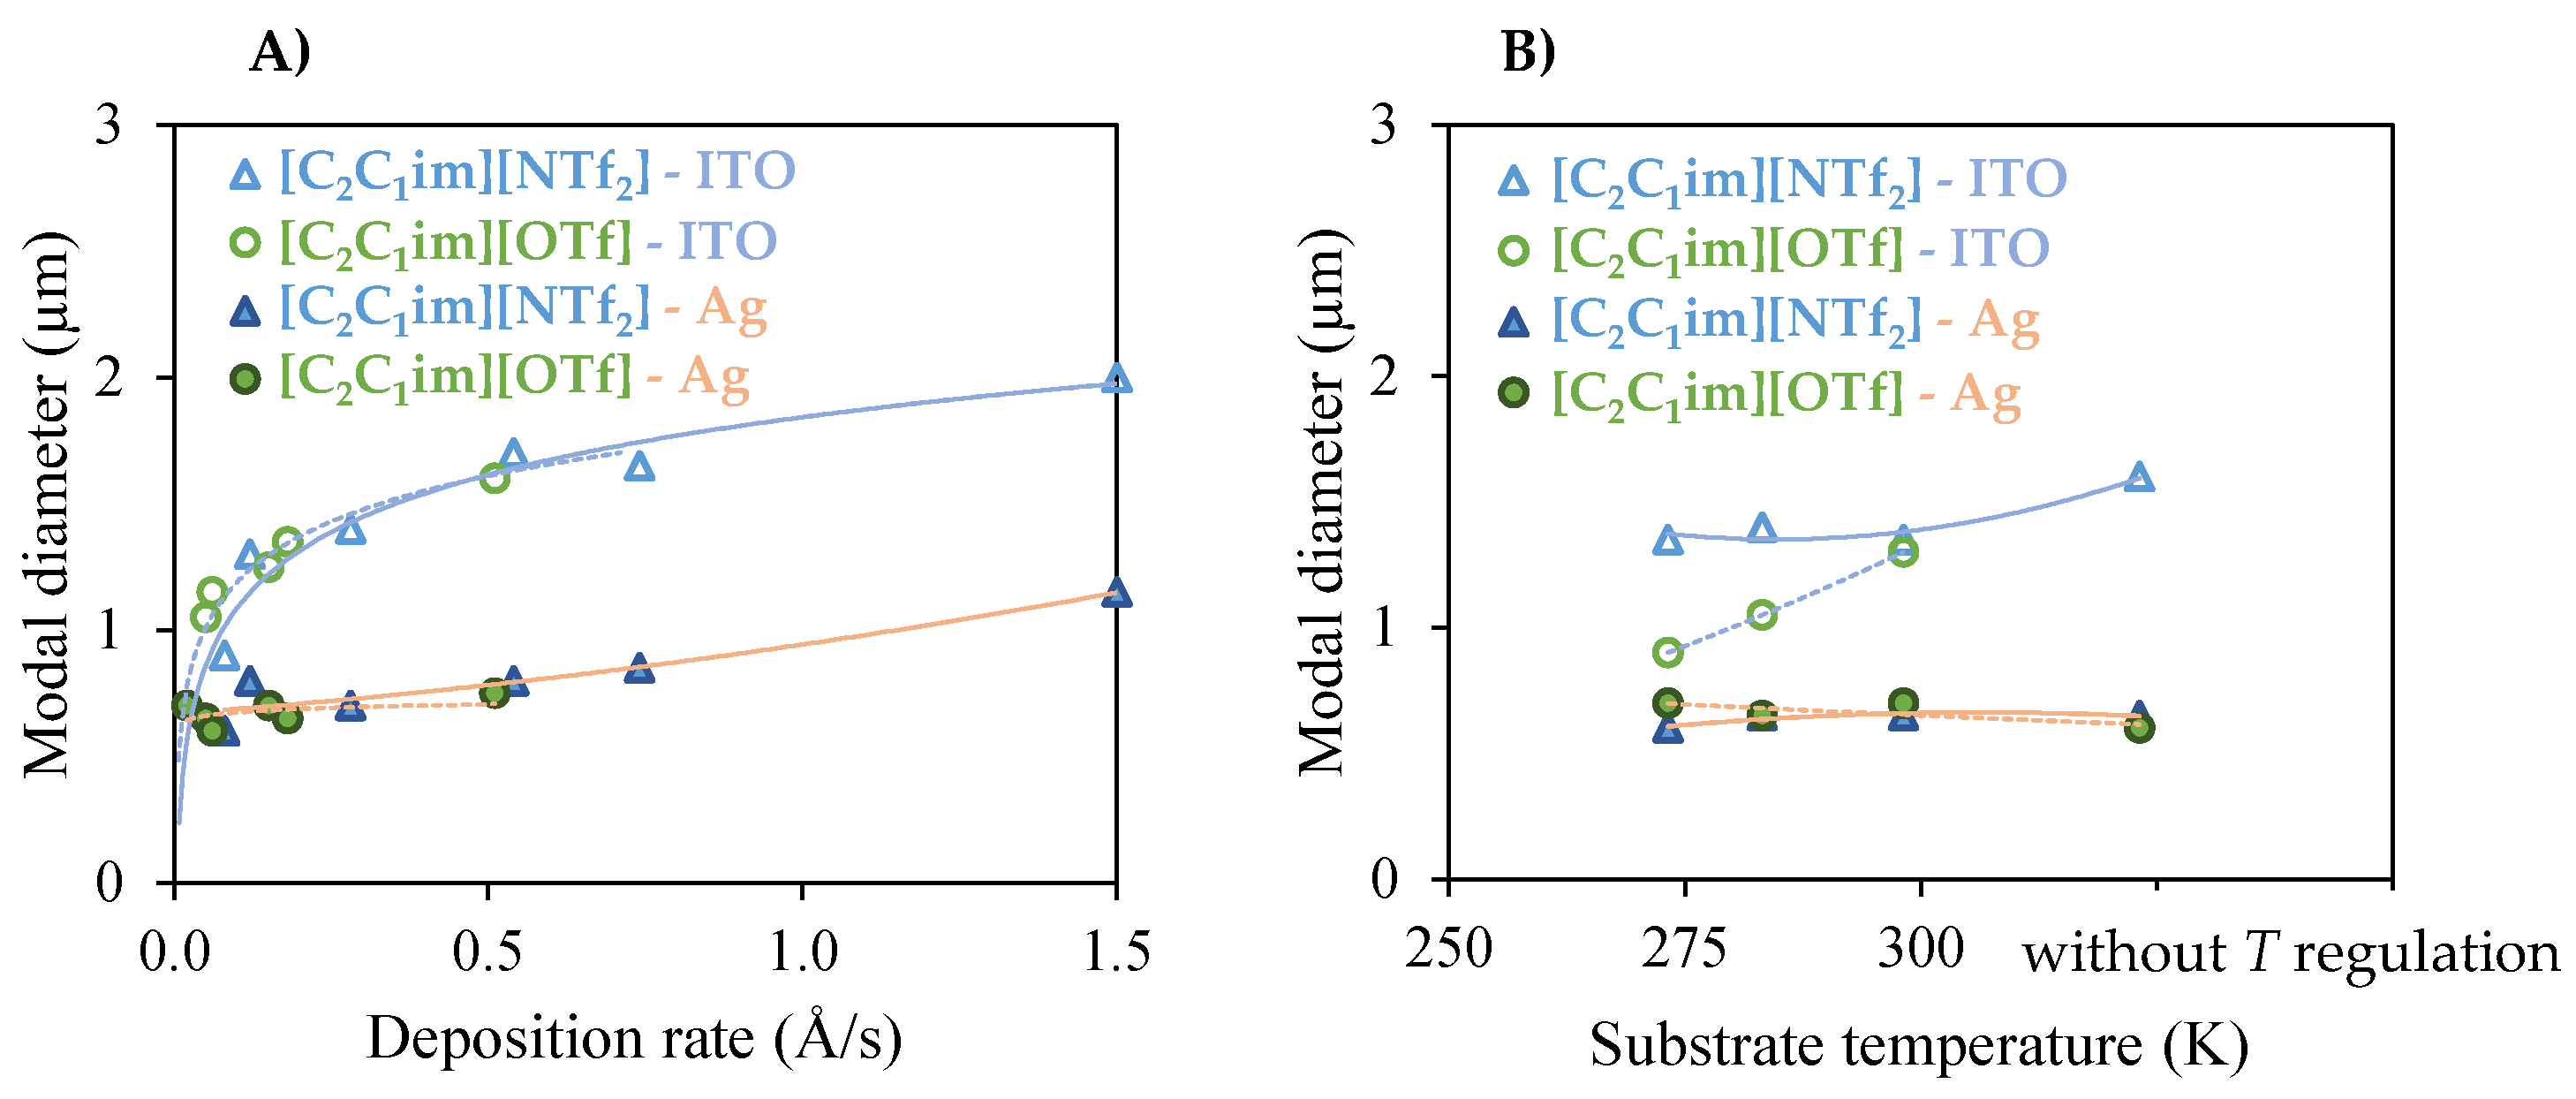
3.1. The Effect of the Mass Flow Rate on the Morphology of ILs Deposited on ITO and Ag Surfaces

The change in the evaporation temperature and diameter of the Knudsen cell orifice were used to investigate the effect of different mass flow rates on the morphology of IL films deposited on both ITO and Ag surfaces. The wetting behavior (in a mesoscopic scale) of the ILs on both surfaces was inferred based on the analysis and processing of the SEM micrographs. A detailed morphology of the substrates is presented in Figure S5 of the SM. The topographies of ITO/glass and Ag/ITO/glass surfaces look similar, suggesting that the roughness of both substrates does not differ significantly. The IL films were obtained at different deposition rates by changing the evaporation temperature (Tevap.) (from 473 to 533 K), the diameter of the Knudsen cell orifice (2, 3 mm), or using only the cell body. The overall results obtained for each IL are presented in Figures S6–S21 (SM). Increasing the evaporation temperature as well as the use of larger Knudsen cell orifices lead to an increase in the mass flow rate (for the same substrate temperature of T = 283 K). The increase in the evaporation temperature on other hand also leads to an increase in the gas flow temperature, contributing to a higher ion pair initial mobility at the surface. As representative results, Figure 2, Figure 3, Figure 4 and Figure 5 present the morphology of the micro- and nanodroplets and the respective size distribution for [C2C1im][NTf2], [C2C1im][OTf], [C8C1im][NTf2], and [C8C1im][OTf], respectively. These results were obtained using a constant diameter of the cell orifice (3 mm) but at different evaporation temperatures (473, 503, and 533 K). The combination of these two variables allowed us to obtain IL films (40 ML) deposited at different deposition rates (Φ): [C2C1im][NTf2] (Φ from 0.08 to 1.5 Å/s); [C2C1im][OTf] (Φ from 0.02 to 0.51 Å/s); [C8C1im][NTf2] (Φ from 0.08 to 1.5 Å/s); [C8C1im][OTf] (Φ from 0.04 to 0.73 Å/s) (Figure 2, Figure 3, Figure 4 and Figure 5 and Table S1). Considering the same evaporation temperature, the deposition rate was found to be lower for the OTf-based ILs. This is due to their lower volatility in comparison to the congeners NTf2-based ILs [67]. A global analysis of the SEM images reveals that, for the same mass flow rate, the size of the IL droplets is always lower on the surface of Ag. This is clearly observed by the comparison between images A, C, and E (SEM images on the left—ILs deposited on ITO) with images B, D, and F (SEM images on the right—ILs deposited on Ag) in Figure 2, Figure 3, Figure 4 and Figure 5. For the same IL, the higher number of droplets formed on Ag surfaces is explained by the lower MFAN of IL films on the metallic surface, as we recently reported [9,46]. Another obvious outcome derived from the morphological analysis and clear by eye is the larger size of the droplets obtained for [C8C1im][NTf2] and [C8C1im][OTf]. There is a noticeable differentiation between the wetting behavior of short- and long-chain imidazolium-based ILs. More intense coalescence mechanisms are observed for [C8C1im][NTf2] and [C8C1im][OTf], which emphasizes the higher wettability of both ITO and Ag substrates to long-chain alkylimidazolium cations [9,46]. After further processing of the micrographs using ImageJ software (version 1.52a), the total number of droplets formed was counted, their size was measured, and the surface coverage was evaluated. The resulting droplet size distribution was then used to create histograms (graphs 1 to 6 of Figure 2, Figure 3, Figure 4 and Figure 5) that illustrate how different deposition rates on the substrate surface affect the size distribution of the formed droplets. The deposition rate had no significant effect on the surface coverage of the IL microdroplets (40 ML) on both ITO and Ag surfaces. The films obtained for [C2C1im][NTf2] were found to have surface coverages of (37 ± 2)% and (35 ± 1)% on ITO and Ag surfaces, respectively, whereas values of (47 ± 2)% and (40 ± 2)% were obtained for [C2C1im][OTf]. An increase in the mass flow rate led to similar changes for [C2C1im][NTf2] (Figure 2) and [C2C1im][OTf] (Figure 3): larger droplets formed on ITO as the flow rate increases (comparing graphs 1, 3, and 5 in both Figures), whereas the size distribution of droplets deposited on Ag shows no difference for the two smaller deposition rates and small difference at the highest one (comparing graphs 2, 4, and 6). Translating these conclusions into numbers, we can see that, for [C2C1im][NTf2] (Figure 2), the most frequent sizes (modal diameter, MD—the diameter value that corresponds to the highest frequency or peak in the distribution) of the droplets obtained on ITO/glass surfaces as we change the deposition rate are: between 1.1 and 1.3 µm for Φ of 0.12 Å/s (graph 1); between 1.4 and 1.8 µm, Φ of 0.54 Å/s (graph 3); and between 1.5 and 2.1 µm, Φ of 1.5 Å/s (graph 5). Under the same experimental conditions, only a small shift is observed in the MD of droplets deposited on Ag: MD changes from 0.7–0.8 µm (graph 2) to 0.7–0.9 µm (graph 4) and 1.1–1.2 µm (graph 6). An overall conclusion indicates that the increase in mass flow rate leads to more intense first order coalescence mechanisms of [C2C1im][NTf2] droplets formed on ITO/glass. This result might be related to the increase in the ion pair mobility at the surface by increasing Tevap. Very similar behavior is observed for the congener [C2C1im][OTf] (graphs 1, 3, and 5 of Figure 3). ITO is a somewhat solvophobic surface to the ILs and, as a consequence, the increase in Φ promotes the aggregation of the small droplets. On the Ag surfaces, a negligible effect of Φ on the MD is seen—MD values between 0.6 and 0.8 µm are observed for Φ of 0.06, 0.18, and 0.51 Å/s (graphs 2, 4, and 6). The small influence of the deposition rate on the wetting behavior of ILs on Ag surfaces on the mesoscopic scale is probably related to the higher affinity of the imidazolium cations to the metallic surface. Hence, due to good adhesion, there is a lower tendency for the coalescence of the nanodroplets even when large deposition rates are applied. For 40 ML, a very reduced number of microdroplets with a diameter above 3 µm was obtained for the C2C1im samples. A very distinct behavior was obtained when long-chain ILs ([C8C1im][NTf2] and [C8C1im][OTf]) were deposited on ITO. For the same number of ML, 40 ML, MDs above 6 µm were often obtained (graphs 1 and 3 of Figure 4, graphs 1, 3, and 5 of Figure 5). Curiously, the behavior of [C8C1im][NTf2] on the Ag surface (graphs 2, 4, and 6 of Figure 4) is very similar to that observed for [C2C1im][NTf2] and [C2C1im][OTf] on the same substrate—there is a shift in the MD when increasing Φ from 0.11 to 1.5 Å/s. [C8C1im][OTf] formed larger microdroplets (graphs 2, 4, and 6 of Figure 5), but the coalescence mechanisms were not as intense as observed for the ITO surface. On ITO, at odds, there is no visible dependence between Φ and MD since the coalescence of the droplets occurred even at the lowest Φ. The coalescence processes may be self-induced by the inherent wetting behavior of [C8C1im][NTf2] and [C8C1im][OTf]. In comparison to C2C1im, the IL film obtained from PVD on ITO surfaces for the larger C8C1im is heterogeneous, as the microdroplets depict an irregular shape. This morphology arises from the typical second order coalescence mechanisms observed for the long-chain imidazolium-based ILs [9,46].

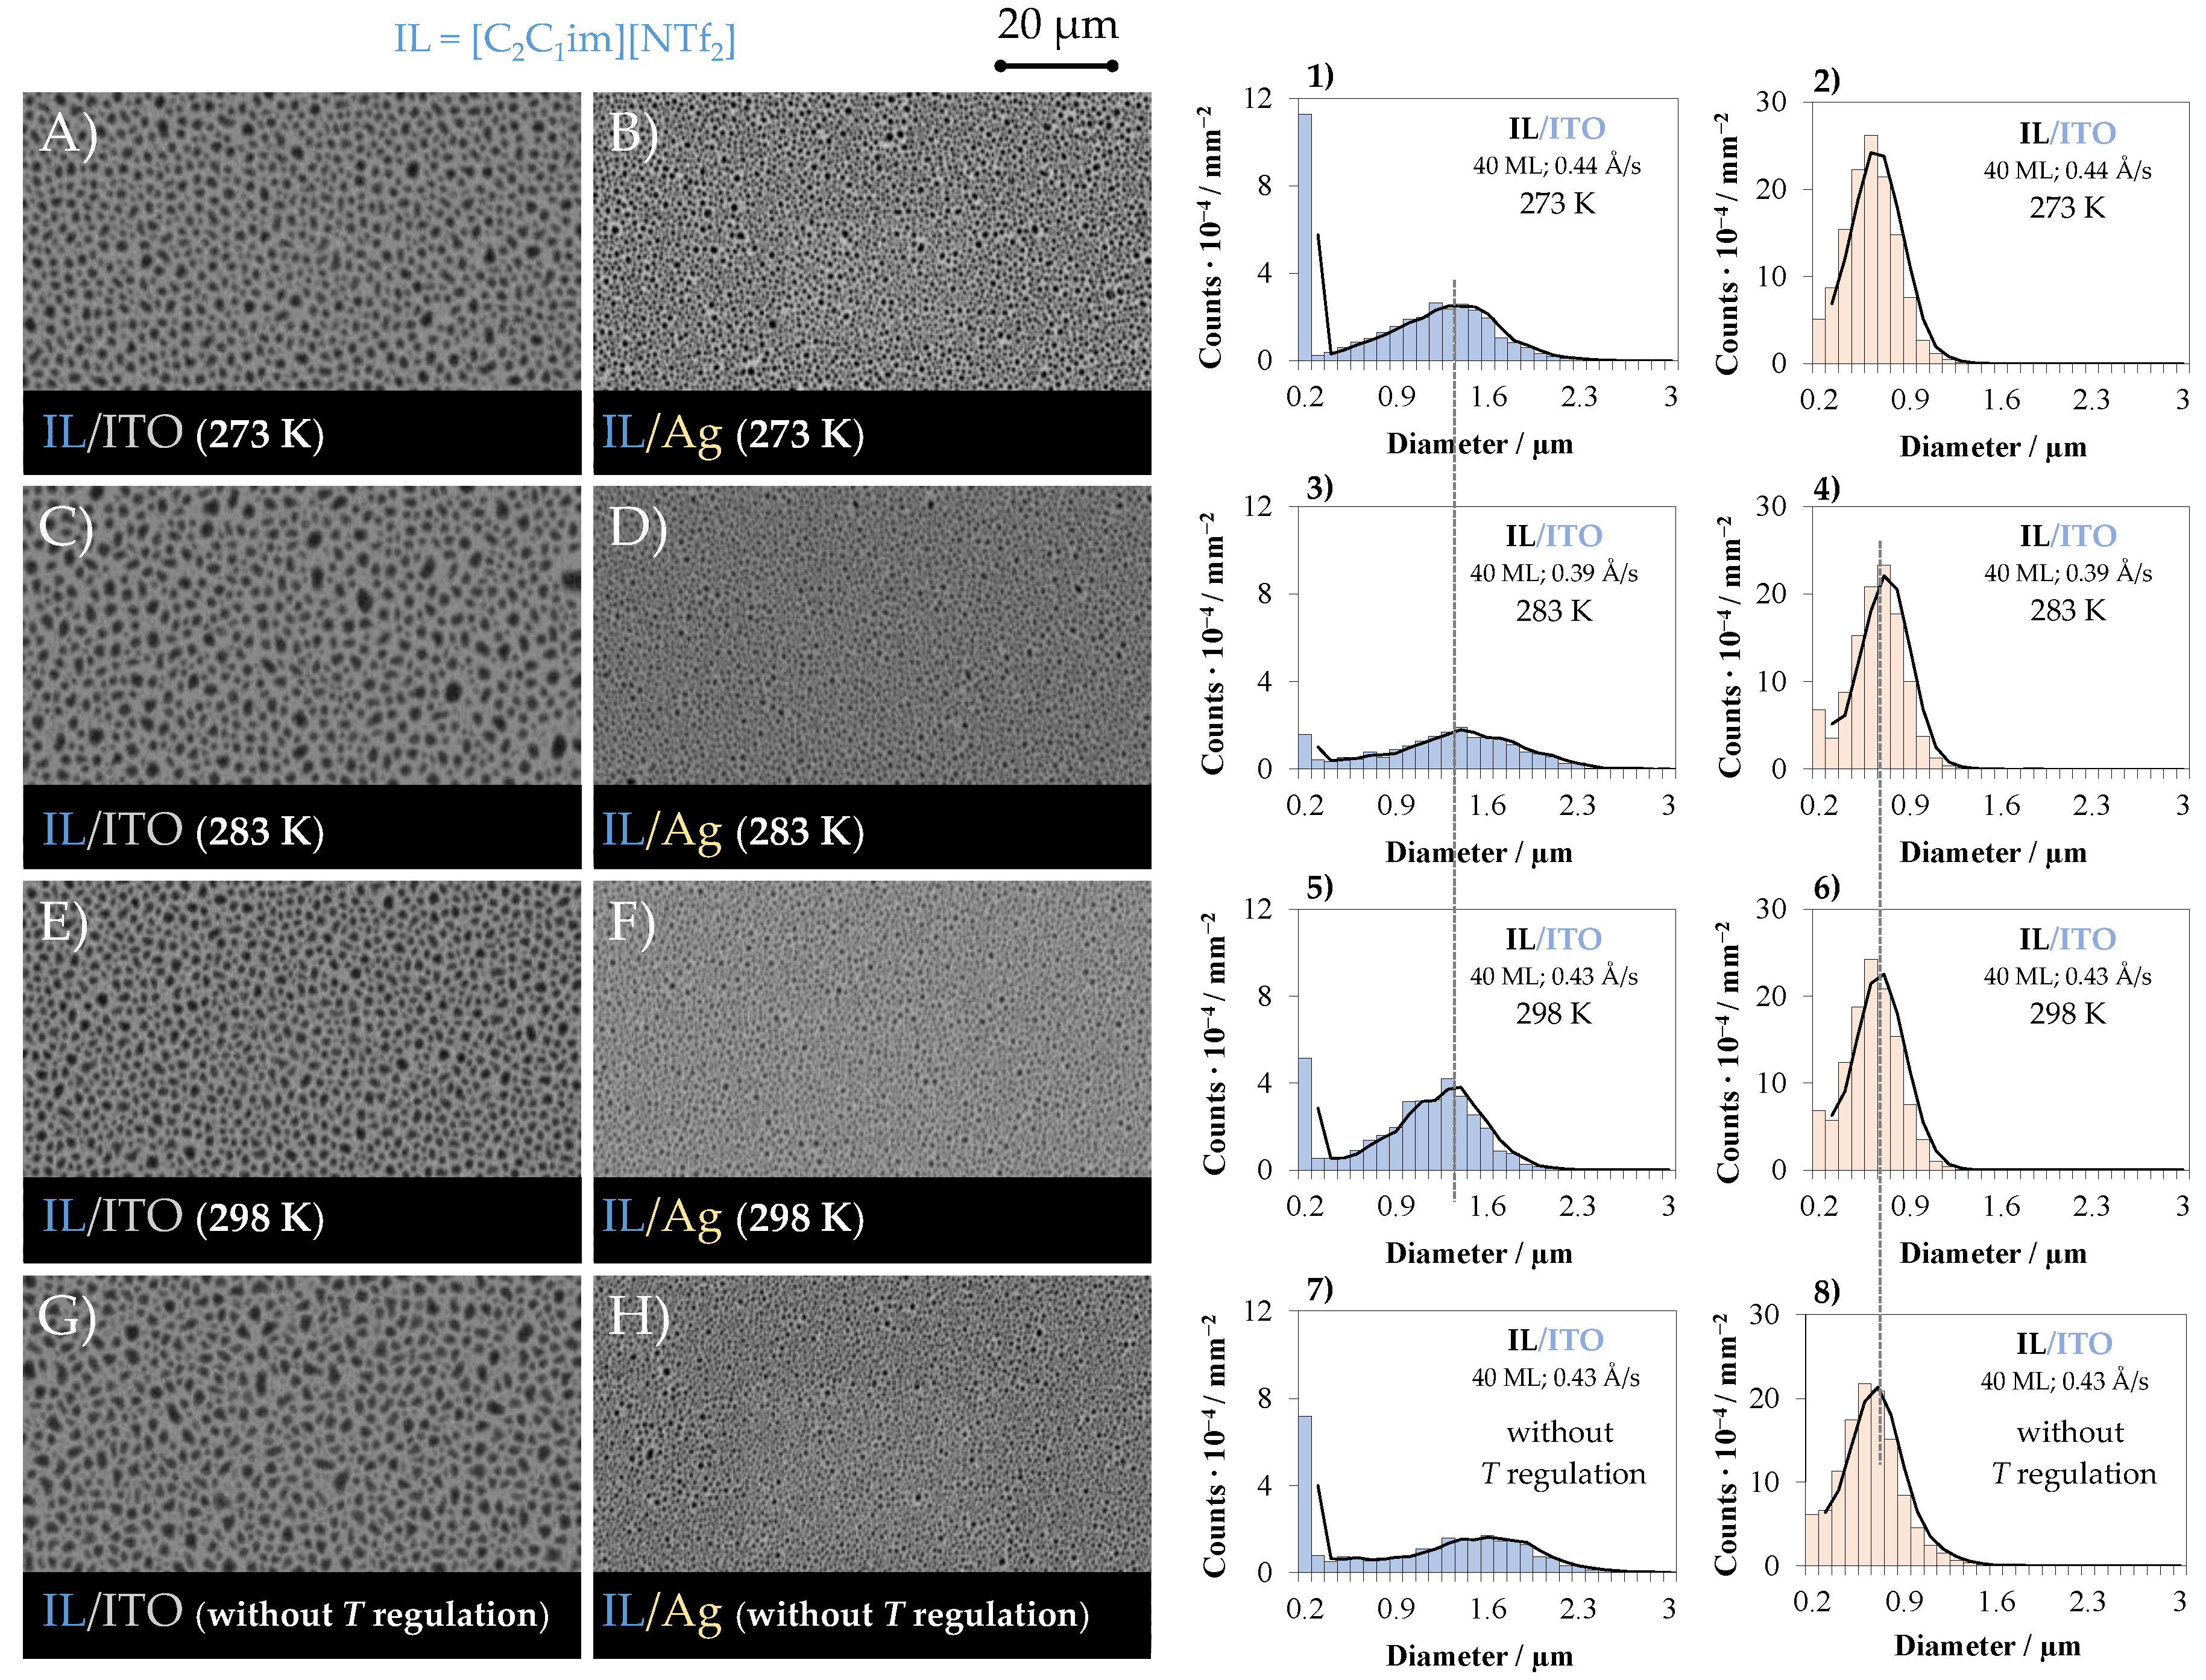
3.2. Effect of the Substrate Temperature on the Morphology of ILs Deposited on ITO or Ag Surfaces

The influence of the substrate temperature (Tsubst.) on the morphology and size distribution of the IL droplets was examined using a constant deposition rate, with the deposition carried out simultaneously on the two surfaces (ITO and Ag), kept at the same substrate temperature (Tsubst.), which was changed in the different experiments. Detailed results obtained for each IL are presented in Figures S22–S29 and Table S2 (SM). Figure 6 shows the SEM micrographs and the respective droplets’ size distribution for the [C2C1im][NTf2] sample deposited on surfaces at 273 K (images A and B, graphs 1 and 2), 283 K (images C and D, graphs 3 and 4), 298 K (images E and F, graphs 5 and 6), and surfaces without thermal regulation of the substrate temperature (with the refrigerated circulating bath turned off) (images G and H, graphs 7 and 8). For [C2C1im][NTf2], the SEM images show very similar morphologies and identical distribution of the droplets for the films obtained on surfaces kept at different temperatures (273, 283, and 298 K). Further, for all experiments, the droplets are formed with a larger size on the ITO surface (images A, C, E, and G). On ITO surfaces, the MD of the droplets is between 1.3 and 1.4 µm (graphs 1, 3, and 5) whereas on the Ag surface, it was between 0.6 and 0.7 µm (graphs 2, 4, 6). Similar results were obtained without controlling Tsubst., where Tsubst. could have been much higher than the highest temperature used before, 298 K, as the substrates were not refrigerated, and hence their temperature depends on the vacuum chamber walls, which can be affected by the temperature of the evaporation ovens.
Overall, we observed that the increase in the substrate temperature had a small effect on the morphology and size distribution of [C2C1im][NTf2] droplets, especially when deposited on the Ag metallic surface. The results presented further highlight the stability of the IL droplets and the reproducibility of the PVD method for the deposition of IL, as independent experiments led to the formation of droplets with similar morphology and size. As regarding [C2C1im][OTf], the effect of Tsubst. on the MD of the droplets deposited on Ag was also minor (Figures S24 and S25 of the SM), with the MD between 0.6 and 0.7 µm, indicating an identical morphological behavior for [C2C1im][NTf2] and [C2C1im][OTf]. On ITO, the results show a clear increase in the MD when Tsubst. was increased. The MD values obtained were 0.8–1.0 µm, 1.0–1.1 µm, and 1.2–1.4 µm, for substrate temperatures of 273, 283, and 298 K, respectively. For [C8C1im][NTf2] (Figures S26 and S27), the droplets obtained on substrates at 273 K had a different appearance compared to those obtained at 283 K and 298 K for both the ITO and Ag surfaces. Further morphological differentiation was noted for [C8C1im][OTf] (Figures S27 and S28). As the substrate temperature progressively increased from 273 K to 298 K, a clear increase in droplet size was observed on the Ag surfaces. The droplets of [C8C1im][OTf] on ITO were consistently found to be very large in all experiments due to their tendency to coalesce, independent of the mass flow rate or substrate temperature used. In general, the droplet size was consistently larger for both C2C1im and C8C1im samples when the ILs were deposited on ITO/glass surfaces.
Figure 6. Morphology of the thin films (micro- and nanodroplets) of [C2C1im][NTf2] (AH) and the respective size distribution of the droplets (histograms (18)). The IL films (40 ML) were deposited (by PVD) simultaneously on surfaces of ITO (images (A,C,E,G)) and Ag (images (B,D,F,H)). The IL film surfaces were obtained on substrates kept at different temperatures: T = 273 K (A,B); T = 283 K (C,D); T = 298 K (E,F); without thermal regulation of the substrate temperature (G,H). In all experiments, the deposition process was carried out by using a similar mass flow rate (≈0.4 Å/s). Top views (AH) were acquired through scanning electron microscopy by using a backscattered electron detector.
Fluids 08 00105 g006

4. Discussion

Reproducible morphological changes were obtained for the four studied ILs, with the molten salts like (shorter alkyl size) ILs [C2C1im][NTf2] and [C2C1im][OTf] forming small droplets whose characteristics are particularly sensitive to changes in the mass flow rate, and the long-chain ILs ([C8C1im][NTf2] and [C8C1im][OTf]) showing an inherent tendency to form higher-size/coalesced droplets.
To better visualize these results, Figure 7 shows the graphical representations of the total number of IL microdroplets obtained (on both ITO and Ag surfaces) as a function of the deposition rate for [C2C1im][NTf2] (graph A), [C2C1im][OTf] (graph B), [C8C1im][NTf2] (graph C), and [C8C1im][OTf] (graph D). A glance at the vertical scale of the graphs clearly indicates that a higher number of droplets was formed for the shorter alkyl size imidazolium-based ILs (C2C1im, graphs A and B). This arises from the less intense coalescence mechanisms of these ILs on the studied surfaces. The better wettability of long-chain imidazolium-based ILs led to the formation of larger droplets for [C8C1im][NTf2] and [C8C1im][OTf], and consequently, the total number of microdroplets formed was lower (graphs C and D). Figure 7 also evidences the higher number of droplets formed on Ag surfaces, in good agreement with previous works [9,46].
A detailed observation of curve shapes shows that similar profiles (although with different magnitudes) were obtained for the number of microdroplets as a function of the deposition rate for [C2C1im][NTf2]/Ag and [C2C1im][NTf2]/ITO (graph A). At lower deposition rates, the number of droplets formed is maximum (but higher on Ag surfaces) and the successive increase in Φ leads to an exponential decay of the total droplet count until reaching a plateau. This suggests that the coalescence mechanisms increase progressively when applying higher deposition rates until reaching a limit where they level off. A similar profile was obtained for [C2C1im][OTf]/ITO (graph B). A peculiar result is observed for [C2C1im][OTf]/Ag as the results indicate no influence of Φ on the droplet counts. This observation agrees with the size distribution of the droplets presented above in Figure 3 (graphs 2, 4, and 6)—only a small effect of Φ in the MD, profile of droplet size distribution, as well as on the total droplet count is observed. We interpret this as resulting from the small submicrodroplets of [C2C1im][OTf] being very stable and well adsorbed to the Ag surface. For this IL, both MFAN and coalescence mechanisms are intrinsically reduced on the Ag surface and the coalescence of the droplets (first order mechanisms) is not intensified by increasing Φ. For the longer ILs, we observe that the intrinsic tendency of the C8C1im droplets to coalesce when deposited on ITO/glass leads to the profiles presented in graphs C and D. The wetting behavior of [C8C1im][NTf2] and [C8C1im][OTf] on ITO leads to the formation of very large droplets (Figure 4 and Figure 5), independently of the experimental conditions of PVD. This behavior arises from the typical second order coalescence mechanisms of the long-chain ILs [9,46]. Similar behavior is observed for [C8C1im][OTf] deposited on the Ag surface (graph D). Curiously, [C8C1im][NTf2] deposited on Ag shows a very distinct behavior, as the dependence of the droplet counts with the deposition rate is closer to observed for the short-chain ILs. This result agrees with the size distribution of the droplets presented in Figure 4 (graphs 2, 4, and 6). Clearly, droplets of [C8C1im][NTf2] deposited on Ag (images B, D, and F of Figure 4) are smaller in comparison to the congener [C8C1im][OTf] deposited on the same surface (images B, D, and F of Figure 5). Overall, these results indicate that, independently of the deposition rate, the second order coalescence processes of [C8C1im][OTf] on Ag are clearly higher when compared to what we observed for [C8C1im][NTf2].
For all the studied ILs, the wetting behavior did not reflect an excellent film-substrate affinity since a continuous film was not obtained, even for the long-chain ILs. Despite the C8C1im-based ILs having a lower film-vapor interfacial tension [24], the magnitude of the substrate-film interfacial tension might be even high, as the obtained 3D film growth mode (island growth) reveals. Although longer chain ILs have a greater droplet spreading, the contact angle on both ITO and Ag surfaces is still considerable (≈20 degrees) [9]. Other authors have also investigated the island growth of ILs on the mesoscopic scale; employing vacuum deposition methods, similar film morphologies (the formation of ionic liquid microdroplets) were reported [35,68,69,70]. Further, there are many reports highlighting the initial formation of a 2D wetting layer followed by droplet formation (3D growth) on a wide range of solid surfaces [55,56,59,71]. Good wettability and spreading behavior have been observed on gold [9,39,46,63,64,72,73] or organic surfaces [43,70] since the ion pairs can interact with the surface by the formation of image dipoles (with gold) or through dispersive interactions (with organic materials).
Herein, the experimental variables studied were found to have a visible influence on the droplet formation and droplet spreading of the small ILs (C2C1im). Our results led us to raise the hypothesis that an increase in the deposition rate could have an impact on the kinetics of the droplet formation and coalescence mechanisms, leading to higher first order coalescence in the short-chain ILs, characteristic of high surface mobility. On the other hand, the prevailing second order coalescence mechanisms known for long-chain ILs (C8C1im) on solvophobic surfaces could explain the formation of large droplets, regardless of the magnitude of the deposition rate. For a detailed comparison of the influence of the anion for the smaller ILs (C2C1im), Figure 8 represents the dependence of the MD of the droplets on the deposition rate (Φ, graph A) and the substrate temperature (Tsubst., graph B). Remarkably, the profiles observed for both ILs in each surface are very similar as regarding to the effect of Φ (A); the curves obtained are almost coincident, and superior MD values are always observed for samples deposited on ITO, as a result of more preponderant first order coalescence mechanisms. For both ILs deposited on ITO, a small increase in Φ (from 0.05 to ≈0.3 Å/s) leads to a large increment in the MD, whereas for higher Φ values, the MD increases more slowly. The similar profiles observed for both ILs might suggest the less significant role of the anion on the wetting behavior of the ILs on ITO.
On Ag surfaces, a small (close to linear) increase in the MD occurs for all range of Φ values. A similar increment in the MD as Φ increases above 0.3 Å/s can be derived from these representations. For both C2C1im samples, the droplets’ MD on ITO is (0.8 ± 0.1) µm higher than the value obtained for the Ag surface. Considering the effect of the substrate temperature (for the same deposition rate, graph B), the MD of the microdroplets was, as expected, lower on Ag surfaces. According to the results, the substrate temperature influences the MD of droplets deposited on ITO, especially for [C2C1im][OTf]. The formation of larger droplets is a consequence of the increased surface mobility caused by the higher substrate temperature [74]. On the other hand, the substrate temperature did not influence the deposition process of the ILs on Ag, and a constant MD of (0.6 ± 0.1) µm was observed for both [C2C1im][NTf2] and [C2C1im][OTf]. These observations emphasize the higher affinity/stability of the droplets on the Ag/ITO surface.

5. Conclusions

The impact of deposition rate and substrate temperature on the morphology of ionic liquid (IL) films deposited by PVD on ITO and Ag/ITO surfaces was investigated for four imidazolium-based ionic liquids (ILs): [C2C1im][NTf2], [C2C1im][OTf], [C8C1im][NTf2], and [C8C1im][OTf]. The film growth was characterized by the formation of three-dimensional droplets/islands (3D growth). The increase in deposition rate and a small change in substrate temperature were found to have a minor effect on the wettability of Ag towards ILs with shorter alkyl chains (C2C1im), indicating good adsorption and stability of IL droplets on the metallic surface. However, on the ITO substrate, a higher degree of droplet coalescence was observed due to the higher surface mobility of the IL on the substrate. It is noteworthy that the increase in deposition rate had a very similar effect on the formation of films for both [C2C1im][NTf2] and [C2C1im][OTf], with the modal diameter of the droplets obtained being identical for each deposition rate. The droplet morphology of the long-chain ILs (C8C1im) was found to be influenced by changes in the deposition rate and/or substrate temperature. Nevertheless, very large droplets were consistently observed on the ITO surface, regardless of the deposition parameters.
In summary, the experimental data presented in this study provides reliable information on the influence of deposition parameters on the nucleation and growth of IL films. Our findings demonstrate that changes in the mass flow rate and substrate temperature have a greater impact on the coalescence stage and morphology of IL droplets deposited on ITO surfaces than those observed on Ag surfaces.

Supplementary Materials

The following supporting information can be downloaded at: https://www.mdpi.com/article/10.3390/fluids8030105/s1, Figure S1: Schematic illustration of the typical mechanisms of nucleation and growth of ionic liquid films; Figure S2: Schematic representation of the vacuum thermal evaporation methodology; Figure S3: Schematic representation of the ovens of the ThinFilmVD apparatus and an image of an individual oven; Figure S4: Schematic representation and images of the substrates support system; Figure S5: Morphology of the substrates (ITO/glass and Ag/ITO/glass); Figures S6–S17: Morphology of [C2C1im][NTf2] (S6), [C2C1im][OTf] (S9), [C8C1im][NTf2] (S12), and [C2C1im][OTf] (S15) films on ITO and Ag using Knudsen effusion cells with different orifice diameters and employing different evaporation temperatures and the respective size distribution of the droplets (S7, S8, S10, S11, S13, S14, S16, and S17); Figures S18–S21: Morphology of micro-/nanodroplets of [C2C1im][NTf2] (S18), [C2C1im][OTf] (S19), [C8C1im][NTf2] (S20), and [C2C1im][OTf] (S21) fabricated onto ITO/glass and Ag/ITO/glass using Knudsen effusion cells with different orifice diameters; Figures S22–S29: Morphology of micro-/nanodroplets of [C2C1im][NTf2] (S22), [C2C1im][OTf] (S24), [C8C1im][NTf2] (S26), and [C2C1im][OTf] (S28) fabricated onto ITO/glass and Ag/ITO/glass employing different substrate temperatures and the respective size distribution (S23, S25, S27, and S29); Table S1: Experimental conditions related to the study of the effect of the mass flow rate on the morphology of the ionic liquid films deposited on ITO/glass and Ag/ITO/glass surfaces; Table S2: Experimental conditions related to the study of the effect of the substrate temperature on the morphology of the ionic liquid films deposited on ITO/glass and Ag/ITO/glass surfaces.

Author Contributions

Conceptualization, J.C.S.C.; methodology, R.M.C., C.N. and J.C.S.C.; investigation, R.M.C. and J.C.S.C.; writing—original draft preparation—R.M.C.; writing—review and editing, M.B., L.M.N.B.F.S. and J.C.S.C.; supervision, M.B. and J.C.S.C.; project administration, M.B. and J.C.S.C.; funding acquisition, L.M.N.B.F.S. All authors have read and agreed to the published version of the manuscript.

Funding

The Portuguese Foundation for Science and Technology (FCT) for financial support to CIQUP, Faculty of Science, University of Porto (Project UIDB/00081/2020), and IMS-Institute of Molecular Sciences (LA/P/0056/2020), Faculty of Science, University of Porto.

Institutional Review Board Statement

Not applicable.

Informed Consent Statement

Not applicable.

Data Availability Statement

Not applicable.

Acknowledgments

The authors thank the Portuguese Foundation for Science and Technology (FCT) for financial support to CIQUP, Faculty of Science, University of Porto (Project UIDB/00081/2020), and IMS-Institute of Molecular Sciences (LA/P/0056/2020), Faculty of Science, University of Porto.

Conflicts of Interest

The authors declare no conflict of interest. The funders had no role in the design of the study; in the collection, analyses, or interpretation of data; in the writing of the manuscript; or in the decision to publish the results.

References

  1. Hayes, R.; Warr, G.G.; Atkin, R. Structure and Nanostructure in Ionic Liquids. Chem. Rev. 2015, 115, 6357–6426. [Google Scholar] [PubMed] [Green Version]
  2. Canongia Lopes, J.N.A.; Pádua, A.A.H. Nanostructural Organization in Ionic Liquids. J. Phys. Chem. B 2006, 110, 3330–3335. [Google Scholar] [CrossRef]
  3. Del Pópolo, M.G.; Voth, G.A. On the Structure and Dynamics of Ionic Liquids. J. Phys. Chem. B 2004, 108, 1744–1752. [Google Scholar] [CrossRef]
  4. Ghandi, K. A Review of Ionic Liquids, Their Limits and Applications. Green Sustain. Chem. 2014, 04, 44–53. [Google Scholar] [CrossRef] [Green Version]
  5. Lei, Z.; Chen, B.; Koo, Y.-M.; MacFarlane, D.R. Introduction: Ionic Liquids. Chem. Rev. 2017, 117, 6633–6635. [Google Scholar] [CrossRef] [Green Version]
  6. Ren, F.; Wang, J.; Xie, F.; Zan, K.; Wang, S.; Wang, S. Applications of Ionic Liquids in Starch Chemistry: A Review. Green Chem. 2020, 22, 2162–2183. [Google Scholar] [CrossRef]
  7. Esperança, J.M.S.S.; Canongia Lopes, J.N.; Tariq, M.; Santos, L.M.N.B.F.; Magee, J.W.; Rebelo, L.P.N. Volatility of Aprotic Ionic Liquids—A Review. J. Chem. Eng. Data 2009, 55, 3–12. [Google Scholar] [CrossRef]
  8. Rocha, M.A.A.; Coutinho, J.A.P.; Santos, L.M.N.B.F. Vapor Pressures of 1,3-Dialkylimidazolium Bis(Trifluoromethylsulfonyl)Imide Ionic Liquids with Long Alkyl Chains. J. Chem. Phys. 2014, 141, 134502. [Google Scholar] [CrossRef] [Green Version]
  9. Costa, J.C.S.; Alves, A.; Bastos, M.; Santos, L.M.N.B.F. The Impact of the Cation Alkyl Chain Length on the Wettability of Alkylimidazolium-Based Ionic Liquids at the Nanoscale. Phys. Chem. Chem. Phys. 2022, 24, 13343–13355. [Google Scholar] [CrossRef]
  10. Shahiduzzaman; Muslih, E.Y.; Hasan, A.K.M.; Wang, L.; Fukaya, S.; Nakano, M.; Karakawa, M.; Takahashi, K.; Akhtaruzzaman; Nunzi, J.-M.; et al. The Benefits of Ionic Liquids for the Fabrication of Efficient and Stable Perovskite Photovoltaics. Chem. Eng. J. 2021, 411, 128461. [Google Scholar] [CrossRef]
  11. Pei, Y.; Zhang, Y.; Ma, J.; Fan, M.; Zhang, S.; Wang, J. Ionic Liquids for Advanced Materials. Mater. Today Nano 2022, 17, 100159. [Google Scholar] [CrossRef]
  12. Kaur, G.; Kumar, H.; Singla, M. Diverse Applications of Ionic Liquids: A Comprehensive Review. J. Mol. Liq. 2022, 351, 118556. [Google Scholar] [CrossRef]
  13. Sun, P.; Armstrong, D.W. Ionic Liquids in Analytical Chemistry. Anal. Chim. Acta 2010, 661, 1–16. [Google Scholar] [CrossRef]
  14. Zhang, S.; Sun, N.; He, X.; Lu, X.; Zhang, X. Physical Properties of Ionic Liquids: Database and Evaluation. J. Phys. Chem. Ref. Data 2006, 35, 1475–1517. [Google Scholar] [CrossRef]
  15. Plechkova, N.V.; Seddon, K.R. Applications of Ionic Liquids in the Chemical Industry. Chem. Soc. Rev. 2008, 37, 123–150. [Google Scholar] [CrossRef] [PubMed]
  16. Borghi, F.; Podestà, A. Ionic Liquids under Nanoscale Confinement. Adv. Phys. X 2020, 5, 1736949. [Google Scholar] [CrossRef] [Green Version]
  17. Calandra, P.; Szerb, E.I.; Lombardo, D.; Algieri, V.; De Nino, A.; Maiuolo, L. A Presentation of Ionic Liquids as Lubricants: Some Critical Comments. Appl. Sci. 2021, 11, 5677. [Google Scholar] [CrossRef]
  18. Yoo, E.; Kim, J.; Hosono, E.; Zhou, H.; Kudo, T.; Honma, I. Large Reversible Li Storage of Graphene Nanosheet Families for Use in Rechargeable Lithium Ion Batteries. Nano Lett. 2008, 8, 2277–2282. [Google Scholar] [CrossRef]
  19. Erto, A.; Silvestre-Albero, A.; Silvestre-Albero, J.; Rodríguez-Reinoso, F.; Balsamo, M.; Lancia, A.; Montagnaro, F. Carbon-Supported Ionic Liquids as Innovative Adsorbents for CO2 Separation from Synthetic Flue-Gas. J. Colloid Interface Sci. 2015, 448, 41–50. [Google Scholar] [CrossRef]
  20. Fredlake, C.P.; Crosthwaite, J.M.; Hert, D.G.; Aki, S.N.V.K.; Brennecke, J.F. Thermophysical Properties of Imidazolium-Based Ionic Liquids. J. Chem. Eng. Data 2004, 49, 954–964. [Google Scholar] [CrossRef]
  21. Wishart, J.F. Energy Applications of Ionic Liquids. Energ. Environ. Sci. 2009, 2, 956. [Google Scholar] [CrossRef]
  22. Hallett, J.P.; Welton, T. Room-Temperature Ionic Liquids: Solvents for Synthesis and Catalysis. 2. Chem. Rev. 2011, 111, 3508–3576. [Google Scholar] [CrossRef] [PubMed]
  23. Rocha, M.A.A.; Lima, C.F.R.A.C.; Gomes, L.R.; Schröder, B.; Coutinho, J.A.P.; Marrucho, I.M.; Esperança, J.M.S.S.; Rebelo, L.P.N.; Shimizu, K.; Lopes, J.N.C.; et al. High-Accuracy Vapor Pressure Data of the Extended [CnC1Im][Ntf2] Ionic Liquid Series: Trend Changes and Structural Shifts. J. Phys. Chem. B 2011, 115, 10919–10926. [Google Scholar] [CrossRef] [PubMed]
  24. Almeida, H.F.D.; Freire, M.G.; Fernandes, A.M.; Lopes-da-Silva, J.A.; Morgado, P.; Shimizu, K.; Filipe, E.J.M.; Canongia Lopes, J.N.; Santos, L.M.N.B.F.; Coutinho, J.A.P. Cation Alkyl Side Chain Length and Symmetry Effects on the Surface Tension of Ionic Liquids. Langmuir 2014, 30, 6408–6418. [Google Scholar] [CrossRef]
  25. Ebrahimi, M.; Moosavi, F. The Effects of Temperature, Alkyl Chain Length, and Anion Type on Thermophysical Properties of the Imidazolium Based Amino Acid Ionic Liquids. J. Mol. Liq. 2018, 250, 121–130. [Google Scholar] [CrossRef]
  26. Katsyuba, S.A.; Vener, M.V.; Zvereva, E.E.; Fei, Z.; Scopelliti, R.; Laurenczy, G.; Yan, N.; Paunescu, E.; Dyson, P.J. How Strong Is Hydrogen Bonding in Ionic Liquids? Combined X-ray Crystallographic, Infrared/Raman Spectroscopic, and Density Functional Theory Study. J. Phys. Chem. B 2013, 117, 9094–9105. [Google Scholar] [CrossRef]
  27. Kurnia, K.A.; Lima, F.; Cláudio, A.F.M.; Coutinho, J.A.P.; Freire, M.G. Hydrogen-Bond Acidity of Ionic Liquids: An Extended Scale. Phys. Chem. Chem. Phys. 2015, 17, 18980–18990. [Google Scholar] [CrossRef] [Green Version]
  28. Bica, K.; Deetlefs, M.; Schröder, C.; Seddon, K.R. Polarisabilities of Alkylimidazolium Ionic Liquids. Phys. Chem. Chem. Phys. 2013, 15, 2703. [Google Scholar] [CrossRef]
  29. Fadeeva, Y.A.; Gruzdev, M.S.; Kudryakova, N.O.; Shmukler, L.E.; Safonova, L.P. Physico-Chemical Characterization of Alkyl-Imidazolium Protic Ionic Liquids. J. Mol. Liq. 2020, 297, 111305. [Google Scholar] [CrossRef]
  30. Sanchora, P.; Pandey, D.K.; Kagdada, H.L.; Materny, A.; Singh, D.K. Impact of Alkyl Chain Length and Water on the Structure and Properties of 1-Alkyl-3-Methylimidazolium Chloride Ionic Liquids. Phys. Chem. Chem. Phys. 2020, 22, 17687–17704. [Google Scholar] [CrossRef]
  31. Rocha, M.A.A.; Neves, C.M.S.S.; Freire, M.G.; Russina, O.; Triolo, A.; Coutinho, J.A.P.; Santos, L.M.N.B.F. Alkylimidazolium Based Ionic Liquids: Impact of Cation Symmetry on Their Nanoscale Structural Organization. J. Phys. Chem. B 2013, 117, 10889–10897. [Google Scholar] [CrossRef] [PubMed]
  32. Xue, L.; Gurung, E.; Tamas, G.; Koh, Y.P.; Shadeck, M.; Simon, S.L.; Maroncelli, M.; Quitevis, E.L. Effect of Alkyl Chain Branching on Physicochemical Properties of Imidazolium-Based Ionic Liquids. J. Chem. Eng. Data 2016, 61, 1078–1091. [Google Scholar] [CrossRef]
  33. Perkin, S.; Crowhurst, L.; Niedermeyer, H.; Welton, T.; Smith, A.M.; Gosvami, N.N. Self-Assembly in the Electrical Double Layer of Ionic Liquids. Chem. Commun. 2011, 47, 6572. [Google Scholar] [CrossRef] [PubMed]
  34. Costa, J.C.S.; Mendes, A.; Santos, L.M.N.B.F. Morphology of Imidazolium-Based Ionic Liquids as Deposited by Vapor Deposition: Micro-/Nanodroplets and Thin Films. ChemPhysChem 2016, 17, 2123–2127. [Google Scholar] [CrossRef] [PubMed] [Green Version]
  35. Costa, J.C.S.; Coelho, A.F.S.M.G.; Mendes, A.; Santos, L.M.N.B.F. Nucleation and Growth of Microdroplets of Ionic Liquids Deposited by Physical Vapor Method onto Different Surfaces. Appl. Surf. Sci. 2018, 428, 242–249. [Google Scholar] [CrossRef]
  36. Campos, R.M.; Alves, A.C.P.M.; Lima, M.A.L.; Farinha, A.F.M.; Cardoso, J.P.S.; Mendes, A.; Costa, J.C.S.; Santos, L.M.N.B.F. Morphology, Structure, and Dynamics of Pentacene Thin Films and Their Nanocomposites with [C2C1Im][NTf2] and [C2C1Im][OTF] Ionic Liquids. ChemPhysChem 2020, 21, 1814–1825. [Google Scholar] [CrossRef] [PubMed]
  37. Cremer, T.; Killian, M.; Gottfried, J.M.; Paape, N.; Wasserscheid, P.; Maier, F.; Steinrück, H.-P. Physical Vapor Deposition of [EMIM][Tf2N]: A New Approach to the Modification of Surface Properties with Ultrathin Ionic Liquid Films. ChemPhysChem 2008, 9, 2185–2190. [Google Scholar] [CrossRef]
  38. Costa, J.C.S.; Rocha, R.M.; Vaz, I.C.M.; Torres, M.C.; Mendes, A.; Santos, L.M.N.B.F. Description and Test of a New Multilayer Thin Film Vapor Deposition Apparatus for Organic Semiconductor Materials. J. Chem. Eng. Data 2015, 60, 3776–3791. [Google Scholar] [CrossRef] [Green Version]
  39. Rietzler, F.; May, B.; Steinrück, H.-P.; Maier, F. Switching Adsorption and Growth Behavior of Ultrathin [C2C1Im][OTf] Films on Au(111) by Pd Deposition. Phys. Chem. Chem. Phys. 2016, 18, 25143–25150. [Google Scholar] [CrossRef] [Green Version]
  40. Richey, N.E.; de Paula, C.; Bent, S.F. Understanding Chemical and Physical Mechanisms in Atomic Layer Deposition. J. Chem. Phys. 2020, 152, 040902. [Google Scholar] [CrossRef]
  41. Venables, J.A.; Spiller, G.D.T.; Hanbucken, M. Nucleation and Growth of Thin Films. Rep. Prog. Phys. 1984, 47, 399–459. [Google Scholar] [CrossRef]
  42. Ratsch, C.; Venables, J.A. Nucleation Theory and the Early Stages of Thin Film Growth. J. Vac. Sci. Technol. A 2003, 21, S96–S109. [Google Scholar] [CrossRef]
  43. Costa, J.C.S.; Campos, R.M.; Castro, A.C.M.; Farinha, A.F.M.; Oliveira, G.N.P.; Araújo, J.P.; Santos, L.M.N.B.F. The Effect of Ionic Liquids on the Nucleation and Growth of Perylene Films Obtained by Vapor Deposition. CrystEngComm 2023, 25, 913–924. [Google Scholar] [CrossRef]
  44. Young, T., III. An Essay on the Cohesion of Fluids. Philos. Trans. Roy. Soc. Lond. 1805, 95, 65–87. [Google Scholar]
  45. ADAM, N.K. Use of the Term “Young’s Equation” for Contact Angles. Nature 1957, 180, 809–810. [Google Scholar] [CrossRef]
  46. Teixeira, M.S.M.; Santos, L.M.N.B.F.; Costa, J.C.S. Nucleation, Coalescence, and Thin-Film Growth of Triflate-Based Ionic Liquids on ITO, Ag, and Au Surfaces. Colloids Interfaces 2022, 6, 46. [Google Scholar] [CrossRef]
  47. Tariq, M.; Freire, M.G.; Saramago, B.; Coutinho, J.A.P.; Lopes, J.N.C.; Rebelo, L.P.N. Surface Tension of Ionic Liquids and Ionic Liquid Solutions. Chem. Soc. Rev. 2012, 41, 829–868. [Google Scholar] [CrossRef]
  48. Dragoni, D.; Manini, N.; Ballone, P. Interfacial Layering of a Room-Temperature Ionic Liquid Thin Film on Mica: A Computational Investigation. ChemPhysChem 2012, 13, 1772–1780. [Google Scholar] [CrossRef]
  49. Weijs, J.H.; Marchand, A.; Andreotti, B.; Lohse, D.; Snoeijer, J.H. Origin of Line Tension for a Lennard-Jones Nanodroplet. Phys. Fluid. 2011, 23, 022001. [Google Scholar] [CrossRef] [Green Version]
  50. Zhang, J.; Wang, P.; Borg, M.K.; Reese, J.M.; Wen, D. A Critical Assessment of the Line Tension Determined by the Modified Young’s Equation. Phys. Fluid. 2018, 30, 082003. [Google Scholar] [CrossRef] [Green Version]
  51. Lexow, M.; Talwar, T.; Heller, B.S.J.; May, B.; Bhuin, R.G.; Maier, F.; Steinrück, H.-P. Time-Dependent Changes in the Growth of Ultrathin Ionic Liquid Films on Ag(111). Phys. Chem. Chem. Phys. 2018, 20, 12929–12938. [Google Scholar] [CrossRef] [PubMed] [Green Version]
  52. Lexow, M.; Heller, B.S.J.; Maier, F.; Steinrück, H.-P. Anion Exchange at the Liquid/Solid Interface of Ultrathin Ionic Liquid Films on Ag(111). ChemPhysChem 2018, 19, 2978–2984. [Google Scholar] [CrossRef] [PubMed] [Green Version]
  53. Lexow, M.; Heller, B.S.J.; Partl, G.; Bhuin, R.G.; Maier, F.; Steinrück, H.-P. Cation Exchange at the Interfaces of Ultrathin Films of Fluorous Ionic Liquids on Ag(111). Langmuir 2018, 35, 398–405. [Google Scholar] [CrossRef] [PubMed] [Green Version]
  54. Liu, Y.; Zhang, Y.; Wu, G.; Hu, J. Coexistence of Liquid and Solid Phases of Bmim-PF6 Ionic Liquid on Mica Surfaces at Room Temperature. J. Am. Chem. Soc. 2006, 128, 7456–7457. [Google Scholar] [CrossRef]
  55. Lexow, M.; Maier, F.; Steinrück, H.-P. Ultrathin Ionic Liquid Films on Metal Surfaces: Adsorption, Growth, Stability and Exchange Phenomena. Adv. Phys. X 2020, 5, 1761266. [Google Scholar] [CrossRef]
  56. Delcheva, I.; Ralston, J.; Beattie, D.A.; Krasowska, M. Static and Dynamic Wetting Behaviour of Ionic Liquids. Adv. Colloid Interface Sci. 2015, 222, 162–171. [Google Scholar] [CrossRef]
  57. Deyko, A.; Cremer, T.; Rietzler, F.; Perkin, S.; Crowhurst, L.; Welton, T.; Steinrück, H.-P.; Maier, F. Interfacial Behavior of Thin Ionic Liquid Films on Mica. J. Phys. Chem. C 2013, 117, 5101–5111. [Google Scholar] [CrossRef]
  58. Gong, X.; Li, L. Understanding the Wettability of Nanometer-Thick Room Temperature Ionic Liquids (RTILs) on Solid Surfaces. Chin. Chem. Lett. 2017, 28, 2045–2052. [Google Scholar] [CrossRef]
  59. Beattie, D.A.; Espinosa-Marzal, R.M.; Ho, T.T.M.; Popescu, M.N.; Ralston, J.; Richard, C.J.E.; Sellapperumage, P.M.F.; Krasowska, M. Molecularly-Thin Precursor Films of Imidazolium-Based Ionic Liquids on Mica. J. Phys. Chem. C 2013, 117, 23676–23684. [Google Scholar] [CrossRef]
  60. Borghi, F.; Mirigliano, M.; Lenardi, C.; Milani, P.; Podestà, A. Nanostructure Determines the Wettability of Gold Surfaces by Ionic Liquid Ultrathin Films. Front. Chem. 2021, 9, 619432. [Google Scholar] [CrossRef]
  61. Li, S.; Han, K.S.; Feng, G.; Hagaman, E.W.; Vlcek, L.; Cummings, P.T. Dynamic and Structural Properties of Room-Temperature Ionic Liquids near Silica and Carbon Surfaces. Langmuir 2013, 29, 9744–9749. [Google Scholar] [CrossRef] [PubMed]
  62. Pensado, A.S.; Malberg, F.; Gomes, M.F.C.; Pádua, A.A.H.; Fernández, J.; Kirchner, B. Interactions and Structure of Ionic Liquids on Graphene and Carbon Nanotubes Surfaces. RSC Adv. 2014, 4, 18017–18024. [Google Scholar] [CrossRef]
  63. Meusel, M.; Gezmis, A.; Jaekel, S.; Lexow, M.; Bayer, A.; Maier, F.; Steinrück, H.-P. Time- and Temperature-Dependent Growth Behavior of Ionic Liquids on Au(111) Studied by Atomic Force Microscopy in Ultrahigh Vacuum. J. Phys. Chem. C 2021, 125, 20439–20449. [Google Scholar] [CrossRef]
  64. Cremer, T.; Stark, M.; Deyko, A.; Steinrück, H.-P. Liquid/Solid Interface of Ultrathin Ionic Liquid Films: [C1C1Im][Tf2N] and [C8C1Im][Tf2N] on Au(111). Langmuir 2011, 27, 3662–3671. [Google Scholar] [CrossRef] [PubMed]
  65. Rola, K.P.; Zajac, A.; Szpecht, A.; Kowal, D.; Cybinska, J.; Smiglak, M.; Komorowska, K. Interaction of electron beam with ionic liquids and its application for micropatterning. Eur. Polym. J. 2021, 156, 110615. [Google Scholar] [CrossRef]
  66. Schneider, C.A.; Rasband, W.S.; Eliceiri, K.W. NIH Image to ImageJ: 25 Years of Image Analysis. Nat. Methods 2012, 9, 671–675. [Google Scholar] [CrossRef]
  67. Zaitsau, D.H.; Topp, A.; Siegesmund, A.; Papcke, A.; Kockerling, M.; Verevkin, S.P. In the Footsteps of August Michaelis: Syntheses and Thermodynamics of Extremely Low-Volatile Ionic Liquids. ChemistryOpen 2021, 10, 243–247. [Google Scholar] [CrossRef]
  68. Maruyama, S.; Takeyama, Y.; Taniguchi, H.; Fukumoto, H.; Itoh, M.; Kumigashira, H.; Oshima, M.; Yamamoto, T.; Matsumoto, Y. Molecular Beam Deposition of Nanoscale Ionic Liquids in Ultrahigh Vacuum. ACS Nano 2010, 4, 5946–5952. [Google Scholar] [CrossRef]
  69. Matsumoto, Y.; Maruyama, S. Laser Deposition of Nano-Ionic Liquids and their Process Applications in a Vacuum. Ionic Liquid Devices 2017, 136–167. [Google Scholar] [CrossRef]
  70. Takeyama, Y.; Mantoku, S.; Maruyama, S.; Matsumoto, Y. Growth Behaviours of Pentacene Films Confined in Engineered Shapes of Ionic-Liquid in Vacuum. CrystEngComm 2014, 16, 684–689. [Google Scholar] [CrossRef]
  71. Delcheva, I.; Beattie, D.A.; Ralston, J.; Krasowska, M. Dynamic Wetting of Imidazolium-Based Ionic Liquids on Gold and Glass. Phys. Chem. Chem. Phys. 2018, 20, 2084–2093. [Google Scholar] [CrossRef] [PubMed]
  72. Hessey, S.G.; Jones, R.G. On the Evaporation, Bonding, and Adsorbate Capture of an Ionic Liquid on Au(111). Chem. Sci. 2013, 4, 2519–2529. [Google Scholar] [CrossRef]
  73. Rietzler, F.; Piermaier, M.; Deyko, A.; Steinruck, H.-P.; Maier, F. Electrospray Ionization Deposition of Ultrathin Ionic Liquid Films: [C8C1Im]Cl and [C8C1Im][Tf2N] on Au(111). Langmuir 2014, 30, 1063–1071. [Google Scholar] [CrossRef] [PubMed]
  74. Chopra, K.L.; Randlett, M.R. Influence of Deposition Parameters on the Coalescence Stage of Growth of Metal Films. J. Appl. Phys. 1968, 39, 1874–1881. [Google Scholar] [CrossRef]
Figure 1. (A)—Molecular structures of the studied ionic liquids: (1) 1-octyl-3-methylimidazolium bis(trifluoromethyl)sulfonyl]imide, [C8C1im][NTf2]; (2) 1-octyl-3-methylimidazolium triflate, [C8C1im][OTf]; (3) 1-ethyl-3-methylimidazolium bis(trifluoromethyl)sulfonyl]imide, [C2C1im][NTf2]; (4) 1-ethyl-3-methylimidazolium triflate, [C2C1im][OTf]. (B)—Schematic representation of the thermal evaporation method: (1) cooling system; (2) instrumentation box; (3) vacuum chamber; (4) N2 (l) metallic trap; (5) vacuum pumping system). (C)—Schematic representation of the effusion process of ionic liquids from a Knudsen cell (T1 and T2 denote the effusion temperature and the substrate temperature, respectively).
Fluids 08 00105 g001
Figure 2. Morphology of the thin films (micro- and nanodroplets) of [C2C1im][NTf2] (AF) and the respective size distribution of the droplets (histograms (16)). The IL films (40 ML) were deposited (by PVD) simultaneously on surfaces of ITO (images (A,C,E)) and Ag (images (B,D,F)). The IL film surfaces were obtained through different mass flow rates in the deposition process: 0.12, 0.54, and 1.5 Å/s (evaporation temperatures of 473, 503, and 533 K, respectively, and using a Knudsen cell orifice with 3 mm of thickness). The red arrows indicate the successive shift of the modal diameter with an increase in the deposition rate. The temperature of the substrates was kept at T = 283 K. Surface coverages of 35.9, 33.8, 36.1, 34.6, 39.8, and 36.1% were derived by image processing of (AF), respectively. Top views (AF) were acquired through scanning electron microscopy by using a backscattered electron detector.
Fluids 08 00105 g002
Figure 3. Morphology of the thin films (micro- and nanodroplets) of [C2C1im][OTf] (AF) and the respective size distribution of the droplets (histograms (16)). The IL films (40 ML) were deposited (by PVD) simultaneously on surfaces of ITO (images (A,C,E)) and Ag (images (B,D,F)). The IL film surfaces were obtained through different mass flow rates in the deposition process: 0.06, 0.18, and 0.51 Å/s (evaporation temperatures of 473, 503, and 533 K, respectively, and using a Knudsen cell orifice with 3 mm of thickness). The red arrows indicate the successive shift of the modal diameter with an increase in the deposition rate. The temperature of the substrates was kept at T = 283 K. Surface coverages of 46.2, 41.9, 48.6, 38.1, 44.8, and 40.6% were derived by image processing of (AF), respectively. Top views (AF) were acquired through scanning electron microscopy by using a backscattered electron detector.
Fluids 08 00105 g003
Figure 4. Morphology of the thin films (micro- and nanodroplets) of [C8C1im][NTf2] (AF) and the respective size distribution of the droplets (histograms (16)). The IL films (40 ML) were deposited (by PVD) simultaneously on surfaces of ITO (images (A,C,E)) and Ag (images (B,D,F)). The IL film surfaces were obtained through different mass flow rates in the deposition process: 0.11, 0.47, and 1.5 Å/s (evaporation temperatures of 473, 503, and 533 K, respectively, and using a Knudsen cell orifice with 3 mm of thickness). The red arrows indicate the successive shift of the modal diameter with an increase in the deposition rate. The temperature of the substrates was kept at T = 283 K. The image processing was not able to derive with accuracy the surface coverage of the films (it is estimated to be >40%). Top views (AF) were acquired through scanning electron microscopy by using a backscattered electron detector.
Fluids 08 00105 g004
Figure 5. Morphology of the thin films (micro- and nanodroplets) of [C8C1im][OTf] (AF) and the respective size distribution of the droplets (histograms (16)). The IL films (40 ML) were deposited (by PVD) simultaneously on surfaces of ITO (images (A,C,E)) and Ag (images (B,D,F)). The IL film surfaces were obtained through different mass flow rates in the deposition process: 0.09, 0.24, and 0.73 Å/s (evaporation temperatures of 473, 503, and 533 K, respectively, and using a Knudsen cell orifice with 3 mm of thickness). The red arrows indicate the successive shift of the modal diameter with an increase in the deposition rate. The temperature of the substrates was kept at T = 283 K. The image processing was not able to derive with accuracy the surface coverage of the films (it is estimated to be >40%). Top views (AF) were acquired through scanning electron microscopy by using a backscattered electron detector.
Fluids 08 00105 g005
Figure 7. Graphical representations of the number of IL droplets obtained (all microdroplets with a minimum area of 0.02 μm2) as a function of the deposition rate for [C2C1im][NTf2] (A); [C2C1im][OTf] (B); [C8C1im][NTf2] (C); and [C8C1im][OTf] (D). These results were derived from image processing of the SEM micrographs relative to the simultaneous deposition of each IL film (40 ML) on surfaces of ITO and Ag/ITO.
Fluids 08 00105 g007
Figure 8. Graphical representations of the modal diameter of the IL droplets as a function of the deposition rate (A) and the substrate temperature (B) for [C2C1im][NTf2] and [C2C1im][OTf]. These results were derived from the analysis of the SEM micrographs relative to the simultaneous deposition of each IL film (40 ML) on surfaces of ITO and Ag/ITO.
Fluids 08 00105 g008
Disclaimer/Publisher’s Note: The statements, opinions and data contained in all publications are solely those of the individual author(s) and contributor(s) and not of MDPI and/or the editor(s). MDPI and/or the editor(s) disclaim responsibility for any injury to people or property resulting from any ideas, methods, instructions or products referred to in the content.

