
Patterning Behavior of Hybrid Buoyancy-Marangoni Convection in Inclined Layers Heated from Below

Abstract
:1. Introduction
2. The System
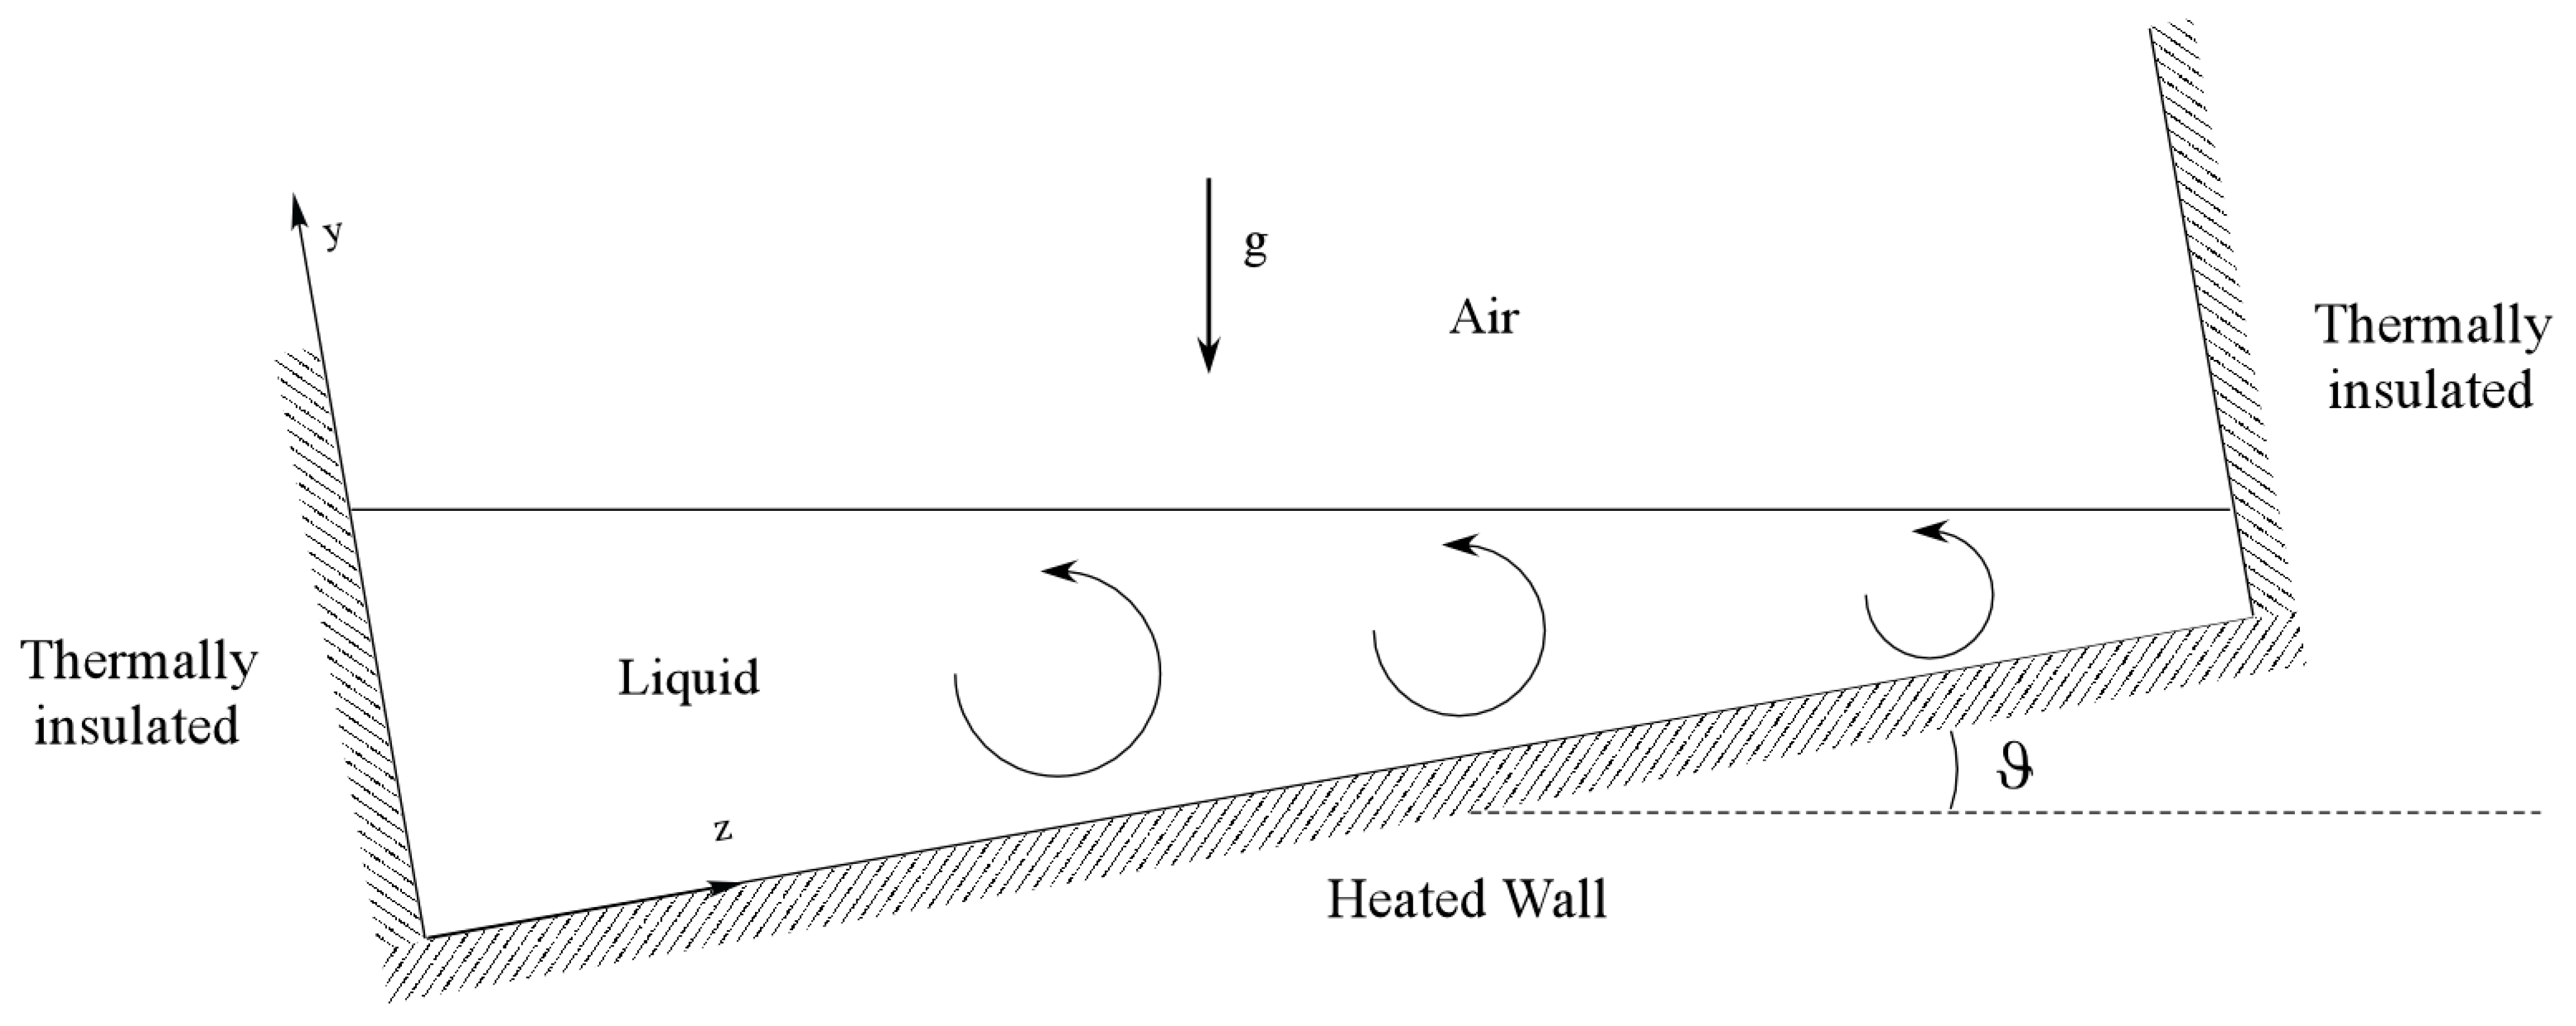
2.1. The Geometry
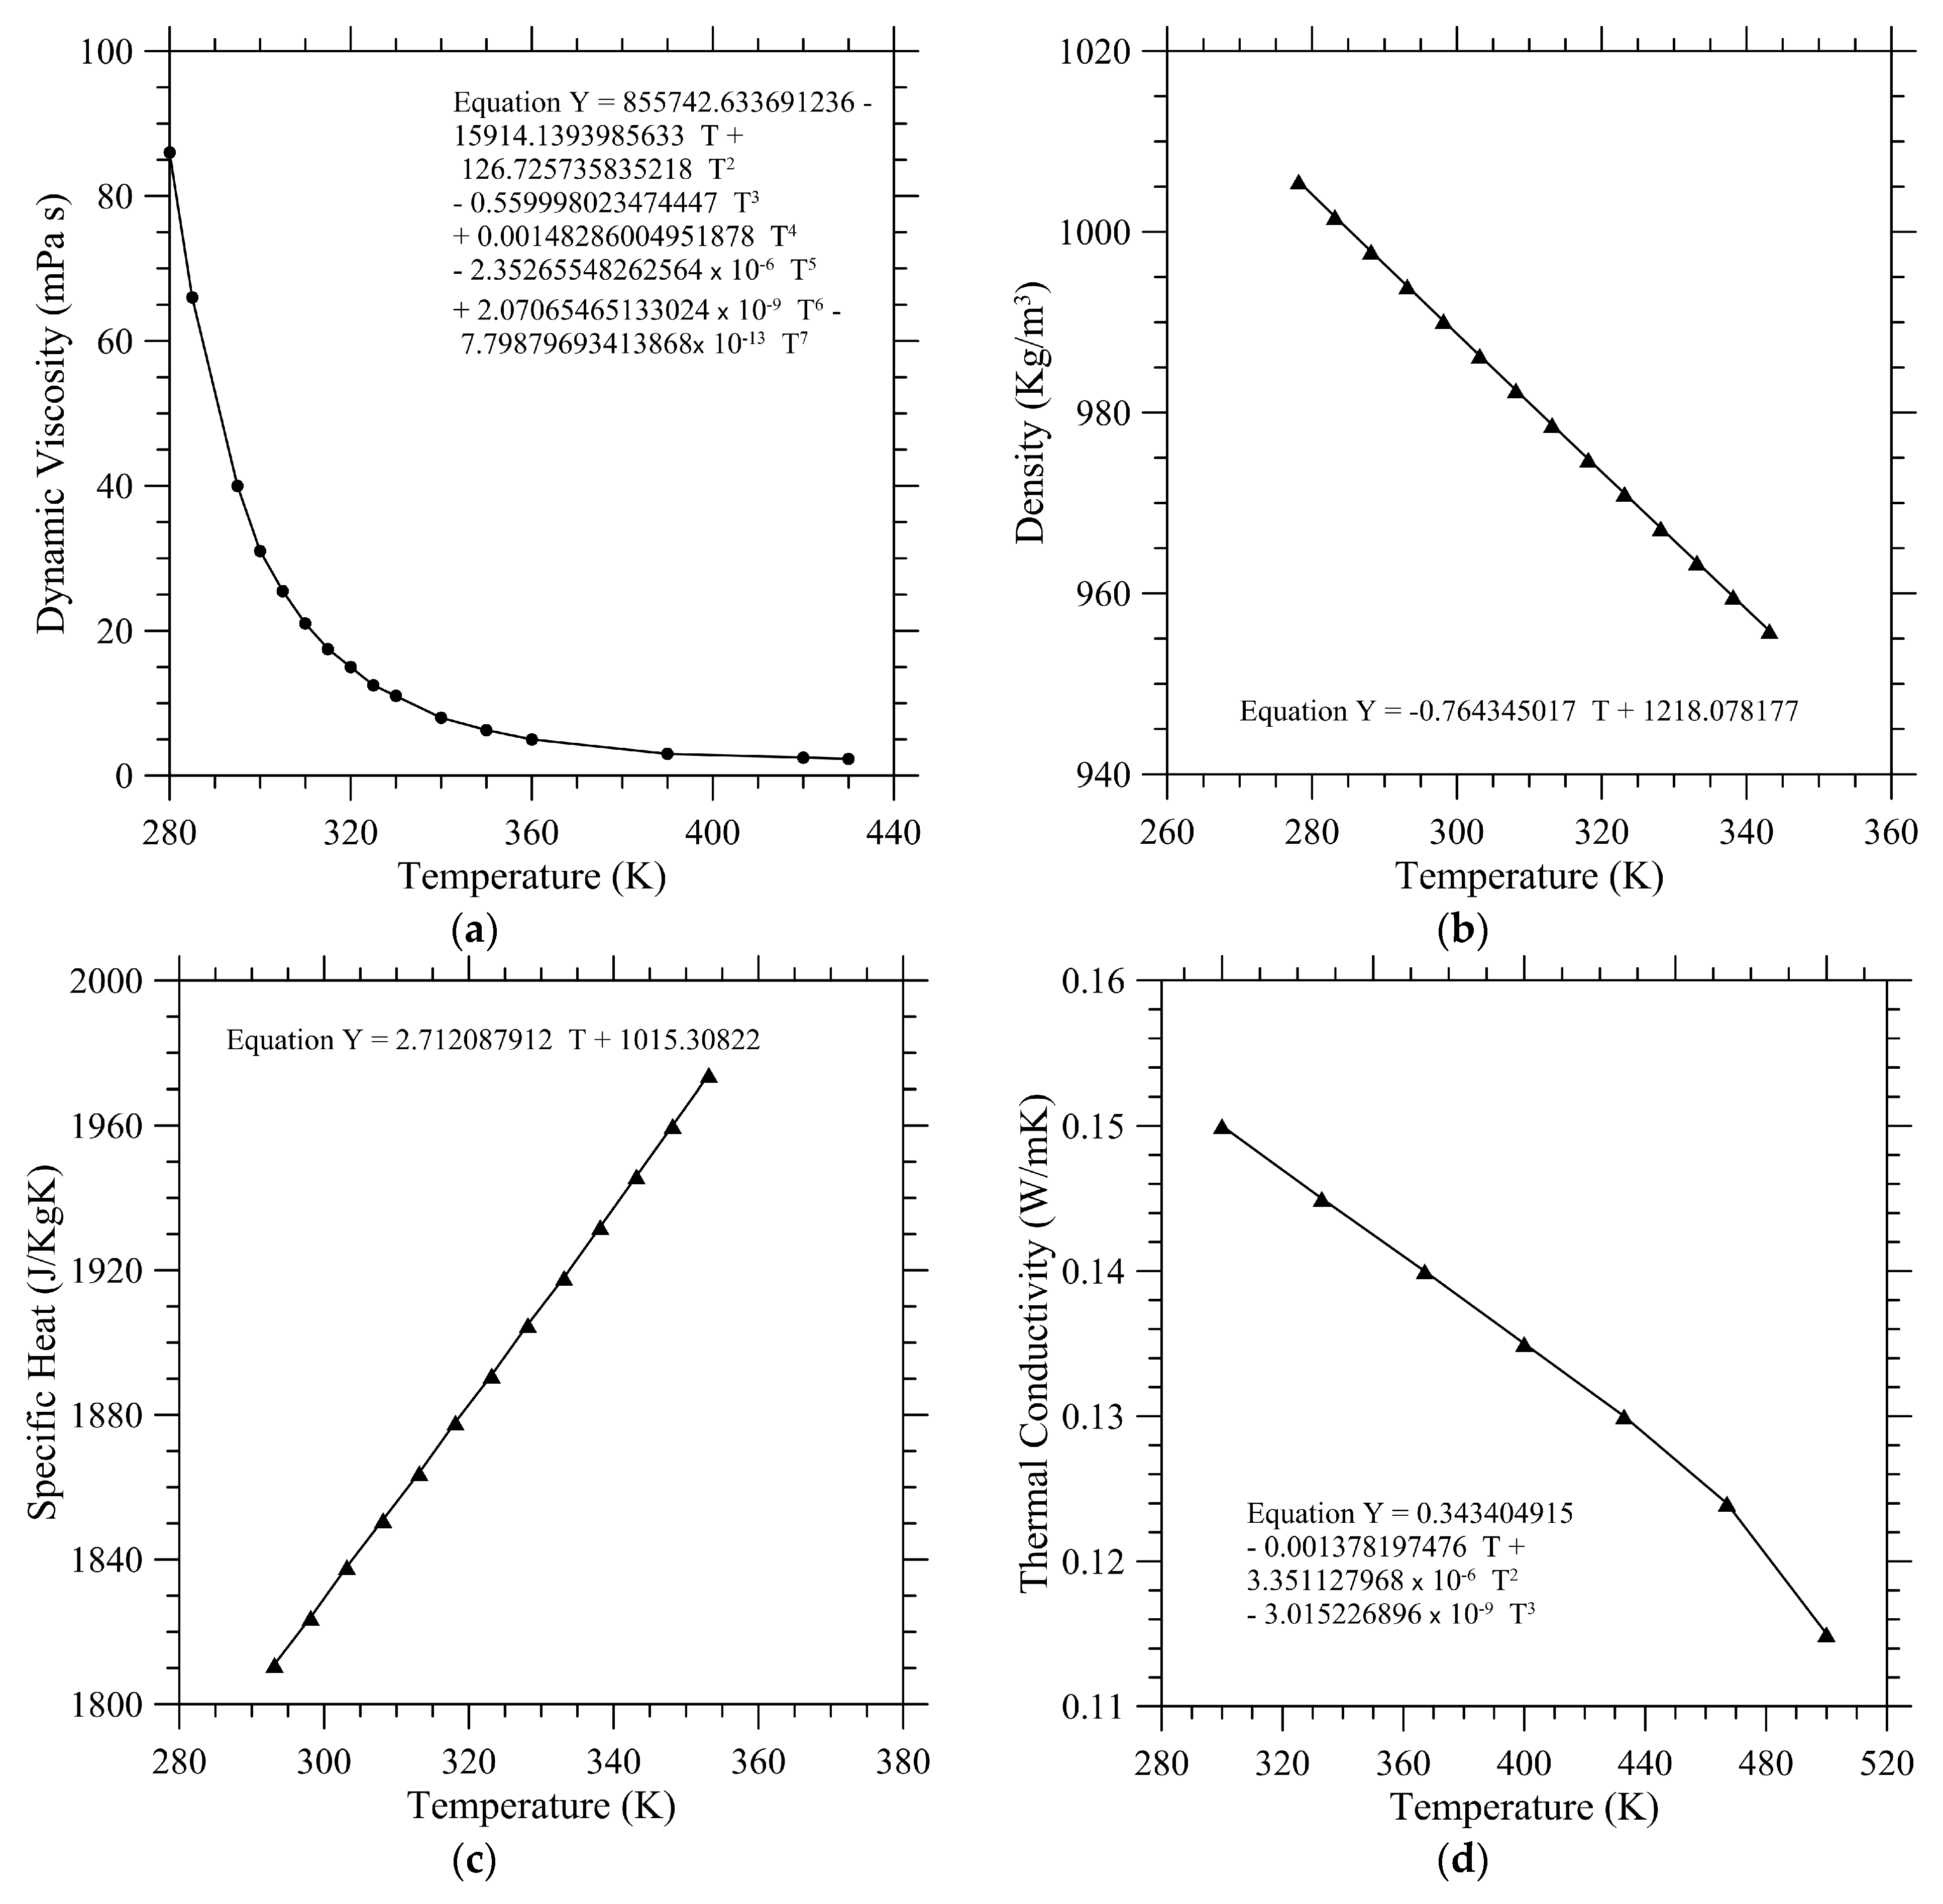
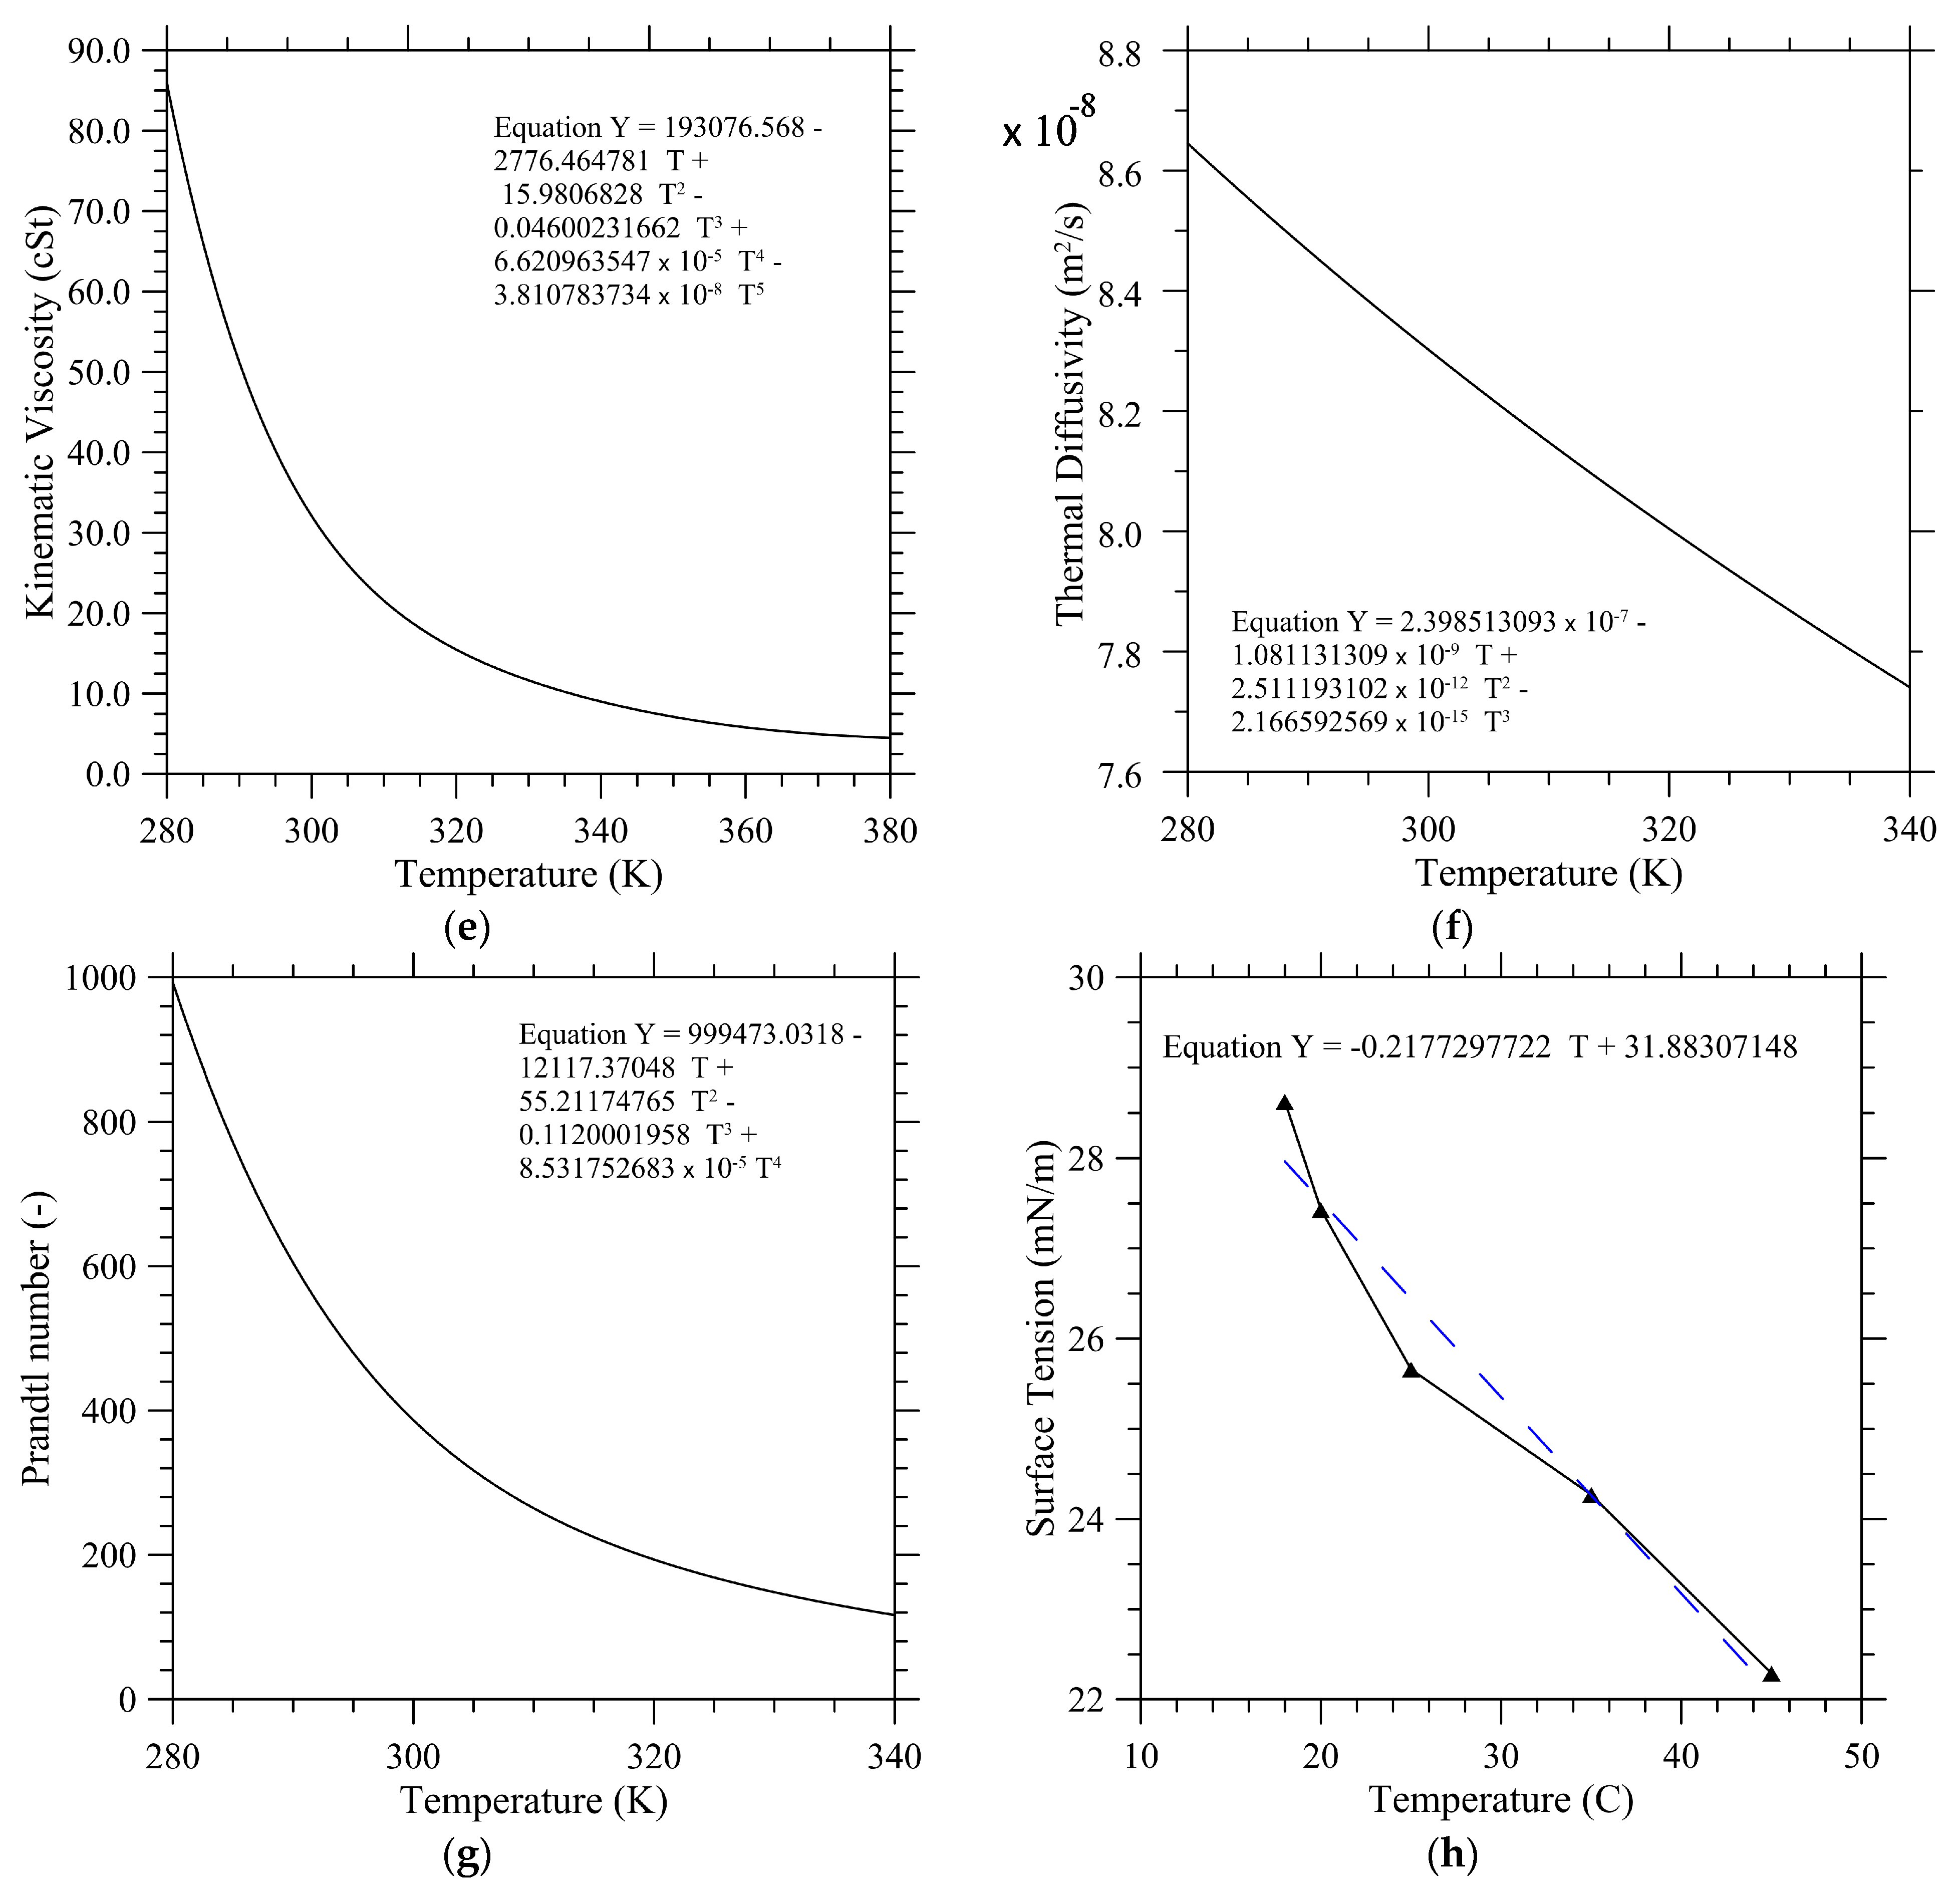
2.2. The Liquid
2.3. Characteristic Numbers
3. Experimental Apparatus
4. Results
4.1. Canonical States of Thermal Convection in the Horizontal Case
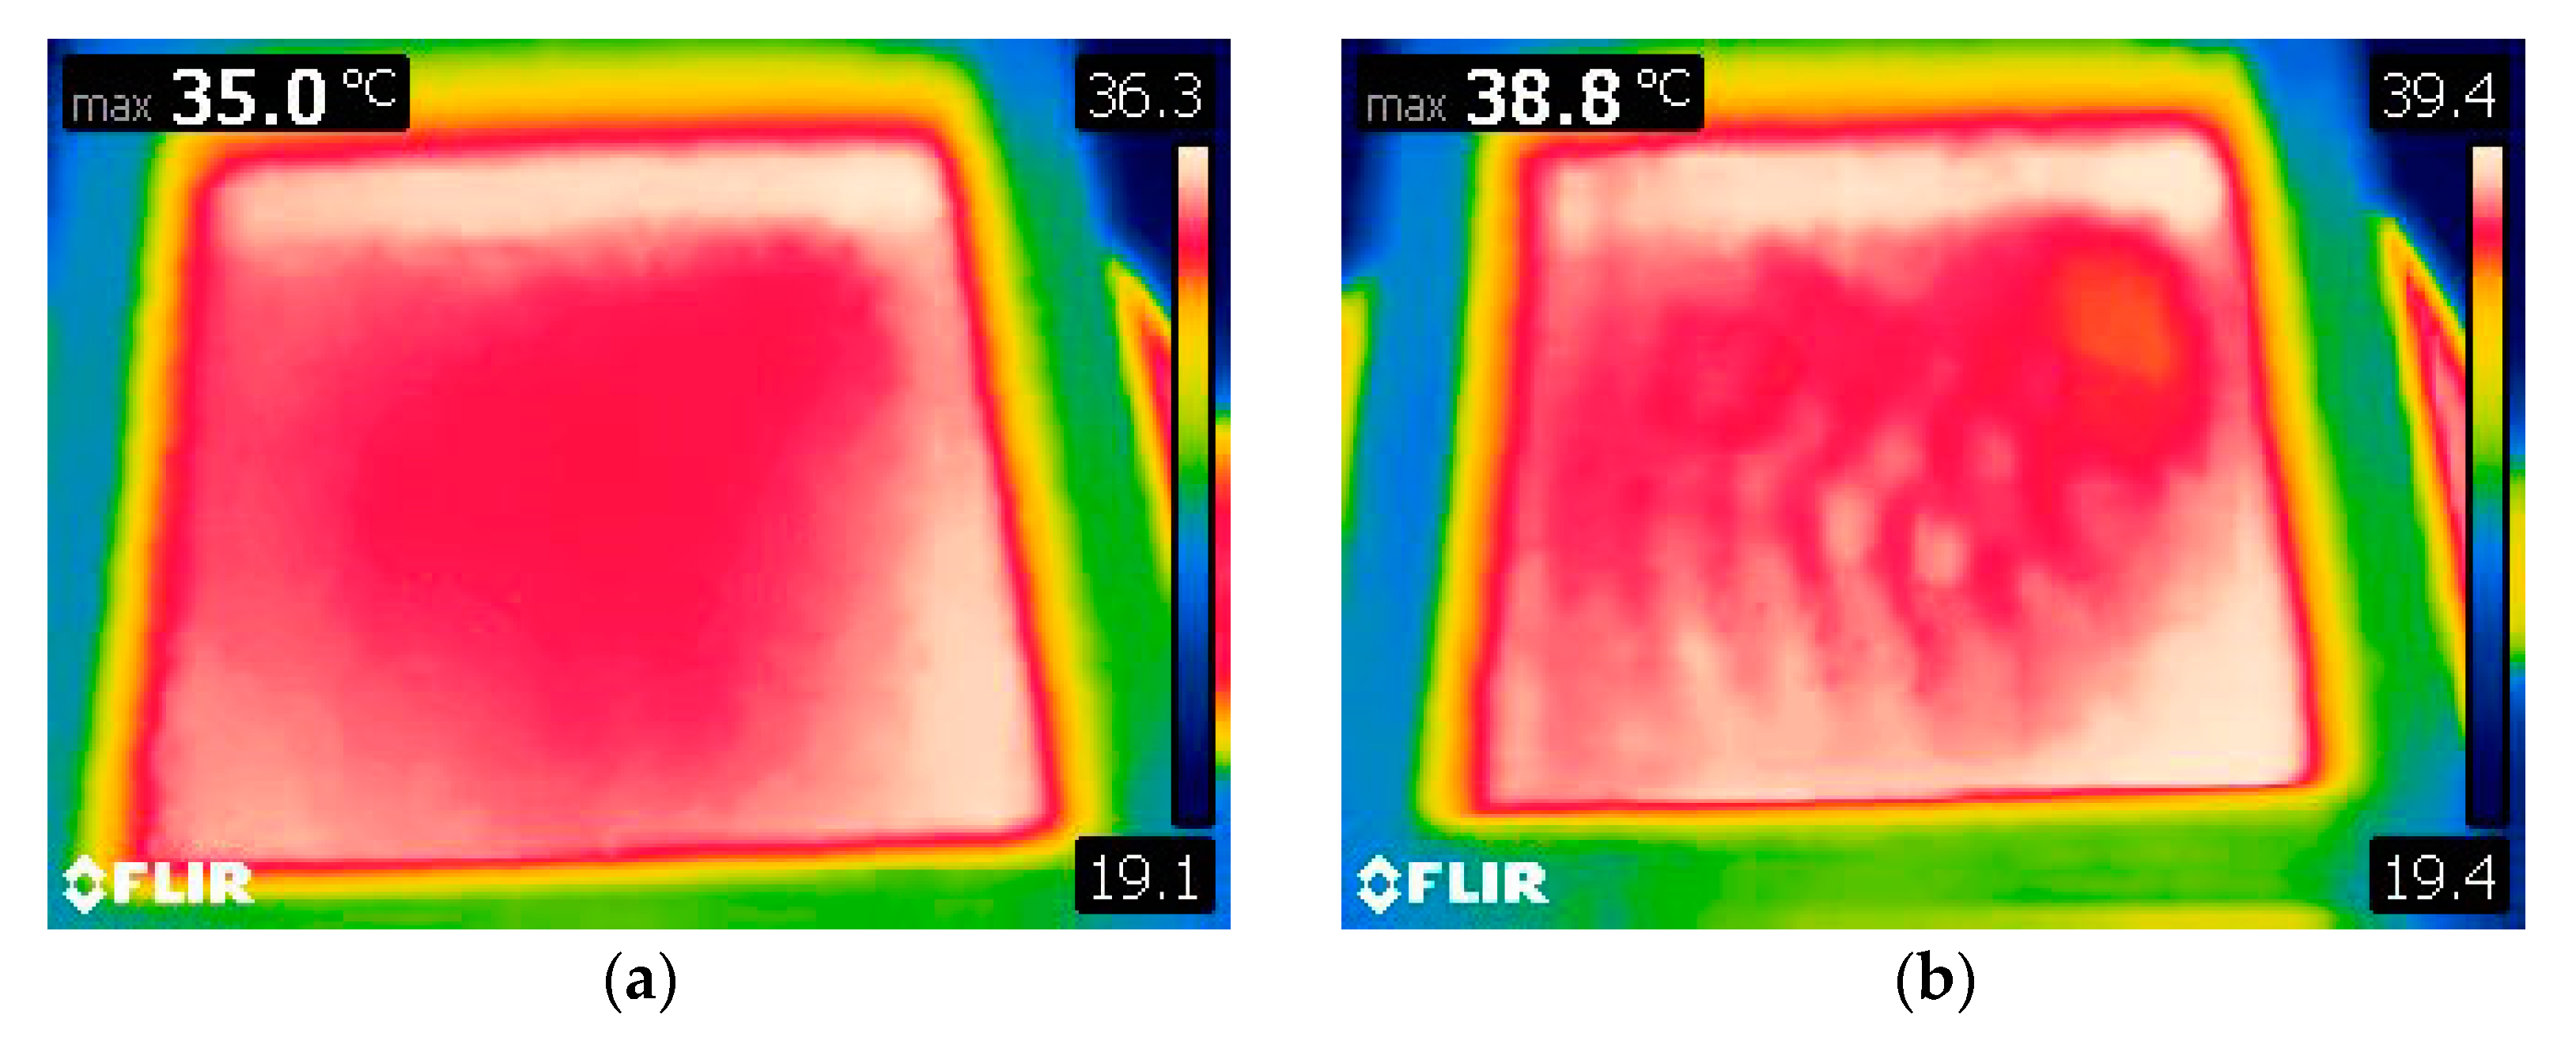
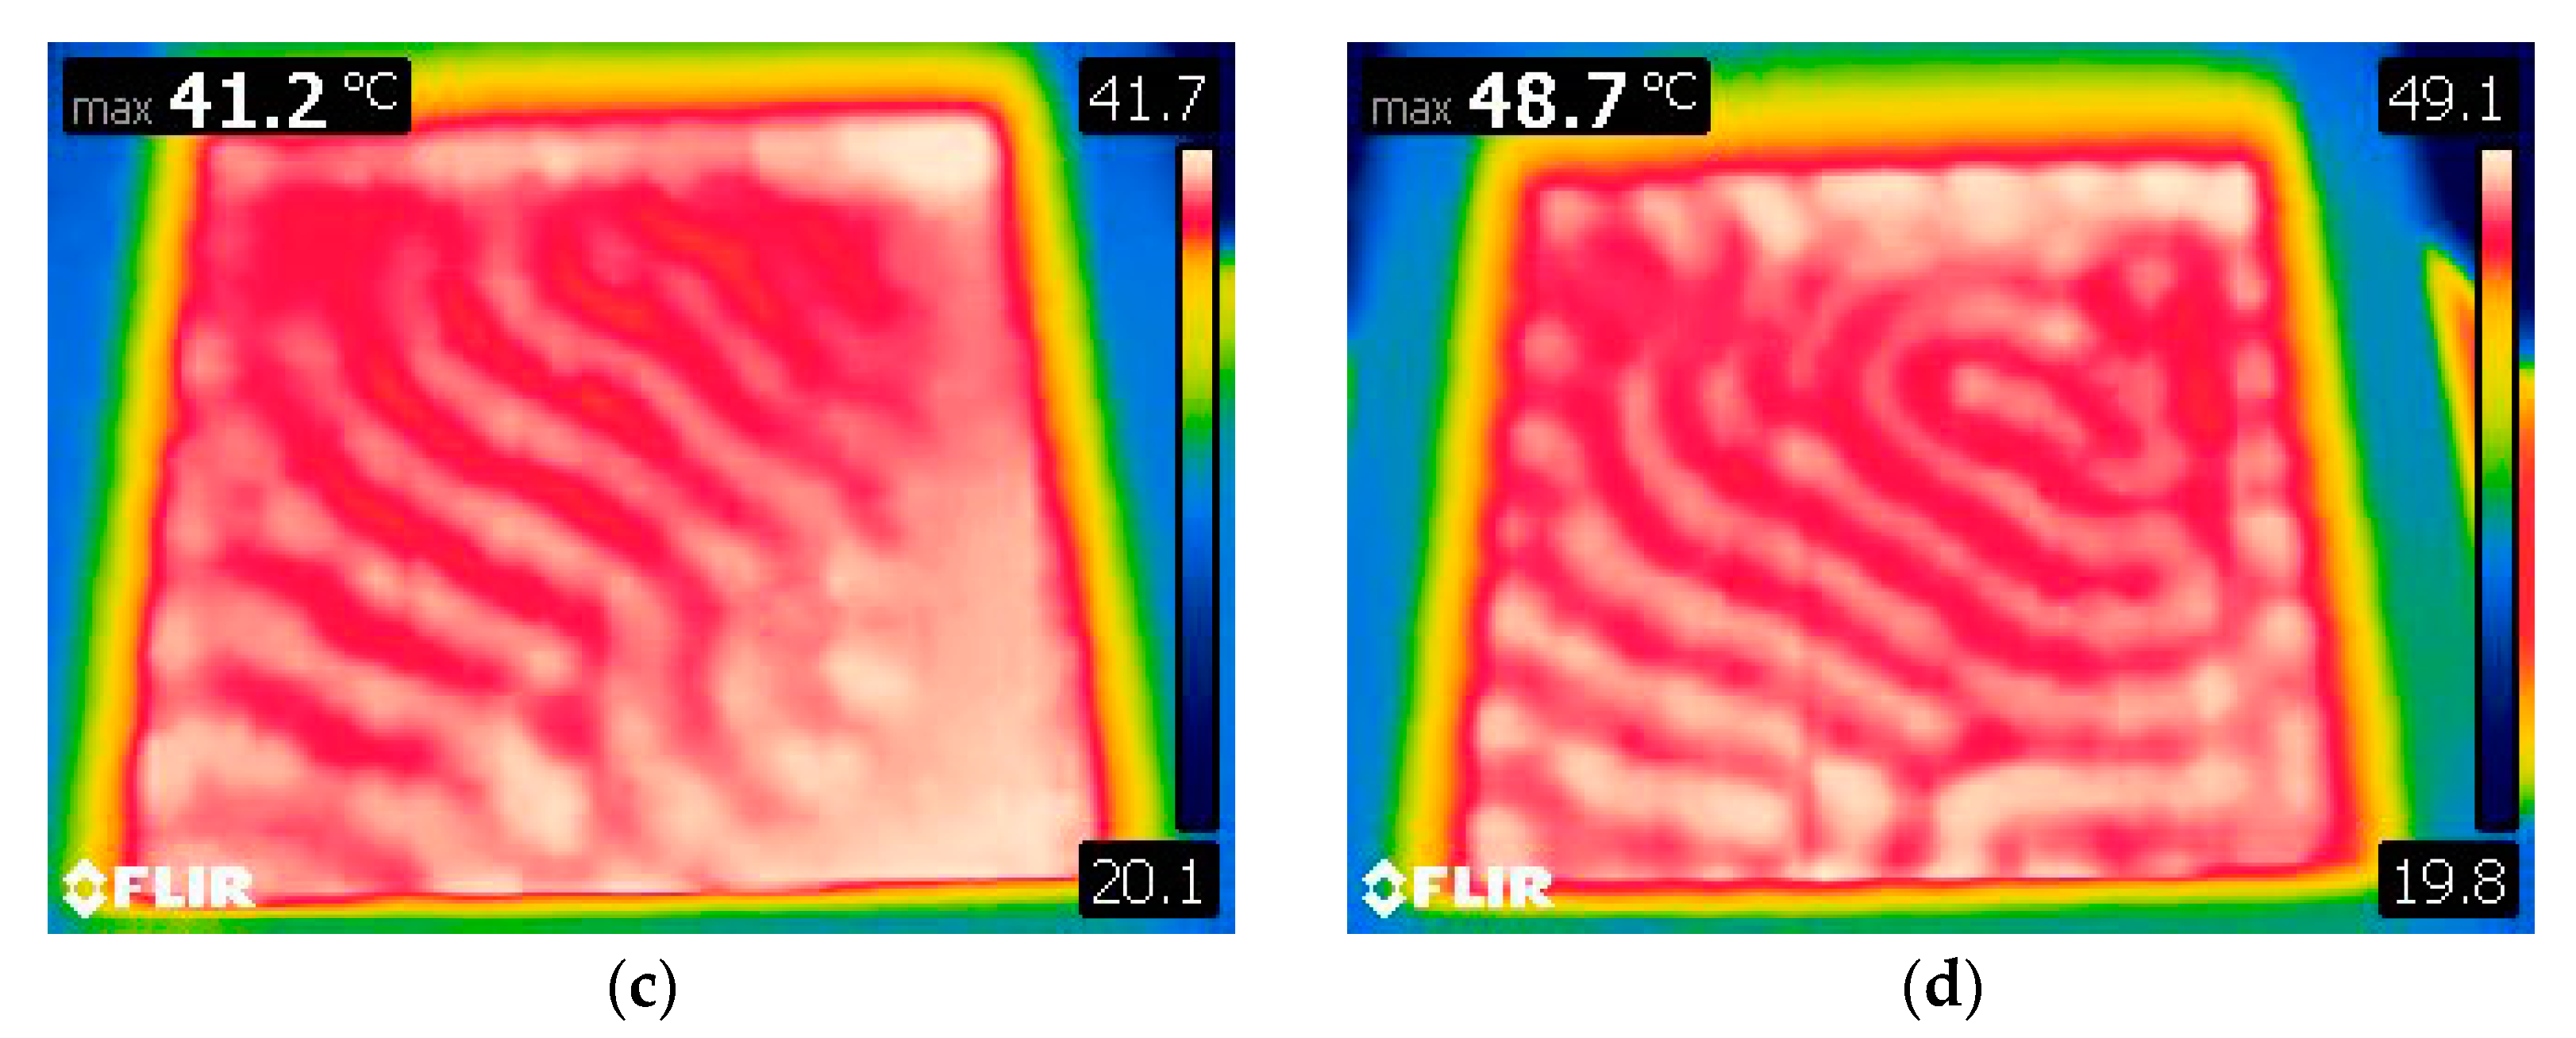
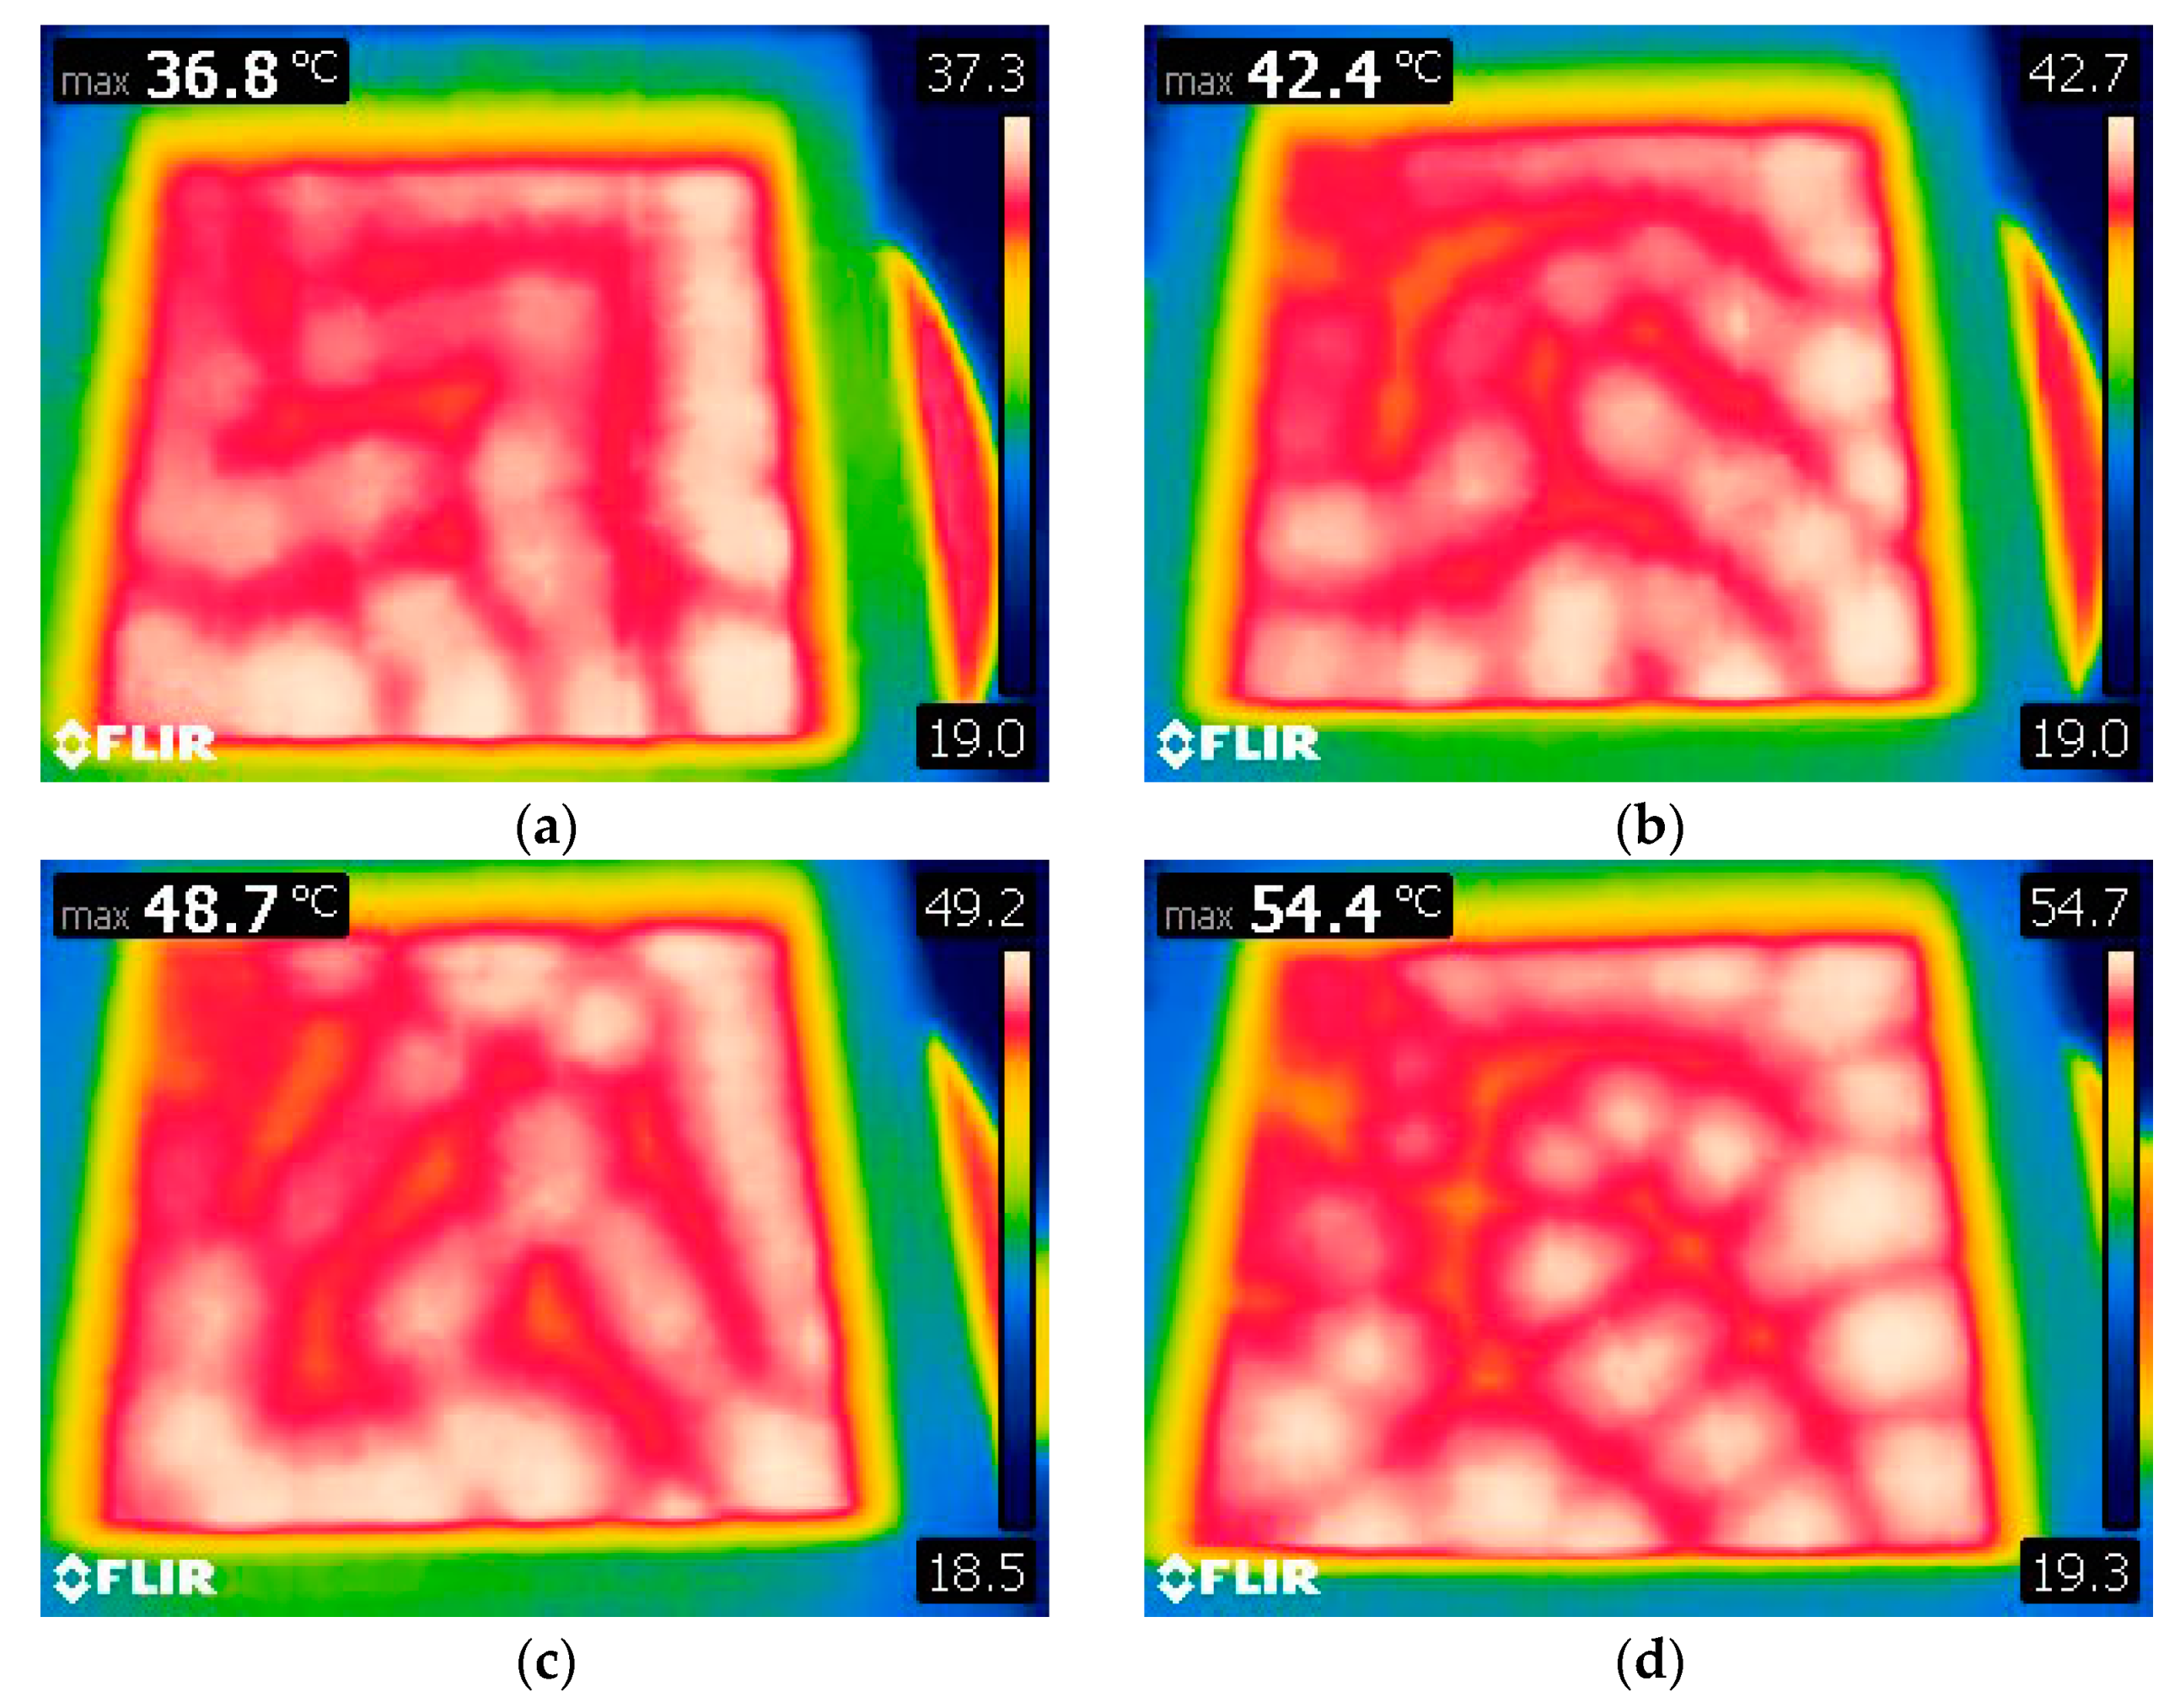
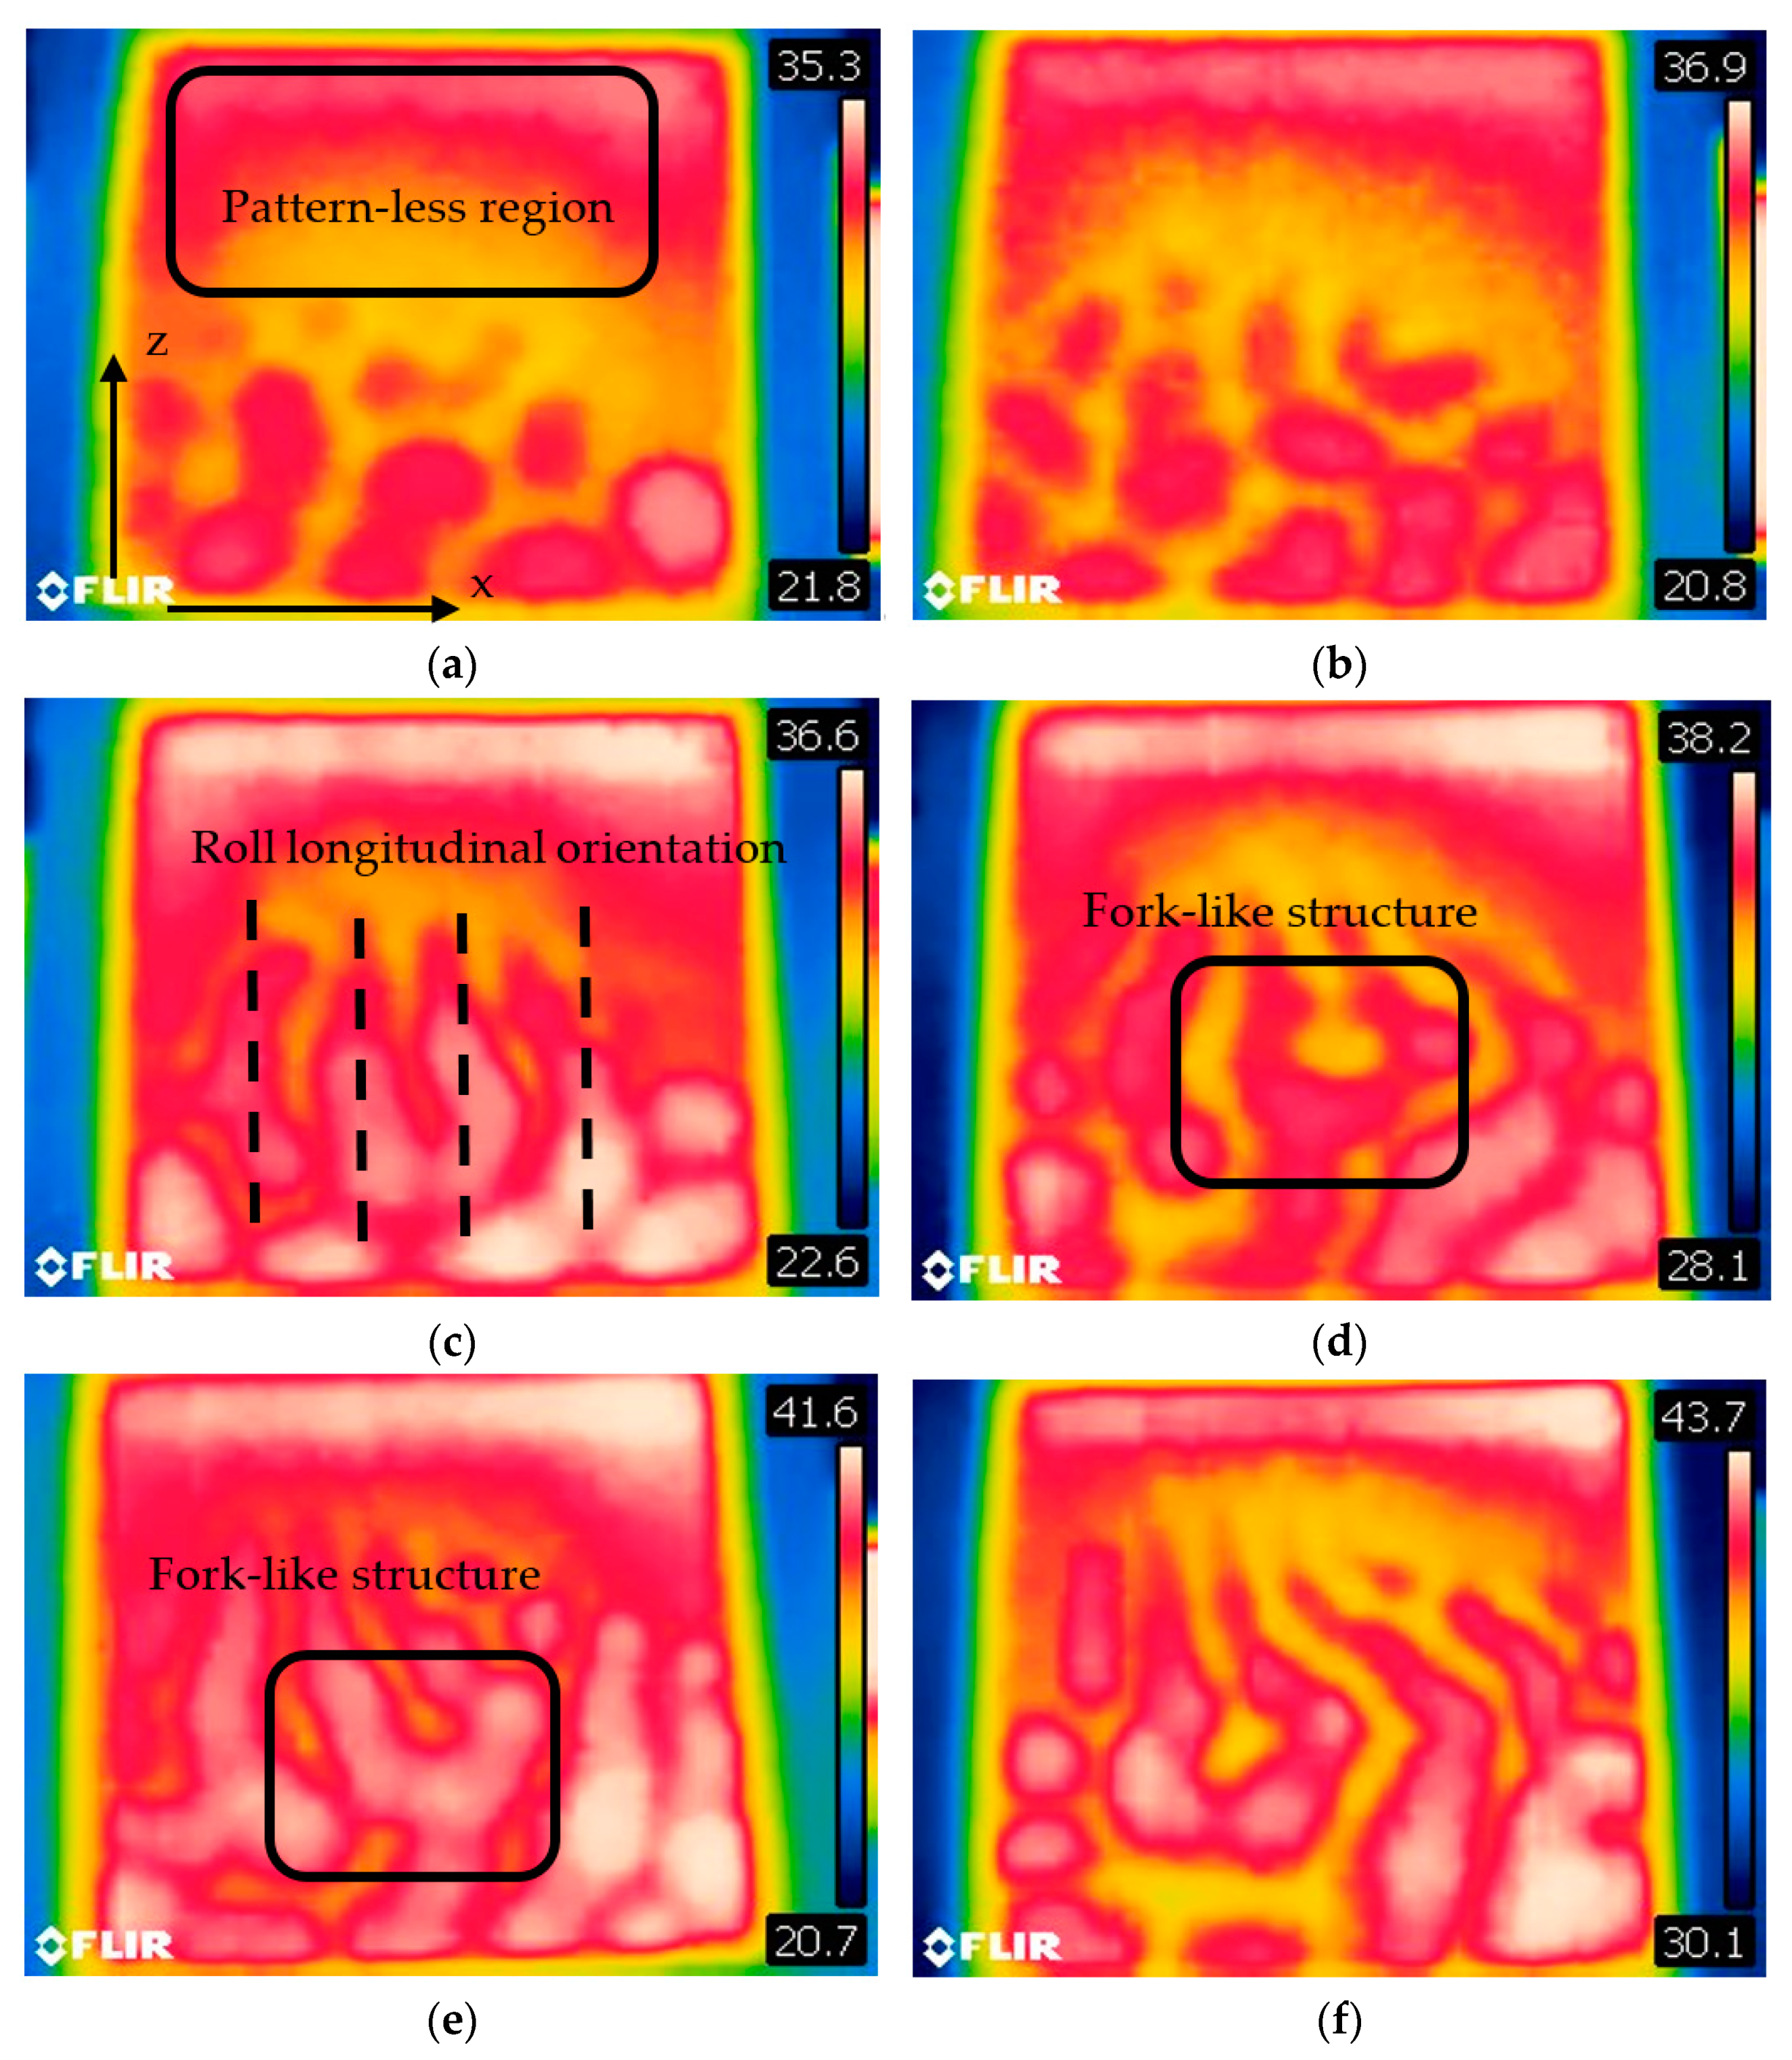
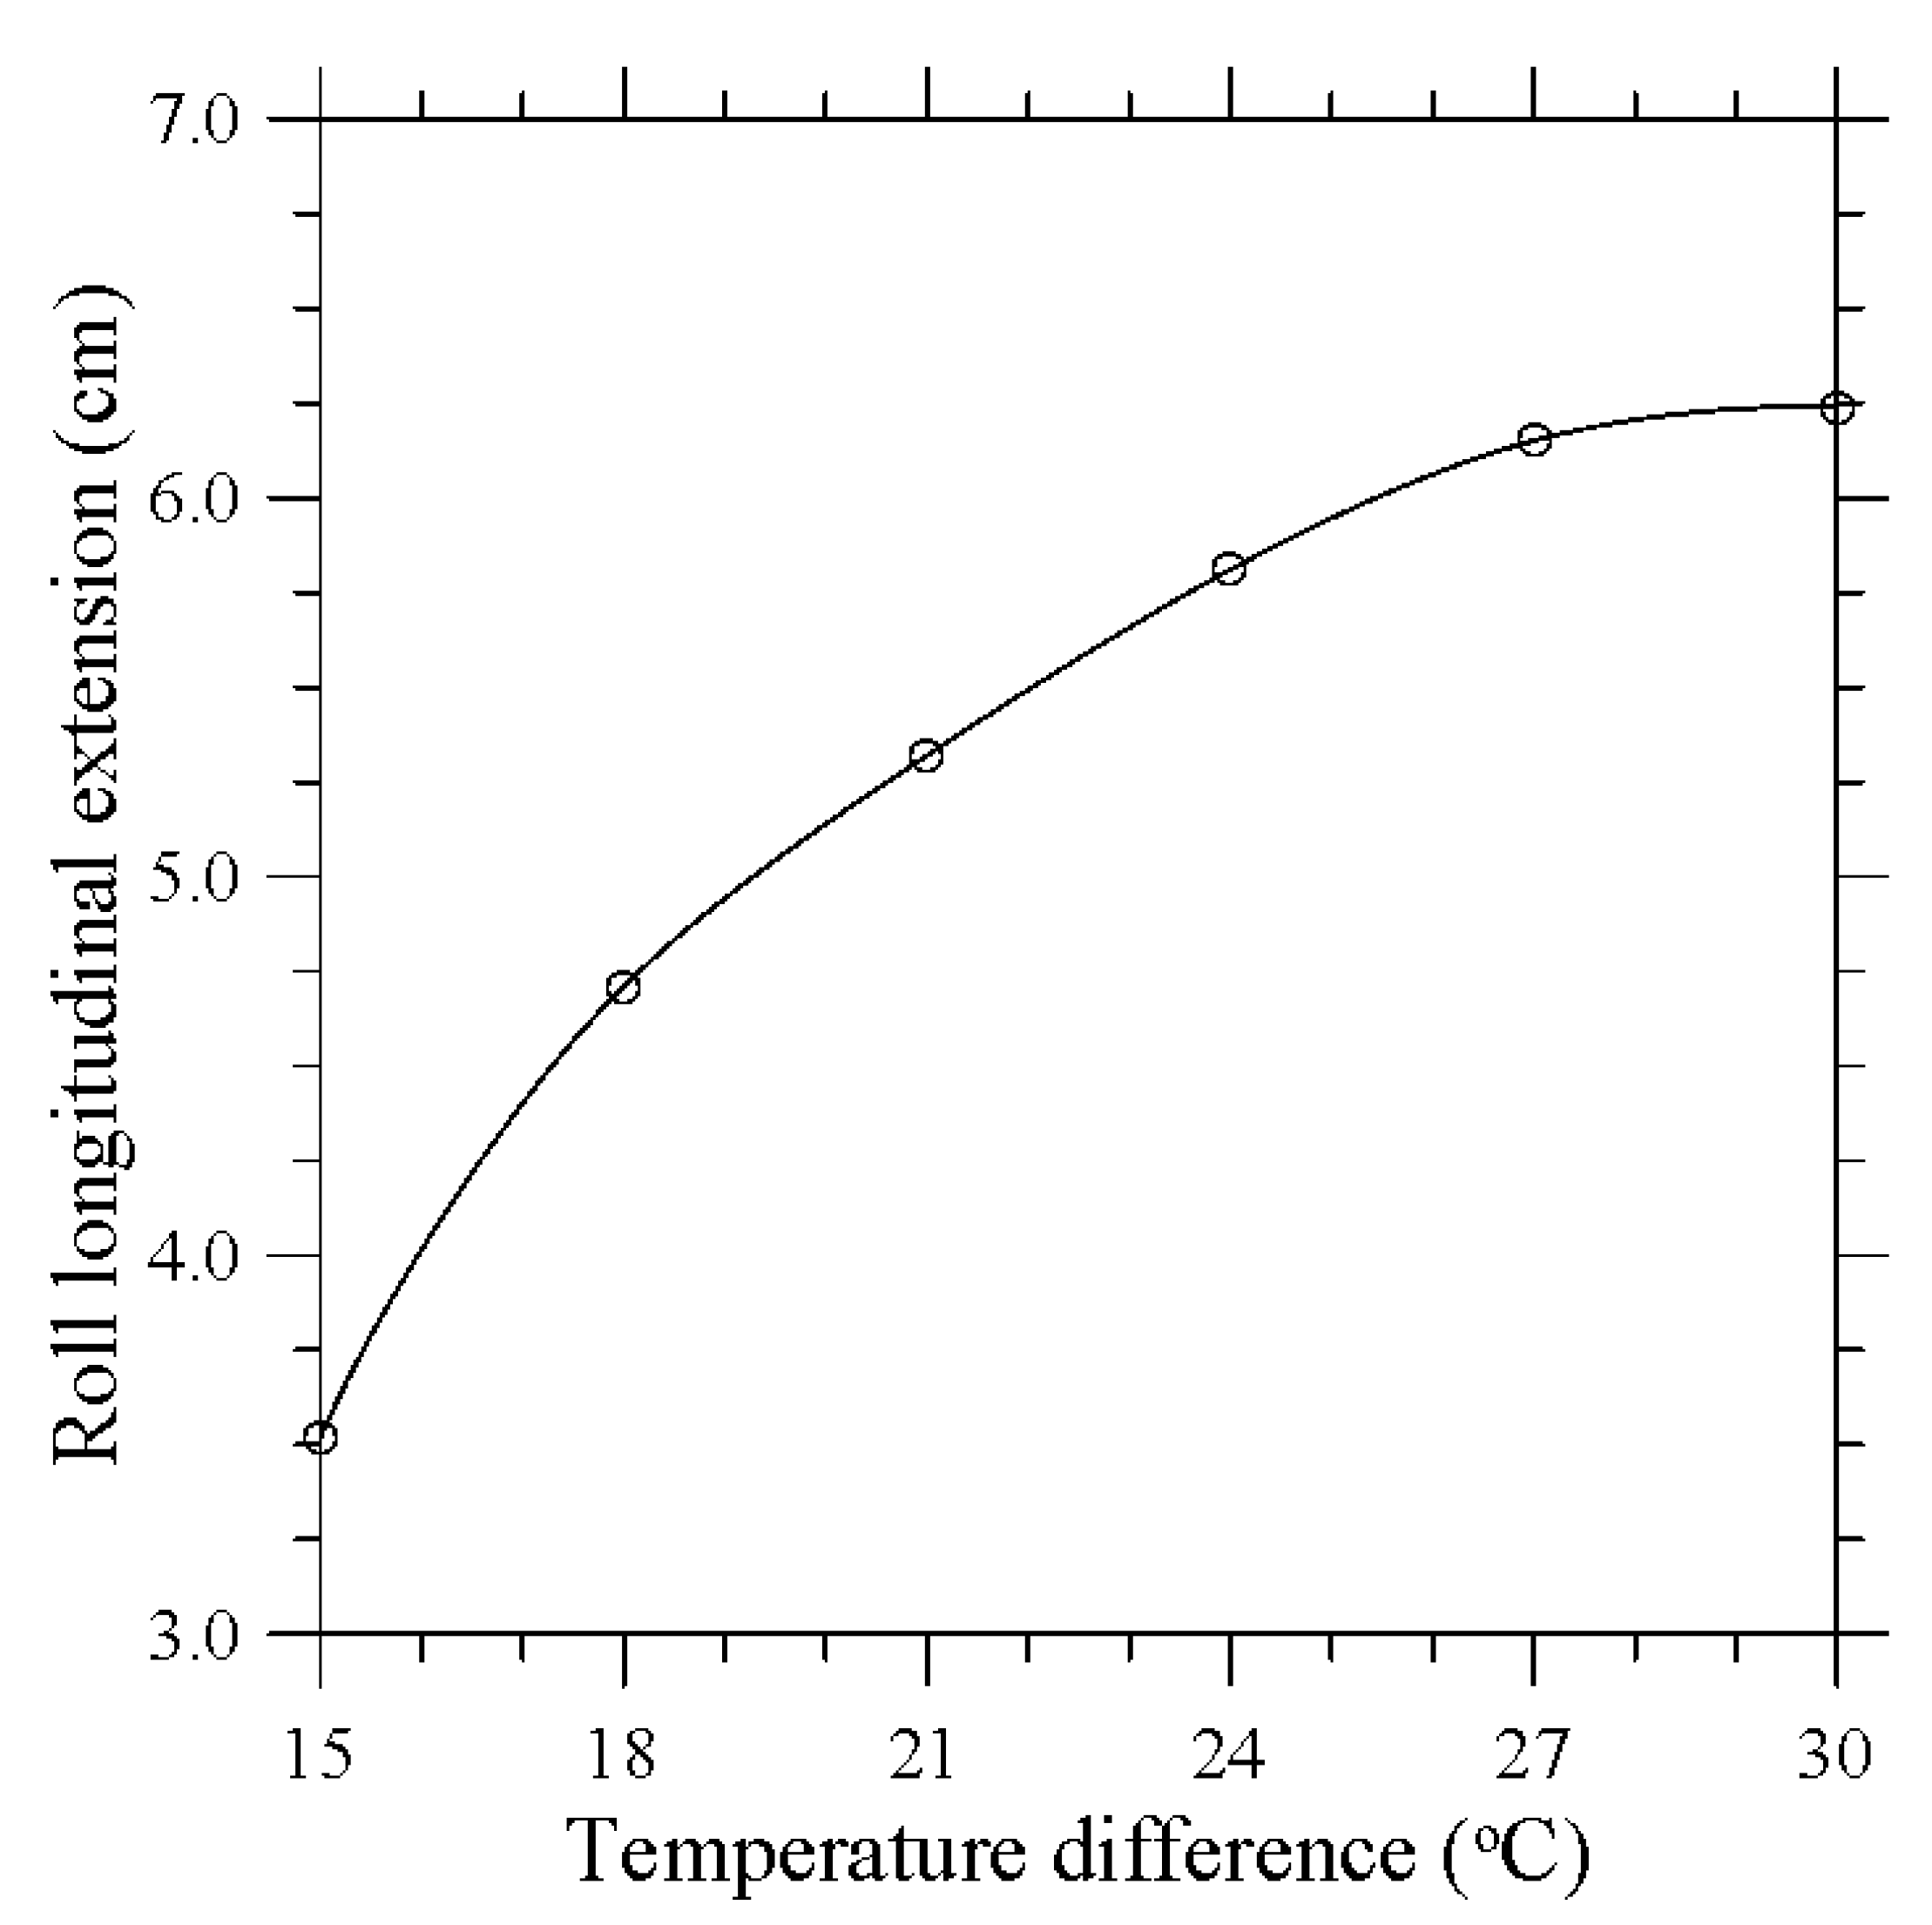
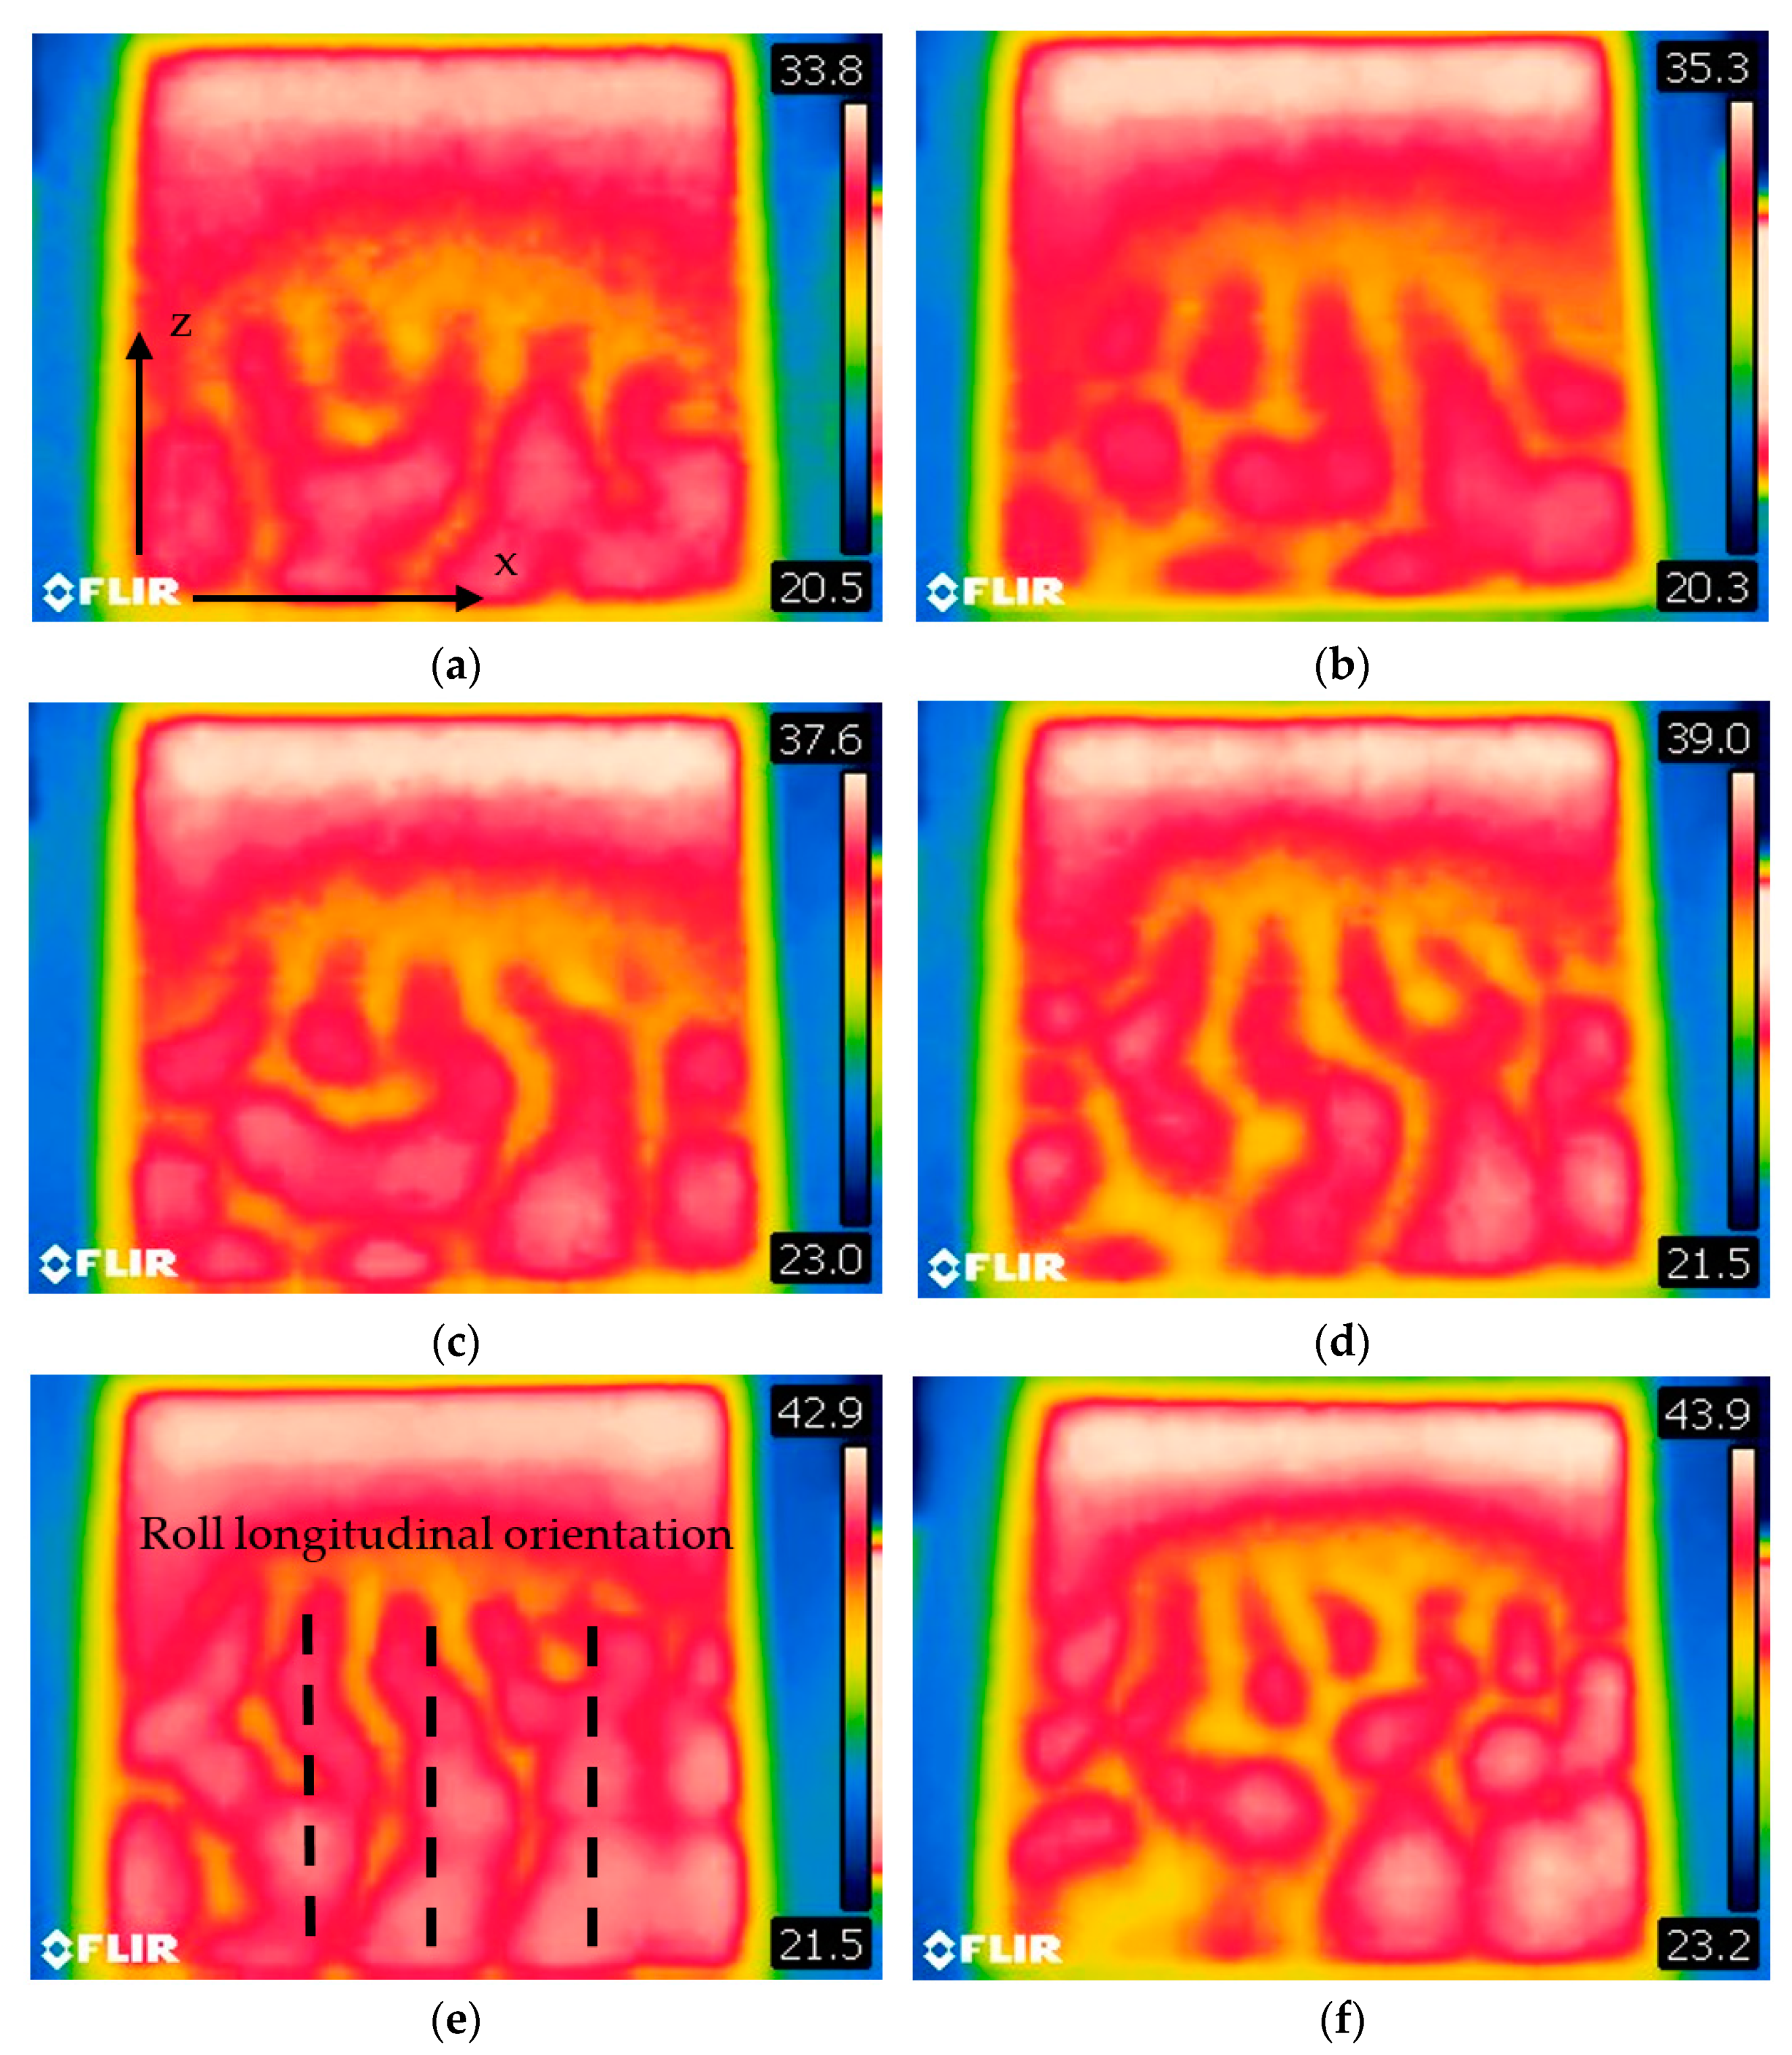
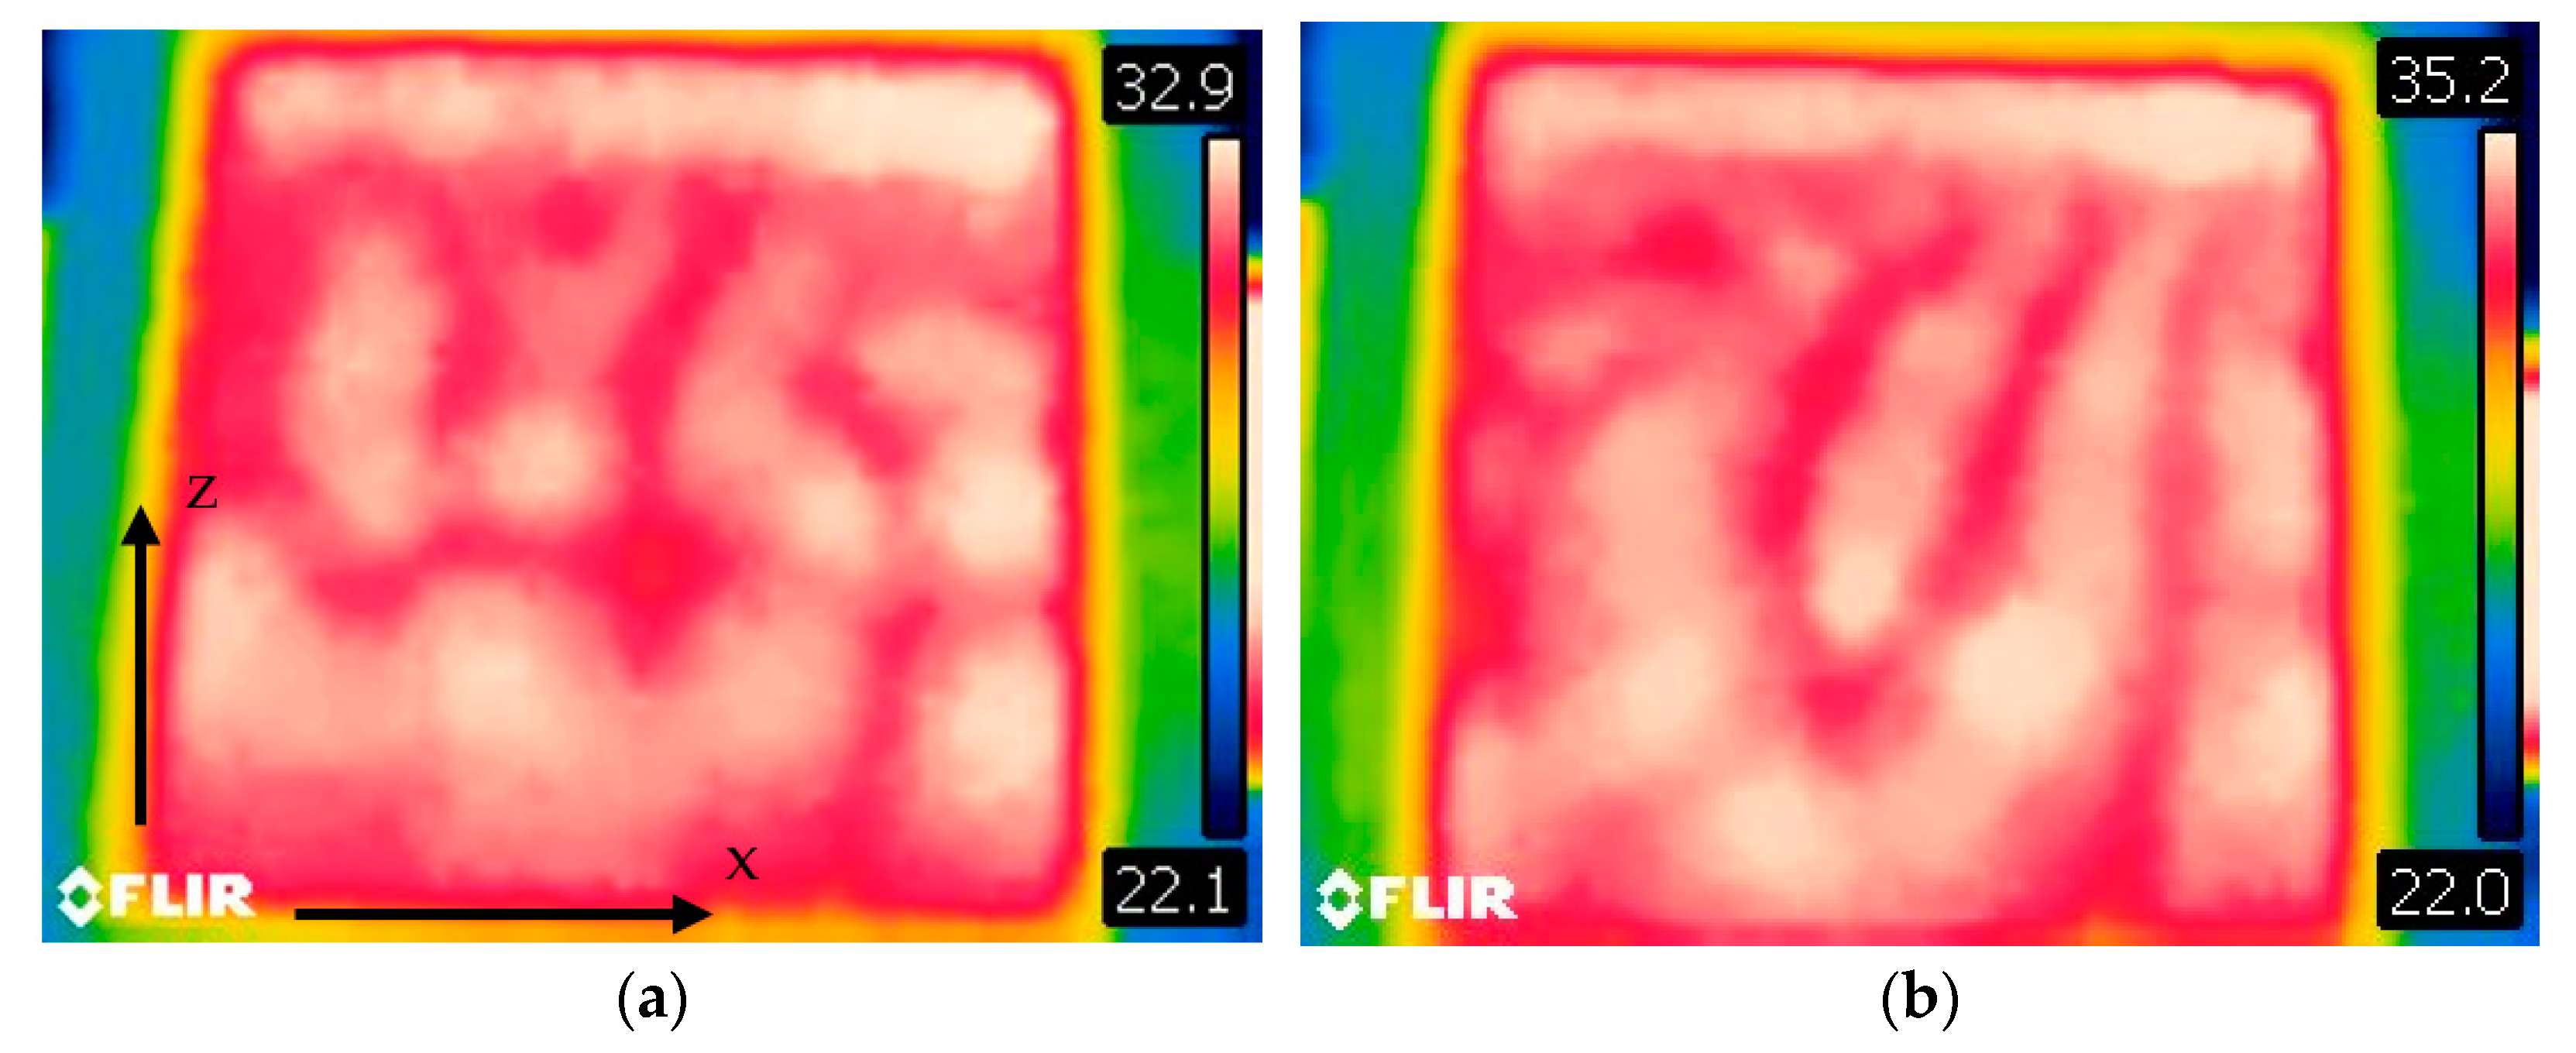
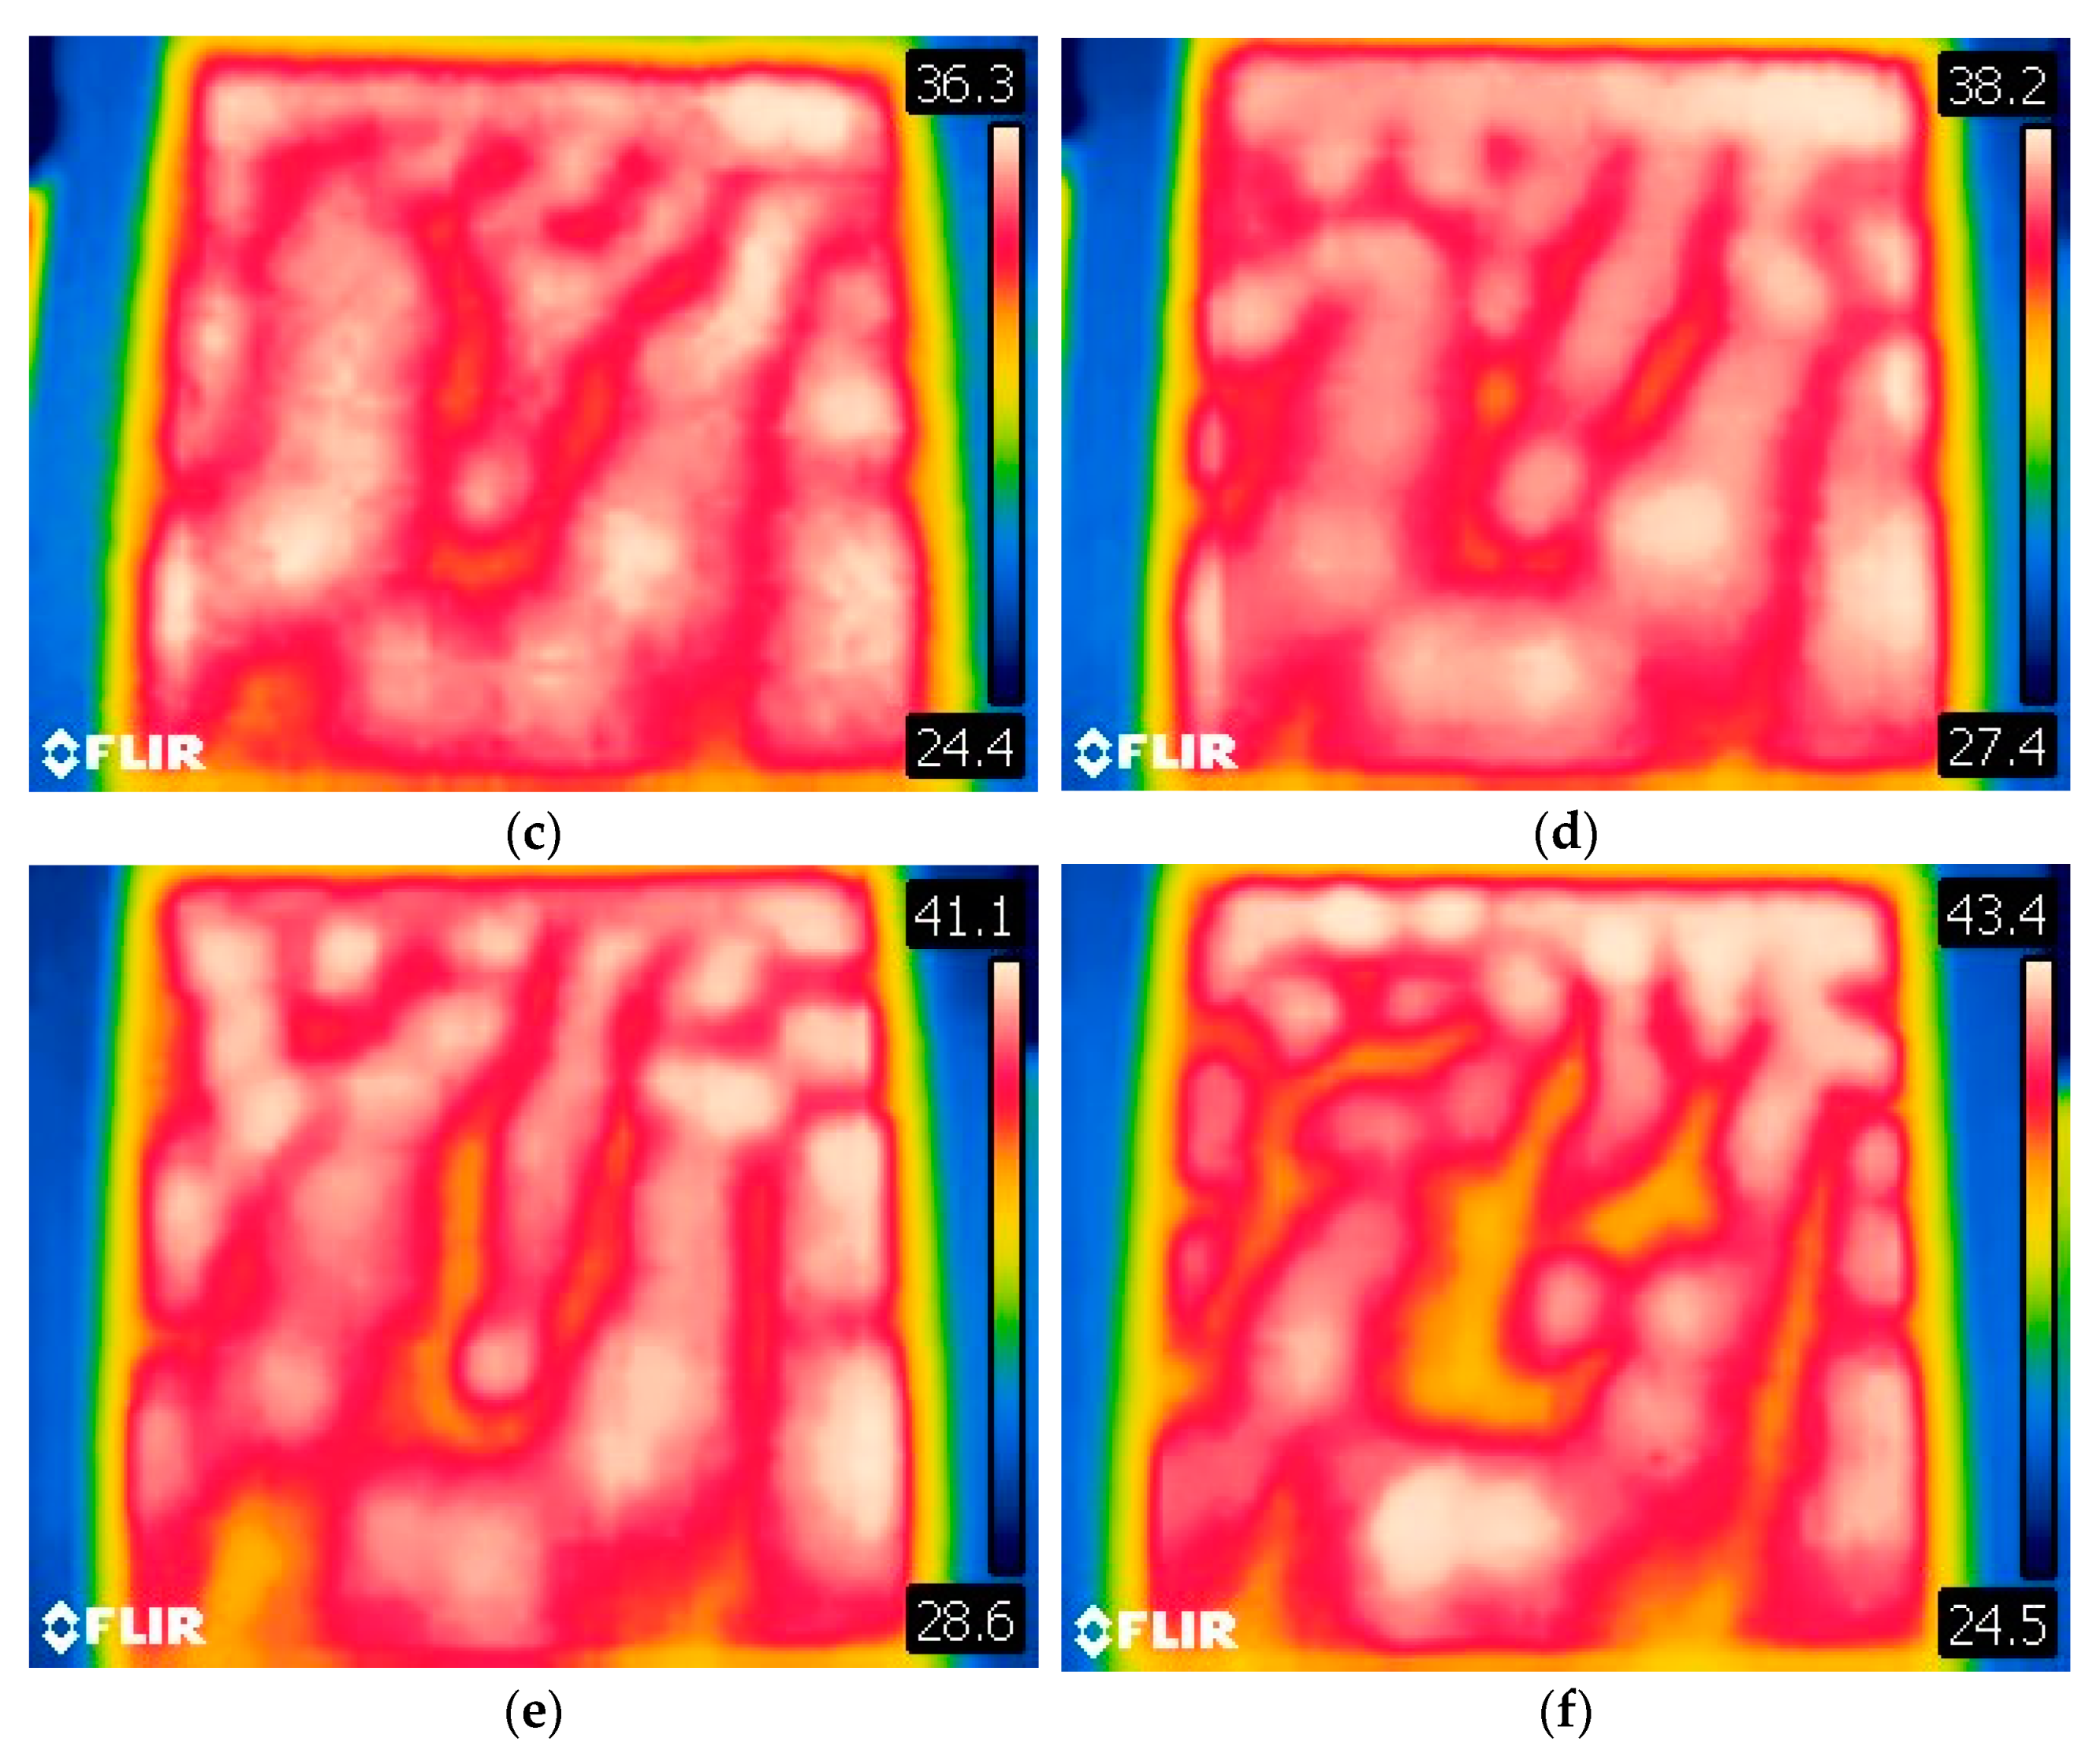
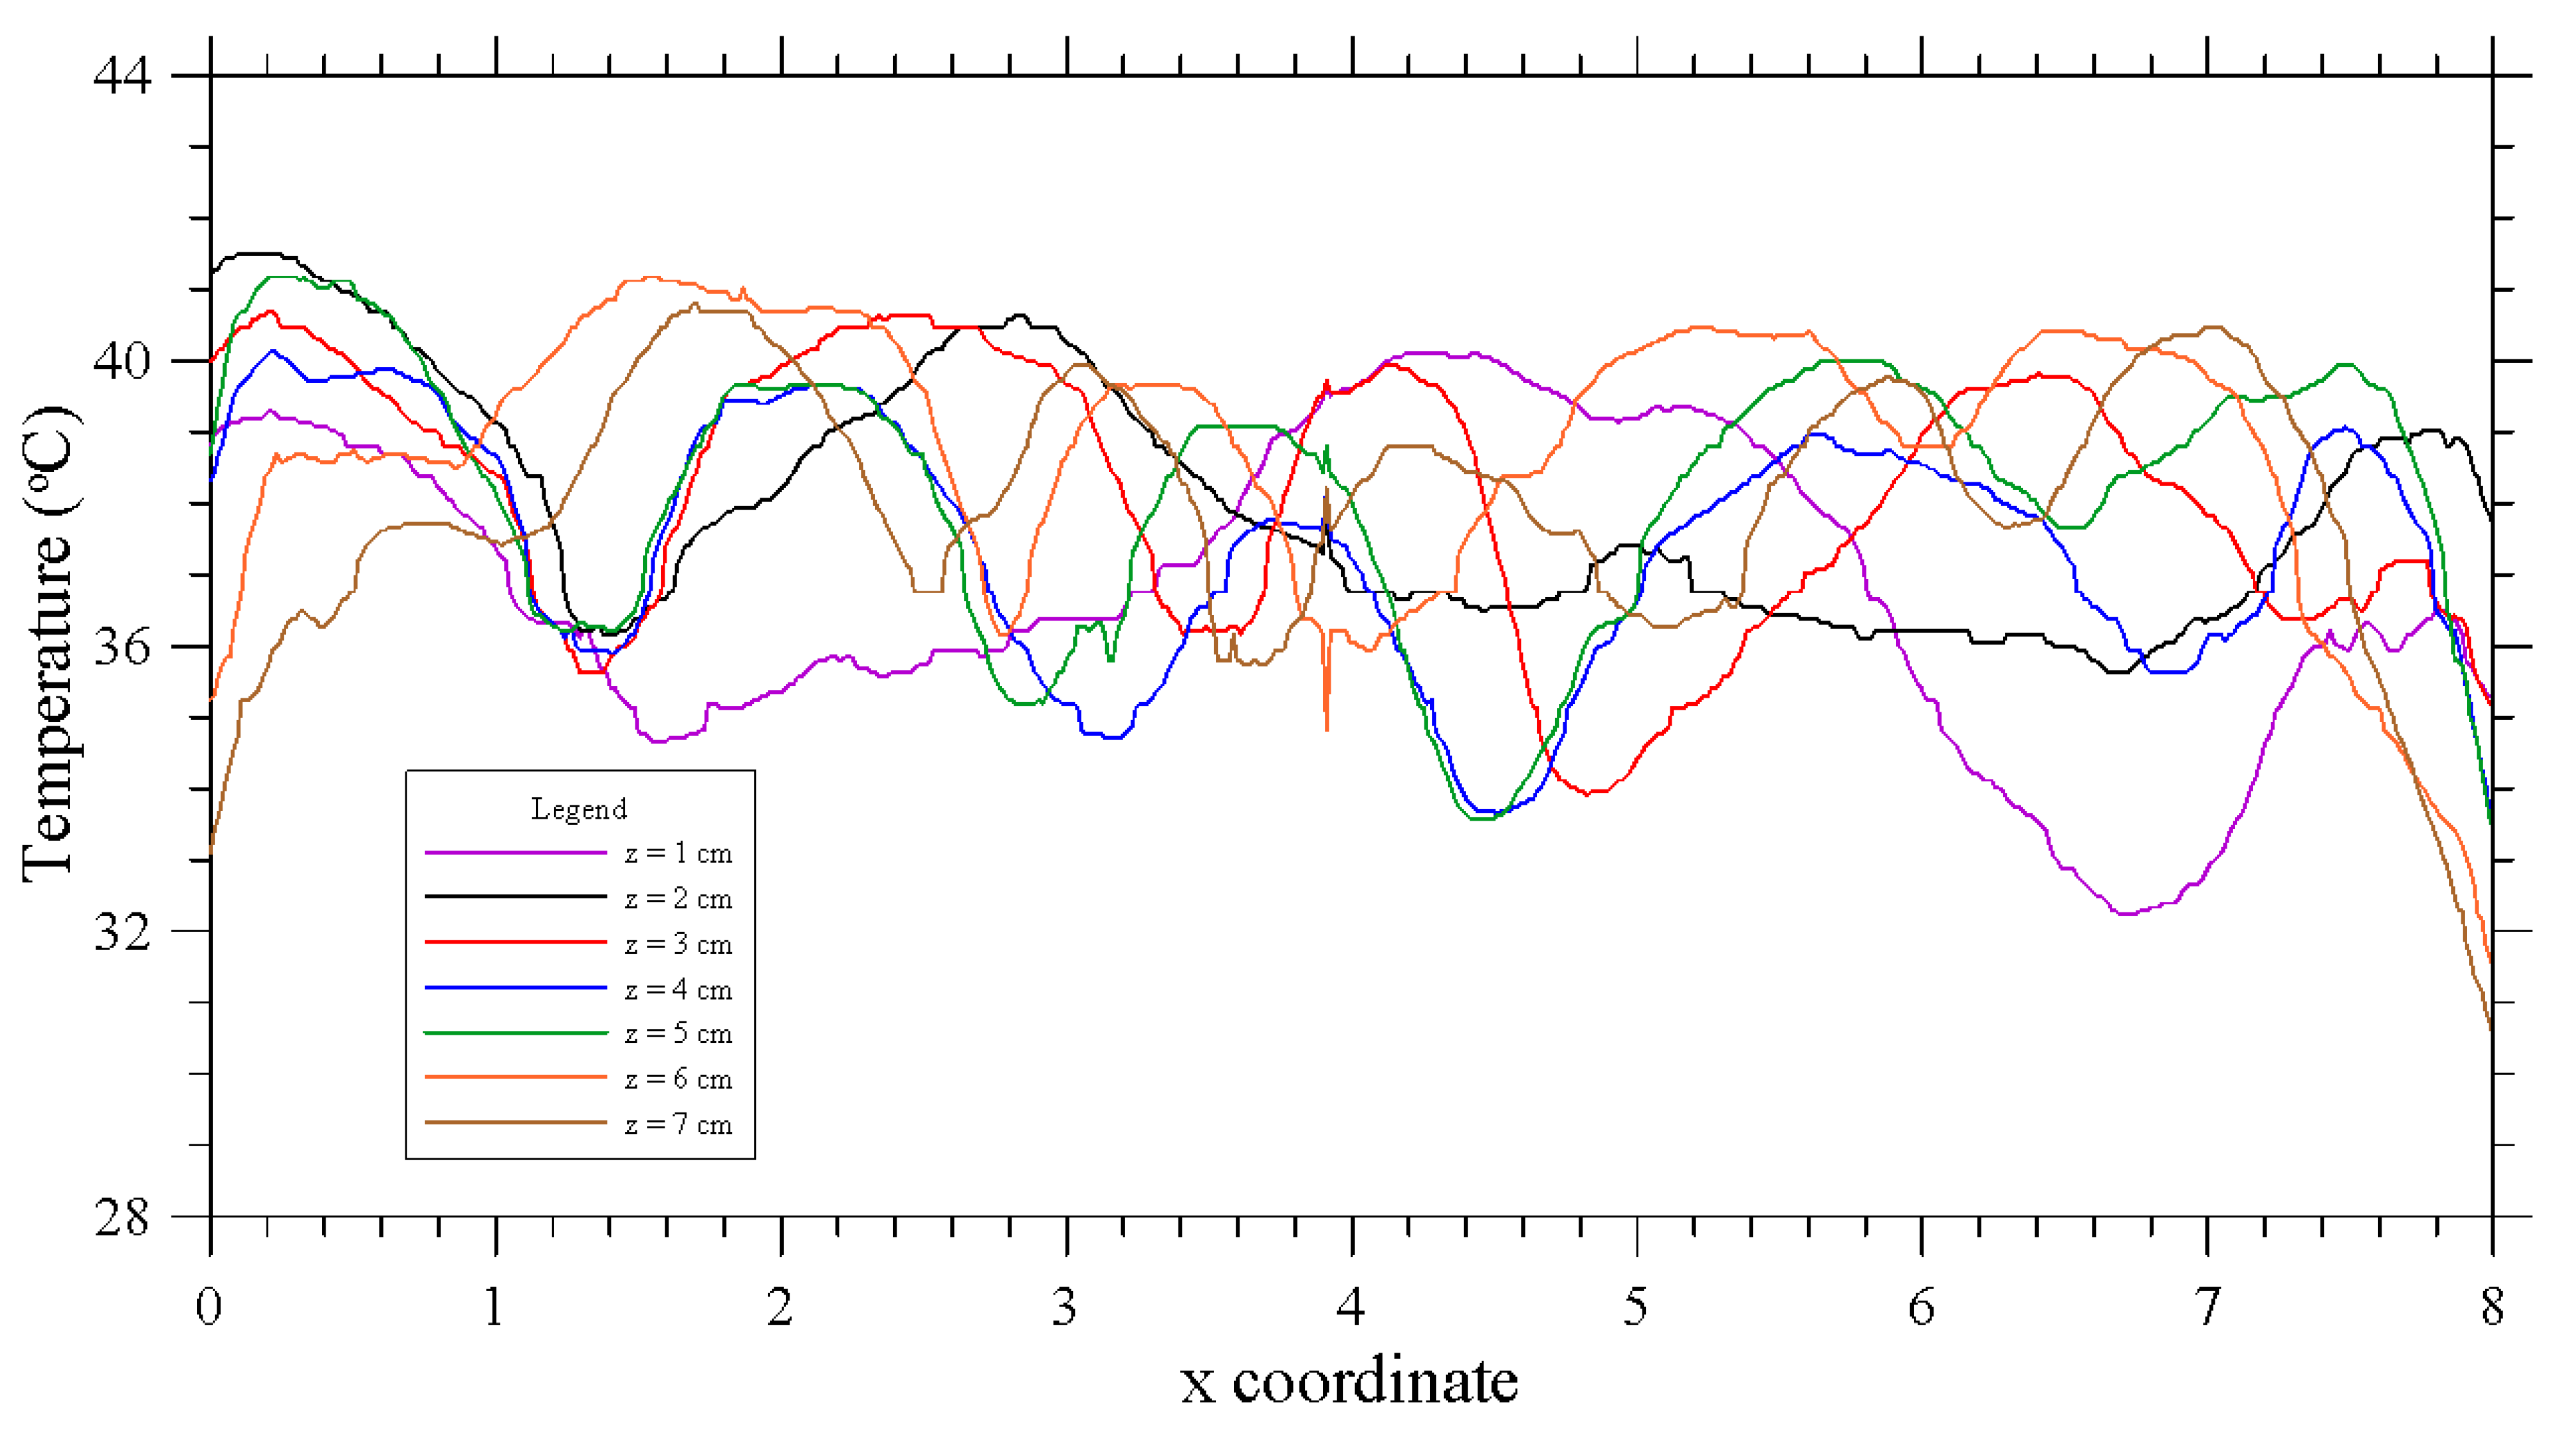
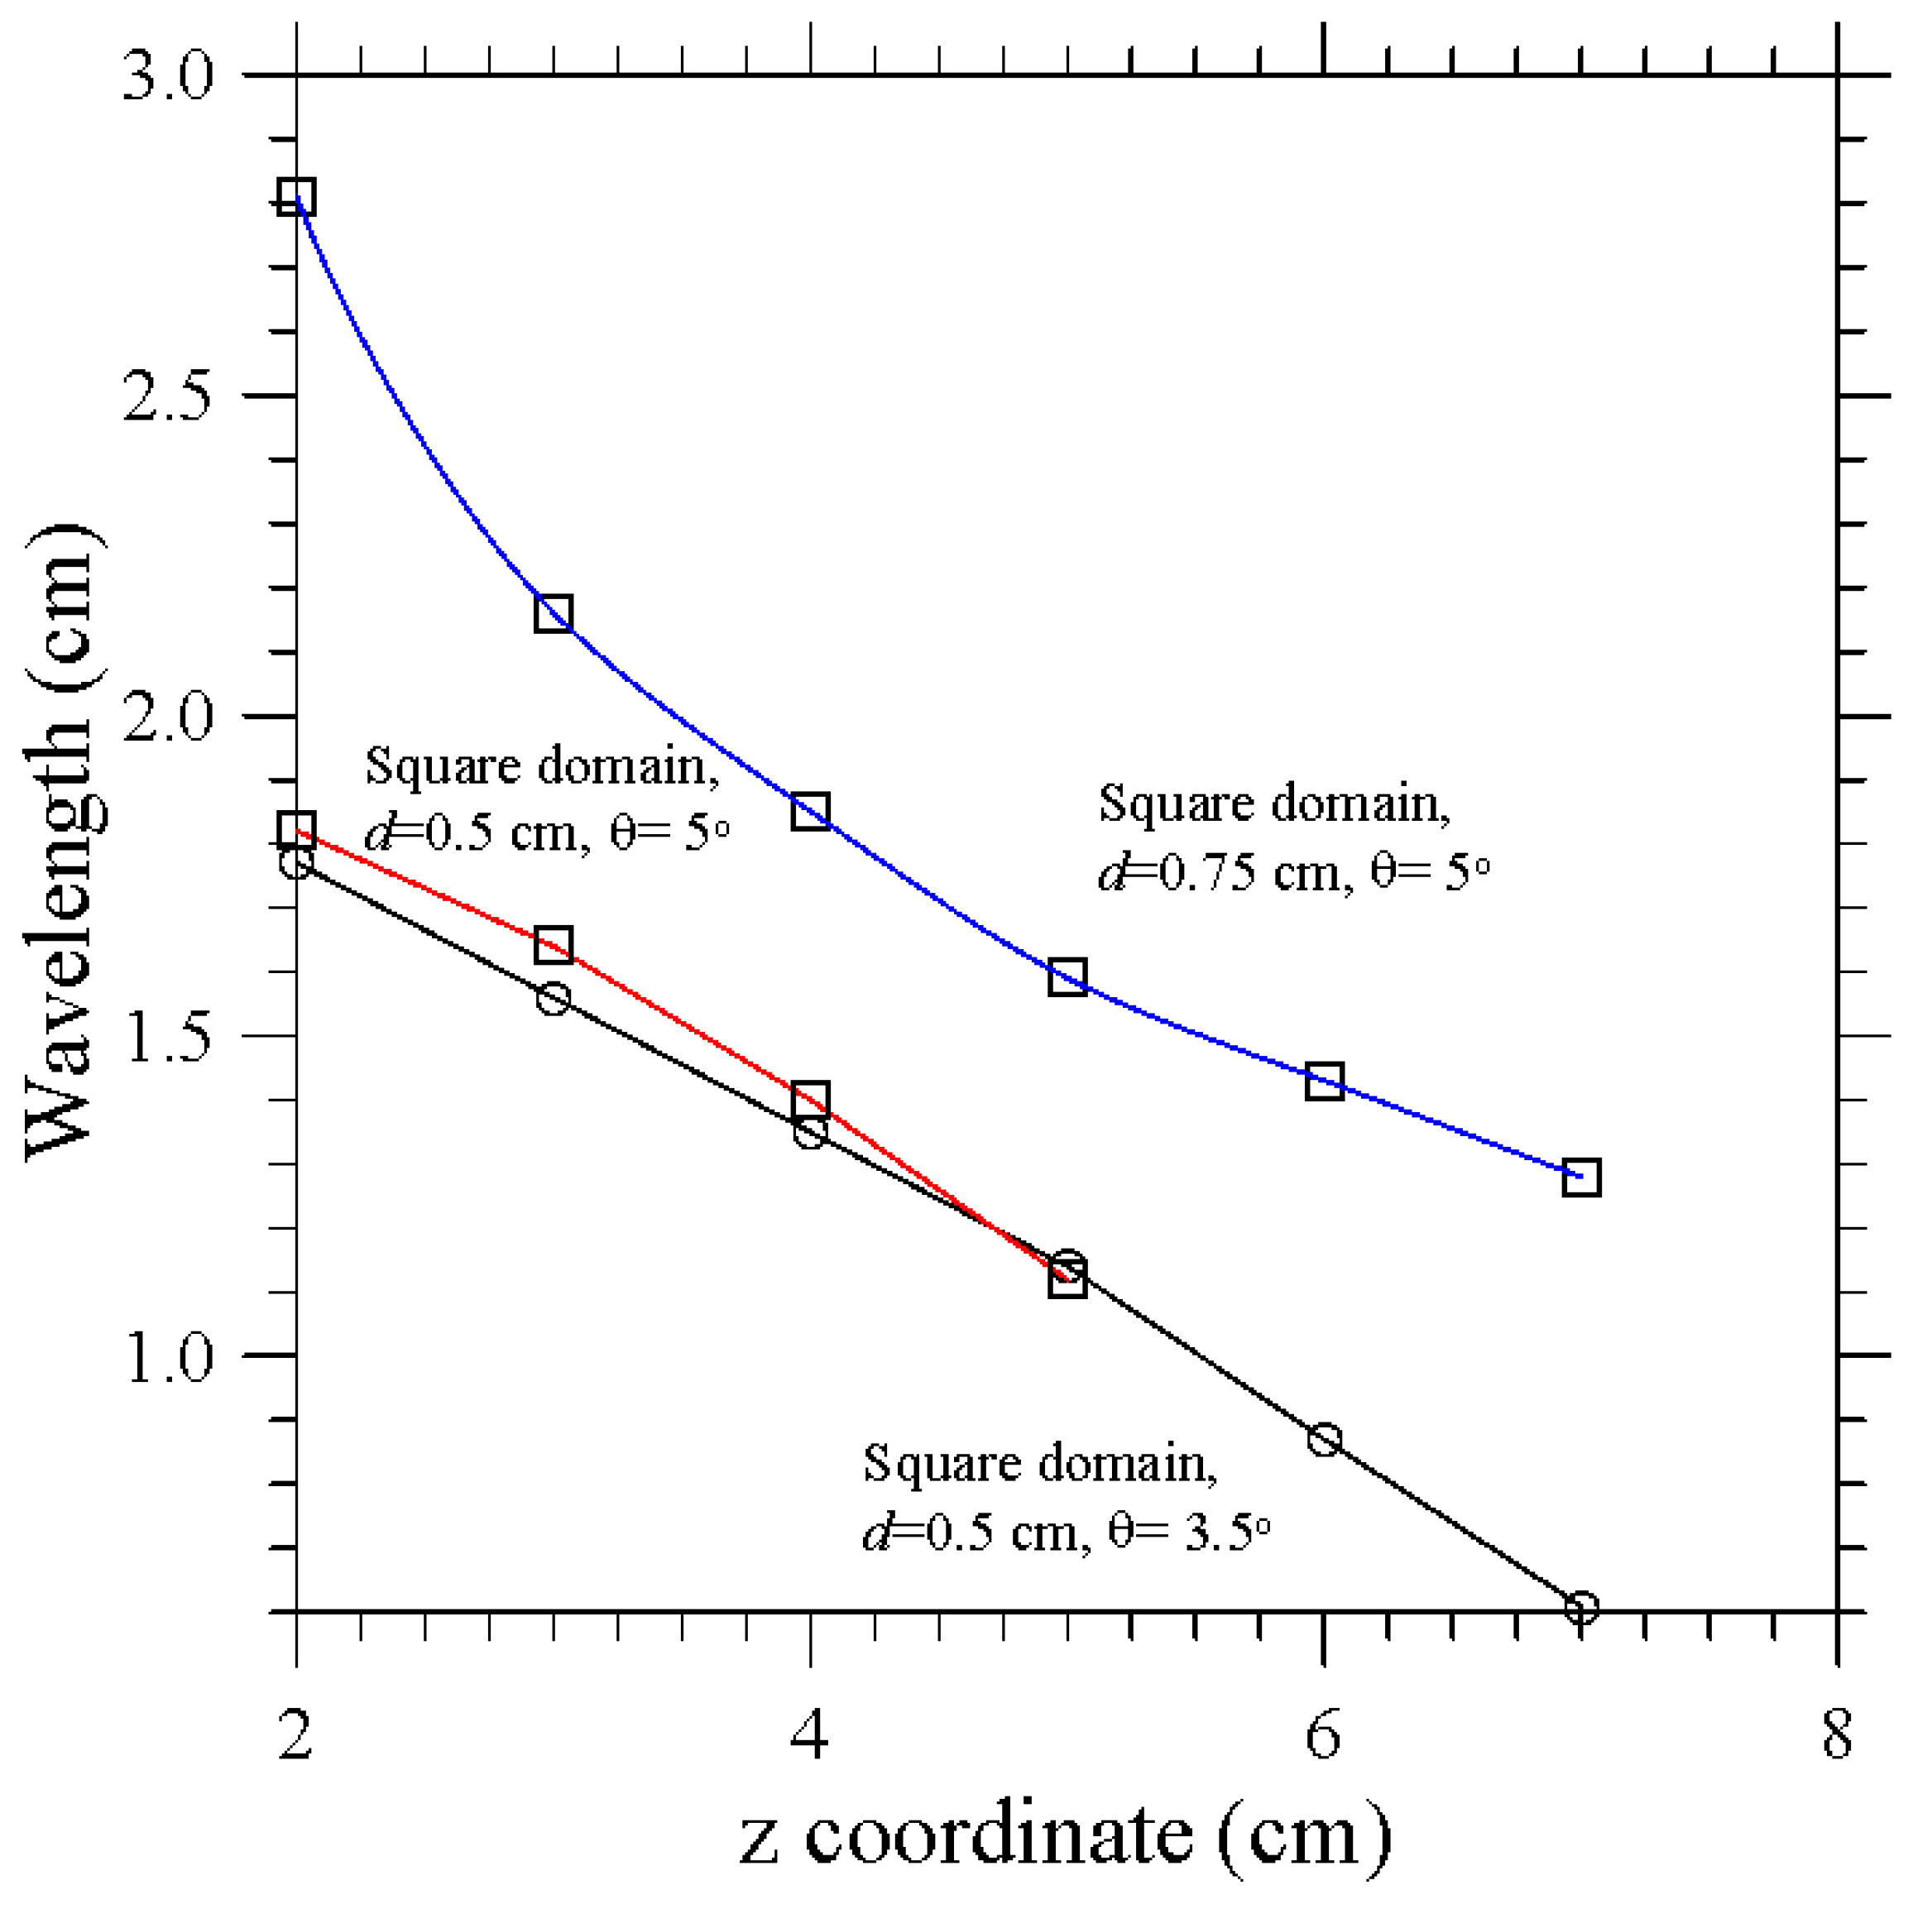
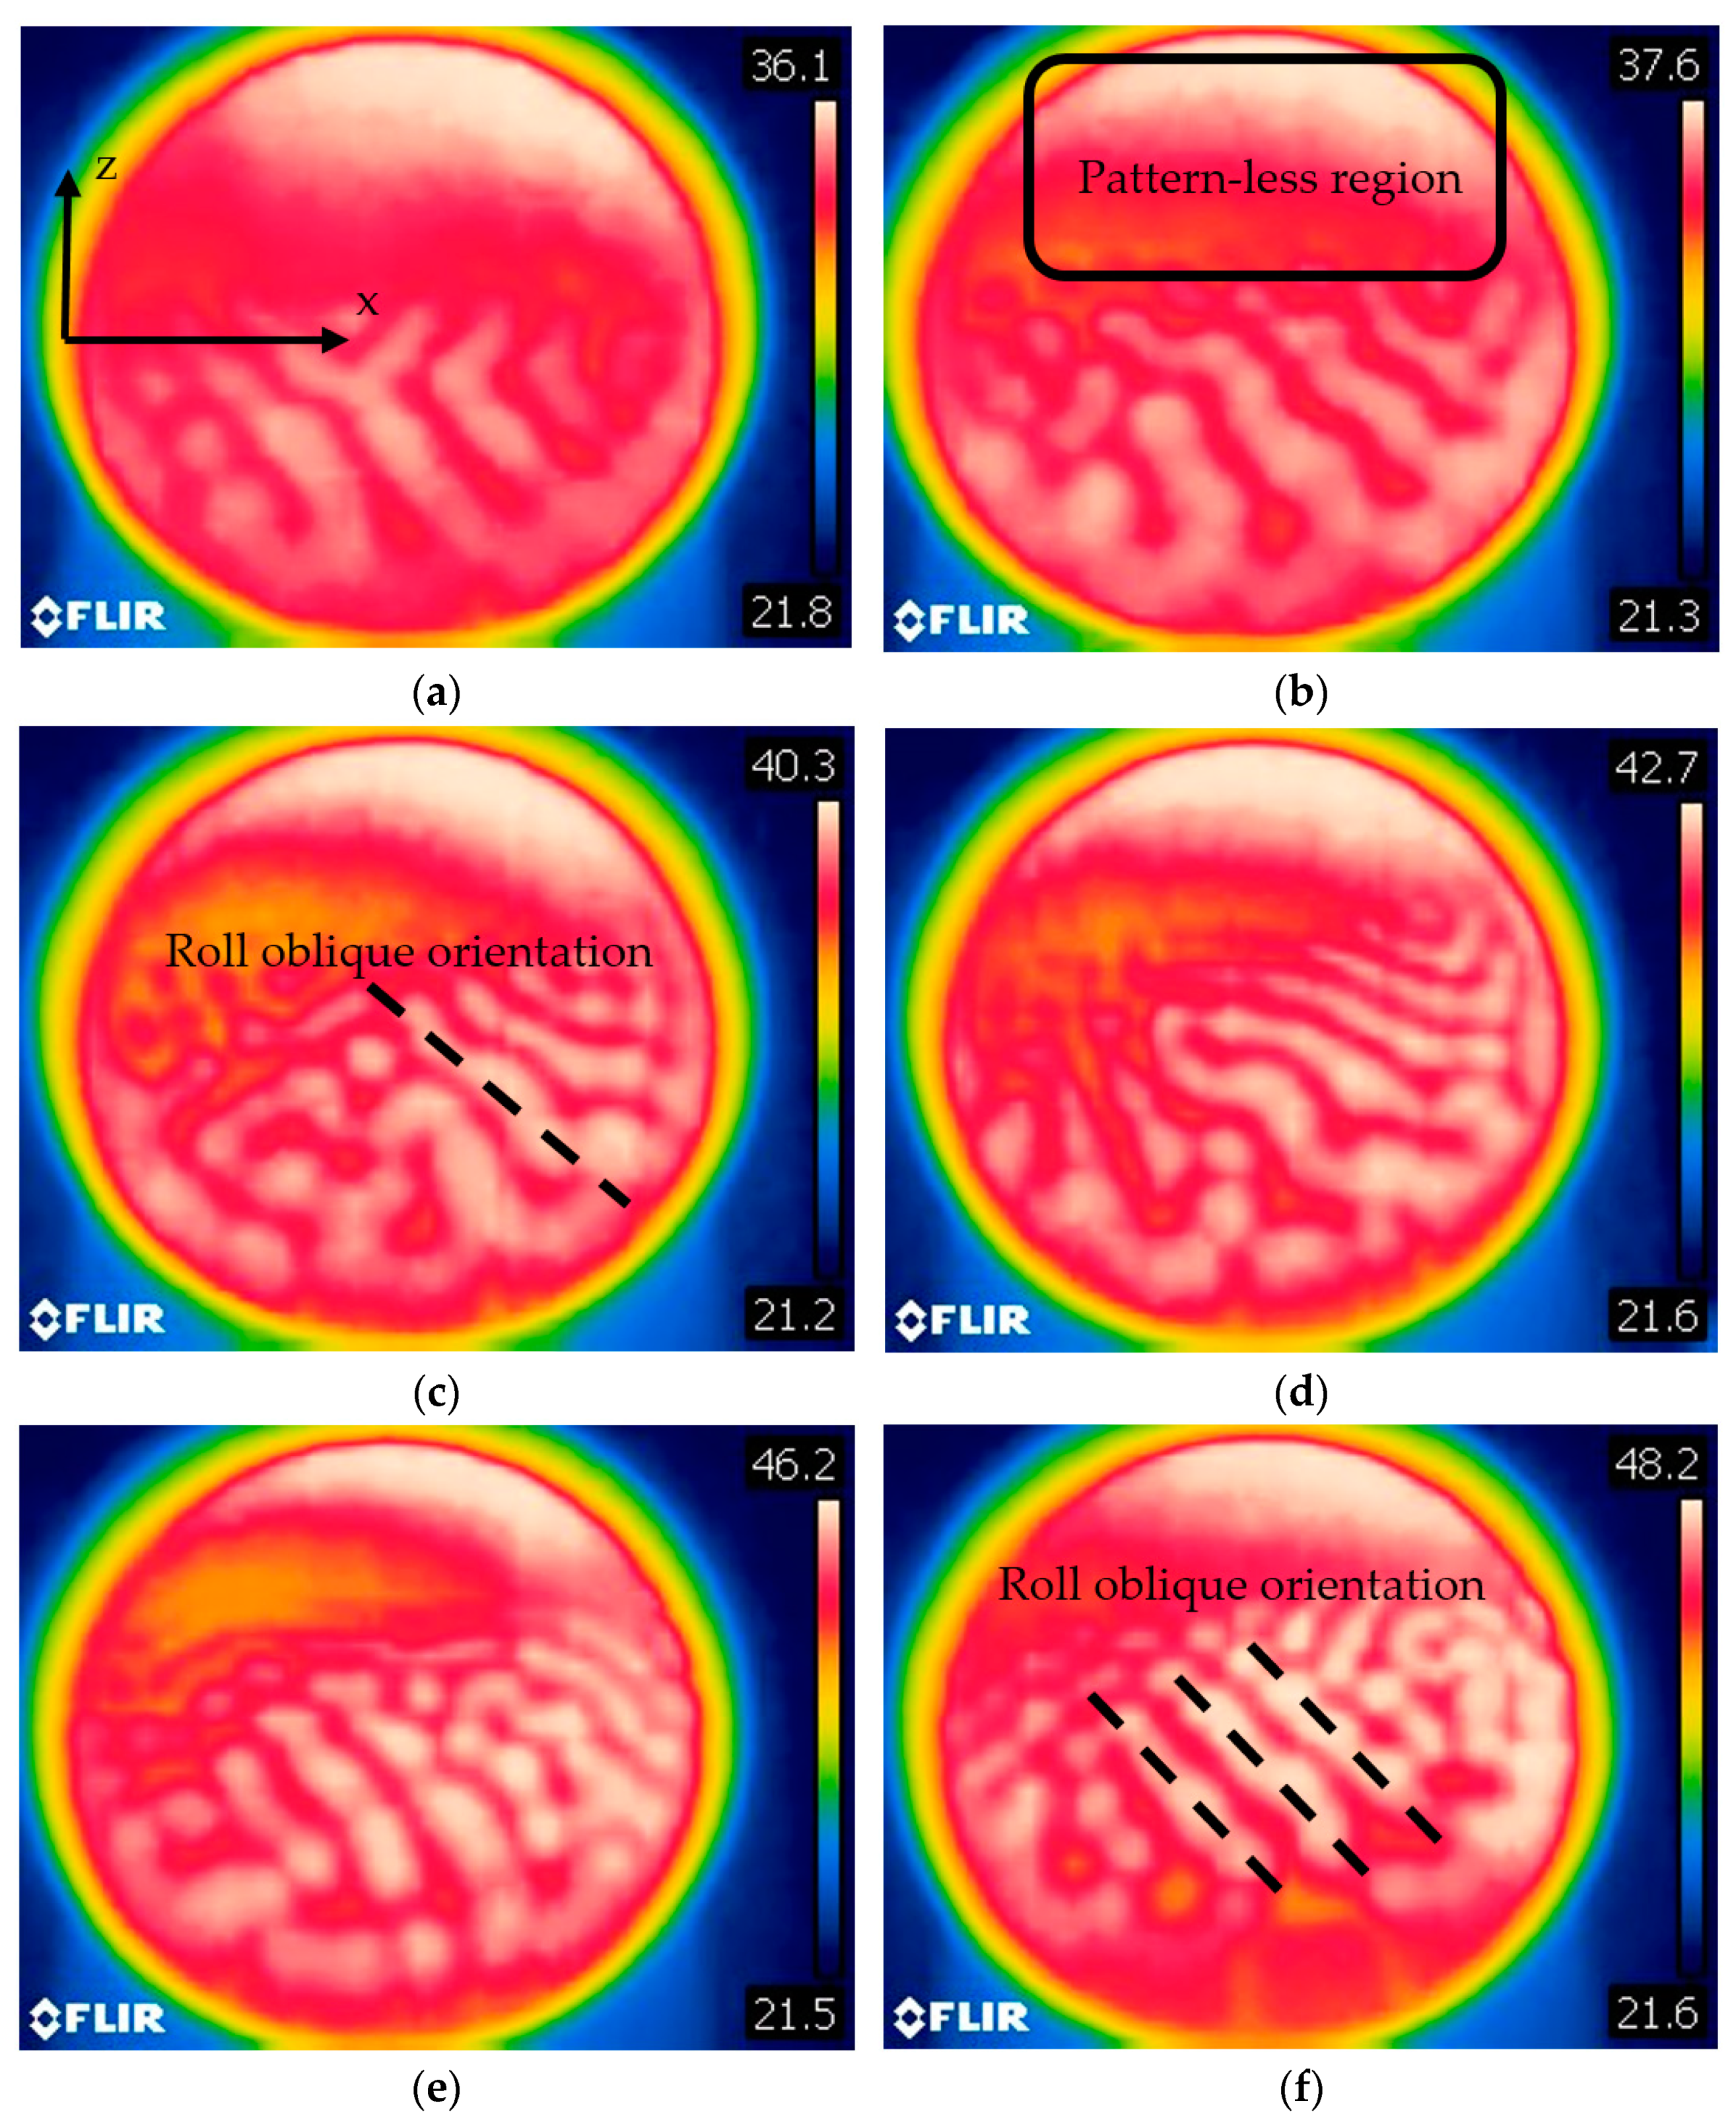
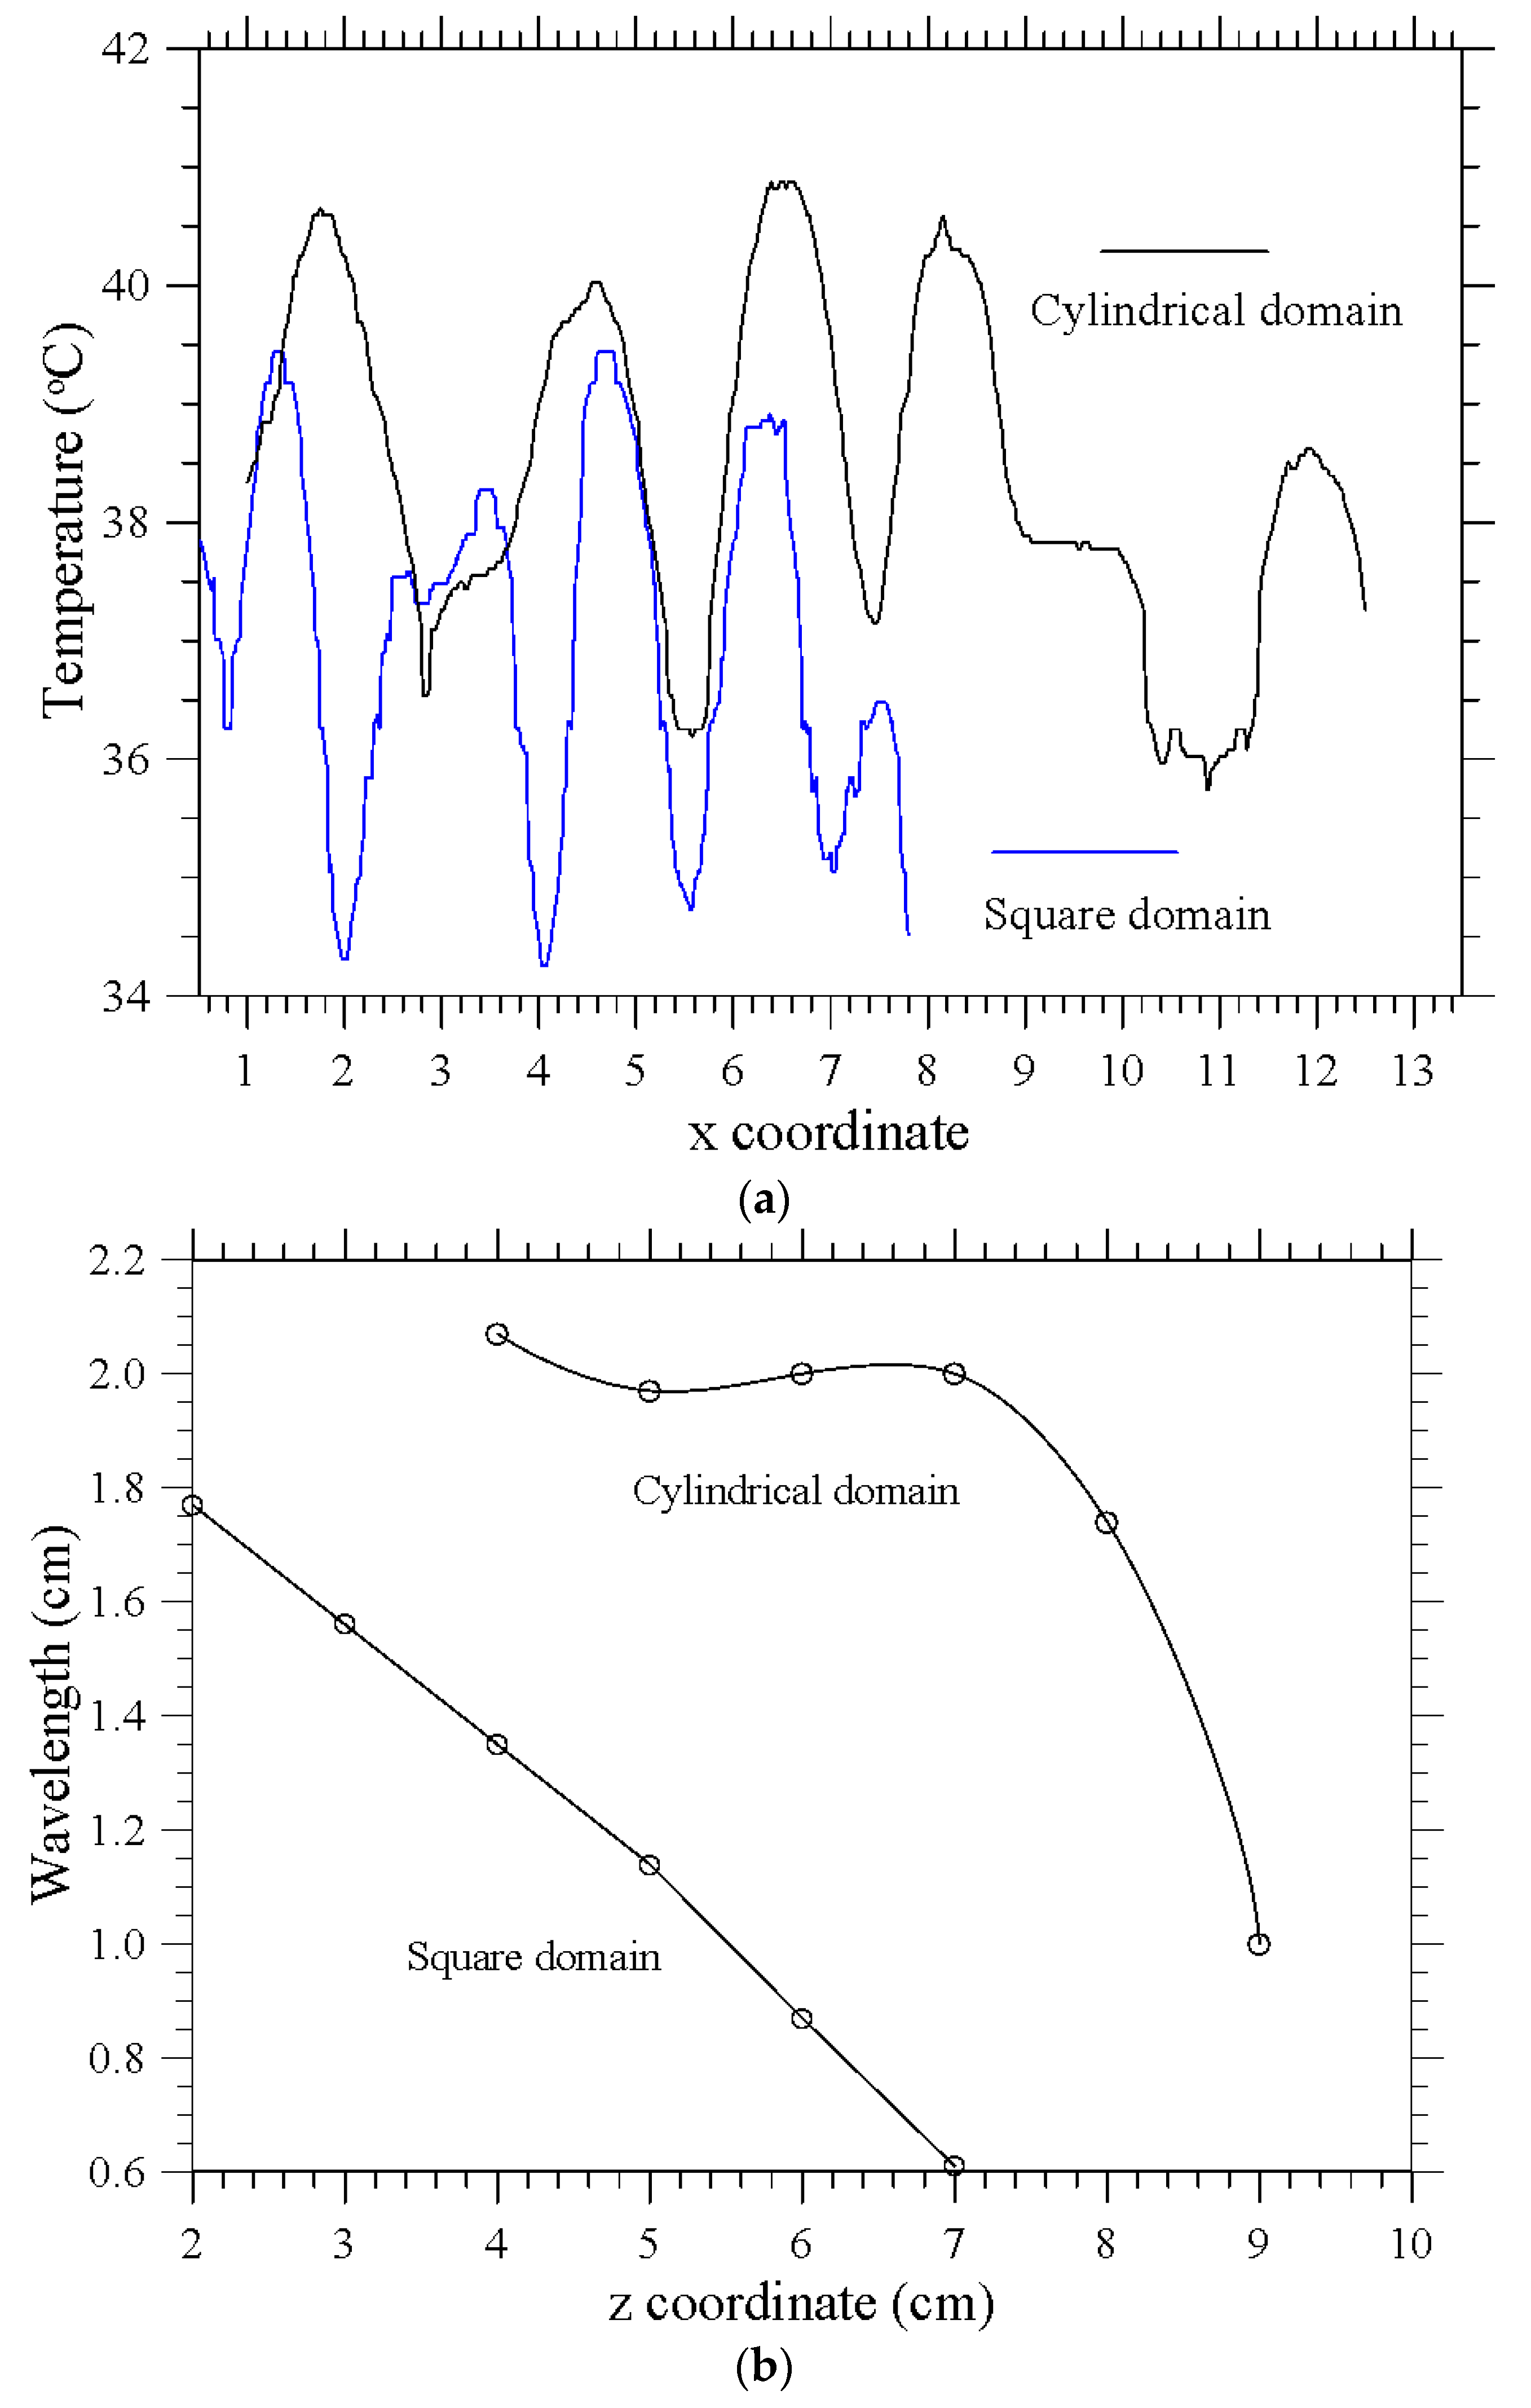
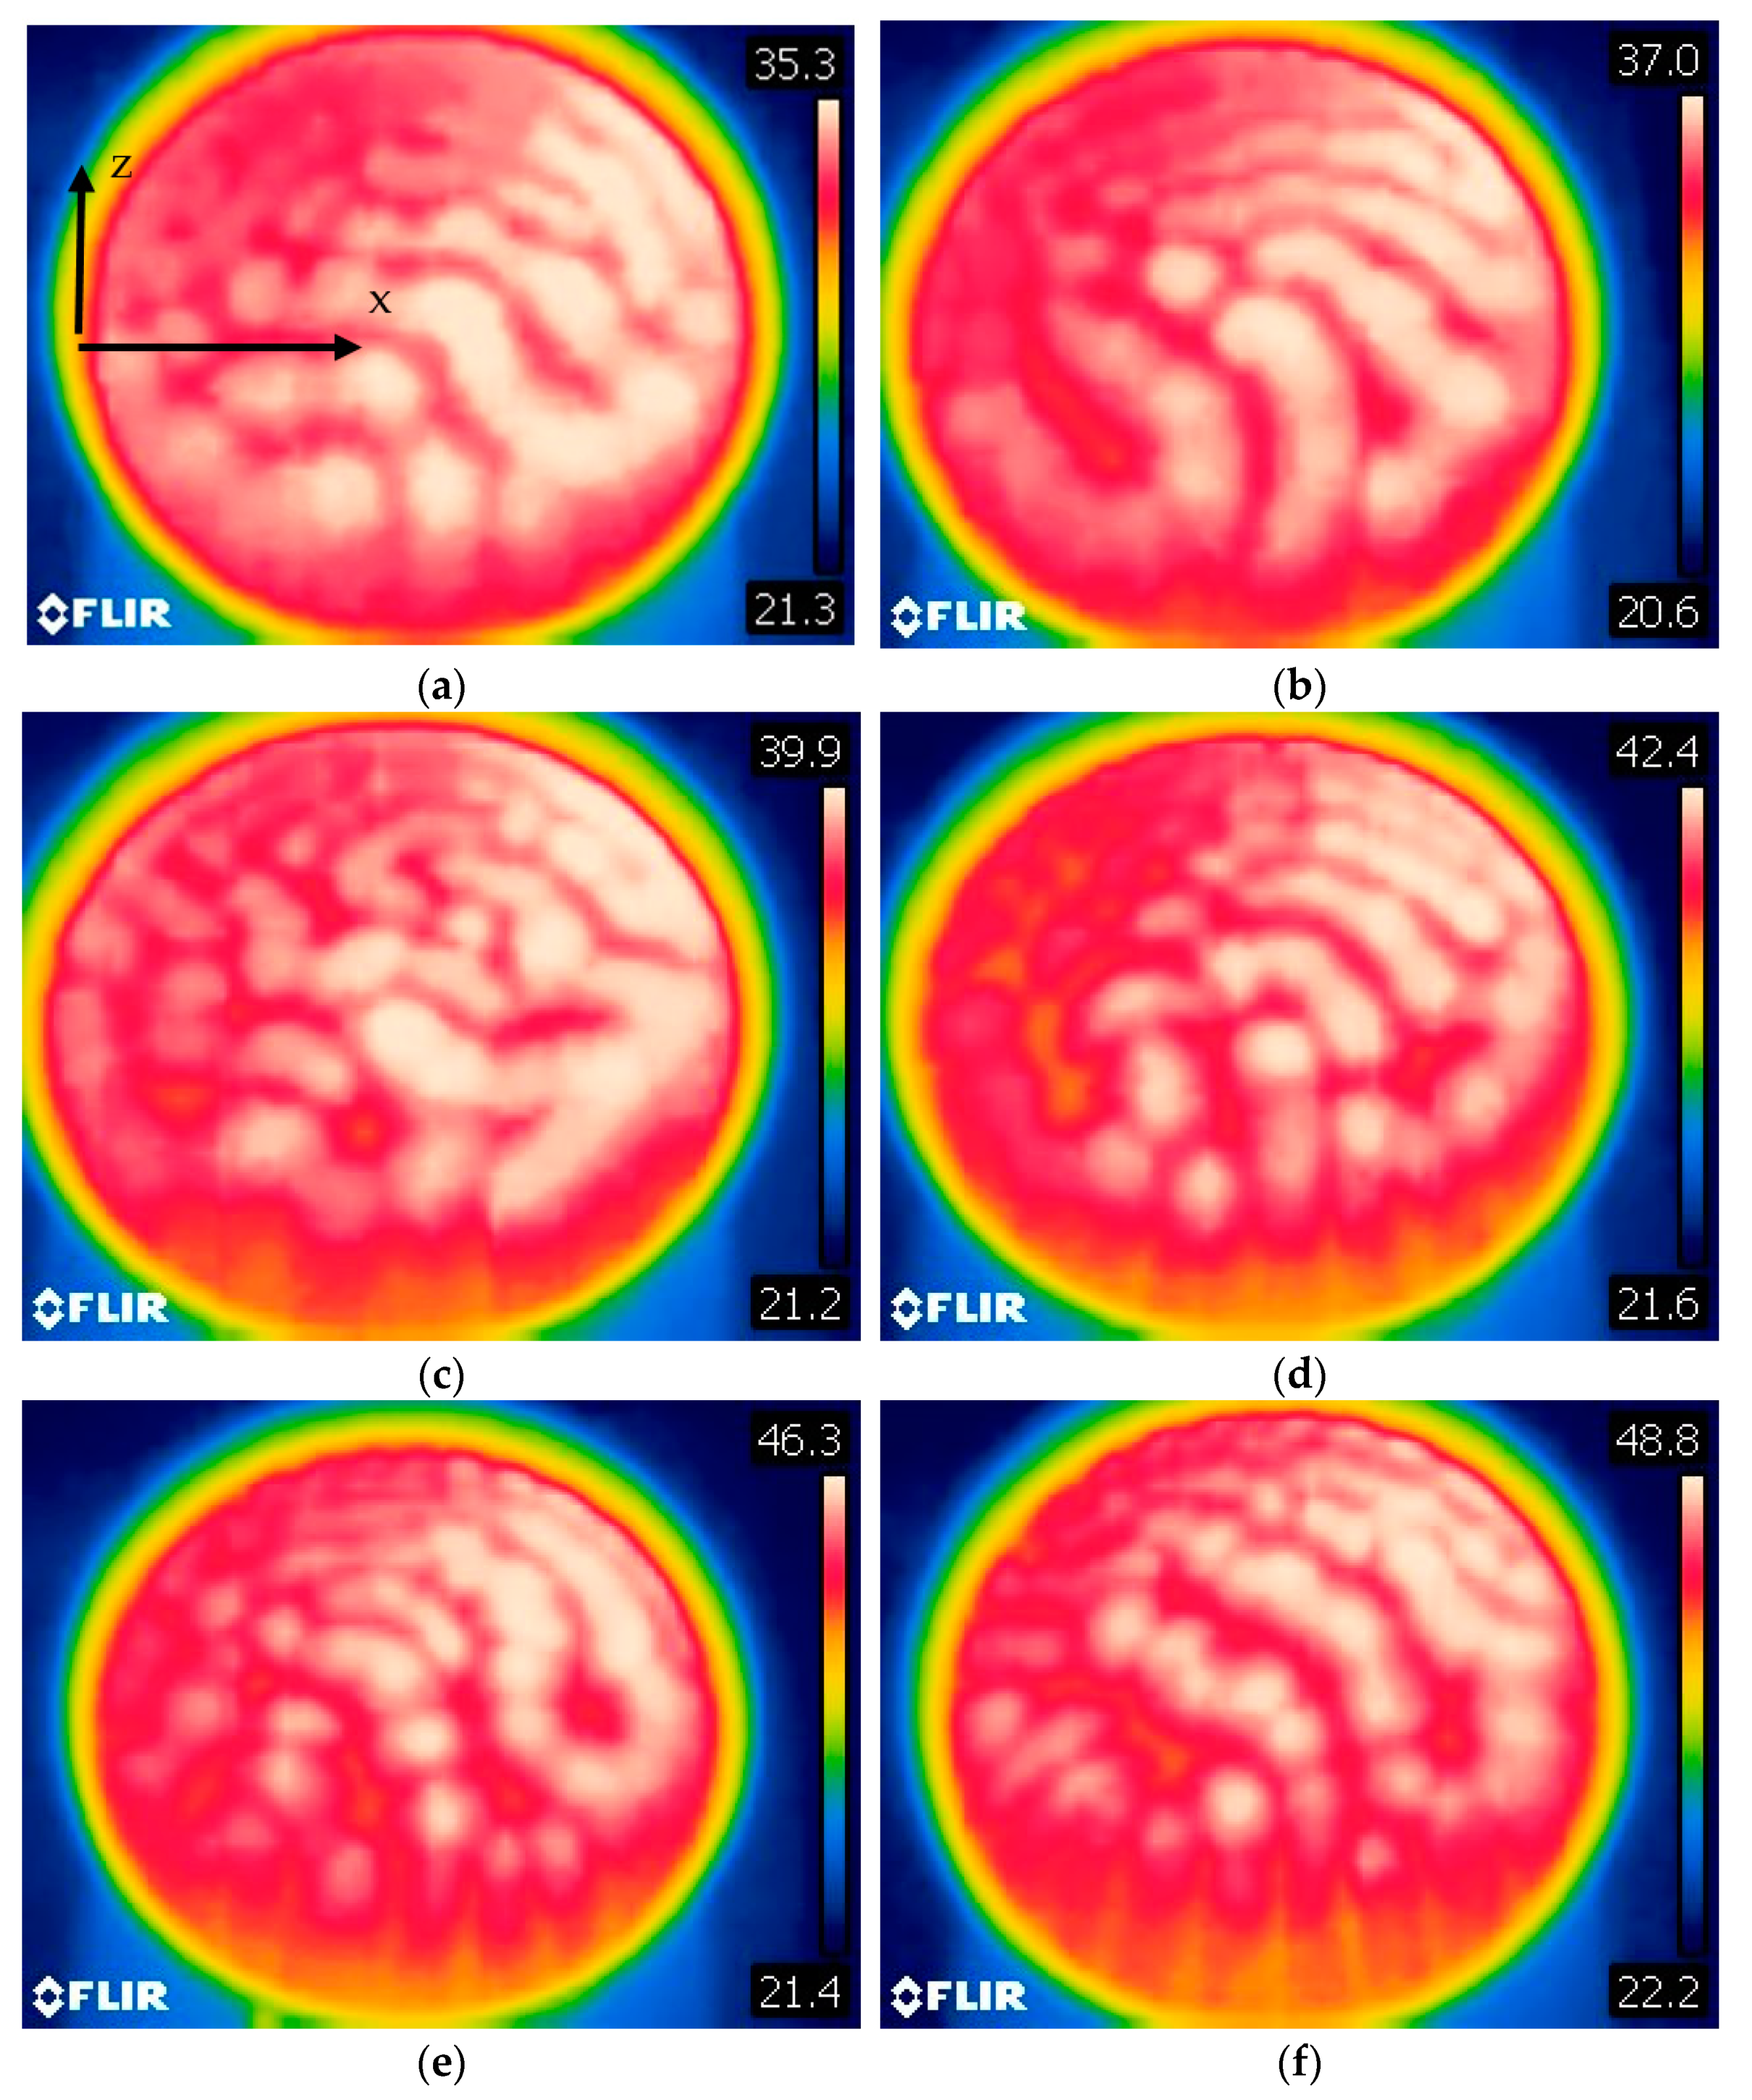
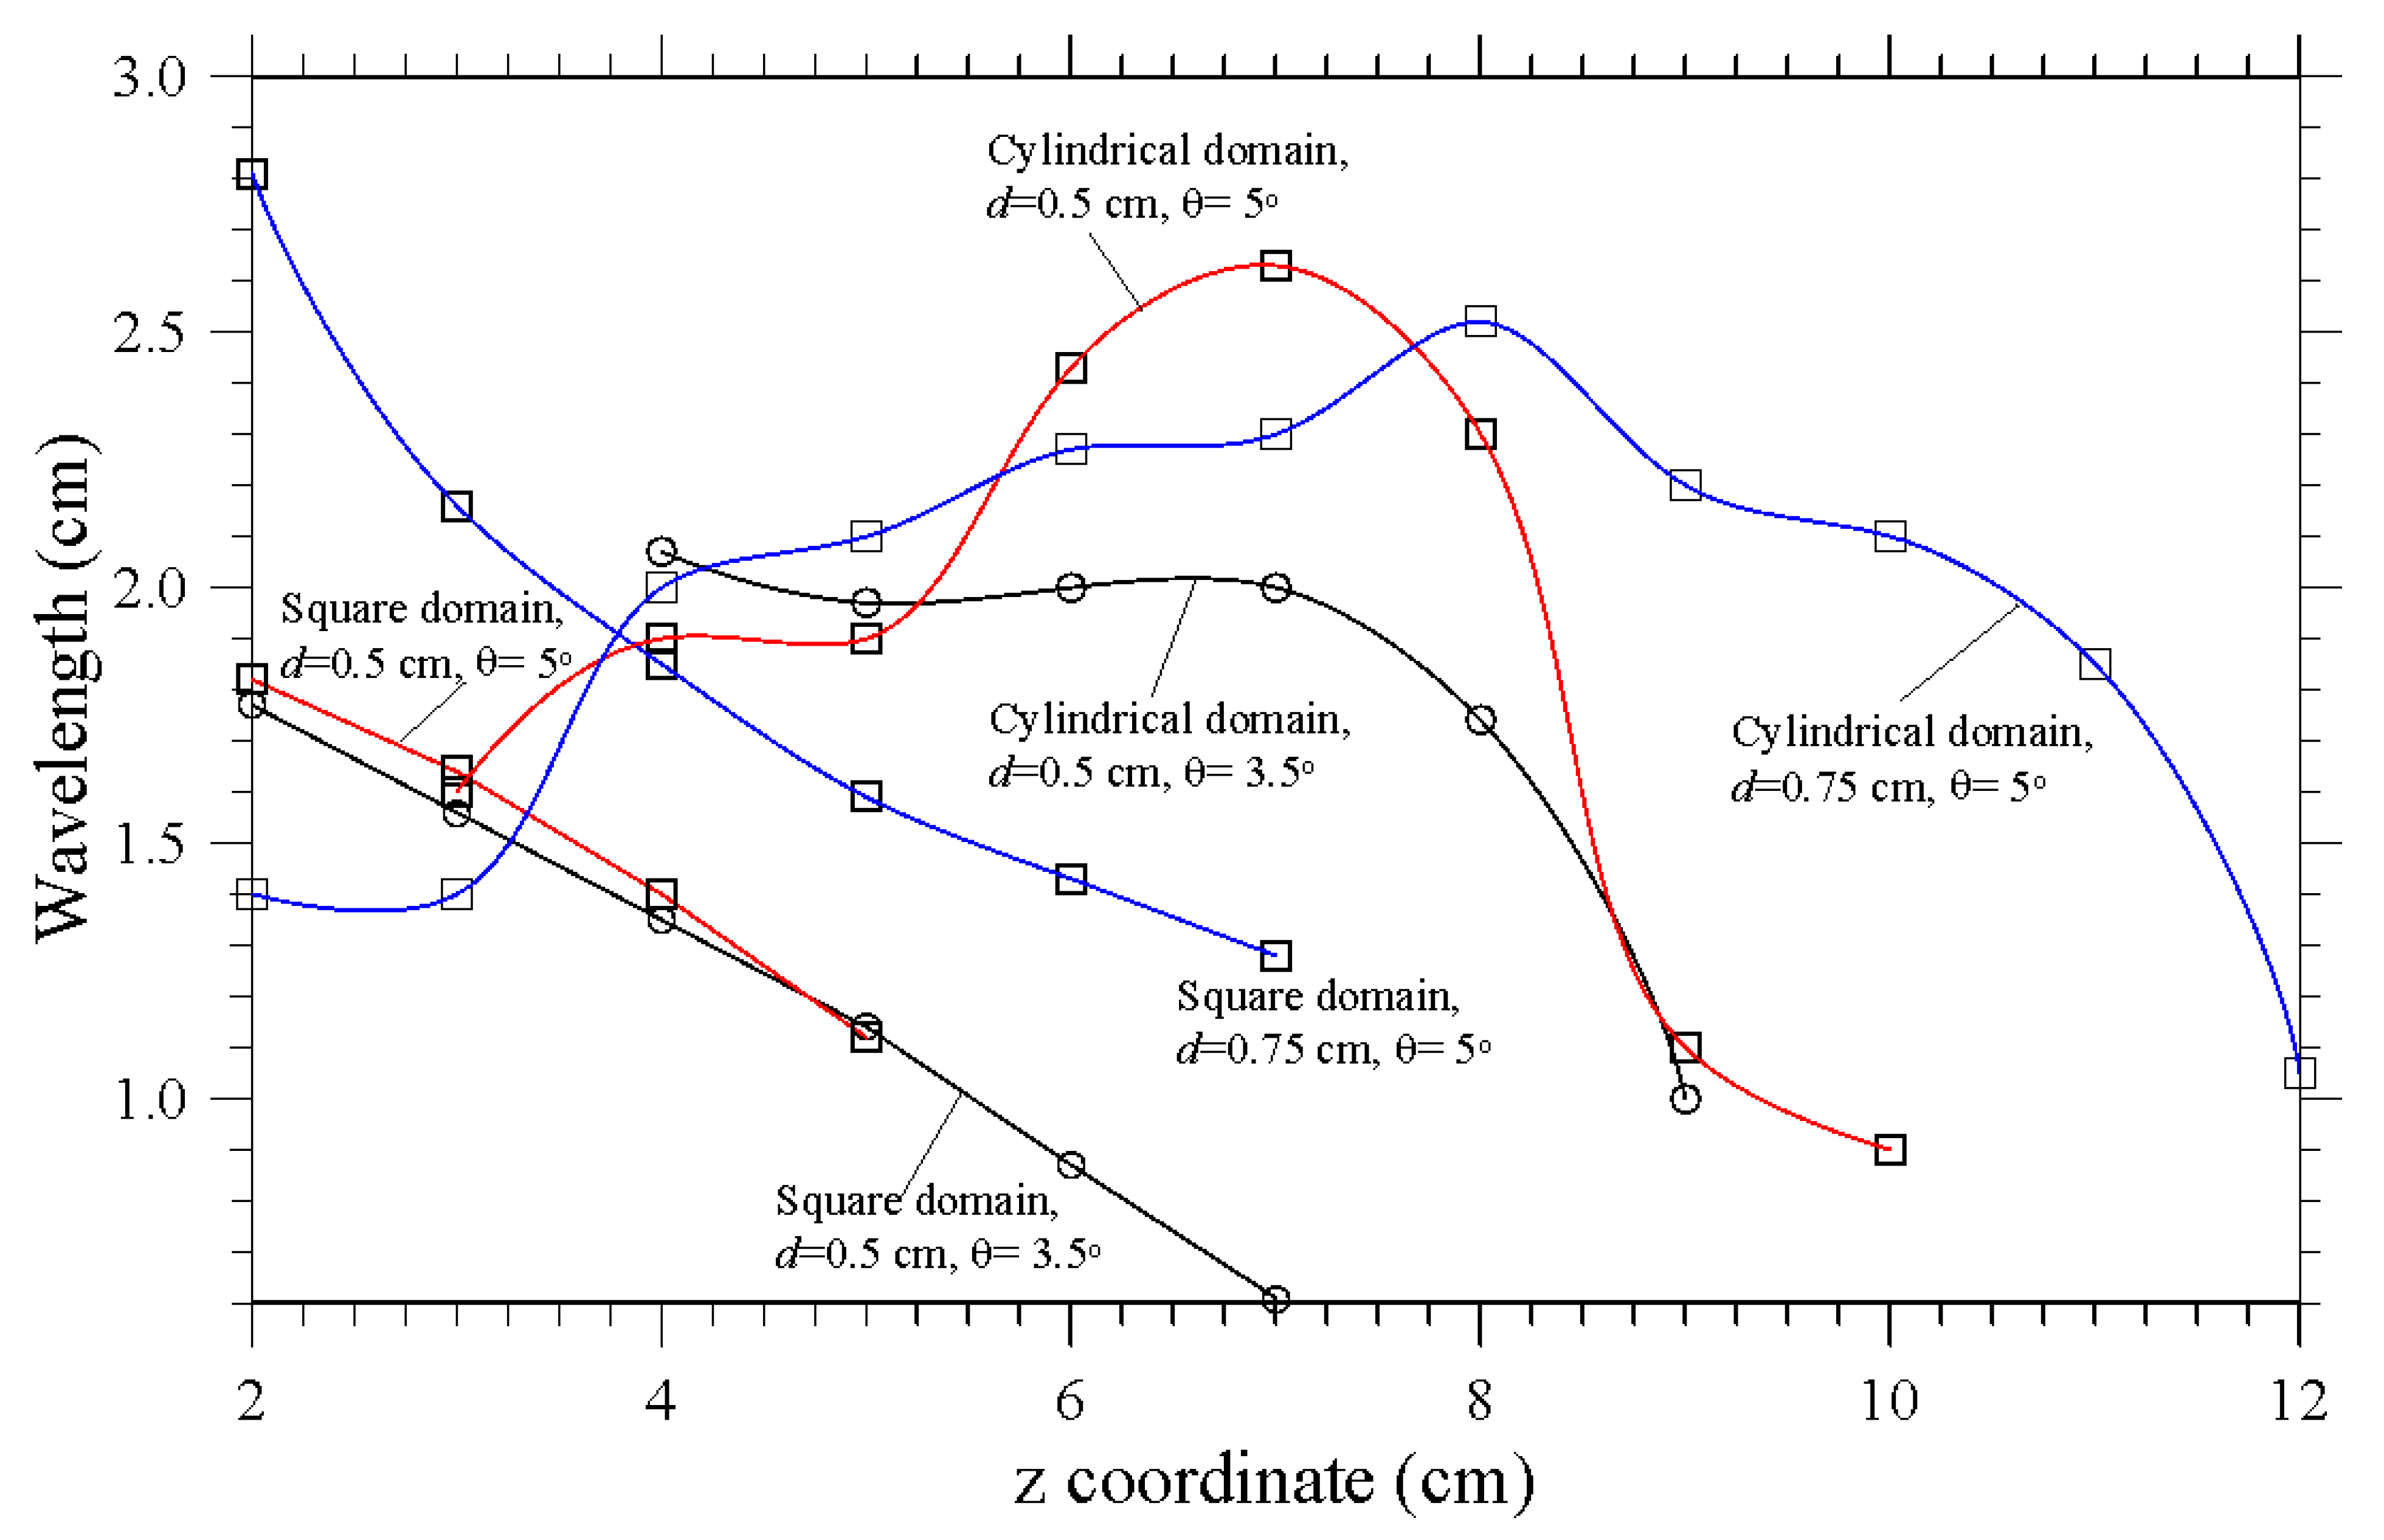
4.2. Convection in Inclined Square Layer
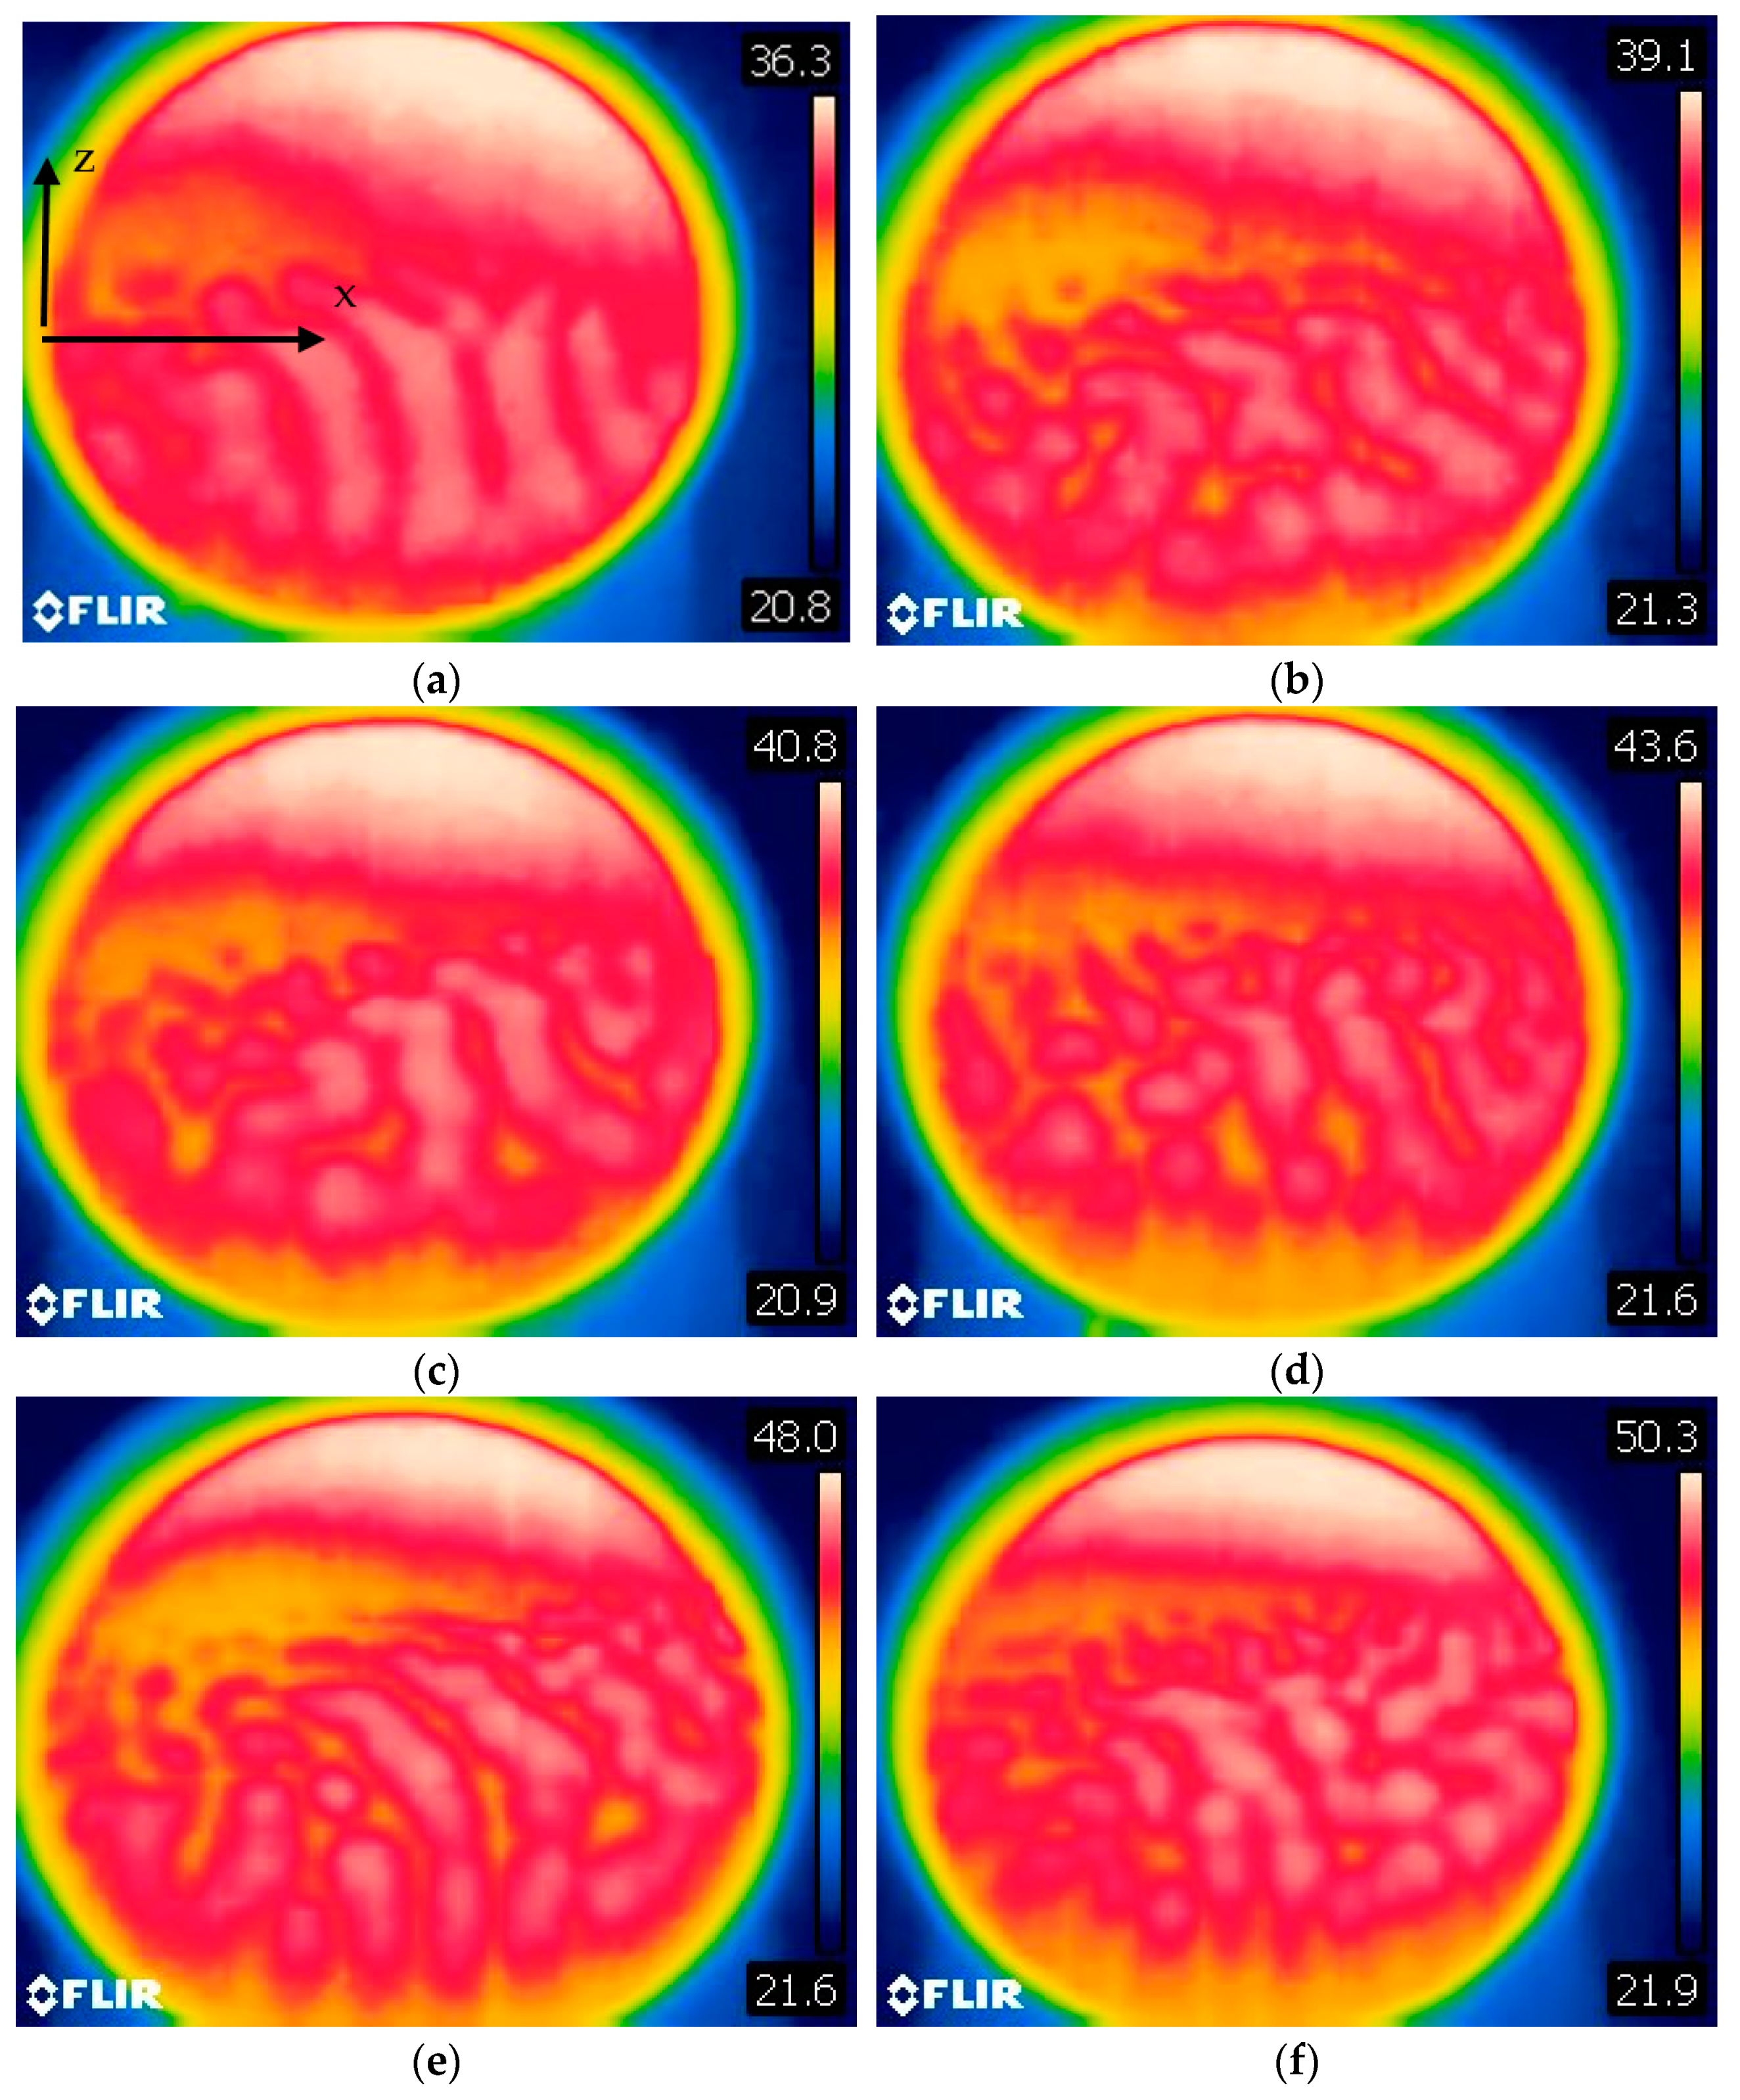
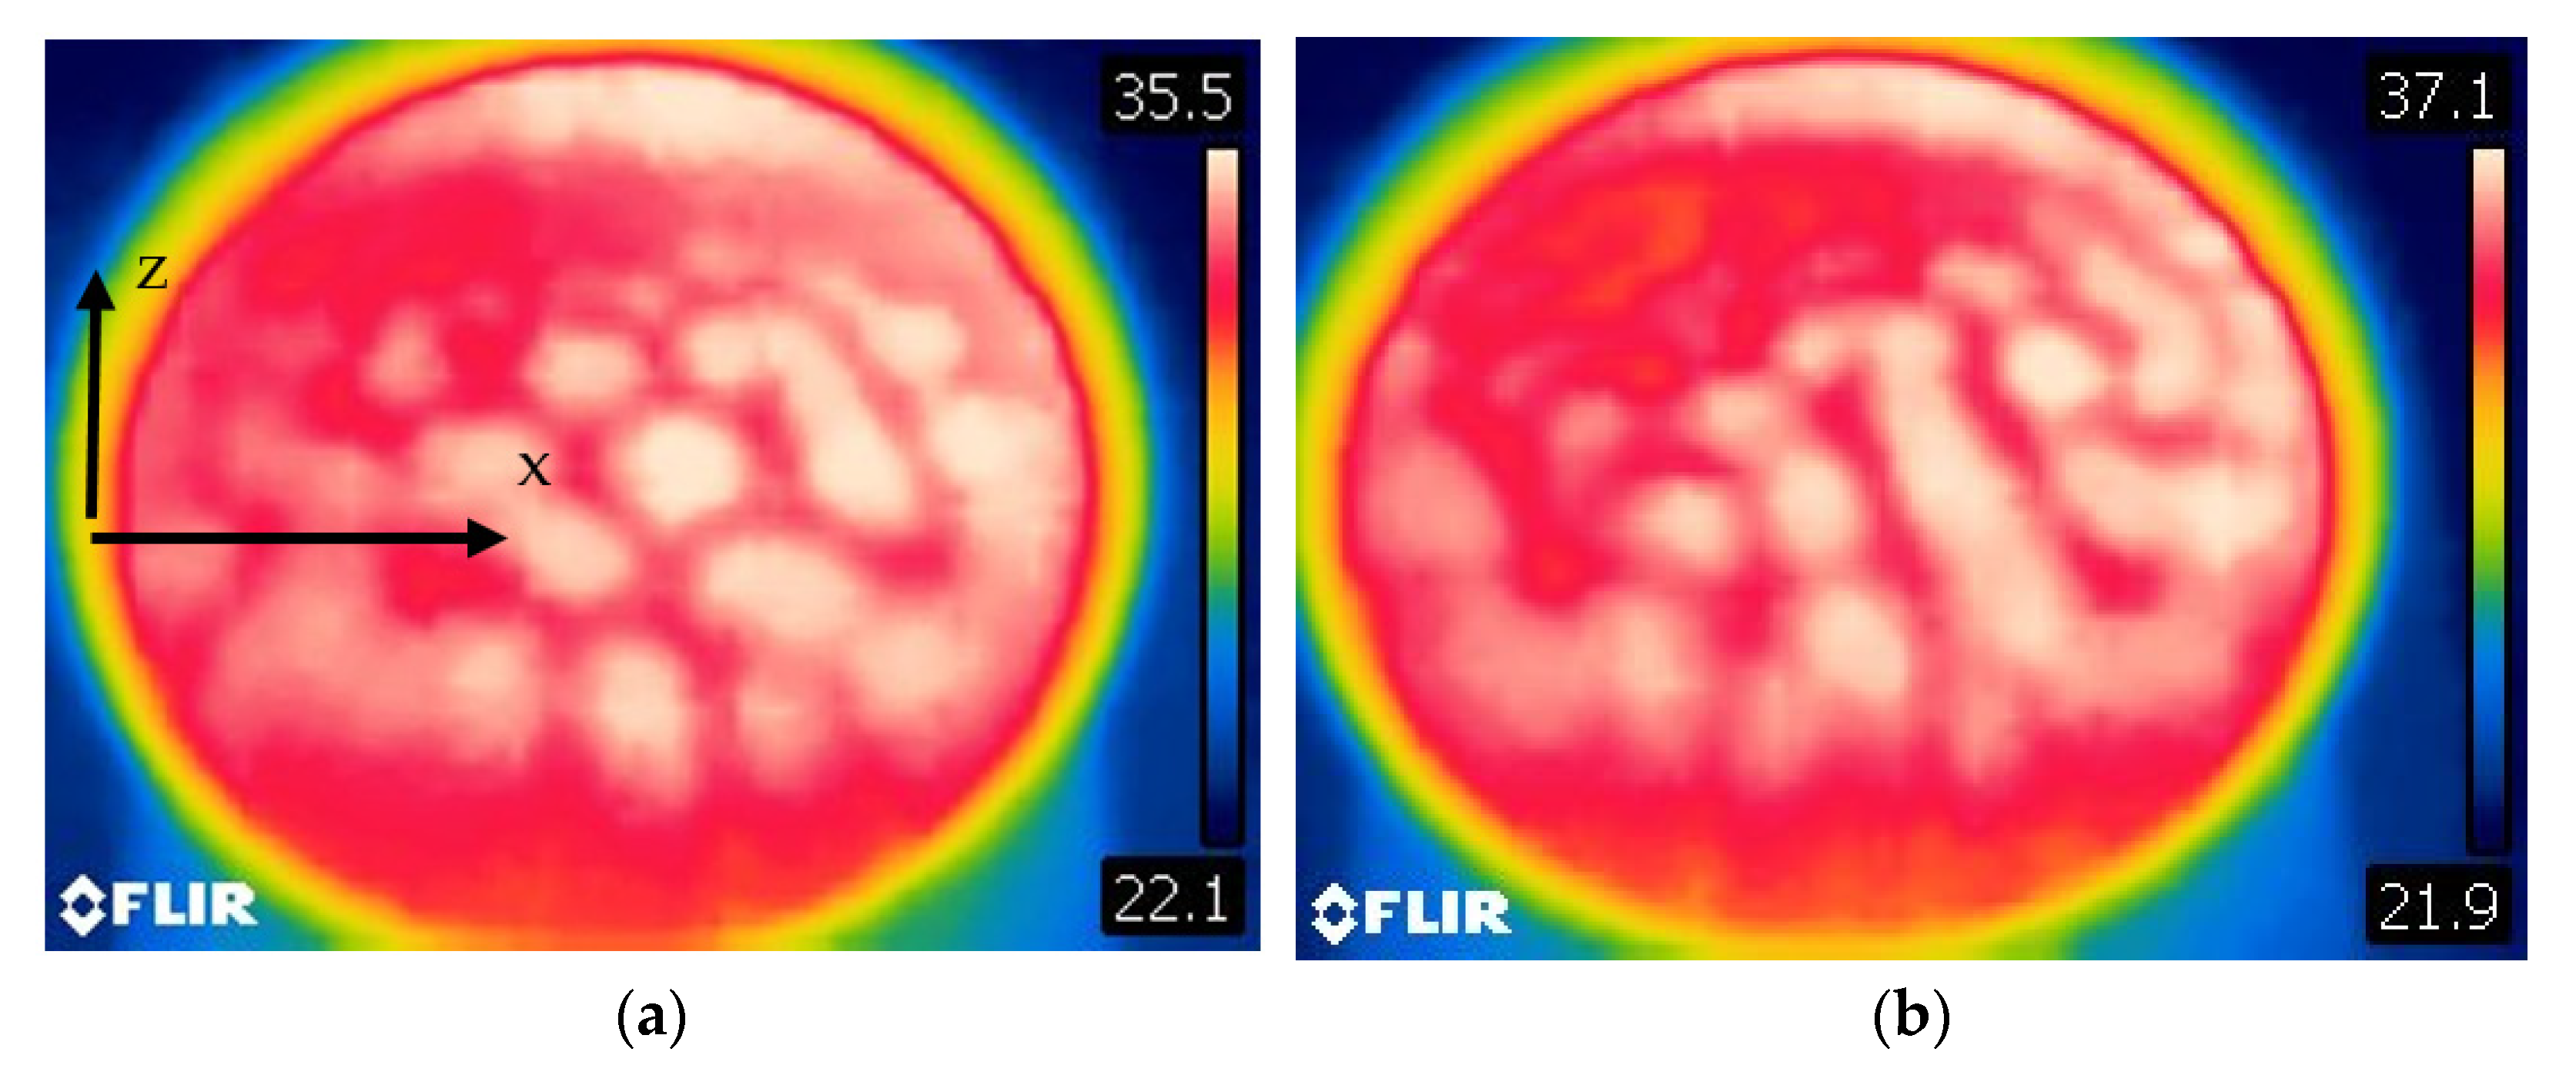
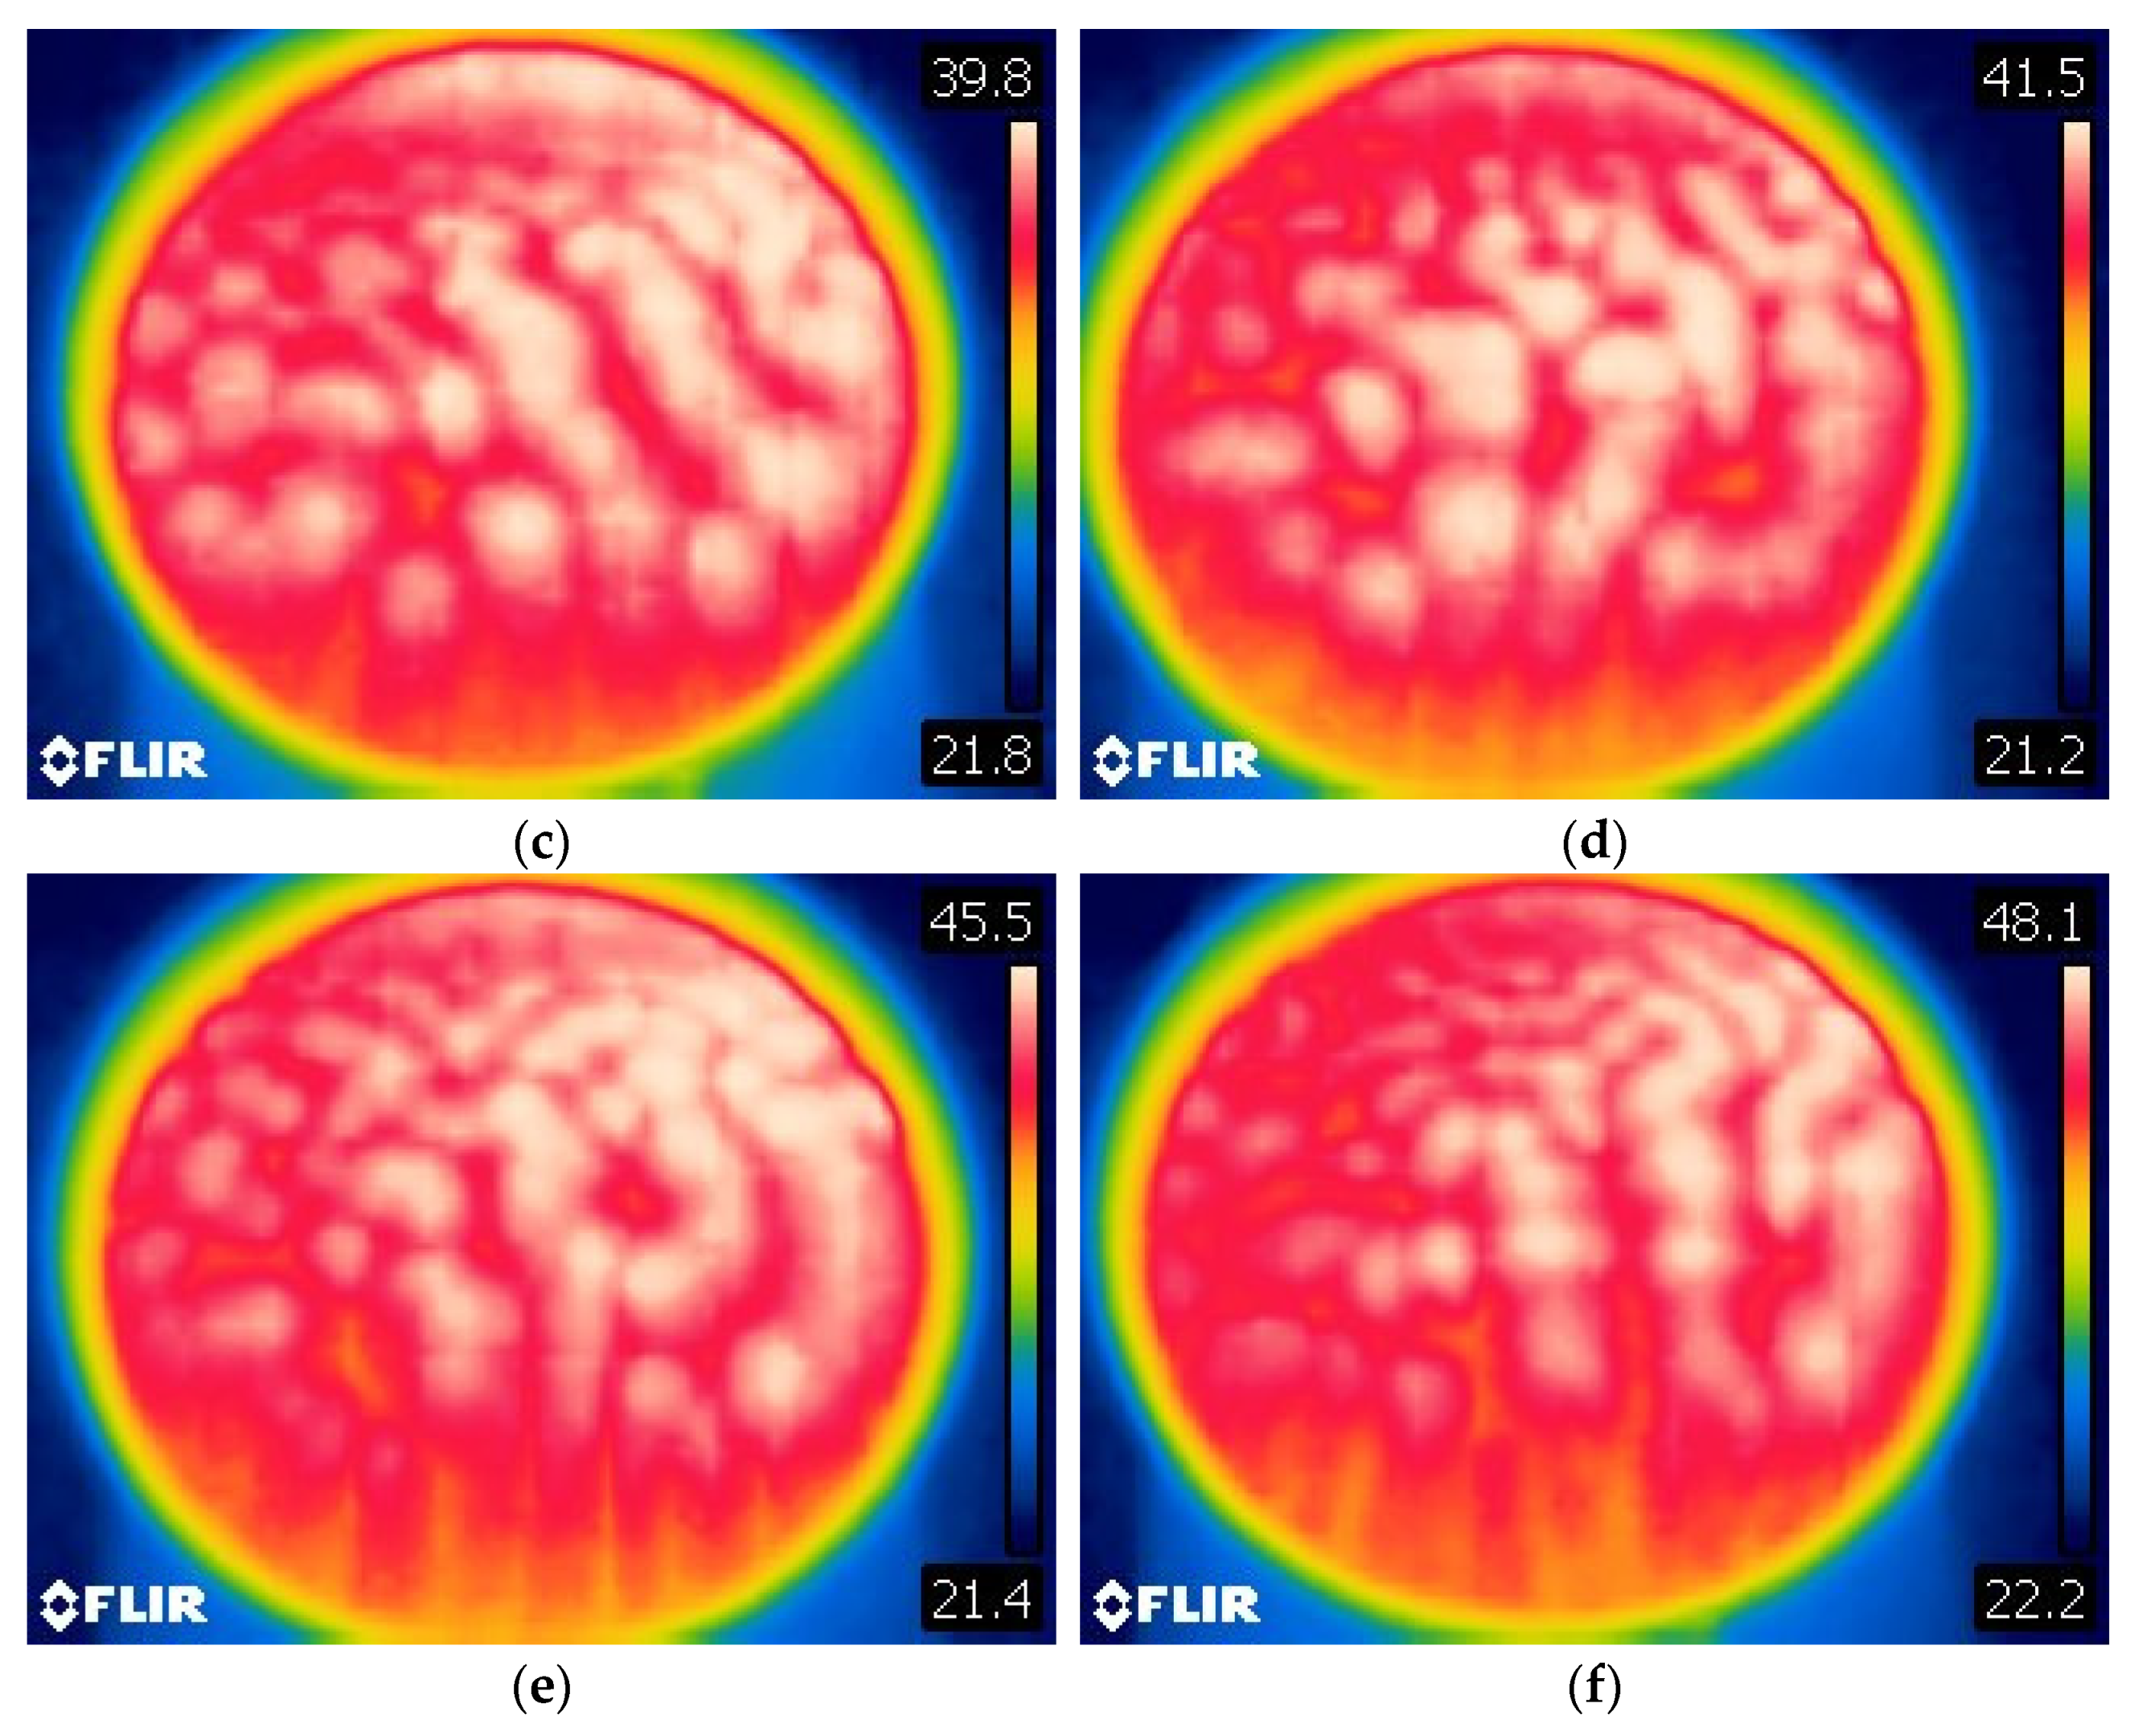
4.3. Convection in Inclined Cylindrical Layer
5. Discussion
6. Conclusions
Author Contributions
Funding
Data Availability Statement
Conflicts of Interest
References
- Markham, B.L.; Rosenberger, F. Diffusive-convective vapor transport across horizontal and inclined rectangular enclosures. J. Cryst. Growth 1984, 67, 241–254. [Google Scholar] [CrossRef]
- Bachran, A.; Reinshaus, P.; Seifert, W. Influence of Thermal Processing Parameters and Material Properties on Velocity Configurations in Semiconductor Melts during the Vertical Bridgman Growth Technique. Cryst. Res. Technol. 1998, 33, 27–36. [Google Scholar] [CrossRef]
- Mizev, A.I.; Schwabe, D. Convective instabilities in liquid layers with free upper surface under the action of an inclined temperature gradient. Phys Fluids 2009, 21, 112102. [Google Scholar] [CrossRef]
- Jones, A.D.W. Spoke patterns. J. Cryst. Growth 1983, 63, 70–76. [Google Scholar] [CrossRef]
- Coriell, S.R.; McFadden, G.B.; Boisvert, R.F.; Sekerka, R.F. Effect of a forced Couette flow on coupled convective and morphological instabilities during unidirectional solidification. J. Cryst. Growth 1984, 69, 15–22. [Google Scholar] [CrossRef]
- Webb, B.W.; Viskanta, R. Natural-convection-dominated melting heat transfer in an inclined rectangular enclosure. Int. J. Heat Mass Transf. 1986, 29, 183–192. [Google Scholar] [CrossRef]
- Forth, S.A.; Wheeler, A.A. Coupled convective and morphological instability in a simple model of the solidification of a binary alloy, including a shear flow. J. Fluid Mech. 1992, 236, 61–94. [Google Scholar] [CrossRef]
- Lappa, M. On the Formation and Propagation of Hydrothermal waves in Solidifying Liquid Layers. Comput. Fluids 2018, 172, 741–760. [Google Scholar] [CrossRef] [Green Version]
- Salgado Sanchez, P.; Ezquerro, J.M.; Fernandez, J.; Rodriguez, J. Thermocapillary effects during the melting of phase-change materials in microgravity: Steady and oscillatory flow regimes. J. Fluid Mech. 2021, 908, A20. [Google Scholar] [CrossRef]
- Salgado Sanchez, P.; Porter, J.; Ezquerro, J.M.; Tinao, I.; Laverón-Simavilla, A. Pattern selection for thermocapillary flow in rectangular containers in microgravity. Phys. Rev. Fluids 2022, 7, 053502. [Google Scholar] [CrossRef]
- Lappa, M. Thermal Convection: Patterns, Evolution and Stability; John Wiley & Sons, Ltd.: Chichester, UK, 2009. [Google Scholar]
- Zhang, J.; Sekimoto, A.; Okano, Y.; Dost, S. Numerical simulation of thermal-solutal Marangoni convection in a shallow rectangular cavity with mutually perpendicular temperature and concentration gradients. Phys. Fluids 2020, 32, 102108. [Google Scholar] [CrossRef]
- Boura, A.; Gebhart, B. The stability of a vertical flow which arises from combined buoyancy modes. AIChE 1976, 22, 94–102. [Google Scholar] [CrossRef]
- Qin, T.; Grigoriev, R.O. A numerical study of buoyancy-Marangoni convection of volatile binary fluids in confined geometries. Int. J. Heat Mass Transf. 2018, 127, 308–320. [Google Scholar] [CrossRef]
- Lipps, F.B. Two-dimensional numerical experiments in thermal convention with vertical shear. J. Atm. Sci. 1971, 28, 3–19. [Google Scholar] [CrossRef]
- Thorpe, S.A. Transitional phenomena and the development of turbulence in stratified fluids: A review. J. Geophys. Res. 1987, 92, 5231–5248. [Google Scholar] [CrossRef]
- Farrow, D.E.; Patterson, J.C. On the stability of the near shore waters of a lake when subject to solar heating. Int. J. Heat Mass Transf. 1993, 36, 89–100. [Google Scholar] [CrossRef]
- Richter, F.M. Convection and the large-scale circulation of the mantle. J. Geophys. Res. 1973, 78, 8735–8745. [Google Scholar] [CrossRef]
- Weber, J.E. On the stability of thermally driven shear flow heated from below. J. Fluid Mech. 1978, 87, 65–84. [Google Scholar] [CrossRef]
- Cliffe, K.A.; Winters, K.H. A numerical study of the cusp catastrophe for Bénard convection in tilted cavities. J. Comput. Phys. 1984, 54, 531–534. [Google Scholar] [CrossRef]
- Mizushima, J.; Adachi, T. Structural Stability of the Pitchfork Bifurcation of Thermal Convection in a Rectangular Cavity. J. Phys. Soc. Jpn. 1995, 64, 4670–4683. [Google Scholar] [CrossRef]
- Clever, R.M.; Busse, F.H. Instabilities of longitudinal convection rolls in an inclined layer. J. Fluid Mech. 1977, 81, 107–125. [Google Scholar] [CrossRef]
- Chen, Y.; Pearlstein, A.J. Stability of free-convection flows of variable-viscosity fluids in vertical and inclined slots. J. Fluid Mech. 1989, 198, 513–541. [Google Scholar] [CrossRef]
- Shadid, J.N.; Goldstein, R.J. Visualization of longitudinal convection roll instabilities in an inclined enclosure heated from below. J. Fluid Mech. 1990, 215, 61–84. [Google Scholar] [CrossRef]
- Busse, F.H.; Clever, R.M. Three-dimensional convection in an inclined layer heated from below. J. Eng. Math. 1992, 26, 1–19. [Google Scholar] [CrossRef]
- Fujimura, K.; Kelly, R.E. Mixed mode convection in an inclined slot. J. Fluid Mech. 1993, 246, 545–568. [Google Scholar] [CrossRef]
- Kaloni, P.N.; Qiao, Z. On the nonlinear stability of thermally driven shear flow heated from below. Phys. Fluids 1996, 8, 639. [Google Scholar] [CrossRef]
- Daniels, K.E.; Bodenschatz, E.; Pesch, W.; Brausch, O. Pattern formation in inclined layer convection; Session QC28—Topics in Pattern Formation and Nonlinear Dynamics. In Proceedings of the APS Centennial Meeting, Atlanta, GA, USA, 20–26 March 1999; Available online: https://flux.aps.org/meetings/YR99/CENT99/abs/S6255001.html (accessed on 20 November 2022).
- Daniels, K.E.; Plapp, B.B.; Bodenschatz, E. Pattern Formation in Inclined Layer Convection. Phys. Rev. Lett. 2000, 84, 5320–5323. [Google Scholar] [CrossRef] [Green Version]
- Daniels, K.E.; Brausch, O.; Pesch, W.; Bodenschatz, E. Competition and bistability of ordered undulations and undulation chaos in inclined layer convection. J. Fluid Mech. 2008, 597, 261–282. [Google Scholar] [CrossRef] [Green Version]
- Tao, J.; Busse, F.H. Oblique roll instability in inclined buoyancy layers. Eur. J. Mech. B/Fluids 2009, 28, 532–540. [Google Scholar] [CrossRef]
- Subramanian, P.; Brausch, O.; Daniels, K.E.; Bodenschatz, E.; Schneider, T.M.; Pesch, W. Spatio-temporal patterns in inclined layer convection. J. Fluid Mech. 2016, 794, 719–745. [Google Scholar] [CrossRef]
- Nepomnyashchy, A.A.; Simanovskii, I.B.; Braverman, L.M. Stability of thermocapillary flows with inclined temperature gradient. J. Fluid Mech. 2001, 442, 141–155. [Google Scholar] [CrossRef]
- Ueno, I.; Kurosawa, T.; Kawamura, H. Thermocapillary Convection in Thin Liquid Layer with Temperature Gradient Inclined to Free Surface. In Proceedings of the IHTC12, Grenoble, France, 18–23 August 2002. [Google Scholar]
- Shklyaev, O.E.; Nepomnyashchy, A.A. Thermocapillary flows under an inclined temperature gradient. J. Fluid Mech. 2004, 504, 99–132. [Google Scholar] [CrossRef]
- Patne, R.; Agnon, Y.; Oron, A. Thermocapillary instabilities in a liquid layer subjected to an oblique temperature gradient. J. Fluid Mech. 2021, 906, A12. [Google Scholar] [CrossRef]
- Cerisier, P.; Pantaloni, J.; Finiels, G.; Amalric, R. Thermovision applied to Benard-Marangoni convection. Appl. Opt. 1982, 21, 2153–2159. [Google Scholar] [CrossRef]
- Cerisier, P.; Rahal, S.; Azuma, H. Pattern dynamics of the Bénard-Marangoni instability in a medium aspect ratio container. J. Phys. Conf. Ser. 2007, 64, 012004. [Google Scholar] [CrossRef]
- Ismagilov, R.F.; Rosmarin, D.; Gracias, D.H.; Stroock, A.D.; Whitesides, G.M. Competition of intrinsic and topographically imposed patterns in Bénard–Marangoni convection. Appl. Phys. Lett. 2001, 79, 439–441. [Google Scholar] [CrossRef] [Green Version]
- Chauvet, F.; Dehaeck, S.; Colinet, P. Threshold of Bénard-Marangoni instability in drying liquid films. EPL Europhys. Lett. 2012, 99, 34001. [Google Scholar] [CrossRef] [Green Version]
- Wang, J.M.; Liu, G.H.; Fang, Y.L.; Li, W.K. Marangoni effect in nonequilibrium multiphase system of material processing. Rev. Chem. Eng. 2016, 32, 551–585. [Google Scholar] [CrossRef]
- Wu, D.; Duan, L.; Kang, Q. Wavenumber Selection by Bénard–Marangoni Convection at High Supercritical Number. Chin. Phys. Lett. 2017, 34, 054702. [Google Scholar] [CrossRef]
- Sobac, B.; Colinet, P.; Pauchard, L. Influence of Bénard–Marangoni instability on the morphology of drying colloidal films. Soft Matter 2019, 15, 2381–2390. [Google Scholar] [CrossRef]
- Tönsmann, M.; Scharfer, P.; Schabel, W. Critical Solutal Marangoni Number Correlation for Short-Scale Convective Instabilities in Drying Poly(vinyl acetate)-Methanol Thin Films. Polymers 2021, 13, 2955. [Google Scholar] [CrossRef]
- Gillon, P.; Homsy, G.M. Combined thermocapillary-buoyancy convection in a cavity: An experimental study. Phys. Fluids 1996, 8, 2953–2963. [Google Scholar] [CrossRef]
- Braunsfurth, M.G.; Homsy, G.M. Combined thermocapillary-buoyancy convection in a cavity. Part II. An experimental study. Phys. Fluids 1997, 9, 1277–1286. [Google Scholar] [CrossRef]
- Burguete, J.; Mukolobwiez, N.; Daviaud, N.; Garnier, N.; Chiffaudel, A. Buoyant-thermocapillary instabilities in extended liquid layers subjected to a horizontal temperature gradient. Phys. Fluids 2001, 13, 2773–2787. [Google Scholar] [CrossRef] [Green Version]
- Pelacho, M.A.; Garcimartin, A.; Burguete, J. Travel instabilities in lateral heating. Int. J. Bifurcat. Chaos 2001, 11, 2881–2886. [Google Scholar] [CrossRef]


| Parameter | Value/Range |
|---|---|
| Work plate Dimension | Diameter 135 mm |
| Work plate material | Stainless steel cover with ceramic |
| Motor type | Brushless DC motor |
| Motor rating input | 5 W |
| Motor rating output | 3 W |
| Power | 515 W |
| Heating output | 500 W |
| Voltage | 100–120/200–240 V 50/60 Hz |
| Heating temperature range | Room temp.–280, increment 1°C |
| Control accuracy of work plate | ±1 °C (<100°C) ±1%(>100 °C) |
| External temperature sensor | PT1000 (accuracy ±0.5 °C) |
| Dimension [W × D × H] | 150 × 260 × 80 mm |
| Weight | 1.8 kg |
Disclaimer/Publisher’s Note: The statements, opinions and data contained in all publications are solely those of the individual author(s) and contributor(s) and not of MDPI and/or the editor(s). MDPI and/or the editor(s) disclaim responsibility for any injury to people or property resulting from any ideas, methods, instructions or products referred to in the content. |
© 2022 by the authors. Licensee MDPI, Basel, Switzerland. This article is an open access article distributed under the terms and conditions of the Creative Commons Attribution (CC BY) license (https://creativecommons.org/licenses/by/4.0/).
Share and Cite
Waris, W.; Lappa, M. Patterning Behavior of Hybrid Buoyancy-Marangoni Convection in Inclined Layers Heated from Below. Fluids 2023, 8, 12. https://doi.org/10.3390/fluids8010012
Waris W, Lappa M. Patterning Behavior of Hybrid Buoyancy-Marangoni Convection in Inclined Layers Heated from Below. Fluids. 2023; 8(1):12. https://doi.org/10.3390/fluids8010012
Chicago/Turabian StyleWaris, Wasim, and Marcello Lappa. 2023. "Patterning Behavior of Hybrid Buoyancy-Marangoni Convection in Inclined Layers Heated from Below" Fluids 8, no. 1: 12. https://doi.org/10.3390/fluids8010012