
Modeling the Phase Transition in Hydrophobic Weak Polyelectrolyte Gels under Compression


Department of Physical and Macromolecular Chemistry, Faculty of Science, Charles University, 12800 Prague, Czech Republic
*
Author to whom correspondence should be addressed.
Gels 2023, 9(3), 259; https://doi.org/10.3390/gels9030259
Submission received: 15 February 2023
/
Revised: 16 March 2023
/
Accepted: 17 March 2023
/
Published: 22 March 2023
(This article belongs to the Special Issue New Era in the Volume Phase Transition of Gels II)
Abstract
:One of the emerging water desalination techniques relies on the compression of a polyelectrolyte gel. The pressures needed reach tens of bars, which are too high for many applications, damage the gel and prevent its reuse. Here, we study the process by means of coarse-grained simulations of hydrophobic weak polyelectrolyte gels and show that the necessary pressures can be lowered to only a few bars. We show that the dependence of applied pressure on the gel density contains a plateau indicating a phase separation. The phase separation was also confirmed by an analytical mean-field theory. The results of our study show that changes in the or salinity can induce the phase transition in the gel. We also found that ionization of the gel enhances its ion capacity, whereas increasing the gel hydrophobicity lowers the pressure required for gel compression. Therefore, combining both strategies enables the optimization of polyelectrolyte gel compression for water desalination purposes.
1. Introduction
Fresh water production is one of the most pressing issues for modern humanity [1]. Seawater desalination offers an option to satisfy the increasing demand of fresh water. There are many technologies that can be divided into two groups, namely thermal-based (e.g., multistage flash distillation) and membrane-based (e.g., reverse or forward osmosis) methods. Each group of methods has advantages and disadvantages. For example, the traditional thermal-based desalination is simpler and cheaper as itself, but associated with high energy costs, whereas the membrane-based technology has lower operating costs, but requires very expensive membranes [2,3].
An alternative desalination method using polyelectrolyte hydrogels has been proposed recently [4,5,6]. It can be viewed as a modification of the forward osmosis (FO) method, where the gel acts both as the draw solute and as the separation membrane [5,7].
A hydrogel is a gel in which the swelling agent is water [8]. Here, we use this term for a network of cross-linked polymer chains, which swells in aqueous solutions. The swelling equilibrium is determined by the interplay between the network elasticity and the osmotic pressure created by the solvent penetrating the network. Hydrogels are known as super-absorbers for their ability to absorb huge amounts of water and can increase their initial (dry) volume by three orders of magnitude [9]. Thanks to these properties, hydrogels have a wide range of applications, including personal care (disposable diapers) [10], agriculture (improving soil water retention) [11] and bioengineering (self-healing materials) [12,13], in addition to water desalination [14,15]. Hydrogels with controllable features are also known as “stimuli-responsive” materials [16,17] because they can change their properties in response to different external stimuli, such as pH, salinity, or electric fields.
The stimuli-responsive properties of polyelectrolytes (PEs) result from the interplay between long-ranged electrostatic forces, short-ranged steric interactions and the entropic elasticity of polymer chains. In a solution, polyelectrolytes show not only large continuous volume changes during swelling–deswelling, but also first-order volume-phase transitions (VPT). These phenomena were theoretically first predicted and explained for weakly charged strong polyelectrolytes by Borue and Erukhimovich [18] and later extended to solutions of linear PE chains [19,20,21], PE stars [22,23,24] and PE combs [25]. Nevertheless, experimental evidence of phase transitions and microphase separation in PEs has also been reported in several studies [26,27,28].
VPT in gels was already theoretically predicted by Dušek [29] using Flory theory in 1968 and later experimentally demonstrated [30]. VPT and microphase separation in gels upon changes in temperature and solvent composition were then studied many times, e.g., [31,32,33,34,35].
Upon varying the number of fixed ionic groups and the Coulomb coupling parameter, Mann et al. demonstrated the co-existence of microphases in polyelectrolyte hydrogels, namely a sausage-like state, a state with nodes (condensation nucleus), and a pearl-necklace state [36]. Furthermore, VPT can also be induced by increasing the temperature (and subsequently changing the solvent quality) in pNIPAM-gels incorporated with acrylic acid groups [37,38], by changing the of phenylboronic acid-based hydrogels [39,40,41], by inducing mechanical uniaxial stress in pNIPAM-gels [42], and even by adding salt [43,44,45,46,47].
Recently, by applying the mean-field analytical theory [48], we demonstrated that the phase transition allows for a higher compression rate for hydrophobic polymer hydrogel compared to hydrophilic gel. Thus, theoretically, a larger volume of a solution may be extracted from a hydrophobic polymer gel during VPT without requiring high pressures. Although some authors have reported the experimental feasibility of salt water desalination using a poly(acrylic acid) hydrogel [4], which can be reused for several cycles even when compressed to 80 bars [5], others have argued that the hydrogel reversibility is limited to pressures of a few atmospheres [49,50]. In this context, we hypothesize that operating hydrophobic polymer gels at VPT and optimizing other conditions for lower pressure may avoid gel damage, thereby enabling the reuse of these gels in a large-scale water desalination process.
In this study, we aimed to investigate the structure of weak polyelectrolyte hydrogels upon their compression at different conditions: difference, solvent quality (or gel hydrophobicity), and salinity. For this purpose, we performed coarse-grained simulations and their comparison with an analytical mean-field theory [48]. Our findings complement the understanding of VPT in weak polyelectrolyte hydrophobic gels and provide insight into the internal structure of such gels at the phase transition region, with potential implications for the water desalination process by means of lowering the working pressure and subsequently mitigating the problem of damage of the hydrogel network.
2. Results and Discussion
2.1. Gel Model
We model the gel as a diamond-like network of polymer chains. Each chain comprises monomer units. The network is in equilibrium with a reservoir of aqueous (bulk) solution at specific concentration of positive and negative monovalent ions, denoted as and .
Each monomer unit (bead) of the network carries an acidic pendant, which can be either charged or uncharged, according to the following reaction:
where K is the ionization equilibrium constant.
Due to this reaction, the gel is partially charged, and the ionization degree varies depending on the parameters of the environment
where and are the densities of charged and non-charged monomer units.
At the same time, each monomer unit carries a hydrophobic pendant, characterized by a hydrophobicity parameter. Depending on the simulation approach, as a hydrophobicity parameter we use either (the Lennard–Jones interaction parameter) or —the Flory–Huggins parameter.
The two approaches used in our study are the: coarse-grained (CG) and mean-field (MF) simulation modeling.
2.1.1. Coarse-Grained (CG) Model
In this model, we consider a network of 16 polymer chains, which are interconnected via periodic boundary conditions to emulate the bulk hydrogel. We account for three simultaneous processes: (1) the mechanical movement of all the particles, (2) the ionization reaction of the gel monomer units and (3) the grand-canonical exchange of and ions with a reservoir. We used Langevin molecular dynamics to sample process (1) and and Monte Carlo for sampling the grand reaction ensemble [51,52] accounting for processes (2) and (3).
The volume of the simulation box , the hydrophobicity parameter , the chemical potentials of the ions and the ionization constant K are the input parameters for the simulation. The output are the averages of pressure, number of ions and in the simulation box, ionization degree, from Equation (2) and other quantities of interest. We also determine the pressure of the bulk solution by running a separate simulation of the same system, but without the gel.
The difference of the obtained pressure and the pressure of the bulk solution gives the pressure difference p, that must be applied to the hydrogel using a solvent permeable piston to achieve the desired gel (number) density , that we define as , where N is the number of monomers in a single gel strand ( in our simulations), V is volume of the simulation box and is the Avogadro constant. We use density as the independent variable, which we set by varying the simulation box volume.
2.1.2. Mean Field (MF) Model
The mean-field approximation is based on the classical lattice Flory theory of polymers. In this approximation, a gel network strand of the length N was considered interacting with a mean-field produced by the other components of the system: water, salt ions, and the rest of the gel [22,53]. The free energy of a chain, F, consists of three independent terms: The conformational entropy of a uniformly extended chain , short-range non-electrostatic interactions (which account for the hydrophobicity of the gel network) , and the ionic contribution
The entire formula for the free energy is a function of the gel density and contains , and as parameters. We obtain the pressure applied to the gel as a derivative of the hydrogel free energy with respect to the gel molar volume
The expanded view of the expression (3) can be found in Section 4.3.
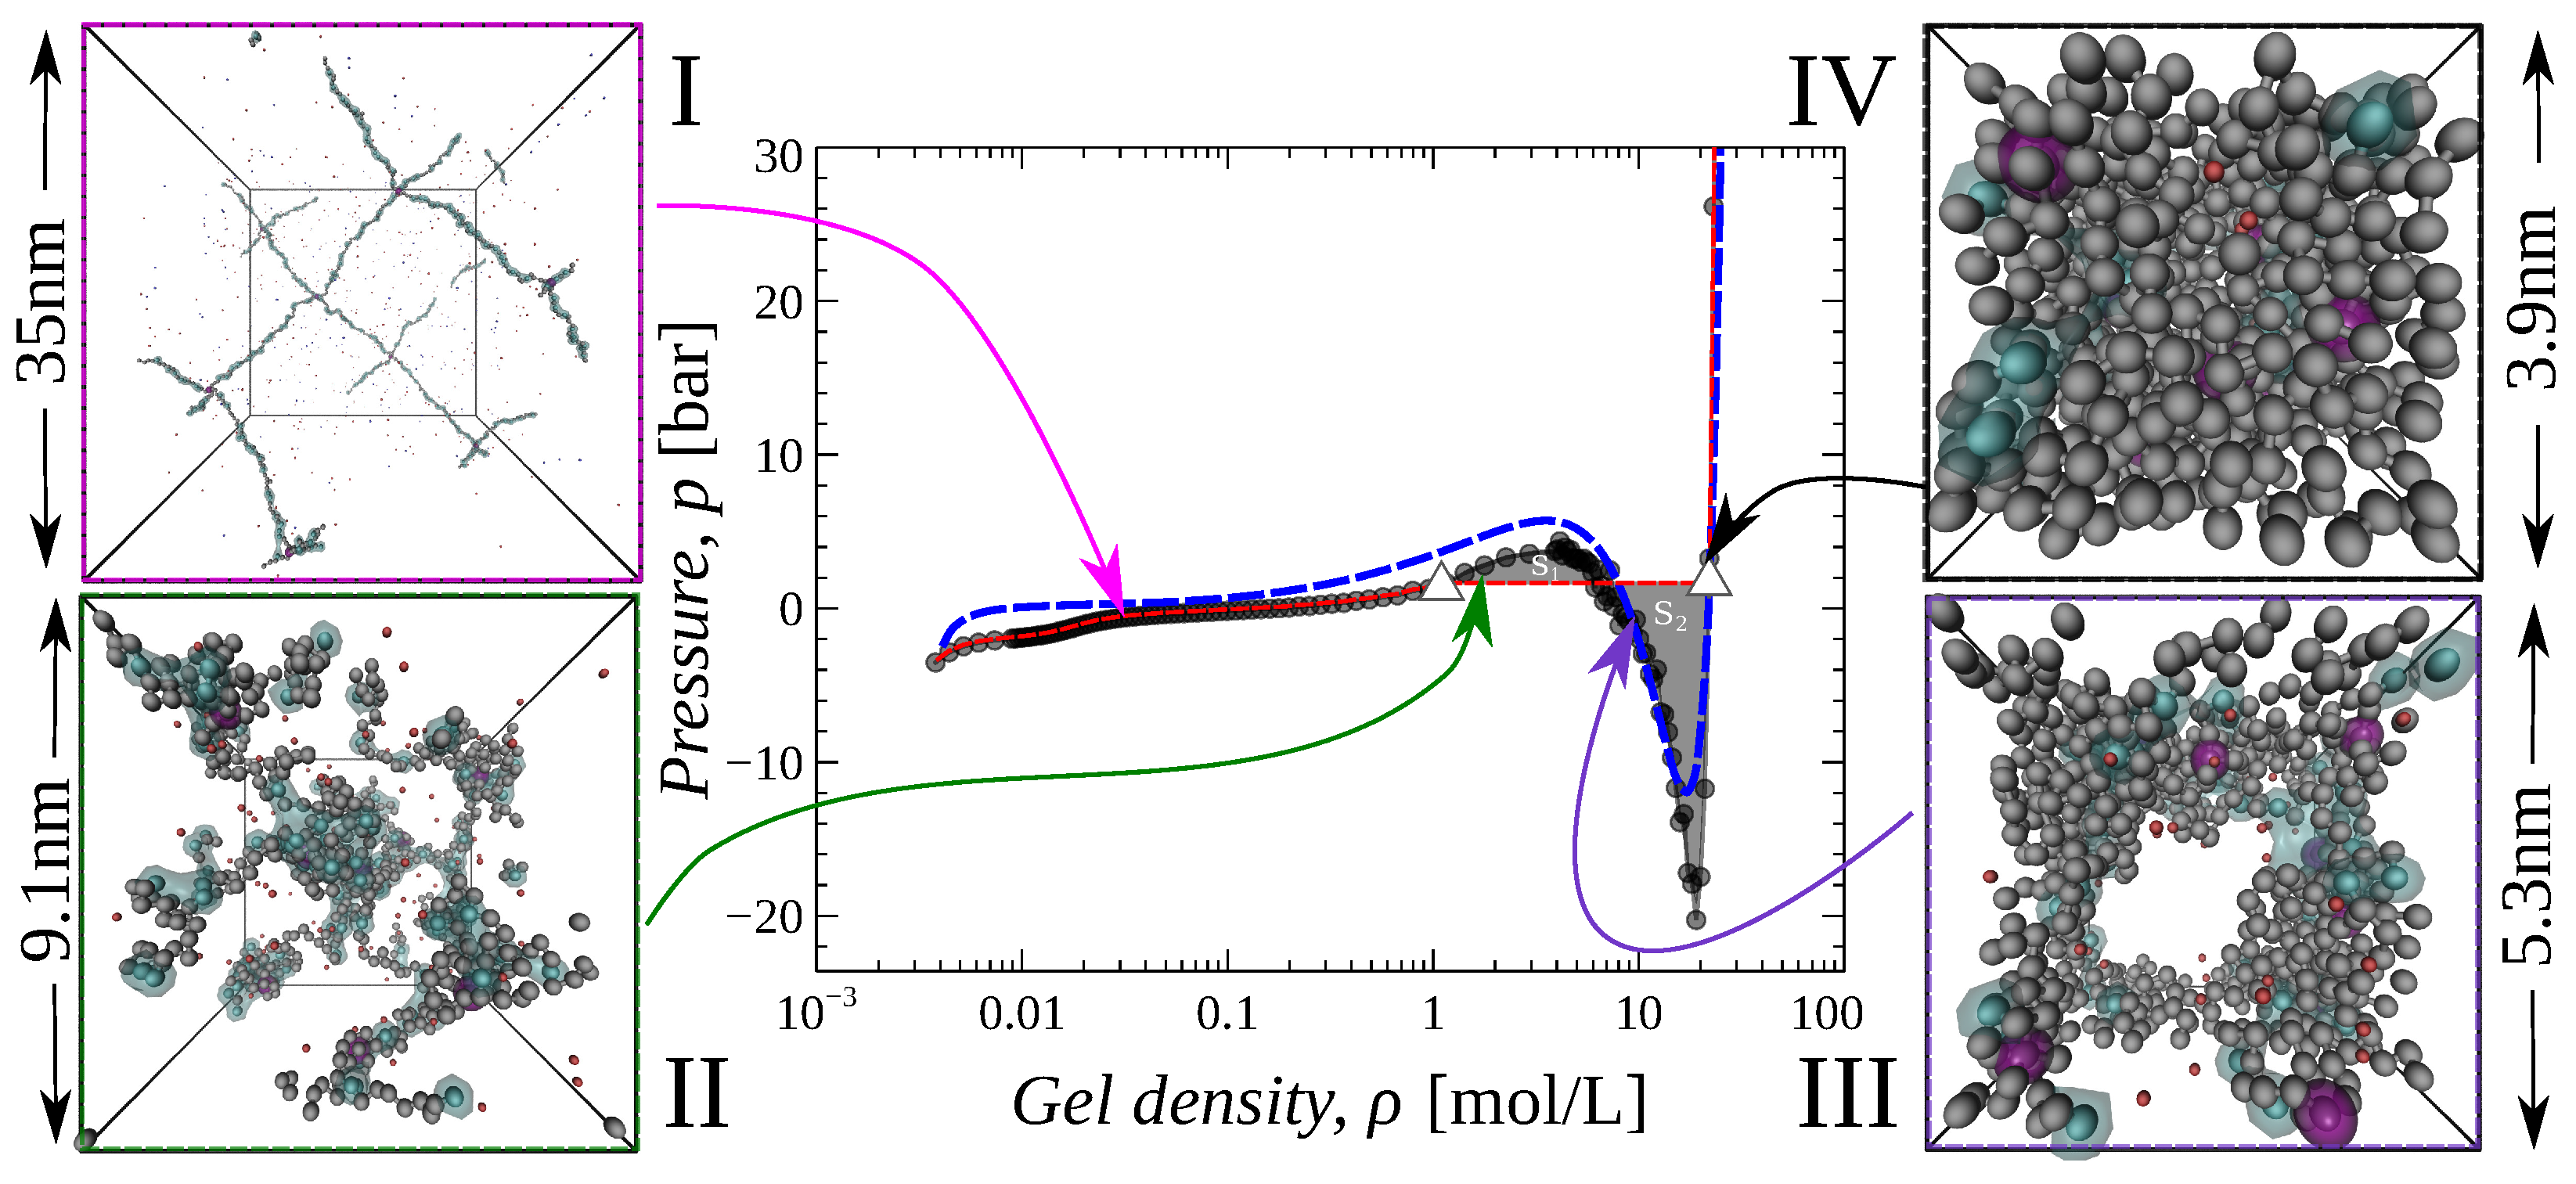
2.1.3. Maxwell Construction
Under some conditions, the solution of Equation (4) and the results of simulations lead to an unphysical outcome, that is, a decrease in the applied pressure with the gel compression, as shown by the loop between the white triangles of the black pressure-extension curve in Figure 1. This resembles the behavior of models of real gases, where competition between attractive and repulsive interactions results in phase separation. This similarity allows us to draw an analogy between the hydrogel phase transition theory and the van der Waals theory of the liquid–vapor phase transition [54,55] when the analytical description of liquid/vapor (in our case hydrogel) behavior is represented by unrealistic, non-monotonic functions of applied pressure on density.
To plot a realistic (monotonic) pressure-extension dependence we use the so-called Maxwell construction [56,57]. The Maxwell construction allows us to replace the van der Waals loops by horizontal lines, which are drawn such that the areas, and , bounded by the line and the loop from above and below are equal. The Maxwell construction is shown in Figure 1 by the red dashed line and it shows a monotonous increase of the pressure versus compression. This dependence consists of three parts: first, at low densities, p increases with density, then it reaches a plateau and remains constant, then at a certain high density it starts to increase abruptly.
The presence of the plateau in the dependence indicates the first order phase transition happening in the gel during compression.
2.2. Pressure Extension Curve
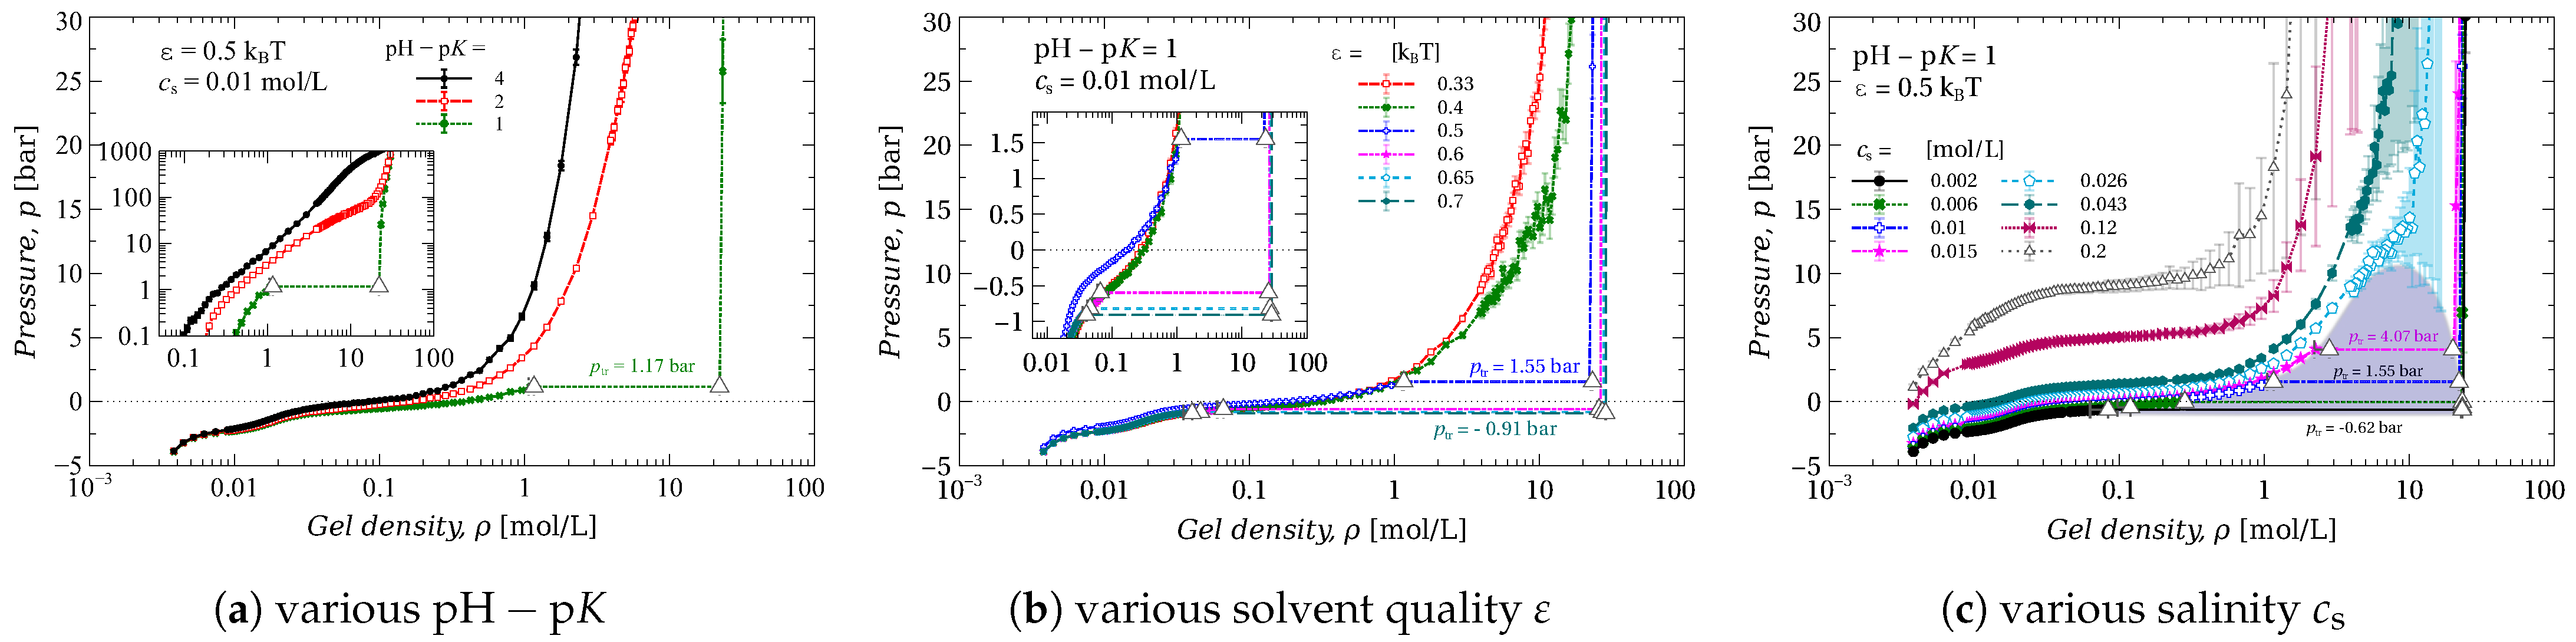
We studied gel compression under different conditions by varying the solvent quality ( parameter), salt concentration , and difference. Figure 1 and Figure 2 show the corresponding dependencies of the pressure difference p on the gel density .
The dependencies presented in the figures can be divided into two types, depending on whether: (i) the pressure increases monotonically with gel density or (ii) the contains a plateau due to the Maxwell construction. In the latter case, the dependencies consist of three regions: (a) in the low-density region, the compression reacts as a smooth increase of pressure p. This region corresponds to a single phase of swollen gel (e.g., inset I in Figure 1); (b) in the high-density region, compression causes a sharp increase of p, which corresponds to the compression of a single phase of collapsed (dry) gel (e.g., inset IV in Figure 1); (c) between these two regions, the pressure remains constant. We assume that this region corresponds to the coexistence of two phases of the gel (e.g., insets II and III in Figure 1) and we refer to the value of the pressure in this region as transition pressure .
Although the pressure is constant in the two-phase region, the average gel density, , varies with the compression. The average is calculated over the two coexisting phases, so the fractions of both phases define the value of according to the lever rule [57].
In the two-phase region, the hydrogel has a domain structure, as shown in insets II and III in Figure 1. In inset II, the domains are small and interconnected through a large number of stretched chains, but in the more compressed state (inset III), the size of the domains is bigger, whereas the fraction of stretched chains is smaller. The physics of such a phase transition lies in the interplay between electrostatic and hydrophobic interactions. Electrostatic interactions are long-ranged and repulsive, whereas hydrophobic ones are short-ranged and attractive. The compression forces the gel beads to discharge; the discharged beads stick together and form dense domains.
The difference plays a key role in the formation of the gel structure. In Figure 2a, it is seen that the gel with and 2 does not exhibit phase transition, whereas the gel with , by contrast, passes through the plateau and thus exhibits phase transition (VPT).
The change of from to models solvent quality deterioration from to poor solvent, respectively [58]. The increase of causes VPT, and moreover leads to a decrease of transition pressure , and to a broadening of the transition region, see Figure 2b.
The change of the surrounding salinity affects the phase transition as well, see Figure 2c. In order to show it, we varied the salinity from mol/L to low mol/L. At high salinity, the pressure gradually increases with gel compression. At mol/L, the corresponding curve seems to be passing through a critical point. With a further decrease of the salt concentration, VPT occurs, at transition pressures of a few bars. The transition pressure decreases with the decrease of .
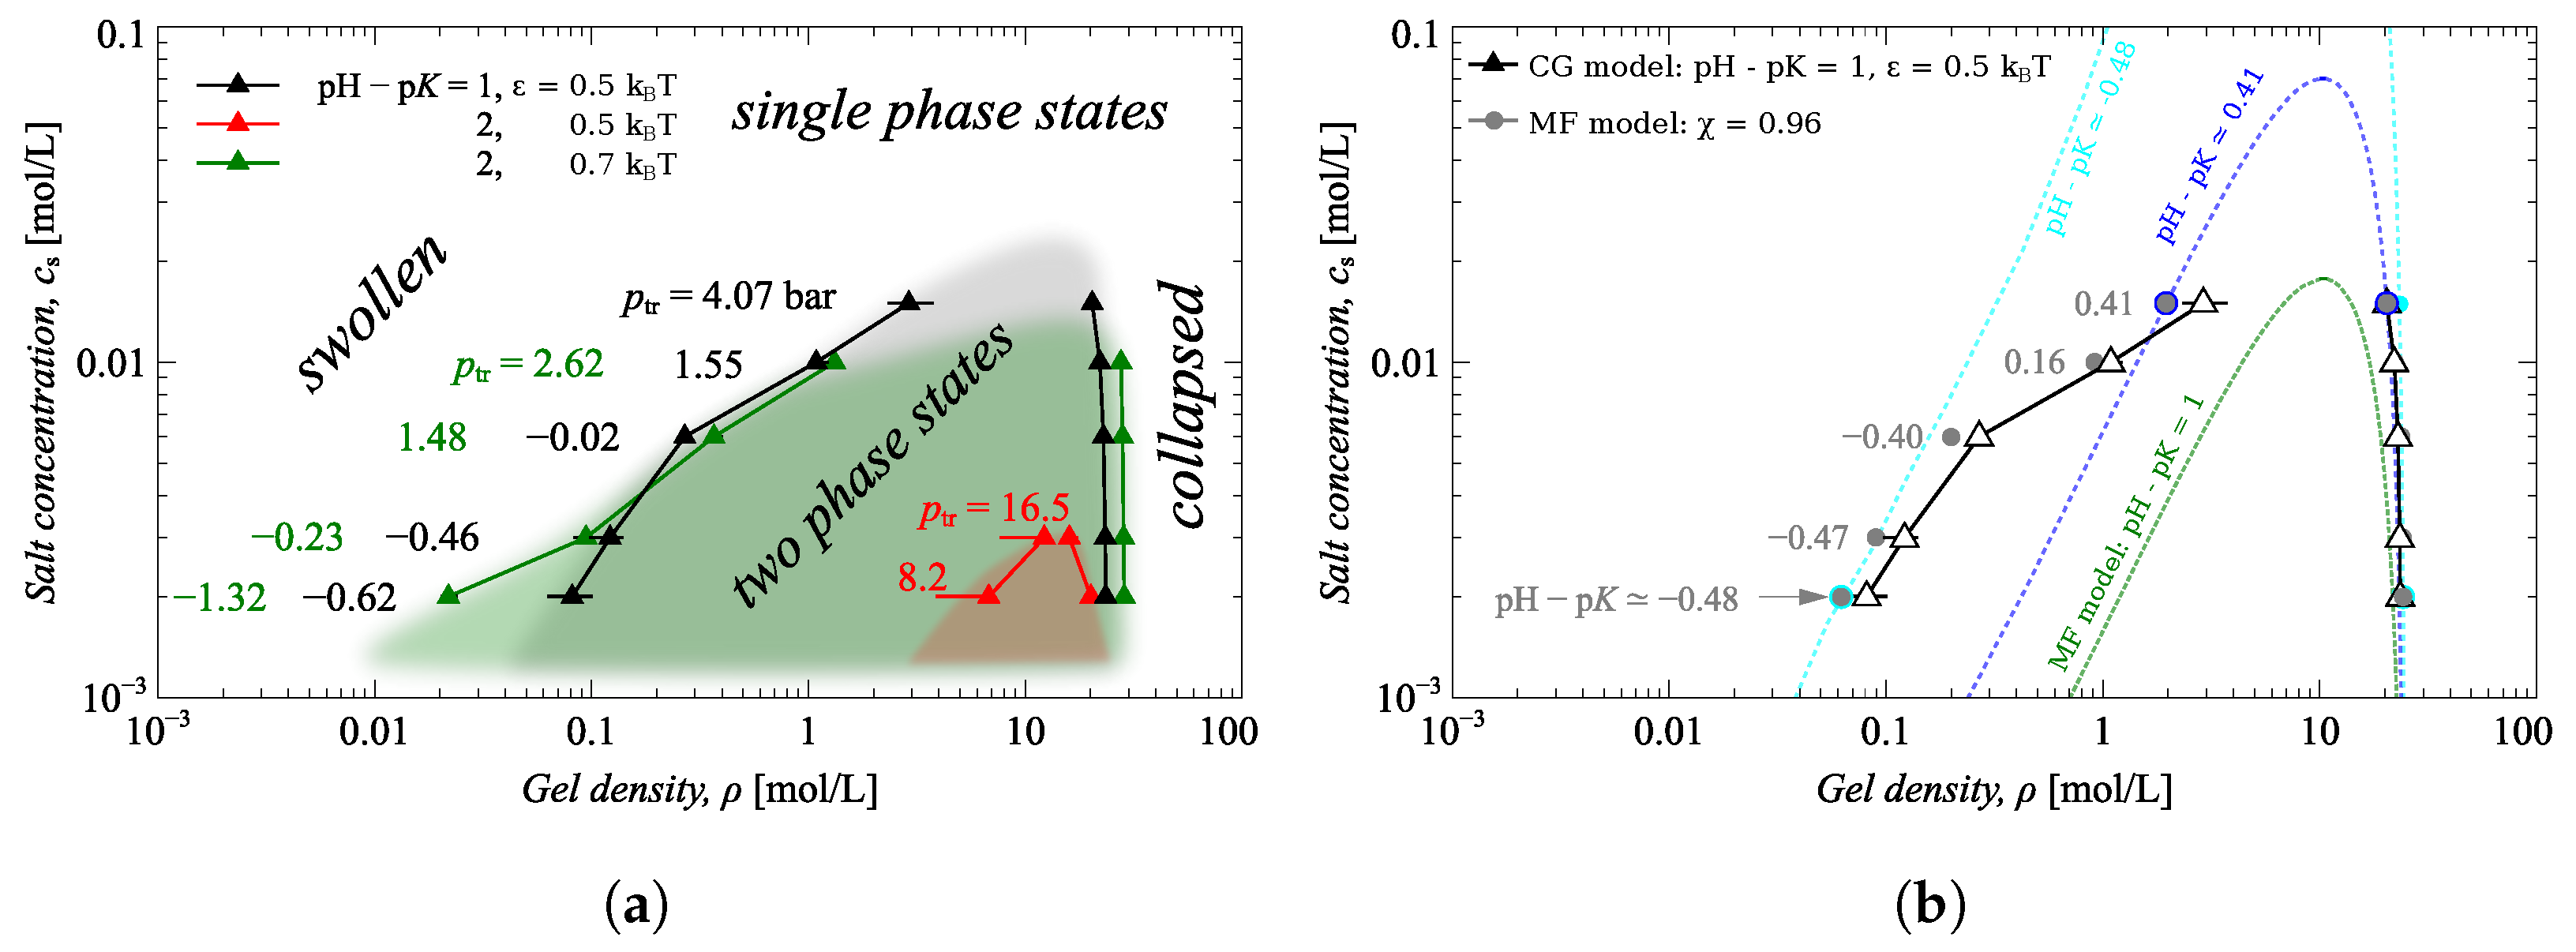
2.3. Phase Diagram
The two-phase region can be defined by drawing a line (binodal) through the white triangles in pressure-extension curves at different salt concentrations in Figure 2c. The gel has two phases inside the binodal and only one outside, which is either swollen (at low ) or collapsed (at high ), as shown in Figure 2c where the shadowed area represents the two-phase region.
The two-phase region is also highlighted in the phase diagram in Figure 3a, which is plotted in the coordinates: salinity versus gel density . Figure 3a shows how the state of the gel depends on the salinity and the gel density. The states marked by black triangles in this figure are the same states as those marked by triangles in Figure 2c, i.e., these points belong to a binodal line separating the single phase and two-phase states of the gel. The shadowed areas are the guides to eyes marking the two-phase regions of the phase diagram.
Figure 3a also shows that the increase of the narrows the two-phase region and increases the transition pressure , whereas the increase of broadens this region and decreases the . Both of these effects are manifested by the fact that the binodal corresponding to and , and the binodal for and are almost lying on top of each other.
Figure 3b compares simulations results for and with the results of analytical theory. To enable this simple, one-to-one comparison, between simulations (black curve) and analytical theory solutions (green curve), we applied the settings used in the simulations to the analytical theory, namely and solvent quality (that approximately corresponds to ). In order to obtain the correspondence, we fitted the coarse-grained model simulation data by the mean-field formula Equation (4). For details of the fitting procedure, see the ESI Section S3.
The MF model predicts the two-phase region to be much narrower than that provided by the CG model (compare the green dashed line with the black line with triangles). Nevertheless, the higher the salt concentration, the better both models agree, and both binodals (black and green lines) seem to be passing through the same critical point. This is due to the more screened electrostatic interactions at high salinity. The agreement between the CG and MF models at low salinity can be improved by allowing pH–pK to be a fitting parameter (“effective” pH–pK). This correction of the MF model accounts for its oversimplified description of electrostatics.
The gray dots on the plot are the results of fitting the CG model data by the MF theory by varying pH–pK parameters (and fixed ). Each pair of gray points, composing the binodal, is calculated by the MF model for different (fitted) pH–pK, as indicated in the plot (numbers printed in gray). It is evident that the MF model binodal line follows the binodal of the CG model providing that the “effective” pH–pK decreases with decreasing salinity. This decrease of effective pH–pK can be explained by the screening of electrostatic interactions. As stated above, the MF model underestimates the ionic contribution, accounting only for the Donnan partitioning effect on gel ionization, whereas the CG model accounts for the direct electrostatic interactions and, therefore, for the screening by the mobile ions. The lower the salinity, the stronger the direct electrostatic interactions; therefore, the higher energy needed for ionization of the neighboring beads of the gel network, which manifests itself as a dependence of the effective pK on the salt concentration.
Based on Figure 2 and Figure 3, we conclude that VPT lowers the pressure needed for the compression of the gel. As a result, a hydrophobic gel becomes more suitable for water desalination than a hydrophilic one. However, the ion capacity of the gel, that is, the number of salt ions that the gel can absorb, is determined by its ionization degree.
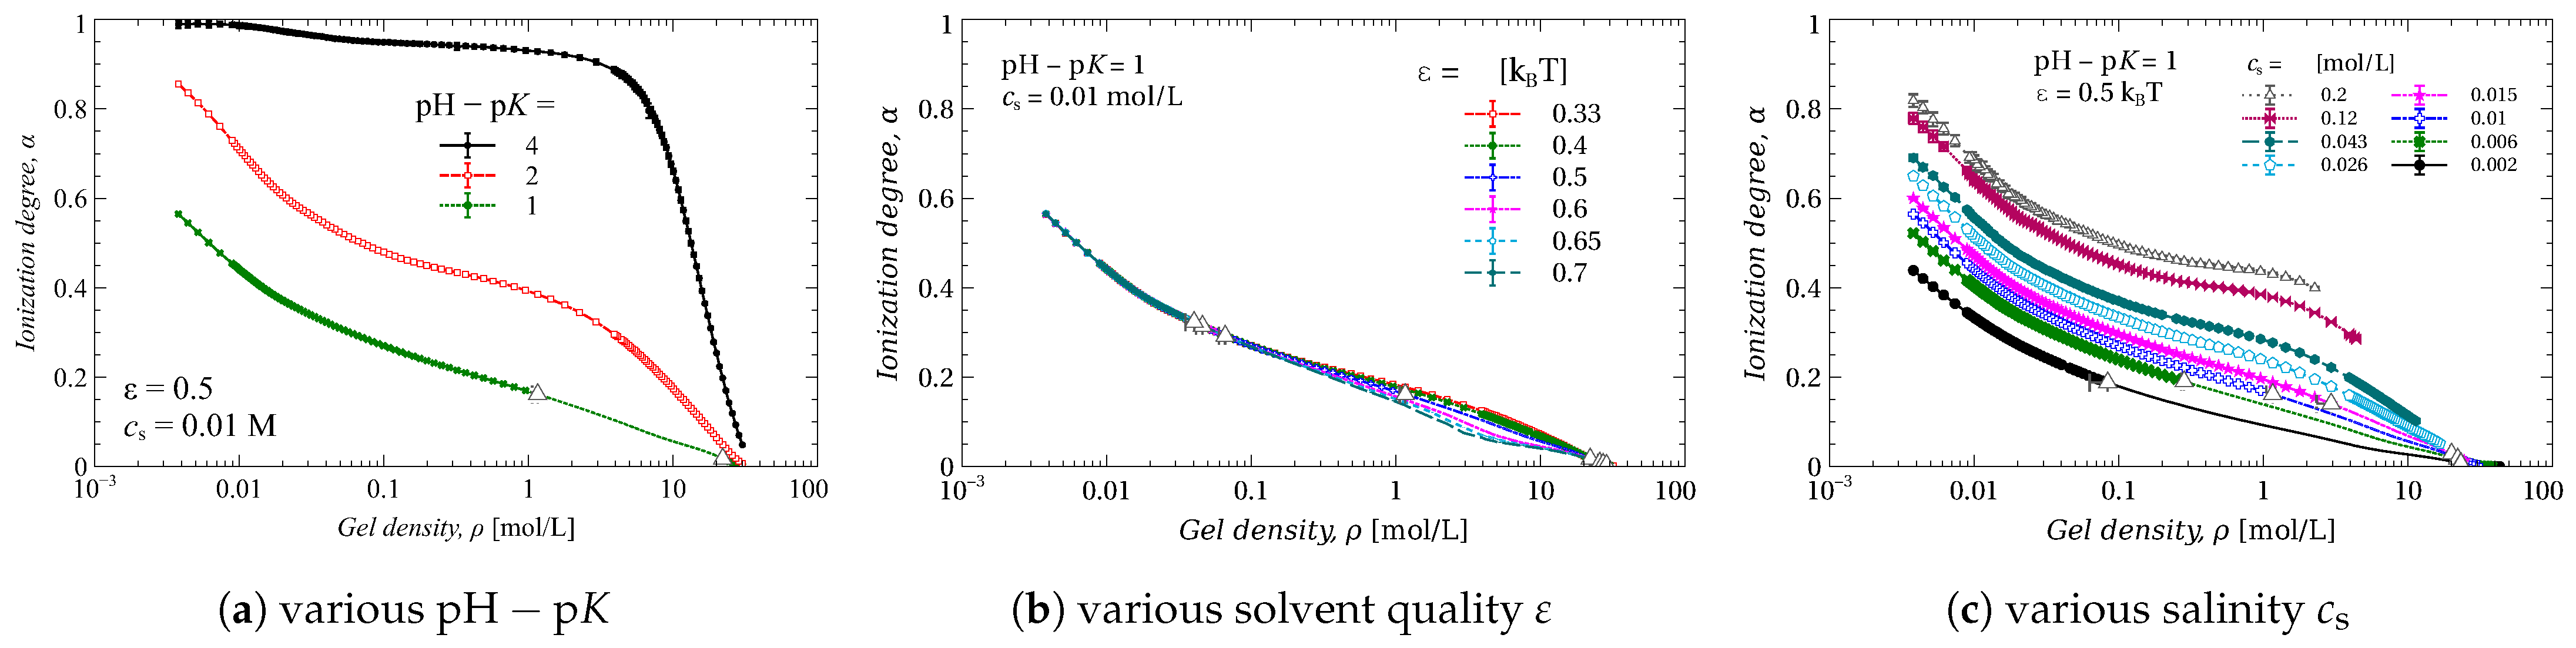
2.4. Ionization Degree of the Gel
Figure 4 shows the average gel ionization degree as a function of gel density . This dependence is displayed in the same manner as in Figure 2: for various (Figure 4a), various (Figure 4b), and various (Figure 4c). Although different phases should have different ionization degrees [23,25], the phase separation does not show up in the dependencies of the average gel ionization; all the dependencies look smooth. We highlighted the points belonging to binodals as in Figure 2, by white triangles.
All three plots show that the compression discharges the gel. The increase of significantly increases the gel ionization; this is quite an obvious pattern, which shows up in the growth of pressure needed for the gel compression (compare Figure 2 and Figure 4). By contrast, varying the solvent quality, , affects the ionization degree only weakly, which becomes noticeable at a gel density ranging from to 10 mol/L (Figure 4b). The salinity of the bath, , affects the ionization of the gel significantly (Figure 4c). The effect of salinity manifests itself in the decrease of the “effective” pK [57]. The presence of salt ions screens the electrostatic interactions of the neighboring chain beads, which, in turn, lowers the energy of their ionization. In other words: the higher the salinity, the higher the ionization.
2.5. Ion Transfer
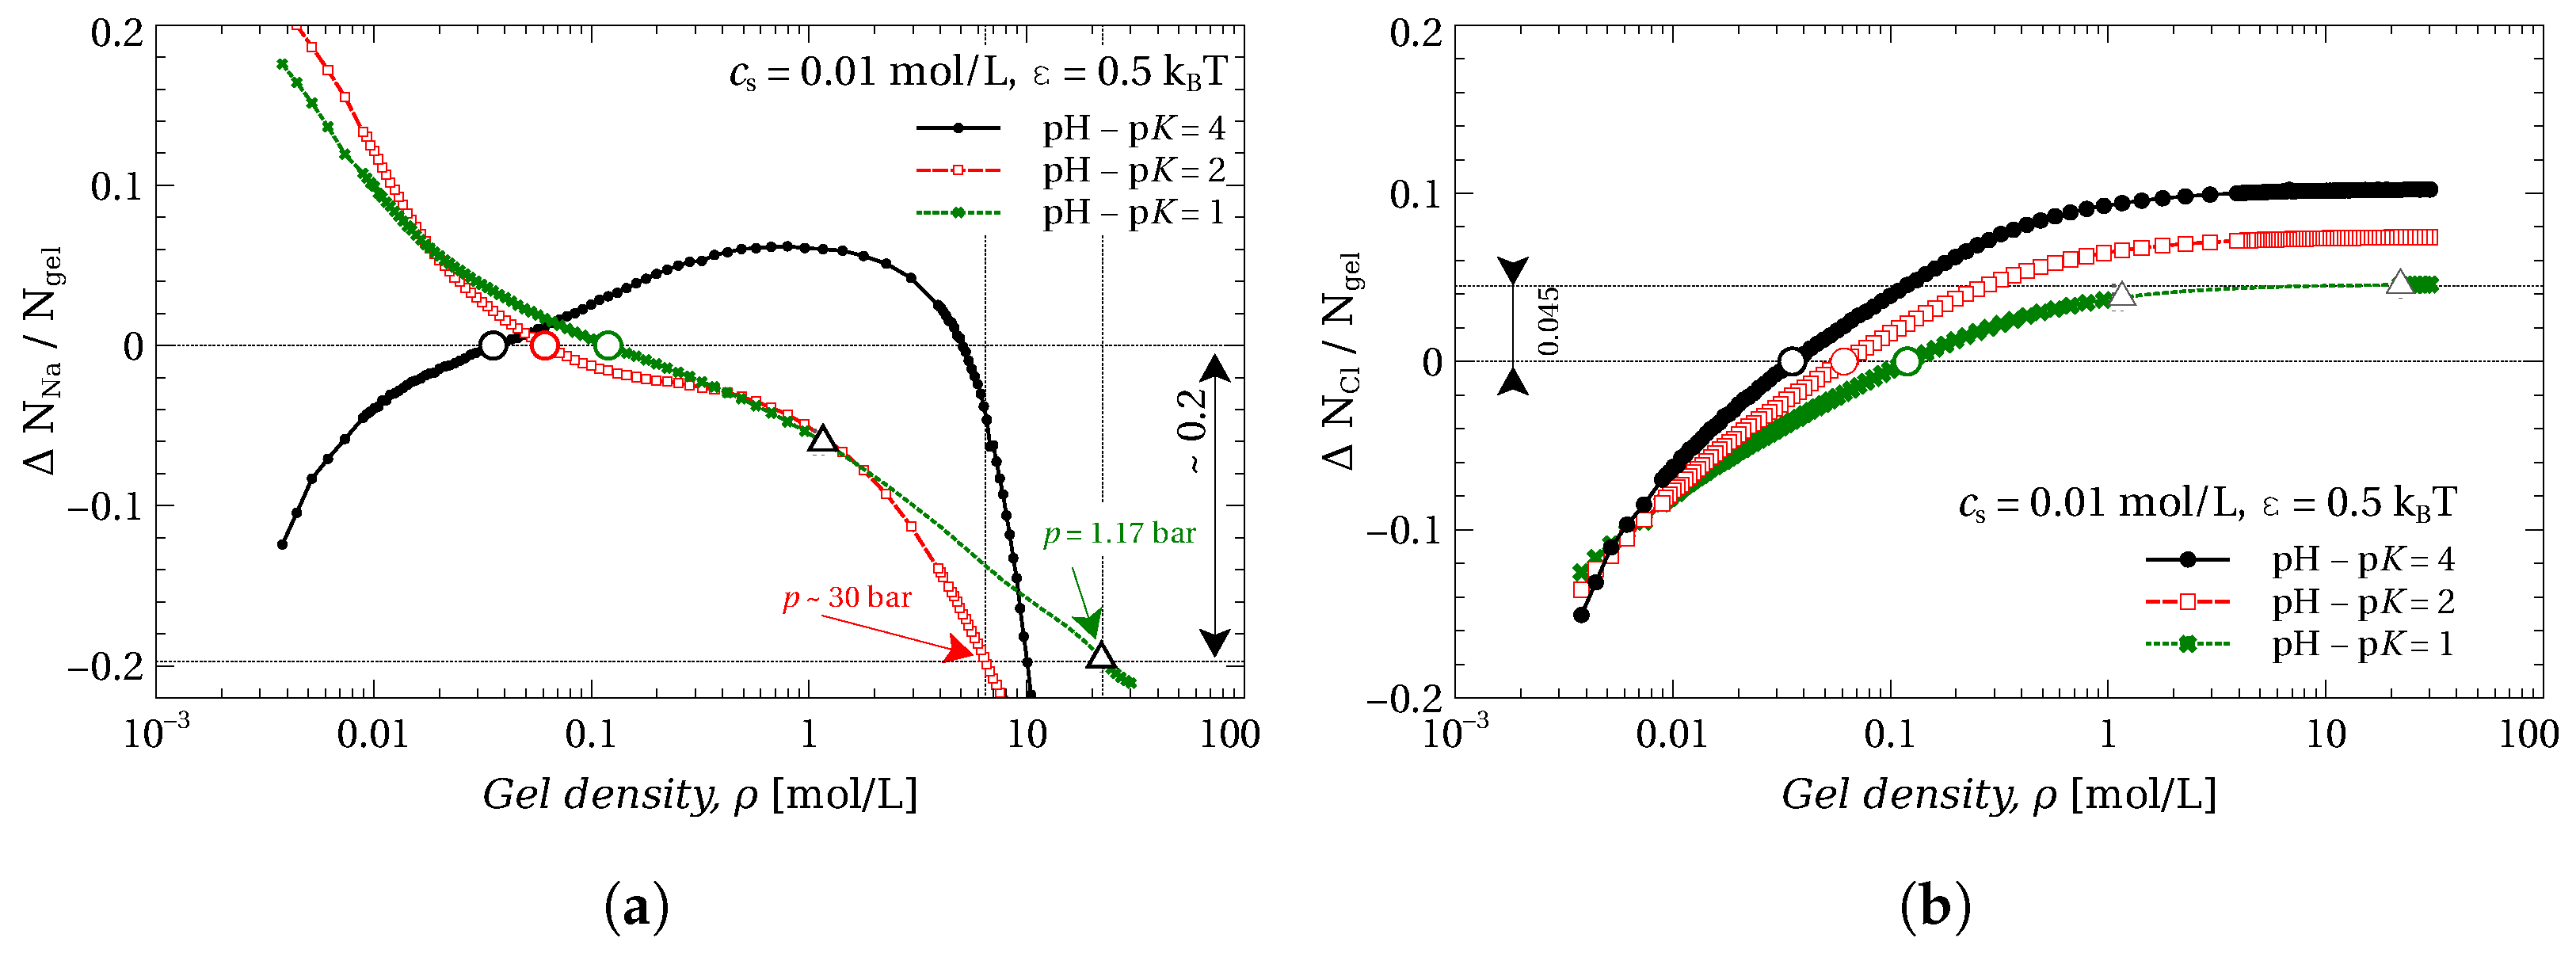
The presence of the charges on the gel chain implies the absorption of counterions into the gel and the rejection of co-ions. Figure 5a demonstrates how this phenomenon affects the transfer of ions during the gel compression. The plotted value is the change of the number of ions in a volume the gel is compressed in (calculated per bead of the gel). is the gel volume at free swelling equilibrium, i.e., at zero applied pressure. Thus, the change in the number of ions in this volume is
where the first term, is the number of ions in the gel, the second term is the number of ions in the outer volume, which is left after compression ( is the gel volume at a specific applied pressure), and is the number of in the gel at free swelling equilibrium (before compression). The positive value of implies that the ions are transferred from the bath to the volume , whereas the negative value of means that the ions are pushed out to the bath.
Figure 5a shows that, in general, the value is a non-monotonic function of compression. For the gel with high at low gel densities, which corresponds to almost constant ionization of the gel (compare the black lines in Figure 4 and Figure 5), the compression of the gel leads to the accumulation of ions in the volume . At higher compressions, the ions are released to the bath. This effect can be explained [59] as follows: While the gel does not discharge, the counterions remain inside the gel, thus their density in gel increases with compression. However, when the discharge rate of the gel becomes sufficiently high, the counterions are released from the gel, and thus from the volume as well.
The larger the change in upon compression in the two-phase region, the more ions are transferred and thus the more useful such a system is for desalination purposes. Figure 5a shows that employing the VPT in gel allows to reach rather high values of , using at the same time rather small pressures. For instance, the compression of the gel with allows us to transfer mol of ions per mol of gel beads using the pressure not exceeding bar. The same result for the gel with already requires a pressure of about 30 bar (compare with Figure 2) and it is even higher for the gel with .
Because the concentration of co-ions in the gel is always lower than in the bath, their number in the volume always increases with gel compression, disregarding whether the gel is discharging or not. These dependencies are present in Figure 5b and are quite different from those of the Figure 5a. This is apparently due to gel discharging (being protonated) during compression, which implies that the gel consumes H+ ions, which are not considered explicitly in our model. If we plotted the change of the total number of the counter-ions, i.e., Na+ minus the consumed H+ ions, we would observe the same dependencies as for the co-ions, ions.
The VPT described in this work is associated with the gel discharge; therefore, the compression of the gel always produces some water ions, or . The compression of a polyacid gel will produce OH- ions and release Na+ ions, and the compression of polybase gel will produce H+ ions and release ions. The simultaneous compression of both types of gel, producing equal amounts of and , would allow us to transfer both Na+ and Cl- ions simultaneously and thus may be utilized for water desalination [60].
In Figure 5, we considered only a particular case of ion transport at rather low salinity, mol/L. Nevertheless, the VPT can by induced at the conditions of higher salinity by tuning the properties of the gel: i.e., the hydrophobicity, , and .
3. Conclusions
We studied the VPT of a hydrophobic hydrogel, from swollen to collapsed states through intermediate states, in which two phases of the gel (swollen and collapsed) coexist in a proportion that varies with compression. At this intermediate state, the hydrogel has a domain structure. Some parts of the gel are collapsed and interconnected by stretched gel chains. In the two-phase region, compression of the gel occurs at a constant pressure and the domains sprawl. The two-phase region can be broadened by decreasing (making gel less charged) and increasing (making gel more hydrophobic). Being more hydrophobic and less charged makes the gel less swollen, and finally collapsed; and oppositely, being less hydrophobic and more charged makes the gel more swollen. This could be used in facilitating the feasibility of water desalination by lowering the necessary pressure over hydrophilic gels and reducing the wear and fouling of gel and making the desalination device simpler.
Analytical theory underestimates the range of the two-phase region and overestimates the transition pressure because it does not account for direct electrostatic interactions to the overall free energy of the gel in the simple mean-field model. However, varying with the salt concentration significantly improves the agreement between simulations and analytical theory results. The transition pressure difference decreases to only a few bars, and the two-phase region of the analytical theory nearly overlaps that of the simulation predictions. Therefore, the agreement between simulation and analytical theory results can be improved by introducing the relationship between and the salt concentration , thereby more accurately accounting for the ionic contribution.
4. Materials and Methods
As we mentioned above, our CG simulation approach accounts for mechanical movements, ionization reactions and ion exchange simultaneously. In order to simulate all these processes concurrently, we alternated short runs of Langevin dynamics (LD) and short runs of grand reaction ensemble Monte Carlo (MC) samplings.
Thus, after the system initialization and equilibration, we
- Run Langevin dynamics making 150 integrations, each by s, collecting samples of pressure values;
- Run the Monte Carlo simulating 4096 reaction steps of the gel ionization reactions and ion pair exchanges, collecting the numbers of and ions and the number of ionized beads ;
- Repeat until we collect a sufficient number of independent samples to obtain accurate estimates of relevant quantity values.
Since we study the thermodynamic equilibrium, the particular lengths of the LD and MD blocks do not affect the results, but may have a significant impact on the computational efficiency. For a more detailed explanation of the theory behind the simulation setup, we address the reader to previous studies [52,59] and to electronic supporting information (ESI).
4.1. Langevin Dynamics
All explicit particles in the model are represented as points interacting via spherically symmetric potentials. We consider water as an implicit solvent, i.e., a structureless continuum characterized by relative dielectric permittivity, .
All particles interact with each other via non-bonding interactions described by Lennard–Jones potential [61]:
where r is the distance between particles, is the characteristic size of particles (we have chosen to be equal ), is the depth of the potential well, ensures that the potential is continuous at , and is the cut-off distance beyond which the potential is zero allowing for faster summation over pairs of particles.
The Lennard–Jones potential was originally developed to model liquid neon and not to describe the effective interactions of polymer segments. Although the interactions in macromolecular systems are more complex [62], this potential is widely used for non-bonding interactions in polyelectrotes [63,64].
We set the interactions between ions, as well as the interactions between ions and gel segments, to be purely repulsive. For that, we set the potential parameters and . The attraction between the hydrogel particles, i.e., the effect of hydrophobicity of the gel network, was introduced by the attractive part of the Lennard–Jones potential, in particular by setting , and varying .
Chemical bonds between gel particles are described by the finite-extension non-linear elastic (FENE) potential [65]:
where is the magnitude of the symmetric interaction between two particles and is the maximal bond length. In our simulations, we use parameters , [66].
The long-range electrostatic interactions are modeled via the Coulomb potential:
where is the Bjerrum length. In our model, we set , which corresponds to the Bjerrum length in water at . The electrostatic energy of the whole system was calculated by a Particle-Particle-Particle-Mesh (P3M) method [36].
The Langevin thermostat was used to ensure that the system was in thermal equilibrium with the heat bath at a temperature of [66].
4.2. Monte Carlo
Short runs of Monte Carlo simulations accounted: (i) for the ionization of monomer units (Equation (1)), and (ii) for the exchange of and ion pairs with the reservoir, which we consider as a formal reaction:
where and are the chemical potentials of and ions. In our model, and differ only in the sign of the charge. We set because we refer them both to the standard state of a one molar NaCl solution. In order to obtain the relation between the chemical potential, , and the concentration, , of the respective component, we run a separate simulation of the the grand-canonical equilibrium between the reservoir and the system without gel. In this simulation, we set up a particular value of and obtain the corresponding salinity .
Due to low concentration of H+ ions near neutral pH, cH+ = 10−7 mol/L, we did not include explicit H+ ions in our model. Instead, we assumed that the reaction Equation (1) occurs only together with an exchange of ion with the H+ ion.
Thus, the reaction which we effectively model in our simulation is , and the effective reaction constant also accounts for the exchange of ion by . The chemical potential of ions, , we estimated as , thus we have (for more details see [59]).
4.3. Mean Field Theory
The Equation (3) expands as follows. The conformational entropy, Fconf, accounts for the finite extensibility of the chain [67]:
where the first term mimics Gaussian elasticity at small extensions and diverges when the chain is fully stretched. The logarithmic term accounts for the effect of chain compression. The parameter d > 0 characterizes the divergence behavior of the stretching energy; b is the chain Kuhn length (which we have chosen to be equal to σ from the CG model); and R is the end-to-end distance of a chain
where is the topological parameter of a diamond network, and φ is the polymer volume fraction. The molar density of the gel monomer units ρ is related to φ via coefficient: .
The short-range non-electrostatic interactions, Fint, are represented by the entropy of solvent (water) molecules and by the energy of polymer-solvent interactions defined by the Flory–Huggins parameter :
where φw is the density of pure solvent without ions φw = 1 − φ − φ+ − φ−; φ+ and φ− are the densities of mobile positive and negative ions [68], respectively.
The ionic part, Fion, is defined by the entropy and osmotic pressure of mobile ions as follows [22,34,69]:
Fint and Fion depend on the gel ionization degree α, which in turn is calculated from the electroneutrality condition and Donnan equilibrium via
Thus, the free energy is a function of the gel volume fraction , so by taking the derivative of the hydrogel molar free energy with respect to the gel molar volume, , we obtain the pressure applied to the gel
Supplementary Materials
The following supporting information can be downloaded at: https://www.mdpi.com/article/10.3390/gels9030259/s1. Figure S1: The pressure, p, as a function of the gel density, , for different (a) pH–pK, (b,c) solvent quality and (d–e) salt concentration cs; Figure S2: The Maxwell constructions on pressure-extension curves of hydrogels with the same hydrophobicity = 0.5 and different pK and salt concentration. Approximate values of the transition pressures are written in the legends and represented by the dashed horizontal lines on the plots. Each value of transition pressure is printed on the state diagram in the main manuscript; Figure S3: Results of the bootstrap fit of pressure-extension curves of gels with pH–pK = 1.0 and the same hydrophobicity = 0.5 and at different salt concentrations. The result of the fitting is an approximate value of parameter written in the legend. Transition pressure, ptr is calculated via Maxwell construction (if possible). Thus the = 0.35, N = 50, b = 2, d = 1.36, = 0.96 are reasonable parameters to use in the analytical theory; Figure S4: Snapshots of hydrophobic gel with pH–pK = 1, = 0.5. Each row corresponds to a certain salt concentration cs and each column to certain gel density. Snapshots in colored frames show the gel in the coexistence region; Figure S5; Snapshots of hydrophobic gel with pH–pK = 1, = 0.7. Each row corresponds to a certain salt concentration cs and each column to certain gel density. Snapshots in colored frames show the gel in the coexistence region; Figure S6: Probability distribution function of local gel density for pH–pK = 1, = 0.5. Each row corresponds to a certain salt concentration cs and each column to a certain gel density; Figure S7: Probability distribution function of local gel density for pH–pK = 1, = 0.7. Each row corresponds to a certain salt concentration cs and each column to a certain gel density.
Author Contributions
Conceptualization, O.V.R.; methodology, A.D.K. and V.M.P.; software, O.V.R.; validation, F.U., L.N. and O.V.R.; formal analysis, L.N.; data curation, A.D.K.; writing—original draft preparation, A.D.K. and V.M.P.; writing—review and editing, L.N., O.V.R. and F.U. All authors have read and agreed to the published version of the manuscript.
Funding
This research was funded by Grant Agency of the Czech Republic, grant No. 19-17847Y.
Institutional Review Board Statement
Not applicable.
Informed Consent Statement
Not applicable.
Data Availability Statement
Data is contained within the article or Supplementary Material.
Acknowledgments
Computational resources were provided by the e-INFRA CZ project (ID:90140), supported by the Ministry of Education, Youth and Sports of the Czech Republic.
Conflicts of Interest
The authors declare no conflict of interest.
References
- Darre, N.C.; Toor, G.S. Desalination of Water: Review. Curr. Pollut. Rep. 2018, 4, 104–111. [Google Scholar] [CrossRef]
- Khawaji, A.D.; Kutubkhanah, I.K.; Wie, J.M. Advances in seawater desalination technologies. Desalination 2008, 221, 47–69. [Google Scholar] [CrossRef]
- Qasim, M.; Badrelzaman, M.; Darwish, N.N.; Darwish, N.A.; Hilal, N. Reverse osmosis desalination: A state-of-the-art review. Desalination 2019, 459, 59–104. [Google Scholar] [CrossRef] [Green Version]
- Höpfner, J.; Klein, C.; Wilhelm, M. A Novel Approach for the Desalination of Seawater by Means of Reusable Poly(acrylic acid) Hydrogels and Mechanical Force. Macromol. Rapid Commun. 2010, 31, 1337–1342. [Google Scholar] [CrossRef] [PubMed]
- Arens, L.; Albrecht, J.B.; Höpfner, J.; Schlag, K.; Habicht, A.; Seiffert, S.; Wilhelm, M. Energy Consumption for the Desalination of Salt Water Using Polyelectrolyte Hydrogels as the Separation Agent. Macromol. Chem. Phys. 2017, 218, 1700237. [Google Scholar] [CrossRef]
- Yu, C.; Wang, Y.; Lang, X.; Fan, S. A Method for Seawater Desalination via Squeezing Ionic Hydrogels. Environ. Sci. Technol. 2016, 50, 13024–13031. [Google Scholar] [CrossRef]
- Cai, Y.; Hu, X.M. A critical review on draw solutes development for forward osmosis. Desalination 2016, 391, 16–29. [Google Scholar] [CrossRef]
- IUPAC. Compendium of Chemical Terminology, 2nd ed.; (The “Gold Book”); Blackwell Scientific Publications: Oxford, UK, 1997. [Google Scholar] [CrossRef]
- Zohuriaan-Mehr, M.J.; Omidian, H.; Doroudiani, S.; Kabiri, K. Advances in non-hygienic applications of superabsorbent hydrogel materials. J. Mater. Sci. 2010, 45, 5711–5735. [Google Scholar] [CrossRef]
- Haque, M.O.; Mondal, M.I.H. Cellulose-Based Hydrogel for Personal Hygiene Applications. In Polymers and Polymeric Composites: A Reference Series; Springer International Publishing: Berlin/Heidelberg, Germany, 2019; pp. 1339–1359. [Google Scholar] [CrossRef]
- Sikder, A.; Pearce, A.K.; Parkinson, S.J.; Napier, R.; O’Reilly, R.K. Recent Trends in Advanced Polymer Materials in Agriculture Related Applications. ACS Appl. Polym. Mater. 2021, 3, 1203–1217. [Google Scholar] [CrossRef]
- Gao, N.; You, H. Recent Applications of Point-of-Care Devices for Glucose Detection on the Basis of Stimuli-Responsive Volume Phase Transition of Hydrogel. BioChip J. 2021, 15, 23–41. [Google Scholar] [CrossRef]
- Lim, H.L.; Hwang, Y.; Kar, M.; Varghese, S. Smart hydrogels as functional biomimetic systems. Biomater. Sci. 2014, 2, 603–618. [Google Scholar] [CrossRef] [PubMed]
- Salehi, A.A.; Ghannadi-Maragheh, M.; Torab-Mostaedi, M.; Torkaman, R.; Asadollahzadeh, M. Hydrogel materials as an emerging platform for desalination and the production of purified water. Sep. Purif. Rev. 2021, 50, 380–399. [Google Scholar] [CrossRef]
- Fengler, C.; Arens, L.; Horn, H.; Wilhelm, M. Desalination of Seawater Using Cationic Poly(acrylamide) Hydrogels and Mechanical Forces for Separation. Macromol. Mater. Eng. 2020, 305, 2000383. [Google Scholar] [CrossRef]
- Roy, I.; Gupta, M.N. Smart Polymeric Materials. Chem. Biol. 2003, 10, 1161–1171. [Google Scholar] [CrossRef] [Green Version]
- Kopeček, J.; Yang, J. Hydrogels as smart biomaterials. Polym. Int. 2007, 56, 1078–1098. [Google Scholar] [CrossRef]
- Borue, V.Y.; Erukhimovich, I.Y. A statistical theory of weakly charged polyelectrolytes: Fluctuations, equation of state and microphase separation. Macromolecules 1988, 21, 3240–3249. [Google Scholar] [CrossRef]
- Dobrynin, A.V.; Rubinstein, M.; Obukhov, S.P. Cascade of Transitions of Polyelectrolytes in Poor Solvents. Macromolecules 1996, 29, 2974–2979. [Google Scholar] [CrossRef]
- Uyaver, S.; Seidel, C. Pearl-necklace structures in annealed polyelectrolytes. J. Phys. Chem. B 2004, 108, 18804–18814. [Google Scholar] [CrossRef]
- Rathee, V.S.; Sikora, B.J.; Sidky, H.; Whitmer, J.K. Simulating the thermodynamics of charging in weak polyelectrolytes: The Debye–Hückel limit. Mater. Res. Express 2018, 5, 014010. [Google Scholar] [CrossRef]
- Polotsky, A.A.; Zhulina, E.B.; Birshtein, T.M.; Borisov, O.V. Collapse of a weak polyelectrolyte star in a poor solvent. Soft Matter 2012, 8, 9446. [Google Scholar] [CrossRef]
- Rud, O.V.; Mercurieva, A.A.; Leermakers, F.A.M.; Birshtein, T.M. Collapse of Polyelectrolyte Star. Theory and Modeling. Macromolecules 2012, 45, 2145–2160. [Google Scholar] [CrossRef]
- Uhlík, F.; Košovan, P.; Zhulina, E.B.; Borisov, O.V. Charge-controlled nano-structuring in partially collapsed star-shaped macromolecules. Soft Matter 2016, 21, 4846–4852. [Google Scholar] [CrossRef] [PubMed]
- Prokacheva, V.M.; Rud, O.V.; Uhlík, F.; Borisov, O.V. Intramolecular micellization and nanopatterning in pH- and thermo-responsive molecular brushes. Soft Matter 2020, 16, 208–218. [Google Scholar] [CrossRef] [PubMed]
- Kiriy, A.; Gorodyska, G.; Minko, S.; Jaeger, W.; Štěpánek, P.; Stamm, M. Cascade of Coil-Globule Conformational Transitions of Single Flexible Polyelectrolyte Molecules in Poor Solvent. J. Am. Chem. Soc. 2002, 124, 13454–13462. [Google Scholar] [CrossRef] [PubMed]
- Kirwan, L.J.; Papastavrou, G.; Borkovec, M.; Behrens, S.H. Imaging the Coil-to-Globule Conformational Transition of a Weak Polyelectrolyte by Tuning the Polyelectrolyte Charge Density. Nano Lett. 2004, 4, 149–152. [Google Scholar] [CrossRef]
- Matějíček, P.; Podhájecká, K.; Humpolíčková, J.; Uhlík, F.; Jelínek, K.; Limpouchová, Z.; Procházka, K.; Špírková, M. Polyelectrolyte Behavior of Polystyrene-block-poly(methacrylic acid) Micelles in Aqueous Solutions at Low Ionic Strength. Macromolecules 2004, 37, 10141–10154. [Google Scholar] [CrossRef]
- Dušek, K.; Patterson, D. Transition in swollen polymer networks induced by intramolecular condensation. J. Polym. Sci. Part A-2: Polym. Phys. 1968, 6, 1209–1216. [Google Scholar] [CrossRef]
- Tanaka, T. Collapse of Gels and the Critical Endpoint. Phys. Rev. Lett. 1978, 40, 820–823. [Google Scholar] [CrossRef]
- Rabin, Y.; Panyukov, S. Scattering profiles of charged gels: Frozen inhomogeneities, thermal fluctuations, and microphase separation. Macromolecules 1997, 30, 301–312. [Google Scholar] [CrossRef]
- Kudlay, A.; Erukhimovich, I.; Khokhlov, A. Microphase separation in weakly charged annealed gels and associating polyelectrolyte solutions. Macromolecules 2000, 33, 5644–5654. [Google Scholar] [CrossRef]
- Quesada-Pérez, M.; Ramos, J.; Forcada, J.; Martín-Molina, A. Computer simulations of thermo-sensitive microgels: Quantitative comparison with experimental swelling data. J. Chem. Phys. 2012, 136, 244903. [Google Scholar] [CrossRef]
- Polotsky, A.A.; Plamper, F.A.; Borisov, O.V. Collapse-to-Swelling Transitions in pH- and Thermoresponsive Microgels in Aqueous Dispersions: The Thermodynamic Theory. Macromolecules 2013, 46, 8702–8709. [Google Scholar] [CrossRef]
- Nasimova, I.; Karino, T.; Okabe, S.; Nagao, M.; Shibayama, M. Small-angle neutron scattering investigation of pressure influence on the structure of weakly charged poly(N-isopropylacrylamide) solutions and gels. Macromolecules 2004, 37, 8721–8729. [Google Scholar] [CrossRef]
- Mann, B.A.; Kremer, K.; Holm, C. The Swelling Behavior of Charged Hydrogels. Macromol. Symp. 2006, 237, 90–107. [Google Scholar] [CrossRef]
- Hirotsu, S.; Hirokawa, Y.; Tanaka, T. Volume-phase transitions of ionized N-isopropylacrylamide gels. J. Chem. Phys. 1987, 87, 1392–1395. [Google Scholar] [CrossRef]
- Matsuo, E.S.; Tanaka, T. Kinetics of discontinuous volume–phase transition of gels. J. Chem. Phys. 1988, 89, 1695–1703. [Google Scholar] [CrossRef]
- Pan, X.; Yang, X.; Lowe, C.R. Evidence for a cross-linking mechanism underlying glucose-induced contraction of phenylboronate hydrogel. J. Mol. Recognit. 2008, 21, 205–209. [Google Scholar] [CrossRef]
- Zhang, X.; Guan, Y.; Zhang, Y. Ultrathin hydrogel films for rapid optical biosensing. Biomacromolecules 2012, 13, 92–97. [Google Scholar] [CrossRef] [PubMed]
- Zhang, C.; Losego, M.D.; Braun, P.V. Hydrogel-based glucose sensors: Effects of phenylboronic acid chemical structure on response. Chem. Mater. 2013, 25, 3239–3250. [Google Scholar] [CrossRef] [Green Version]
- Suzuki, A.; Ishii, T. Phase coexistence of neutral polymer gels under mechanical constraint. J. Chem. Phys. 1999, 110, 2289–2296. [Google Scholar] [CrossRef]
- Horkay, F.; Tasaki, I.; Basser, P.J. Effect of Monovalent–Divalent Cation Exchange on the Swelling of Polyacrylate Hydrogels in Physiological Salt Solutions. Biomacromolecules 2001, 2, 195–199. [Google Scholar] [CrossRef] [PubMed]
- Annaka, M.; Amo, Y.; Sasaki, S.; Tominaga, Y.; Motokawa, K.; Nakahira, T. Salt effect on volume phase transition of a gel. Phys. Rev. E 2002, 65, 031805. [Google Scholar] [CrossRef] [PubMed]
- Yan, Q.; de Pablo, J.J. Monte Carlo Simulation of a Coarse-Grained Model of Polyelectrolyte Networks. Phys. Rev. Lett. 2003, 91, 018301. [Google Scholar] [CrossRef] [PubMed]
- Wu, K.A.; Jha, P.K.; Cruz, M.O.D.L. Control of nanophases in polyelectrolyte gels by salt addition. Macromolecules 2010, 43, 9160–9167. [Google Scholar] [CrossRef]
- Mussel, M.; Basser, P.J.; Horkay, F. Ion-Induced Volume Transition in Gels and Its Role in Biology. Gels 2021, 7, 20. [Google Scholar] [CrossRef]
- Prokacheva, V.M.; Rud, O.V.; Uhlík, F.; Borisov, O.V. Phase transition in hydrophobic weak polyelectrolyte gel utilized for water desalination. Desalination 2021, 511, 115092. [Google Scholar] [CrossRef]
- Vervoort, S.; Patlazhan, S.; Weyts, J.; Budtova, T. Solvent release from highly swollen gels under compression. Polymer 2005, 46, 121–127. [Google Scholar] [CrossRef]
- Zhao, X.; Sun, X.; Zhang, J.; Bai, B. Gel composition and brine concentration effect on hydrogel dehydration subjected to uniaxial compression. J. Pet. Sci. Eng. 2019, 182, 106358. [Google Scholar] [CrossRef]
- Smith, W.R.; Triska, B. The reaction ensemble method for the computer simulation of chemical and phase equilibria. I. Theory and basic examples. J. Chem. Phys. 1994, 100, 3019–3027. [Google Scholar] [CrossRef]
- Landsgesell, J.; Hebbeker, P.; Rud, O.; Lunkad, R.; Košovan, P.; Holm, C. Grand-Reaction Method for Simulations of Ionization Equilibria Coupled to Ion Partitioning. Macromolecules 2020, 53, 3007–3020. [Google Scholar] [CrossRef] [Green Version]
- Prokacheva, V. Theoretical Study of Branched Polyelectrolytes. Ph.D. Thesis, Faculty of Science, Charles University, Prague, Czechia, 2022. [Google Scholar]
- Dimitriyev, M.S.; Chang, Y.W.; Goldbart, P.M.; Fernández-Nieves, A. Swelling thermodynamics and phase transitions of polymer gels. Nano Futur. 2019, 3, 042001. [Google Scholar] [CrossRef] [Green Version]
- Dušek, K.; Dušková-Smrčková, M. Volume Phase Transition in Gels: Its Discovery and Development. Gels 2020, 6, 22. [Google Scholar] [CrossRef]
- Callen, H.B. Thermodynamics and an Introduction to Thermostatistics, 2nd ed.; Wiley: New York, NY, USA, 1985. [Google Scholar]
- Atkins, P.; de Paula, J. Atkins’ Physical Chemistry; Oxford University Press: Oxford, UK, 2010. [Google Scholar]
- Kazakov, A.D.; Prokacheva, V.M.; Uhlík, F.; Košovan, P.; Leermakers, F.A.M. Computer modeling of polymer stars in variable solvent conditions: A comparison of MD simulations, self-consistent field (SCF) modeling and novel hybrid Monte Carlo SCF approach. Soft Matter 2021, 17, 580–591. [Google Scholar] [CrossRef] [PubMed]
- Rud, O.V.; Kazakov, A.D.; Nova, L.; Uhlik, F. Polyelectrolyte Hydrogels as Draw Agents for Desalination of Solutions with Multivalent Ions. Macromolecules 2022, 55, 1763–1770. [Google Scholar] [CrossRef]
- Rud, O.; Borisov, O.; Košovan, P. Thermodynamic model for a reversible desalination cycle using weak polyelectrolyte hydrogels. Desalination 2018, 442, 32–43. [Google Scholar] [CrossRef]
- Jones, J.E. On the Determination of Molecular Fields. II. From the Equation of State of a Gas. Proc. R. Soc. A Math. Phys. Eng. Sci. 1924, 106, 463–477. [Google Scholar] [CrossRef] [Green Version]
- Chremos, A.; Horkay, F. Disappearance of the polyelectrolyte peak in salt-free solutions. Phys. Rev. E 2020, 102, 012611. [Google Scholar] [CrossRef]
- Ghavami, A.; Kobayashi, H.; Winkler, R.G. Internal dynamics of microgels: A mesoscale hydrodynamic simulation study. J. Chem. Phys. 2016, 145, 244902. [Google Scholar] [CrossRef]
- Ghelichi, M.; Qazvini, N.T. Self-organization of hydrophobic-capped triblock copolymers with a polyelectrolyte midblock: A coarse-grained molecular dynamics simulation study. Soft Matter 2016, 12, 4611–4620. [Google Scholar] [CrossRef]
- Warner, H.R. Kinetic Theory and Rheology of Dilute Suspensions of Finitely Extendible Dumbbells. Ind. Eng. Chem. Fundam. 1972, 11, 379–387. [Google Scholar] [CrossRef]
- Weik, F.; Weeber, R.; Szuttor, K.; Breitsprecher, K.; de Graaf, J.; Kuron, M.; Landsgesell, J.; Menke, H.; Sean, D.; Holm, C. ESPResSo 4.0—An extensible software package for simulating soft matter systems. Eur. Phys. J. Spec. Top. 2019, 227, 1789–1816. [Google Scholar] [CrossRef] [Green Version]
- Miao, B.; Vilgis, T.A.; Poggendorf, S.; Sadowski, G. Effect of finite extensibility on the equilibrium chain size. Macromol. Theory Simul. 2010, 19, 414–420. [Google Scholar] [CrossRef]
- Jha, P.K.; Zwanikken, J.W.; de Pablo, J.J.; Olvera de la Cruz, M. Electrostatic control of nanoscale phase behavior of polyelectrolyte networks. Curr. Opin. Solid State Mater. Sci. 2011, 15, 271–276. [Google Scholar] [CrossRef]
- Borisov, O.V.; Zhulina, E.B.; Leermakers, F.A.M.; Ballauff, M.; Müller, A.H.E. Conformations and Solution Properties of Star-Branched Polyelectrolytes. Self Organ. Nanostructures Amphiphilic Block Copolym. I 2011, 241, 1–55. [Google Scholar] [CrossRef]
Figure 1.
Pressure-extension curves of a hydrophobic gel with , , reservoir salt concentration mol/L with inserted simulation snapshots at the following gel densities: (I) , (II) , (III) , and (IV) mol/L. The black curve results from simulations and the red one from the Maxwell construction over the black curve. The blue dashed curve corresponds to a fit of simulation data by analytical theory equation (vide infra). White triangles represent bimodal points. The blue clouds indicate charged segments of the gel. The magenta spheres show the nodes of the gel. The red and blue spheres represent counter- and co-ions, respectively. For more snapshots, see the ESI (Figures S4 and S5).

Figure 2.
The pressure p applied to the gel as a function of gel density at different values of (a) difference, (b) solvent quality and (c) salt concentration . White triangles mark the borders of the two-phase region. The shaded area highlights the two-phase area limited by binodals. The original data (with loops) and Maxwell construction details are provided in the ESI (Figures S1 and S2).

Figure 3.
Phase diagrams of a hydrophobic gel in the coordinates salt concentration versus gel density . (a) Comparison of simulation results at different values of solvent quality and . The values of are the results of Maxwell construction (see Figure S2 in ESI). (b) Comparison of simulation results at and with analytical theory (MF) results at solvent quality and different . The gray dots are the points belonging to binodals calculated by the MF model for different as indicated. Three of these binodals are plotted by dotted lines (green, blue and cyan).

Figure 4.
Ionization degree of the gel and as a function of gel density for different (a) , (b) solvent quality and (c) salt concentration . White triangles define the borders of the two-phase area.
Figure 4.
Ionization degree of the gel and as a function of gel density for different (a) , (b) solvent quality and (c) salt concentration . White triangles define the borders of the two-phase area.

Figure 5.
Change in the number of (a) and (b) ions in the volume normalized by the number of gel segments as a function of gel density for different . White triangles define the borders of the two-phase area. Circles represent free swelling equilibrium states, where the applied pressure is zero.
Figure 5.
Change in the number of (a) and (b) ions in the volume normalized by the number of gel segments as a function of gel density for different . White triangles define the borders of the two-phase area. Circles represent free swelling equilibrium states, where the applied pressure is zero.

Disclaimer/Publisher’s Note: The statements, opinions and data contained in all publications are solely those of the individual author(s) and contributor(s) and not of MDPI and/or the editor(s). MDPI and/or the editor(s) disclaim responsibility for any injury to people or property resulting from any ideas, methods, instructions or products referred to in the content. |
© 2023 by the authors. Licensee MDPI, Basel, Switzerland. This article is an open access article distributed under the terms and conditions of the Creative Commons Attribution (CC BY) license (https://creativecommons.org/licenses/by/4.0/).
Share and Cite
MDPI and ACS Style
Kazakov, A.D.; Prokacheva, V.M.; Rud, O.V.; Nová, L.; Uhlík, F. Modeling the Phase Transition in Hydrophobic Weak Polyelectrolyte Gels under Compression. Gels 2023, 9, 259. https://doi.org/10.3390/gels9030259
AMA Style
Kazakov AD, Prokacheva VM, Rud OV, Nová L, Uhlík F. Modeling the Phase Transition in Hydrophobic Weak Polyelectrolyte Gels under Compression. Gels. 2023; 9(3):259. https://doi.org/10.3390/gels9030259
Chicago/Turabian StyleKazakov, Alexander D., Varvara M. Prokacheva, Oleg V. Rud, Lucie Nová, and Filip Uhlík. 2023. "Modeling the Phase Transition in Hydrophobic Weak Polyelectrolyte Gels under Compression" Gels 9, no. 3: 259. https://doi.org/10.3390/gels9030259
Note that from the first issue of 2016, this journal uses article numbers instead of page numbers. See further details here.