

Macrofungal Diversity and Distribution Patterns in the Primary Forests of the Shaluli Mountains
 , ,
, ,  , and
, and
Abstract
:1. Introduction
2. Materials and Methods
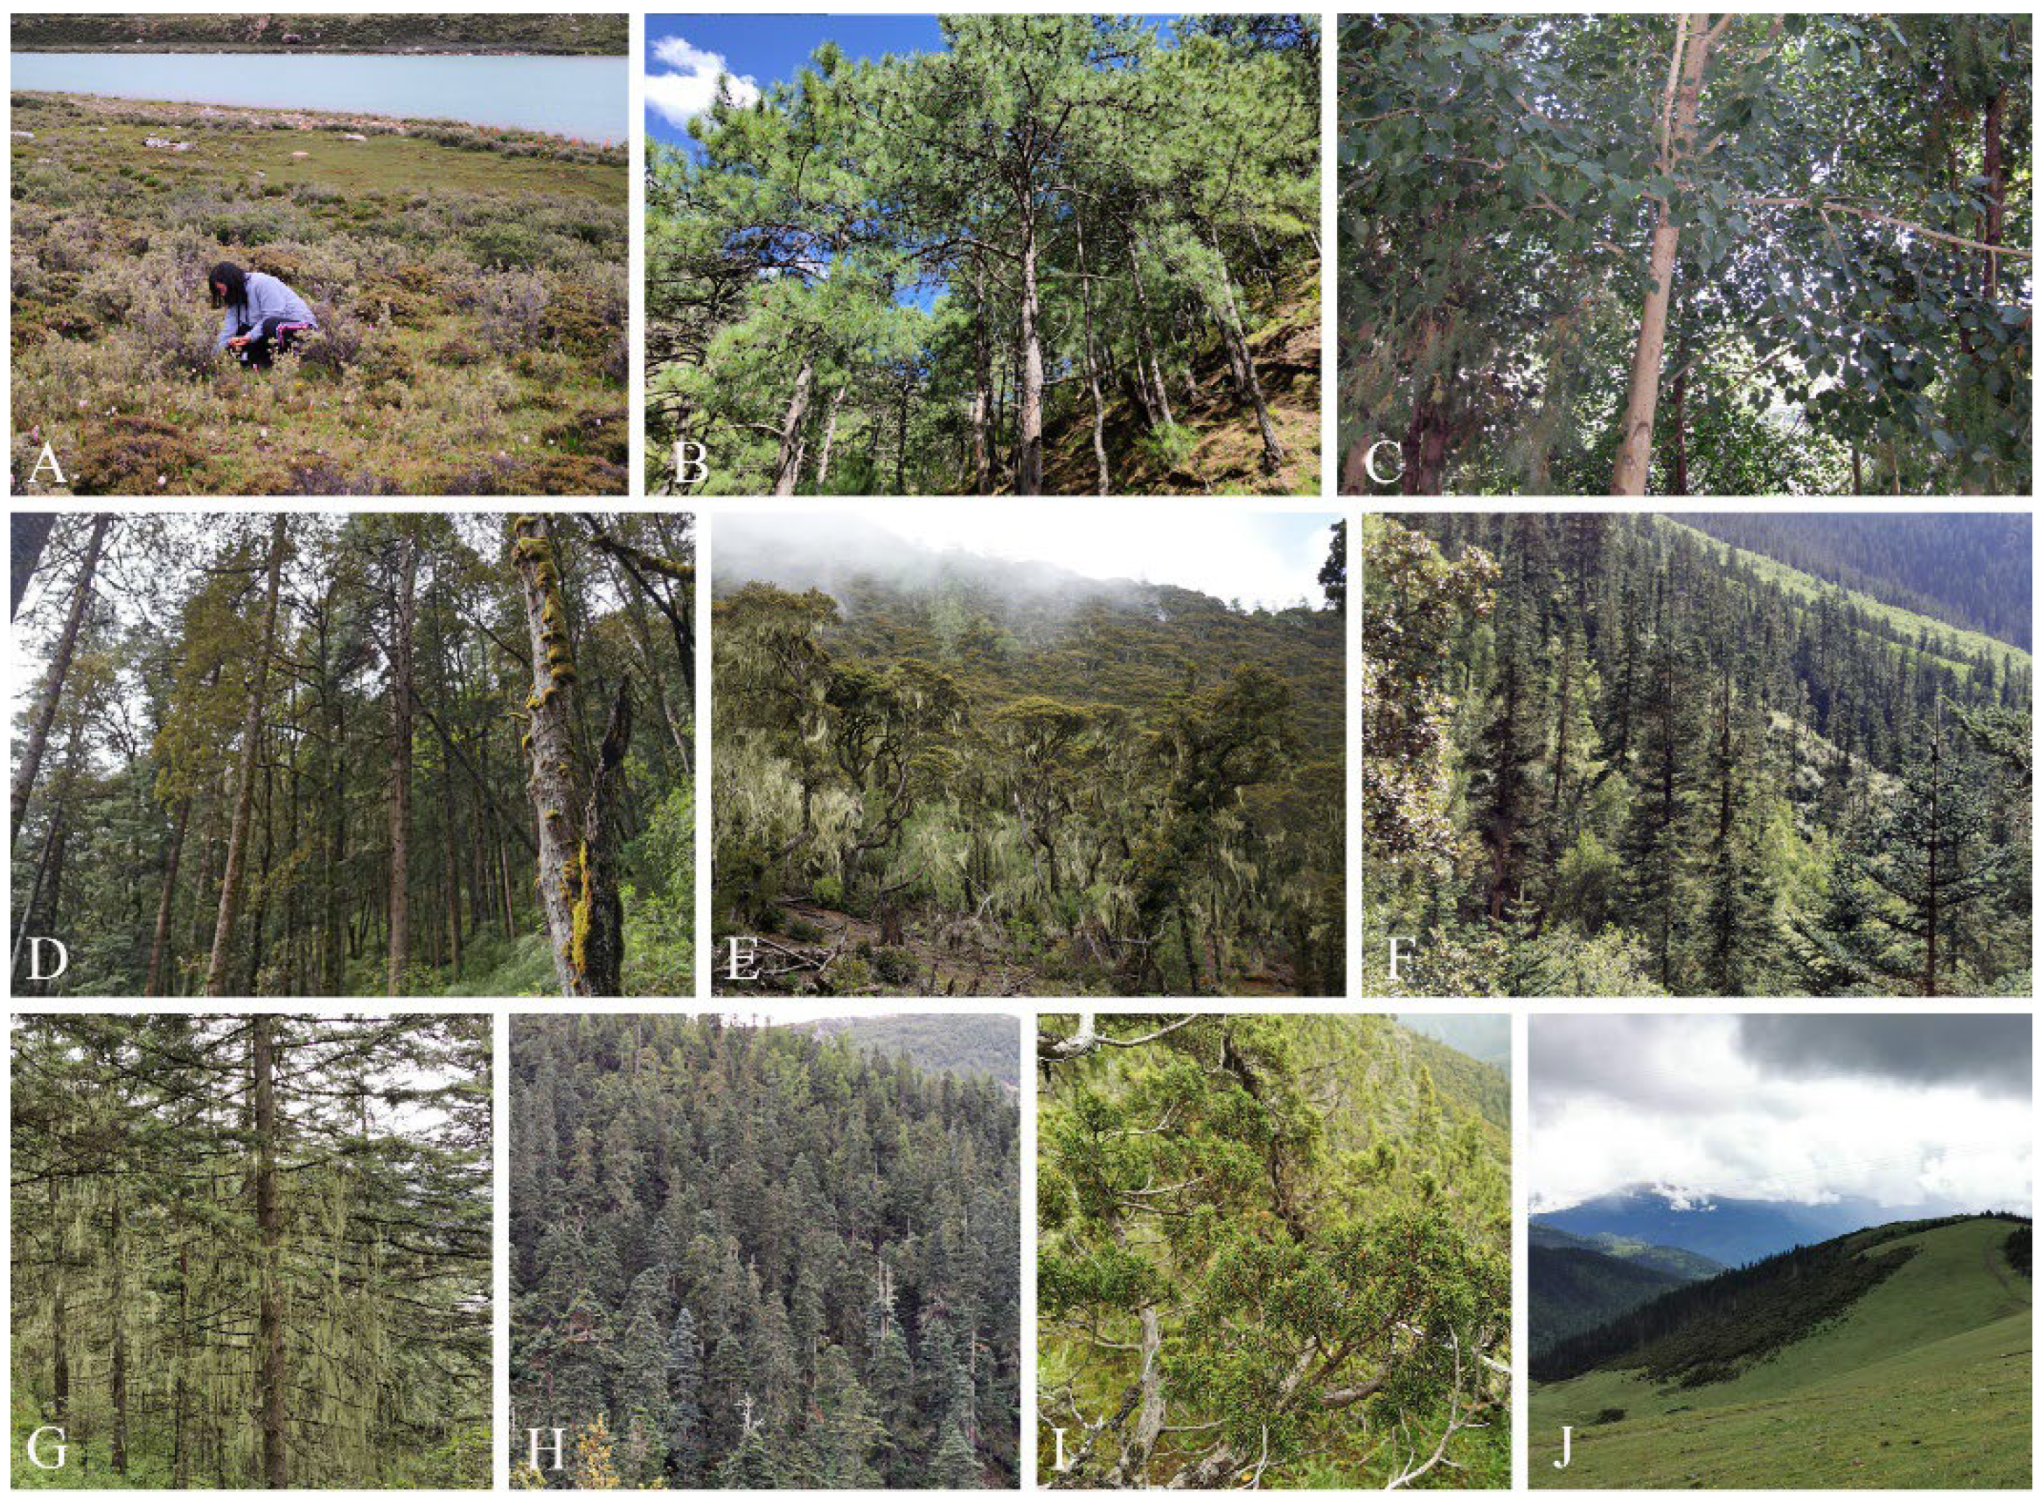
2.1. Sample Plot Setup and Sporocarp Sampling
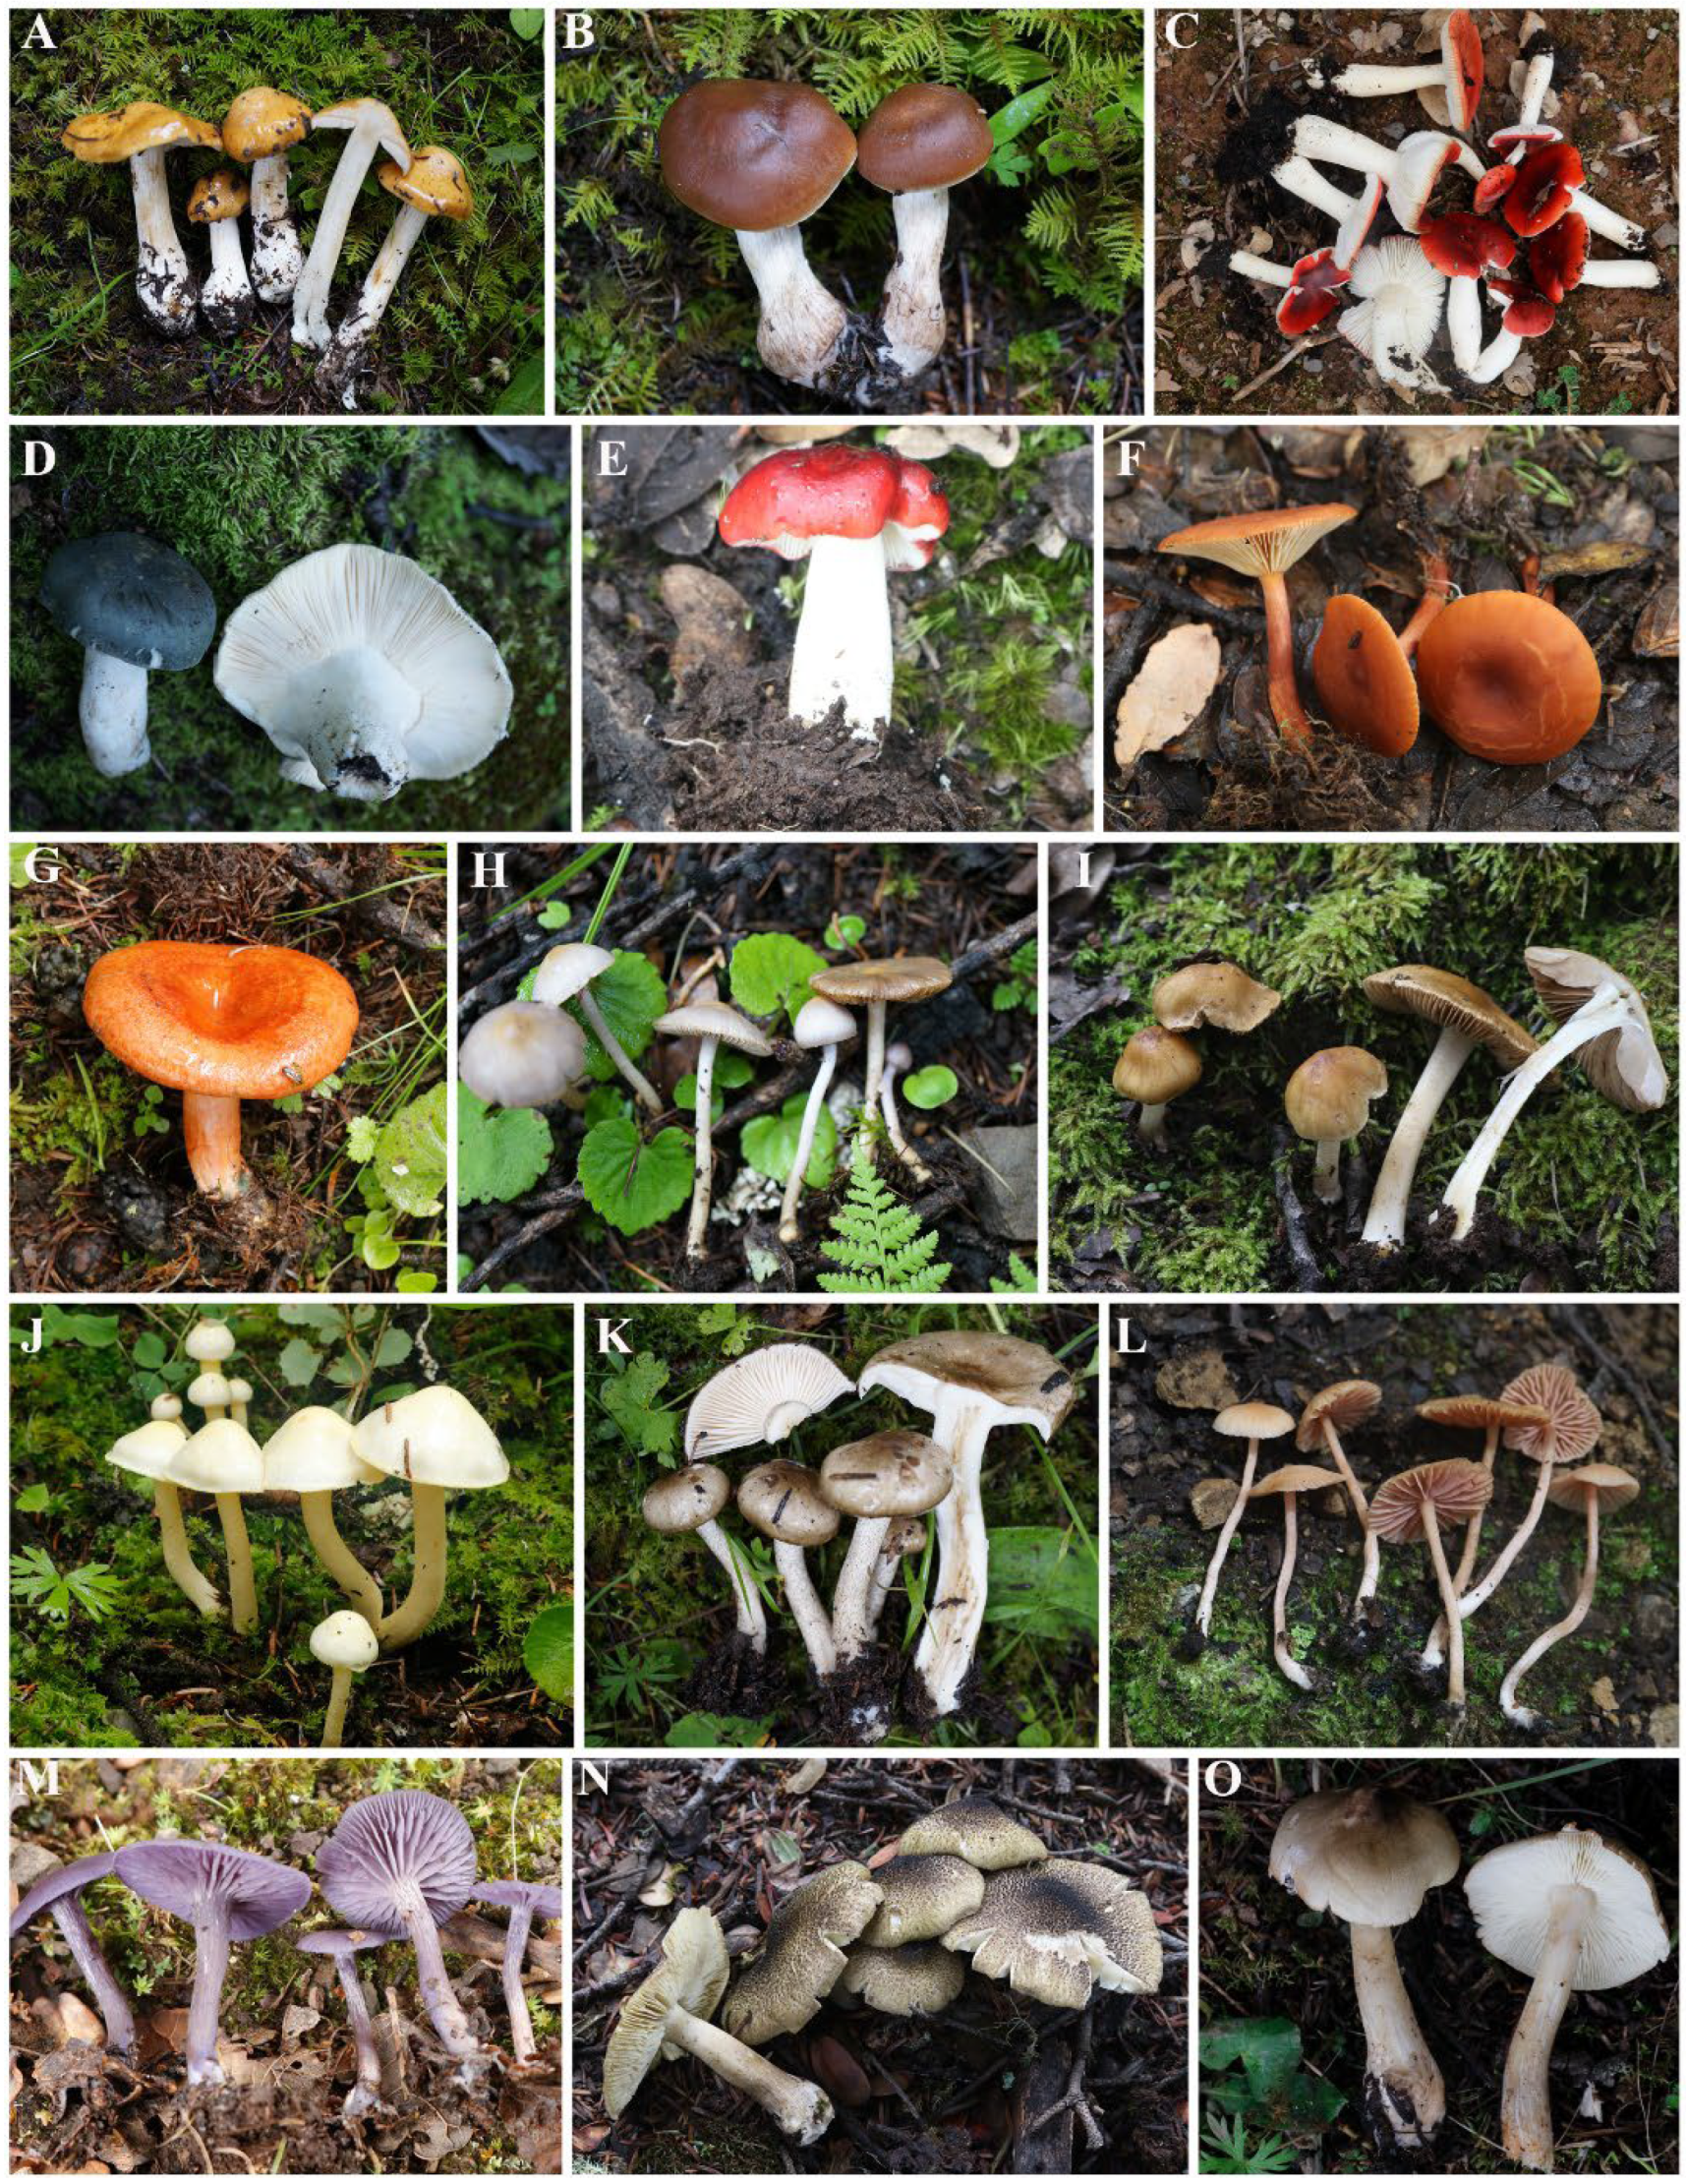
2.2. Species Identification
2.3. Statistical Analysis
3. Results
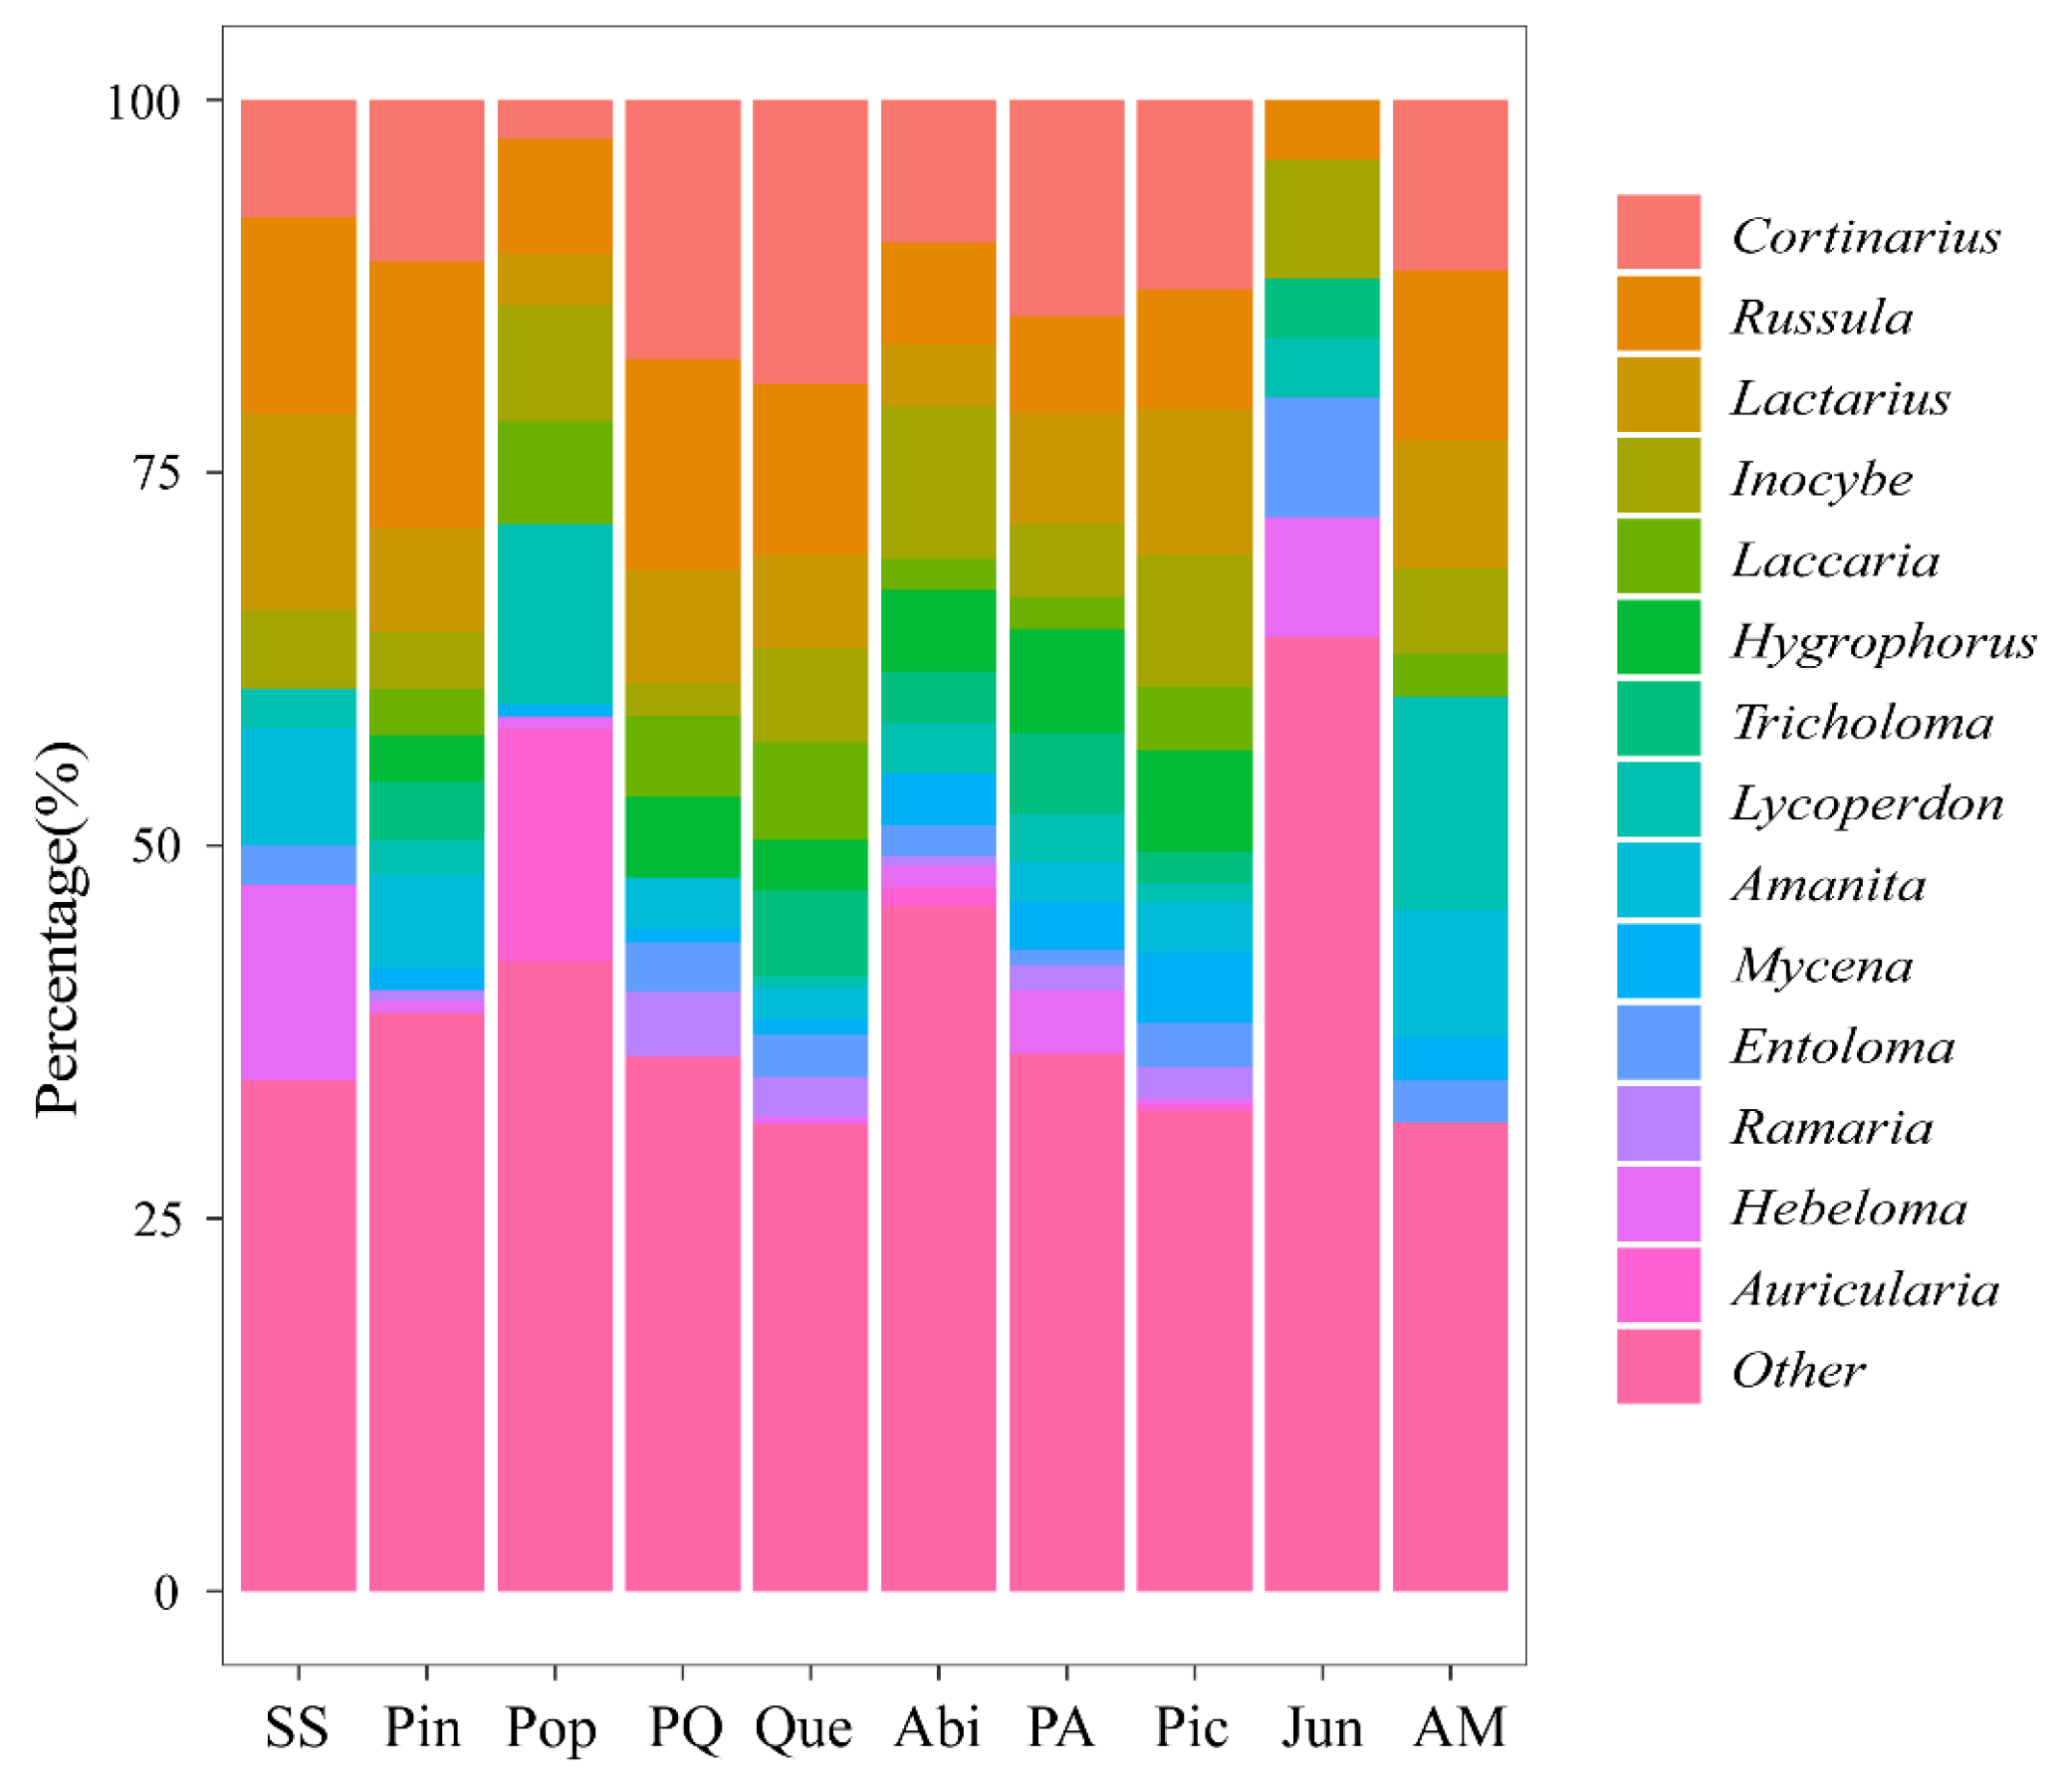
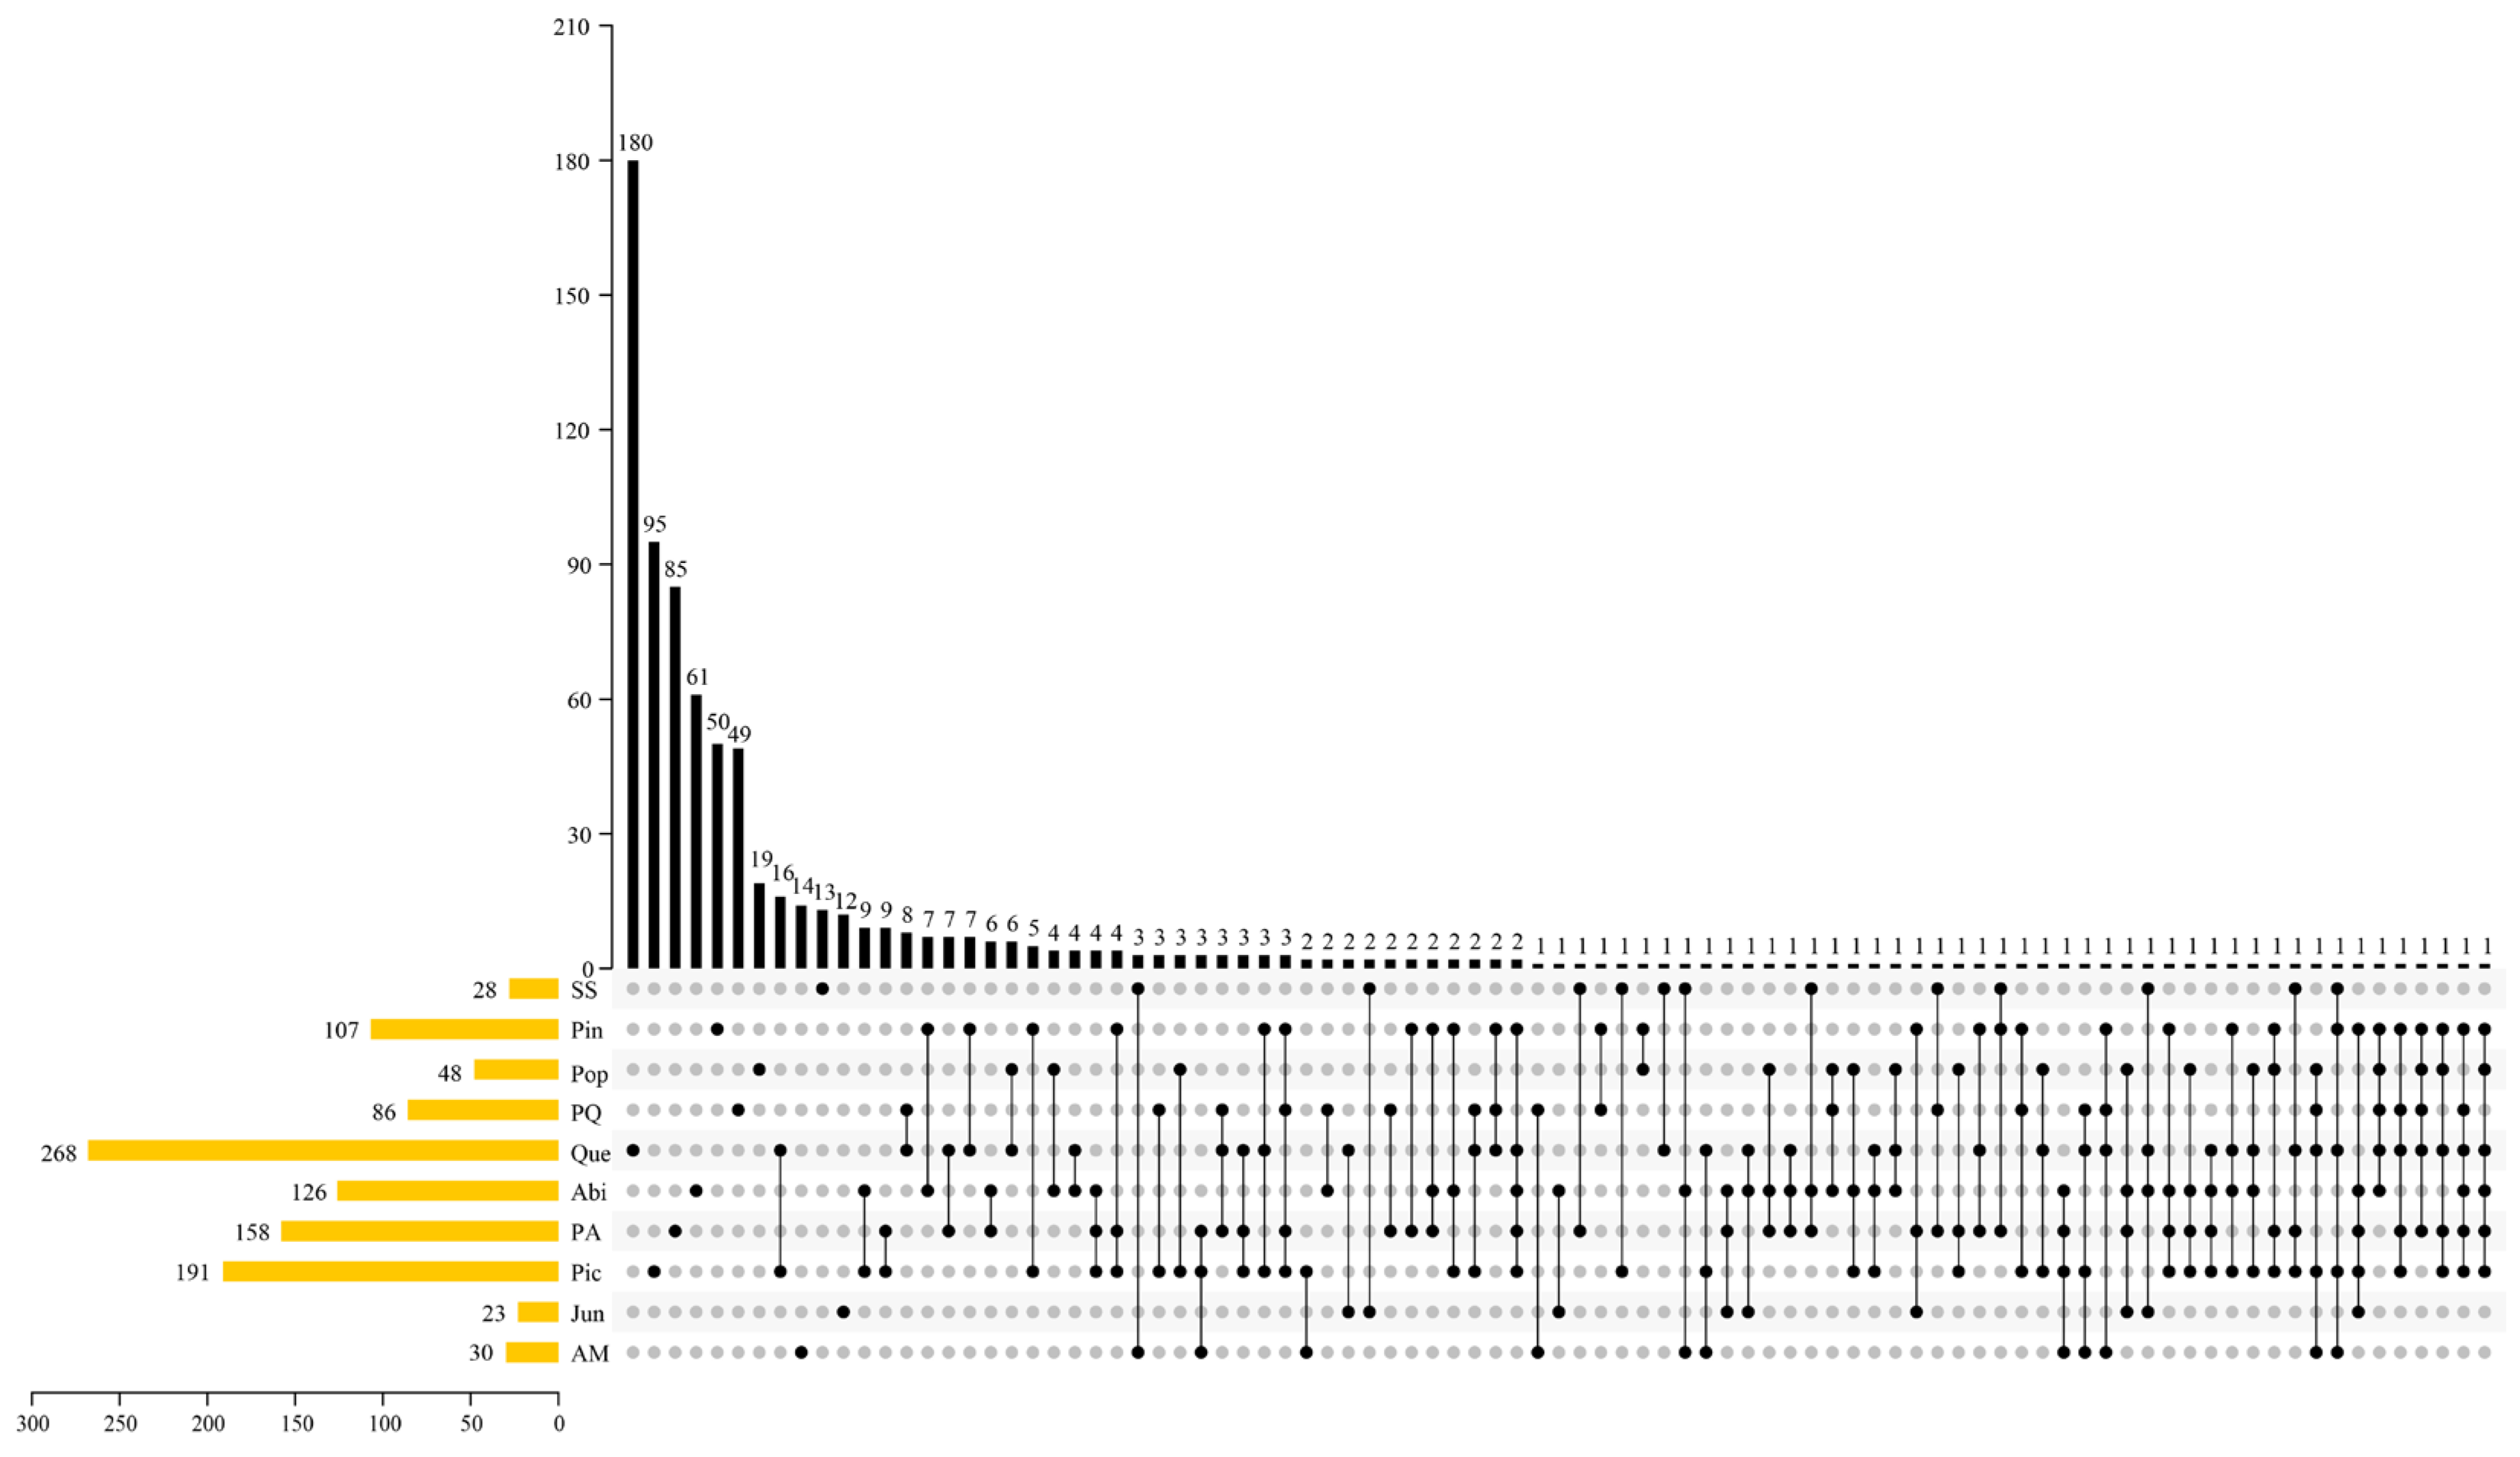
3.1. Macrofungal Composition
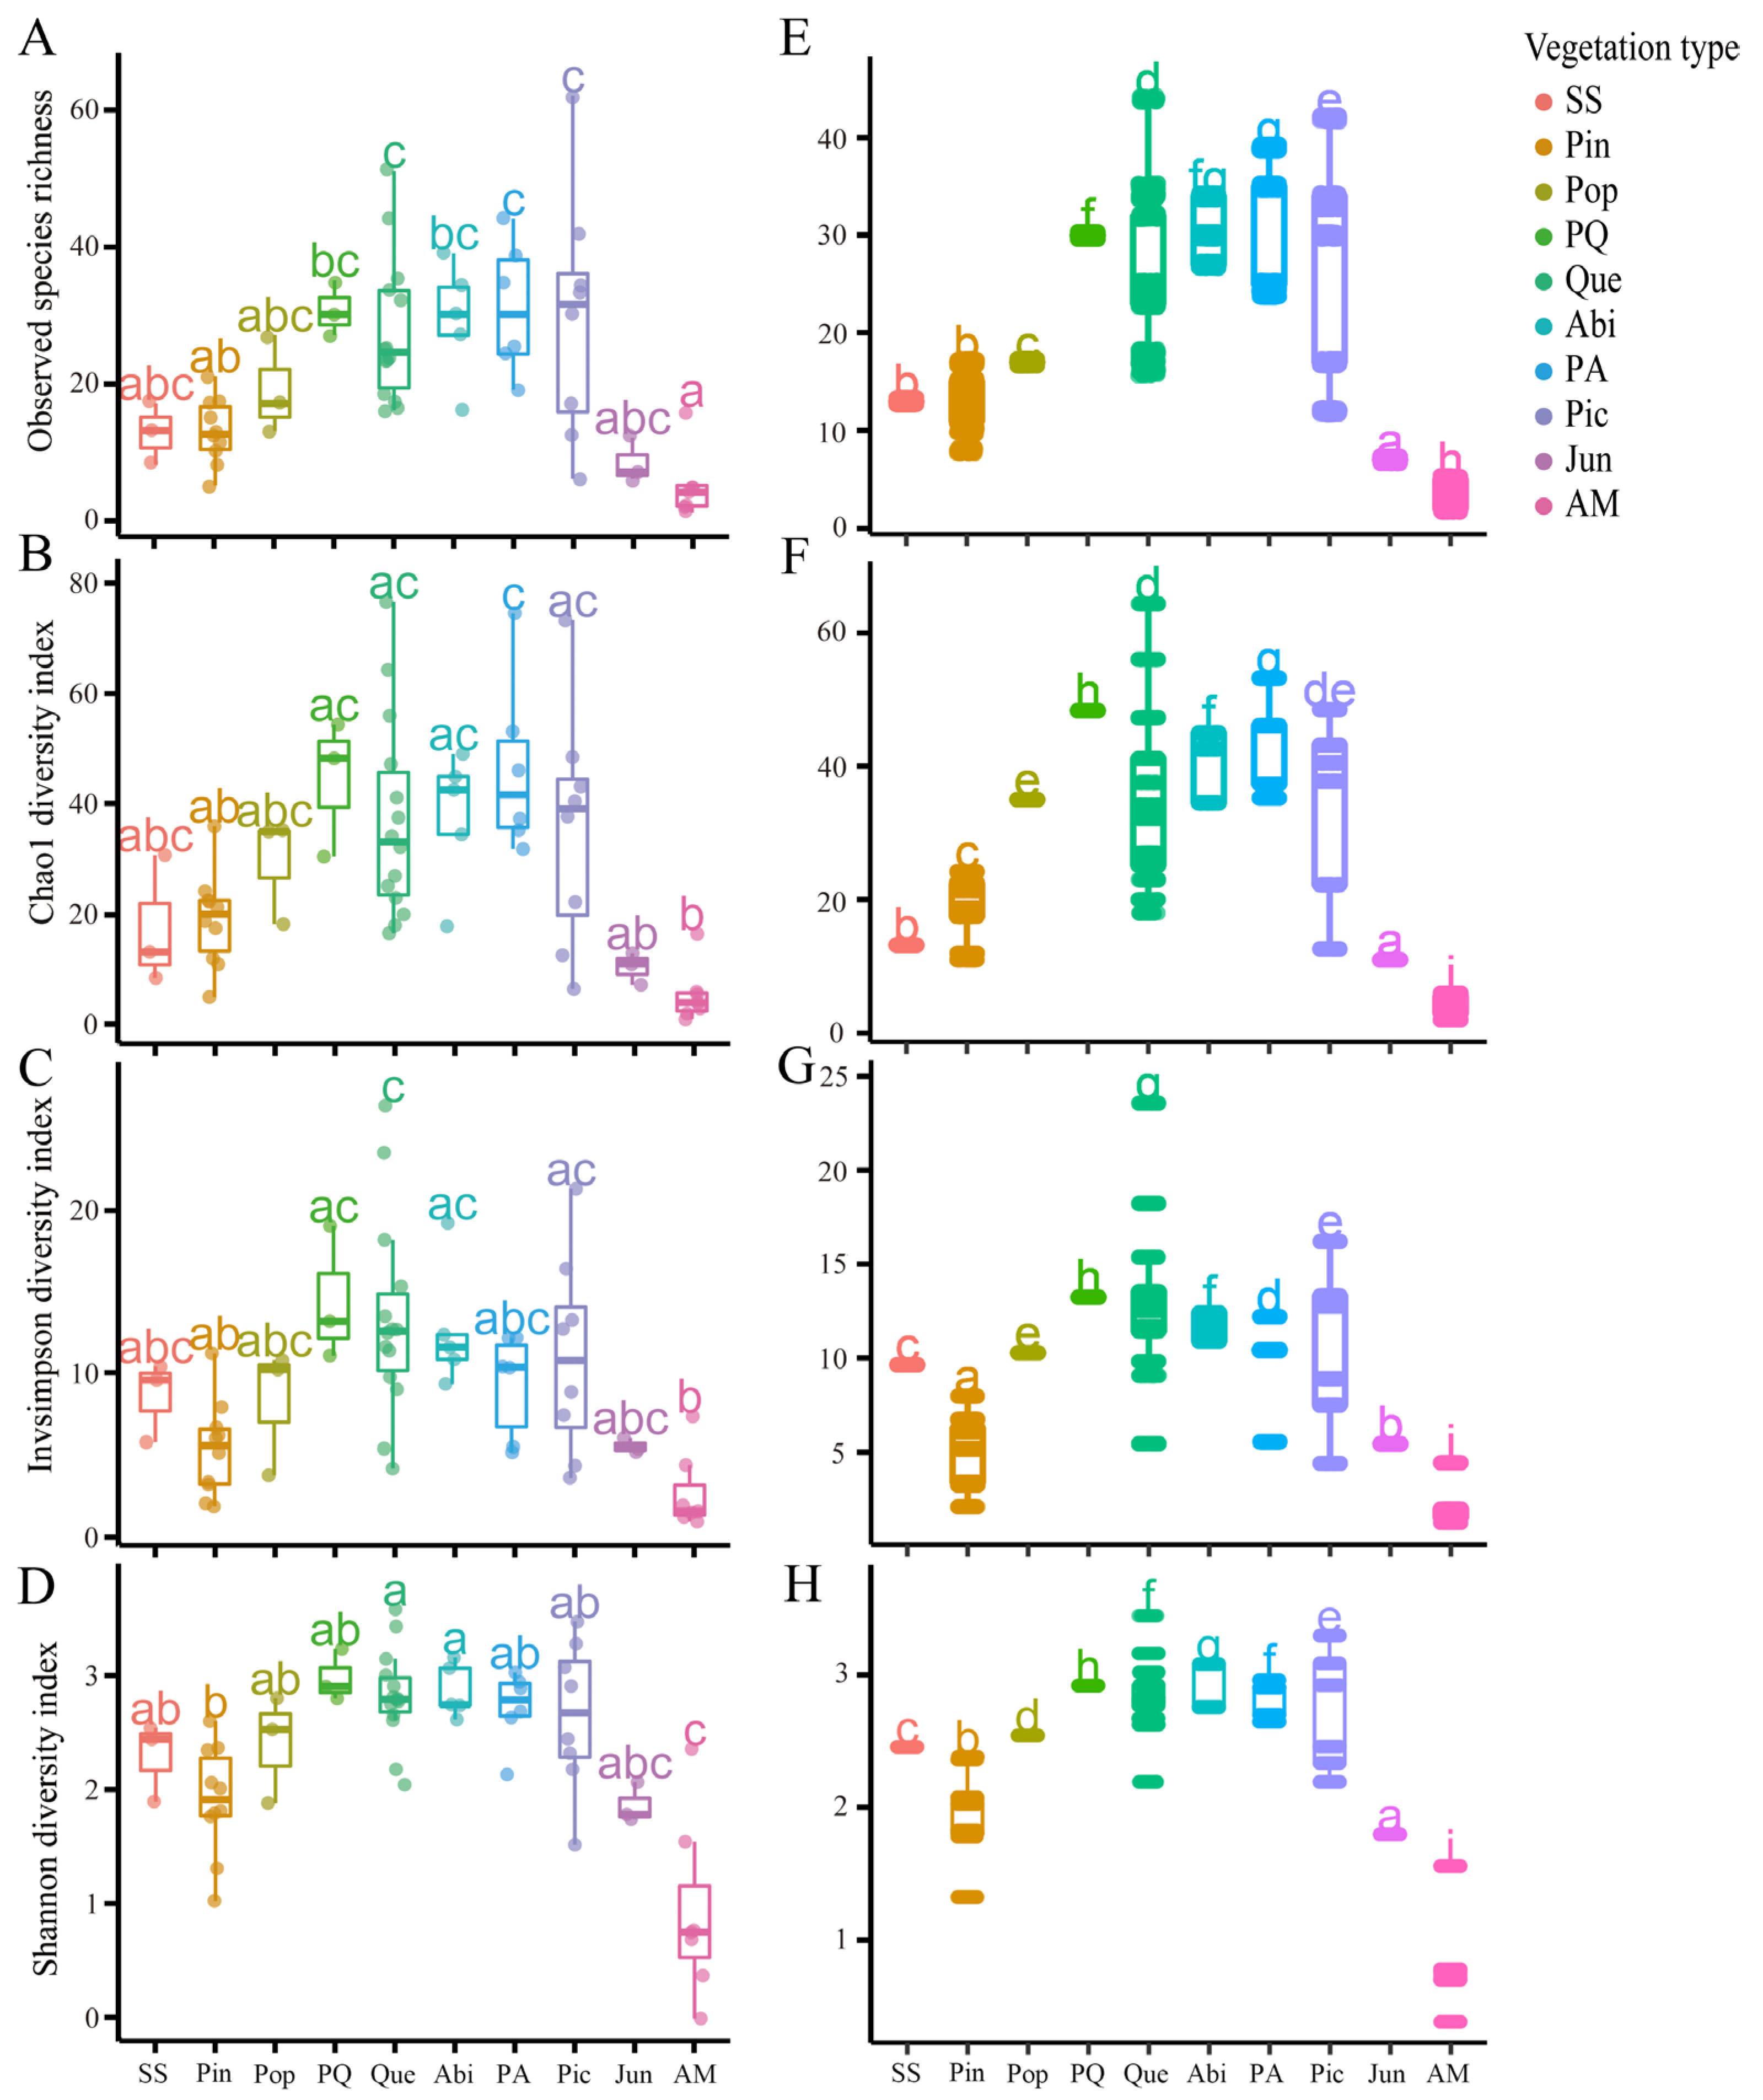
3.2. Macrofungal Alpha Diversity
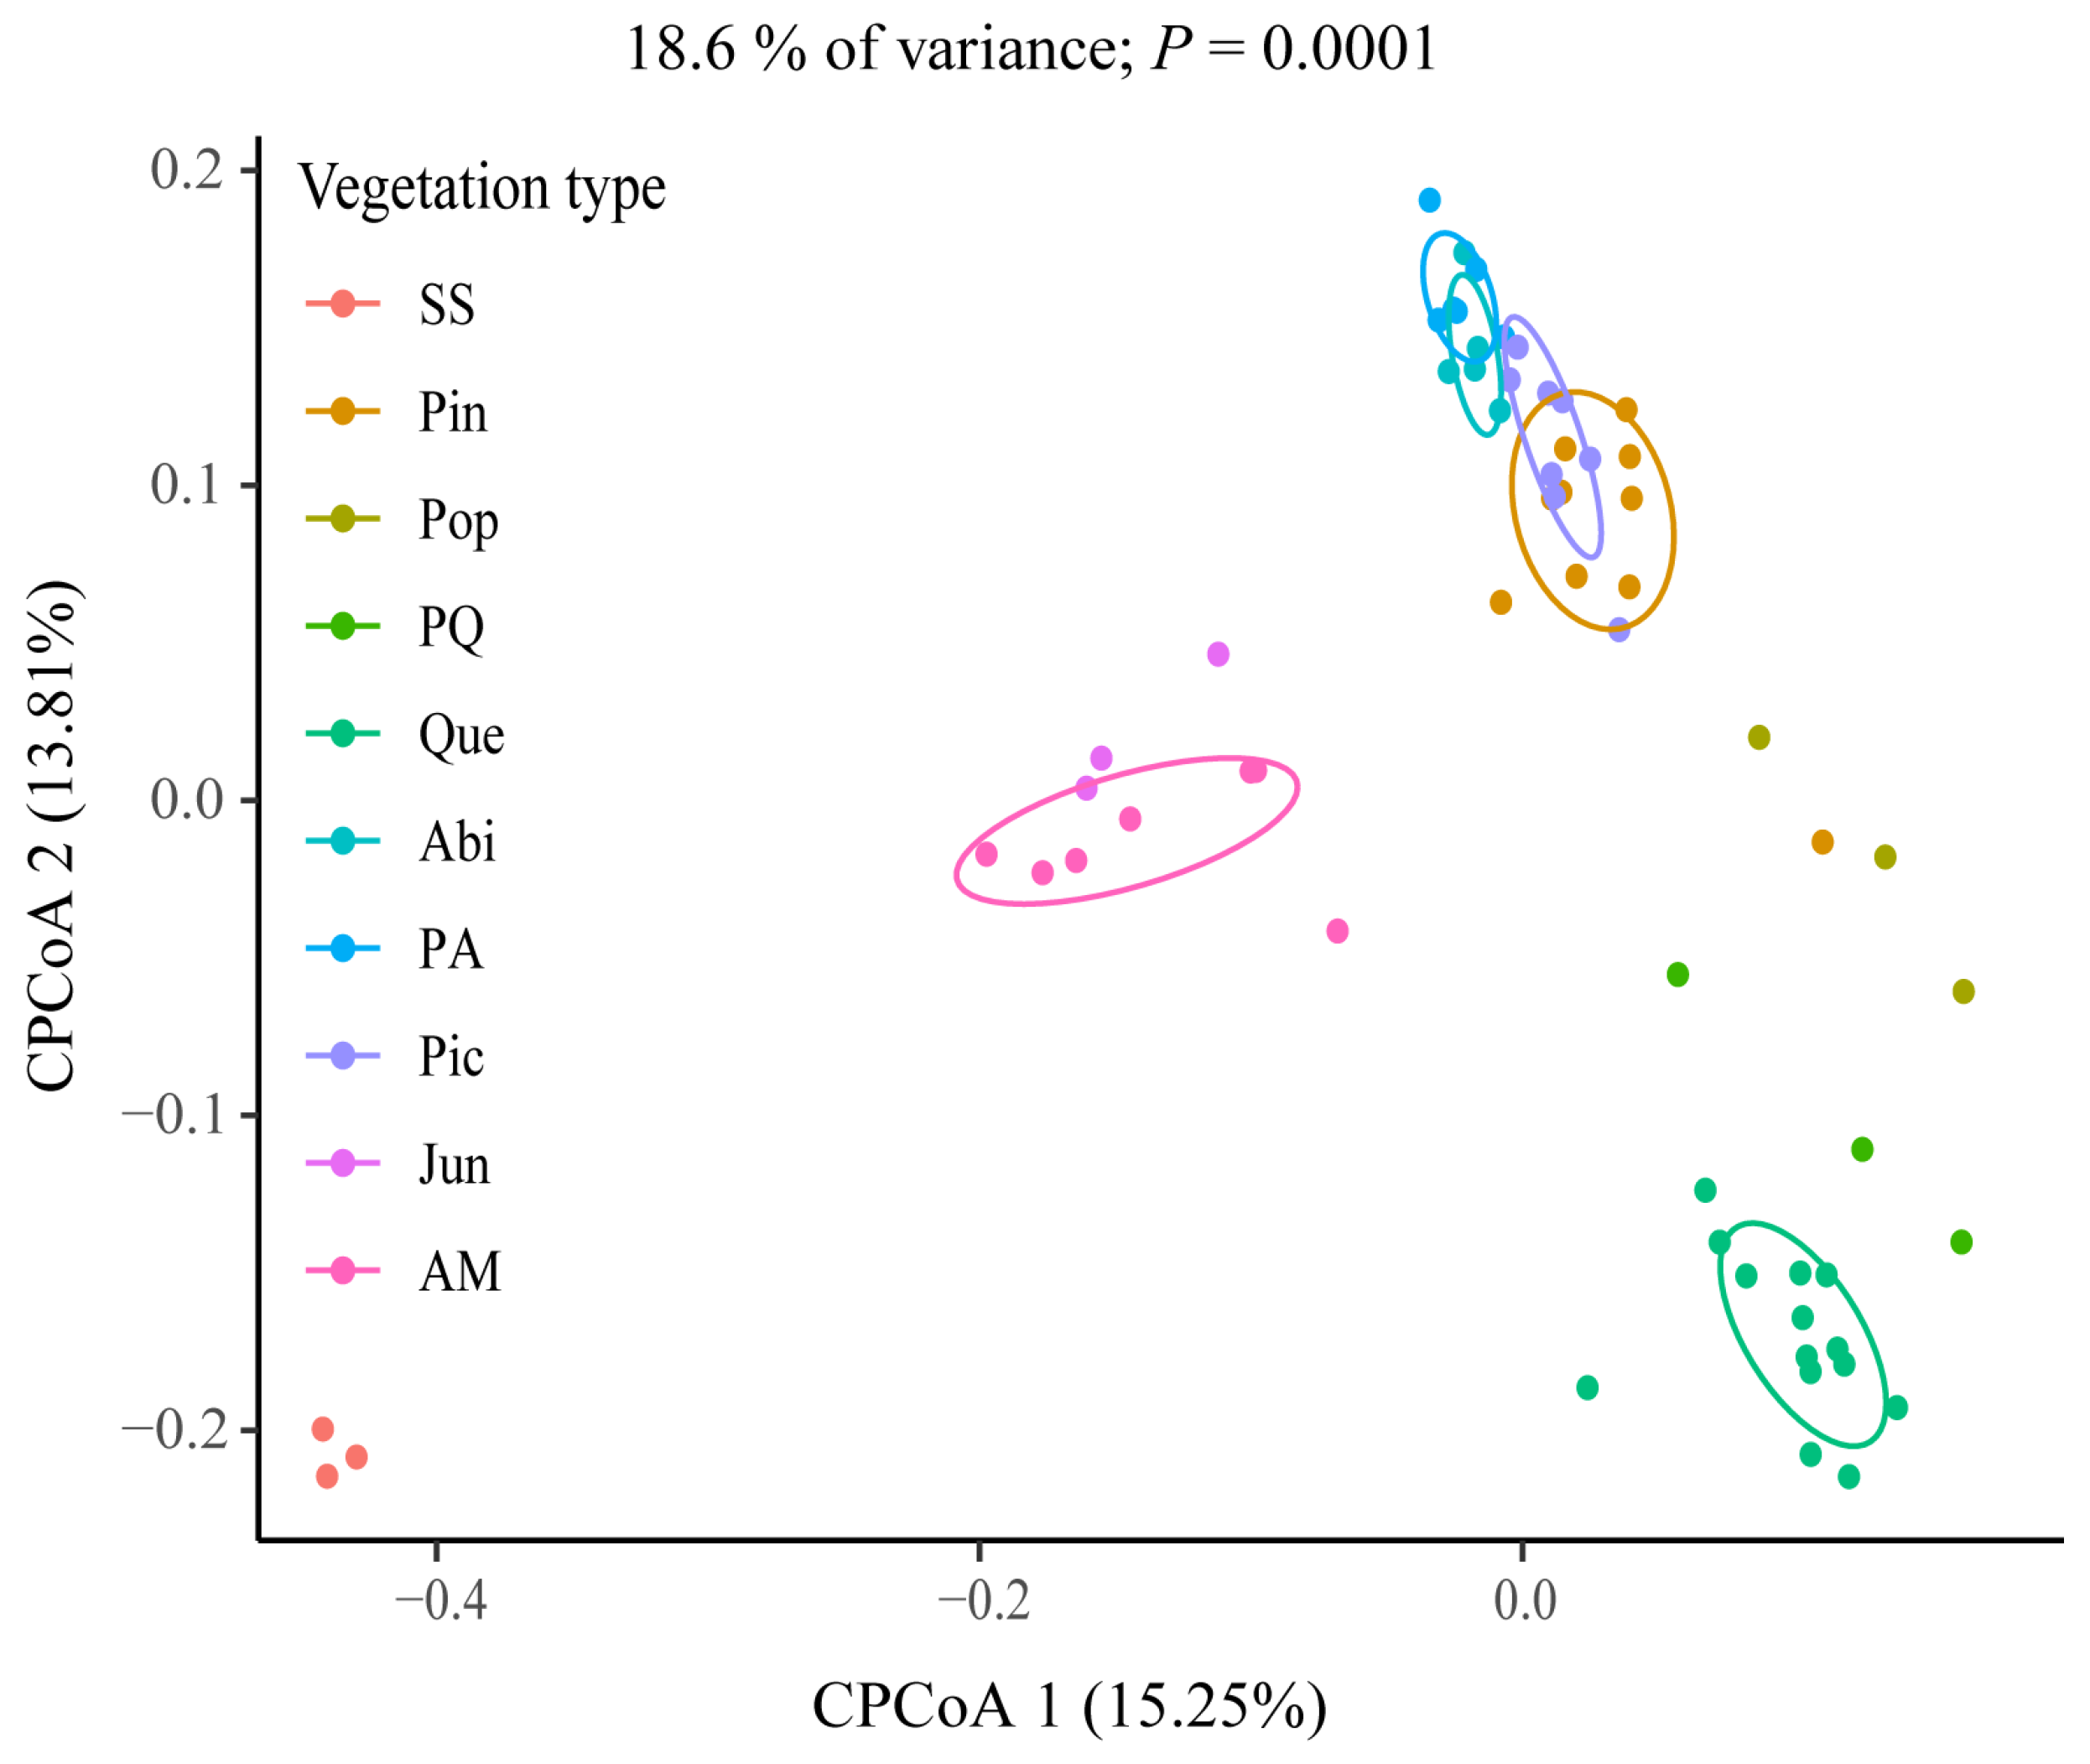
3.3. Macrofungal Beta Diversity
4. Discussion
4.1. Macrofungal Species Diversity Composition
4.2. Macrofungal Species Conservation
4.3. Correlation between Macrofungal Diversity and Vegetation Types
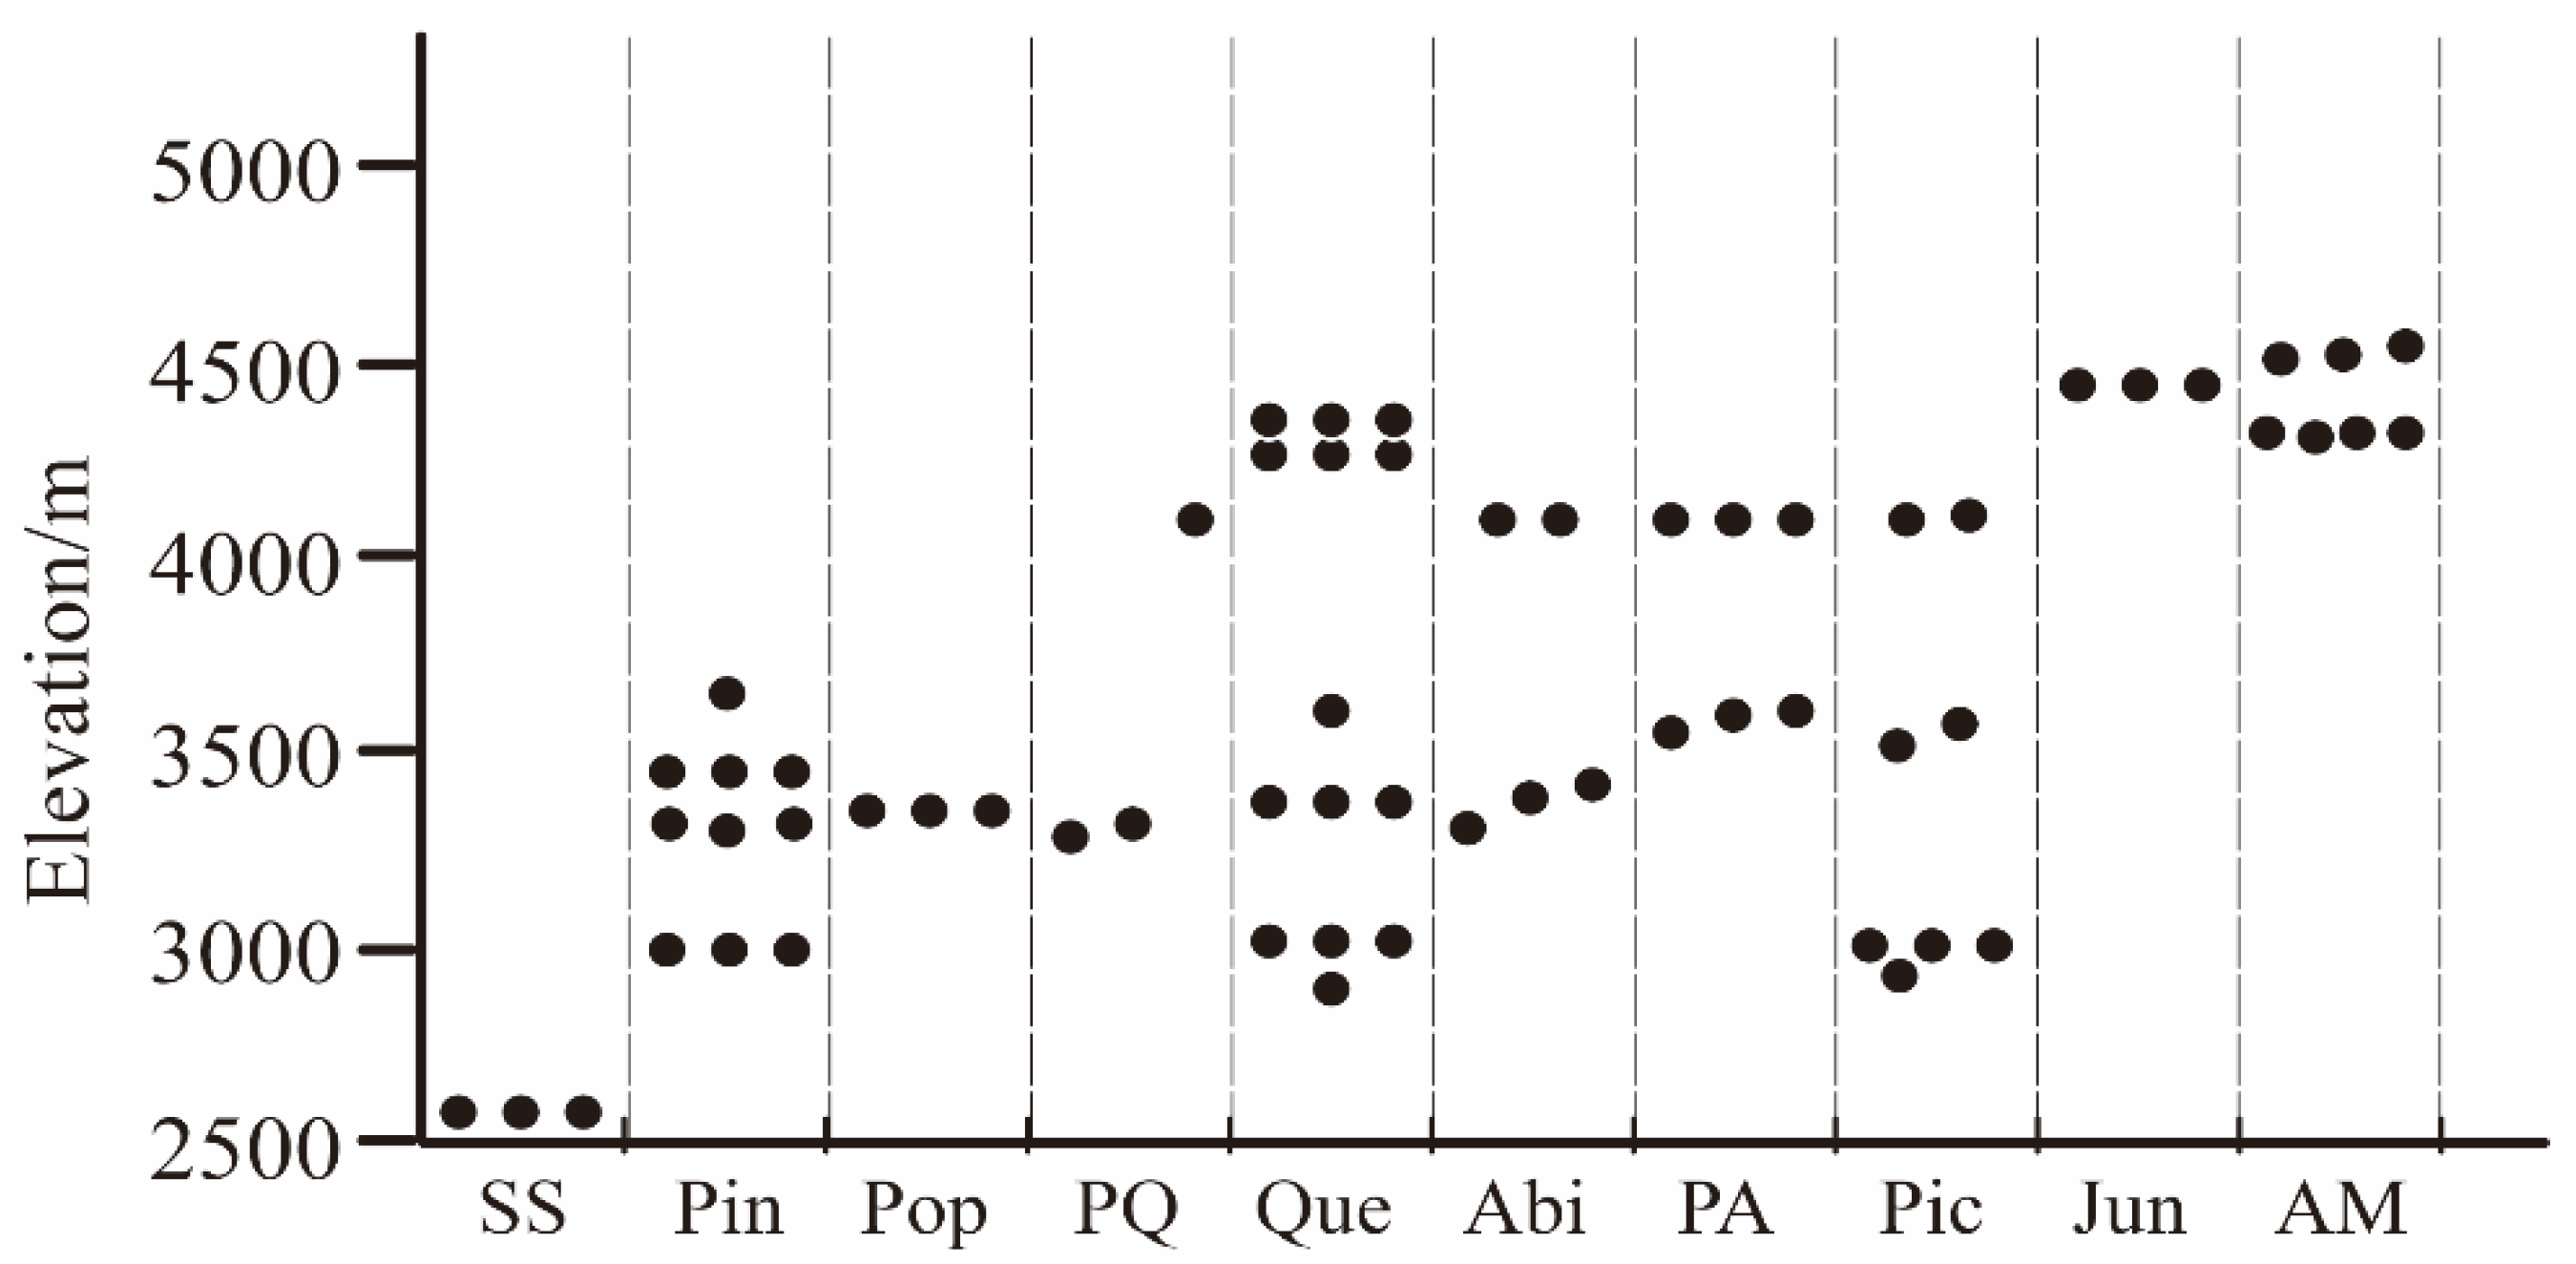
4.4. Correlation between Macrofungal Diversity Patterns and Elevation
5. Conclusions
Supplementary Materials
Author Contributions
Funding
Institutional Review Board Statement
Informed Consent Statement
Data Availability Statement
Acknowledgments
Conflicts of Interest
References
- Wang, K.; Kirk, P.M.; Yao, Y.J. Development trends in taxonomy, with special reference to fungi. J. Syst. Evol. 2020, 58, 406–412. [Google Scholar] [CrossRef]
- Muszyńska, B.; Grzywacz-Kisielewska, A.; Kała, K.; Gdula-Argasińska, J. Anti-inflammatory properties of edible mushrooms: A review. Food Chem. 2018, 243, 373–381. [Google Scholar] [CrossRef]
- Clemmensen, K.E.; Finlay, R.D.; Dahlberg, A.; Stenlid, J.; Wardle, D.A.; Lindahl, B.D. Carbon sequestration is related to mycorrhizal fungal community shifts during long-term succession in boreal forests. New Phytol. 2015, 205, 1525–1536. [Google Scholar] [CrossRef]
- Wagg, C.; Schlaeppi, K.; Banerjee, S.; Kuramae, E.E.; Van Der Heijden, M.G.A. Fungal-bacterial diversity and microbiome complexity predict ecosystem functioning. Nat. Commun. 2019, 10, 4841. [Google Scholar] [CrossRef] [PubMed]
- Johnson, D.; Vandenkoornhuyse, P.J.; Leake, J.R.; Gilbert, L.; Booth, R.E.; Grime, J.P.; Young, J.P.W.; Read, D.J. Plant communities affect arbuscular mycorrhizal fungal diversity and community composition in grassland microcosms. New Phytol. 2004, 161, 503–515. [Google Scholar] [CrossRef] [PubMed]
- Pec, G.J.; Simard, S.W.; Cahill, J.F.; Karst, J. The effects of ectomycorrhizal fungal networks on seedling establishment are contingent on species and severity of overstorey mortality. Mycorrhiza 2020, 30, 173–183. [Google Scholar] [CrossRef]
- Smith, S.E.; Read, D.J. Mycorrhizal Symbiosis, 3rd ed.; Academic Press: London, UK, 2008. [Google Scholar]
- Dai, Y.-C.; Yang, Z.-L.; Cui, B.-K.; Yu, C.-J.; Zhou, L.-W. Species Diversity and Utilization of Medicinal Mushrooms and Fungi in China (Review). Int. J. Med. Mushrooms 2009, 11, 287–302. [Google Scholar] [CrossRef]
- Cör, D.; Knez, Ž.; Knez Hrnčič, M. Antitumour, Antimicrobial, Antioxidant and Antiacetylcholinesterase Effect of Ganoderma lucidum Terpenoids and Polysaccharides: A Review. Molecules 2018, 23, 649. [Google Scholar] [CrossRef]
- Zhang, L.; Hu, Y.; Duan, X.Y.; Tang, T.T.; Shen, Y.B.; Hu, B.; Liu, A.P.; Chen, H.; Li, C.; Liu, Y.T. Characterization and antioxidant activities of polysaccharides from thirteen boletus mushrooms. Int. J. Biol. Macromol. 2018, 113, 1–7. [Google Scholar] [CrossRef]
- Wu, F.; Zhou, L.-W.; Yang, Z.-L.; Bau, T.; Li, T.-H.; Dai, Y.-C. Resource diversity of Chinese macrofungi: Edible, medicinal and poisonous species. Fungal Divers. 2019, 98, 1–76. [Google Scholar] [CrossRef]
- Tarvainen, O.; Markkola, A.M.; Strömmer, R. Diversity of macrofungi and plants in Scots pine forests along an urban pollution gradient. Basic Appl. Ecol. 2003, 4, 547–556. [Google Scholar] [CrossRef]
- Al Obaydi, M.F.; Hamed, W.M.; Al Kury, L.T.; Talib, W.H. Terfezia boudieri: A Desert Truffle With Anticancer and Immunomodulatory Activities. Front. Nutr. 2020, 7, 38. [Google Scholar] [CrossRef] [PubMed]
- Ghate, S.D.; Sridhar, K.R. Contribution to the knowledge on macrofungi in mangroves of the southwest India. Plant Biosyst.-Int. J. Deal. All Asp. Plant Biol. 2015, 150, 977–986. [Google Scholar] [CrossRef]
- Rudolf, K.; Morschhauser, T.; Pál-Fám, F. Macrofungal diversity in disturbed vegetation types in North-East Hungary. Open Life Sci. 2012, 7, 634–647. [Google Scholar] [CrossRef]
- Geml, J.; Pastor, N.; Fernandez, L.; Pacheco, S.; Semenova, T.A.; Becerra, A.G.; Wicaksono, C.Y.; Nouhra, E.R. Large-scale fungal diversity assessment in the Andean Yungas forests reveals strong community turnover among forest types along an altitudinal gradient. Mol. Ecol. 2014, 23, 2452–2472. [Google Scholar] [CrossRef]
- Shen, C.; Gunina, A.; Luo, Y.; Wang, J.; He, J.-Z.; Kuzyakov, Y.; Hemp, A.; Classen, A.T.; Ge, Y. Contrasting patterns and drivers of soil bacterial and fungal diversity across a mountain gradient. Environ. Microbiol. 2020, 22, 3287–3301. [Google Scholar] [CrossRef]
- Salo, K.; Kouki, J. Severity of forest wildfire had a major influence on early successional ectomycorrhizal macrofungi assemblages, including edible mushrooms. For. Ecol. Manag. 2018, 415–416, 70–84. [Google Scholar] [CrossRef]
- Botnen, S.S.; Davey, M.L.; Aas, A.B.; Carlsen, T.; Thoen, E.; Heegaard, E.; Vik, U.; Dresch, P.; Mundra, S.; Peintner, U.; et al. Biogeography of plant root-associated fungal communities in the North Atlantic region mirrors climatic variability. J. Biogeogr. 2019, 46, 1532–1546. [Google Scholar] [CrossRef]
- Kouki, J.; Salo, K. Forest disturbances affect functional groups of macrofungi in young successional forests–harvests and fire lead to different fungal assemblages. For. Ecol. Manag. 2020, 463, 118039. [Google Scholar] [CrossRef]
- Collado, E.; Bonet, J.; Alday, J.; de Aragón, J.M.; De-Miguel, S. Impact of forest thinning on aboveground macrofungal community composition and diversity in Mediterranean pine stands. Ecol. Indic. 2021, 133, 108340. [Google Scholar] [CrossRef]
- Yu, H.; Wang, T.; Skidmore, A.; Heurich, M.; Bässler, C. The critical role of tree species and human disturbance in determining the macrofungal diversity in Europe. Glob. Ecol. Biogeogr. 2021, 30, 2084–2100. [Google Scholar] [CrossRef]
- Gabel, A.; Ebbert, E.; Lovett, K. Macrofungi Collected from the Black Hills of South Dakota and Bear Lodge Mountains of Wyoming. Am. Midl. Nat. 2004, 152, 43–62. [Google Scholar] [CrossRef]
- Wu, J.; Peng, H.; Jiang, X.; Xue, D.; Du, F.; Han, L.; Yang, Z.; Shui, Y.; Liu, P.; Yang, X.; et al. An inventory of county-level biodiversity in Northwest Yunnan. Biodivers. Sci. 2016, 24, 1414–1420. [Google Scholar] [CrossRef]
- Cho, S.E.; Jo, J.W.; Kim, N.K.; Kwag, Y.-N.; Han, S.-K.; Chang, K.S.; Oh, S.H.; Kim, C.S. Macrofungal Survey of the Tian Shan Mountains, Kyrgyzstan. Mycobiology 2019, 47, 378–390. [Google Scholar] [CrossRef] [PubMed]
- Lai, Y.; Liu, Y.; Liu, X. Elevational Diversity Patterns of Green Lacewings (Neuroptera: Chrysopidae) Uncovered with DNA Barcoding in a Biodiversity Hotspot of Southwest China. Front. Ecol. Evol. 2021, 9, 778686. [Google Scholar] [CrossRef]
- Ujházy, K.; Ujházyová, M.; Bučinová, K.; Čiliak, M.; Glejdura, S.; Mihál, I. Response of fungal and plant communities to management-induced overstorey changes in montane forests of the Western Carpathians. Eur. J. For. Res. 2018, 137, 169–183. [Google Scholar] [CrossRef]
- Kutszegi, G.; Siller, I.; Dima, B.; Takács, K.; Merényi, Z.; Varga, T.; Turcsányi, G.; Bidló, A.; Ódor, P. Drivers of macrofungal species composition in temperate forests, West Hungary: Functional groups compared. Fungal Ecol. 2015, 17, 69–83. [Google Scholar] [CrossRef]
- Chen, Y.; Yuan, Z.; Bi, S.; Wang, X.; Ye, Y.; Svenning, J.-C. Macrofungal species distributions depend on habitat partitioning of topography, light, and vegetation in a temperate mountain forest. Sci. Rep. 2018, 8, 1–13. [Google Scholar] [CrossRef]
- Nie, Z.-L.; Wen, J.; Gu, Z.-J.; Boufford, D.E.; Sun, H. Polyploidy in the flora of the Hengduan Mountains hotspot, south-western China. Ann. Mo. Bot. Garden 2005, 92, 275–306. [Google Scholar]
- Xu, L.B.; Zhou, S.Z. Quaternary glaciations recorded by glacial and fluvial landforms in the Shaluli Mountains, Southeastern Tibetan Plateau. Geomorphology 2009, 103, 268–275. [Google Scholar] [CrossRef]
- Yang, M.X.; Werth, S.; Wang, L.S.; Scheidegger, C. Phylogeographic analyses of an epiphytic foliose lichen show multiple dispersal events westward from the Hengduan Mountains of Yunnan into the Himalayas. Ecol. Evol. 2022, 12, e9308. [Google Scholar] [CrossRef] [PubMed]
- Sun, H.; Li, Z. Qinchai-Tibet Plateau uplift and its impact on tethys flora. Adv. Earth Sci. 2003, 18, 852–862. [Google Scholar] [CrossRef]
- Zhang, D.-C.; Zhang, Y.-H.; Boufford, D.E.; Sun, H. Elevational patterns of species richness and endemism for some important taxa in the Hengduan Mountains, southwestern China. Biodivers. Conserv. 2009, 18, 699–716. [Google Scholar] [CrossRef]
- Wang, X.; Chai, K.; Liu, S.; Wei, J.; Jiang, Z.; Liu, Q. Changes of glaciers and glacial lakes implying corridor-barrier effects and climate change in the Hengduan Shan, southeastern Tibetan Plateau. J. Glaciol. 2017, 63, 535–542. [Google Scholar] [CrossRef]
- Liu, L.H.; Yu, Y.D.; Zhang, J.H. The division of vertical vegetation zone in Hengduanshan. Acta Bot. Yunnanica. 1984, 6, 205–216. [Google Scholar]
- Xu, B.; Li, Z.-M.; Sun, H. Plant diversity and floristic characters of the alpine subnival belt flora in the Hengduan Mountains, SW China. J. Syst. Evol. 2014, 52, 271–279. [Google Scholar] [CrossRef]
- Fan, Z.M. Scenario simulation of vertical distribution changes of vegetation ecosystem in the Qinghai-Tibet Plateau. Acta Ecol. Sin. 2021, 41, 8178–8191. [Google Scholar] [CrossRef]
- Kratochwil, A. Biodiversity in ecosystems: Some principles. In Tasks for Vegetation Science; Springer: Dordrecht, The Netherlands, 1999; Volume 34, pp. 5–38. [Google Scholar]
- Magurran, A.E. Ecological Diversity and Its Measurement; Princeton University Press: Princeton, NJ, USA, 1988. [Google Scholar]
- Liu, Z.; Li, Q.; Chen, D.; Zhai, W.; Zhao, L.; Xu, S.; Zhao, X. Patterns of plant species diversity along an altitudinal gradient and its effect on above-ground biomass in alpine meadows in Qinghai-Tibet Plateau. Biodivers. Sci. 2015, 23, 451–462. [Google Scholar] [CrossRef]
- Chen, W.; Wang, J.; Chen, X.; Meng, Z.; Xu, R.; Duoji, D.; Zhang, J.; He, J.; Wang, Z.; Chen, J.; et al. Soil microbial network complexity predicts ecosystem function along elevation gradients on the Tibetan Plateau. Soil Biol. Biochem. 2022, 172, 108766. [Google Scholar] [CrossRef]
- Peet, R.K. Forest vegetation of the Colorado Front Range: Patterns of species diversity. Vegetatio 1978, 37, 65–78. [Google Scholar] [CrossRef]
- Wang, X.; Zhu, J.; Peng, S.; Zheng, T.; Qi, Z.; Hu, J.; Ji, C. Patterns of grassland community composition and structure along an elevational gradient on the Qinghai–Tibet Plateau. J. Plant Ecol. 2022, 15, 808–817. [Google Scholar] [CrossRef]
- Stevens, G.C. The elevational gradient in altitudinal range: An extension of Rapoport’s latitudinal rule to altitude. Am. Nat. 1992, 140, 893–911. [Google Scholar] [CrossRef] [PubMed]
- Yu, H.; Miao, S.; Xie, G.; Guo, X.; Chen, Z.; Favre, A. Contrasting Floristic Diversity of the Hengduan Mountains, the Himalayas and the Qinghai-Tibet Plateau Sensu Stricto in China. Front. Ecol. Evol. 2020, 8, 136. [Google Scholar] [CrossRef]
- Hu, Y.; Fei, S.Y.; Wang, C.; Zhang, T.X.; He, X.C.; Ran, J.H. Bird diversity in the southern section of Shaluli Mountains, Sichuan. Sichuan J. Zool. 2023, 42, 101–108. [Google Scholar] [CrossRef]
- Li, J.; He, Q.; Hua, X.; Zhou, J.; Xu, H.; Chen, J.; Fu, C. Climate and history explain the species richness peak at mid-elevation for Schizothorax fishes (Cypriniformes: Cyprinidae) distributed in the Tibetan Plateau and its adjacent regions. Glob. Ecol. Biogeogr. 2009, 18, 264–272. [Google Scholar] [CrossRef]
- Hu, Y.; Liang, J.; Jin, K.; Ding, Z.; Zhou, Z.; Hu, H.; Jiang, Z. The elevational patterns of mammalian richness in the Himalayas. Biodivers. Sci. 2018, 26, 191–201. [Google Scholar] [CrossRef]
- Jun, X.W.; He, Z.; Li, J.B.; Xie, T.; Wu, Y.H.; Zhen, L.X. Spatiotemporal distribution patterns and drivers of bacterial communities in the rhizosphere and bulk soil under an Abies fabri forest on Gongga Mountain. Chin. J. Appl. Environ. Biol. 2021, 27, 1130–1137. [Google Scholar] [CrossRef]
- Zhang, D.-R.; Chen, M.-Y.; Murphy, R.W.; Che, J.; Pang, J.-F.; Hu, J.-S.; Luo, J.; Wu, S.-J.; Ye, H.; Zhang, Y.-P. Genealogy and palaeodrainage basins in Yunnan Province: Phylogeography of the Yunnan spiny frog, Nanorana yunnanensis (Dicroglossidae). Mol. Ecol. 2010, 19, 3406–3420. [Google Scholar] [CrossRef]
- Fu, P.; Heyman, J.; Hättestrand, C.; Stroeven, A.P.; Harbor, J.M. Glacial geomorphology of the Shaluli Shan area, southeastern Tibetan Plateau. J. Maps 2012, 8, 48–55. [Google Scholar] [CrossRef]
- Largent, D.L. How to Identify Mushrooms to Fenus; Mad River Press: Eureka, CA, USA, 1986; Volume 1–5. [Google Scholar]
- Zhao, R.-L.; Zhou, J.-L.; Chen, J.; Margaritescu, S.; Sánchez-Ramírez, S.; Hyde, K.D.; Callac, P.; Parra, L.A.; Li, G.-J.; Moncalvo, J.-M. Towards standardizing taxonomic ranks using divergence times–a case study for reconstruction of the Agaricus taxonomic system. Fungal Divers. 2016, 78, 239–292. [Google Scholar] [CrossRef]
- Li, J.-X.; He, M.-Q.; Zhao, R.-L. A review of Cystoderma (Agaricales/Basidiomycota) from China with four new species and two new records. Mycology 2022, 13, 163–176. [Google Scholar] [CrossRef]
- Li, J.-X.; He, M.-Q.; Zhao, R.-L. Three new species of Micropsalliota (Agaricaceae, Agaricales) from China. Phytotaxa 2021, 491, 167–176. [Google Scholar] [CrossRef]
- Sanger, F.; Nicklen, S.; Coulson, A.R. DNA sequencing with chain-terminating inhibitors. Proc. Natl. Acad. Sci. USA 1977, 74, 5463–5467. [Google Scholar] [CrossRef] [PubMed]
- Schoch, C.L.; Seifert, K.A.; Huhndorf, S.; Robert, V.; Spouge, J.L.; Levesque, C.A.; Chen, W.; Consortium, F.B.; Fungal Barcoding Consortium Author List; Bolchacova, E.; et al. Nuclear ribosomal internal transcribed spacer (ITS) region as a universal DNA barcode marker for Fungi. Proc. Natl. Acad. Sci. USA 2012, 109, 6241–6246. [Google Scholar] [CrossRef] [PubMed]
- Vu, D.; Groenewald, M.; De Vries, M.; Gehrmann, T.; Stielow, B.; Eberhardt, U.; Al-Hatmi, A.; Groenewald, J.Z.; Cardinali, G.; Houbraken, J.; et al. Large-scale generation and analysis of filamentous fungal DNA barcodes boosts coverage for kingdom fungi and reveals thresholds for fungal species and higher taxon delimitation. Stud. Mycol. 2019, 92, 135–154. [Google Scholar] [CrossRef] [PubMed]
- He, M.-Q.; Zhao, R.-L.; Hyde, K.D.; Begerow, D.; Kemler, M.; Yurkov, A.; McKenzie, E.H.C.; Raspé, O.; Kakishima, M.; Sánchez-Ramírez, S.; et al. Notes, outline and divergence times of Basidiomycota. Fungal Divers. 2019, 99, 105–367. [Google Scholar] [CrossRef]
- Wijayawardene, N.N.; Hyde, K.D.; Lumbsch, H.T.; Liu, J.K.; Maharachchikumbura, S.S.N.; Ekanayaka, A.H.; Tian, Q.; Phookamsak, R. Outline of Ascomycota: 2017. Fungal Divers. 2018, 88, 167–263. [Google Scholar] [CrossRef]
- Chen, C.J.; Chen, H.; Zhang, Y.; Thomas, H.R.; Frank, M.H.; He, Y.H.; Xia, R. TBtools: An Integrative Toolkit Developed for Interactive Analyses of Big Biological Data. Mol. Plant 2020, 13, 1194–1202. [Google Scholar] [CrossRef]
- R Core Team R: A Language and Environment for Statistical Computing. R Foundation for Statistical Computing. Vienna, Austria. 2017. Available online: https://www.r-project.org (accessed on 12 November 2022).
- Lex, A.; Gehlenborg, N.; Strobelt, H.; Vuillemot, R.; Pfister, H. UpSet: Visualization of Intersecting Sets. IEEE Trans. Vis. Comput. Graph. 2014, 20, 1983–1992. [Google Scholar] [CrossRef]
- Li, Y.; Sun, N.; Lu, Z.; Sun, S.; Huang, J.; Chen, Z.; He, J. Prognostic alternative mRNA splicing signature in non-small cell lung cancer. Cancer Lett. 2017, 393, 40–51. [Google Scholar] [CrossRef]
- Oksanen, J.; Blanchet, F.G.; Friendly, M.; Kindt, R.; Legendre, P.; McGlinn, D.; Minchin, P.R.; O’hara, R.B.; Simpson, G.L.; Solymos, P. Vegan: Community Ecology Package (2.5-7). 2020. Available online: https://CRAN.R-project.org/package=vegan (accessed on 20 January 2023).
- Zhang, J.; Liu, Y.-X.; Zhang, N.; Hu, B.; Jin, T.; Xu, H.; Qin, Y.; Yan, P.; Zhang, X.; Guo, X.; et al. NRT1.1B is associated with root microbiota composition and nitrogen use in field-grown rice. Nat. Biotechnol. 2019, 37, 676–684. [Google Scholar] [CrossRef] [PubMed]
- Liu, Y.-X.; Qin, Y.; Chen, T.; Lu, M.; Qian, X.; Guo, X.; Bai, Y. A practical guide to amplicon and metagenomic analysis of microbiome data. Protein Cell 2021, 12, 315–330. [Google Scholar] [CrossRef]
- Seaton, F.M.; George, P.B.L.; Lebron, I.; Jones, D.L.; Creer, S.; Robinson, D.A. Soil textural heterogeneity impacts bacterial but not fungal diversity. Soil Biol. Biochem. 2020, 144, 107766. [Google Scholar] [CrossRef]
- Oksanen, J.; Blanchet, F.G.; Kindt, R.; Legendre, P.; Minchin, P.R.; O’hara, R.B.; Simpson, G.L.; Solymos, P.; Stevens, M.H.H.; Wagner, H. Package ‘vegan’. Community Ecology Package, Version 2.6-4; 2013. Available online: https://cran.ism.ac.jp/web/packages/vegan/vegan.pdf (accessed on 5 November 2022).
- Zgadzaj, R.; Garrido-Oter, R.; Jensen, D.B.; Koprivova, A.; Schulze-Lefert, P.; Radutoiu, S. Root nodule symbiosis in Lotus japonicus drives the establishment of distinctive rhizosphere, root, and nodule bacterial communities. Proc. Natl. Acad. Sci. USA 2016, 113, E7996–E8005. [Google Scholar] [CrossRef] [PubMed]
- Yijian, Y.; Jiangchun, W.; Wenying, Z.; Lei, C.; Dongmei, L.; Junsheng, L.; Tiezheng, W.; Yi, L.; Ke, W.; Haijun, W. Development of red list assessment of macrofungi in China. Biodivers. Sci. 2020, 28, 4–10. [Google Scholar] [CrossRef]
- Ke, W.; Dongmei, L.; Lei, C.; Haijun, W.; Yi, L.; Tiezheng, W.; Yonghui, W.; Hongmei, W.; Xiaodan, W.; Binbin, L.; et al. Methods and procedures of the red list assessment of macrofungi in China. Biodivers. Sci. 2020, 28, 11–19. [Google Scholar] [CrossRef]
- Yijian, Y.; Jiangchun, W.; Wenying, Z.; Tiezheng, W.; Yi, L.; Xinli, W.; Hong, D.; Dongmei, L.; Lei, C.; Junsheng, L.; et al. Threatened species list of China’s macrofungi. Biodivers. Sci. 2020, 28, 20–25. [Google Scholar] [CrossRef]
- Yijian, Y. Red list assessment of macrofungi in China. Biodivers. Sci. 2020, 28, 1–3. [Google Scholar] [CrossRef]
- Packham, J.M.; May, T.; Brown, M.J.; Wardlaw, T.; Mills, A.K. Macrofungal diversity and community ecology in mature and regrowth wet eucalypt forest in Tasmania: A multivariate study. Austral Ecol. 2002, 27, 149–161. [Google Scholar] [CrossRef]
- O’hanlon, R.; Harrington, T.J. Macrofungal diversity and ecology in four Irish forest types. Fungal Ecol. 2012, 5, 499–508. [Google Scholar] [CrossRef]
- Tuo, Y.; Rong, N.; Hu, J.; Zhao, G.; Wang, Y.; Zhang, Z.; Qi, Z.; Li, Y.; Zhang, B. Exploring the Relationships between Macrofungi Diversity and Major Environmental Factors in Wunvfeng National Forest Park in Northeast China. J. Fungi 2022, 8, 98. [Google Scholar] [CrossRef] [PubMed]
- Jang, S.-K.; Hur, T.-C. Relationship between Climatic Factors and the Distribution of Higher Fungi in Byeonsanbando National Park, Korea. Mycobiology 2014, 42, 27–33. [Google Scholar] [CrossRef] [PubMed]
- Luo, X.; Karunarathna, S.C.; Luo, Y.H.; Xu, K.; Xu, J.C.; Chamyuang, S.; Mortimer, P.E. Drivers of macrofungal composition and distribution in Yulong Snow Mountain, southwest China. Mycosphere 2016, 7, 727–740. [Google Scholar] [CrossRef]
- Liu, Z.; Fang, J.; Song, B.; Yang, Y.; Yu, Z.; Hu, J.; Dong, K.; Takahashi, K.; Adams, J.M. Stochastic processes dominate soil arbuscular mycorrhizal fungal community assembly along an elevation gradient in central Japan. Sci. Total. Environ. 2023, 855, 158941. [Google Scholar] [CrossRef] [PubMed]
- Guo, Q.F.; Berry, W.L. Species richness and biomass: Dissection of the hump-shaped relationships. Ecology 1998, 79, 2555–2559. [Google Scholar] [CrossRef]


| Phylum | Class | Order | Family | Genus | Vegetation Type |
|---|---|---|---|---|---|
| Ascomycota | Geoglossomycetes | Geoglossales | Geoglossaceae | Geoglossum | Jun |
| Trichoglossum | PQ | ||||
| Leotiomycetes | Helotiales | Chlorociboriaceae | Chlorociboria | PQ | |
| Helotiaceae | Bisporella | Pic | |||
| Leotiaceae | Leotia | Pic, PQ, Que | |||
| Pezizomycetes | Pezizales | Discinaceae | Gyromitra | Pin, Pop | |
| Helvellaceae | Helvella | Abi, PA, Pic, PQ, Que | |||
| Otideaceae | Otidea | Abi, PA, Que | |||
| Pyronemataceae | Cheilymenia | Pin | |||
| Humaria | Pic, Pin, Que | ||||
| Sowerbyella | Que | ||||
| Sarcoscyphaceae | Cookeina | Pic | |||
| Sarcosomataceae | Plectania | Que | |||
| incertae sedis | Tarzetta | Que | |||
| Rhytismatales | Cudoniaceae | Cudonia | PA, Pin | ||
| Spathularia | Abi, Jun, PA, Pic, Pin | ||||
| Sordariomycetes | Hypocreales | Hypocreaceae | Hypomyces | Que | |
| Ophiocordycipitaceae | Tolypocladium | Pop | |||
| Xylariales | Hypoxylaceae | Daldinia | Abi, Pic, Que | ||
| Hypoxylon | Que | ||||
| Basidiomycota | Agaricomycetes | Agaricales | Agaricaceae | Agaricus | AM, PA, Pic, Pin, PQ, Que |
| Holocotylon | AM | ||||
| Lepiota | Abi, Pic, Que, SS | ||||
| Leucoagaricus | Abi | ||||
| Leucocoprinus | Abi | ||||
| Amanitaceae | Amanita | AM, PA, Pic, Pin, PQ, Que, SS | |||
| Biannulariaceae | Catathelasma | PA, Pic | |||
| Bolbitiaceae | Pholiotina | Pin | |||
| Cortinariaceae | Cortinarius | Abi, AM, PA, Pic, Pin, Pop, PQ, Que, SS | |||
| Crepidotaceae | Crepidotus | Pic | |||
| Pleuroflammula | Pin | ||||
| Cyphellaceae | Chondrostereum | Pin | |||
| Entolomataceae | Clitopilus | Abi, PA, Pop, Que | |||
| Entoloma | Abi, AM, Jun, PA, Pic, PQ, Que, SS | ||||
| Hydnangiaceae | Laccaria | Abi, AM, PA, Pic, Pin, Pop, PQ, Que | |||
| Hygrophoraceae | Cuphophyllus | Abi, Jun, Pop, Que, SS | |||
| Hygrocybe | Abi, Jun, Pic, Que, SS, SS | ||||
| Hygrophorus | Abi, PA, Pic, Pin, PQ, Que | ||||
| Lichenomphalia | Abi, Pic, Pin | ||||
| Spodocybe | Pic | ||||
| Hymenogastraceae | Galerina | PA, Pin | |||
| Gymnopilus | Abi, Pin | ||||
| Hebeloma | Abi, Jun, PA, Pic, Pin, Pop, Que, SS | ||||
| incertae sedis | Abi | ||||
| Inocybaceae | Inocybe | Abi, AM, Jun, PA, Pic, Pin, Pop, PQ, Que, SS | |||
| Inosperma | Que | ||||
| Mallocybe | Abi, PA, Pop | ||||
| Pseudosperma | Que | ||||
| Lycoperdaceae | Apioperdon | Pic, Que | |||
| Bovista | Abi, AM, Jun | ||||
| Calvatia | PA, Que | ||||
| Lycoperdon | Abi, AM, Jun, PA, Pic, Pin, Pop, Que, SS | ||||
| Lyophyllaceae | Calocybe | Pic | |||
| Hypsizygus | Que | ||||
| Lyophyllum | Jun, PA, PQ, Que, SS | ||||
| Tephrocybe | PA | ||||
| Marasmiaceae | Marasmius | Abi, Jun, Pic | |||
| Mycenaceae | Hydropus | Pic, Que | |||
| Mycena | Abi, AM, PA, Pic, Pin, Pop, PQ, Que | ||||
| Panellus | Pic | ||||
| Xeromphalina | Pic, Pin | ||||
| Omphalotaceae | Gymnopus | Abi, AM, PA, Pic, Pin, PQ, Que | |||
| Lentinula | Pin | ||||
| Marasmiellus | PQ, Que | ||||
| Omphalotus | PA | ||||
| Rhodocollybia | Abi | ||||
| Physalacriaceae | Armillaria | Abi, PA, Pic, Pin, Pop, Que | |||
| Hymenopellis | Pin | ||||
| Mucidula | PQ | ||||
| Oudemansiella | PQ | ||||
| Xerula | Pic | ||||
| Pleurotaceae | Hohenbuehelia | Pic | |||
| Pleurotus | Abi, PA, Pic | ||||
| Pluteaceae | Pluteus | Abi, PA, Pin, Pop, Que | |||
| Volvopluteus | PA, PQ, Que | ||||
| Psathyrellaceae | Coprinellus | Que | |||
| Coprinopsis | Que | ||||
| Homophron | Abi, PA | ||||
| Psathyrella | Pic, Que | ||||
| Pseudoclitocybaceae | Pseudoclitocybe | Que | |||
| Strophariaceae | Agrocybe | PA | |||
| Deconica | Pic | ||||
| Hypholoma | Pop | ||||
| Pholiota | Abi, Pic, Pin, Pop, Que | ||||
| Protostropharia | PA, PQ, Que | ||||
| Stropharia | AM, PA | ||||
| Tricholomataceae | Leucopaxillus | Pop | |||
| Pseudotricholoma | Jun | ||||
| Tricholoma | Abi, Jun, PA, Pic, Pin, Que | ||||
| incertae sedis | Aspropaxillus | PA | |||
| Clitocybe | Jun, PA, Pic, Que | ||||
| Clitocybula | Abi | ||||
| Collybia | PA, Pin, PQ, Que | ||||
| Cyathus | Pop | ||||
| Cystoderma | AM | ||||
| Cystodermella | Pic | ||||
| Floccularia | Abi, Jun, PA, Pin | ||||
| Gerronema | Pic | ||||
| Infundibulicybe | PA, Pic, Que | ||||
| Lepista | Abi, PA, Que | ||||
| Melanoleuca | Pic, Que | ||||
| Mycenella | Que | ||||
| Nidula | Pic | ||||
| Panaeolus | AM, Pic | ||||
| Rhizocybe | Pop, PQ | ||||
| Tricholomopsis | Pin, Pop | ||||
| Auriculariales | Auriculariaceae | Auricularia | Abi, Pic, Pop | ||
| incertae sedis | Guepinia | PA, PQ | |||
| Ovipoculum | Abi | ||||
| Boletales | Boletaceae | Boletus | Abi, PA, Que | ||
| Cyanoboletus | Que | ||||
| Harrya | PQ | ||||
| Hourangia | Que | ||||
| Leccinum | Abi, AM, PA, Pin, Pop, Que, SS | ||||
| Strobilomyces | Que | ||||
| Suillellus | Que | ||||
| Tylopilus | Que | ||||
| Xanthoconium | Abi | ||||
| Xerocomellus | Abi, Que | ||||
| Xerocomus | PQ, Que | ||||
| Zangia | Que | ||||
| Gomphidiaceae | Gomphidius | Pic | |||
| Paxillaceae | Paxillus | Que | |||
| Rhizopogonaceae | Rhizopogon | Abi, Pin | |||
| Sclerodermataceae | Scleroderma | PA, Que | |||
| Suillaceae | Suillus | Abi, Pic, Pin | |||
| Tapinellaceae | Pseudomerulius | Pic | |||
| Tapinella | Pop | ||||
| Cantharellales | Hydnaceae | Cantharellus | Que | ||
| Clavulina | Pic | ||||
| Craterellus | PQ | ||||
| Hydnum | Abi, Pic, Pin, PQ | ||||
| Geastrales | Geastraceae | Geastrum | PA | ||
| Gomphales | Clavariadelphaceae | Clavariadelphus | Abi, PA, Pic, Pop, Que | ||
| Gomphaceae | Gomphus | PA, Pic, Que, SS | |||
| Phaeoclavulina | Jun, Pic, PQ, Que | ||||
| Ramaria | Abi, PA, Pic, Pin, PQ, Que | ||||
| Turbinellus | Pic, PQ | ||||
| Hymenochaetales | Hymenochaetaceae | Coltricia | Abi, PA | ||
| Inonotus | Pin | ||||
| Phellinus | Que | ||||
| Rickenellaceae | Cotylidia | Pic | |||
| Hysterangiales | Hysterangiaceae | Hysterangium | Pic | ||
| Polyporales | Dacryobolaceae | Amaropostia | Pic | ||
| Fomitopsidaceae | Antrodia | Pop | |||
| Fomitopsis | Que | ||||
| Incrustoporiaceae | Tyromyces | Que | |||
| Panaceae | Panus | PA | |||
| Podoscyphaceae | Abortiporus | Que | |||
| Polyporaceae | Daedaleopsis | Abi, PA, Pic, Pop | |||
| Ganoderma | Que | ||||
| Laccocephalum | Abi | ||||
| Lenzites | Pic | ||||
| Neofavolus | Que | ||||
| Polyporus | PA, Pic, Pin, Pop, Que | ||||
| Trametes | Abi, Que | ||||
| Steccherinaceae | Nigroporus | Que | |||
| incertae sedis | Mycoleptodonoides | Pic | |||
| Russulales | Albatrellaceae | Albatrellus | PA, PQ | ||
| Auriscalpiaceae | Auriscalpium | Abi | |||
| Lentinellus | Pic | ||||
| Bondarzewiaceae | Heterobasidion | Pic, Pop | |||
| Hericiaceae | Hericium | Que | |||
| Russulaceae | Lactarius | Abi, AM, PA, Pic, Pin, Pop, PQ, Que, SS | |||
| Lactifluus | Abi, Pop | ||||
| Russula | Abi, AM, Jun, PA, Pic, Pin, Pop, PQ, Que, SS | ||||
| Stereaceae | Stereum | PQ, Que | |||
| Stereopsidales | Stereopsidaceae | Stereopsis | Abi, Pic, PQ | ||
| Thelephorales | Bankeraceae | Bankera | Pic, Pin | ||
| Boletopsis | PQ | ||||
| Hydnellum | Pic, Que | ||||
| Sarcodon | PA, Pin, Que | ||||
| Thelephoraceae | Phellodon | Pin | |||
| Dacrymycetes | Dacrymycetales | Dacrymycetaceae | Calocera | Abi, PA, Pic, Pin | |
| Dacrymyces | Abi, Pic, Pop | ||||
| Guepiniopsis | Que | ||||
| Exobasidiomycetes | Exobasidiales | Exobasidiaceae | Exobasidium | Pic | |
| Tremellomycetes | Tremellales | Naemateliaceae | Naematelia | Que |
| Family | Number of Species | Percentage (%) |
|---|---|---|
| Cortinariaceae | 116 | 15.14% |
| Russulaceae | 97 | 12.66% |
| Inocybaceae | 56 | 7.31% |
| Hygrophoraceae | 37 | 4.83% |
| Boletaceae | 32 | 4.18% |
| Tricholomataceae | 28 | 3.66% |
| Entolomataceae | 25 | 3.26% |
| Mycenaceae | 23 | 3.00% |
| Amanitaceae | 22 | 2.87% |
| Hymenogastraceae | 22 | 2.87% |
| Hydnangiaceae | 20 | 2.61% |
| Lycoperdaceae | 19 | 2.48% |
| Gomphaceae | 16 | 2.09% |
| Omphalotaceae | 15 | 1.96% |
| Strophariaceae | 15 | 1.96% |
| Agaricaceae | 14 | 1.83% |
| Polyporaceae | 14 | 1.83% |
| Pluteaceae | 10 | 1.31% |
| Lyophyllaceae | 10 | 1.31% |
| Genra | Number of Species | Percentage (%) |
|---|---|---|
| Cortinarius | 116 | 15.14% |
| Russula | 59 | 7.70% |
| Inocybe | 51 | 6.66% |
| Lactarius | 37 | 4.83% |
| Tricholoma | 26 | 3.39% |
| Entoloma | 23 | 3.00% |
| Amanita | 22 | 2.87% |
| Laccaria | 20 | 2.61% |
| Hygrophorus | 18 | 2.35% |
| Mycena | 18 | 2.35% |
| Lycoperdon | 14 | 1.83% |
| Hebeloma | 13 | 1.70% |
| Ramaria | 11 | 1.44% |
| Hygrocybe | 10 | 1.31% |
| Leccinum | 10 | 1.31% |
| Gymnopus | 10 | 1.31% |
Disclaimer/Publisher’s Note: The statements, opinions and data contained in all publications are solely those of the individual author(s) and contributor(s) and not of MDPI and/or the editor(s). MDPI and/or the editor(s) disclaim responsibility for any injury to people or property resulting from any ideas, methods, instructions or products referred to in the content. |
© 2023 by the authors. Licensee MDPI, Basel, Switzerland. This article is an open access article distributed under the terms and conditions of the Creative Commons Attribution (CC BY) license (https://creativecommons.org/licenses/by/4.0/).
Share and Cite
Han, X.; Liu, D.; Zhang, M.; He, M.; Li, J.; Zhu, X.; Wang, M.; Thongklang, N.; Zhao, R.; Cao, B. Macrofungal Diversity and Distribution Patterns in the Primary Forests of the Shaluli Mountains. J. Fungi 2023, 9, 491. https://doi.org/10.3390/jof9040491
Han X, Liu D, Zhang M, He M, Li J, Zhu X, Wang M, Thongklang N, Zhao R, Cao B. Macrofungal Diversity and Distribution Patterns in the Primary Forests of the Shaluli Mountains. Journal of Fungi. 2023; 9(4):491. https://doi.org/10.3390/jof9040491
Chicago/Turabian StyleHan, Xixi, Dongmei Liu, Mingzhe Zhang, Maoqiang He, Jiaxin Li, Xinyu Zhu, Meiqi Wang, Naritsada Thongklang, Ruilin Zhao, and Bin Cao. 2023. "Macrofungal Diversity and Distribution Patterns in the Primary Forests of the Shaluli Mountains" Journal of Fungi 9, no. 4: 491. https://doi.org/10.3390/jof9040491