
Phenothiazines Rapidly Induce Laccase Expression and Lignin-Degrading Properties in the White-Rot Fungus Phlebia radiata
 , , and
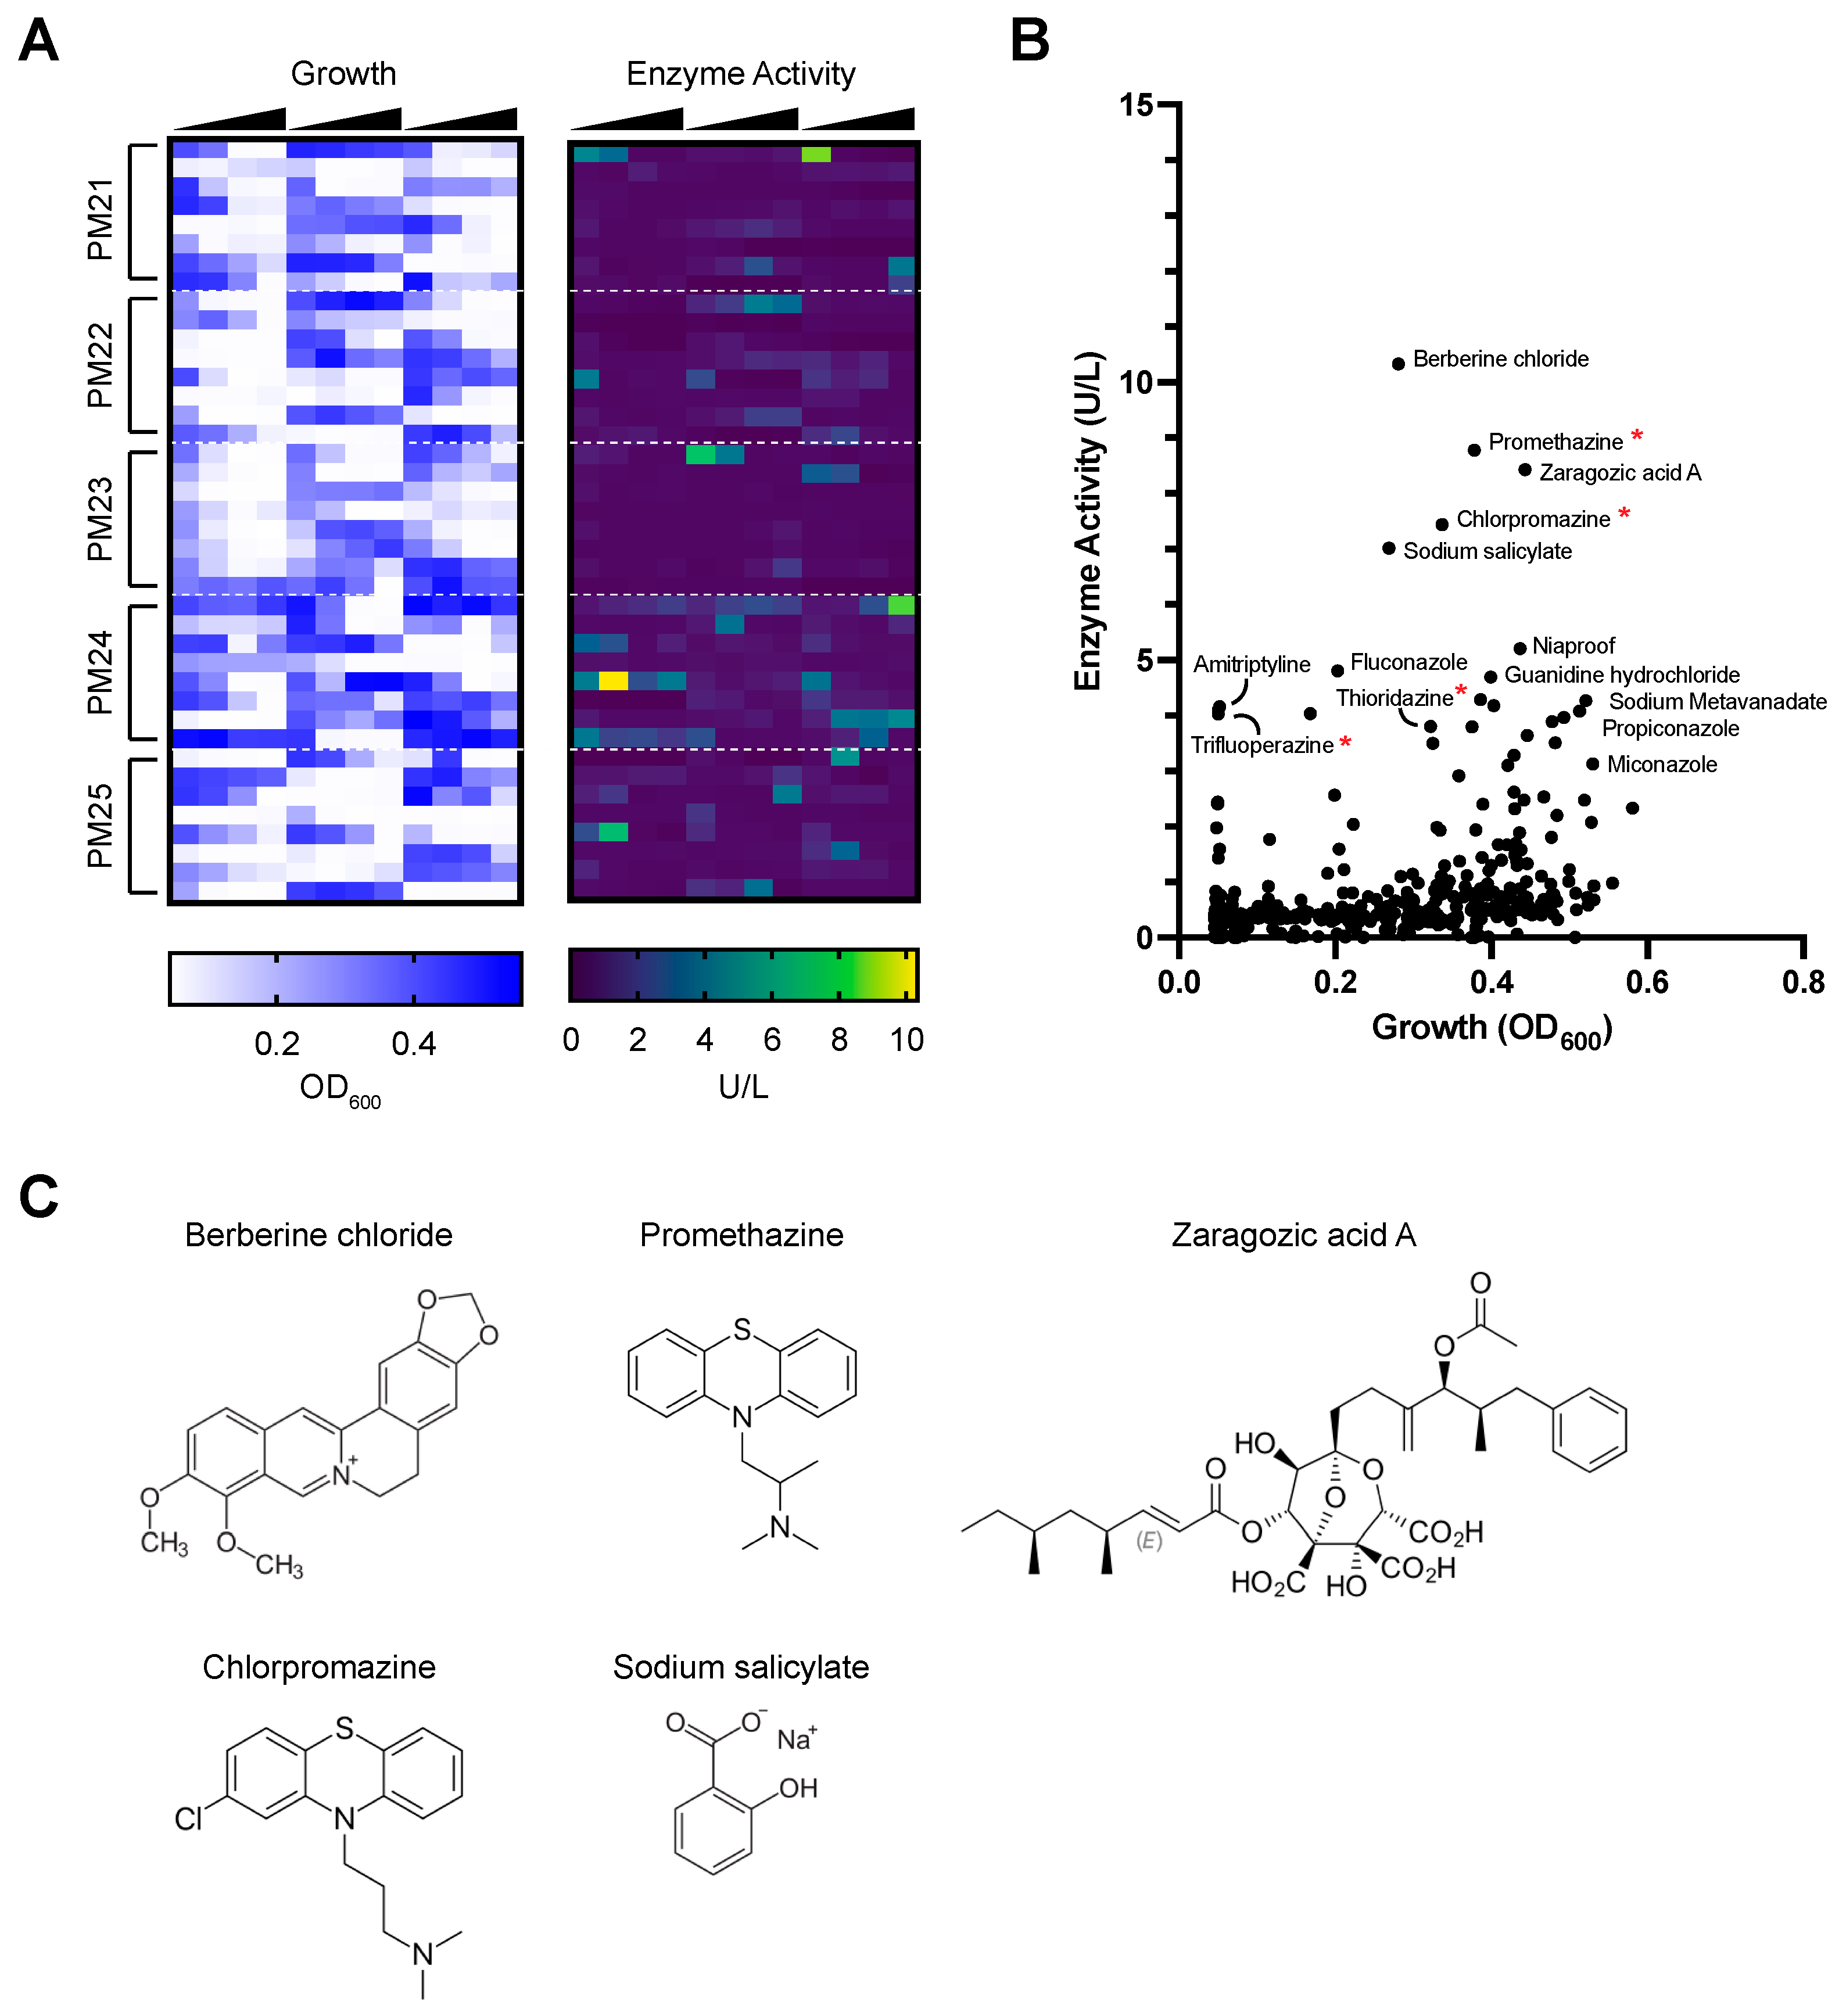
Abstract
:1. Introduction
2. Materials and Methods
2.1. Strains and Culture Conditions
2.2. Chemical Screen Using Phenotype Microarrays
2.3. Promethazine Induction Experiments
2.4. Laccase Activity Assays
2.5. Secretome Analysis Using Label-Free Quantitative Proteomics
2.6. Degradation Analysis of Lignin Model Compounds
2.7. RNA Purification, RNA-Sequencing and Transcriptomic Analyses
3. Results
3.1. Chemical Screen to Identify Compounds That Induce Laccase Expression in P. radiata
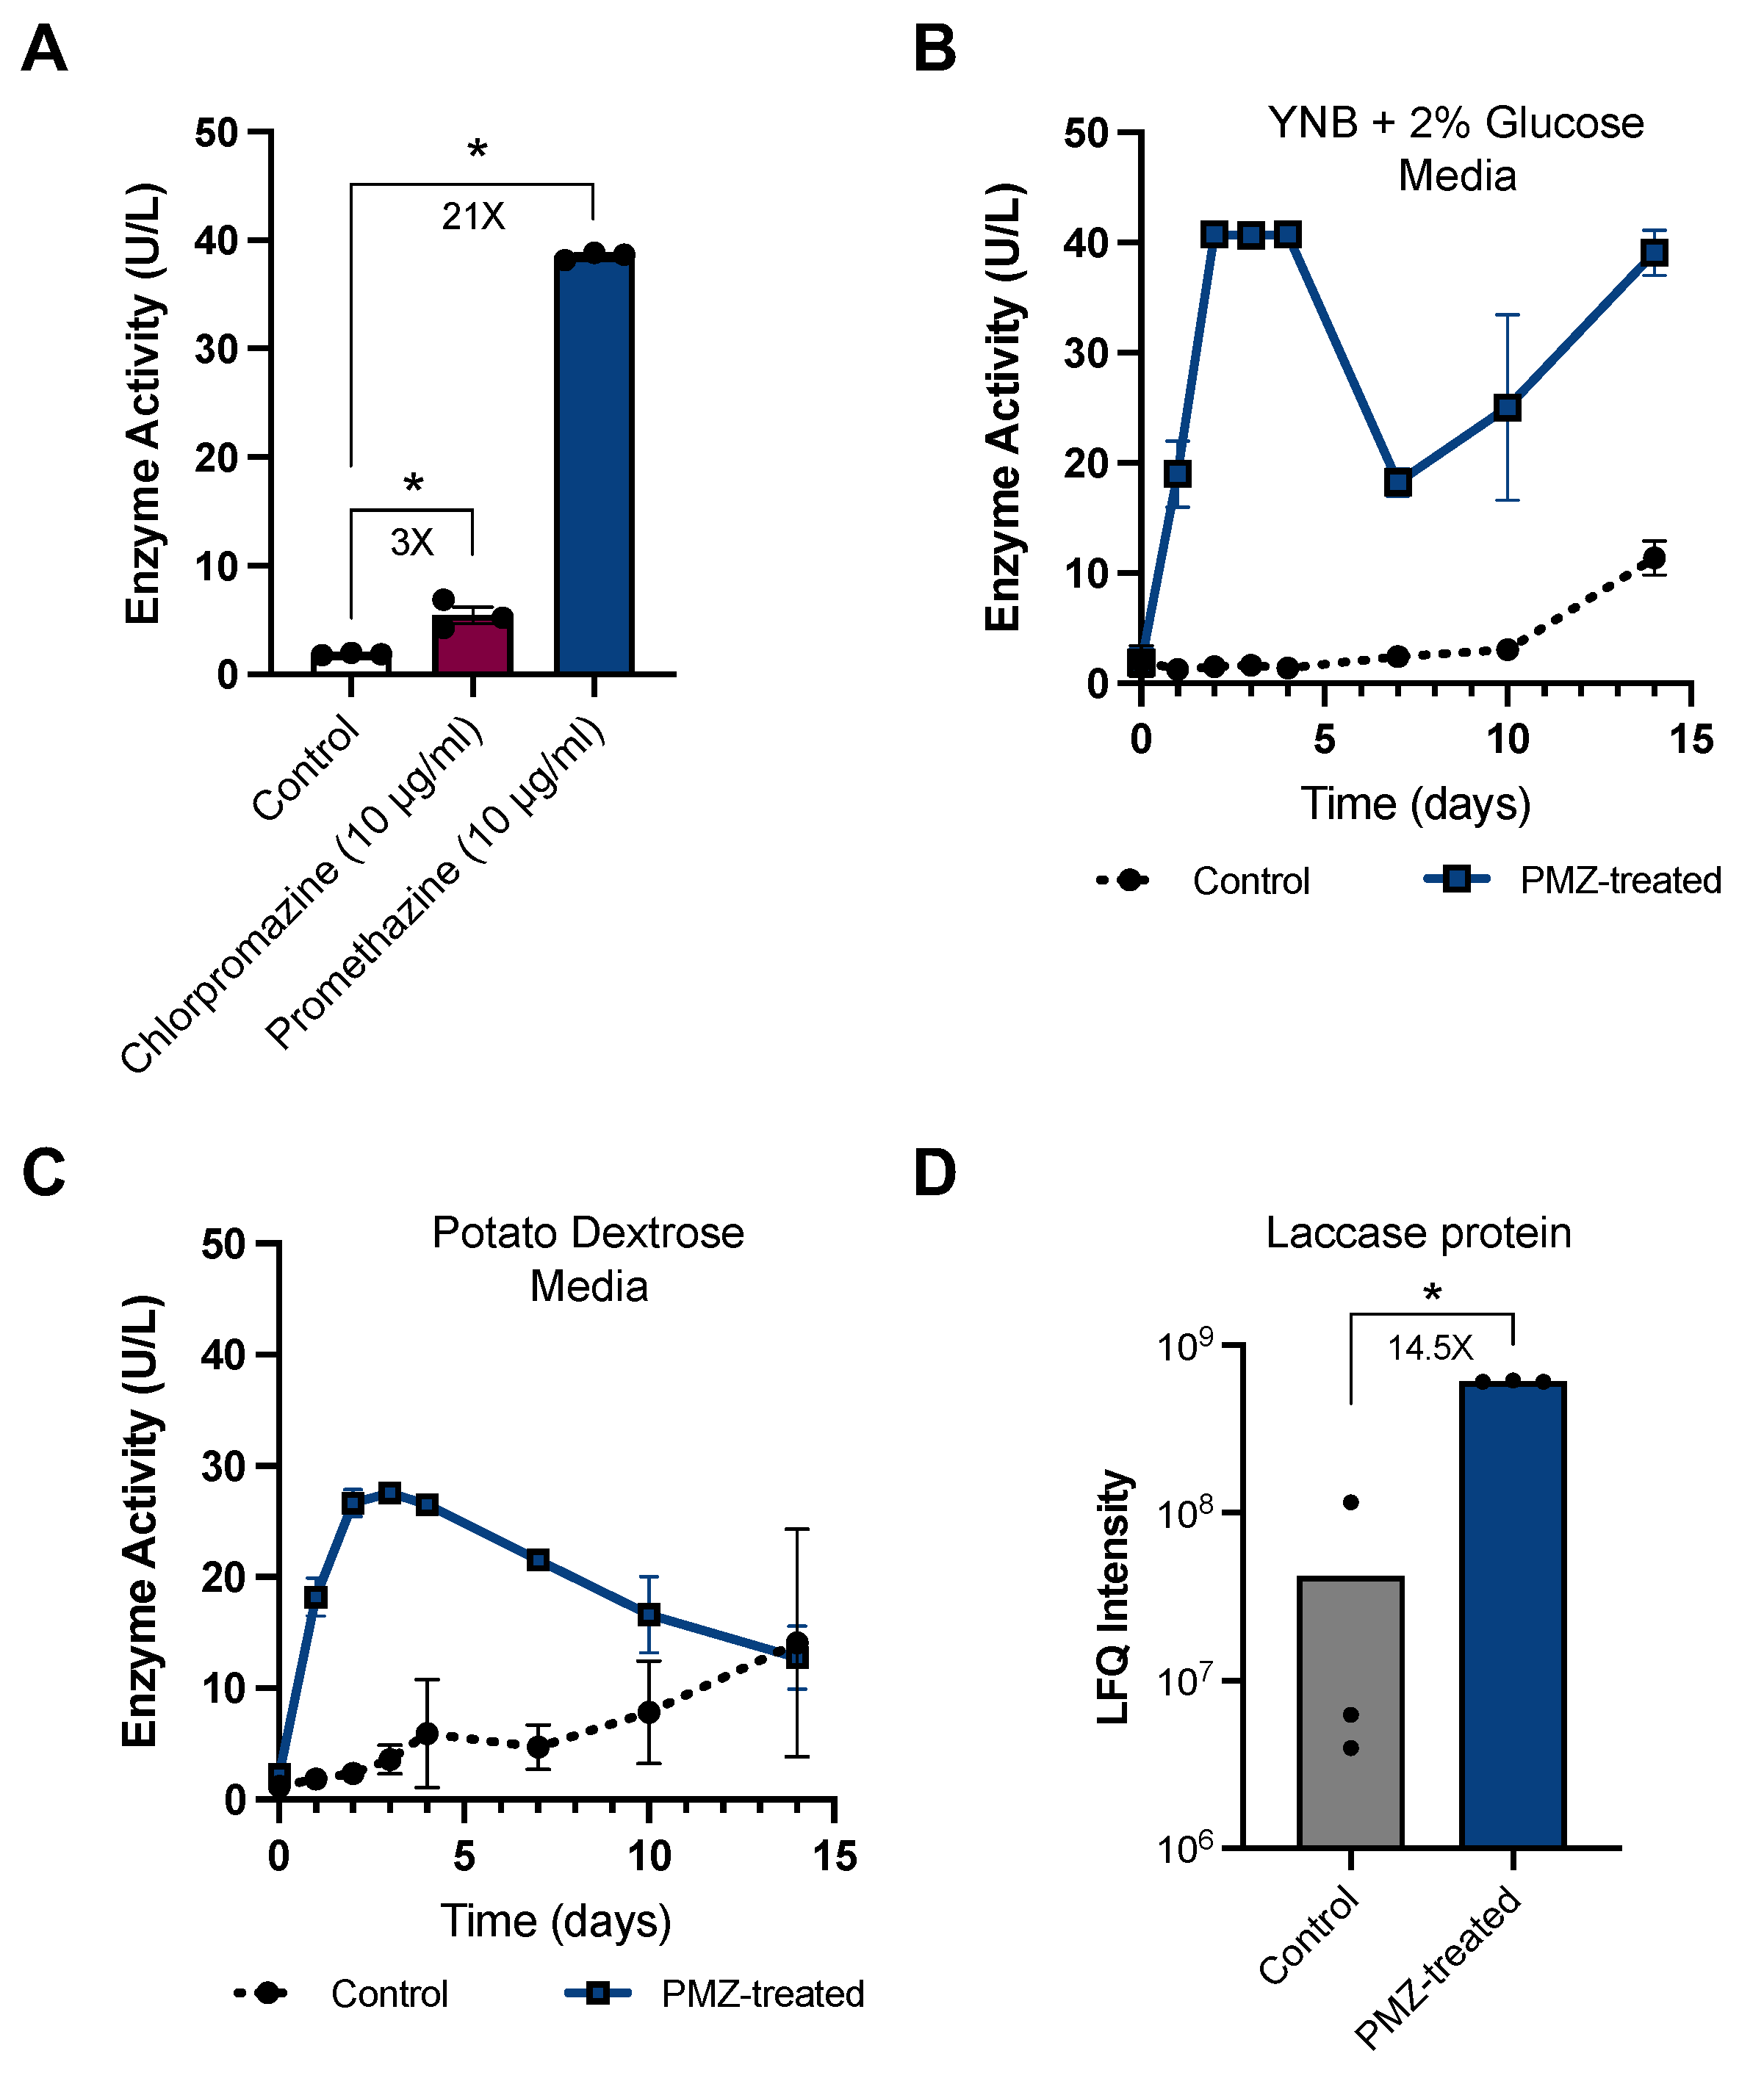
3.2. Promethazine as a Rapid and Potent Inducer of Laccase Activity in P. radiata
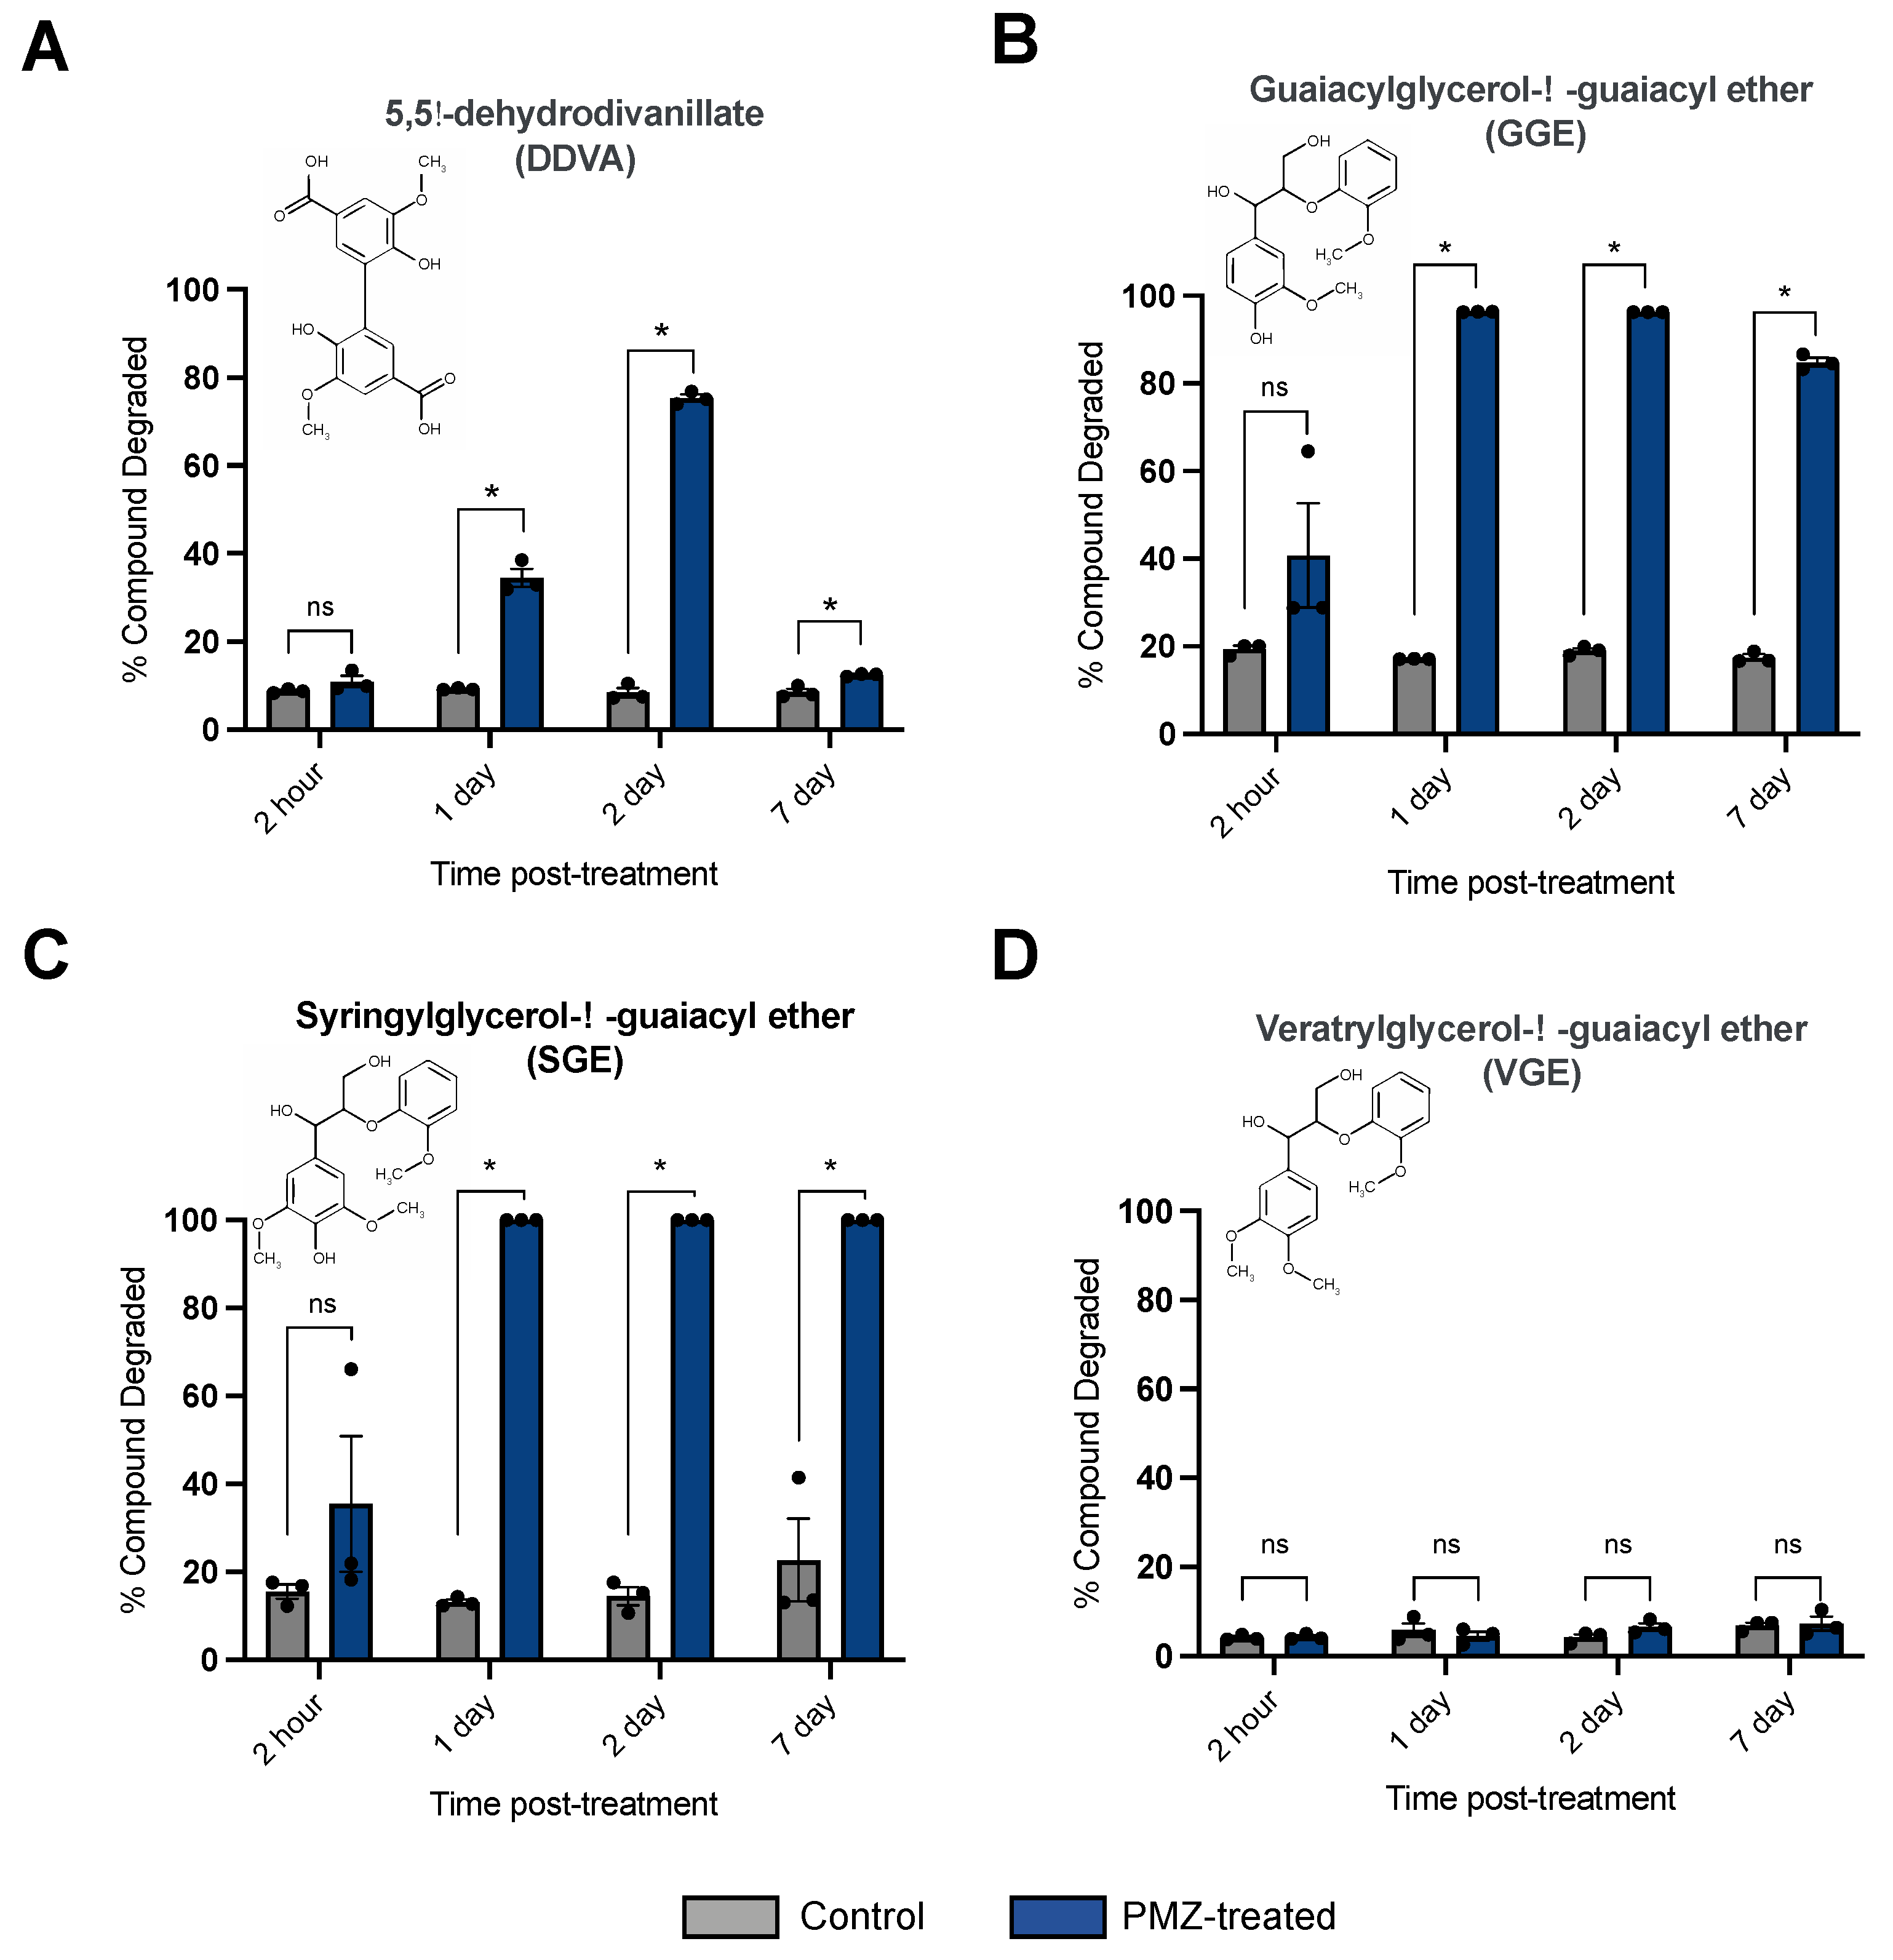
3.3. Promethazine Treatment Enhances the Ability of P. radiata to Degrade Phenolic Model Lignin Compounds
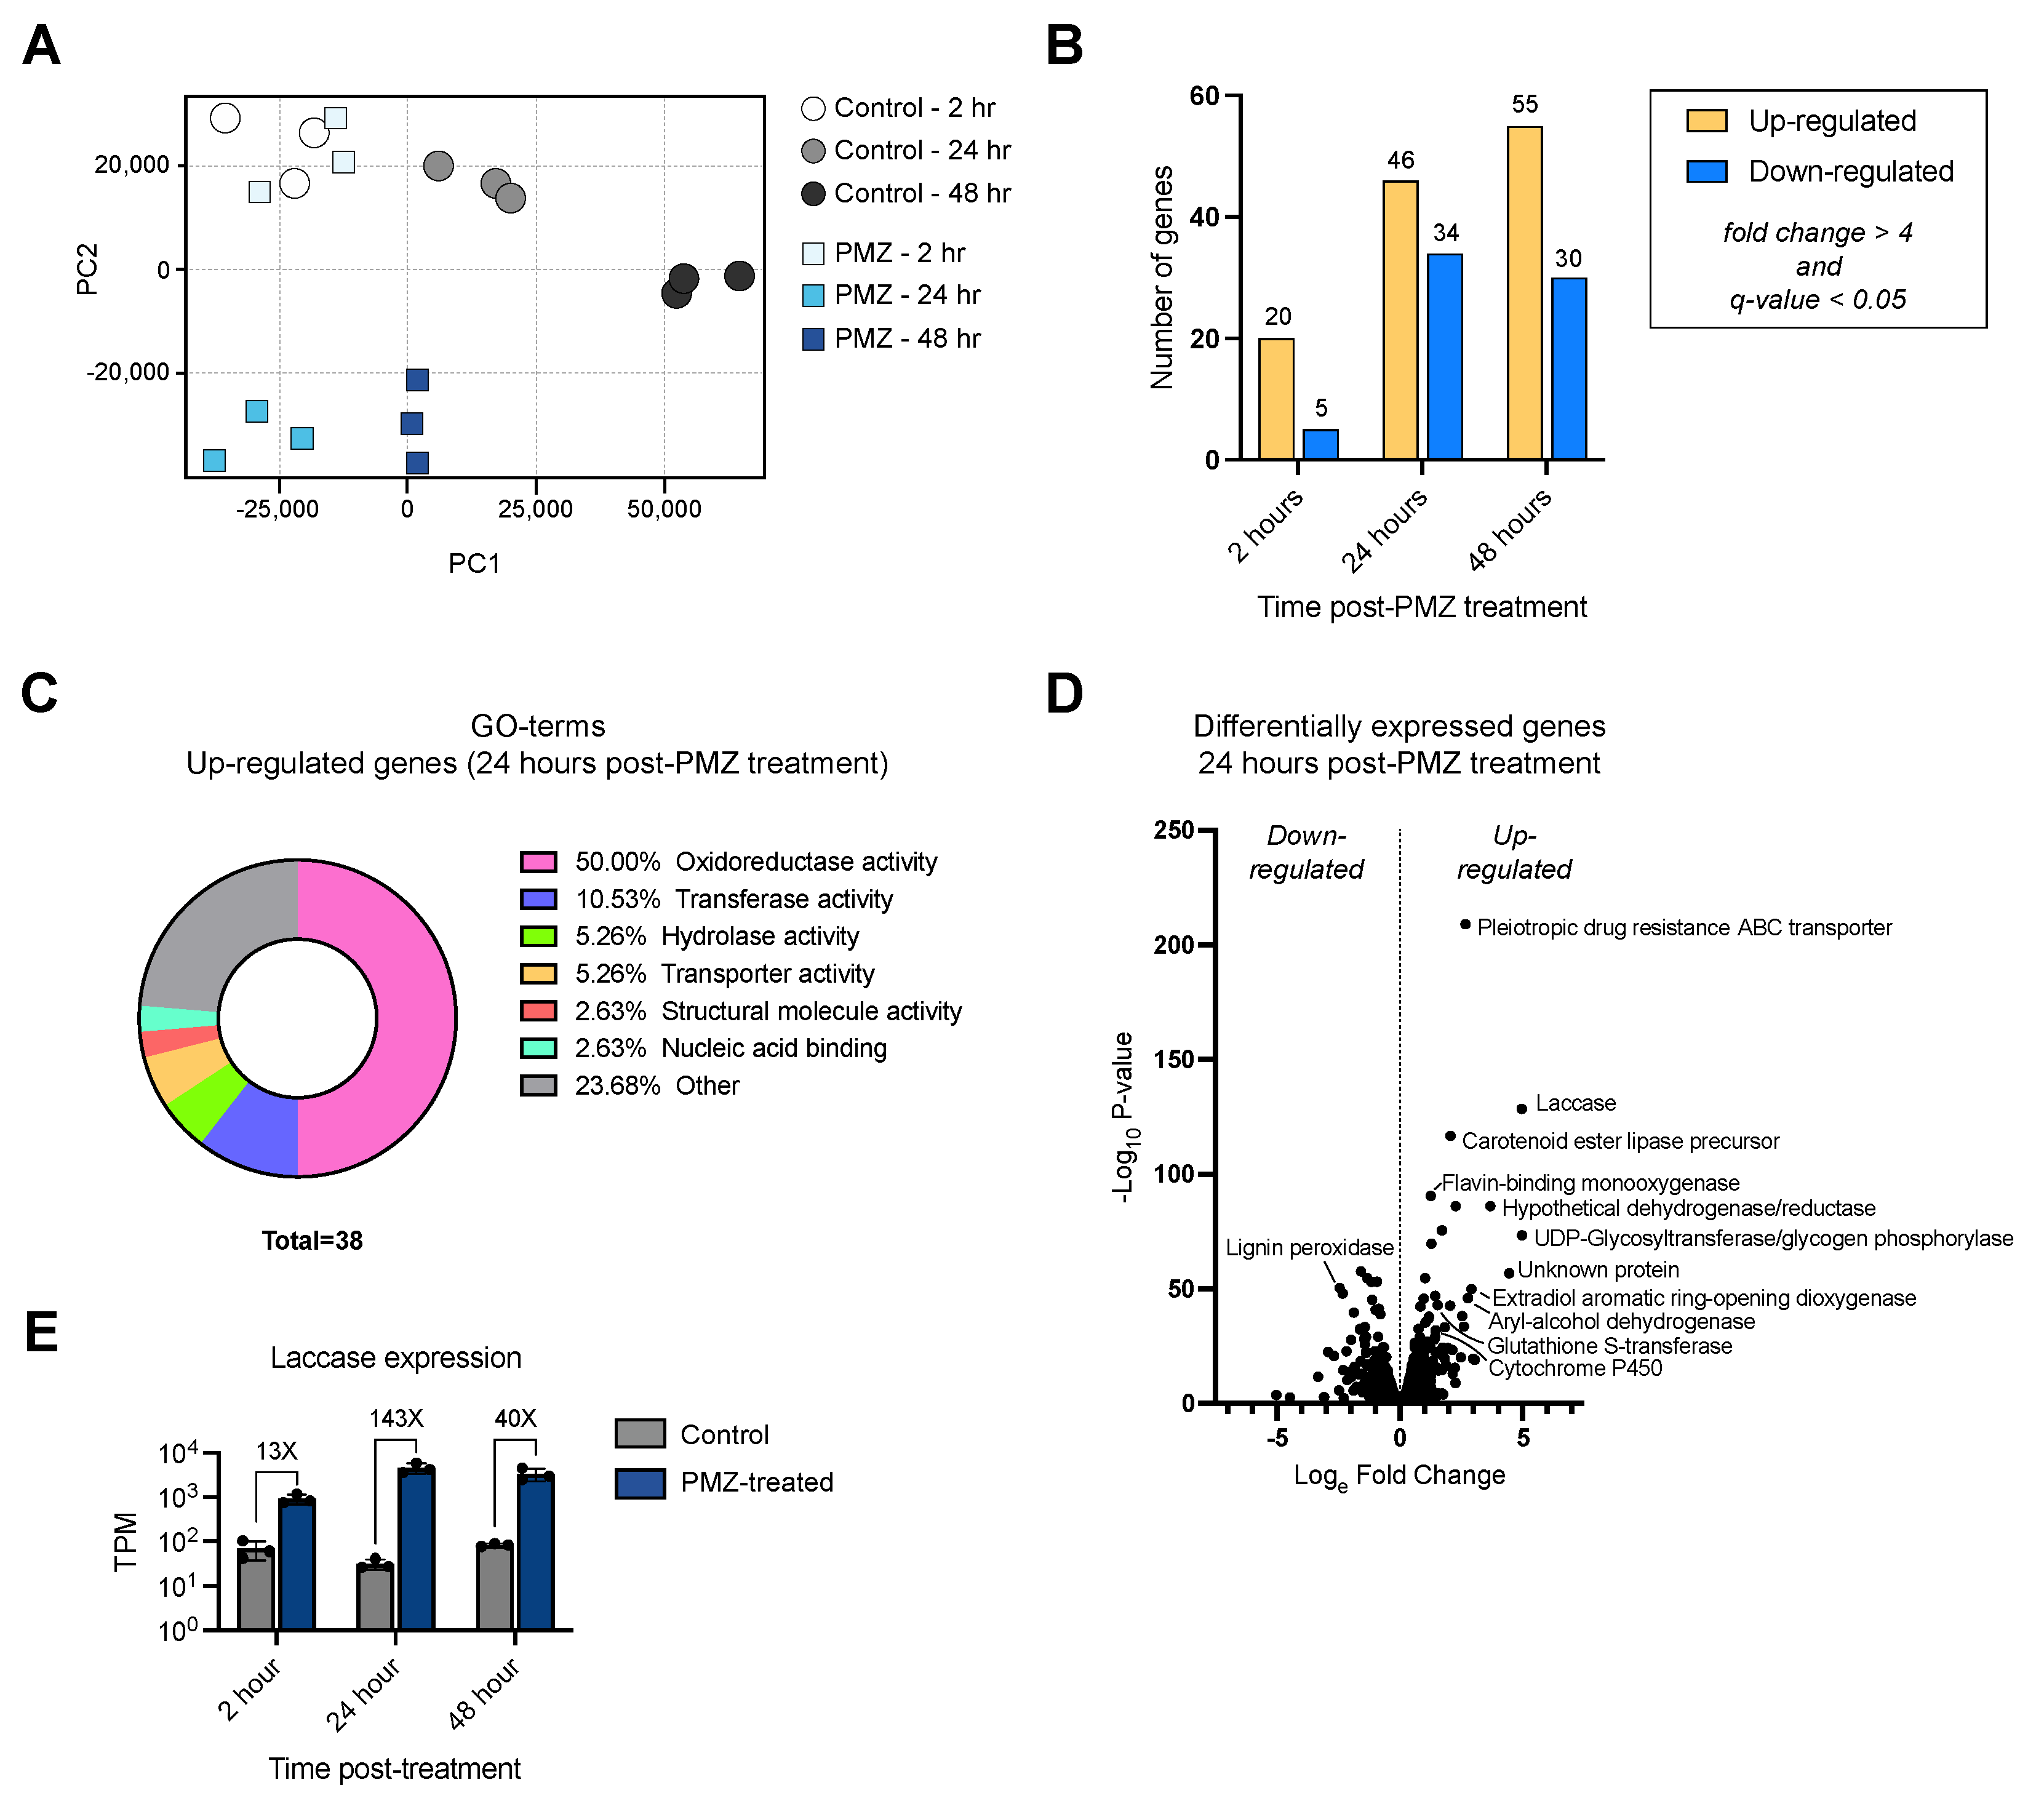
3.4. Transcriptomic Analysis of the P. radiata Response to Promethazine
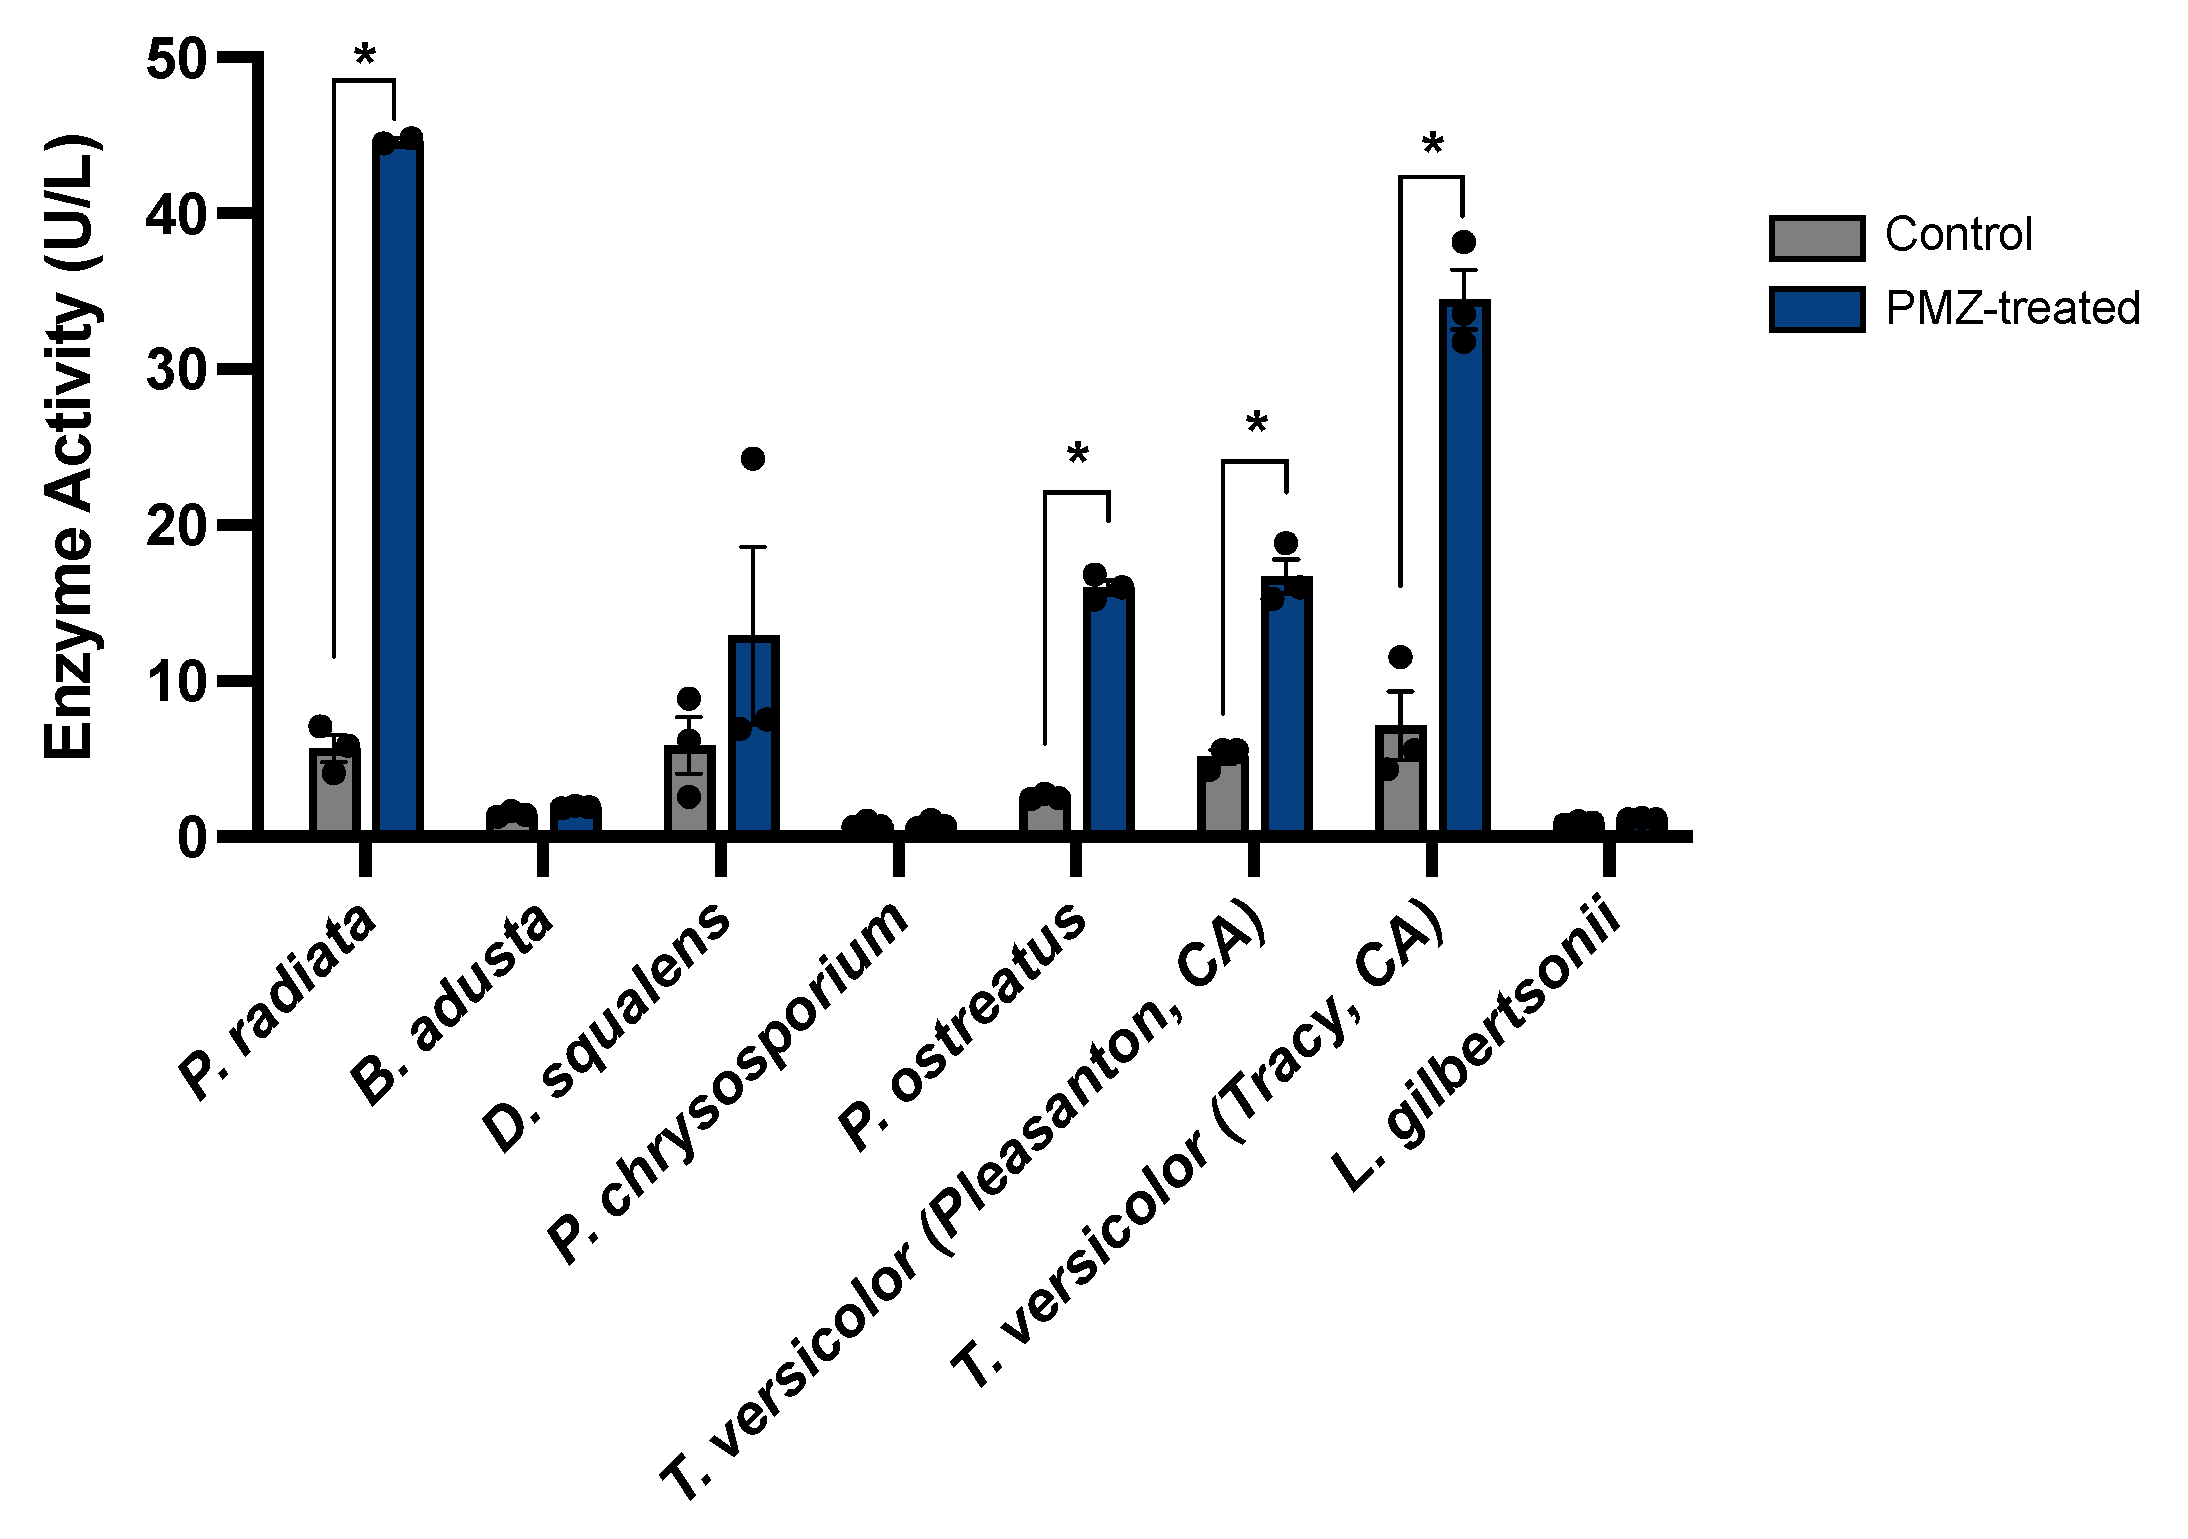
3.5. Promethazine Induction of Laccase Activity in Additional Wood-Degrading Fungi
4. Discussion
Supplementary Materials
Author Contributions
Funding
Institutional Review Board Statement
Informed Consent Statement
Data Availability Statement
Acknowledgments
Conflicts of Interest
References
- Manavalan, T.; Manavalan, A.; Heese, K. Characterization of lignocellulolytic enzymes from white-rot fungi. Curr. Microbiol. 2015, 70, 485–498. [Google Scholar] [CrossRef] [PubMed]
- Eriksson, K.E.L.; Blanchette, R.A.; Ander, P. Microbial and Enzymatic Degradation of Wood and Wood Components; Springer: Berlin/Heidelberg, Germany, 1990. [Google Scholar]
- Kirk, T.K.; Farrell, R.L. Enzymatic “combustion”: The microbial degradation of lignin. Annu. Rev. Microbiol. 1987, 41, 465–501. [Google Scholar] [CrossRef]
- Wong, D.W. Structure and action mechanism of ligninolytic enzymes. Appl. Biochem. Biotechnol. 2009, 157, 174–209. [Google Scholar] [CrossRef]
- Janusz, G.; Pawlik, A.; Sulej, J.; Świderska-Burek, U.; Jarosz-Wilkołazka, A.; Paszczyński, A. Lignin degradation: Microorganisms, enzymes involved, genomes analysis and evolution. FEMS Microbiol. Rev. 2017, 41, 941–962. [Google Scholar] [CrossRef] [Green Version]
- Cui, L.; Wang, Z.; Zeng, Y.; Yang, N.; Liu, M.; Zhao, Y.; Zheng, Y. Lignin Biodegradation and Its Valorization. Fermentation 2022, 8, 366. [Google Scholar] [CrossRef]
- Del Cerro, C.; Erickson, E.; Dong, T.; Wong, A.R.; Eder, E.K.; Purvine, S.O.; Mitchell, H.D.; Weitz, K.K. Intracellular pathways for lignin catabolism in white-rot fungi. Proc. Natl. Acad. Sci. USA 2021, 118, e2017381118. [Google Scholar] [CrossRef] [PubMed]
- Singh, A.K.; Bilal, M.; Iqbal, H.M.; Meyer, A.S.; Raj, A. Bioremediation of lignin derivatives and phenolics in wastewater with lignin modifying enzymes: Status, opportunities and challenges. Sci. Total. Environ. 2021, 777, 145988. [Google Scholar] [CrossRef]
- Kijpornyongpan, T.; Schwartz, A.; Yaguchi, A.; Salvachua, D. Systems biology-guided understanding of white-rot fungi for biotechnological applications: A review. iScience 2022, 25, 104640. [Google Scholar] [CrossRef]
- Gao, D.; Du, L.; Yang, J.; Wu, W.; Liang, H. A critical review of the application of white rot fungus to environmental pollution control. Crit. Rev. Biotechnol. 2010, 30, 70–77. [Google Scholar] [CrossRef] [PubMed]
- Furukawa, T.; Bello, F.O.; Horsfall, L. Microbial enzyme systems for lignin degradation and their transcriptional regulation. Front. Biol. 2014, 9, 448–471. [Google Scholar] [CrossRef]
- Martinez, D.; Larrondo, L.; Putnam, N.; Gelpke, M.D.S.; Huang, K.; Chapman, J.; Helfenbein, K.G.; Ramaiya, P.; Detter, J.C.; Larimer, F.W.; et al. Genome sequence of the lignocellulose degrading fungus Phanerochaete chrysosporium strain RP78. Nat. Biotechnol. 2004, 22, 695–700. [Google Scholar] [CrossRef]
- Jeffries, T.W.; Choi, S.; Kirk, T.K. Nutritional Regulation of Lignin Degradation by Phanerochaete chrysosporium. Appl. Environ. Microbiol. 1981, 42, 290–296. [Google Scholar] [CrossRef] [PubMed] [Green Version]
- Vanden Wymelenberg, A.; Gaskell, J.; Mozuch, M.; Kersten, P.; Sabat, G.; Martinez, D.; Cullen, D. Transcriptome and secretome analyses of Phanerochaete chrysosporium reveal complex patterns of gene expression. Appl. Environ. Microbiol. 2009, 75, 4058–4068. [Google Scholar] [CrossRef] [Green Version]
- Belinky, P.A.; Flikshtein, N.; Lechenko, S.; Gepstein, S.; Dosoretz, C.G. Reactive oxygen species and induction of lignin peroxidase in Phanerochaete chrysosporium. Appl. Environ. Microbiol. 2003, 69, 6500–6506. [Google Scholar] [CrossRef] [Green Version]
- Vanden Wymelenberg, A.; Gaskell, J.; Mozuch, M.; Sabat, G.; Ralph, J.; Skyba, O.; Mansfield, S.D.; Blanchette, R.A.; Martinez, D. Comparative transcriptome and secretome analysis of wood decay fungi Postia placenta and Phanerochaete chrysosporium. Appl. Environ. Microbiol. 2010, 76, 3599–3610. [Google Scholar] [CrossRef] [Green Version]
- Fernández-Fueyo, E.; Castanera, R.; Ruiz-Dueñas, F.J.; López-Lucendo, M.F.; Ramírez, L.; Pisabarro, A.G.; Martínez, A.T. Ligninolytic peroxidase gene expression by Pleurotus ostreatus: Differential regulation in lignocellulose medium and effect of temperature and pH. Fungal Genet. Biol. 2014, 72, 150–161. [Google Scholar] [CrossRef] [Green Version]
- Mehra, R.; Muschiol, J.; Meyer, A.S.; Kepp, K.P. A structural-chemical explanation of fungal laccase activity. Sci. Rep. 2018, 8, 17285. [Google Scholar] [CrossRef] [Green Version]
- Mate, D.M.; Alcalde, M. Laccase: A multi-purpose biocatalyst at the forefront of biotechnology. Microb. Biotechnol. 2017, 10, 1457–1467. [Google Scholar] [CrossRef] [PubMed] [Green Version]
- Leynaud Kieffer Curran, L.M.C.; Pham, L.T.M.; Sale, K.L.; Simmons, B.A. Review of advances in the development of laccases for the valorization of lignin to enable the production of lignocellulosic biofuels and bioproducts. Biotechnol. Adv. 2022, 54, 107809. [Google Scholar] [CrossRef] [PubMed]
- Arregui, L.; Ayala, M.; Gómez-Gil, X.; Gutiérrez-Soto, G.; Hernández-Luna, C.E.; de los Santos, M.H.; Levin, L.; Rojo-Domínguez, A.; Romero-Martínez, D.; Saparrat, M.C.; et al. Laccases: Structure, function, and potential application in water bioremediation. Microb. Cell Factories 2019, 18, 200. [Google Scholar] [CrossRef] [Green Version]
- Janusz, G.; Pawlik, A.; Swiderska-Burek, U.; Polak, J.; Sulej, J.; Jarosz-Wilkolazka, A.; Paszczyński, A. Laccase Properties, Physiological Functions, and Evolution. Int. J. Mol. Sci. 2020, 21, 966. [Google Scholar] [CrossRef] [Green Version]
- Pham, L.T.M.; Deng, K.; Northen, T.; Singer, S.; Adams, P.; Simmons, B.; Sale, K. Heterologous Expression, Characterization, and Comparison of Laccases from the White Rot Causing Basidiomycete Cerrena Unicolor. Catal. Res. 2022, 2, 1–33. [Google Scholar] [CrossRef]
- Kowalczyk, J.E.; Peng, M.; Pawlowski, M.; Lipzen, A.; Ng, V.; Singan, V.; Wang, M.; Grigoriev, I.V.; Mäkelä, M.R. The White-Rot Basidiomycete Dichomitus squalens Shows Highly Specific Transcriptional Response to Lignocellulose-Related Aromatic Compounds. Front. Bioeng. Biotechnol. 2019, 7, 229. [Google Scholar] [CrossRef] [PubMed]
- Jiao, X.; Li, G.; Wang, Y.; Nie, F.; Cheng, X.; Abdullah, M.; Lin, Y.; Cai, Y. Systematic Analysis of the Pleurotus ostreatus Laccase Gene (PoLac) Family and Functional Characterization of PoLac2 Involved in the Degradation of Cotton-Straw Lignin. Molecules 2018, 23, 880. [Google Scholar] [CrossRef] [PubMed] [Green Version]
- Arora, D.S.; Rampal, P. Laccase production by some Phlebia species. J. Basic Microbiol. 2002, 42, 295–301. [Google Scholar] [CrossRef] [PubMed]
- Pinheiro, V.E.; Michelin, M.; Vici, A.C.; de Almeida, P.Z.; Teixeira de Moraes Polizeli, M.L. Trametes versicolor laccase production using agricultural wastes: A comparative study in Erlenmeyer flasks, bioreactor and tray. Bioprocess Biosyst. Eng. 2020, 43, 507–514. [Google Scholar] [CrossRef]
- Chmelova, D.; Legerska, B.; Kunstova, J.; Ondrejovic, M.; Miertus, S. The production of laccases by white-rot fungi under solid-state fermentation conditions. World J. Microbiol. Biotechnol. 2022, 38, 21. [Google Scholar] [CrossRef] [PubMed]
- Bollag, J.M.; Leonowicz, A. Comparative studies of extracellular fungal laccases. Appl. Environ. Microbiol. 1984, 48, 849–854. [Google Scholar] [CrossRef] [Green Version]
- Piscitelli, A.; Giardina, P.; Lettera, V.; Pezzella, C.; Sannia, G.; Faraco, V. Induction and transcriptional regulation of laccases in fungi. Curr. Genom. 2011, 12, 104–112. [Google Scholar] [CrossRef] [Green Version]
- Yang, J.; Wang, G.; Ng, T.B.; Lin, J.; Ye, X. Laccase Production and Differential Transcription of Laccase Genes in Cerrena sp. in Response to Metal Ions, Aromatic Compounds, and Nutrients. Front. Microbiol. 2015, 6, 1558. [Google Scholar] [CrossRef]
- Pawlik, A.; Ciołek, B.; Sulej, J.; Mazur, A.; Grela, P.; Staszczak, M.; Niścior, M.; Jaszek, M.; Matuszewska, A.; Janusz, G.; et al. Cerrena unicolor Laccases, Genes Expression and Regulation of Activity. Biomolecules 2021, 11, 468. [Google Scholar] [CrossRef]
- Van Aken, B.; Hofrichter, M.; Scheibner, K.; Hatakka, A.I.; Naveau, H.; Agathos, S.N. Transformation and mineralization of 2,4,6-trinitrotoluene (TNT) by manganese peroxidase from the white-rot basidiomycete Phlebia radiata. Biodegradation 1999, 10, 83–91. [Google Scholar] [CrossRef] [PubMed]
- Hofrichter, M.; Lundell, T.; Hatakka, A. Conversion of milled pine wood by manganese peroxidase from Phlebia radiata. Appl. Environ. Microbiol. 2001, 67, 4588–4593. [Google Scholar] [CrossRef] [PubMed] [Green Version]
- Mäkinen, M.; Kuuskeri, J.; Laine, P.; Smolander, O.-P.; Kovalchuk, A.; Zeng, Z.; Asiegbu, F.O.; Paulin, L.; Auvinen, P.; Lundell, T. Genome description of Phlebia radiata 79 with comparative genomics analysis on lignocellulose decomposition machinery of phlebioid fungi. BMC Genom. 2019, 20, 430. [Google Scholar] [CrossRef] [Green Version]
- Makela, M.R.; Lundell, T.; Hatakka, A.; Hilden, K. Effect of copper, nutrient nitrogen, and wood-supplement on the production of lignin-modifying enzymes by the white-rot fungus Phlebia radiata. Fungal Biol. 2013, 117, 62–70. [Google Scholar] [CrossRef]
- Kuuskeri, J.; Hakkinen, M.; Laine, P.; Smolander, O.P.; Tamene, F.; Miettinen, S.; Nousiainen, P.; Kemmel, M. Time-scale dynamics of proteome and transcriptome of the white-rot fungus Phlebia radiata: Growth on spruce wood and decay effect on lignocellulose. Biotechnol. Biofuels 2016, 9, 192. [Google Scholar] [CrossRef] [PubMed] [Green Version]
- Kantelinen, A.; Hatakka, A.; Viikari, L. Production of lignin peroxidase and laccase by Phlebia radiata. Appl. Microbiol. Biotechnol. 1989, 31, 234–239. [Google Scholar] [CrossRef]
- Niku-Paavola, M.; Karhunen, E.; Kantelinen, A.; Viikari, L.; Lundell, T.; Hatakka, A. The effect of culture conditions on the production of lignin modifying enzymes by the white-rot fungus Phlebia radiata. J. Biotechnol. 1990, 13, 211–221. [Google Scholar] [CrossRef]
- Rogalski, J.; Cho, N.S.; Zadora, J.; Prendecka, M.; Choma, A.; Urbanik-Sypniewska, T.; Leonowicz, A. Influence of aromatic compounds on biodegradation of [14C]-labeled xylan and mannan by the white-rot fungus Phlebia radiata. J. Ind. Microbiol. Biotechnol. 2002, 28, 168–172. [Google Scholar] [CrossRef]
- Martin, K.J.; Rygiewicz, P.T. Fungal-specific PCR primers developed for analysis of the ITS region of environmental DNA extracts. BMC Microbiol. 2005, 5, 28. [Google Scholar] [CrossRef] [Green Version]
- Blumenstein, K.; Macaya-Sanz, D.; Martin, J.A.; Albrectsen, B.R.; Witzell, J. Phenotype MicroArrays as a complementary tool to next generation sequencing for characterization of tree endophytes. Front. Microbiol. 2015, 6, 1033. [Google Scholar] [CrossRef]
- Kameshwar, A.K.S.; Qin, W. Qualitative and Quantitative Methods for Isolation and Characterization of Lignin-Modifying Enzymes Secreted by Microorganisms. BioEnergy Res. 2016, 10, 248–266. [Google Scholar] [CrossRef]
- Agrawal, K.; Verma, P. Laccase: Addressing the ambivalence associated with the calculation of enzyme activity. 3 Biotech 2019, 9, 365. [Google Scholar] [CrossRef]
- Rodriguez, A.; Ersig, N.; Geiselman, G.M.; Seibel, K.; Simmons, B.A.; Magnuson, J.K.; Eudes, A.; Gladden, J.M. Conversion of depolymerized sugars and aromatics from engineered feedstocks by two oleaginous red yeasts. Bioresour. Technol. 2019, 286, 121365. [Google Scholar] [CrossRef]
- Chen, S.; Zhou, Y.; Chen, Y.; Gu, J. fastp: An ultra-fast all-in-one FASTQ preprocessor. Bioinformatics 2018, 34, i884–i890. [Google Scholar] [CrossRef] [PubMed]
- Bray, N.L.; Pimentel, H.; Melsted, P.; Pachter, L. Near-optimal probabilistic RNA-seq quantification. Nat. Biotechnol. 2016, 34, 525–527. [Google Scholar] [CrossRef]
- Grigoriev, I.V.; Nikitin, R.; Haridas, S.; Kuo, A.; Ohm, R.; Otillar, R.; Riley, R.; Salamov, A. MycoCosm portal: Gearing up for 1000 fungal genomes. Nucleic Acids Res. 2014, 42, D699–D704. [Google Scholar] [CrossRef]
- Pimentel, H.; Bray, N.L.; Puente, S.; Melsted, P.; Pachter, L. Differential analysis of RNA-seq incorporating quantification uncertainty. Nat. Methods 2017, 14, 687–690. [Google Scholar] [CrossRef] [PubMed]
- Götz, S.; Garcia-Gomez, J.M.; Terol, J.; Williams, T.D.; Nagaraj, S.H.; Nueda, M.J.; Robles, M.; Talón, M.; Dopazo, J.; Conesa, A. High-throughput functional annotation and data mining with the Blast2GO suite. Nucleic Acids Res. 2008, 36, 3420–3435. [Google Scholar] [CrossRef]
- Lundell, T.; Leonowicz, A.; Rogalski, J.; Hatakka, A. Formation and Action of Lignin-Modifying Enzymes in Cultures of Phlebia radiata Supplemented with Veratric Acid. Appl. Environ. Microbiol. 1990, 56, 2623–2629. [Google Scholar] [CrossRef] [PubMed] [Green Version]
- Jaszczyszyn, A.; Gąsiorowski, K.; Świątek, P.; Malinka, W.; Cieślik-Boczula, K.; Petrus, J.; Czarnik-Matusewicz, B. Chemical structure of phenothiazines and their biological activity. Pharmacol. Rep. 2012, 64, 16–23. [Google Scholar] [CrossRef]
- Sudeshna, G.; Parimal, K. Multiple non-psychiatric effects of phenothiazines: A review. Eur. J. Pharmacol. 2010, 648, 6–14. [Google Scholar] [CrossRef]
- Amaral, L.; Viveiros, M.; Molnar, J. Antimicrobial activity of phenothiazines. In Vivo 2004, 18, 725–731. [Google Scholar] [PubMed]
- Zhang, Q.; Liu, F.; Zeng, M.; Mao, Y.; Song, Z. Drug repurposing strategies in the development of potential antifungal agents. Appl. Microbiol. Biotechnol. 2021, 105, 5259–5279. [Google Scholar] [CrossRef] [PubMed]
- Montoya, M.C.; DiDone, L.; Heier, R.F.; Meyers, M.J.; Krysan, D.J. Antifungal Phenothiazines: Optimization, Characterization of Mechanism, and Modulation of Neuroreceptor Activity. ACS Infect. Dis. 2018, 4, 499–507. [Google Scholar] [CrossRef]
- Kolaczkowski, M.; Michalak, K.; Motohashi, N. Phenothiazines as potent modulators of yeast multidrug resistance. Int. J. Antimicrob. Agents 2003, 22, 279–283. [Google Scholar] [CrossRef]
- Dastidar, S.G.; Kristiansen, J.E.; Molnar, J.; Amaral, L. Role of Phenothiazines and Structurally Similar Compounds of Plant Origin in the Fight against Infections by Drug Resistant Bacteria. Antibiotics 2013, 2, 58–72. [Google Scholar] [CrossRef] [PubMed] [Green Version]
- da Silva, A.R.; de Andrade Neto, J.B.; da Silva, C.R.; Campos Rde, S.; Costa Silva, R.A.; Freitas, D.D.; Bruna Stefany Aires do Nascimento, F. Berberine Antifungal Activity in Fluconazole-Resistant Pathogenic Yeasts: Action Mechanism Evaluated by Flow Cytometry and Biofilm Growth Inhibition in Candida spp. Antimicrob. Agents Chemother. 2016, 60, 3551–3557. [Google Scholar] [CrossRef] [Green Version]
- Zorić, N.; Kosalec, I.; Tomić, S.; Bobnjarić, I.; Jug, M.; Vlainić, T.; Vlainić, J. Membrane of Candida albicans as a target of berberine. BMC Complement. Altern. Med. 2017, 17, 268. [Google Scholar] [CrossRef] [Green Version]
- Scorzoni, L.; de Paula, E.S.A.C.; Marcos, C.M.; Assato, P.A.; de Melo, W.C.; de Oliveira, H.C.; Costa-Orlandi, C.B. Antifungal Therapy: New Advances in the Understanding and Treatment of Mycosis. Front. Microbiol. 2017, 8, 36. [Google Scholar] [CrossRef] [PubMed] [Green Version]
- Wang, L.; Luo, X.; Pan, Y.; Zheng, Z.; Yin, R.; Tian, X.; Zhang, L. Mechanism of Laccase Induction via Emodin in Trametes versicolor. Front. Bioeng. Biotechnol. 2021, 9, 653800. [Google Scholar] [CrossRef] [PubMed]
- Munk, L.; Sitarz, A.K.; Kalyani, D.C.; Mikkelsen, J.D.; Meyer, A.S. Can laccases catalyze bond cleavage in lignin? Biotechnol. Adv. 2015, 33, 13–24. [Google Scholar] [CrossRef] [PubMed]


Disclaimer/Publisher’s Note: The statements, opinions and data contained in all publications are solely those of the individual author(s) and contributor(s) and not of MDPI and/or the editor(s). MDPI and/or the editor(s) disclaim responsibility for any injury to people or property resulting from any ideas, methods, instructions or products referred to in the content. |
© 2023 by the authors. Licensee MDPI, Basel, Switzerland. This article is an open access article distributed under the terms and conditions of the Creative Commons Attribution (CC BY) license (https://creativecommons.org/licenses/by/4.0/).
Share and Cite
Hirakawa, M.P.; Rodriguez, A.; Tran-Gyamfi, M.B.; Light, Y.K.; Martinez, S.; Diamond-Pott, H.; Simmons, B.A.; Sale, K.L. Phenothiazines Rapidly Induce Laccase Expression and Lignin-Degrading Properties in the White-Rot Fungus Phlebia radiata. J. Fungi 2023, 9, 371. https://doi.org/10.3390/jof9030371
Hirakawa MP, Rodriguez A, Tran-Gyamfi MB, Light YK, Martinez S, Diamond-Pott H, Simmons BA, Sale KL. Phenothiazines Rapidly Induce Laccase Expression and Lignin-Degrading Properties in the White-Rot Fungus Phlebia radiata. Journal of Fungi. 2023; 9(3):371. https://doi.org/10.3390/jof9030371
Chicago/Turabian StyleHirakawa, Matthew P., Alberto Rodriguez, Mary B. Tran-Gyamfi, Yooli K. Light, Salvador Martinez, Henry Diamond-Pott, Blake A. Simmons, and Kenneth L. Sale. 2023. "Phenothiazines Rapidly Induce Laccase Expression and Lignin-Degrading Properties in the White-Rot Fungus Phlebia radiata" Journal of Fungi 9, no. 3: 371. https://doi.org/10.3390/jof9030371