Article

Trichoderma pubescens Elicit Induced Systemic Resistance in Tomato Challenged by Rhizoctonia solani

1
Agricultural Botany Department, Faculty of Agriculture (Saba Basha), Alexandria University, Alexandria 21531, Egypt
2
Plant Protection and Biomolecular Diagnosis Department, ALCRI, City of Scientific Research and Technological Applications, New Borg El Arab City 21934, Egypt
3
Plant Protection Department, Faculty of Agriculture (Saba Basha), Alexandria University, Alexandria 21531, Egypt
*
Authors to whom correspondence should be addressed.
J. Fungi 2023, 9(2), 167; https://doi.org/10.3390/jof9020167
Submission received: 26 December 2022 / Revised: 16 January 2023 / Accepted: 25 January 2023 / Published: 27 January 2023

Abstract

:
Rhizoctonia solani causes severe diseases in many plant species, particularly root rot in tomato plants. For the first time, Trichoderma pubescens effectively controls R. solani in vitro and in vivo. R. solani strain R11 was identified using the ITS region (OP456527); meanwhile, T. pubescens strain Tp21 was characterized by the ITS region (OP456528) and two genes (tef-1 and rpb2). The antagonistic dual culture method revealed that T. pubescens had a high activity of 76.93% in vitro. A substantial increase in root length, plant height, shoot fresh and dry, and root fresh and dry weight was indicated after applying T. pubescens to tomato plants in vivo. Additionally, it significantly increased the chlorophyll content and total phenolic compounds. The treatment with T. pubescens exhibited a low disease index (DI, 16.00%) without significant differences with Uniform® fungicide at a concentration of 1 ppm (14.67%), while the R. solani-infected plants showed a DI of 78.67%. At 15 days after inoculation, promising increases in the relative expression levels of three defense-related genes (PAL, CHS, and HQT) were observed in all T. pubescens treated plants compared with the non-treated plants. Plants treated with T. pubescens alone showed the highest expression value, with relative transcriptional levels of PAL, CHS, and HQT that were 2.72-, 4.44-, and 3.72-fold higher in comparison with control plants, respectively. The two treatments of T. pubescens exhibited increasing antioxidant enzyme production (POX, SOD, PPO, and CAT), while high MDA and H2O2 levels were observed in the infected plants. The HPLC results of the leaf extract showed a fluctuation in polyphenolic compound content. T. pubescens application alone or for treating plant pathogen infection showed elevated phenolic acids such as chlorogenic and coumaric acids. Therefore, the ability of T. pubescens to inhibit the growth of R. solani, enhance the development of tomato plants, and induce systemic resistance supports the application of T. pubescens as a potential bioagent for managing root rot disease and productivity increase of crops.

1. Introduction

Tomato (Lycopersicon esculentum L.) is ranked among vegetable crops as the 2nd most consumed globally, following potato [1]. It belongs to the Solanaceae family and contains tomatine and tryptophan, which are considered nutritive and vital compounds for human health. Among processed vegetables, tomato ranks first in area used for growing globally, followed by potato. Many phytopathogens attack tomato plants, which leads to serious diseases. The diseases of tomato plants can be caused by fungi, nematodes, bacteria, and viruses [2,3]. Soil-borne fungi such as Fusarium oxysporum, Rhizoctonia solani, Verticillium, and Pythium can cause root rot diseases in tomatoes [4]. Among these, R. solani is the main pathogenic fungus. R. solani is a harmful soil-borne pathogen that is responsible for substantial crop losses all over the world [5]. One of the most serious tomato diseases, R. solani- root rot and damping-off, is managed using fungicides. There are various symptoms of R. solani infection, which is responsible for seedling death in the cultivated area [6]. Circular patches on stem seedlings are the first symptom of the disease, followed by abrasions of seedlings at the soil surface [5,6]. The tomato root rot disease caused by R. solani pathogen mostly occurs during the seedling and mature plant stages, leading to about 60% yield loss [7].
The most widely used method of preventing these diseases is chemical control using fungicides; however, due to physiological pathogen races becoming more resistant to fungicides, there is a limit to the chemical’s application for this purpose against fungal pathogens [8,9,10]. There are also hazards to human health and the environment related to using chemicals [11]. Biological control agents can inhibit pathogen growth using specialized mechanisms such as parasitism, antibiosis, and competition for nutrients and space in the rhizosphere zone [12]. The use of beneficial microorganisms, such as biocontrol agents, is being promoted for their potential in sustainable agriculture. Trichoderma species have been used to control the phytopathogenic fungi, such as R. solani, Fusarium spp., Phytophthora palmivora, Botrytis cinerea, and Pythium spp., in tomato, rice, papaya, castor beans, tobacco, and bean crops [4,5,13,14]. The effect of Trichoderma species as biocontrol agents is due to their rapid growth and tolerance of adverse environmental conditions [15]. Trichoderma species have strong antagonistic and mycoparasitic effects on plant pathogens, which allow them to reduce the plant disease severity, while hyperparasitism is considered the most critical mechanism for Trichoderma [16,17]. Cell-wall-degrading-enzymes (CWDEs) such as chitinases, glucanases, and proteinases can be released by Trichoderma spp. during the hyperparasitic phase [18]. The plant pathogen cell wall can be weakened by the secreted CWDEs [19].
During the Trichoderma-plant interaction, various classes of metabolites, such as proteins with enzymatic activity, low molecular weight compounds related to the fungal or plant cell wall [20], and other secondary metabolites trigger plant defense mechanisms against pathogens [21], by activating the pathogenesis-related proteins that reduce the disease symptoms. A systemic acquired resistance mechanism (SAR) is activated when a plant comes into contact with a pathogen. However, when they interact with a non-pathogen organism, the plants activat an “induced systemic resistance” (ISR) mechanism [22]. Therefore, the current study aims to evaluate the effect of Trichoderma on the root rot of tomato caused by R. solani compared with fungicides under laboratory and greenhouse conditions. Additional effects of Trichoderma were evaluated on growth metrics, chlorophyll content, oxidative and antioxidant enzymes, phenolic and flavonoid content, and the expression levels of genes involved in defense.

2. Materials and Methods

2.1. Isolation and Identification of Pathogen and Bioagents

From different fields in the governorate of El-Behira, Egypt, tomato plants showing rot symptoms on roots were collected. From the collected samples, the fungal pathogen was isolated and characterized using cultural and morphological parameters, as well as ITS sequence [23]. Trichoderma-specific-medium (TSM, 0.2 g of MgSO4∙7H2O, 0.9 g of K2HPO4, 0.15 g of KCl, 1.0 g of NH4NO3, 3.0 g of glucose, 0.15 g of rose Bengal, 20 g of agar, 0.25 g of chloramphenicol, 0.3 g of p-dimethylaminobenzenediazo sodium sulfonate and 0.2 g of pentachloronitrobenzene/L of distilled water) was used for the isolation of Trichoderma from rhizospheric samples of soil collected from different fields. The technique of serial dilution was used to isolate the antagonistic Trichoderma spp. Dilution of 1 × 10⁻³ (1 mL) was poured onto Petri plates containing TSM as used by Elad et al. [24]. Using a hyphal tip technique, the acquired cultures of Rhizoctonia solani fungi were purified and kept on slants of potato dextrose agar (PDA, filtrate of boiled 200 g potato, 20 g dextrose, and 20 g agar; all the ingredients were mixed and made up to one litre of distilled water) for subsequent procedures.

2.2. Effect of Trichoderma Isolates on Growth of Rhizoctonia

A dual culture technique was used to evaluate the efficacy of Trichoderma isolates in inhibiting R. solani, as described by Fahmi et al. [25]. Seven-day-old cultures of Trichoderma isolates and R. solani (R4) were used in this test. PDA Petri plates were inoculated with a 5 mm disc of Trichoderma positioned diametrically opposite to the R. solani disc. After five days of incubation at 25 ± 2 °C, R. solani radial growth was recorded. Petri plates with an agar disc (5 mm) were used as the control instead of Trichoderma. These tests were conducted in triplicate for all treatments. From the recorded radial growth of R. solani (mm), the inhibition percentage was estimated as follows:
Inhibition   % = C T C × 100
where C = R. solani growth in control, T = R. solani growth in treatments.
After 4 days, a light microscope was used to investigate the mycoparasitic interaction zone between Trichoderma and R. solani on PDA.

2.3. Effect of Fungicides on R. solani In Vitro

Using a poisoned food technique [26], different fungicides were tested for their ability to prevent the growth of the R. solani isolate. Three fungicides were used: Uniform® (active ingredient: Azoxystrobin 28.2% (w/w) and Mefenoxam 10.8% (w/w), Syngenta, Wilmington, Delaware, USA), Rizolex® (active ingredient: Tolclofos-methyl 50 % (w/w) WP, Sumitomo Chemical Corp., Nihonbashi, Chuo-ku, Tokyo, Japan), and Hattrick® (active ingredient: Tebuconazole 6% FS, Shoura chemicals, Egypt). PDA media plates were incorporated with fungicides at a final concentration of 1 ppm. The mycelial disc of the R. solani (5 mm) from the 7-day-old culture was placed in the middle of the Petri plate and incubated at 25 °C. PDA without fungicide was used as a control. Three replicates were used for each treatment, and the experiment was arranged in a completely randomized design (CRD). The radial growth of R. solani was recorded after 7 days to calculate the inhibition percentage.

2.4. Identification of R. solani and Trichoderma Isolates

Based on morphological characteristics and molecular testing using the ITS, rpb2, and tef-1 genes, R. solani and Trichoderma isolates are identified [27,28,29]. Primer sequences used to identify R. solani and the most effective Trichoderma isolate are presented in Table 1. From isolated fungi, 0.5 g of fresh 5-day-old mycelium was taken by a sterile scalpel for DNA extraction. Using 1 mL of CTAB extraction buffer, the mycelium of fungi was crushed in a mortar and pestle before being heated at 65 °C for 30 min in a water bath. Chloroform/isoamyl alcohol was then mixed with the sample in equal volume and gently mixed for 30 min, then centrifuged for 10 min at 10,000 rpm. Chilled isopropanol (600 µL) was added to the obtained supernatant and kept for 2 h at 4 °C. To precipitate, the DNA samples were centrifuged for 10 min at 10,000 rpm. Ethanol (70%) was used to wash the collected pellet, then left for 4 h to get air dried to remove any remaining ethanol.
PCR reactions with DNA template (1 µL), 10 pmol of forward and reverse primer (0.5 µL of each), and 10 µL of 2× Taq-Ready-Mix (Enzynomics Inc., Daejeon, Republic of Korea), the reaction volume adjusted to 25 µL using Milli-Q water. A Techne Prime Thermal Cycler (Cole-Parmer, Staffordshire, UK) was used for the cycling, which was carried out as follows: a 95 °C for 4 min initial denaturation, then 35 cycles (94 °C for 45 s, 55 °C for 45 s, and 72 °C for 1 min) and 72 °C for 5 min as a final extension [5]. MEGA X software was used to align the nucleotide sequences after the PCR amplification product was sequenced. The acquired sequences were compared to the database in GenBank using the GenBank BLAST program.

2.5. Biocontrol Potential and Plant Growth-Promoting Abilities of Trichoderma Isolate against R. solani on Tomato Plants

The most effective Trichoderma isolate in inhibiting R. solani R4 under lab conditions was evaluated under greenhouse conditions (28 ± 2 °C temperature, humidity 80–90%, and day/night 12 h photoperoid) based on a pot experiment for their effect on R. solani R4 and plant growth. Sterile soil was used to fill plastic pots (20 cm) and pre-inoculated with R. solani; four weeks of tomato (var. Peto 86) seedlings were transplanted. Seedling roots were dipped for 2 h before transplanting in the inoculum of Trichoderma (1 × 10⁸ spores/mL) [24]. Pre-autoclaved wetted barley grains (500 g) were inoculated with 2 discs of R. solani fungus (5 mm in diameter) and incubated for 7 days at 25 ± 2 °C. After incubation, the fungus-grain inoculum was air-dried, blended to a powder form, and added to the pots 48 h before transplanting (10 g inoculum/kg) where the inoculum was initiated nearby to the root pan and crown of the plant. The fungicide was applied to the soil as final dose (0.16 mL/m2). Five replicates of each treatment were placed throughout the greenhouse experiment. The treatments were in five groups: G1, control tomato plants; G2, treatment with R. solani only; G3, plants treated with Trichoderma; G4, plants treated with Trichoderma and R. solani; G5, plants treated with R. solani and fungicide. Tomato leaf samples collected 15 days after transplanting from all treated plants in a greenhouse, defense-related genes, and total phenolic compounds in response to treatments were evaluated.
Tomato roots were screened for disease index 30 days after transplantation using a scale of 0–5, according to browning which appeared on the roots of tomato plants [5,35], where 0 = symptomless, 1 = 0–25% browning of the roots, 2 = 26–50% browning of roots, 3 = 51–75% roots browning, 4 = 76–100% browning of roots, 5 indicates the plant has completely died. After observing the tomato plants, the plant disease index (DI) was determined according to the following equation:
DI   % = of   all   numerical   ratings Maximum   rate   of   disease × number   of   all   screened   plants × 100
∑ of all numerical ratings means the sum of all disease ratings; the maximum rate of disease means the maximum disease grade, which in our study is five (the reference scale ranged from 0 to 5); and the number of all screened plants means the total number of ratings in each treatment. Additionally, the measurements of Trichoderma effects on the various growth metrics, including plant height and root length, fresh weight of shoot and root system, dry weight of shoot and root systems, as well as the total chlorophyll contents, were tested using SPAD 502 Plus Chlorophyll Meter (Spectrum Technologies Inc., Aurora, IL, USA).

2.6. Analysis of Defense-Related-Genes

2.6.1. Extraction of RNA and Synthesis of cDNA

Fresh tomato leaves were collected 15 days after transplanting, and 0.1 g of leaves were used for extraction of RNA, using the method of guanidium isothiocyanate (Merck KGaA, Darmstadt, Germany) as described previously [36]. To estimate the purity and concentration of the extracted RNA, Nano SPECTROstar (BMG Labtech, Ortenberg, Germany) was used, while to confirm the RNA integrity, gel electrophoresis agarose was used. Two micrograms of isolated RNA treated with DNase I (Fisher Scientific Inc., Waltham, MA, USA) were used for cDNA synthesis in a reverse transcription reaction (RevertAid First Strand cDNA Synthesis Kit, Catalog no. K1622, Thermo Fisher Scientific Inc., Waltham, MA, USA) [37]. The synthesized cDNA was kept at −80 °C to be used for qRT-PCR.

2.6.2. Assay of qRT-PCR

Using the qPCR, the expression level of genes related to pathogenesis (PAL, HQT, and CHS) were examined and normalized using the β-actin gene as a reference. Nucleotide sequences of all used primers are presented in Table 1. The experiments were conducted three times for each sample. The qRT-PCR was performed using a Rotor-Gene 6000 QIAGEN (QIAGEN N.V., ABI System, Venlo, The Netherlands) with Thermo SYBR Green Mix (Foster, CA, USA) [38]. Using the 2−ΔΔCt algorism, the levels of relative expression of the studied genes were determined [39].

2.7. Oxidative Stress Markers

All the chemicals, substrates and reagents used in this section and Section 2.8. were purchased from Merck KGaA (Darmstadt, Germany). All the oxidative stress markers and antioxidant enzymes measurments were determined by Novaspec II spectrophotometer (Amersham Pharmacia Biotech Uk Limited, Buckinghamshire, UK)

2.7.1. Analysis of Malondialdehyde

Thiobarbituric acid (TBA) was used to evaluate levels of malondialdehyde (MDA), as Heath and Packer [40] described. Tomato leaf samples (0.1 g) were ground in 1 mL of 0.1% trichloroacetic acid (TCA), and the mixture was centrifuged for 30 min at 10,000 rpm. Four mL of TBA solution (0.5% TBA: 20% TCA) was mixed with collected supernatant (1 mL) and maintained for 30 min at 95 °C. The mixture was submerged in ice immediately to stop the reaction, formed color was detected at 600 nm as an indicator of the concentration of malondialdehyde and expressed as µM/g fresh weight (FW).

2.7.2. Determination of Hydrogen Peroxide

Hydrogen peroxide (H2O2) was measured in fresh leaf samples of tomatoes using the KI method with a simple modification [41]. Fresh plant samples (100 mg) were crushed using TCA 0.1% and then centrifuged to collect a pure homogenate. The H2O2 evaluation was measured by mixing 1 mL of plant homogenate with KI solution (2 mL) (1 M KI in 10 mM phosphate buffer, pH 7.0). The absorbance was recorded after 20 min at 390 nm, and the results were reported as µM/g FW utilizing the extinction coefficient of H2O2 (0.28 M−1 cm−1).

2.8. Antioxidant Enzymatic Activities Measurement

2.8.1. Polyphenol Oxidase Enzyme

To detect the activity of polyphenol oxidase (PPO), we used the method described by Zhu [42]. Homogenized leaf sample (1 g) was mixed with 250 µL of sodium phosphate buffer (50 mM) (0.1 M, pH 6.5) then centrifuged at 8500 rpm for 30 min at 4 °C. The enzyme extract supernatant (0.1 mL) was mixed with 0.1 mM pyrogallol and 25 mM phosphate buffer (pH 6.8). Pyrogallol was not added to the control mixture. The rate at which absorbency increased at 525 nm was used to calculate the sample’s absorbance.

2.8.2. Peroxidase Enzyme

Peroxidase (POX) enzyme was measured using 1 g of tomato leaves homogenized and mixed with 5 mL buffer (pH 7.0) with EDTA 0.1% and polyvinylpyrrolidone 10%, then centrifuged at 12,000 rpm for 20 min at 4 °C [43]. The collected supernatant (100 µL) was combined with 0.1 mL of 20 mM guaiacol and 40 µL of 0.1% H2O2. Absorbance was recorded at 470 nm, and the enzyme activities were expressed as µM/g FW.

2.8.3. Catalase Enzyme

The catalase enzyme (CAT) was estimated by combining 12.5 µL of enzyme extract with 478.5 µL of potassium phosphate buffer (25 mM), which had a final concentration of 10 mM H2O2 [44]. At 240 nm, catalase activity was recorded and represented as µM/g FW.

2.8.4. Superoxide Dismutase Enzyme

To measure the superoxide dismutase enzyme (SOD), the crude plant extract (0.1 mL) in phosphate buffer (pH 7.0) was mixed with 50 µM nitro blue tetrazolium, 12 mM L-methionine, 0.1 mM EDTA, 10 µM riboflavin, and 50 mM sodium carbonate. The final volume of the reaction was completed to 3 mL by adding 50 mM phosphate buffer (pH 7.6) [45]. The control reaction was without plant extract. To begin the photochemical reaction, the mixtures were introduced to fluorescent lights for 15 min. After that, it was kept in the dark to measure at 560 nm. One unit of SOD activity was defined by a reduction of photochemical (50%) [46]. As µM/g FW, the activity of SOD was expressed.

2.9. Polyphenolic Components in Tomato Leaves

2.9.1. Preparation of Tomato Samples for Phenolic Analysis

Tomato leaf samples were collected 15 days after transplanting and then kept for a week at room temperature to get dry and crushed in a grinder mill to a fine powder (Moulinex AR1044, Paris, France). Two grams of the dry powder were immersed for two days in ethanol 95% (15 mL) [47]. Whatman filter paper No. 1 was used to filter the mixture, and a rotary evaporator was used to evaporate and concentrate the obtained extract in order to completely eliminate the ethanol. The obtained tomato plant extract was reserved at 4 °C in a brown bottle until further analysis.

2.9.2. HPLC Analysis of Tomato-Collected Leaves Extract

The different polyphenolic components of the tomato sample extract from the treatment of greenhouse experiment were determined using an HPLC analysis with an Agilent 1260 series (Waldbronn, Germany). Eclipse column C18 (4.6 mm × 250 mm i.d., 5 μm) was used for the separation. The mobile phase contains water (A) and trifluoroacetic acid in acetonitrile 0.05% (B) at a 0.9 mL/min flow rate. The following linear gradient was sequentially coded into the mobile phase: 0 min (82% A); 0 to 5 min (80% A); 5 to 8 min (60% A); 8 to 12 min (60% A); 12 to 15 min (82% A); 15 to 16 min (82% A) and 16 to 20 (82% A). Multi-wavelength detector was observed at 280 nm. 5 μL were used for each sample. The column temperature was kept constant at 40 °C.

2.10. Statistical Analysis

The data were analyzed using CoStat software, and significant differences were estimated using Tukey’s honest significant differences technique (H.S.D.) at a p ≤ 0.05, with standard deviation (SD) presented as a column bar or values. Up-regulation of a gene means that the relative expression levels are greater than 1, whereas down-regulation means values less than 1.

3. Results

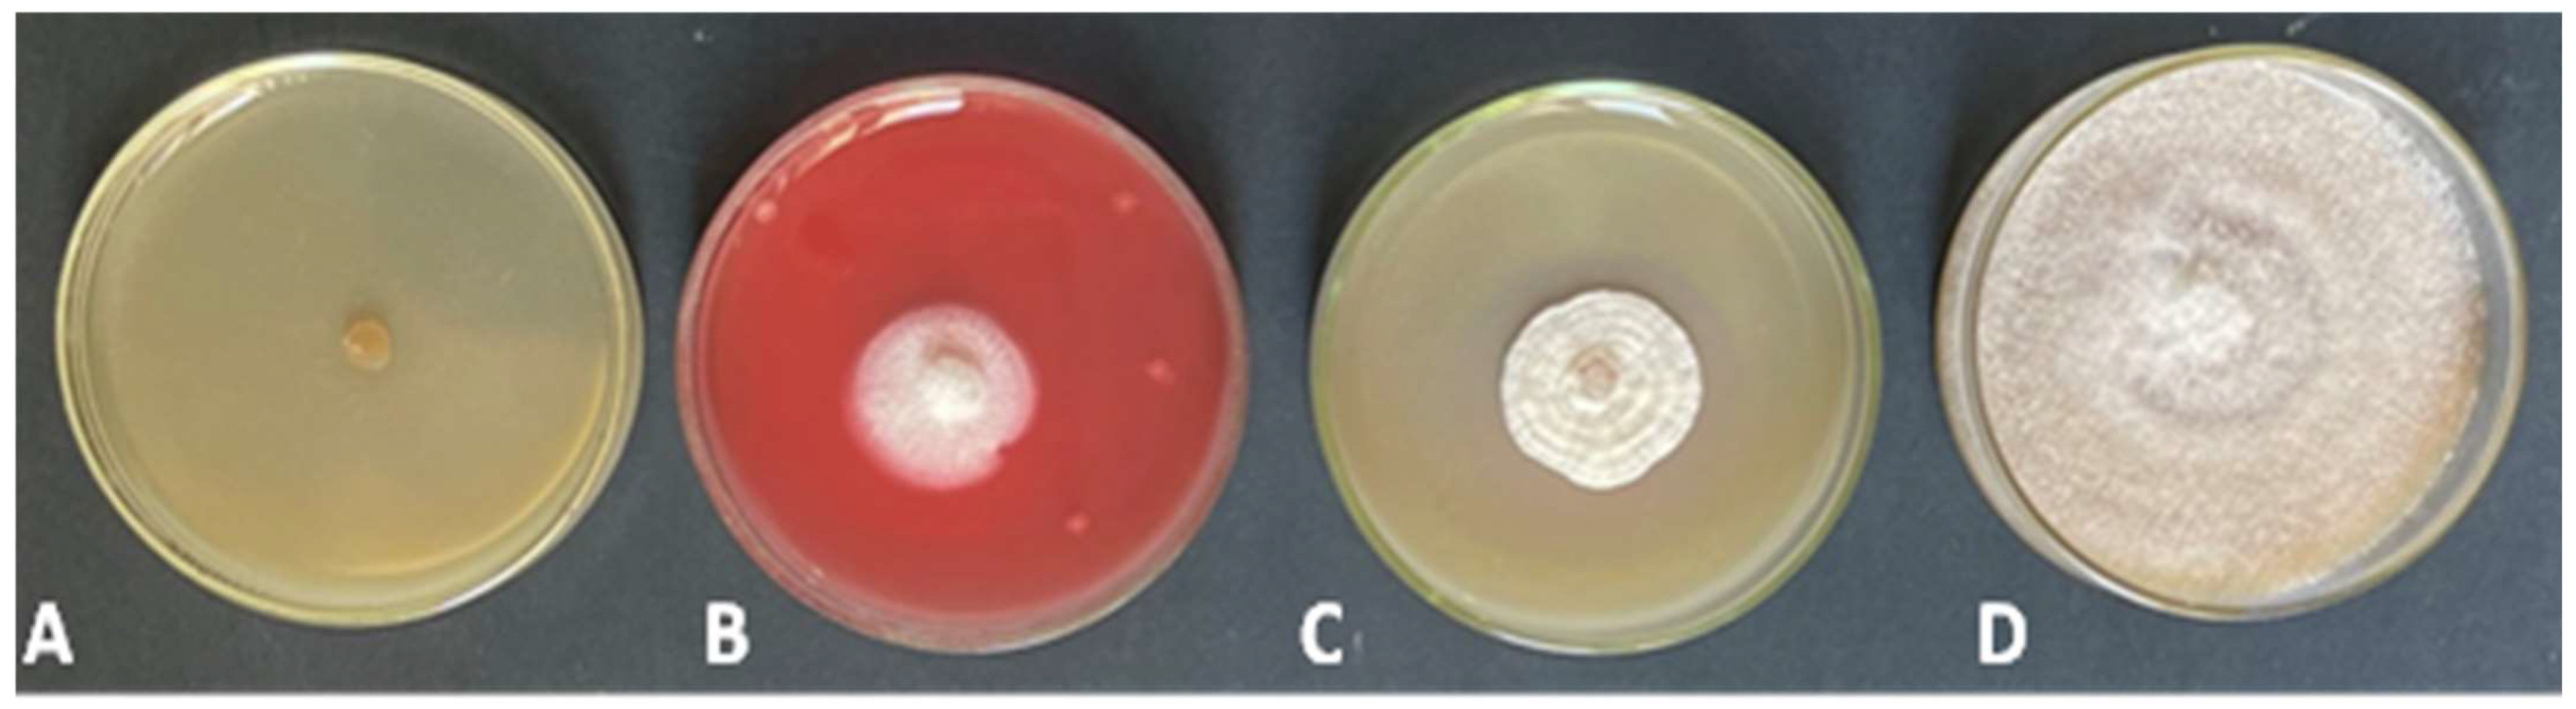
3.1. Rhizoctonia, Trichoderma Isolation and Identification

Five Rhizoctonia solani isolates isolated from tomato plant roots with rot symptoms, and the most virulent isolate of R. solani R4 was selected based on the pathogenicity test (Table S1). The morphological characteristics of R. solani hyphae were found to be septate multinucleate, while conidia and rhizomorphs were never observed. The isolation from tomato rhizospheric soil revealed 12 Trichoderma isolates.

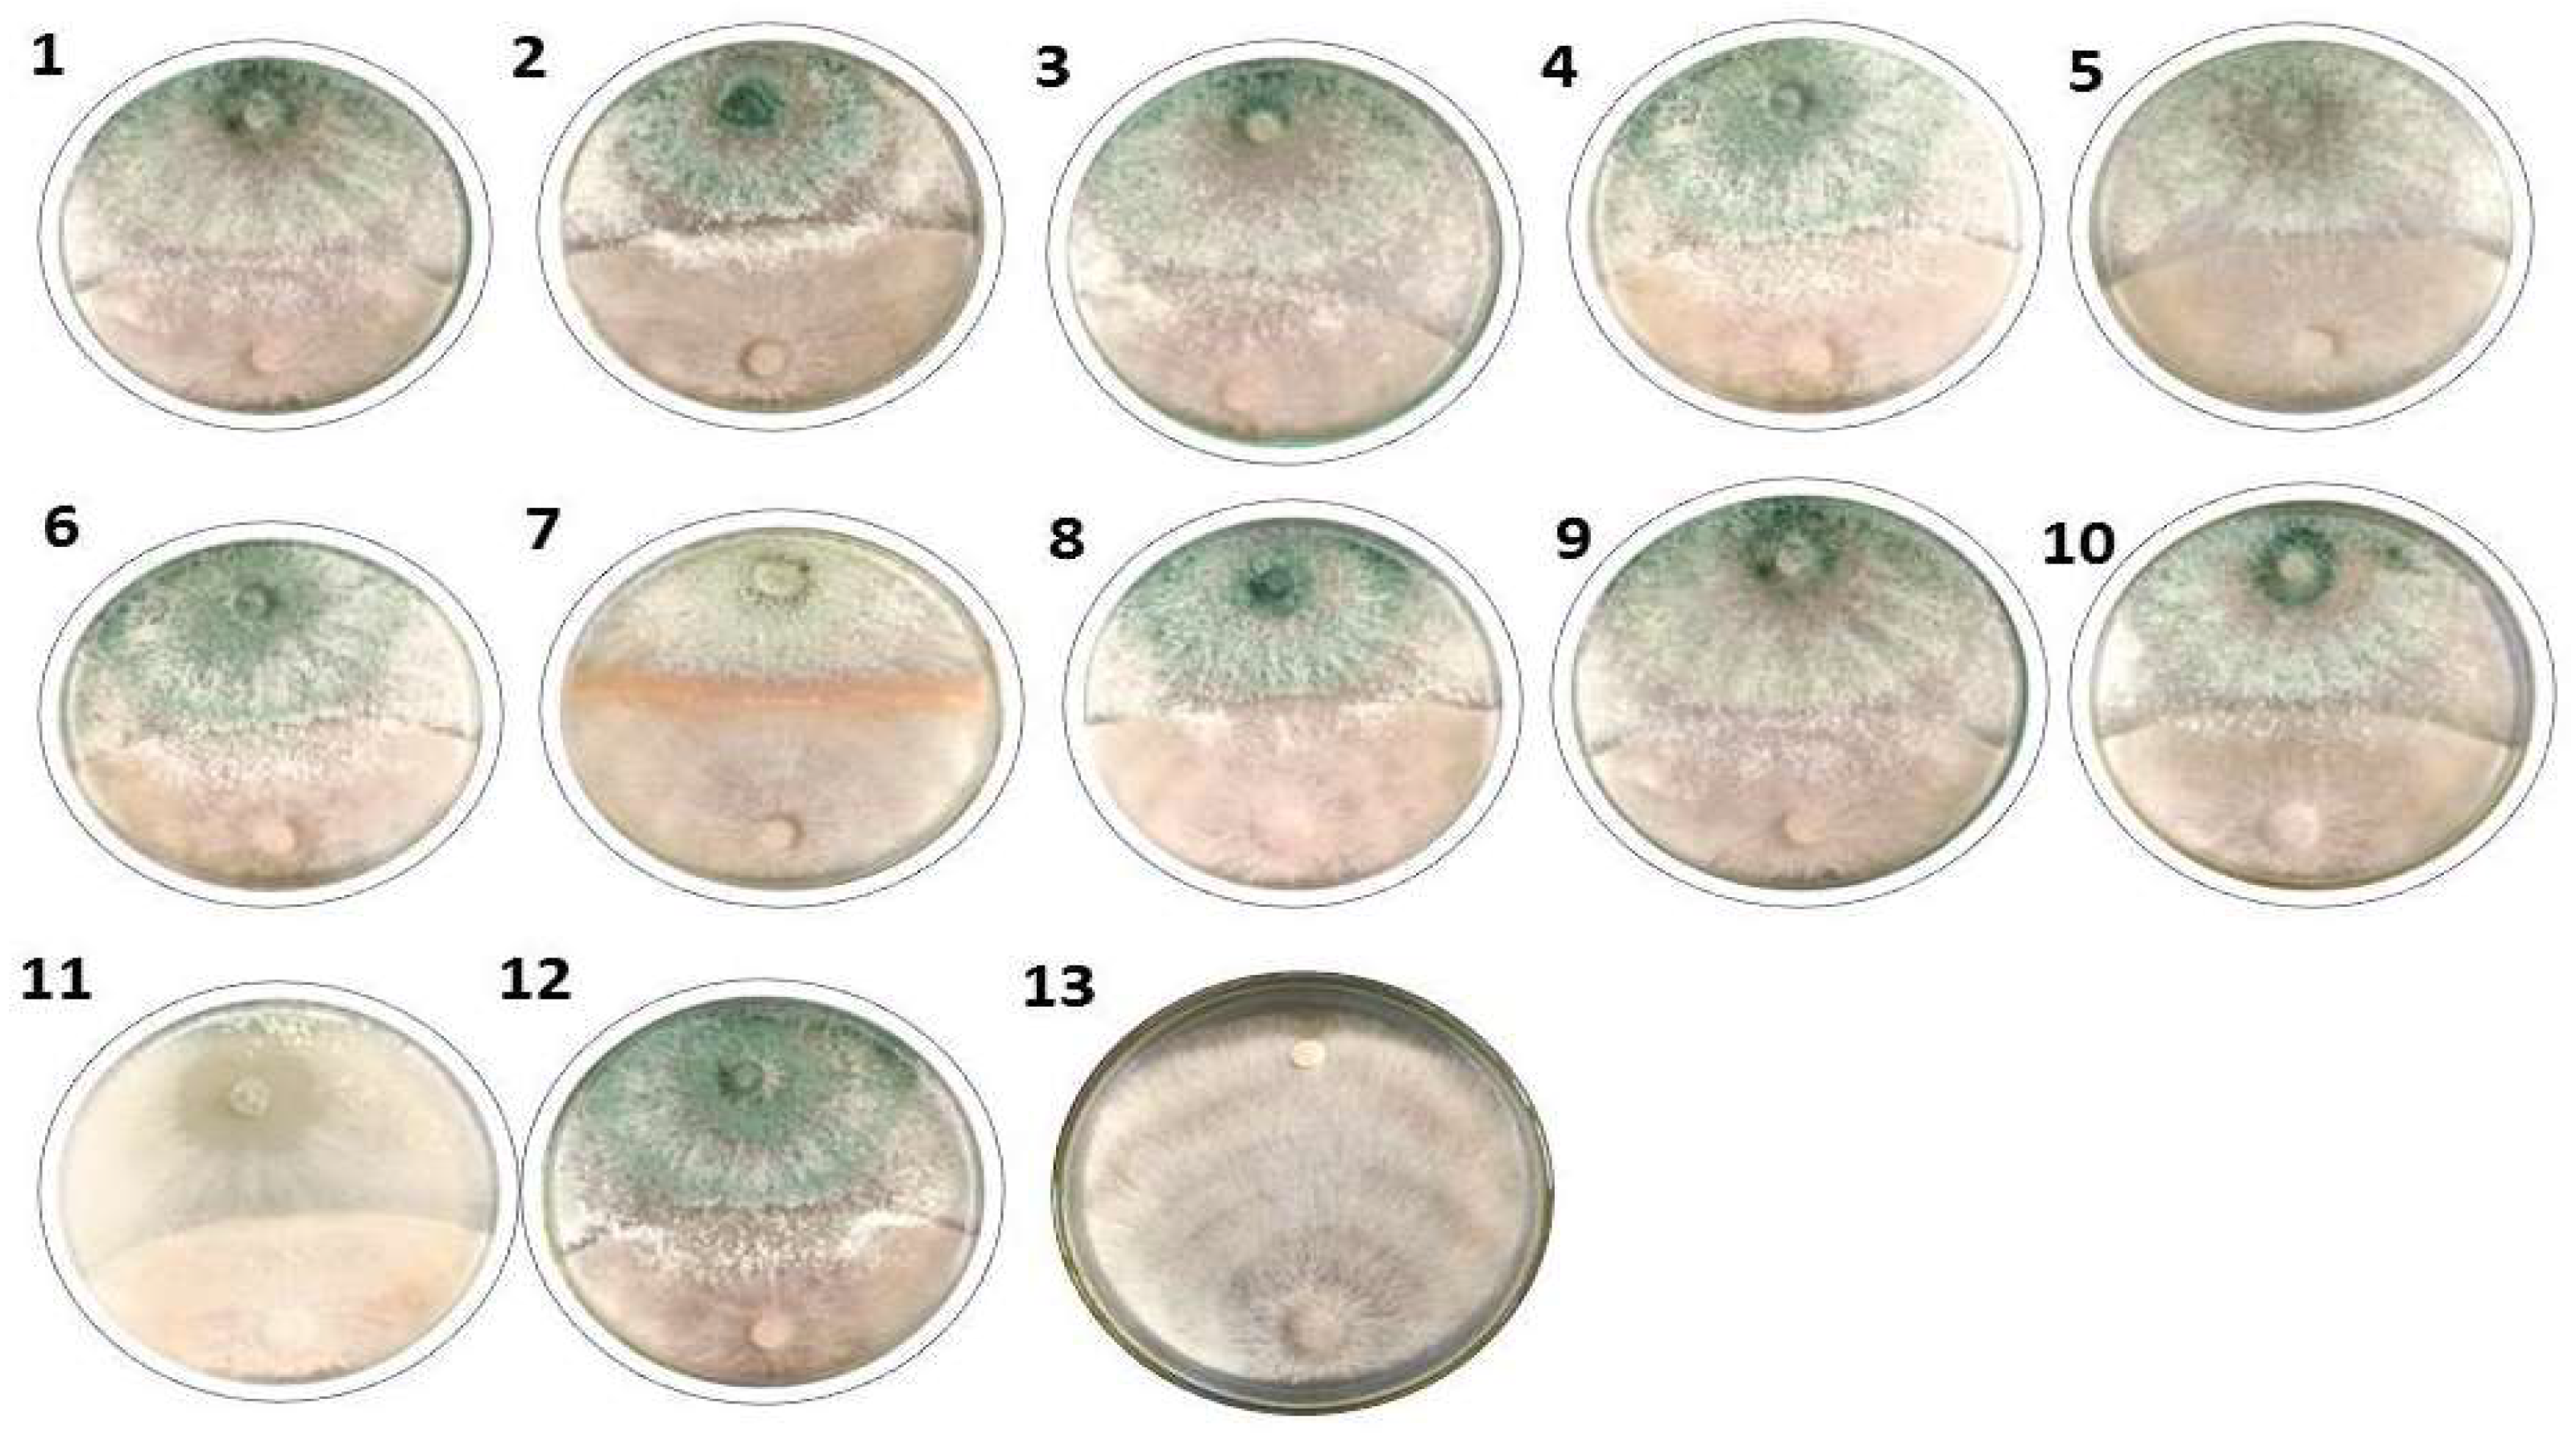
3.2. Effect of Trichoderma Isolates on R. solani In Vitro

The dual culture method was used to test the potential of Trichoderma spp. to inhibit R. solani (R4) growth in vitro. Twelve Trichoderma isolates were used to combat root rot pathogen R. solani compared to the control (without any treatment) (Table 2 and Figure 1). All tested isolates of Trichoderma showed an inhibition effect on R. solani growth (Table 2), in which Trichoderma isolate T3 was significantly the most effective (76.93%), followed by T12 (74.44%) and T9, T11 with inhibition effect 47.04%, while the lowest effect of Trichoderma isolates recorded from T4 (61.85%). The antifungal test was used to study the ability of Trichoderma isolates to inhibit R. solani growth. Among the twelve Trichoderma isolates, T3 was most effective against R. solani, which was selected for further study under greenhouse conditions.

3.3. Effect of Fungicides on R. solani In Vitro

All the tested fungicides demonstrated variable degrees of control over the pathogen radial mycelial growth and significantly differed from the control (Figure 2). Uniform®, Rizolex®, and Hattrick® fungicides were effective against R. solani by inhibiting the growth of fungal mycelium. At the concentration (1 ppm), Uniform® completely inhibited the radial mycelial growth of R. solani (100%), while Hattrick® and Rizolex® fungicides inhibition percentages were 64.07 and 62.96%, respectively, compared with the control. For that, we selected Uniform® fungicide for further study under greenhouse conditions.

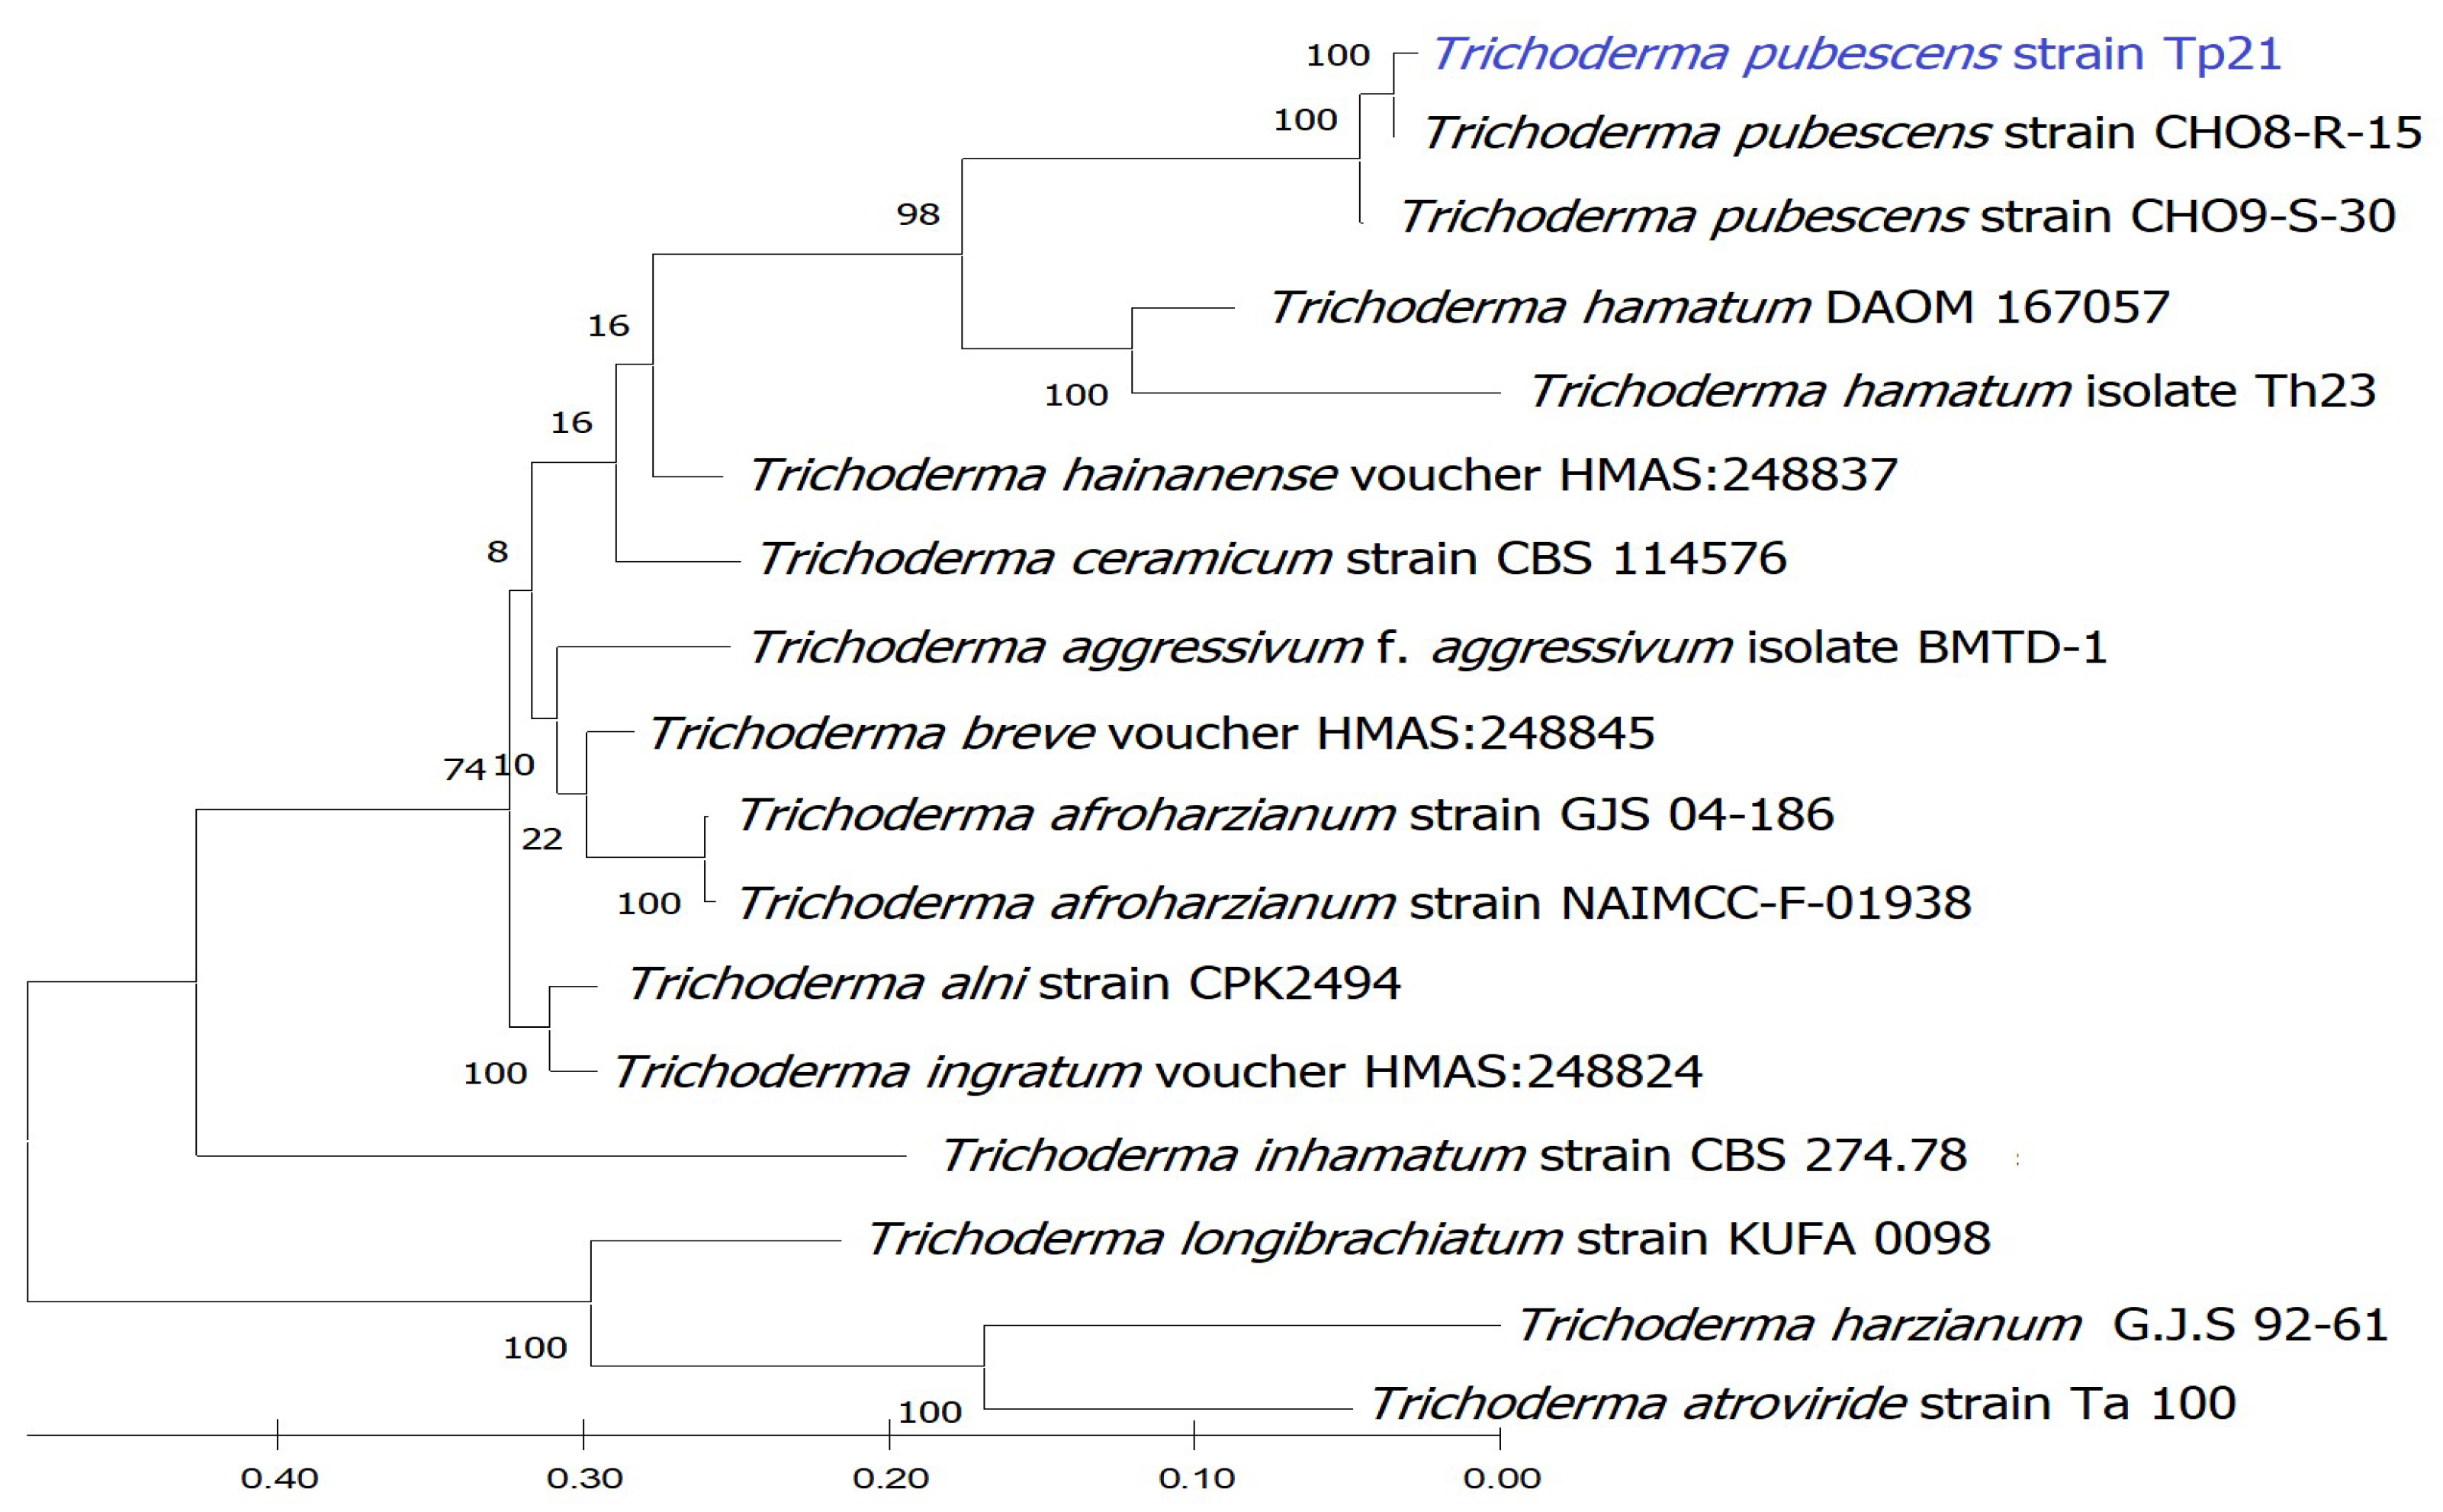
3.4. Molecular Identification of R. solani and Trichoderma spp.

Rhizoctonia solani was identified at a molecular level using ITS1/ITS4 primers. Molecular results confirmed the primary identification of the evaluated isolate in this study. The identified isolate R. solani strain R11 was deposited in the NCBI-GenBank database under accession no. OP456528. Comparing ITS nucleotide sequence with R. solani isolates in the NCBI-GenBank database showed that the highest homogeneity was 100% with R. solani isolate from tomato (HG934419).
On the other hand, ITS region, tef-1, and rpb2 genes were used for identifying the most effective isolate of Trichoderma in inhibiting R. solani fungus. Using NCBI-BLAST alignment, Trichoderma isolate was highly similar to Trichoderma pubescens. Phylogenetic analysis was performed using three molecular markers ITS (OP456527), tef-1 (OP491464), and rpb2 (OP491463) datasets to describe species limits. Bootstrap 1000 subgroups indicated the importance of each branch in the alignment (only values higher than 24% are displayed). A multiple sequence alignment in the maximum likelihood method using Mega X revealed the relationship of almost all Trichoderma spp., reference isolates could be clearly distinguished on the level of species and divided into various clusters and clades (Figure 3).

3.5. Effect of T. pubescens on R. solani Root Rot In Vivo

Under greenhouse conditions, T. pubescens was tested for its activity against R. solani, causing root rot in tomatoes. The severity of the root browning symptoms for each treatment (on a scale from 0 to 5) was used to record the disease index (DI%) in Table 3. T. pubescens treatment significantly reduced the DI% compared with control plants (G1). Applying T. pubescens on tomato plants in G4 treatment showed a significant reduction in plant disease index (16.00%) compared with G5 treatment (14.67%). Meanwhile, DI% was 78.67% in the G2 treatment compared to the G1 and G3 treatments (0.0%).

3.6. Efficacy of T. pubescens on Tomato Growth Parameters

In the experiment conducted in a greenhouse, T. pubescens treatment demonstrated a significant increase (p ≤ 0.05) in the growth parameters of treated plants (Table 4). Additionally, the T. pubescens treatment significantly impacted plant height. Plant height was recorded as 21.27 cm in T. pubescens treatment (G3), followed by T. pubescens + R. solani (G4), which recorded 19.23 cm. Compared to the R. solani treatment (G2, 11.10 cm) and R. solani + fungicide treatment (G5, 13.27 cm), G3 and G4 treatments significantly increased root length by 10.37 and 9.23 cm, respectively (Table 4). T. pubescens treatments alone (G3) or when applied in inoculated plants (G4) increased the fresh weight of the shoot (6.10 and 5.38g, respectively) and root-fresh weight (3.40 and 3.23 g, respectively) compared to the control treatment (G1). Tomato roots’ dry weight was changed after being treated with T. pubescens (G3) and fungicide treatment (G5) compared with G2 and G1 treatments (Table 4). T. pubescens treatment (G3) effectively increased the chlorophyll content (37.70 SPAD value), followed by T. pubescens + R. solani treatment (G4), with a SPAD value of 36.70. In contrast, R. solani + fungicide treatment (G5) showed a SPAD value of 35.10 compared to the control (G1, 35.27), and plants inoculated with R. solani (G2) showed a SPAD value of 23.63 (Table 3).

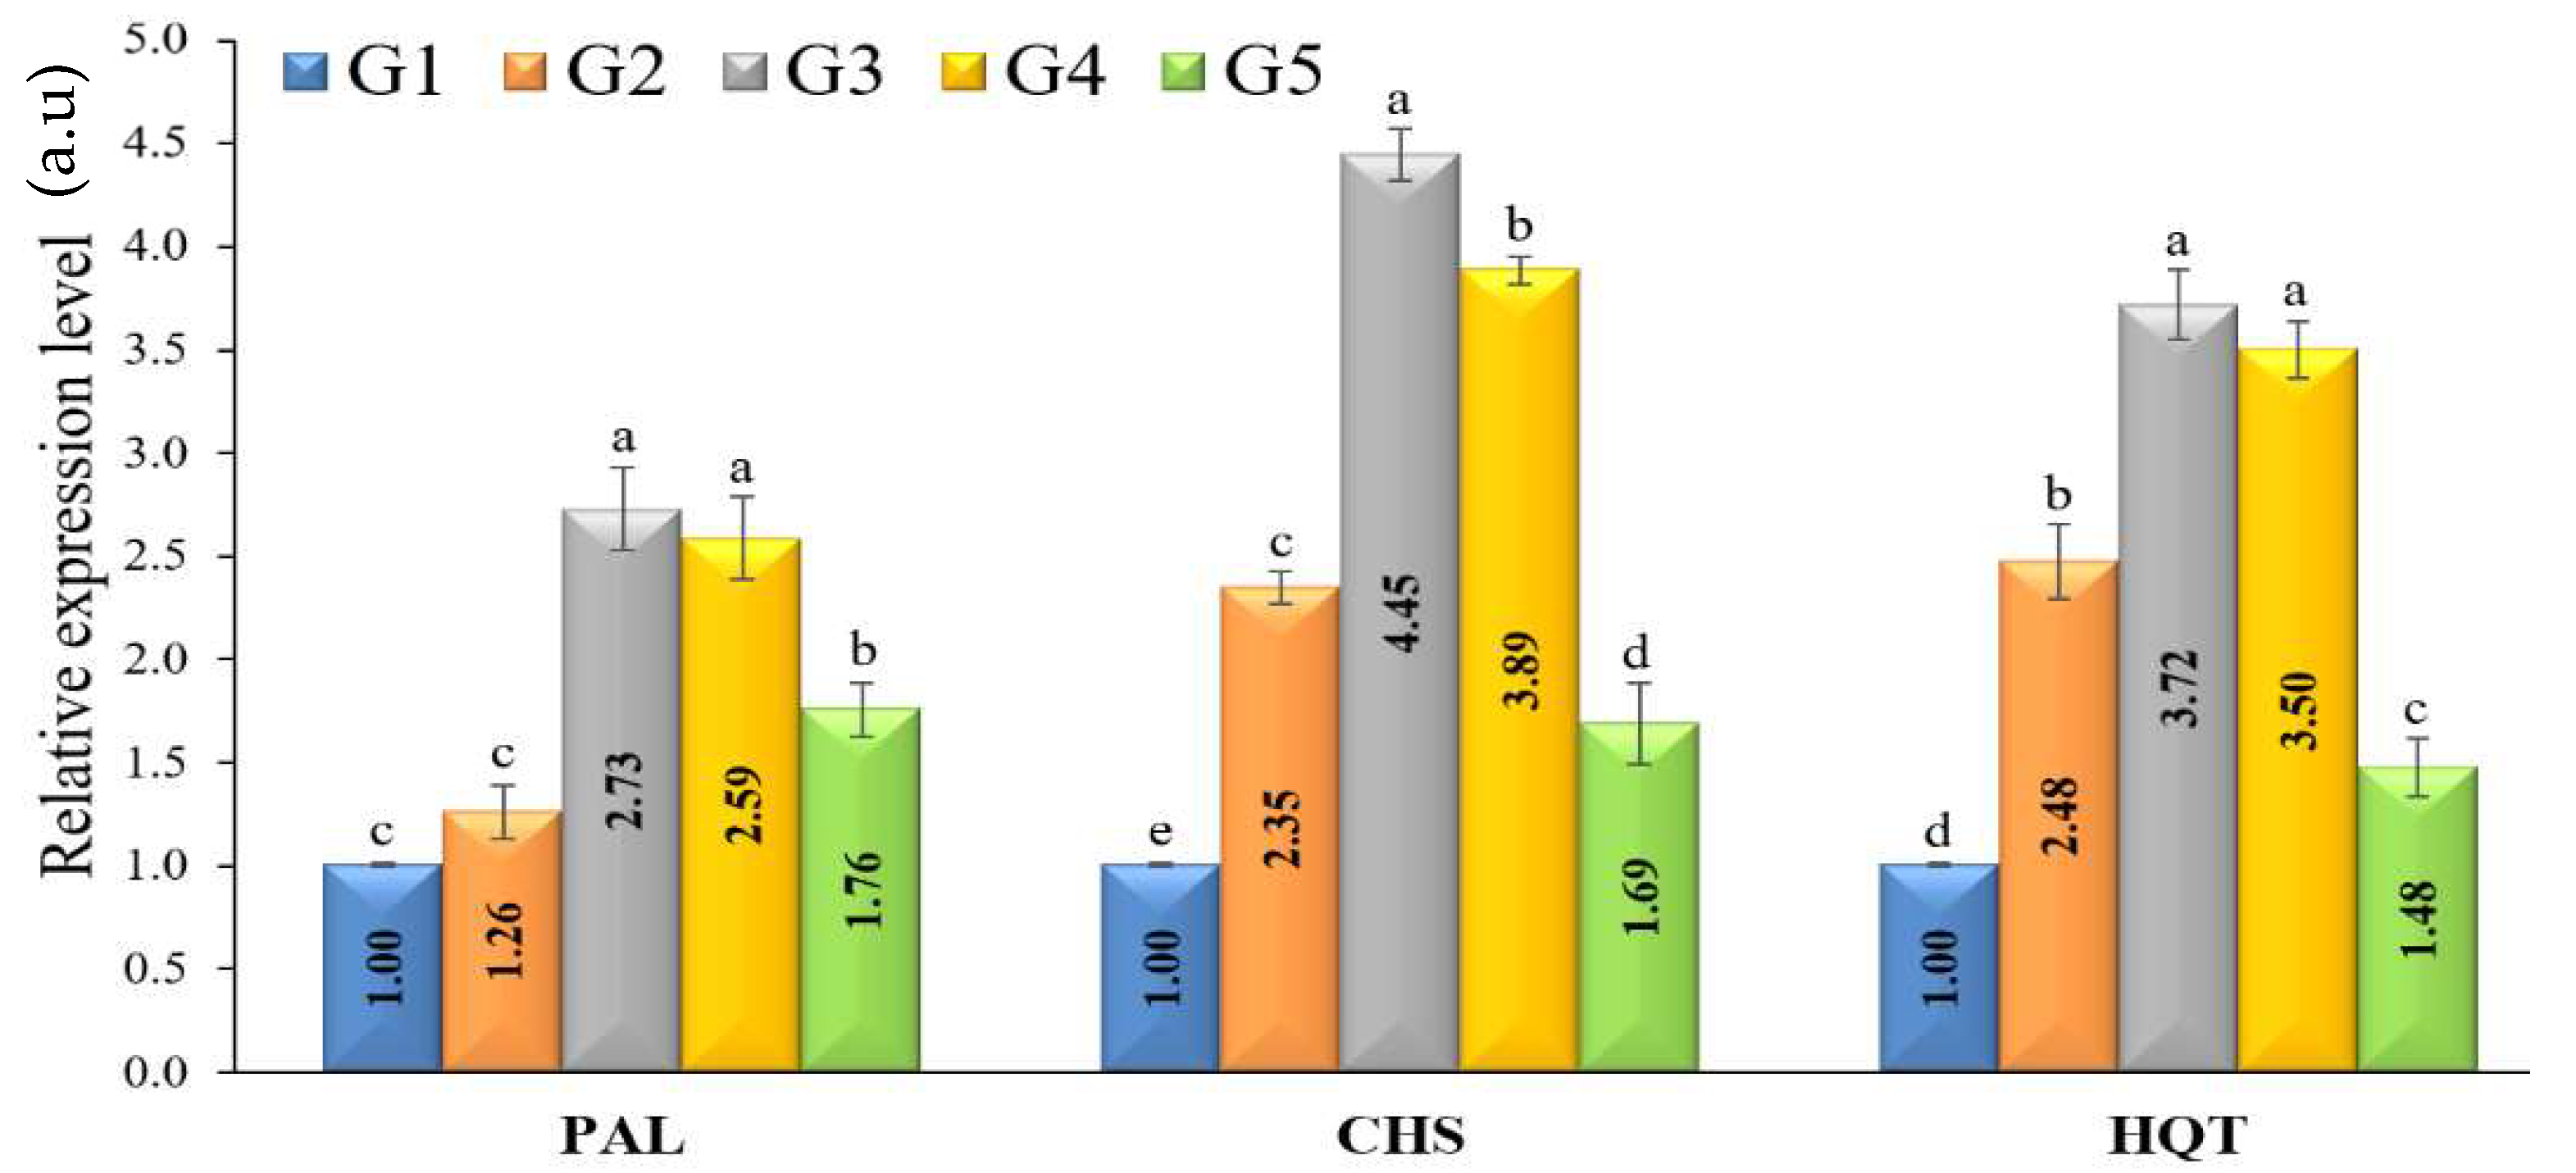
3.7. Defense-Related Enzymes Activity

At 15 days after transplanting, the expression levels of three defense-related-genes (PAL, CHS, and HQT) have increased significantly in plants treated with T. pubescens in comparison with the untreated plants (p ≤ 0.05). All treatments significantly upregulated PAL as compared to the control group (G1) (Figure 4). T. pubescens treatment (G3) showed the highest level of relative expression (2.729-fold higher than the control), followed by G4 (T. pubescens + R. solani) and G5 (R. solani + fungicide) treatments with expression levels 2.586- and 1.757-fold, respectively. Like CHS, plants treated with T. pubescens showed upregulated CHS expression levels. The highest expression level (4.447-fold) was observed in G3, followed by G4 (3.887-fold higher) and G2 (2.347-fold higher). A significant increase in HQT expression was observed in all treatment groups compared to the control, particularly in plants treated with T. pubescens (Figure 4). The most considerable transcriptional level (3.72-fold) was recorded in the G3 treatment, followed by G4, G2, and G5, with expression levels 3.503-, 2.477-, and 1.477-fold higher than the control, respectively.

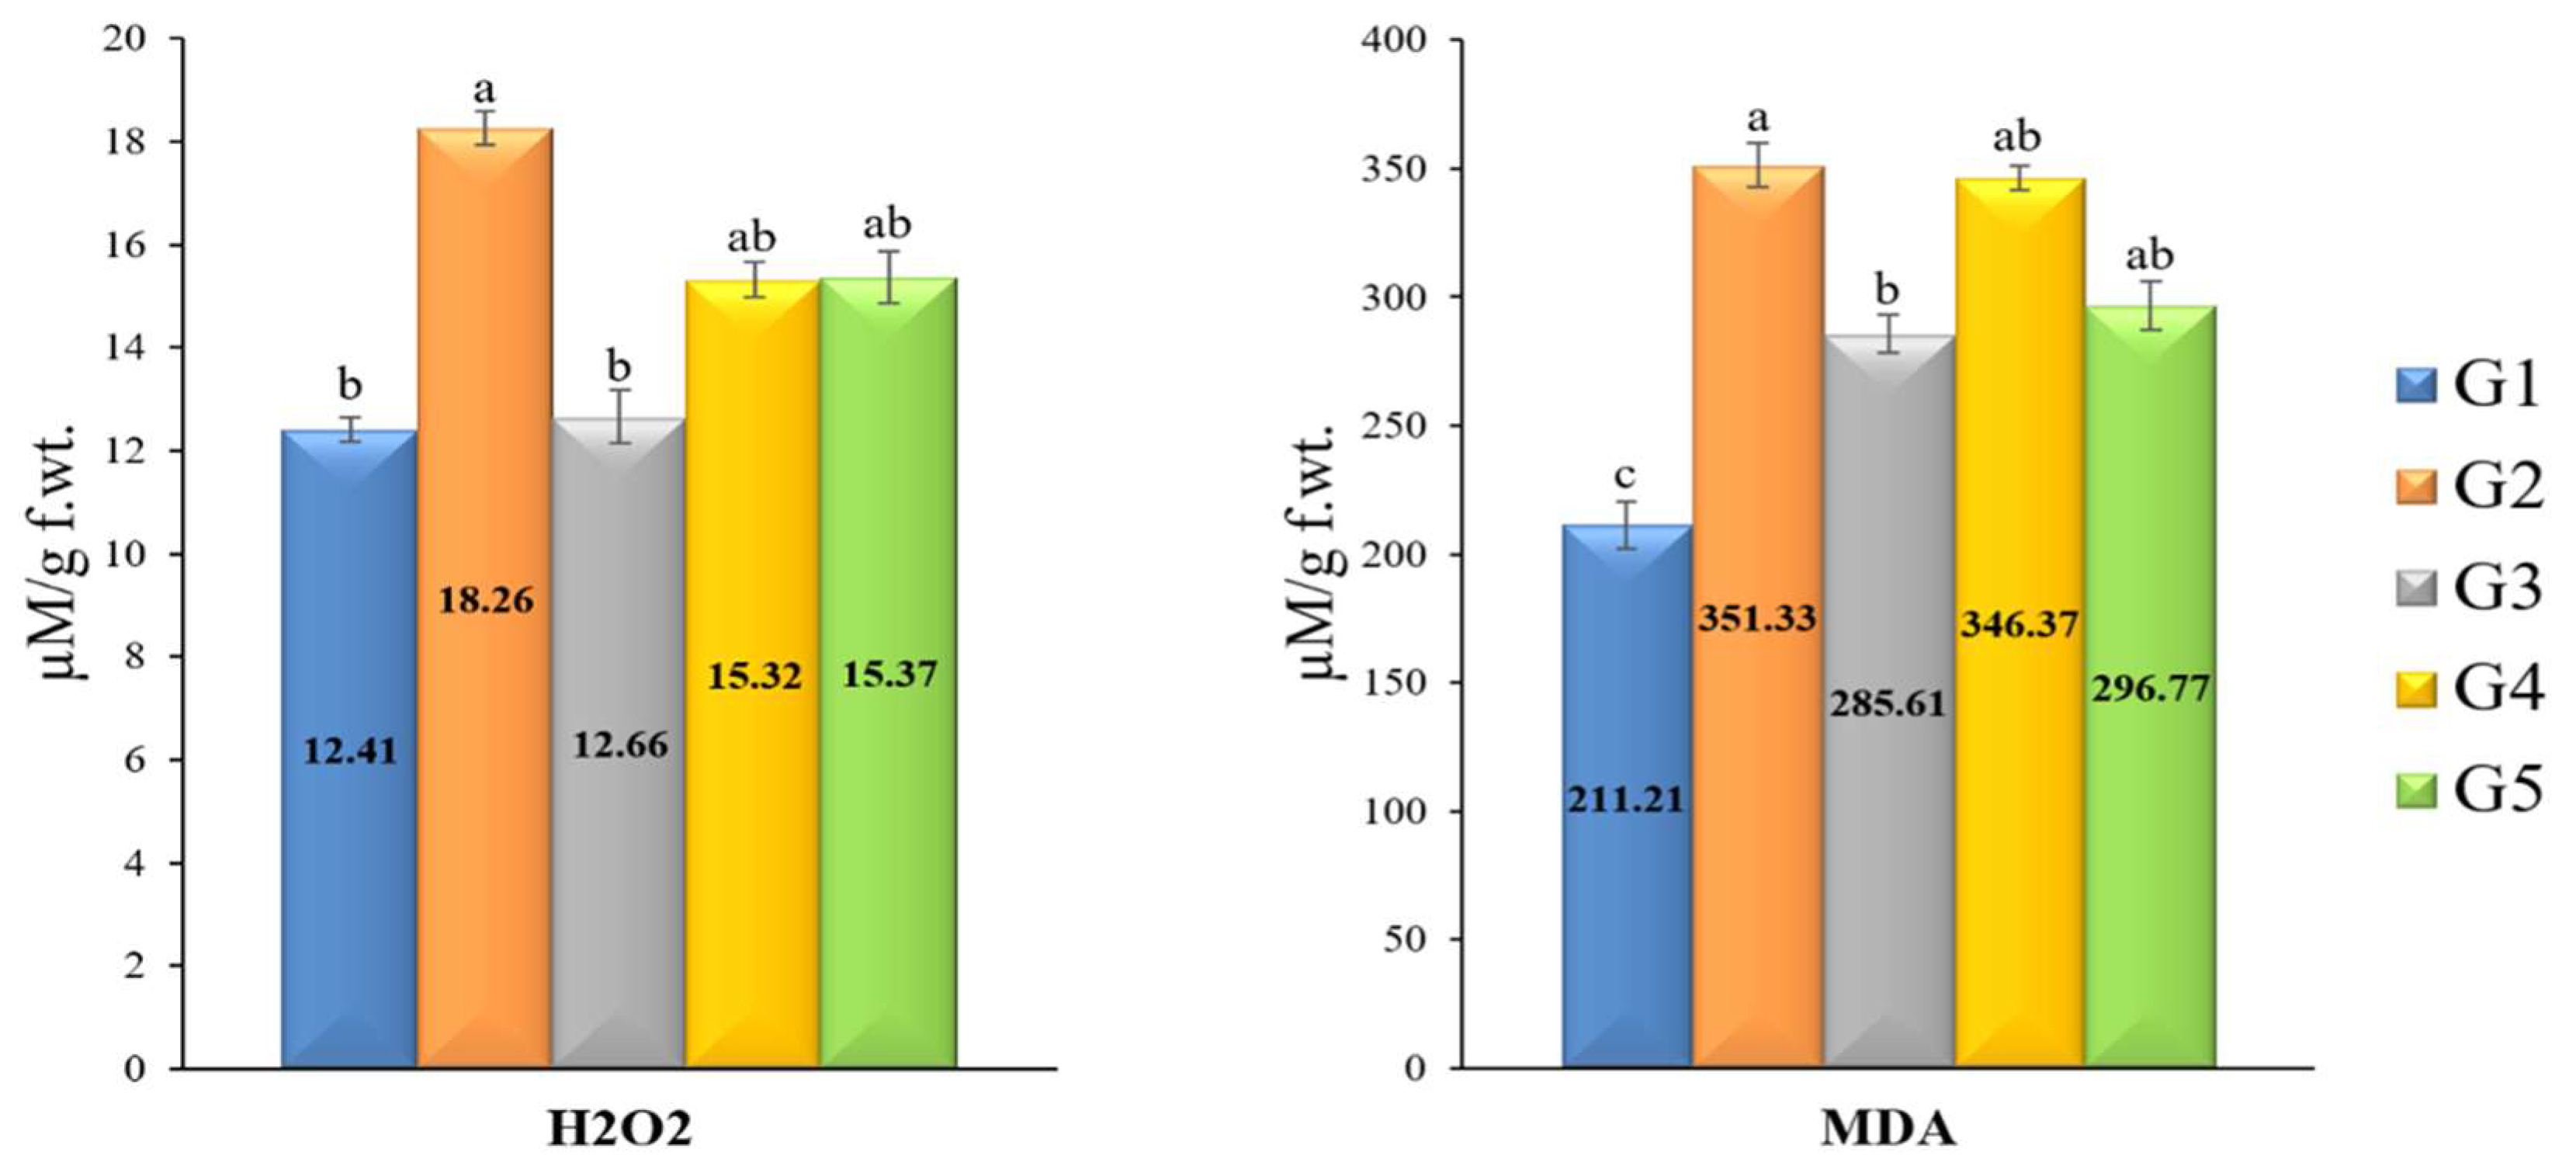
3.8. H2O2 and MDA Kinetics

Two oxidative stress markers (H2O2 and MDA) were estimated. The results for H2O2 showed that plants inoculated with R. solani showed the highest level (18.26 µM/g FW), followed by R. solani-inoculated plants treated with fungicide (15.37 µM/g FW) compared with untreated plants (12.41 µM/g FW). However, the tomato plants from the two treatments, T. pubescens (G3) and T. pubescens + R. solani (G4), showed a reduction in H2O2 content compared to the R. solani treatment (G2). T. pubescens treatment (G2) recorded 12.66 µM/g FW, while T. pubescens + R. solani (G4) showed 15.32 µM/g FW (Figure 5). Similar to H2O2, MDA was elevated upon R. solani infection. The treatment of R. solani + fungicide (G5) and R. solani alone (G2) showed the greatest H2O2 level (351.33 and 346.37 µM/g FW, respectively) compared to the untreated control, which showed a significant increase (211.21 µM/g FW). At the same time, plants treated with T. pubescens + R. solani (G4) recorded 296.77 and 285.61 µM/g FW for G3 treatment (T. pubescens alone) with significant decreases in the MDA.

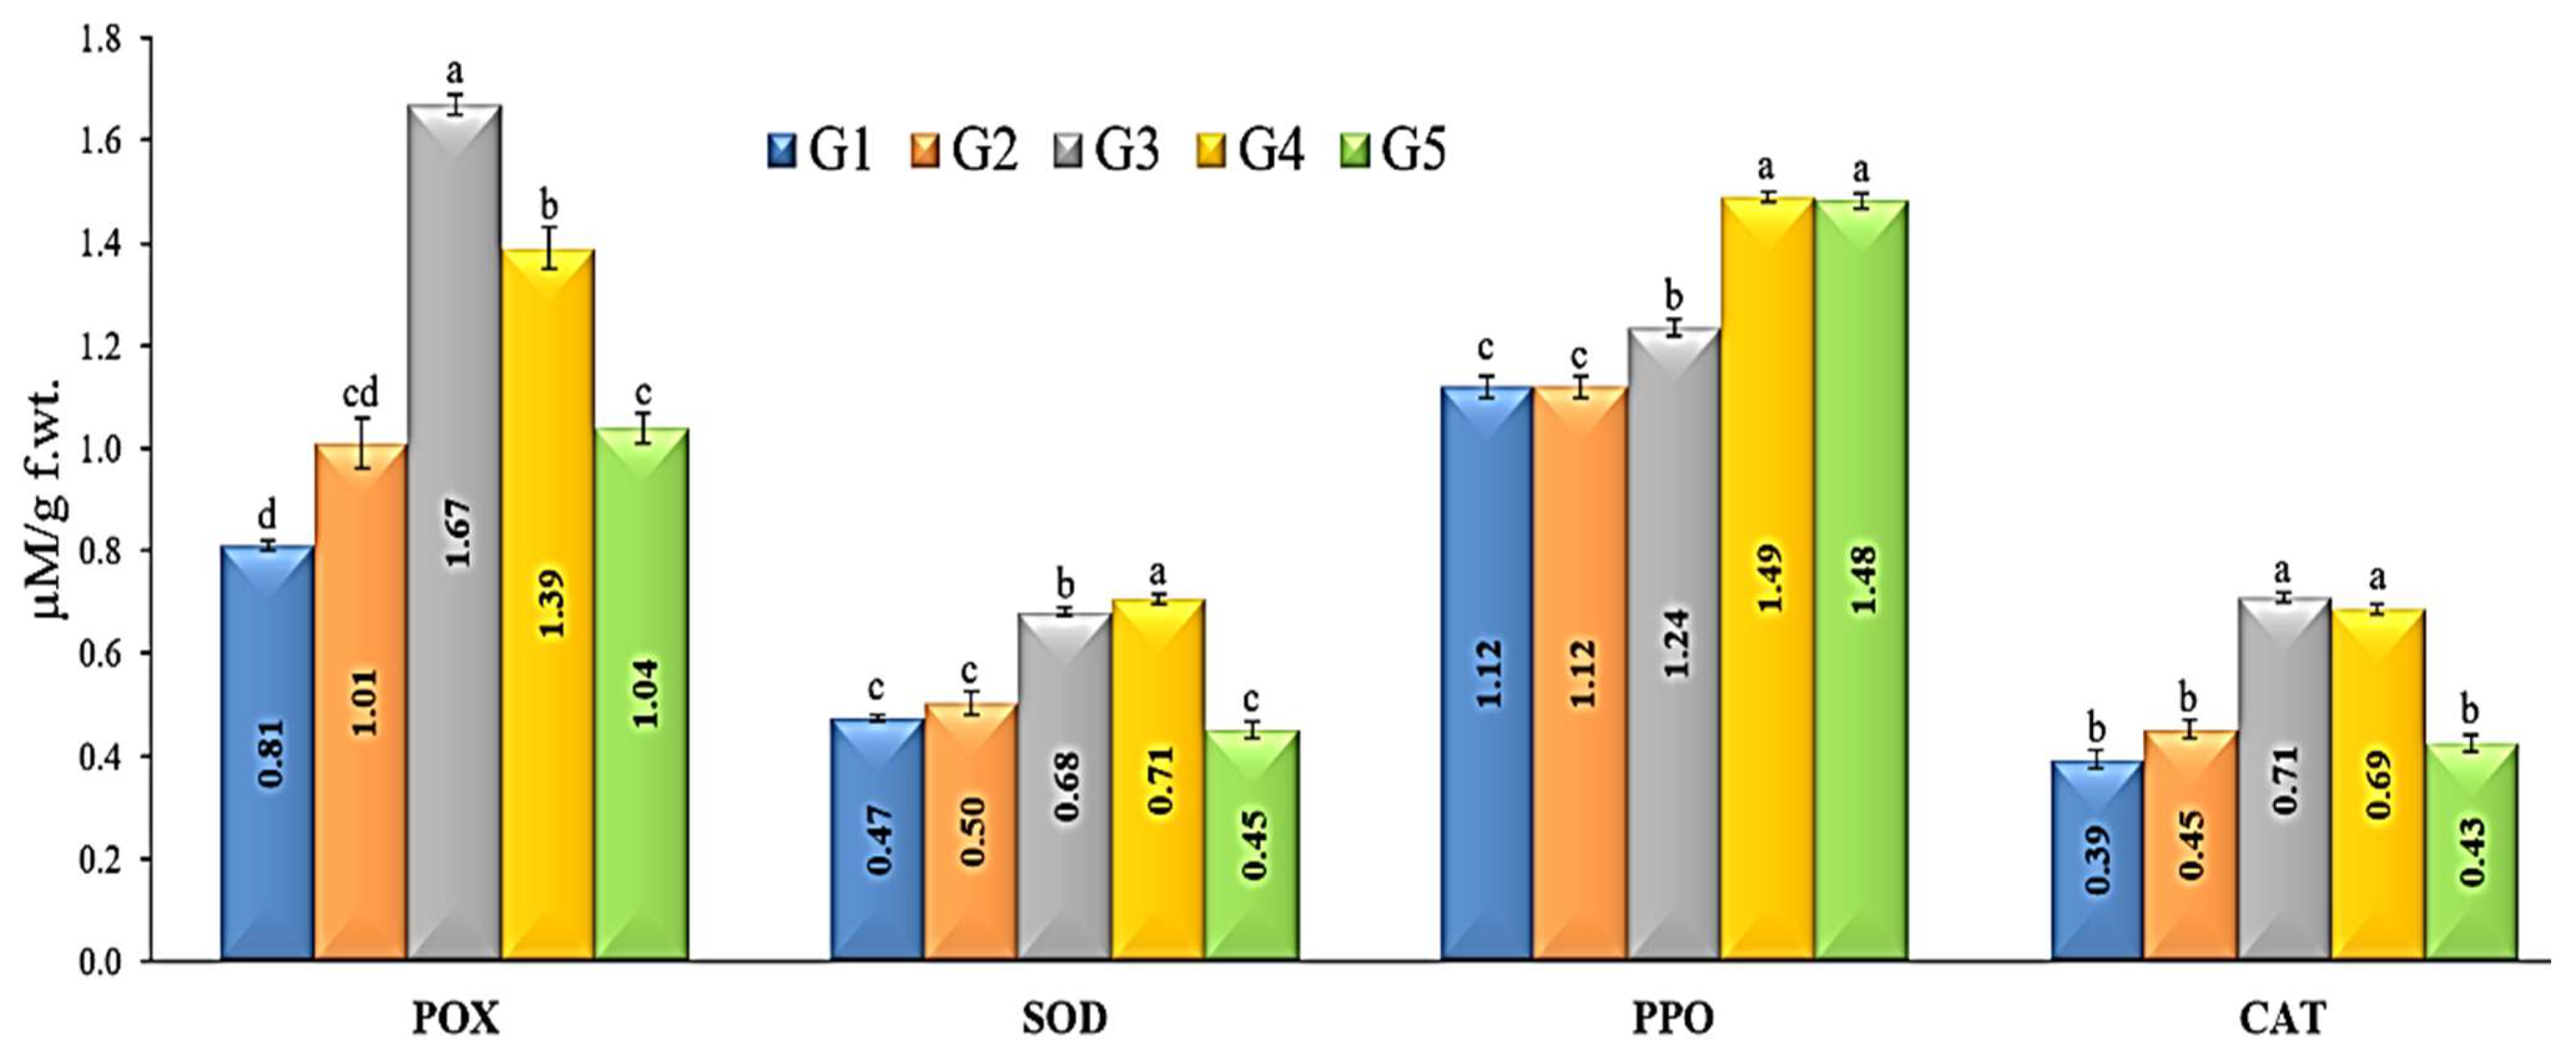
3.9. Antioxidant Enzymes Activities

Four antioxidant enzymes, namely SOD, PPO, POX, and CAT, were distinguished upon R. solani infection and T. pubescens as well as fungicide treatment (Figure 6). T. pubescens isolate induced the antioxidant defense system and enhanced the four-enzyme content significantly in tomato plants, as recorded in group treatments G3 and G4. The T. pubescens + R. solani treatment (G4) exhibited the highest PPO activity value (1.49 µM/g FW), followed by R. solani-inoculated plants treated with fungicide (G5, 1.482 µM/g FW). At the same time, treatment with T. pubescens alone (G3) induced the PPO activity by 1.236 µM/g FW. Peroxidase (POX) activity was elevated in response to R. solani infection in plants treated with T. pubescens (Figure 6). Compared with control (G1), infected plants treated with T. pubescens (G4) exhibited the highest level of peroxidase activity, followed by plants treated with T. pubescens (G3). Furthermore, R. solani inoculated plants treated with fungicide (G5) displayed a slight increase in peroxidase activity more than the control. Regarding antioxidant enzyme CAT activity, G3 and G4 treatments showed the greatest level of content (0.708 and 0.685 µM/g FW, respectively) compared with the G5 treatment (0.425 µM/g FW). In addition, G2 treatment exhibited 0.452 µM/g FW activity compared to G1 plants (0.393 µM/g FW). Concerning the activity of superoxide dismutase (SOD), results revealed that SOD was significantly increased upon T. pubescens treatment with or without R. solani (Figure 6). The G4 treatment showed the highest SOD activity, followed by G3 treatment (0.705, 0.680 µM/g FW, respectively). In comparison, the lowest value for SOD activity was obtained for G1 plants (0.474 µM/g FW).

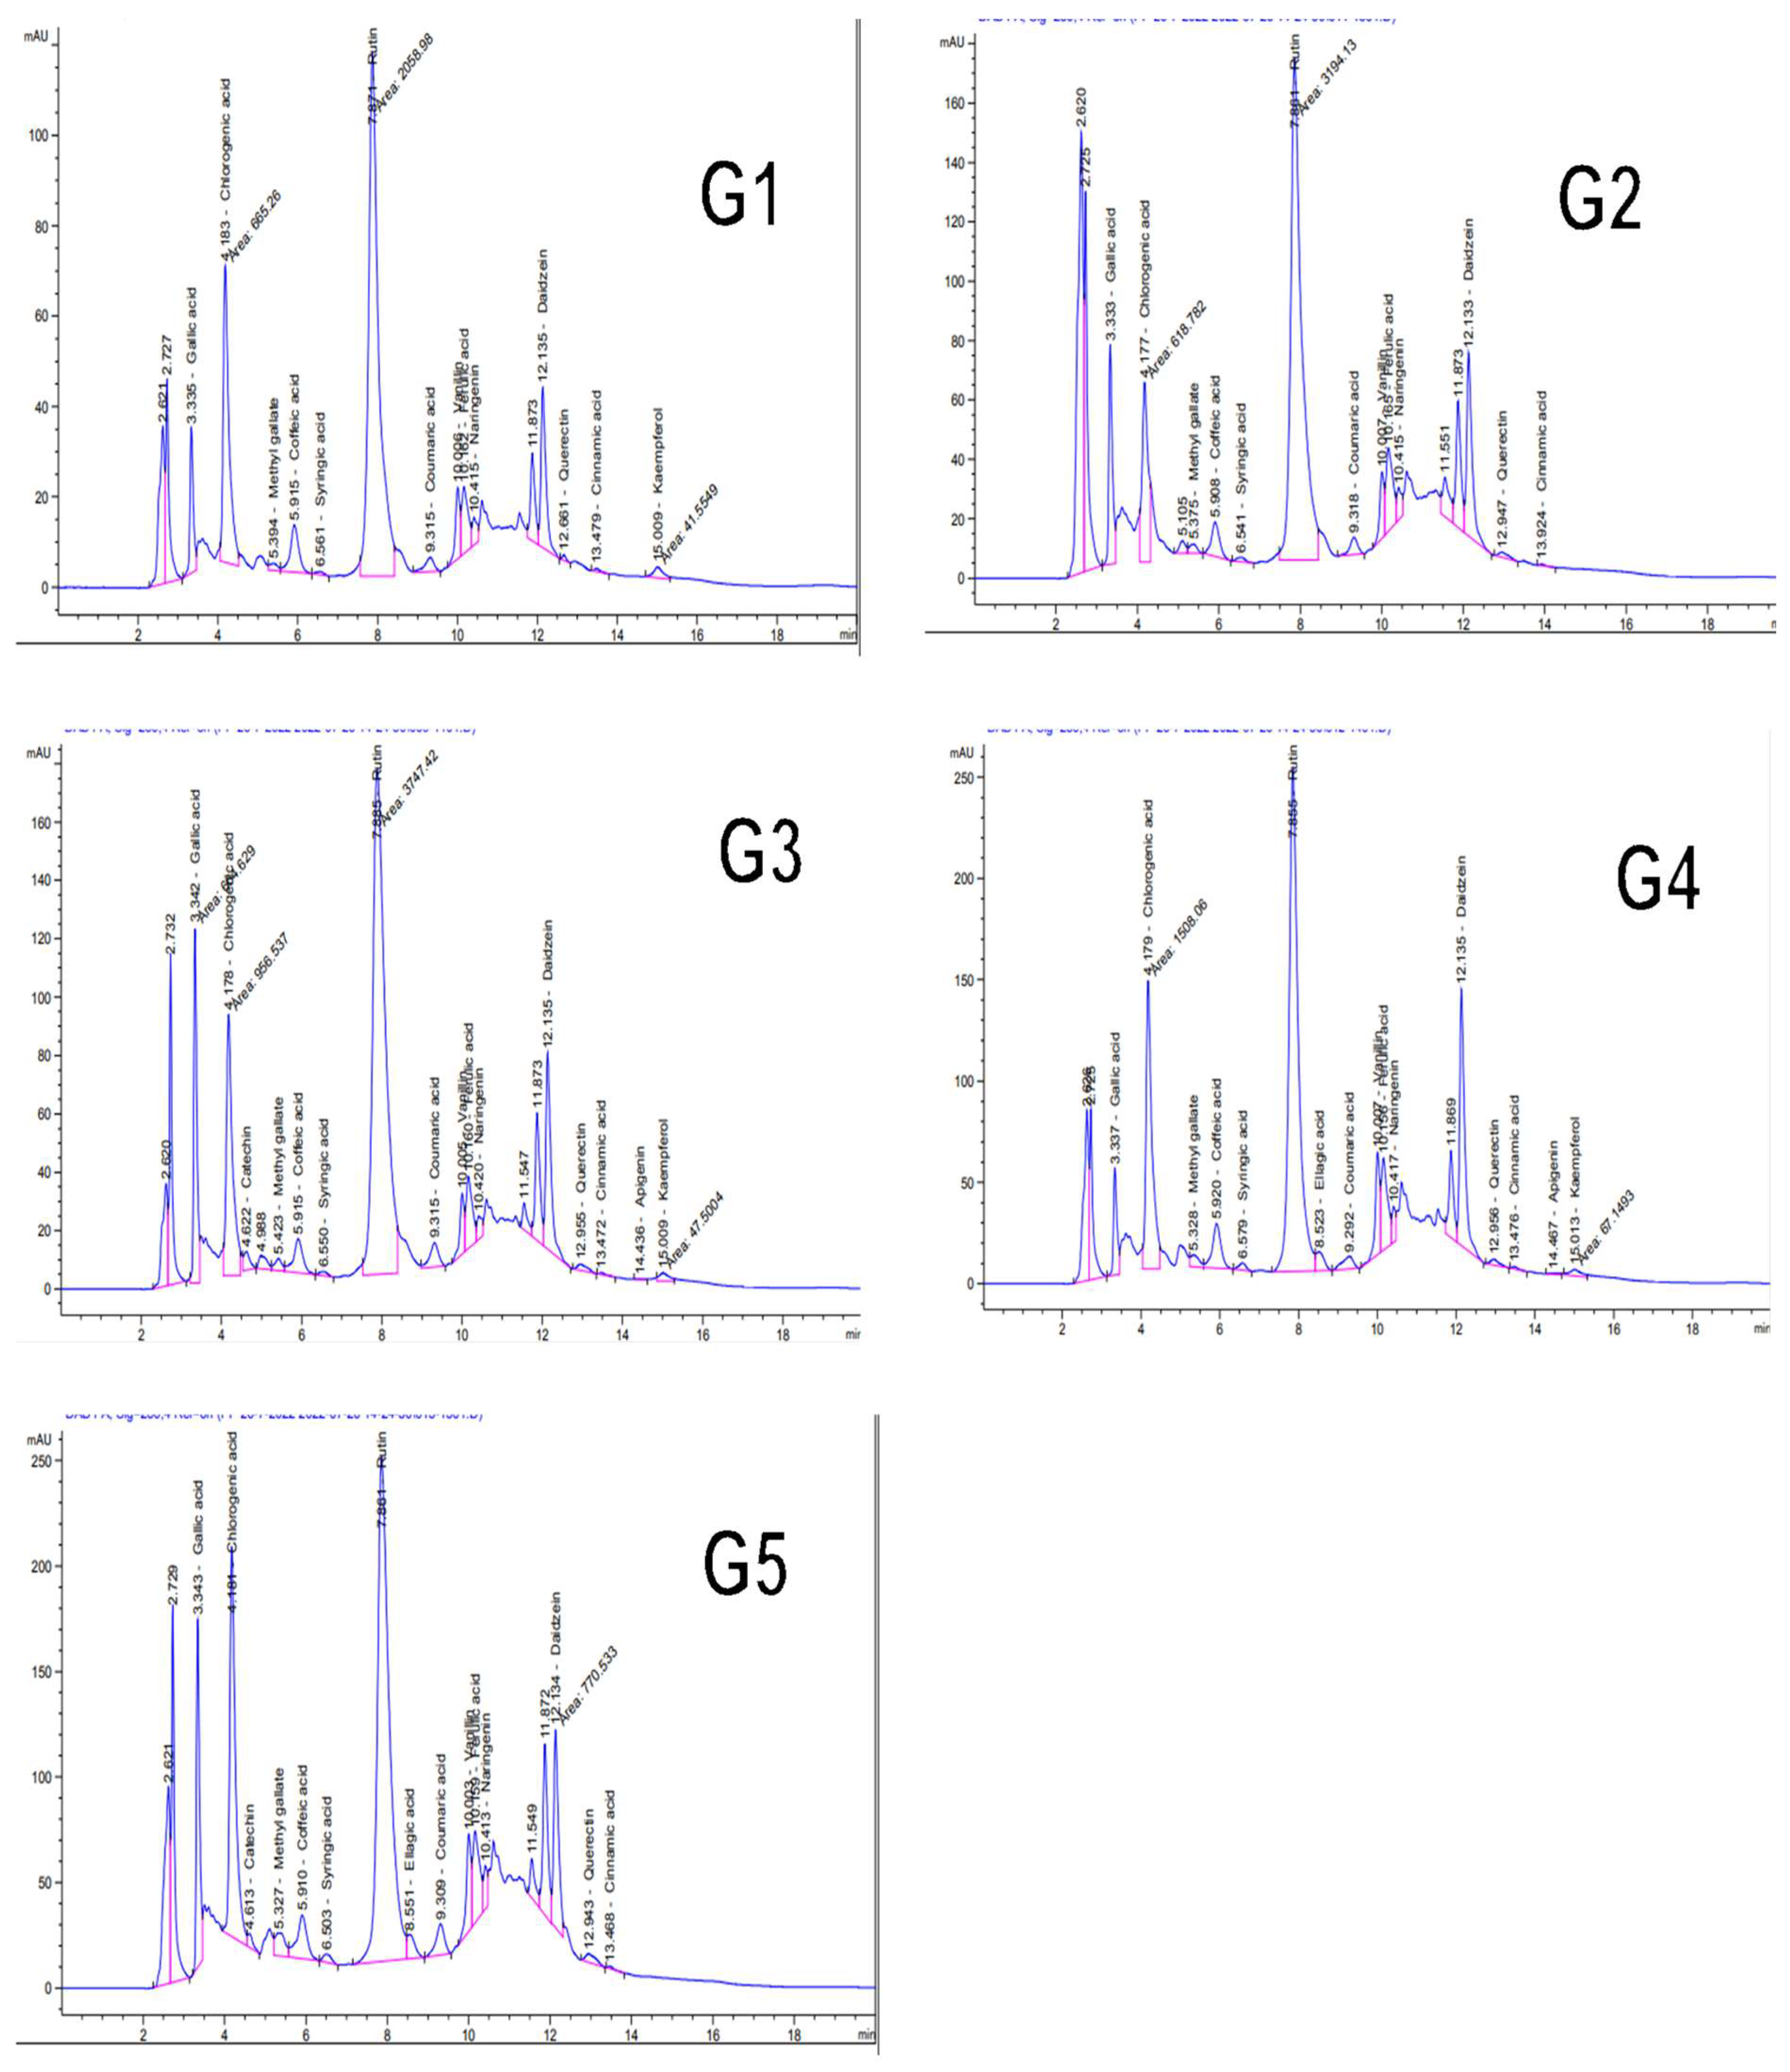
3.10. Phytochemical Analysis of Tomato Leaf Extract

The HPLC chromatograms for ethanolic extracts for different groups of treatments G1, G2, G3, G4, and G5 tomato plants were presented in Figure 7. HPLC analysis showed that the total contents of 19 polyphenolic compounds were 35,205.91, 35,591.70, 56,032.64, 43,031.03, and 41,038.68 µg/g for G1, G2, G3, G4, and G5, respectively (Figure 7). The major detected compounds were gallic acid, chlorogenic acid, ferulic acid, methyl gallate, caffeic acid, syringic acid, pyrocatechol, ellagic acid, coumaric acid, and cinnamic acid, while flavonoid compounds were vanillin, catechin, rutin, quercetin, naringenin, daidzein, quercetin, apigenin, and kaempferol. The most prevalent phenolic compounds (µg/g) were chlorogenic acid (7875.70, 5158.17, 9981.89, 9613.27, and 9282.39), gallic acid (1367.53, 2294.84, 4254.70, 1275.36, and 2776.91), ferulic acid (1136.84, 1581.69, 1619.09, 9613.27, and 1473.40), caffeic acid (1235.52, 903.82, 1319.00, 1430.01, and 1231.44) in G1, G2, G3, G4, and G5 extracts, respectively. On the other hand, naringenin as a flavonoid compound was overexpressed in G2 treatment with an accumulation value (606.62 µg/g) compared to G1 plants (500.20 µg/g) (Table 5).

4. Discussion

Many fields are frequently affected by the Rhizoctonia solani fungus disease, which significantly negatively impacts seed germination and growth of many plants and causes root rot diseases [5,48]. Fungicides, as chemical controls, are regularly used and effectively manage R. solani fungus. However, using chemicals to control fungal infections in plants might not always be acceptable. Chemical control of plant diseases is becoming less popular because of the risks that come with it [23]. As biocontrol agents, many microorganisms are used because they are a safe alternative to harmful fungicides and are sustainable and good for the environment [49,50]. Trichoderma spp. are known to be very effective antagonist fungi that have biocontrol activity on many other fungi, such as R. solani, Verticillium dahliae, and Sclerotium rolfsii [51].
The morphological characteristics of the genus Rhizoctonia, an anamorphic mycelial septate fungus without asexual spores, were consistent in identifying R. solani isolated from tomato plants [5]. The isolated fungus from tomato root rot was identified morphologically and molecularly as R. solani. For molecular identification of Trichoderma, ITS, tef-1, and rpb2 primers were used as multigenic analysis and were characterized as T. pubescens. Also, to test the ability of T. pubescens to suppress R. solani and enhance the tomato plants’ growth parameters, we performed an experiment composed of the following treatments: G1, untreated tomato plants (control); G2, plants inoculated by R. solani only; G3, plants treated with T. pubescens; G4, plants inoculated by R. solani and treated with T. pubescens; and, G5, plants inoculated by R. solani and treated with Uniform® fungicide.
Our results showed the ability of T. pubescens to inhibit R. solani growth by up to 76.39%, as T. pubescens grows faster than R. solani under laboratory conditions. Siameto et al. [52] studied the growth inhibition of R. solani using T. harzianum and found that the highest inhibition percentage of R. solani inhibition was 61.55%, while the lowest value was 25.88%. Guedez et al. [53] found that the growth-inhibitory activity of different isolates of T. harzianum against R. solani ranged from 62.0 to 72.0%. According to Ramrez-Cario et al. [54], Trichoderma species have a significant advantage over the pathogens Alternaria alternata and Fusarium oxysporum in the competition for nutrients and growth area. This is due to their fast rate of growth and development. Competition is a mechanism that occurs when there is a lack of nutrients and space for living. T. pubescens was evaluated for its effect on R. solani under greenhouse conditions and revealed that the severity of the disease symptoms was significantly reduced. The most frequent reason for microbial death is nutrition deficiency. A vital method of preventing plant diseases is the use of biological controls to contend for scarce nutrition [55].
T. pubescens increased the length of the shoot and root systems, as well as the fresh and dry weight of the shoot and root systems and the amount of chlorophyll compared to control plants (G1) and plants that were infected by R. solani (G2). According to our findings, tomato plants treated with T. pubescens were able to suppress R. solani in the G4 treatment. These results align with what Harman et al. [56] found about the improvement in the growth of shoot and root systems. The acquired statistics are also consistent with the findings of Yedidia et al. [57], who claimed that T. pubescens treatment had a higher impact on cucumber plants than control plants, increasing the root length by 75%, shoot length by 95%, and dry weight by 80% [57]. The amount of chlorophyll in melon plants that were treated with T. harzianum went up [58].
Tomato plants treated with T. gamsii resulted in similar findings of improved plant growth [59]. The secretion of auxins, gibberellins, and cytokinins may be responsible for increased plant growth. Their siderophore or antibiotic synthesis and direct or indirect stimulation of nutrient uptake may also contribute to the rise in biomatter production [59]. Trichoderma-secreted compounds are produced to protect plants from harmful rhizosphere organisms. Trichoderma can help plants grow by increasing soil nutrient uptake, speeding up photosynthesis, and enhancing growth parameters. This is possible because many microorganisms can produce indole-acetic acid (IAA) [60]. In addition to being crucial for root hair and lateral root development, the indole acetic acid hormone is also thought to be a major regulator for plant root and shoot growth. Trichoderma species from different regions can release IAA and promote the development of plants like tomato and cucumber [16]. Trichoderma spp. can secrete secondary metabolites like 6-n-pentyl-6H-pyran-2-one (6PP), harziandione, gliotoxin, viridin, harzianopyridone, and peptaibols, which have a significant effect as growth promoters [56].
In our study, T. pubescens effects on relative expressions of three defense-related genes (PAL, CHS, and HQT) were determined 15 days after transplanting. As mentioned before, in plants infected with R. solani, SAR was triggered, while in Trichoderma treatments, an ISR mechanism was induced [22]. Different secondary metabolites activate the expression of PR proteins through the interaction between Trichoderma and tomato plants, which triggers defense mechanisms against plant pathogens [5]. The effect of T. pubescens against R. solani is due to growth enhancement, at least partly. Many enzyme activities were involved in the interaction among the Trichoderma-plant-pathogen dilemma. The enzyme SOD has a role in the early defensive reactions. It is classified as the first detoxification phase. Superoxide anion dismutation into hydrogen peroxide is catalyzed by SOD [61]. Zehra et al. [62] stated that T. harzianum showed an increase in the activity of SOD in infected tomato plants with F. oxysporum. In our study, compared to all treatments, only plants that were treated with T. pubescens (G3) had a small amount of H2O2 built up in their leaves. In line with Zehra et al. [62], MDA concentrations increased in the tomato plants that were infected with R. solani (G2) or in combination with T. pubescens (G4) during our investigation. When Trichoderma was used to treat tomato plants (G3), the MDA levels were much lower than when plants were exposed to pathogens (G2). Our results revealed that T. pubescens improved defense and detoxification systems, which cause rapid and effective responses to pathogen inoculation. Also, when tomato is stressed by fungi, the activities of flavonoids, phenolics, PPO, CAT, and SOD may be very important for their survival. CAT is known to protect plant cells under stress exposure from ROS oxidative damage by converting ROS components into less toxic and more stable molecules like oxygen and water [63]. In our experiment, the CAT enzyme was significantly raised in plants treated with T. pubescens (G3) and T. pubescens + R. solani (G4). Masuta et al. [64] discussed that CAT might make cell walls more resistant, turn on defense genes, and increase the signal of SA.
Extracted tomato plants’ antibacterial and antifungal activities are linked to their chemical composition and the functional groups of the significant compounds (flavonoids, phenols, terpenes, chlorogenic acid, and caffeic acid) [65,66]. Many substances produced by plants, such as phenolic acids, polyphenols, flavonoids, and terpenoids, have been characterized as effective against various pathogenic microbes. HPLC analysis of tomato leaf extracts in all treatments revealed an increase in polyphenolic compound content in plants treated with T. pubescens alone (G3) or in combination with R. solani (G4) compared to control plants (G1) with values 56,032.64 µg/g and 43,031.03 µg/g, respectively. The main detected phenolic compounds were gallic acid, chlorogenic acid, caffeic acid, syringic acid, ellagic acid, coumaric acid, and cinnamic acid. In contrast, the most prevalent flavonoid compounds were catechin, rutin, naringenin, and kaempferol [67,68]. Also, tomato leaves have more flavonoids, solavetivone, lubimin, phytuberin, phytuberol, rishitin, and glutinosone. These chemicals have toxic antimicrobial properties, so they protect the plant from a wide range of pathogens and pests. Because of this, the phenolics that build up in plants treated with Trichoderma can act as electron and hydrogen donors, protecting root tissue from damage caused by oxidation when pathogens attack. The analysis of tomato leaf extracts using HPLC is consistent with tomatoes protected from the R. solani infection as detected in onions by Ortega-Garca et al. [69].

5. Conclusions

Our investigation studied the effect of T. pubescens on tomato root rot disease caused by R. solani. The study revealed that T. pubescens effectively controls R. solani in vitro and in vivo. A substantial increase in root length, plant height, shoot fresh and dry, and root fresh and dry weight was indicated after applying T. pubescens to tomato plants in vivo. The treatment with T. pubescens exhibited a lower disease index than the control. At 15 days after inoculation, promising increases in the relative expression levels of three defense-related genes (PAL, CHS, and HQT) were observed in all T. pubescens treated plants. T. pubescens G3 and G4 treatments exhibited increasing antioxidant enzyme production (POX, SOD, PPO, and CAT), and high MDA and H2O2 levels were observed in the infected plants. The HPLC results of T. pubescens G3 and G4 treatments showed increasing in chlorogenic and coumaric acids. Therefore, the ability of T. pubescens to inhibit the growth of R. solani, enhance the development of tomato plants, and induce systemic resistance supports the application of T. pubescens as a potential bioagent for managing root rot disease and productivity increase of crops.

Supplementary Materials

The following supporting information can be downloaded at: https://www.mdpi.com/article/10.3390/jof9020167/s1, Table S1: Response of tomato plants to pathogenicity of Rhizoctonia solani isolates recorded as disease index (DI%).

Author Contributions

Conceptualization, S.B., A.A. and A.H.; methodology, S.B., S.A.S., M.A., A.M.K., M.A.M., A.A. and A.H.; software, S.B., A.A. and A.H.; validation, S.B., S.A.S., M.A., A.M.K., M.A.M., A.A. and A.H.; investigation, S.B., S.A.S., M.A., A.M.K., M.A.M., A.A. and A.H.; writing—original draft preparation, S.B., A.A. and A.H.; writing—review and editing, S.B., S.A.S., M.A., A.M.K., M.A.M., A.A. and A.H.; supervision, S.B., A.M.K., M.A.M. All authors have read and agreed to the published version of the manuscript.

Funding

This research received no external funding.

Institutional Review Board Statement

Not applicable.

Informed Consent Statement

Not applicable.

Data Availability Statement

Not applicable.

Conflicts of Interest

The authors declare no conflict of interest.

References

  1. Georgé, S.; Tourniaire, F.; Gautier, H.; Goupy, P.; Rock, E.; Caris-Veyrat, C. Changes in the contents of carotenoids, phenolic compounds and vitamin C during technical processing and lyophilisation of red and yellow tomatoes. Food Chem. 2011, 124, 1603–1611. [Google Scholar] [CrossRef]
  2. Mickelbart, M.V.; Hasegawa, P.M.; Bailey-Serres, J. Genetic mechanisms of abiotic stress tolerance that translate to crop yield stability. Nat. Rev. Genet. 2015, 16, 237–251. [Google Scholar] [CrossRef] [PubMed]
  3. Abdelkhalek, A.; Hafez, E. Plant viral diseases in Egypt and their control. In Cottage Industry of Biocontrol Agents and Their Applications; Springer: Berlin/Heidelberg, Germany, 2020; pp. 403–421. [Google Scholar]
  4. Singh, N.; Raina, S.; Singh, D.; Ghosh, M.; Heflish, A. Exploitation of promising native strains of Bacillus subtilis with antagonistic properties against fungal pathogens and their PGPR characteristics. J. Plant Pathol. 2017, 99, 27–35. [Google Scholar]
  5. Heflish, A.A.; Abdelkhalek, A.; Al-Askar, A.A.; Behiry, S.I. Protective and curative effects of Trichoderma asperelloides Ta41 on tomato root rot caused by Rhizoctonia solani Rs33. Agronomy 2021, 11, 1162. [Google Scholar] [CrossRef]
  6. Channa, M.Y.; Pathan, M.A.; Solangi, G.R.; Wondiar, M. Studies on Rhizoctonia solani (Kuhn) causing root rot of lentil. Sarhad J. Agric. 1995, 11, 495–499. [Google Scholar]
  7. Halifu, S.; Deng, X.; Song, X.; Song, R. Effects of two Trichoderma strains on plant growth, rhizosphere soil nutrients, and fungal community of Pinus sylvestris var. mongolica annual seedlings. Forests 2019, 10, 758. [Google Scholar]
  8. Hahn, M. The rising threat of fungicide resistance in plant pathogenic fungi: Botrytis as a case study. J. Chem. Biol. 2014, 7, 133–141. [Google Scholar] [CrossRef] [PubMed] [Green Version]
  9. Bakade, R.R.; Sundaresha, S.; Lal, M. Management strategies and alternatives for fungicidal resistance in potato. In Pesticides-Updates on Toxicity, Efficacy and Risk Assessment; IntechOpen: London, UK, 2022; ISBN 1803560398. [Google Scholar]
  10. Lahlali, R.; Ezrari, S.; Radouane, N.; Kenfaoui, J.; Esmaeel, Q.; El Hamss, H.; Belabess, Z.; Barka, E.A. Biological control of plant pathogens: A global perspective. Microorganisms 2022, 10, 596. [Google Scholar] [CrossRef]
  11. Punja, Z.K.; Utkhede, R.S. Using fungi and yeasts to manage vegetable crop diseases. Trends Biotechnol. 2003, 21, 400–407. [Google Scholar] [CrossRef] [PubMed]
  12. Shoresh, M.; Harman, G.E. Differential expression of maize chitinases in the presence or absence of Trichoderma harzianum strain T22 and indications of a novel exo-endo-heterodimeric chitinase activity. BMC Plant Biol. 2010, 10, 136. [Google Scholar] [CrossRef] [Green Version]
  13. Vinale, F.; Marra, R.; Scala, F.; Ghisalberti, E.L.; Lorito, M.; Sivasithamparam, K. Major secondary metabolites produced by two commercial Trichoderma strains active against different phytopathogens. Lett. Appl. Microbiol. 2006, 43, 143–148. [Google Scholar] [CrossRef] [PubMed]
  14. Montero-Barrientos, M.; Hermosa, R.; Cardoza, R.E.; Gutiérrez, S.; Monte, E. Functional analysis of the Trichoderma harzianum nox1 gene, encoding an NADPH oxidase, relates production of reactive oxygen species to specific biocontrol activity against Pythium ultimum. Appl. Environ. Microbiol. 2011, 77, 3009–3016. [Google Scholar] [CrossRef] [Green Version]
  15. Tapwal, A.; Pandey, H. In vitro evaluation of Trichoderma species for virulence efficacy on Botryodiplodia palmarum. Curr. Life Sci. 2016, 2, 86–91. [Google Scholar]
  16. Halifu, S.; Deng, X.; Song, X.; Song, R.; Liang, X. Inhibitory mechanism of Trichoderma virens ZT05 on Rhizoctonia solani. Plants 2020, 9, 912. [Google Scholar] [CrossRef] [PubMed]
  17. Kredics, L.; Chen, L.; Kedves, O.; Büchner, R.; Hatvani, L.; Allaga, H.; Nagy, V.D.; Khaled, J.M.; Alharbi, N.S.; Vágvölgyi, C. Molecular tools for monitoring Trichoderma in agricultural environments. Front. Microbiol. 2018, 9, 1599. [Google Scholar] [CrossRef] [PubMed]
  18. Berini, F.; Caccia, S.; Franzetti, E.; Congiu, T.; Marinelli, F.; Casartelli, M.; Tettamanti, G. Effects of Trichoderma viride chitinases on the peritrophic matrix of Lepidoptera. Pest Manag. Sci. 2016, 72, 980–989. [Google Scholar] [CrossRef]
  19. Xiong, H.; Xue, K.; Qin, W.; Chen, X.; Wang, H.; Shi, X.; Ma, T.; Sun, Z.; Chen, W.; Tian, X. Does soil treated with conidial formulations of Trichoderma spp. attract or repel subterranean termites? J. Econ. Entomol. 2018, 111, 808–816. [Google Scholar] [CrossRef] [PubMed]
  20. Woo, S.L.; Lorito, M. Exploiting the interactions between fungal antagonists, pathogens and the plant for biocontrol. In Novel Biotechnologies for Biocontrol Agent Enhancement and Management; Springer: Berlin/Heidelberg, Germany, 2007; pp. 107–130. [Google Scholar]
  21. Malmierca, M.G.; Barua, J.; McCormick, S.P.; Izquierdo-Bueno, I.; Cardoza, R.E.; Alexander, N.J.; Hermosa, R.; Collado, I.G.; Monte, E.; Gutiérrez, S. Novel aspinolide production by T richoderma arundinaceum with a potential role in Botrytis cinerea antagonistic activity and plant defence priming. Environ. Microbiol. 2015, 17, 1103–1118. [Google Scholar] [CrossRef] [PubMed]
  22. Mukherjee, P.K.; Horwitz, B.A.; Herrera-Estrella, A.; Schmoll, M.; Kenerley, C.M. Trichoderma research in the genome era. Annu. Rev. Phytopathol. 2013, 51, 105–129. [Google Scholar] [CrossRef] [PubMed]
  23. Heflish, A.I.A.I.; Singh, N.; Raina, S.; Buttar, D.S. Evaluation of Trichoderma isolates against Rhizoctonia solani and Rhizoctonia oryzae causing sheath blight of rice. Plant Dis. Res. 2017, 32, 36–46. [Google Scholar]
  24. Elad, Y.; Chet, I.; Katan, J. Trichoderma harzianum: A biocontrol agent effective against Sclerotium rolfsii and Rhizoctonia solani. Phytopathology 1980, 70, 119–121. [Google Scholar] [CrossRef] [Green Version]
  25. Fahmi, A.I.; Al-Talhi, A.D.; Hassan, M.M. Protoplast fusion enhances antagonistic activity in Trichoderma spp. Nat. Sci. 2012, 10, 100–106. [Google Scholar]
  26. Singh, G.; Milne, K.S. Laboratory evaluation of fungicides against fungi causing flower blight of chrysanthemums. N. Z. J. Exp. Agric. 1974, 2, 181–183. [Google Scholar] [CrossRef]
  27. Carbone, I.; Kohn, L.M. A method for designing primer sets for speciation studies in filamentous ascomycetes. Mycologia 1999, 91, 553–556. [Google Scholar] [CrossRef]
  28. Samuels, G.J.; Dodd, S.L.; Gams, W.; Castlebury, L.A.; Petrini, O. Trichoderma species associated with the green mold epidemic of commercially grown Agaricus bisporus. Mycologia 2002, 94, 146–170. [Google Scholar] [CrossRef]
  29. Abdelkhalek, A.; Behiry, S.I.; Al-Askar, A.A. Bacillus velezensis PEA1 inhibits Fusarium oxysporum growth and induces systemic resistance to Cucumber mosaic virus. Agronomy 2020, 10, 1312. [Google Scholar] [CrossRef]
  30. White, T.J.; Bruns, T.; Lee, S.; Taylor, J. Amplification and direct sequencing of fungal ribosomal RNA genes for phylogenetics. PCR Protoc. Guid. Methods Appl. 1990, 18, 315–322. [Google Scholar]
  31. Liu, Y.J.; Whelen, S.; Hall, B.D. Phylogenetic relationships among ascomycetes: Evidence from an RNA polymerse II subunit. Mol. Biol. Evol. 1999, 16, 1799–1808. [Google Scholar] [CrossRef] [Green Version]
  32. Hatvani, L.; Antal, Z.; Manczinger, L.; Szekeres, A.; Druzhinina, I.S.; Kubicek, C.P.; Nagy, A.; Nagy, E.; Vágvölgyi, C.; Kredics, L. Green mold diseases of Agaricus and Pleurotus spp. are caused by related but phylogenetically different Trichoderma species. Phytopathology 2007, 97, 532–537. [Google Scholar] [CrossRef] [Green Version]
  33. Wurz, R.P.; Charette, A.B. Doubly activated cyclopropanes as synthetic precursors for the preparation of 4-nitro-and 4-cyano-dihydropyrroles and pyrroles. Org. Lett. 2005, 7, 2313–2316. [Google Scholar] [CrossRef]
  34. André, C.M.; Schafleitner, R.; Legay, S.; Lefèvre, I.; Aliaga, C.A.A.; Nomberto, G.; Hoffmann, L.; Hausman, J.-F.; Larondelle, Y.; Evers, D. Gene expression changes related to the production of phenolic compounds in potato tubers grown under drought stress. Phytochemistry 2009, 70, 1107–1116. [Google Scholar] [CrossRef] [PubMed]
  35. Abdeljalil, N.O.-B.; Vallance, J.; Gerbore, J.; Bruez, E.; Martins, G.; Rey, P.; Daami-Remadi, M. Biocontrol of Rhizoctonia root rot in tomato and enhancement of plant growth using rhizobacteria naturally associated to tomato. J. Plant Pathol. Microbiol. 2016, 7, 1000356. [Google Scholar] [CrossRef] [Green Version]
  36. Abdelkhalek, A.; Sanan-Mishra, N. Differential expression profiles of tomato miRNAs induced by Tobacco mosaic virus. J. Agric. Sci. Technol. 2019, 21, 475–485. [Google Scholar]
  37. Behiry, S.I.; Ashmawy, N.A.; Abdelkhalek, A.A.; Younes, H.A.; Khaled, A.E.; Hafez, E.E. Compatible- and incompatible-type interactions related to defense genes in potato elucidation by Pectobacterium carotovorum. J. Plant Dis. Prot. 2018, 125, 197–204. [Google Scholar] [CrossRef]
  38. Abdelkhalek, A.; Dessoky, E.S.; Hafez, E. Polyphenolic genes expression pattern and their role in viral resistance in tomato plant infected with Tobacco mosaic virus. Biosci. Res. 2018, 15, 3349–3356. [Google Scholar]
  39. Livak, K.J.; Schmittgen, T.D. Analysis of relative gene expression data using real-time quantitative PCR and the 2(-Delta Delta C(T)) Method. Methods 2001, 25, 402–408. [Google Scholar] [CrossRef]
  40. Heath, R.L.; Packer, L. Photoperoxidation in isolated chloroplasts: I. Kinetics and stoichiometry of fatty acid peroxidation. Arch. Biochem. Biophys. 1968, 125, 189–198. [Google Scholar] [CrossRef]
  41. Junglee, S.; Urban, L.; Sallanon, H.; Lopez-Lauri, F. Optimized assay for hydrogen peroxide determination in plant tissue using potassium iodide. Am. J. Anal. Chem. 2014, 5, 730–736. [Google Scholar] [CrossRef] [Green Version]
  42. Zhu, G.L.; Zhong, H.W.; Zhang, A.Q. Plant Physiology Experimentation; Peking University Press: Beijing, China, 1990. [Google Scholar]
  43. Moerschbacher, B.M.; Noll, U.M.; Flott, B.E.; Reisener, H.-J. Lignin biosynthetic enzymes in stem rust infected, resistant and susceptible near-isogenic wheat lines. Physiol. Mol. Plant Pathol. 1988, 33, 33–46. [Google Scholar] [CrossRef]
  44. Cakmak, I.; Marschner, H. Magnesium deficiency and high light intensity enhance activities of superoxide dismutase, ascorbate peroxidase, and glutathione reductase in bean leaves. Plant Physiol. 1992, 98, 1222–1227. [Google Scholar] [CrossRef] [Green Version]
  45. Beauchamp, C.; Fridovich, I. Superoxide dismutase: Improved assays and an assay applicable to acrylamide gels. Anal. Biochem. 1971, 44, 276–287. [Google Scholar] [CrossRef]
  46. Kumar, A.; Dutt, S.; Bagler, G.; Ahuja, P.S.; Kumar, S. Engineering a thermo-stable superoxide dismutase functional at sub-zero to >50 °C, which also tolerates autoclaving. Sci. Rep. 2012, 2, 387. [Google Scholar] [CrossRef] [PubMed] [Green Version]
  47. Abdelkhalek, A.; Al-Askar, A.A.; Alsubaie, M.M.; Behiry, S.I. First Report of protective activity of Paronychia argentea extract against Tobacco mosaic virus infection. Plants 2021, 10, 2435. [Google Scholar] [CrossRef] [PubMed]
  48. El-Kazzaz, M.K.; Ghoneim, K.E.; Agha, M.K.M.; Helmy, A.; Behiry, S.I.; Abdelkhalek, A.; Saleem, M.H.; Al-Askar, A.A.; Arishi, A.A.; Elsharkawy, M.M. Suppression of pepper root rot and wilt diseases caused by Rhizoctonia solani and Fusarium oxysporum. Life 2022, 12, 587. [Google Scholar] [CrossRef]
  49. Sharma, A. Fungi as Biological Control Agents. In Biofertilizers for Sustainable Agriculture and Environment; Springer: Berlin/Heidelberg, Germany, 2019; pp. 395–411. [Google Scholar]
  50. Abdelkhalek, A.; Aseel, D.G.; Király, L.; Künstler, A.; Moawad, H.; Al-Askar, A.A. Induction of systemic resistance to Tobacco mosaic virus in tomato through foliar application of Bacillus amyloliquefaciens Strain TBorg1 culture filtrate. Viruses 2022, 14, 1830. [Google Scholar] [CrossRef]
  51. Lamenew, F.; Mekonnen, H.; Gashaw, T. Biocontrol potential of Trichoderma and yeast against post harvest fruit fungal diseases: A review. World News Nat. Sci. 2019, 27, 153–173. [Google Scholar]
  52. Siameto, E.N.; Okoth, S.; Amugune, N.O.; Chege, N.C. Antagonism of Trichoderma harzianum isolates on soil borne plant pathogenic fungi from Embu District, Kenya. J. Yeast Fungal Res. 2010, 1, 47–54. [Google Scholar]
  53. Guédez, C.; Cañizalez, L.; Castillo, C.; Olivar, R. Evaluación in vitro de aislamientos de Trichoderma harzianum para el control de Rhizoctonia solani, Sclerotium rolfsii y Fusarium oxysporum en plantas de tomate. Rev. Soc. Venez. Microbiol. 2012, 32, 44–49. [Google Scholar]
  54. Ramírez-Cariño, H.F.; Guadarrama-Mendoza, P.C.; Sánchez-López, V.; Cuervo-Parra, J.A.; Ramírez-Reyes, T.; Dunlap, C.A.; Valadez-Blanco, R. Biocontrol of Alternaria alternata and Fusarium oxysporum by Trichoderma asperelloides and Bacillus paralicheniformis in tomato plants. Antonie Van Leeuwenhoek 2020, 113, 1247–1261. [Google Scholar] [CrossRef]
  55. Sood, M.; Kapoor, D.; Kumar, V.; Sheteiwy, M.S.; Ramakrishnan, M.; Landi, M.; Araniti, F.; Sharma, A. Trichoderma: The “secrets” of a multitalented biocontrol agent. Plants 2020, 9, 762. [Google Scholar] [CrossRef]
  56. Harman, G.E.; Howell, C.R.; Viterbo, A.; Chet, I.; Lorito, M. Trichoderma species—Opportunistic, avirulent plant symbionts. Nat. Rev. Microbiol. 2004, 2, 43–56. [Google Scholar] [CrossRef] [PubMed]
  57. Yedidia, I.; Srivastva, A.K.; Kapulnik, Y.; Chet, I. Effect of Trichoderma harzianum on microelement concentrations and increased growth of cucumber plants. Plant Soil 2001, 235, 235–242. [Google Scholar] [CrossRef]
  58. Tchameni, S.N.; Sameza, M.L.; O’Donovan, A.; Fokom, R.; Mangaptche Ngonkeu, E.L.; Wakam Nana, L.; Etoa, F.-X.; Nwaga, D. Antagonism of Trichoderma asperellum against Phytophthora megakarya and its potential to promote cacao growth and induce biochemical defence. Mycology 2017, 8, 84–92. [Google Scholar] [CrossRef] [Green Version]
  59. Sundaramoorthy, S.; Balabaskar, P. Biocontrol efficacy of Trichoderma spp. against wilt of tomato caused by Fusarium oxysporum f. sp. lycopersici. J. Appl. Biol. Biotechnol. 2013, 1, 036–040. [Google Scholar]
  60. Casimiro, I.; Marchant, A.; Bhalerao, R.P.; Beeckman, T.; Dhooge, S.; Swarup, R.; Graham, N.; Inzé, D.; Sandberg, G.; Casero, P.J. Auxin transport promotes Arabidopsis lateral root initiation. Plant Cell 2001, 13, 843–852. [Google Scholar] [CrossRef] [PubMed] [Green Version]
  61. Ighodaro, O.M.; Akinloye, O.A. First line defence antioxidants-superoxide dismutase (SOD), catalase (CAT) and glutathione peroxidase (GPX): Their fundamental role in the entire antioxidant defence grid. Alexandria J. Med. 2018, 54, 287–293. [Google Scholar] [CrossRef] [Green Version]
  62. Zehra, A.; Meena, M.; Dubey, M.K.; Aamir, M.; Upadhyay, R.S. Synergistic effects of plant defense elicitors and Trichoderma harzianum on enhanced induction of antioxidant defense system in tomato against Fusarium wilt disease. Bot. Stud. 2017, 58, 44. [Google Scholar] [CrossRef] [Green Version]
  63. Garg, N.; Manchanda, G. ROS generation in plants: Boon or bane? Plant Biosyst. 2009, 143, 81–96. [Google Scholar] [CrossRef]
  64. Masuta, C.; Inaba, J.; Shimura, H. The 2b proteins of Cucumber mosaic virus generally have the potential to differentially induce necrosis on Arabidopsis. Plant Signal. Behav. 2012, 7, 43–45. [Google Scholar] [CrossRef] [Green Version]
  65. Kim, D.S.; Na, H.; Kwack, Y.; Chun, C. Secondary metabolite profiling in various parts of tomato plants. Hortic. Sci. Technol. 2014, 32, 252–260. [Google Scholar] [CrossRef] [Green Version]
  66. Kim, D.S.; Kwack, Y.; Lee, J.H.; Chun, C. Antimicrobial activity of various parts of tomato plants varied with different solvent extracts. Plant Pathol. J. 2019, 35, 149. [Google Scholar] [CrossRef] [PubMed]
  67. Ejike, C.E.C.C.; Gong, M.; Udenigwe, C.C. Phytoalexins from the Poaceae: Biosynthesis, function and prospects in food preservation. Food Res. Int. 2013, 52, 167–177. [Google Scholar] [CrossRef]
  68. Sharifi-Rad, M.; Varoni, E.M.; Iriti, M.; Martorell, M.; Setzer, W.N.; del Mar Contreras, M.; Salehi, B.; Soltani-Nejad, A.; Rajabi, S.; Tajbakhsh, M. Carvacrol and human health: A comprehensive review. Phyther. Res. 2018, 32, 1675–1687. [Google Scholar] [CrossRef] [PubMed]
  69. Ortega-García, J.G.; Montes-Belmont, R.; Rodríguez-Monroy, M.; Ramírez-Trujillo, J.A.; Suárez-Rodríguez, R.; Sepúlveda-Jiménez, G. Effect of Trichoderma asperellum applications and mineral fertilization on growth promotion and the content of phenolic compounds and flavonoids in onions. Sci. Hortic. 2015, 195, 8–16. [Google Scholar] [CrossRef]
Figure 1. Inhibition effect of Trichoderma isolates against R. solani growth under laboratory conditions; Trichoderma isolates (1–12) and control (13).
Jof 09 00167 g001
Figure 2. Response of R. solani isolate to different fungicides at 1 ppm concentration. The fungicides were Uniform® (A), Hattrick® (B), and Rizolex® (C) compared with control (D).
Jof 09 00167 g002
Figure 3. Cladogram of Trichoderma spp. sequences aligned with T. pubescens strain Tp21 upon partial sequences of ITS, tef-1, and rpb2 according to the maximum likelihood method.
Jof 09 00167 g003
Figure 4. A relative expression values of the PAL, CHS, and HQT genes at 15 days after transplanting in different treatments. a.u: arbitrary units. Significant differences are represented by the various letters (a–e) at p-value ≤ 0.05. G1 = untreated tomato plants (control), G2 = plants inoculated by R. solani only, G3 = plants treated with Trichoderma pubescens, G4 = plants inoculated by R. solani and treated with T. pubescens and, G5 = plants inoculated by R. solani and treated with Uniform® fungicide.
Jof 09 00167 g004
Figure 5. Estimated oxidative stress markers for H2O2 and MDA in tomato plants under greenhouse conditions. Significant differences are represented by the various letters (a–c) at p-value ≤ 0.05. G1 = untreated tomato plants (control), G2 = plants inoculated by R. solani only, G3 = plants treated with Trichoderma pubescens, G4 = plants inoculated by R. solani and treated with T. pubescens and, G5 = plants inoculated by R. solani and treated with Uniform® fungicide.
Jof 09 00167 g005
Figure 6. Activities of antioxidant enzymes in tomato plants with T. pubescens and inoculated with R. solani. Significant differences are represented by the various letters (a–d) at p-value ≤ 0.05. G1 = untreated tomato plants (control), G2 = plants inoculated by R. solani only, G3 = plants treated with Trichoderma pubescens, G4 = plants inoculated by R. solani and treated with T. pubescens and, G5 = plants inoculated by R. solani and treated with Uniform® fungicide.
Jof 09 00167 g006
Figure 7. Identified polyphenolic substances by HPLC chromatography in ethanol extract of tomato leaves 15 days after transplanting of various treatments. G1 = untreated plants (Control), G2 = plants inoculated with R. solani, G3 = treatment with T. pubescens, G4 = plants inoculated with R. solani and T. pubescens and, G5 = plants inoculated with R. solani and Uniform® fungicide.
Jof 09 00167 g007
Table 1. List of sequences of primer nucleotide used in this study.
GeneAmplified RegionPrimer
Direction
Sequence (5’-3’)References
ITSInternal transcribed spacerITS1TCCGTAGGTGAACCTGCGG[30]
ITS4TCCTCCGCTTATTGATATGC
Rpb2RNA polymerase II subunit 2fRPB2-5fGAYGAYMGWGATCAYTTYGG[31]
fRPB2-7crCCCATRGCTTGYTTRCCCAT
Tef-1Translation elongation factor 1 alphaEF1-728FCATCGAGAAGTTCGAGAAGG[32]
TEF1LLErevAACTTGCAGGCAATGTGG
PALPhenylalanine ammonia-lyasePAL-fACGGGTTGCCATCTAATCTGACA[33]
PAL-rCGAGCAATAAGAAGCCATCGCAAT
HQTHydroxycinnamoyl Co A quinate hydroxycinnamoyl transferaseHQT-fCCCAATGGCTGGAAGATTAGCTA[34]
HQT-rCATGAATCACTTTCAGCCTCAACAA
CHSChalcone synthaseCHS-fCACCGTGGAGGAGTATCGTAAGGC[34]
CHS-rTGATCAACACAGTTGGAAGGCG
Table 2. Efficacy of Trichoderma isolates on R. solani growth compared with control in vitro.
TreatmentsInhibition % ± SD *
T170.74 ± 2.57 c
T268.52 ± 3.39 c
T376.93 ± 3.21 a
T461.85 ± 4.49 d
T568.52 ± 3.21 c
T668.52 ± 3.21 c
T770.37 ± 3.21 c
T862.96 ± 3.21 d
T974.07 ± 3.21 b
T1069.26 ± 0.64 c
T1174.07 ± 1.70 b
T1274.44 ± 2.94 b
Control00.00 ± 0.00 e
* SD means standard deviation. Different letters alongside the inhibition % data values mean the values were significantly different at p-value ≤ 0.05.
Table 3. Effect of Trichoderma pubescens on Rhizoctonia solani disease index (DI%) and chlorophyll content on tomato plants in vivo.
TreatmentDisease Index ± SD *Total Chlorophyll Content (SPAD) ± SD
G100.00 ± 0.00 c35.27 ± 0.90 b
G278.67 ± 5.58 a23.63 ± 1.07 c
G300.00 ± 0.00 c37.70 ± 0.70 a
G416.00 ± 3.65 b36.70 ± 0.79 ab
G514.67 ± 5.54 b35.10 ± 1.0 ab
* SD means standard deviation. Different letters alongside data values in each column mean the values differed significantly at p-value ≤ 0.05. G1 = untreated tomato plants (control), G2 = plants inoculated by R. solani only, G3 = plants treated with Trichoderma pubescens; G4 = plants inoculated by R. solani and treated with T. pubescens and, G5 = plants inoculated by R. solani and treated with Uniform® fungicide.
Table 4. Effect of various treatments on tomato plants growth parameters under greenhouse conditions.
Treatments **Length (cm) ± SD *Fresh Weight (g) ± SDDry Weight (g) ± SD
ShootRootShootRootShootRoot
G113.30 ± 0.79 b06.23 ± 0.06 d4.40 ± 0.10 b2.03 ± 0.32 b1.87 ± 0.15 ab0.93 ± 0.15 b
G211.10 ± 1.11 b04.93 ± 0.38 e2.63 ± 0.15 c1.10 ± 0.20 b1.57 ± 0.31 b0.40 ± 0.10 c
G321.27 ± 0.64 a10.37 ± 0.12 a6.10 ± 0.53 a3.40 ± 0.10 a2.47 ± 0.25 a1.47 ± 0.15 a
G419.23 ± 1.44 a09.23 ± 0.49 b5.38 ± 0.13 a3.23 ± 0.12 a2.37 ± 0.55 ab1.37 ± 0.06 a
G513.27 ± 0.40 b07.07 ± 0.21 c4.53 ± 0.32 b1.70 ± 0.10 b1.90 ± 0.10 ab0.83 ± 0.23 b
* SD means standard deviation. Different letters alongside data values in each column mean the values differed significantly at the p-value ≤ 0.05. ** G1 = untreated tomato plants (control), G2 = plants inoculated by R. solani only, G3 = plants treated with Trichoderma pubescens, G4 = plants inoculated by R. solani and treated with T. pubescens and, G5 = plants inoculated by R. solani and treated with Uniform® fungicide.
Table 5. Polyphenolic compounds in ethanolic tomato leaf extracts using HPLC analysis.
CompoundConcentration (µg/g)
G1 *G2G3G4G5
Gallic acid1367.532294.844254.701275.362776.91
Chlorogenic acid7875.705158.179981.899613.279282.39
Ferulic acid1136.841581.691619.091839.911473.40
Methyl gallate133.15168.65282.46291.74489.70
Coffeic acid1235.52903.821319.001430.011231.44
Syringic acid81.76126.33152.03217.20204.89
Ellagic acid0.000.000.001190.751083.84
Coumaric acid136.32143.42294.12173.35237.75
Cinnamic acid17.009.2215.4617.0711.73
Vanillin619.55586.14709.761071.24805.74
Catechin0.000.001251.230.00538.17
Rutin19,975.1121,819.7732,046.7421,580.3020,416.05
Naringenin500.19606.62598.33598.06548.08
Daidzein1546.992003.502671.253040.661650.84
Querectin68.89189.53298.64211.84287.75
Apigenin0.000.0022.6835.330.00
Kaempferol511.380.00515.26444.950.00
Total35,205.9135,591.7056,032.6443,031.0341,038.68
* G1 = untreated plants (Control), G2 = plants inoculated with R. solani, G3 = treatment with T. pubescens, G4 = plants inoculated with R. solani and T. pubescens and, G5 = plants inoculated with R. solani and Uniform® fungicide.
Disclaimer/Publisher’s Note: The statements, opinions and data contained in all publications are solely those of the individual author(s) and contributor(s) and not of MDPI and/or the editor(s). MDPI and/or the editor(s) disclaim responsibility for any injury to people or property resulting from any ideas, methods, instructions or products referred to in the content.

