
Reprogramming of Fundamental miRNA and Gene Expression during the Barley-Piriformospora indica Interaction

1
School of Chemical Engineering and Technology, Hebei University of Technology, Tianjin 300401, China
2
Tianjin Key Laboratory of Structure and Performance for Functional Molecules, College of Chemistry, Tianjin Normal University, Tianjin 300387, China
*
Authors to whom correspondence should be addressed.
J. Fungi 2023, 9(1), 24; https://doi.org/10.3390/jof9010024
Submission received: 12 November 2022
/
Revised: 7 December 2022
/
Accepted: 19 December 2022
/
Published: 23 December 2022
(This article belongs to the Topic Interaction between Plants and Fungi and Oomycetes)
Abstract
:The interactions between plants and microorganisms, which are widely present in the microbial-dominated rhizosphere, have been studied. This association is highly beneficial to the organisms involved, as plants benefit soil microorganisms by providing them with metabolites, while microorganisms promote plant growth and development by promoting nutrient uptake and/or protecting the plant from biotic and abiotic stresses. Piriformospora indica, an endophytic fungus of Sebacinales, colonizes the roots of a wide range of host plants and establishes various benefits for the plants. In this work, an interaction between barley and the P. indica was established to elucidate microRNA (miRNA)-based regulatory changes in miRNA profiles and gene expression that occurred during the symbiosis. Growth promotion and vigorous root development were confirmed in barley colonized by P. indica. The genome-wide expression profile analysis of miRNAs in barley root showed that 7,798,928, 6,418,039 and 7,136,192 clean reads were obtained from the libraries of mock, 3 dai and 7 dai roots, respectively. Sequencing of the barley genome yielded in 81 novel miRNA and 450 differently expressed genes (DEGs). Additionally, 11, 24, 6 differentially expressed microRNAs (DEMs) in barley were found in the three comparison groups, including 3 dai vs. mock, 7 dai vs. mock and 7 dai vs. 3 dai, respectively. The predicted target genes of these miRNAs are mainly involved in transcription, cell division, auxin signal perception and transduction, photosynthesis and hormone stimulus. Transcriptome analysis of P. indica identified 667 and 594 differentially expressed genes (DEG) at 3 dai and 7 dai. Annotation and GO (Gene Ontology) analysis indicated that the DEGs with the greatest changes were concentrated in oxidoreductase activity, ion transmembrane transporter activity. It implies that reprogramming of fundamental miRNA and gene expression occurs both in barley and P. indica. Analysis of global changes in miRNA profiles of barley colonized with P. indica revealed that several putative endogenous barley miRNAs expressed upon colonization belonging to known micro RNA families involved in growth and developmental regulation.
1. Introduction
The interactions between plants and microorganisms, which are widely present in the microbial-dominated rhizosphere, have been well studied. This association is highly beneficial to the organisms involved, as plants benefit soil microorganisms by providing them with metabolites, while microorganisms promote plant growth and development by promoting nutrient uptake and/or protecting the plant from biotic and abiotic stresses [1,2]. The establishment and maintenance of mutualism requires genetic and epigenetic reprogramming and metabolomic regulation through the exchange of effector molecules between beneficial microorganisms and plants [3,4]. Beneficial microorganisms have a major role in crop production because of their impact on plant health and yield. Piriformospora indica (P. indica) is an endophytic fungus, belonging to the order Sebacinales that colonizes the roots of both monocotyledons and dicotyledons plants [5]. P. indica serves as an excellent model for beneficial microbes as it can form a mutually beneficial symbiosis with a series of crops such as Chinese cabbage, rice, wheat, cucumber, onion and banana, which can effectively promote their growth, nutrient absorption, accumulation of secondary metabolites, and resistance to disease damage [6,7,8,9,10,11,12]. P. indica has great potential in biological control and soil improvement and thus can play a positive role in agricultural production.
MicroRNAs (miRNAs) are a class of endogenous small noncoding RNAs (ncRNAs) which is evolutionary conserved and contains approximately 20–22 nucleotides [13,14]. They participate in the regulating gene expression and multiple physiological and biochemical processes by complementary functions with target gene mRNA. Many studies have shown that plant miRNAs play an important regulatory role in the interaction between plants and soil microbes, including promoting plant growth and development, stress response and hormone transduction [15]. MiRNAs recognize their mRNA target genes based on near-perfect complementarity and direct degradation or translational repression of homologous mRNA targets [16]. In addition, they tend to act as “early” regulators of signal transduction at the level of transcription factors (TFS) in various systems [17,18]. MiRNAs respond rapidly to infection by symbiotic bacteria. In soybean roots, a group of miRNAs which target a wide range of mRNAs were intensively up-or down-regulated by infection with the rhizobium bacterium Brodyrnia japonicum [19,20]. In the process of symbiosis, miRNAs were involved in the regulation of plant nutrient balance [21,22], hormone homeostasis and signal transduction [19], and spatial and temporal development of symbiosis nodules [20,23].
In addition, miRNAs also play a regulatory role in the process of abiotic stress in plants. Li et al. [24] found that after silencing BnmiR169n in rape seed, the drought tolerance of plants increased due to the increase of its target gene BnNFYA8. Under salt stress, the expression of miR169q in maize was inhibited and the expression of its target gene ZmNFYA8 was upregulated. ZmNFYA8 binds to the promoter of the antioxidant enzyme gene zmper1 and activates its expression, alleviating the toxic effect of ROS on plants and improving maize salt tolerance [25]. The research on tomato by Zhang et al. [26] also verified that miR394 was involved in the negative regulation of biological stress. The overexpression of miR394 inhibited the expression of its target gene LCR, and then inhibited JA synthesis-related genes, thus reducing the resistance of tomato to Phytophthora. It is found that MiR164 plays an important role in wheat leaf rust and poplar black spot defense [27,28].
The role of miRNAs as gene expression regulators in Sebacinalean symbiosis has been largely unexplored. Previous studies have shown that P. indica can induce root growth of Oncidium orchid which is closely related to microRNA [29]. Results indicated that the predicted miRNAs target genes are mainly participated in auxin signal perception and transduction, transcription, development, and plant defense. Several novel unique miRNAs were detected, for which a function could not yet be identified. Another research revealed fundamental sRNA and gene expression reprogramming at the onset of symbiosis between P. indica and the model grass species Brachypodium distachyon [30]. Their data suggests that a Sebacinalean symbiosis involves reciprocal sRNA targeting of genes during the interaction.
Based on comprehensive high-throughput sequencing and transcriptome analysis, we evaluated an interaction between barley and the beneficial fungal root endophyte P. indica to elucidate miRNA regulatory changes in gene expression and miRNA–mRNA interaction profiles. Additionally, we discuss the biological functions and potential regulatory mechanisms of miRNAs in barley growth and possible miRNA-based regulation that might be crucial for the establishment of the barely-P. indica symbiosis. This study will contribute to our understanding of the RNA-based growth promotion mechanism mediated by P. indica colonization.
2. Methods
2.1. P. indica and Barley Cultivation and Inoculation
Piriformospora indica (11,827, Gift from IPAZ, Institute of Phytopathology, Giessen, Germany) was grown on complete media plates (CM [31]) at 23 °C in dark for one month. P. indica mycelium collection was carried out according to reference [32].
The seeds of barley line (gift from Tianjin Academy of Agricultural Sciences, JINNONG 8) were surface sterilized for 20 min with 3% active chlorine, sodium hypochlorite solution, and washed five times, then seeds were soaked in chlamydospore suspensions of P. indica (1 × 10⁵/mL) for 30 min. Control seeds were treated with Tween 20 (0.002%, v/v) solution as mock. The mock and soaking seeds (SS) were sown at the same time, with three replicates for each treatment. Barley biomass analyses were performed on seedlings grown on soil under 8 h dark (18 °C) and 16 h light (160 μmol m−2 s−1, 22 °C) conditions at 65% relative humidity for 4 weeks.
Samples for RNA-seq and RT-qPCR were also grown under these conditions. To assess growth promotion in P. indica inoculated barley relative to the control, we used the pairwise t test or the Mann–Whitney–Wilcoxon test on each of the three repetitions of experiments, after checking for normality and homogenous variances. Benjamini-Hochberg correction for multiple testing was used to correct the p values and the significance asterisks were assigned to the average p-value as follows: * for p ≤ 0.05, ** for p ≤ 0.001, and *** for p ≤ 0.0001.
2.2. Small RNA Library Construction and Sequencing
According to TRIzol (Invitrogen, #15,596-018) method, roots infected with P. indica at 3 and 7 days after inoculation (dai)or mock were collected, respectively. All samples were grounded into fine powder in liquid nitrogen for three independent repetitions. RNA degradation and contamination were monitored on 1% agarose gels. NanoPhotometer® Spectrophotometer (IMPLEN, Carlsbad, CA, USA), Qubit® RNA Assay Kit in Qubit® 2.0 Flurometer (Life Technologies, Carlsbad, CA, USA) and RNA Nano 6000 Assay kit of Bioanalyzer 2100 system (Agilent Technologies, Santa Clara, CA, USA) were applied to check RNA purity, RNA concentration, and RNA integrity, respectively. Samples were subjected to small RNA Solexa sequencing in Novogene (Tianjin, China). Briefly, the small-molecule RNAs were separated by 15% (w/v) PAGE (18–30 nt), and then the purified small molecule RNAs were ligated to a pair of Solexa adaptors to the 59 and 39 ends, reverse transcribed to cDNA using a RT primer, and finally amplified by PCR and sequenced. The RNA-seq data have been submitted to the Sequence Read Archive (SRA) on NCBI website, and the accession number is PRJNA898289.
2.3. Novel miRNA Prediction
The characteristics of hairpin structure of miRNA precursor could be used to predict novel miRNA. We used miREvo [33] and mirdeep2 [34] to predict novel miRNAs and the minimum free energy of the small RNA tags unannotated in the former steps. At the same time, custom scripts were used to obtain the identified miRNA counts as well as base bias on the first position with certain length and on each position of all identified miRNAs, respectively.
2.4. Co-Expression Analysis of mRNA-miRNA
The functional annotation of identified miRNAs was performed using co-expression analysis [35]. Pearson’s correlation coefficients between mRNAs and miRNAs were calculated based on the mRNAs FPKM values, and the putative target mRNA should have a value >0.99 or <−0.99. In addition, the TargetFinder [36] was used to predict the target mRNA of the miRNA. The mRNA–miRNA network was constructed using Cytoscape [37] software (Version 3.0.2) based on the correlations between mRNAs and miRNAs.
2.5. GO and KEGG Enrichment Analysis of Differentially Expressed Genes
Gene Ontology (GO) enrichment analysis of differentially expressed genes was implemented by the cluster Profiler R package, in which gene length bias was corrected. GO terms with corrected p-value less than 0.05 were considered significantly enriched by differential expressed genes. The Kyoto Encyclopedia of Genes and Genomes (KEGG) is a database resource for understanding high-level functions and utilities of the biological system, such as the cell, the organism, and the ecosystem, from molecular-level information, especially large-scale molecular data sets generated by genome sequencing and other high-throughput experimental technologies (http://www.genome.jp/kegg/ (accessed on 12 November 2022)). We used cluster Profiler R package and KOBAS software to test the statistical enrichment of differential expression genes. The term with a corrected p-value < 0.05 is considered to be significantly enriched in differentially expressed genes.
2.6. Quantitative Real Time Polymerase Chain Reaction (qRT-PCR) and Stem-Loop PCR for Validation of Sequencing Results
The RNA collected in 2.2 and M-MLV Reverse Transcriptase were used to make cDNA. After treatment with Dnase I (Sigma, Germany), the cDNA was used as a template for qRT-PCR to quantify selected miRNAs and mRNAs using the miRNA-specific primers and target mRNA specific primers [38]. The expression level of respective gene was determined by quantitative RT-PCR. Quantitative RT-PCR was measured by SYBR Green influorescence method as described previously. In brief, qPCR experiments were conducted on a Light Cycler96 Fast real-time PCR system (Roche). The reaction solution contains 2 × Ultra SYBR Mixture 10 µL, 100 ng cDNA template, 10 µM forward and reverse primers. HvUBIQUTIN was used as the control, and all experiments were conducted with at least three technical replications. The amplification program was applied as the following steps: the first initial activation step was performed at 95 °C, 5 min, then followed by 30 cycles (95 °C for 20 s, 56 °C for 35 s, 72 °C for 35 s, and 65 °C for 20 s). At the end of each cycle, melting curves were determined respectively to guarantee the amplification of the single-PCR product.
For the identification of miRNAs in barley, stem-loop RT-PCR was referenced [39].
Briefly, cDNA was synthesized from total RNA extracted from P. indica inoculated barley roots. Hairpin primer was designed and performed according to literature [40]. For each stem-loop reaction, the detail protocol was performed according to the manufacturer’s instructions (Thermo Scientific, Waltham, MA, USA).
For primer annealing, the reaction was incubated at 16 °C for 30 min and then extended at 42 °C for 30 min. The universal stem-loop primer and specific miRNA primer (Table S5) were used in Endpoint PCR under the same conditions as described in target RNA amplification. PCR products were purified and cloned into the pGEM®-T Vector Systems (Promega, Madison, WI, USA) following the manufacturer’s instructions. Five colonies of each cloned miRNA were subjected to sequencing using an M13 forward primer (Ding guo, China).
3. Results
3.1. P. indica Promote Root Growth and Plant Development
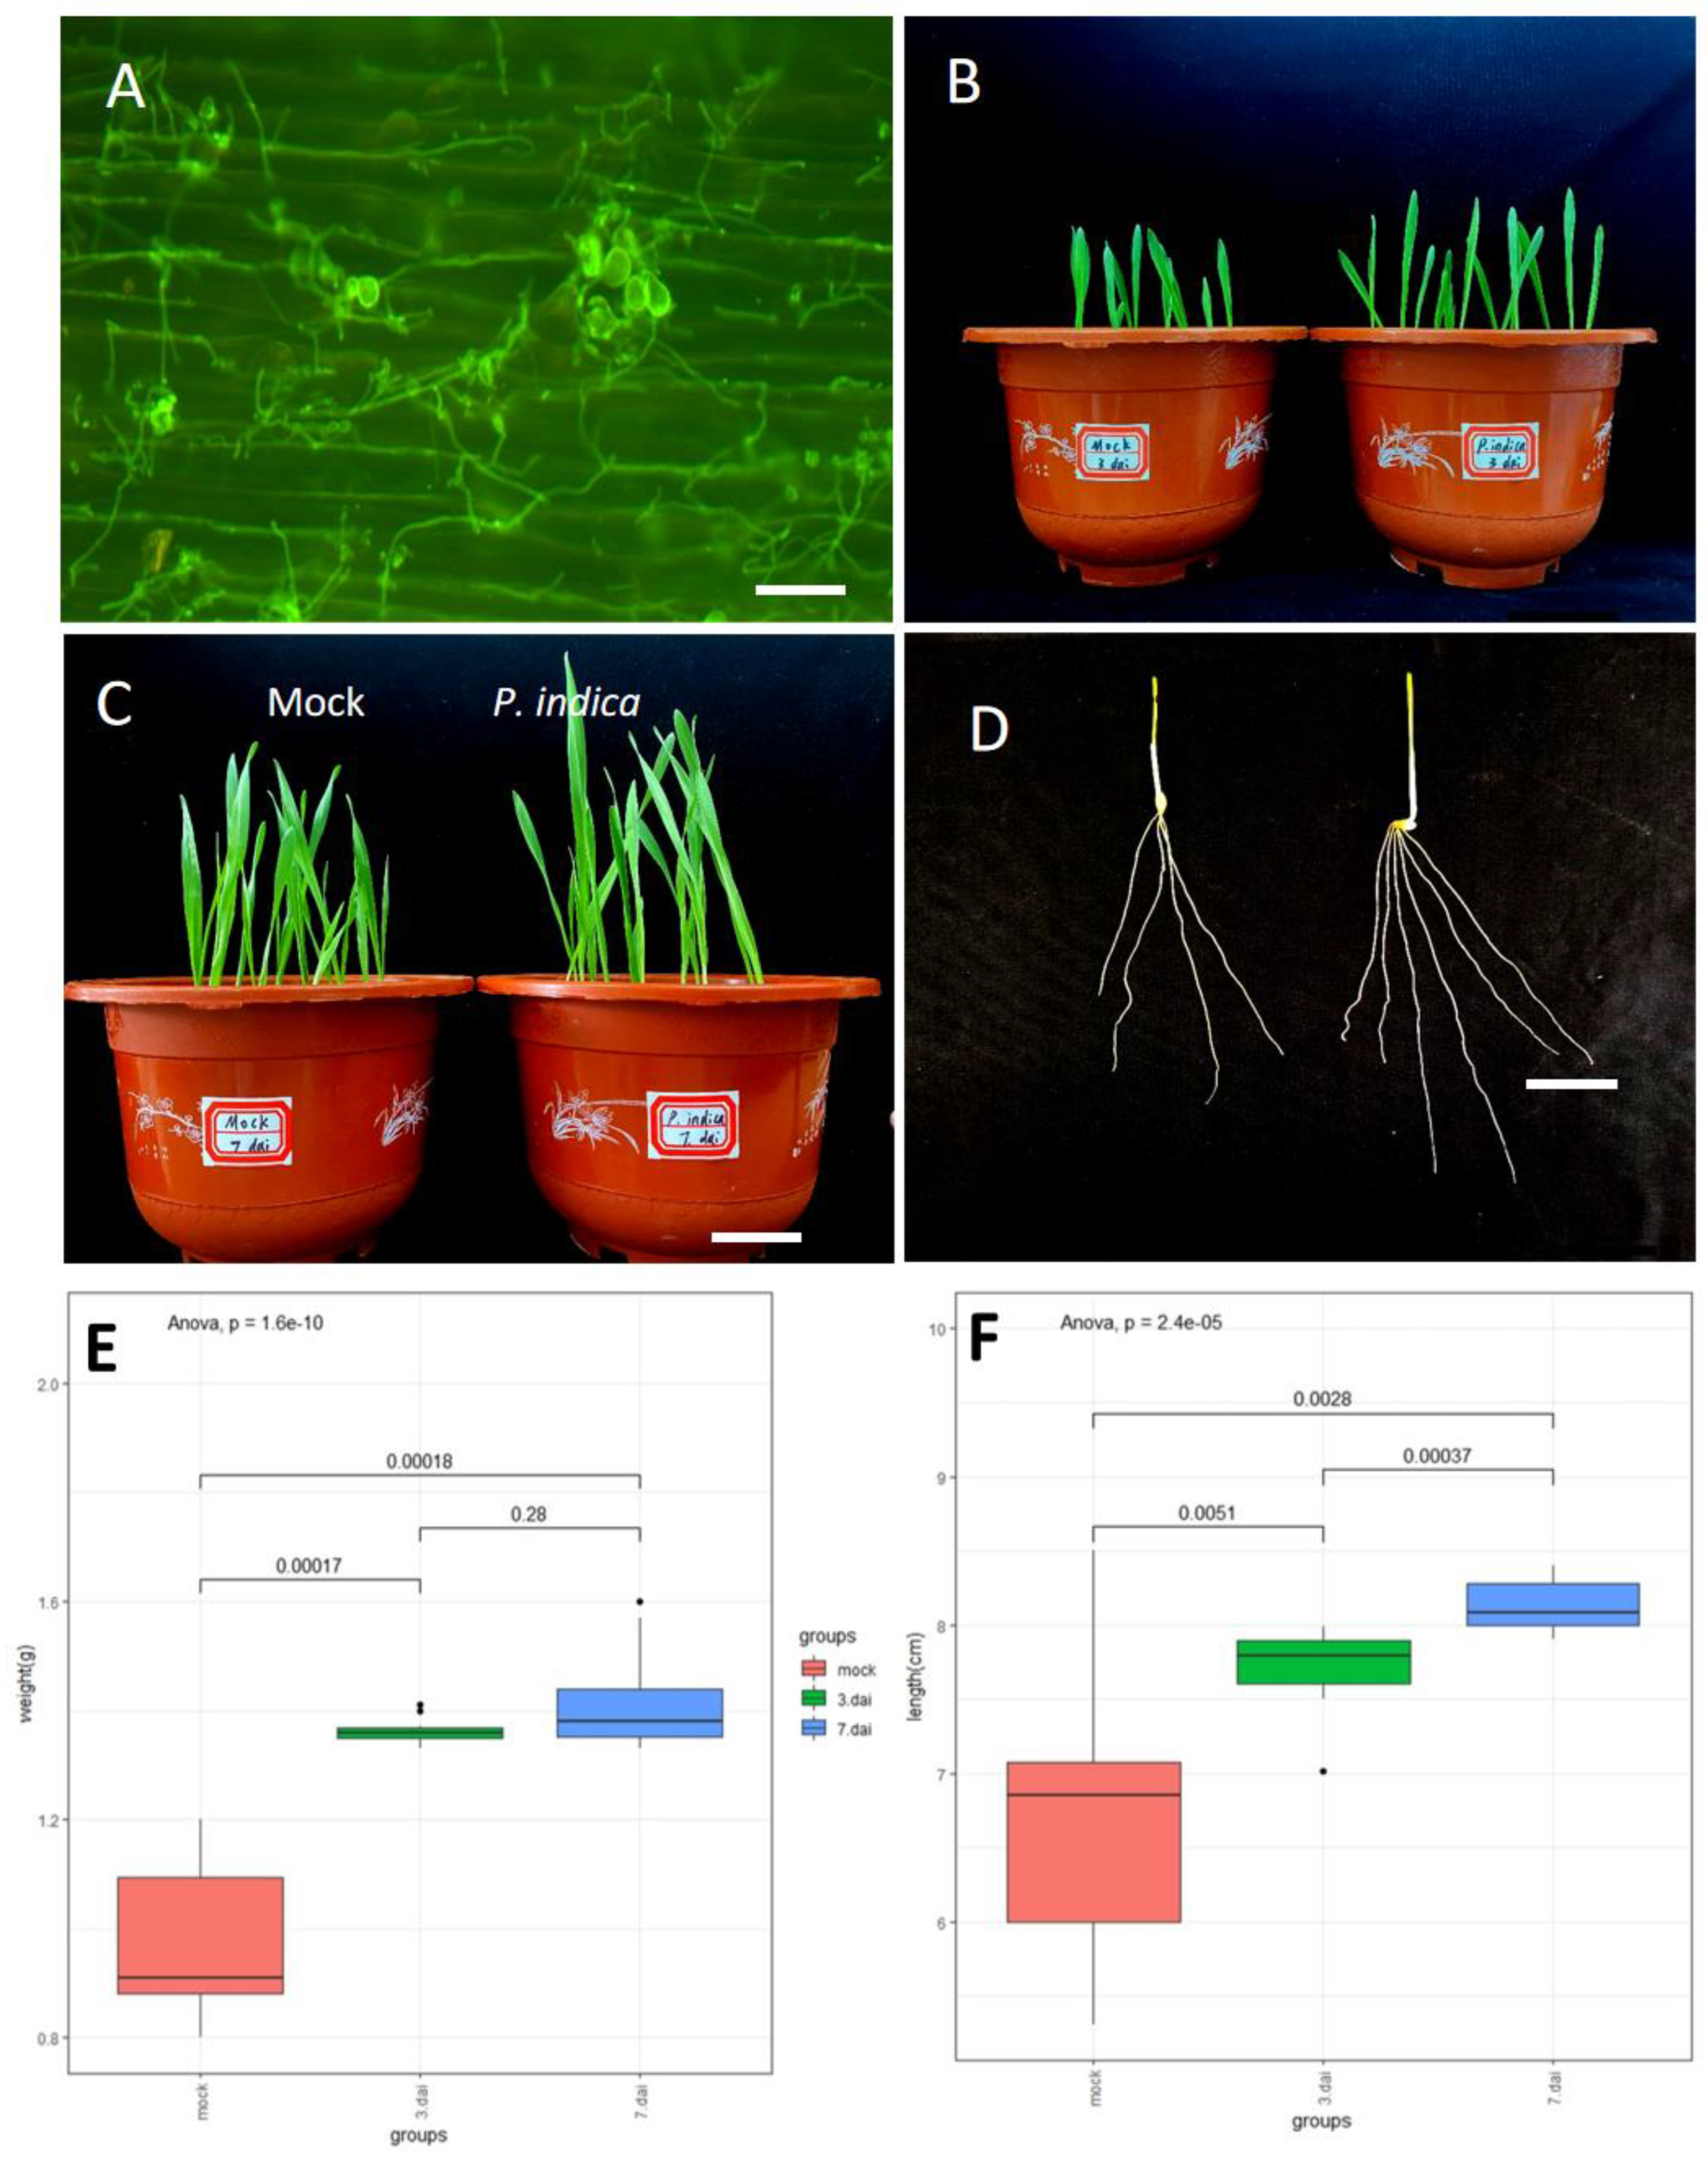
To investigate whether barley seed can develop a beneficial interaction with P. indica by applying seed soaking (SS) treatment with P. indica chlamydospore suspensions, seedling three days after germination in soil were subjected to colonization identification. The hyphae of P. indica were widely distributed over the root surface three days after germination (Figure 1A) which indicating that the establishment of the beneficial symbiosis is successful. The biomass enhancement was observed in the SS treatment compared to that the non-inoculated barley, the stems and roots developed better than barley without P. indica co-cultivation at 3 and 7 days after inoculation (dai) (Figure 1B,C). Furthermore, the branching of roots was also obvious (Figure 1D). Comparison of shoot length in colonized vs. non-colonized plants grown in soil showed that P. indica increased the shoot length by 18.7% and 22.1% at 3 dai and 7 dai, respectively (Figure 1E), and total grain weight/plant increased by 36.9% and 44.6% at 3 dai and 7 dai, respectively (Figure 1F). We found that this method of soaking seeds was very effective in increasing barley biomass. Concordantly, shoot and weight analyses of barley seedlings revealed a significant increase in biomass (Figure 1D) upon P. indica colonization.
3.2. Establishment of the Barley–P. indica Interaction Is Associated with Extensive Transcriptional Reprogramming
In order to evaluate how the mutualistic interaction affects, the miRNA profiles in the colonized barley root at 3 and 7 dai of P. indica and barley controls were subjected to miRNA sequencing. These time points were selected because the fungus-related growth-promoting effect was visible. After removal of the low-quality contaminant and adapter reads, 7,798,928, 6,418,039, and 7,136,192 clean read sequences were obtained from the libraries of mock, 3 dai, and 7 dai roots (Tables S1–S3), respectively. Sequencing data indicated that libraries are of high quality and can be used for further miRNA studies (Table S4).
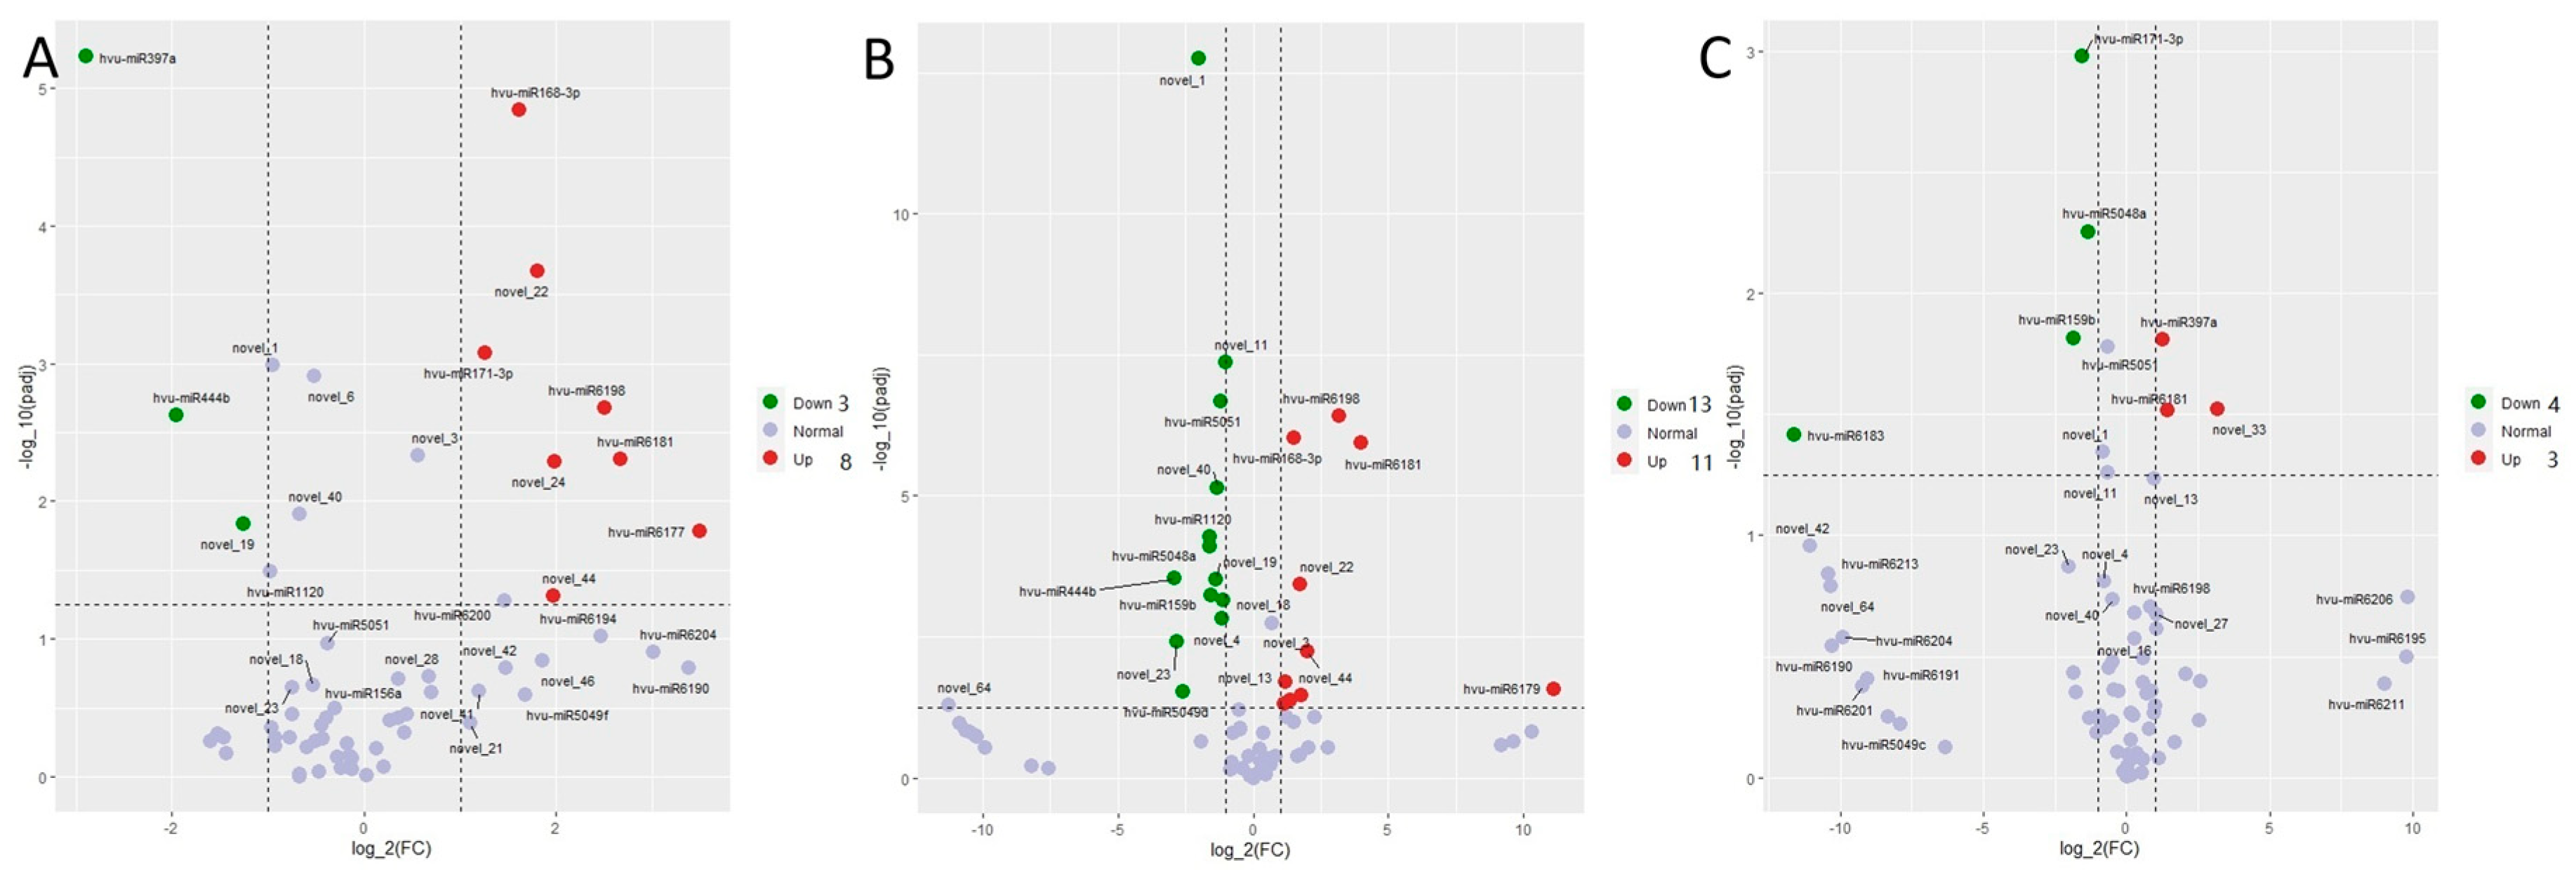
Differentially expressed microRNAs in barley were found in the three comparison groups, including 3 dai vs. mock, 7 dai vs. mock, and 7 dai vs. 3 dai (Figure 2). There were 8 microRNAs upregulated and 3 micro RNAs down regulated in 3 dai vs. mock; there were 11 microRNAs upregulated and 13 micro RNAs down regulated in 7 dai vs. mock, and there were 3 microRNAs upregulated and 4 microRNAs down regulated in 7 dai vs. 3 dai. The clustering heat map showed that P. indica colonization affected the expression pattern of microRNAs (Figure S1); alternatively, some miRNAs like novel-1, miR-444b, miR-1120 and miR397a were down regulated responding to the P. indica colonization; whereas miR171-3P and miR 6183 were upregulated at 3 dai and down-regulated at 7 dai; the other microRNAs including miR1681, novel-22, novel-3, miR168-3P, miR6198, miR6177, and novel 13 were up-regulated after P. indica colonization.
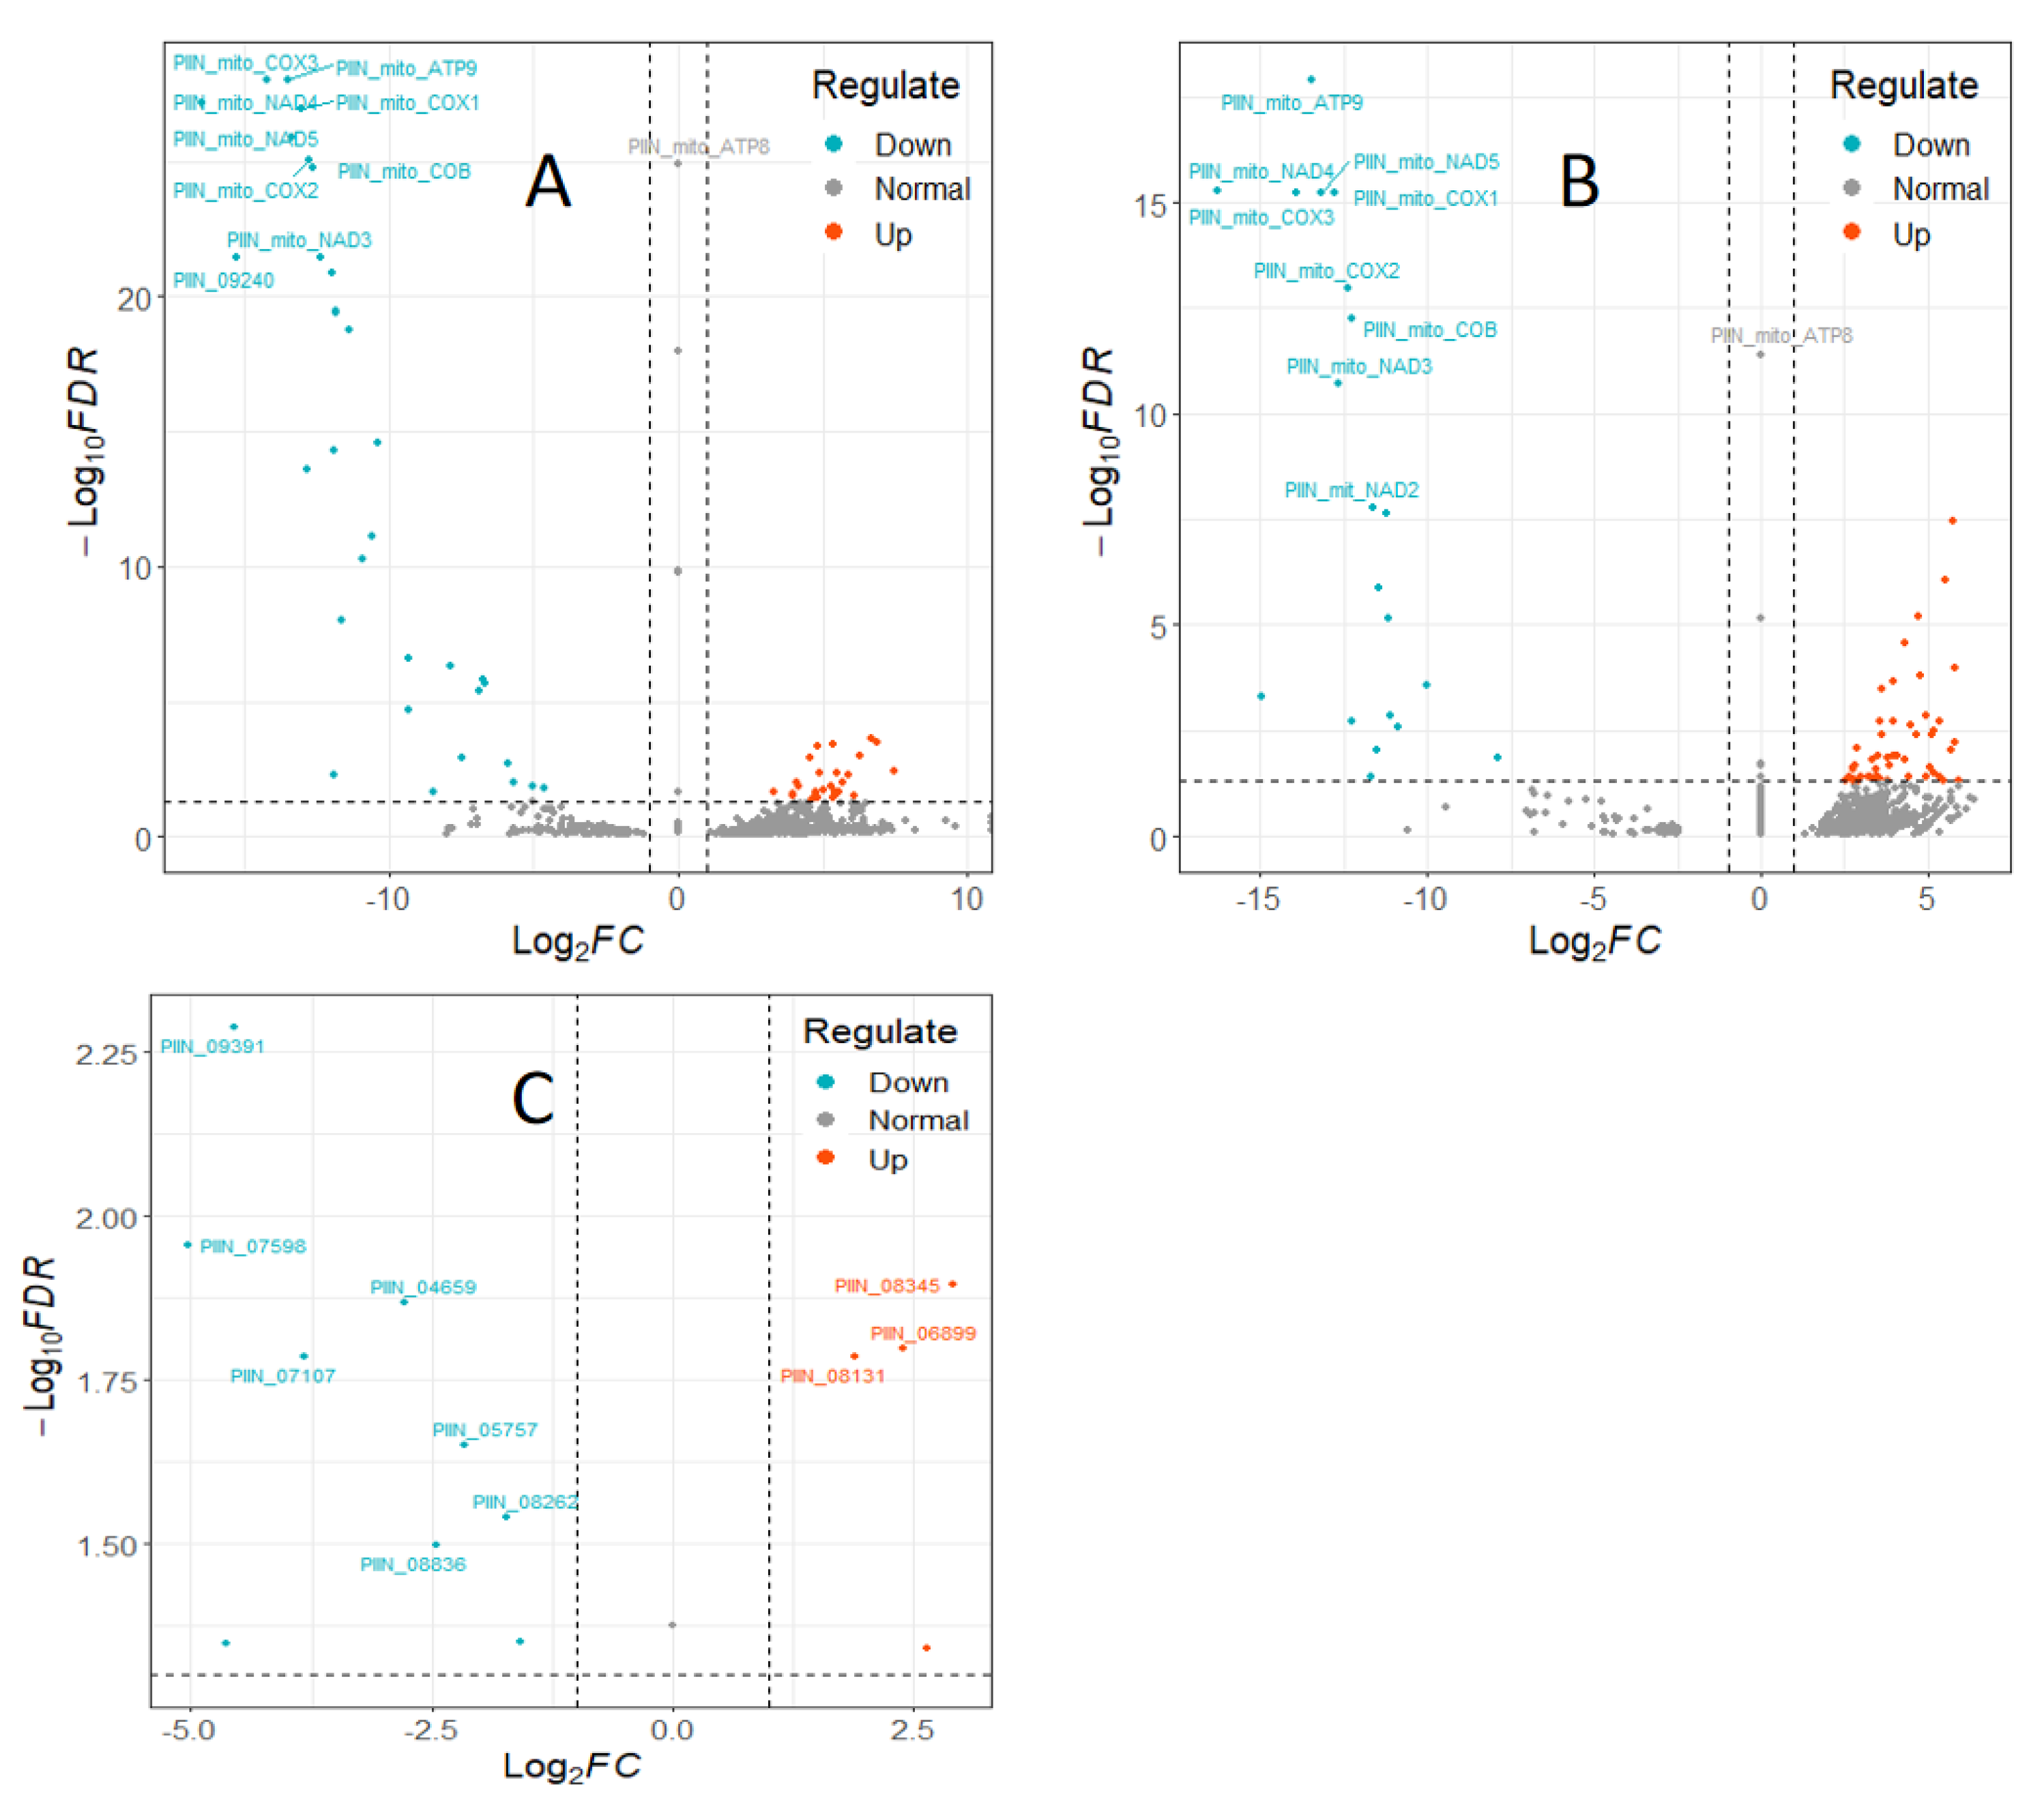
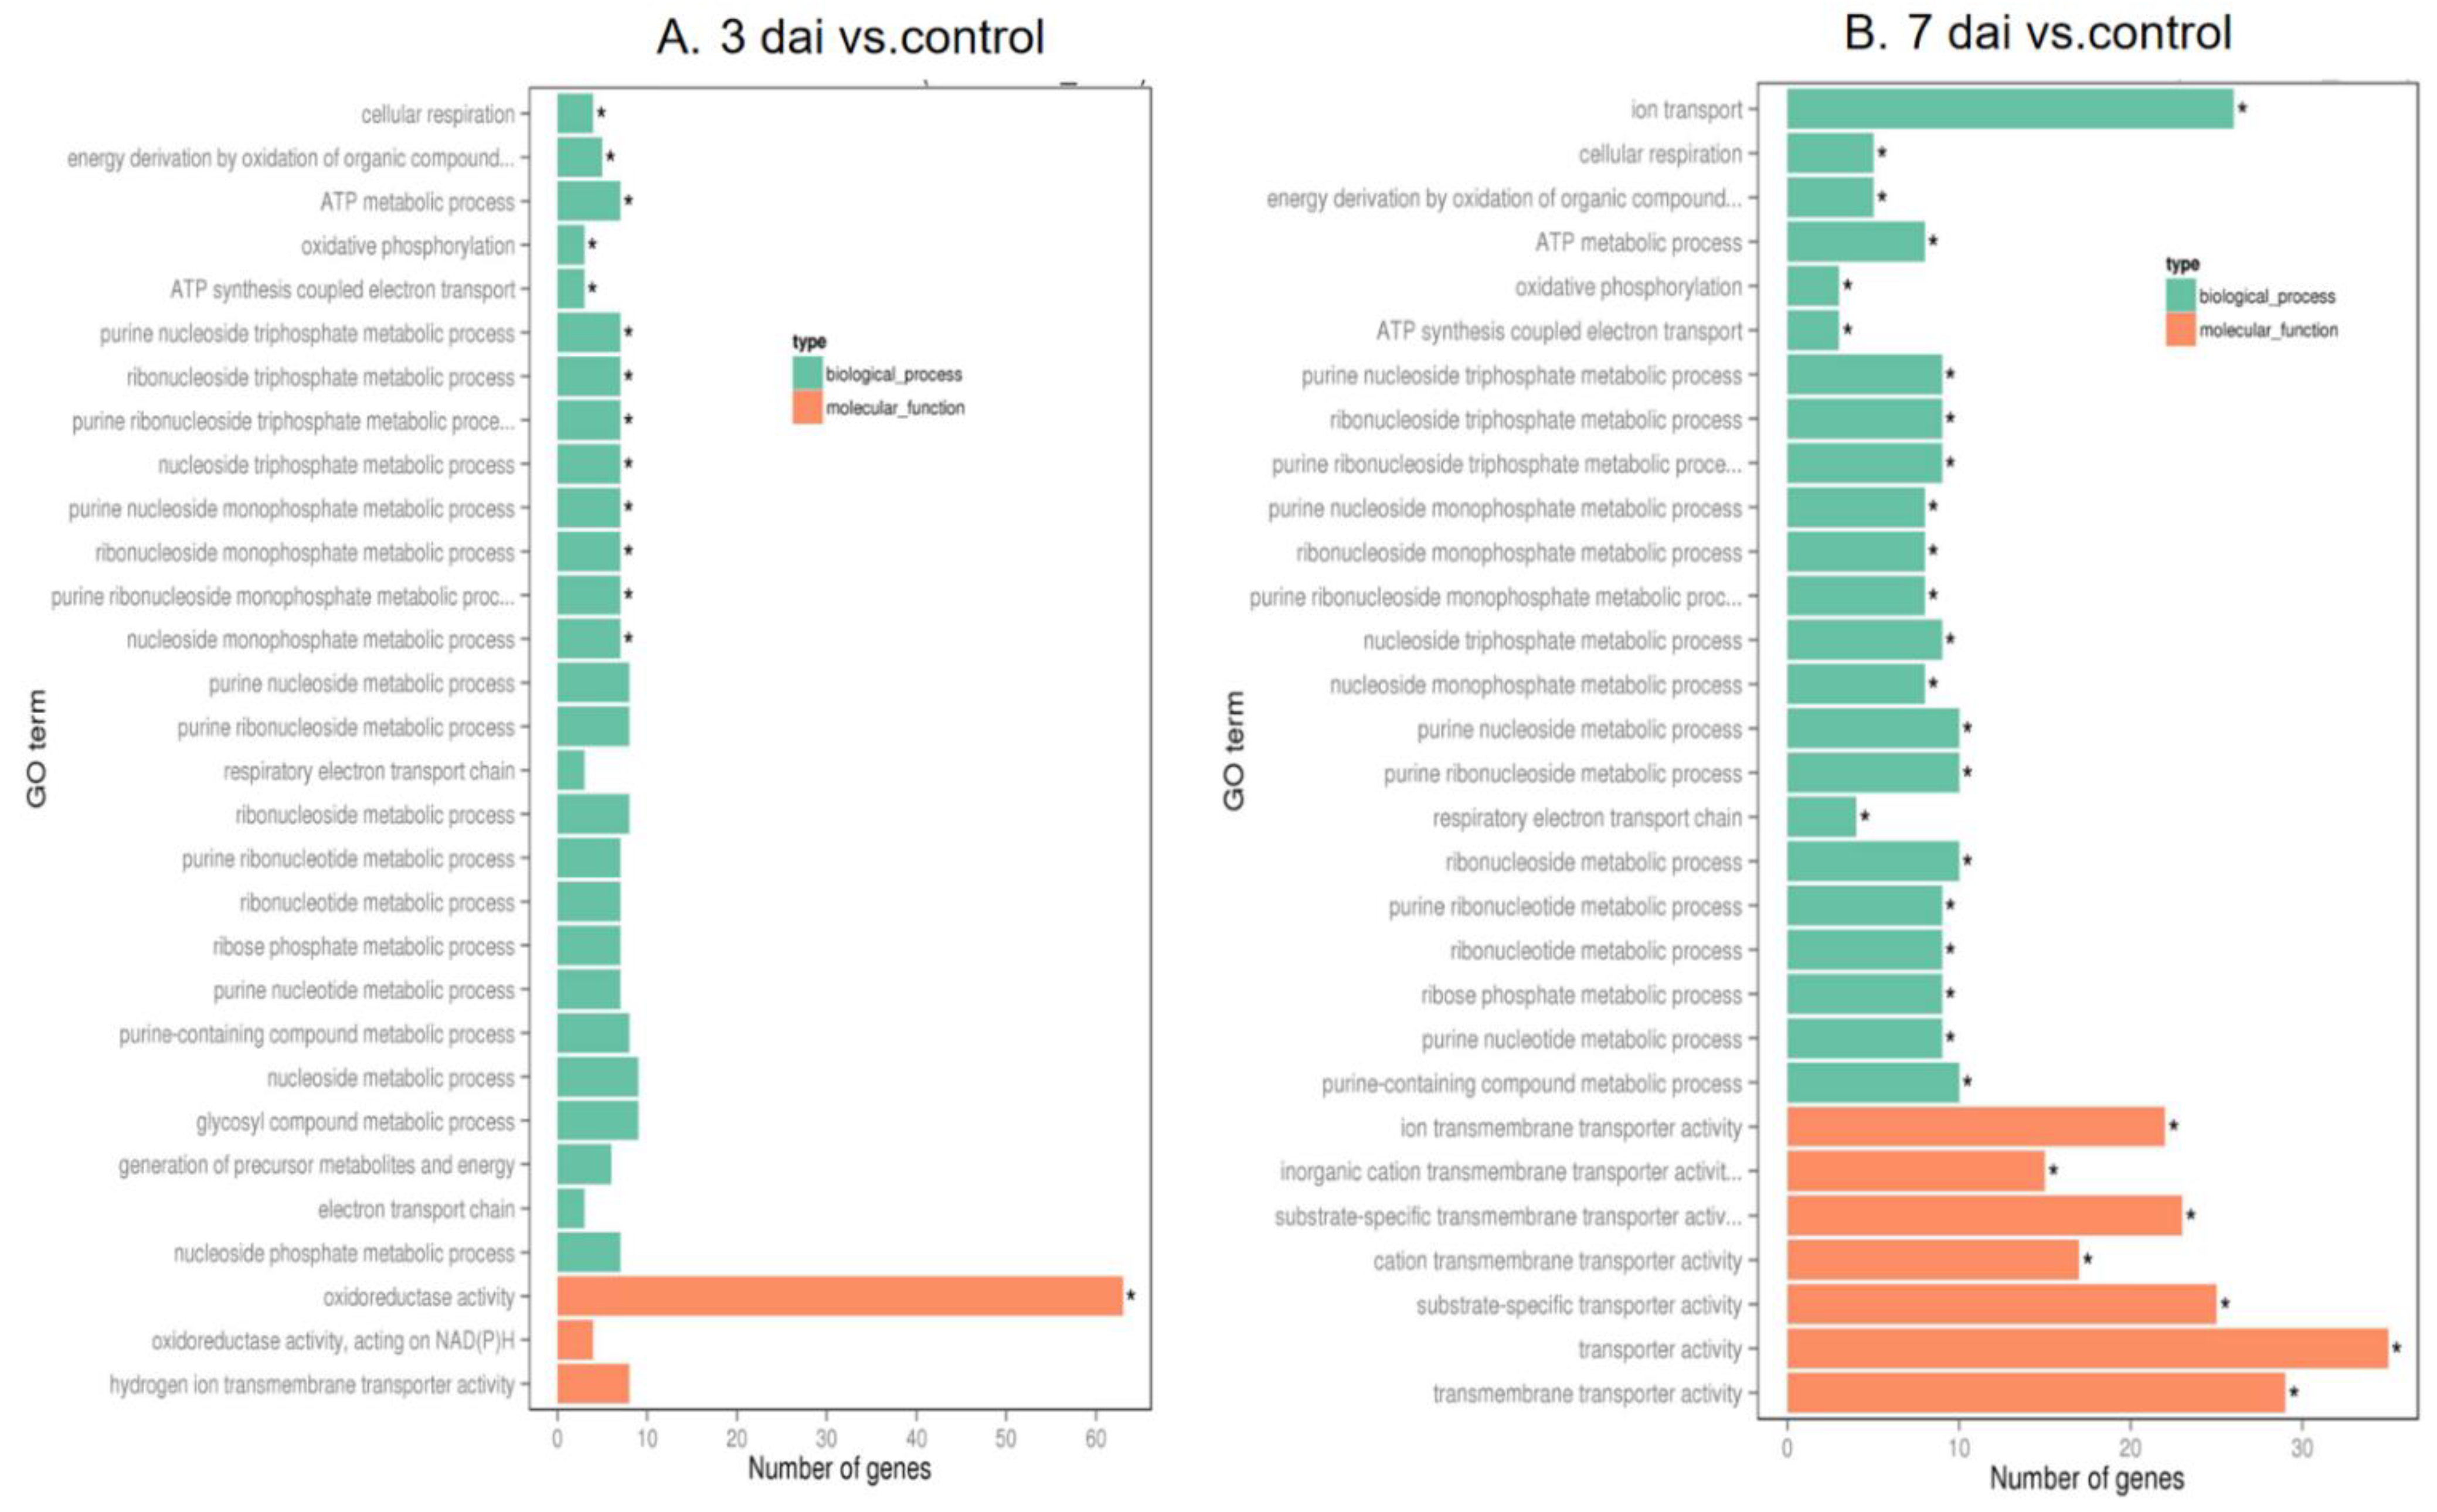
To investigate interaction of barley by P. indica, differentially expressed genes (DEGs) in colonized P. indica in comparison to axenic mycelium samples were analyzed. Among the 667 DEGs of predicted unique P. indica genes, 499 were confirmed as up-regulated and 168 were down-regulated in 7 dai vs. control, and of 594 predicted unique P. indica genes, 517 were confirmed as upregulated and 168 were down-regulated at day 3 after colonization (Figure 3). Gene ontology and annotation analysis indicated that the DEGs with the greatest changes were mainly concentrated in oxidoreductase activity, ion transmembrane transporter activity, phosphate transporter and tRNA THr modification in 3 dai vs. control, and other DEGs were concentrated in cellular respiration, ion transport, endonuclease activity, oxidoreductase activity, and phosphate transporter in 7 dai vs. control (Figure 4). Top 20 P. indica DEGs during colonization at 3 dai and 7 dai vs. mock and 7 dai vs. 3 dai are listed in Table 1, Table 2 and Table 3.
3.3. Differentially Expressed miRNAs
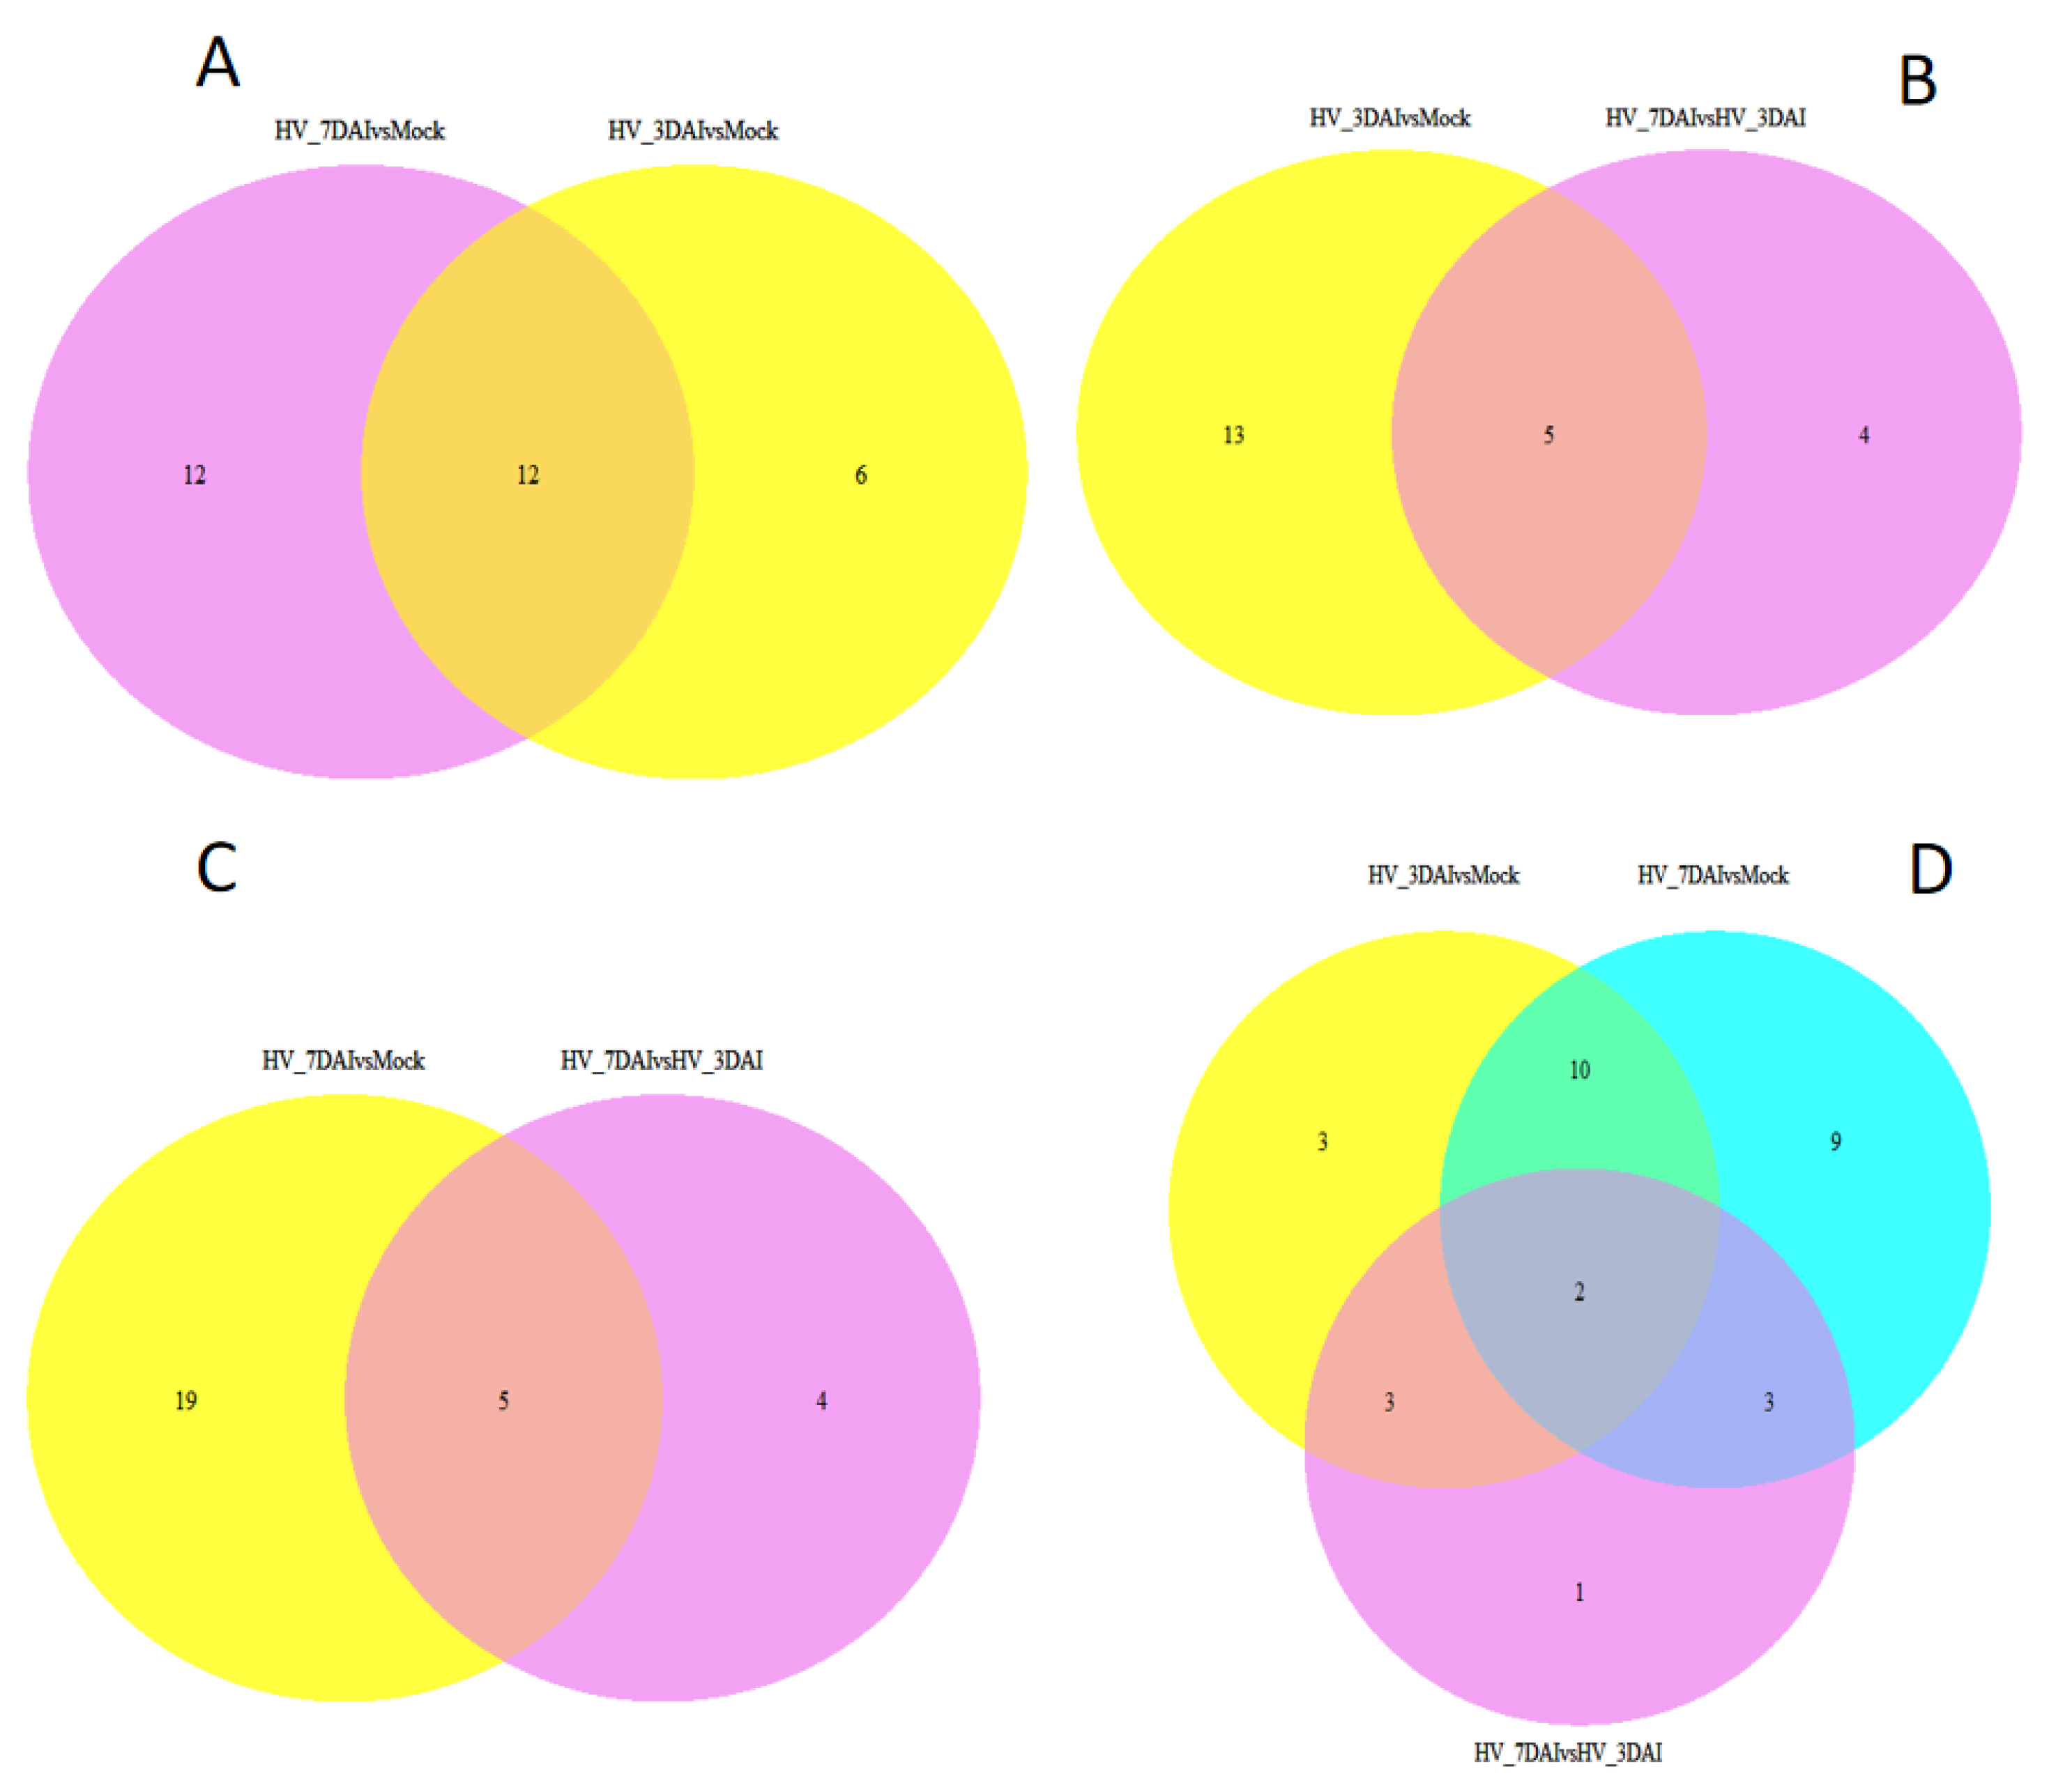
Analysis of unique plant miRNAs in 7 dai-mock vs. 3 dai-mock revealed that 12 of the putative endogenous miRNAs were exclusively present in 7 dai-mock, 6 miRNAs were exclusively present in 3 dai-mock, and 12 miRNAs were present in both comparison group (Figure 5). For the reads from the putative 3 dai-mock vs. 7 dai-3 dai, 13 miRNAs were exclusively present in 3 dai-mock, 4 miRNAs were exclusive present to 7 dai-3 dai, and 5 miRNAs were found in both comparison groups. Comparison between the unique miRNAs in 7 dai-mock vs. 7 dai-3 dai indicated that 19 of the putative endogenous miRNAs were exclusively present in 7 dai vs. mock, 4 miRNAs were found in 7 dai vs. 3 dai, and 5 miRNAs were present in both comparison group. Similarly, from the putative 3 dai-mock vs. 7 dai-3 dai, three miRNAs were exclusively present in 3 dai-mock, nine miRNAs were exclusively present in 7 dai-mock, one miRNA was exclusively present in 7 dai-3 dai, and two miRNAs were found in all three comparison groups.
3.4. Expression Patterns of miRNAs and Their Putative Targets in P. indica—Colonized Roots
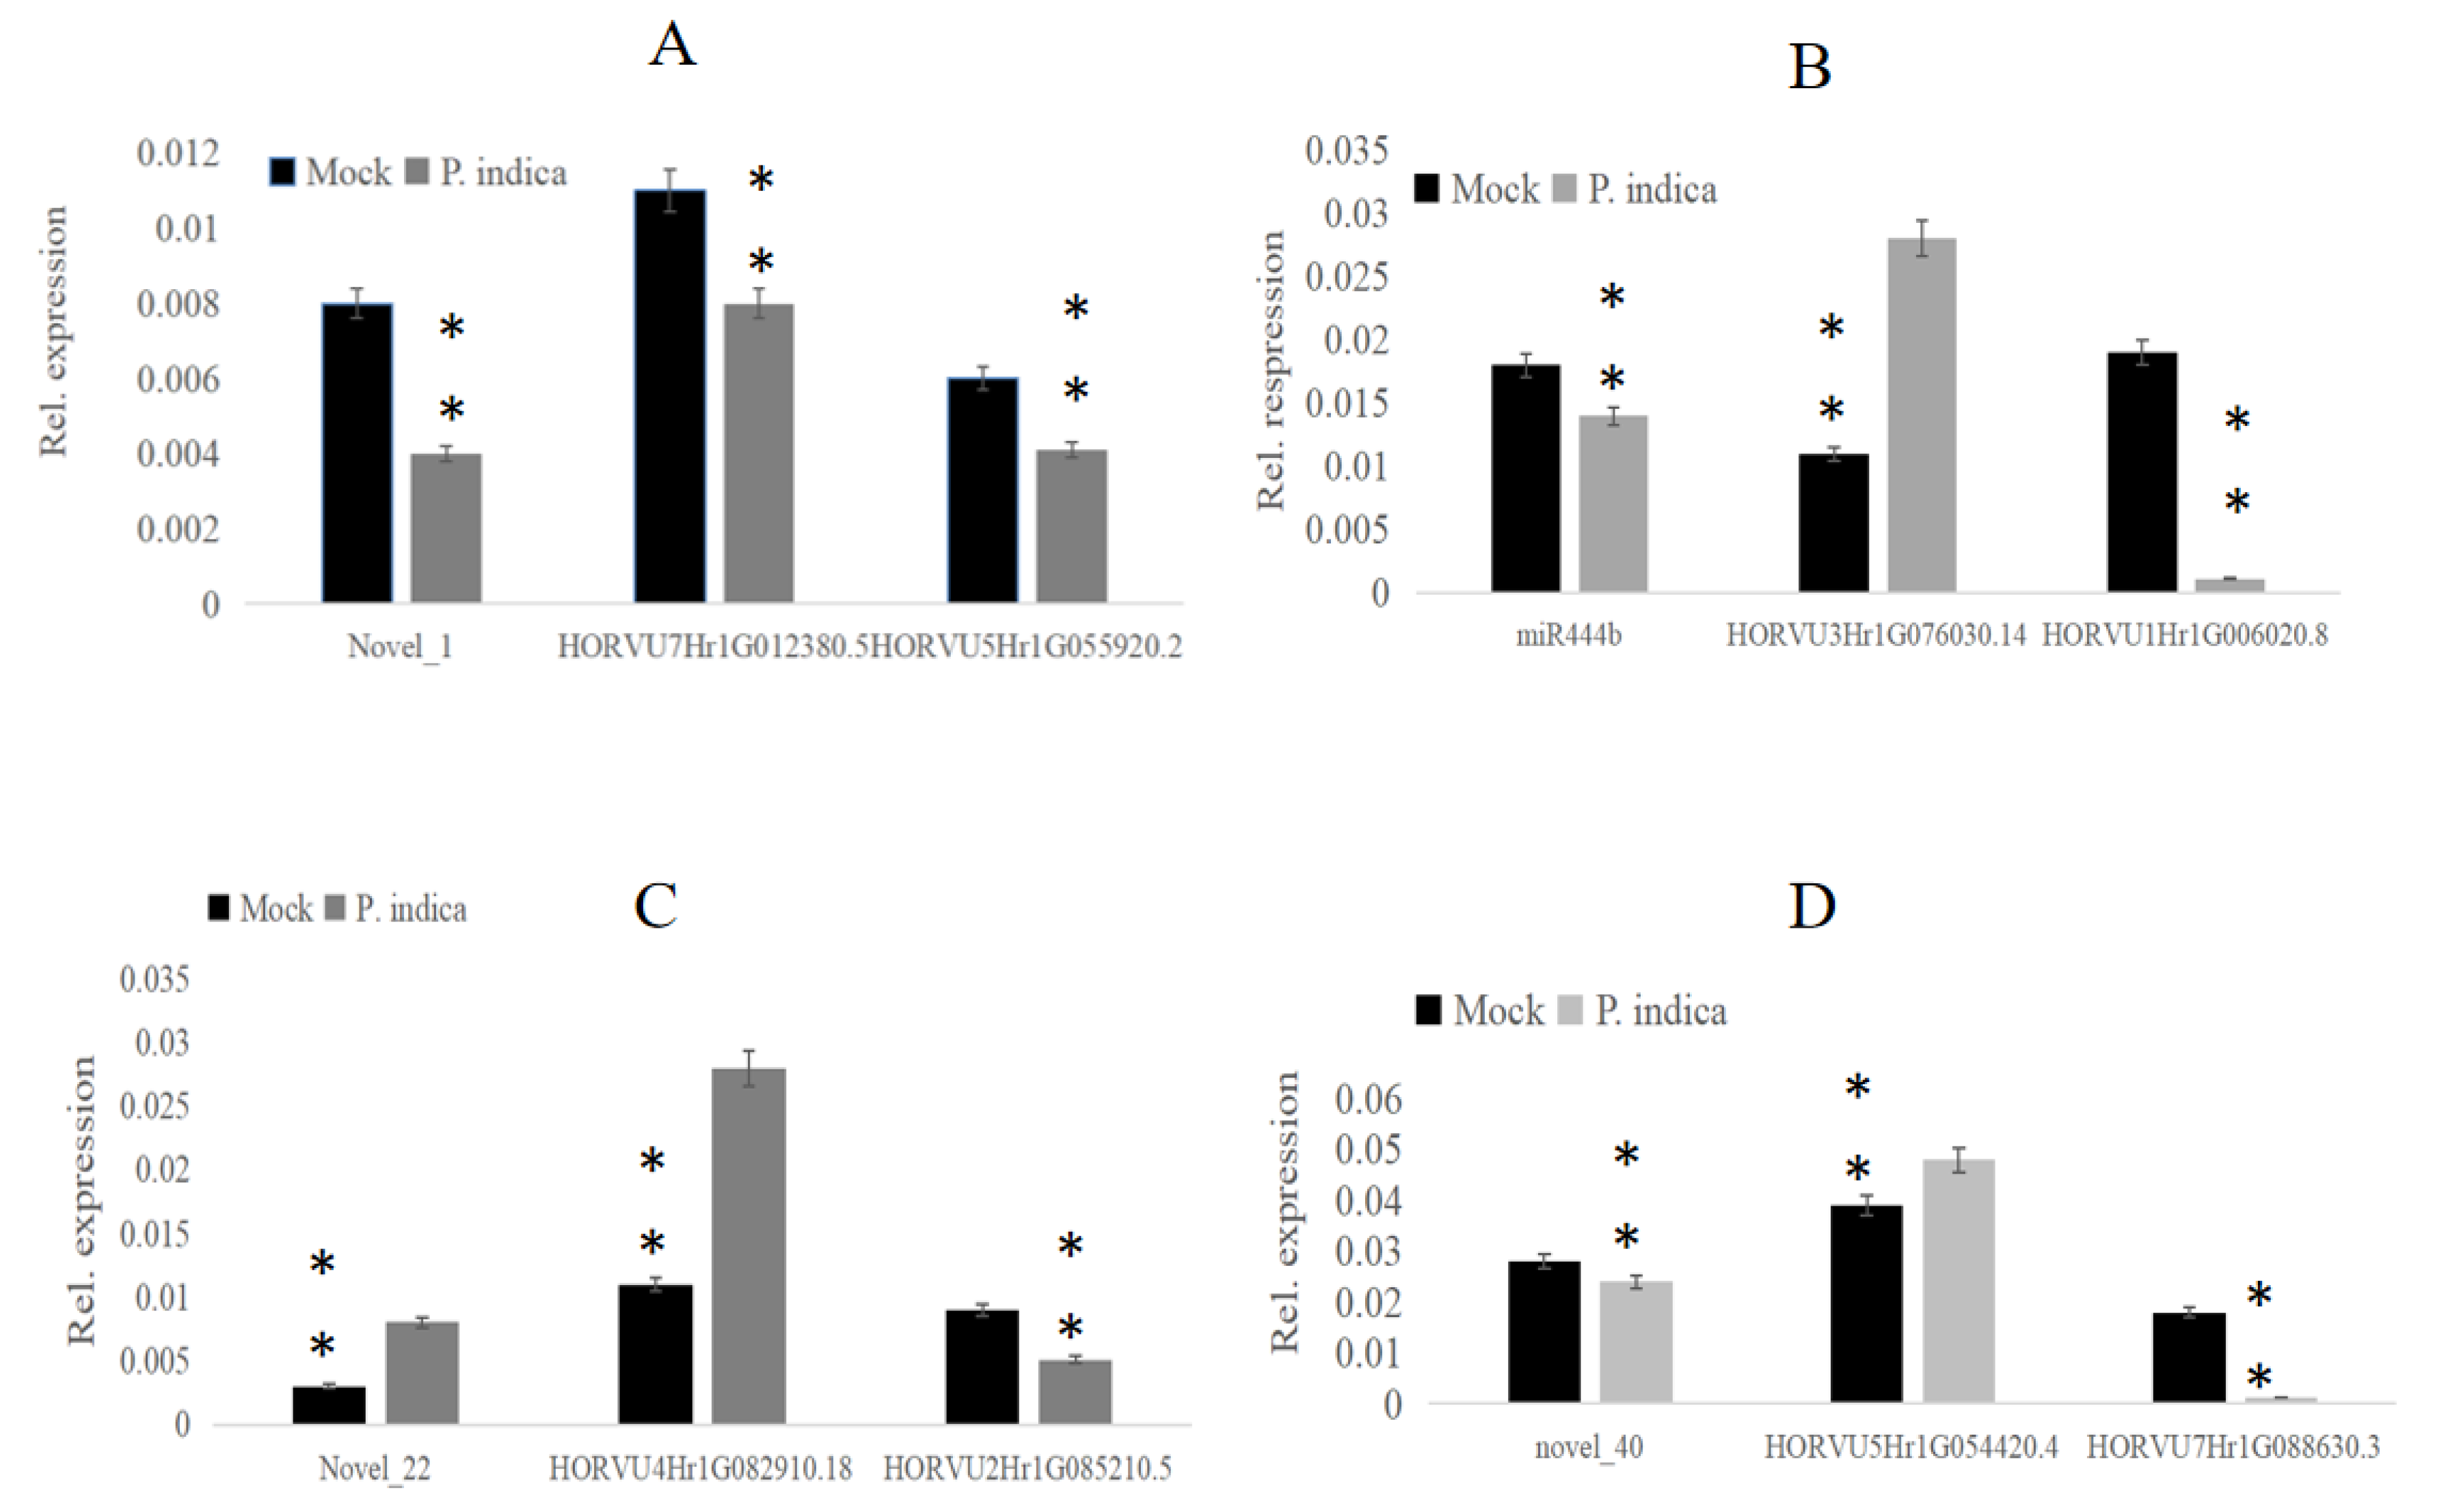
To elucidate the regulatory function of miRNAs on their putative targets, real-time qPCR was performed to confirm the expression level by using specific primers for these miRNAs and their target genes (Table S5). The miRNAs novel_1, novel_22, novel_40, miR444b and their target genes involved in the growth-regulating factor, promoter-binding-like protein and transcription factor were selected. QPCR results indicated that the selected miRNAs novel_1 was down-regulated at 3 dai compared with mock, and its target genes HORVU7Hr1G012380. 5 and HORVU5Hr1G055920. 2 were both down-regulated, too (Figure 6A). In addition, the selected miRNAs miR444b was down-regulated at 3 dai compared to mock, and its target gene HORVU3Hr1G076030. 14 was up-regulated, but the other target gene HORVU1Hr1G006020. 8 was down-regulated (Figure 6B). Moreover, the selected miRNAs novel_22 was up-regulated at 3 dai compared with mock, and its target gene HORVU4Hr1G082910. 18 was upregulated, but the target gene HORVU2Hr1G085210. 5 was downregulated (Figure 6C). And the selected miRNAs novel_40 was down-regulated at 3 dai compared to mock, and its target gene HORVU5Hr1G054420. 4 was up-regulated, another target gene HORVU7Hr1G088630. 3 was down-regulated (Figure 6D). The result showed that the expression of these miRNAs was consistent with the results of RNA-seq data.
Functions of target mRNA corresponding to up-regulated and down-regulated miRNA in 3 dai vs. mock are listed in Table 4 and Table 5. As shown, one miRNA corresponded to multiple target genes, and the regulatory function of miRNA on target genes may be either up-regulated or down-regulated. Data showed that four microRNAs corresponding to target RNAs had specific functional descriptions. And the functions of these target mRNA described as: Serine/threonine-protein kinase STY13, putative transcription factor RL9, leucine rich repeat family expressed, 60S ribosomal protein L35a-1, squamosa promoter-binding-like protein, squamosa promoter-binding-like protein 4/16, scarecrow-like protein 6/. And the functions of down-regulated miRNA related target mRNA were MADS-box transcription factor 57, 6-phosphogluconate dehydrogenase, general negative regulator of transcription subunit 3 isoform X4, and growth-regulating factor 1, 2, 4, 5-like isoform.
3.5. Prediction of miRNA Target Genes
To understand the regulatory function of miRNAs during symbiosis, those miRNAs which were abundantly detected and significantly up-/down-regulated by P. indica were selected for further investigation. Eighty-one conserved miRNAs belonging to 15 families were selected for target gene prediction. Target-Finder software was used to predict miRNA target genes, 450 best fit target candidates were obtained (Table S6).
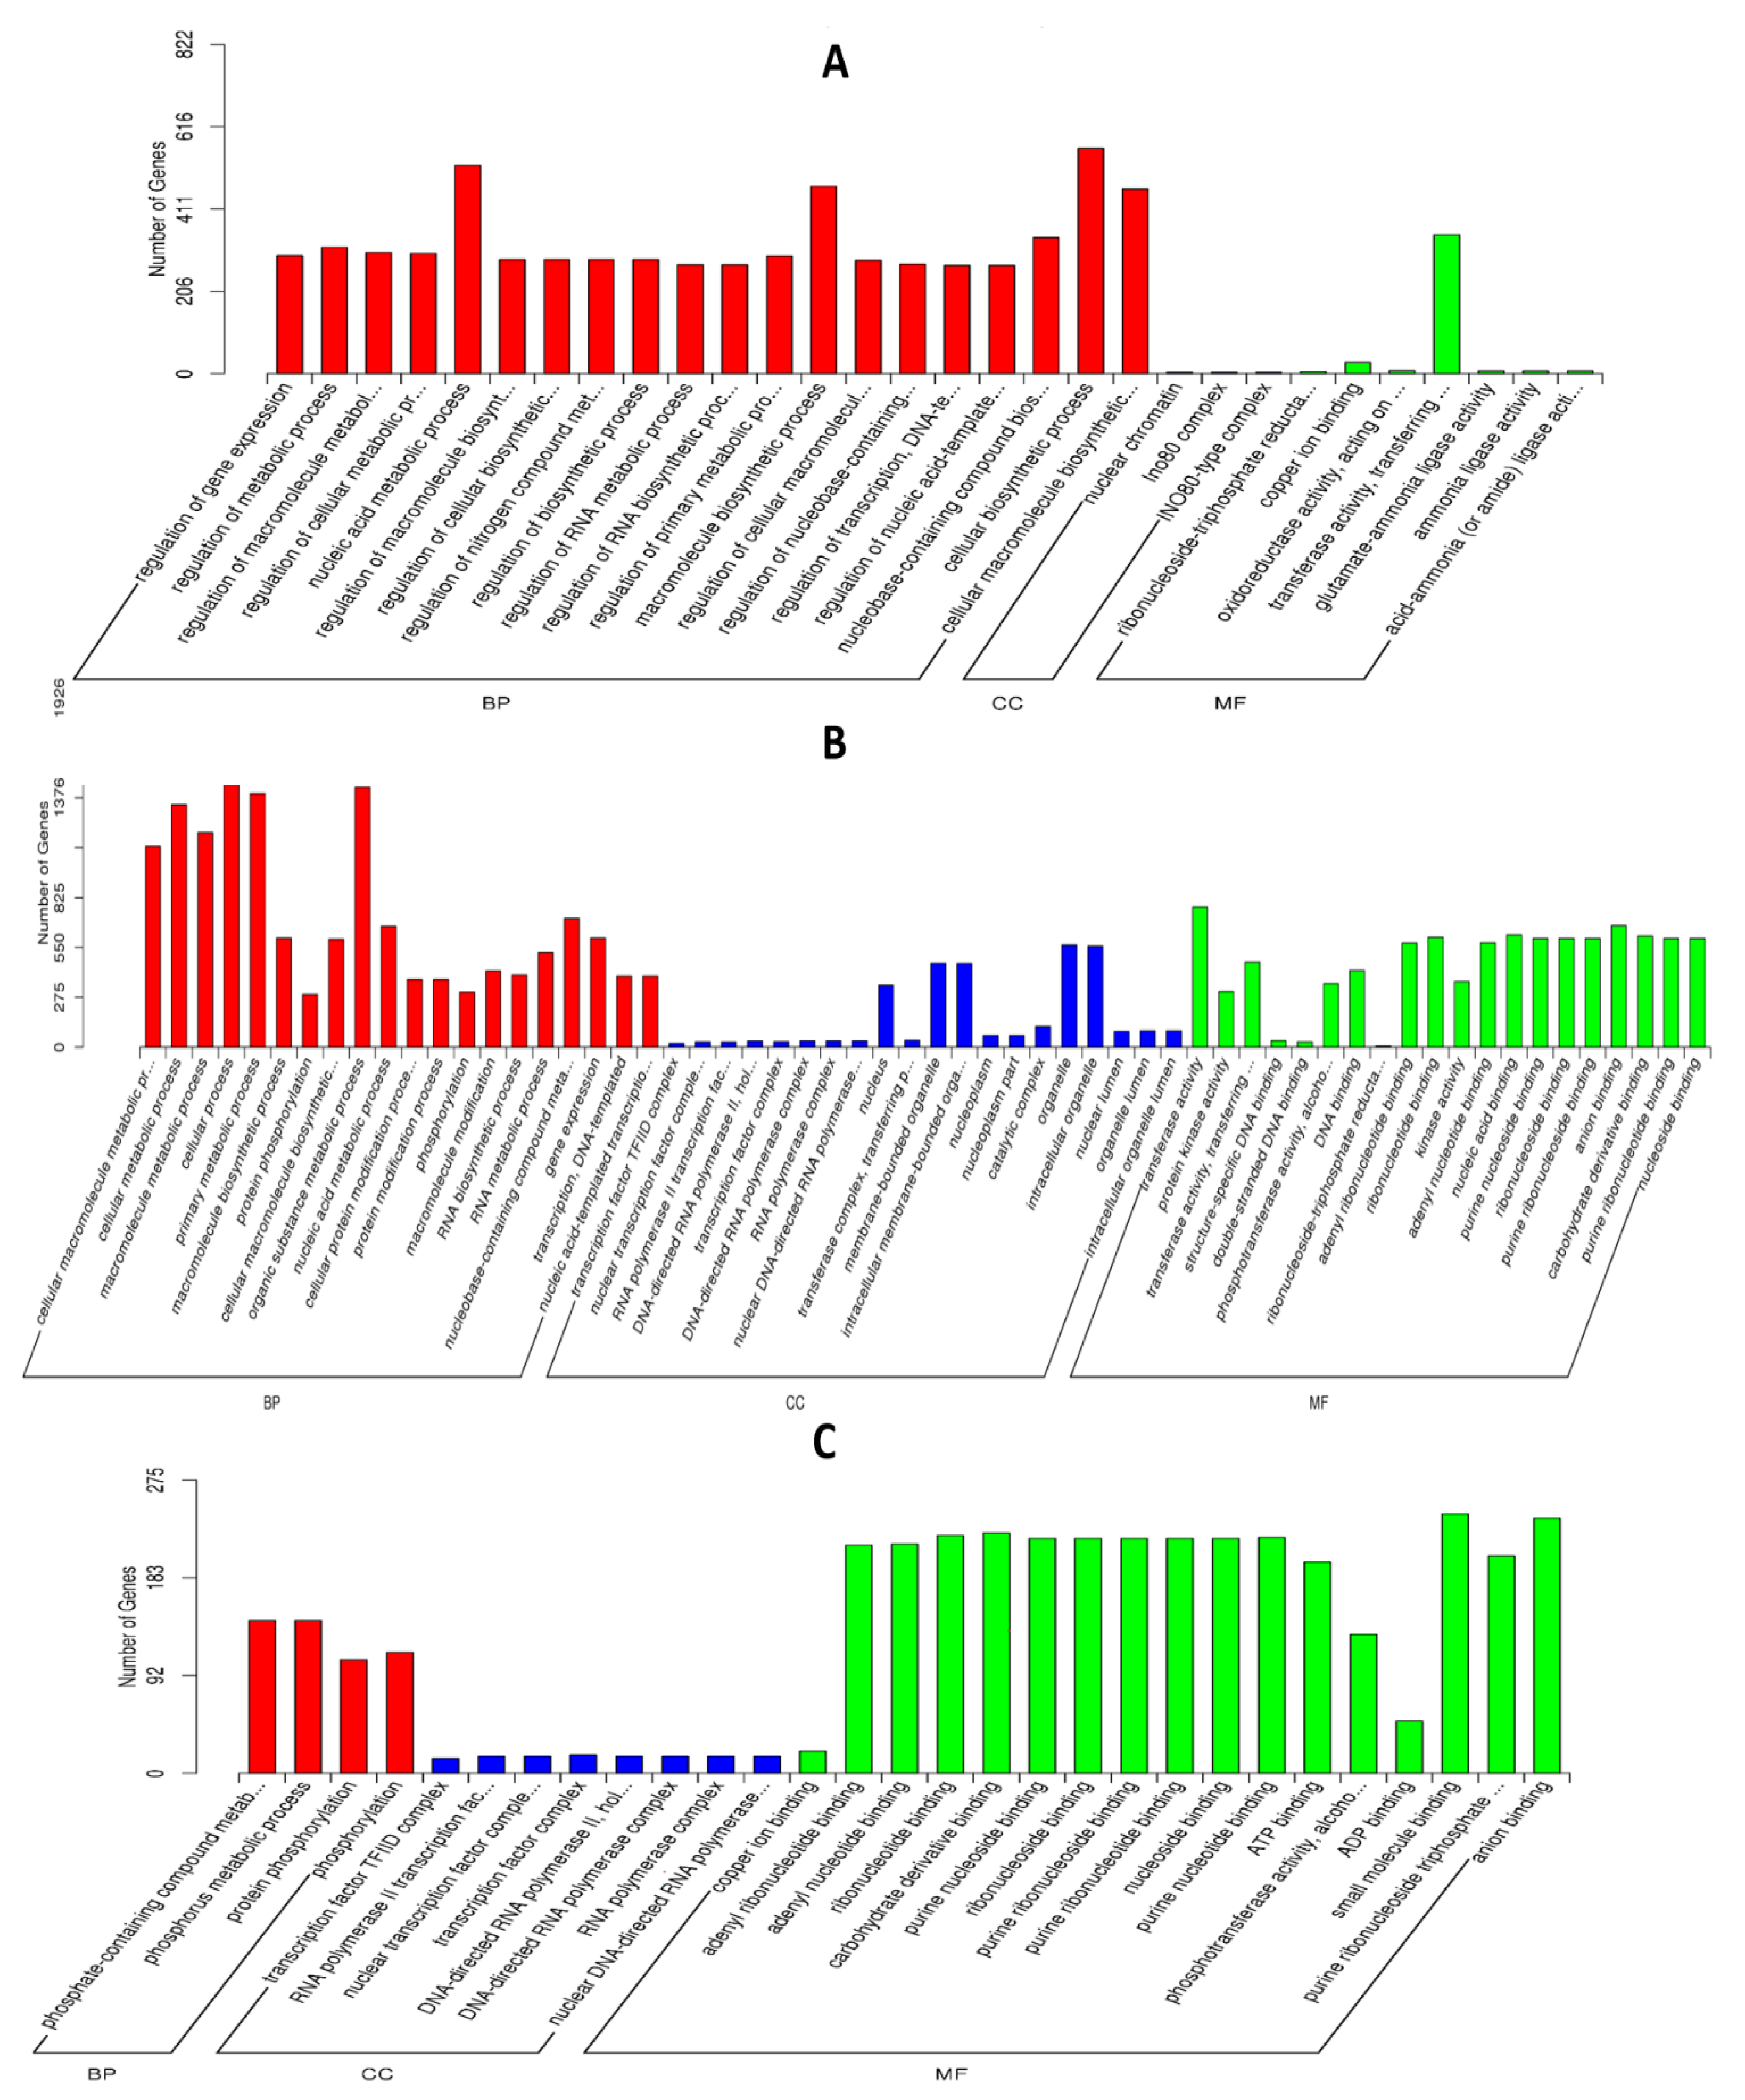
Subsequently, annotation and GO analysis were conducted by Goseq. A total of 450 targets were annotated and distributed in 38 categories. Clustering of microRNA target genes varied among different comparison groups. MiRNAs target genes were more concentrated in biological process signaling pathways than in cell components in 3 dai vs. mock (Figure 7A): In the subcategory of biological process, most of the target genes of miRNA are concentrated in the cellular biosynthetic process, macromolecule biosynthetic process and nucleic acid metabolic process; In the subcategory of molecular function, transferase activity and copper ion binding are the main enrichment pathways of miRNA target genes. In the 7 dai vs. mock group, miRNA target genes were involved in biological processes, cell components, and molecular functional signaling pathways (Figure 7B): most of the miRNA target genes are concentrated in the cellular biosynthetic process, macromolecule biosynthetic process, nucleic acid metabolic process and organic substance metabolic process in the subcategory of biological process, In the subcategory of cell components, most of the miRNA target genes are concentrated in intracellular organelle, membrane bounded organelle and nucleus; in the subcategory of molecular function, transferase activity, ribonucleotide binding, carbohydrate derivative binding, and anion binding are the main enrichment pathways of microRNA target genes. In the 7 dai vs. 3 dai group, miRNAs target genes were more concentrated in molecular function signaling pathways than in biological process (Figure 7C). In the subcategory of biological process, the expression of miRNA target genes was mainly enriched in protein phosphorylation and phosphorous compound metabolism. Whereas, miRNA target genes, in the subcategory of molecular function were mainly concentrated in binding process of small molecules, ATP, ADP, copper ion, carbohydrate derivative, and purine nucleoside.
3.6. Identification of miRNAs Related to Transcription Factor and Other Key Pathway Regulation in Barley Roots Colonization by P. indica
To further study the function of miRNAs in the growth of barley roots in response to P. indica colonization, the GO terms of different expression miRNAs targets were annotated based on http://geneontology.org/ (accessed on 12 November 2022) and http://www.uniprot.org/uniprot/ (accessed on 12 November 2022). The results showed that seven miRNAs might be involved in the regulation of gene transcription, because their target genes have transcription factor activity (Table 6). In the 3 dai vs. mock group, miR6189 was up-regulated and miR 6214 and miR444b were down-regulated; in the 7 dai vs. mock group, miR6190 was up-regulated and miR6214, miR397a were down-regulated; in the 7 dai vs. 3 dai group, miR6180 was down-regulated and miR6214 was up-regulated; all their target genes have transcription factor activity.
Besides the transcription factor activity regulation, we found that miRNAs including miR6214, miR6180, miR6189, miR444b, miR6190, and miR397a might also be involved in other key signal pathways because their target genes participated in these pathways including cell division, auxin stimulus, photosynthesis, hormone stimulus, and chlorophyllide oxygenase activity, which contribute to the plant growth promotion. It was observed that there were four miRNAs response to auxin stimulus in the 3 dai vs. mock and 7 dai vs. mock comparison groups. Those miRNAs were all up-regulated compared with mock while they were diversely (positively or negatively) correlated to their target genes (Table 7).
3.7. MiRNA–mRNA Interaction
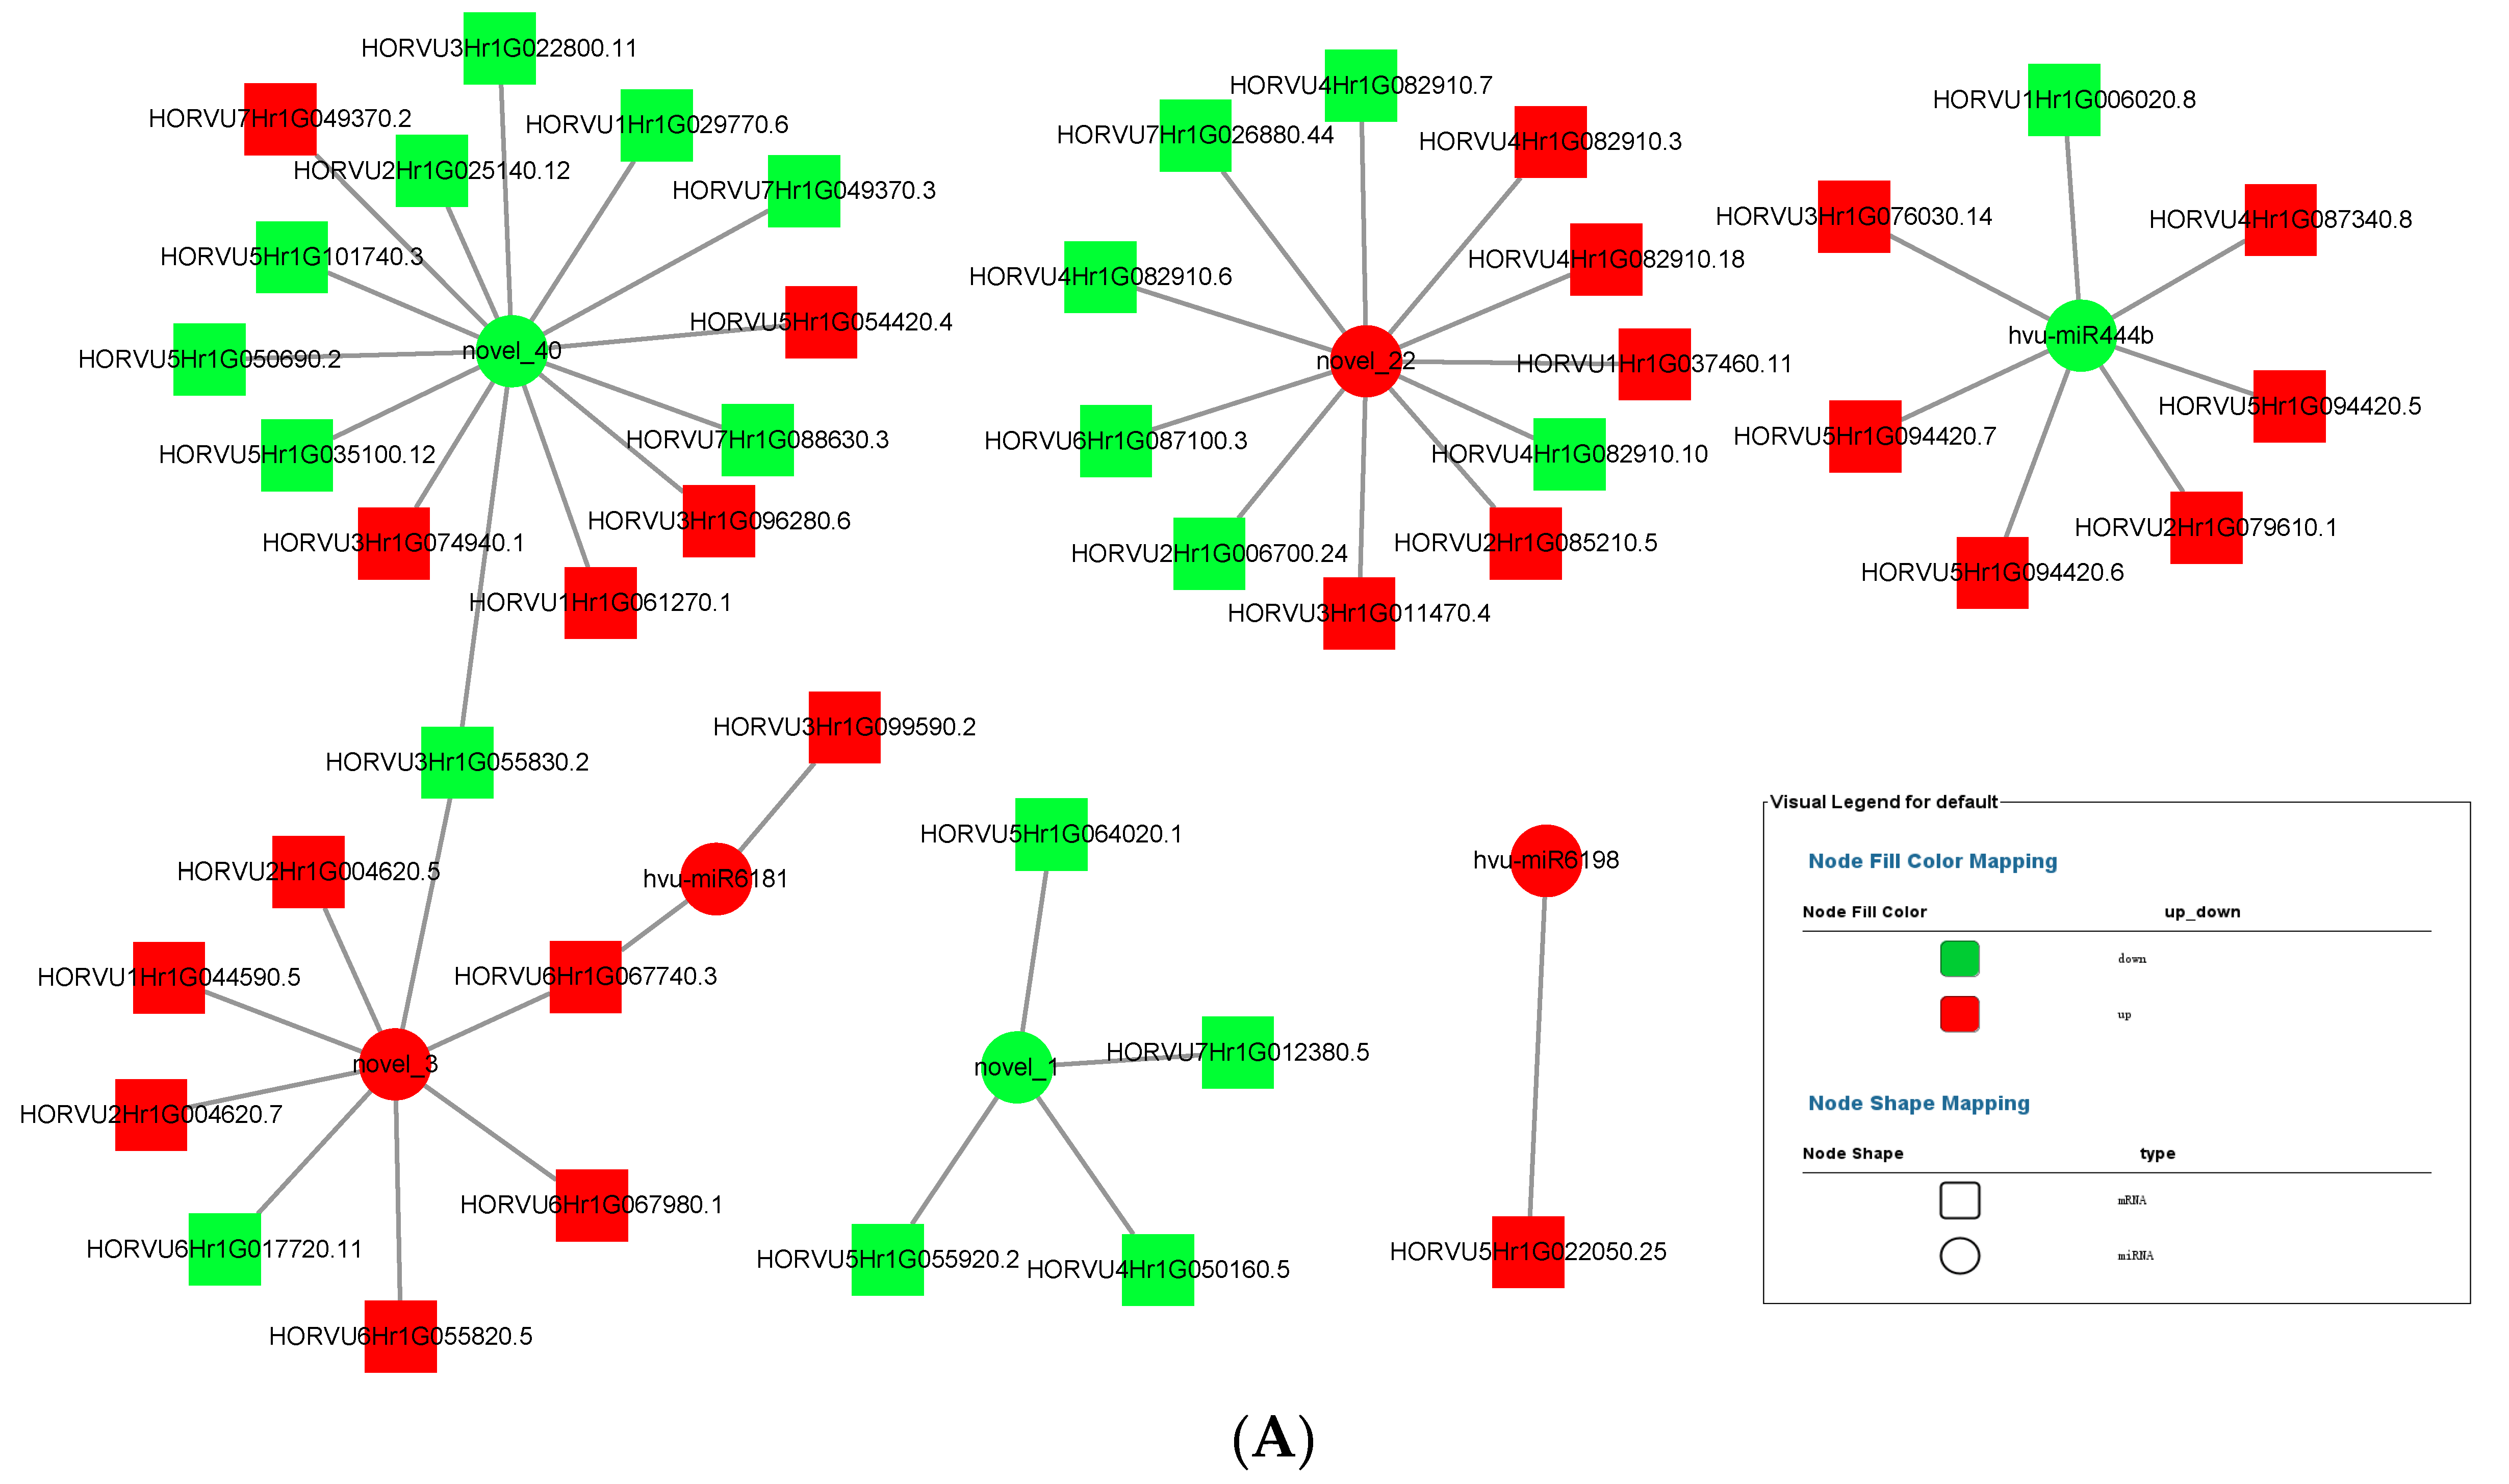
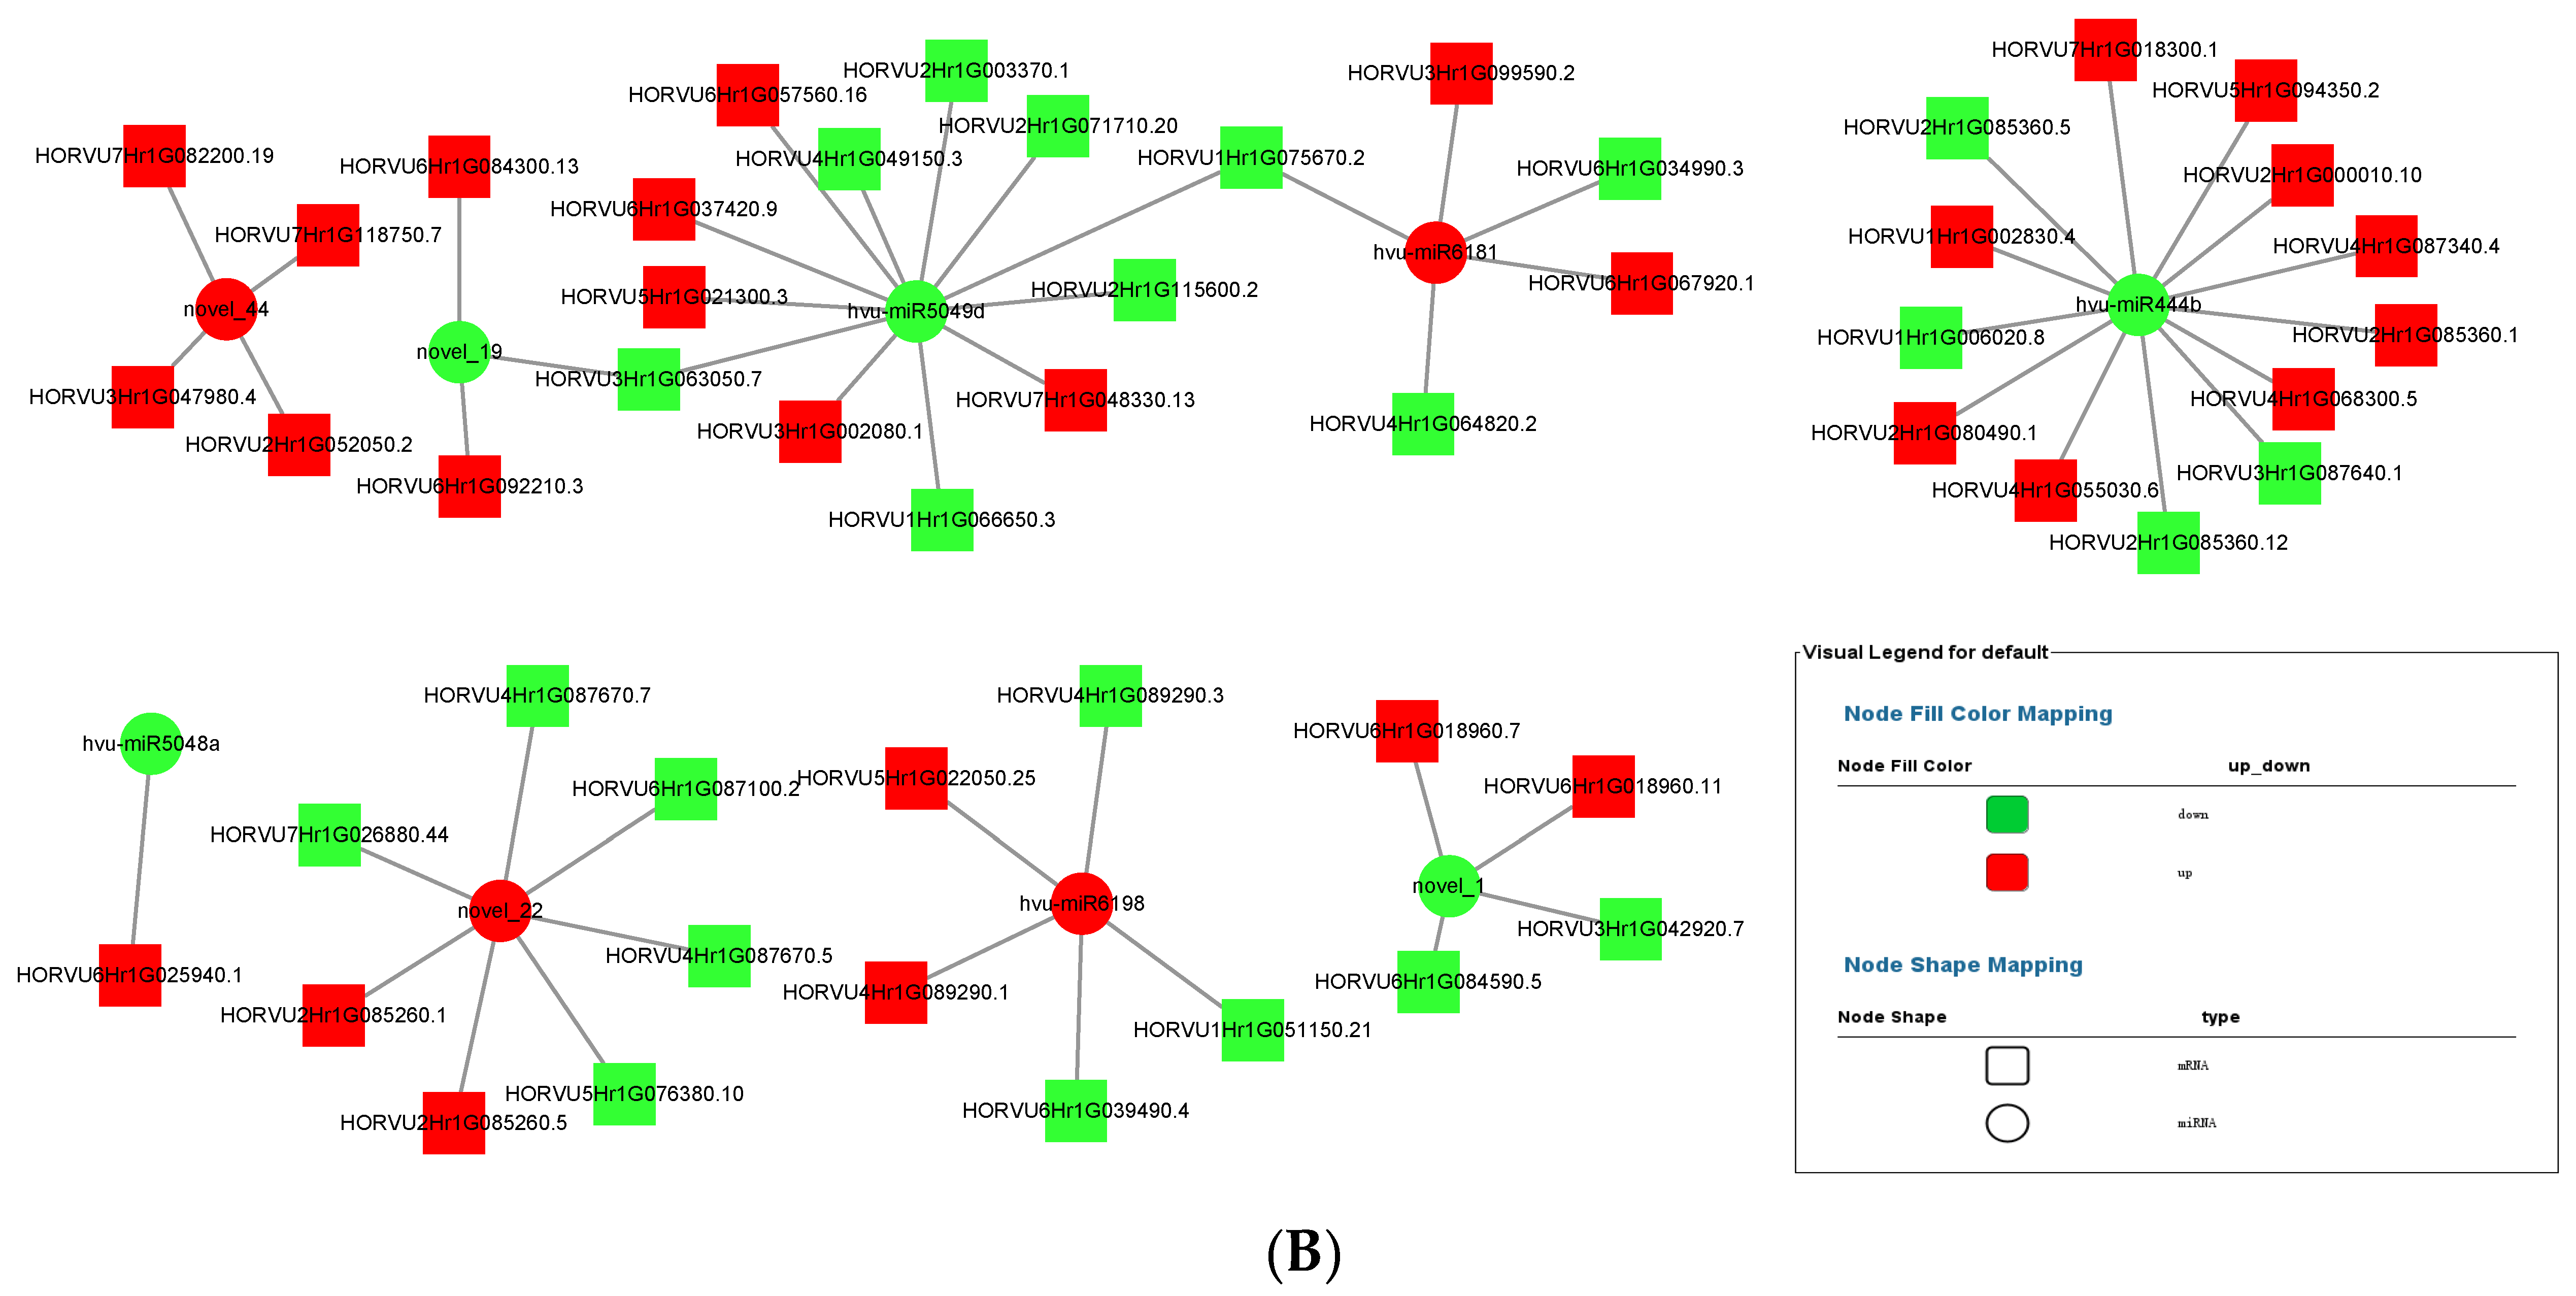
MiRNA up-regulated and down-regulated its expression in response to the colonization of P. indica, thereby affecting the expression of plant transcriptome. The miRNA–mRNA interaction diagrams of 3 dai vs. mock and 7 dai vs. mock were obtained by Cytoscape software, as shown in Figure 8A,B. Several key miRNAs including novel_1, novel_3, novel_22, novel_40, miR444b, miR6181, miR6198 were selected to construct the miRNA–mRNA interaction network. One miRNA can establish interactions with multiple target genes. Novel_1 showed strong positive correlation (r = 0.7852) with its targets HORVU7HrG012380. 5, HORVU7HrG055920. 2, HORVU4HrG050160, and HORVU4HrG064020 because both miRNA and its target genes were down-regulated. As shown in Table 2 and Table 3, most target mRNAs of novel_1 were involved in growth-regulating factor. It is reasonable to speculate that novel_1 acted as a trans-regulator regulating growth regulator in response to P. indica colonization. In contrast, miR444b showed a strong negative correlation (r = 0.7013) with its target mRNAs including HORVU3HrG076030, HORVU2HrG079610, HORVU5HrG094420.6, HORVU5HrG094420. 8, HORVU5HrG094420. 5, and HORVU4HrG087340. 8., except HORVU1HrG006020. Those target mRNAs of novel_444b were involved in MADS-box transcription factor 57.
4. Discussion
To cope with rapidly changing environments, plants employ a large number of mechanisms that provide phenotypic plasticity and allow fine-tuning of stress response actions. Advances in molecular biology have made great strides in identifying genomic regions and underlying mechanisms that influence transcriptional and post-transcriptional biotic and abiotic stress pathways regulation. In plants, miRNAs evolve and contribute to the complexity of these molecules through a series of pathways, and play an important role in the regulation of stress response activity. It has been shown that one way in which plants respond to environmental stress is through the activity of miRNAs. MiRNAs, as important regulatory molecules of plant biotic and abiotic stress response, are the driver molecules of RNA interference (RNAi), and ensure the up-regulation and down-regulation of target genes, and participate in important biological processes [41]. MiRNAs are small, 20–22 nt noncoding RNAs that regulate gene expression by post-transcriptional gene silencing in most eukaryotes [42]. RNA interference (RNAi) regulates gene expression by inducing degradation of messenger RNA (mRNA) or inhibiting its translation. MiRNAs play crucial roles in plant development, including the formation of embryo, meristem, leaf, and flower [43] as well as the responses to biotic and abiotic stresses [44].
P. indica is well known to be able to establish beneficial interactions with many different hosts, including monocotyledons such as barley, wheat, rice, corn, and dicotyledons such as Arabidopsis and tobacco [8], even on Brassicaceae family that cannot be colonized by mycorrhizal fungi [11]. Colonization of the roots by P. indica results in enhanced biomass production as well as increased resistance against biotic and abiotic stresses. We established and studied the interaction between barley—a major cereal crop—and P. indica—a beneficial endophyte with an exceptionally large host range. The functions and regulatory mechanisms of miRNAs in barley growth regulation during the symbiosis with P. indica were explored in our work. We showed that P. indica colonizes barley, resulting growth promotion in shoot, alterations in root architecture, and improved grain development.
4.1. Transcriptional Changes Detected during the Barley–P. indica Interaction
To investigate the interaction of barley with P. indica, we analyzed DEGs in colonized P. indica in comparison to axenic mycelium samples. Gene ontology analysis indicated DEGs with the greatest changes were mainly concentrated in oxidoreductase activity, ion transmembrane transporter activity, phosphate transporter, and tRNA THr modification in 3 dai vs. control, and other DEGs were concentrated in cellular respiration, ion transport, endonuclease activity, oxidoreductase activity and phosphate transporter in 7 dai vs. control. We noticed that the phosphate transporter gene which could promote the uptake of phosphorus by plant roots and provide essential nutrients for plants [45] was upregulated in both 3 dai vs. control and 7 dai vs. control. These results indicate that the interaction between barley and P. indica initiates the expression of proteins related to phosphorus transport. Other up-regulated genes encode enzymes involved in ion transport and ion transmembrane transporter activity. These proteins may modulate metal ions transport from soil into the plants. In fact, there are many transporters in P. indica which are responsible for the transfer of phosphorus [45] and sulfur elements [46] and the transport of metal elements. It is believed that these transporters play an important role in assisting the plant to absorb large and trace elements.
Roots of barley plants also displayed substantial transcriptional reprogramming following P. indica colonization. GO analysis indicated DEGs in barley root enrichment in nucleic acid metabolic and macromolecule biosynthetic, cellular marcomolecule biosynthetic and transferase activity associated processes in 3 dai vs. mock. Barley root DEGs exhibiting the greatest changes in expression between 7 dai and noncolonized plants are related to the primary metabolic process, cellular process, organic substance, transferase activity, and phosphotransferase activity. Previous research indicated that DEGs in Brachypodium distachyon after P. indica colonization involved in catalytic and oxidoreduction associated processes [30]. This also indicates that different plants have different transcriptome responses upon P. indica colonization. In 3 dai vs. mock, of the downregulated barley genes, several encode proteins commonly associated with stress responses, including a peroxidase and a putative protein kinase. Several downregulated DEGs also encode transcription factors, including growth-regulating factor 1/2/4/5/6-like (Table S7). One report also demonstrated that several DEGs encode transcription factors, including MYB-related, GRAS, and bZIP were downregulated in Brachypodium distachyon after P. indica colonization. Of the upregulated barley genes, several encode leucine rich repeat family and squamosa promoter-binding-like protein (Table S7). In 7 dai vs. mock, several upregulated DEGs also encode squamosa promoter-binding-like protein 16, serine/threonine-protein kinase SIS8, and some down regulated DEGs encode MADS-box transcription factor 57, pyruvate kinase, cytosolic, isozyme, and transcription initiation factor TFIID subunit 6 (Table S8). In 7 dai vs. 3 dai, the downregulated target genes were mainly encoded scarecrow-like protein and growth-regulating factor (Table S9).
4.2. Barley miRNAs Detected in the Barley–P. indica Interaction
The role of miRNAs as gene expression regulators in P. indica symbiosis has been largely unexplored in barley. The report demonstrated that P. indica promot plant growth associated miRNAs in Oncidium orchid roots [29]. Another study indicated that sRNAs reprogrammed after P. indica colonization in Brachypodium distachyon [30]. A high-throughput sequencing and comparative expression analysis were conducted. In total, 7,798,928, 6,418,039 and 7,136,192 clean reads were obtained from the libraries in control and P. indica-colonized root libraries. Differentially expressed microRNAs were found in the three comparison groups, including 3 dai vs. mock, 7 dai vs. mock and 7 dai vs. 3 dai (Figure 2). Analysis of putative endogenous barley miRNAs expressed during P. indica colonization identified 42 miRNAs. Some of them have unknown targets, whereas some of them have more than one target. For example, the miRNA hvu-miR1120 targets mRNAs (HORVU1Hr1G080480) encoding 6-phosphogluconate dehydrogenase and other targets mRNAs (HORVU4Hr1G002170) encoding general negative regulators of transcription. Four key miRNAs, including hvu-miR6181, novel_22, novel_44, and hvu-miR6198, were up-regulated both in 3 dai and 7 dai vs. mock in our work. Their targets gene functions were mainly involved in vacuolar protein-sorting-associated protein and squamosa promoter-binding-like protein. Other important miRNAs, such as hvu-miR1120, hvu-miR444b, novel_1, and hvu-miR397a, were down-regulated both in 3 dai and 7 dai vs. mock. Among them, hvu-miR6189, hvu-miR6214, hvu-miR444b, hvu-miR6190, hvu-miR397a, their targets mRNAs actually possess transcription factor activity (Table 4). In Arabidopsis, repression of transcription factors by the miR165/166 family modulates root growth, maintenance of the shoot apicalmeristem, and the development of leaf polarity; miR156-mediated downregulation of SPLs modulates developmental timing, lateral root development, branching, and leaf morphology [30]. This suggests that miRNAs, which regulate transcription factors, play an important role in plant growth and development. MiRNA including mir156, mir166, and mir169, which target mRNAs for the transcription factor genes SPL, PHV/PHB, and NTF, were also abundantly detected in Oncidium orchid roots after P. indica colonization [29]. This further indicates that the colonization of P. indica could reprogram miRNAs which participate in transcription factors regulation.
These miRNAs identified in barley include hvu-miR6180, hvu-miR6189, hvu-miR6214, hvu-miR444b, and hvu-miR6190, predicted to target genes involved in hormone activity, cell division, and photosynthesis pathway (Table 5). Because these miRNAs predict a variety of targets that are associated with plant growth and development, this group of miRNAs may play an important role in reprogramming plant cells during P. indica symbiosis establishment.
4.3. MiRNA and Target mRNA
MiRNAs regulate gene expression by mediating target gene silencing at transcriptional (TGS) and post-transcriptional (PTGS) levels, including DNA methylation, histone modification, translational repression, and RNA silencing [47,48]. They play important roles in plant development, differentiation, and response to biotic and abiotic stresses [48,49,50,51,52,53,54,55]. In the analysis of the interaction between miRNA and target genes, it was found that miRNA can be positively correlated with target genes or negatively correlated with target genes at 3 dai and 7 dai of P. indica. The predicted target genes of these miRNAs are mainly involved in transcription, cell division, auxin signal perception and transduction, photosynthesis, and hormone stimulus (Table 4 and Table 5). In fact, miRNAs can bind not only to mRNAs but also to long non-coding RNAs (lncRNA). LncRNAs acting as potential competing endogenous RNA-harboring microRNA response elements (MREs), thereby competing with mRNAs for shared miRNA and thus regulate miRNA-mediated gene silencing [44]. In our work, the lncRNA–mRNA–miRNA network was constructed, too (Figures S2 and S3). For instance, several key lncRNAs were found to have correlations with the miRNA including novel_1, novel_19, novel_22, novel_44hvu-miR6181, hvu-miR6198, and hvu-miR444b in 7 dai vs. mock; several key lncRNAs were also found to have correlations with the miRNAs, including novel_1, novel_2, novel_22, hvu-miR6181, hvu-miR6198, and hvu-miR444b in 3 dai vs. mock. These data suggest that these key miRNAs excavated play an important role in the regulation of plant growth in response to P. indica colonization. Specific regulatory functions of miRNAs on target genes and lncRNAs is the main research content in the future work.
5. Conclusions
We reported the miRNA profiling of barley after colonization by P. indica. The miRNAs and their target genes illustrated that the physiological metabolism of barley is reprogrammed in response to the symbiotic interaction. Genes participating in transcription, cell division, auxin signal perception and transduction, photosynthesis, and hormone stimulus are major targets of the P. indica-induced miRNAs in barley roots. Therefore, we propose that P. indica alters the miRNA pattern to establish an intricate network for growth promotion and developmental reprogramming and enhances resistance in barley roots. Several novel unique miRNAs were detected, for which a function could not yet be identified. Further investigations on the molecular mechanism of miRNAs in symbiotic interactions are of huge significance.
Supplementary Materials
The following supporting information can be downloaded at: https://www.mdpi.com/article/10.3390/jof9010024/s1, Figure S1: Cluster analysis of differentially expressed miRNAs; Figure S2: lncRNA-mRNA-miRNA network for 3 dai vs. Mock; Figure S3: lncRNA-mRNA-miRNA network for 7 dai vs. Mock. Table S1: Total reads in mock library; Table S2: Total reads in 3 dai library; Table S3: Total reads in 7 dai library; Table S4: miRNAlibraries quality; Table S5: Primers of target genes and miRNAs used for QPCR; Table S6: miRNA and their target_mRNA; Table S7: Up-regulated and down regulated targets mRNA in 3 dai vs. Mock; Table S8: Up-regulated and down regulated targets mRNA in 7 dai vs. Mock; Table S9: Down regulated targets mRNA in 7 dai vs. 3 dai.
Author Contributions
L.L.: conceptualization, methodology, investigation, formal analysis, visualization, writing—original draft preparation, reviewing, and editing. N.G.: investigation, formal analysis, visualization. Y.Z. and Z.Y.: software, data curation, formal analysis. S.L. and A.L.: investigation, formal analysis, writing—reviewing and editing, Z.W. reviewing and funding the project. All authors have read and agreed to the published version of the manuscript.
Funding
This research was funded by Natural Science Foundation of Hebei Province (Grant No. C2021202005) and National Natural Science Foundation of China (Grant No. 31801948) as well as S&T Program of Hebei Province (Grant No. 19226505D, 21326504D) for financial supports.
Institutional Review Board Statement
Not applicable.
Informed Consent Statement
Not applicable.
Data Availability Statement
All data generated or analyzed during this study are available in this article and its supplementary information files. All miRNA-sequencing data related to the present study have been deposited in the National Centre for Biotechnology Information (NCBI) under the Bioproject accession number PRJNA898289. (https://www.ncbi.nlm.nih.gov/sra/?term=PRJNA898289 (accessed on 12 November 2022)).
Acknowledgments
The author gratefully acknowledges support from Natural Science Foundation of Hebei Province (Grant No. C2021202005) and National Natural Science Foundation of China (Grant No. 31801948) as well as S&T Program of Hebei Province (Grant No. 19226505D, 21326504D) for financial supports. And the authors would like to thank Karl-Heinz-Kogel for the gift of the Piriformospora indica. The authors gratefully acknowledge the Wu Hongqing and Huang Zhihui for technical assistance in microscopy and macroscopy analyses. We also want to express our appreciation to students who contributed to this work, especially Feng Yu and Yuan Zhi. Lastly, we thank Mu Di for critical reading and revision of the manuscript.
Conflicts of Interest
The authors declare no conflict of interest.
References
- Fesel, P.H.; Zuccaro, A. Dissecting endophytic lifestyle along the parasitism/ mutualism continuum in Arabidopsis. Curr. Opin. Microbiol. 2016, 32, 103–112. [Google Scholar] [CrossRef] [PubMed] [Green Version]
- Lagunas, B.; Schäfer, P.; Gifford, M.L. Housing helpful invaders: The evolutionary and molecular architecture underlying plant root-mutualist microbe interactions. J. Exp. Bot. 2015, 66, 2177–2186. [Google Scholar] [CrossRef] [PubMed] [Green Version]
- Vishwakarma, K.; Kumar, N.; Shandilya, C.; Mohapatra, S.; Bhayana, S.; Varma, A. Revisiting plant-microbe interactions and microbial consortia application for enhancing sustainable agriculture: A review. Front. Microbiol. 2020, 11, 3195. [Google Scholar] [CrossRef] [PubMed]
- Li, L.; Guo, N.; Feng, Y.; Duan, M.; Li, C. Effect of Piriformospora indica-induced systemic resistance and basal immunity against Rhizoctonia cerealis and Fusarium graminearum in wheat. Front. Plant Sci. 2022, 13, 836940. [Google Scholar] [CrossRef]
- Deshmukh, S.; Huckelhoven, R.; Schäfer, P.; Imani, J.; Sharma, M.; Weiss, M.; Waller, F.; Kogel, K.-H. The root endophytic fungus Piriformospora indica requires host cell death for proliferation during mutualistic symbiosis with barley. Proc. Natl. Acad. Sci. USA 2006, 103, 18450–18457. [Google Scholar] [CrossRef] [Green Version]
- Li, D.; Bodjrenou, D.M.; Zhang, S.; Wang, B.; Pan, H.; Yeh, K.W.; Lai, Z.; Cheng, C. The endophytic fungus Piriformospora indica reprograms banana to cold resistance. Int. J. Mol. Sci. 2021, 22, 4973. [Google Scholar] [CrossRef]
- Sagonda, T.; Adil, M.F.; Sehar, S.; Rasheed, A.; Joan, H.I.; Ouyang, Y.; Shamsi, I.H. Physio-ultrastructural footprints and iTRAQ-based proteomic approach unravel the role of Piriformospora indica-colonization in counteracting cadmium toxicity in rice. Ecotoxicol. Environ. Saf. 2021, 220, 112390. [Google Scholar] [CrossRef]
- Kundu, A.; Mishra, S.; Kundu, P.; Jogawat, A.; Vadassery, J. Piriformospora indica recruits host-derived putrescine for growth promotion in plants. Plant Physiol. 2022, 188, 2289–2307. [Google Scholar] [CrossRef]
- Hua, M.D.; Senthil Kumar, R.; Shyur, L.F.; Cheng, Y.B.; Tian, Z.; Oelmüller, R.; Yeh, K.W. Metabolomic compounds identified in Piriformospora indica-colonized Chinese cabbage roots delineate symbiotic functions of the interaction. Sci. Rep. 2017, 7, 9291. [Google Scholar] [CrossRef] [Green Version]
- Atia, M.A.M.; Abdeldaym, E.A.; Abdelsattar, M.; Ibrahim, D.S.S.; Saleh, I.; Elwahab, M.A.; Osman, G.H.; Arif, I.A.; Abdelaziz, M.E. Piriformospora indica promotes cucumber tolerance against Root-knot nematode by modulating photosynthesis and innate responsive genes. Saudi J. Biol. Sci. 2020, 27, 279–287. [Google Scholar] [CrossRef]
- Kundu, A.; Vadassery, J. Molecular mechanisms of Piriformospora indica mediated growth promotion in plants. Plant Signal Behav. 2022, 17, 2096785. [Google Scholar] [CrossRef] [PubMed]
- Yang, L.; Cao, J.L.; Zou, Y.N.; Wu, Q.S.; Kuca, K. Piriformospora indica: A root endophytic fungus and its roles in plants. Not. Bot. Horti Agrobo. 2020, 48, 1–13. [Google Scholar] [CrossRef] [Green Version]
- Simon, S.A.; Meyers, B.C.; Sherrier, D.J. MicroRNAs in the rhizobia legume symbiosis. Plant Physiol. 2009, 151, 1002–1008. [Google Scholar] [CrossRef] [PubMed] [Green Version]
- Lai, E.C. miRNAs: Whys and wherefores of miRNA-mediated regulation. Curr. Biol. 2005, 15, 458–460. [Google Scholar] [CrossRef] [PubMed] [Green Version]
- Li, C.L.; Wang, M.Z.; Qiu, X.X.; Zhou, H.; Lu, S.F. Noncoding RNAs in medicinal plants and their regulatory roles in bioactive compound production. Curr. Pharm. Biotechnol. 2020, 22, 341–359. [Google Scholar] [CrossRef]
- Li, X.; Zhang, Y.Z. Computational detection of microRNAs targeting transcription factor genes in Arabidopsis thaliana. Comput. Biol. Chem. 2005, 29, 360–367. [Google Scholar] [CrossRef]
- Szittya, G.; Moxon, S.; Santos, D.M.; Jing, R.; Fevereiro, M.P.; Moulton, V.; Dalmay, T. High throughput sequencing of Medicago truncatula short RNAs identifies eight new miRNA families. BMC Genomics. 2008, 9, 593. [Google Scholar] [CrossRef] [Green Version]
- Voinnet, O. Origin, biogenesis, and activity of plant microRNAs. Cell 2008, 136, 669–687. [Google Scholar] [CrossRef] [Green Version]
- Subramanian, S.; Fu, Y.; Sunkar, R.; Barbazuk, W.B.; Zhu, J.K.; Yu, O. Novel and nodulation-regulated microRNAs in soybean roots. BMC Genom. 2008, 9, 160. [Google Scholar] [CrossRef] [Green Version]
- Lelandais-Briere, C.; Naya, L.; Sallet, E.; Calenge, F.; Frugier, F.; Hartmann, C.; Gouzy, J.; Crespi, M. Genome-wide Medicago truncatula small RNA analysis revealed novel microRNAs and isoforms differentially regulated in roots and nodules. Plant Cell 2009, 21, 2780–2796. [Google Scholar] [CrossRef]
- Branscheid, A.; Sieh, D.; Pant, B.D.; May, P.; Devers, E.A.; Elkrog, A.; Schauser, L.; Scheible, W.R.; Krajinski, F. Expression pattern suggests a role of MiR399 in the regulation of the cellular response to local Pi increase during arbuscular mycorrhizal symbiosis. Mol. Plant Microbe. Interact. 2010, 23, 915–926. [Google Scholar] [CrossRef] [PubMed] [Green Version]
- Devers, E.A.; Branscheid, A.; May, P.; Krajinski, F. Stars and symbiosis: microRNA and microRNA-mediated transcript cleavage involved in arbuscular mycorrhizal symbiosis. Plant Physiol. 2011, 156, 1990–2010. [Google Scholar] [CrossRef] [PubMed] [Green Version]
- Combier, J.P.; Frugier, F.; de Billy, F.; Boualem, A.; El-Yahyaoui, F.; Moreau, S.; Vernié, T.; Ott, T.; Gamas, P.; Crespi, M.; et al. MtHAP2-1 is a key transcriptional regulator of symbiotic nodule development regulated by microRNA169 in Medicago truncatula. Genes Dev. 2006, 20, 3084–3088. [Google Scholar] [CrossRef] [PubMed] [Green Version]
- Li, J.; Duan, Y.J.; Sun, N.L.; Wang, L.; Feng, S.S.; Fang, Y.J.; Wang, Y.P. The miR169n-NF-YA8 regulation module involved in drought resistance in Brassica napus L. Plant Sci. 2021, 313, 111062. [Google Scholar] [CrossRef]
- Xing, L.J.; Zhu, M.; Luan, M.D.; Zhang, M.; Jin, L.; Liu, Y.P.; Zou, J.J.; Wang, L.; Xu, M.Y. miR169q and nuclear factor YA8 enhance salt tolerance by activating PEROXIDASE1 expression in response to ROS. Plant Physiol. 2022, 188, 608–623. [Google Scholar] [CrossRef]
- Zhang, Y.Y.; Hong, Y.H.; Liu, Y.R.; Cui, J.; Luan, Y.S. Function identification of miR394 in tomato resistance to Phytophthora infestans. Plant Cell Rep. 2021, 40, 1831–1844. [Google Scholar] [CrossRef]
- Tomkowiak, A.; Jędrzejewski, T.; Spychała, J.; Kuczyński, J.; Kwiatek, M.T.; Tyczewska, A.; Skowrońska, R.; Twardowski, T. Analysis of miRNA expression associated with the Lr46 gene responsible for APR resistance in wheat (Triticum aestivum L.). J. Appl. Genet. 2020, 61, 503–511. [Google Scholar] [CrossRef]
- Chen, S.S.; Wu, J.D.; Zhang, Y.F.; Zhao, Y.Y.; Xu, W.J.; Li, Y.; Xie, J.B. Genome-wide analysis of coding and non-coding RNA reveals a conserved miR164-NAC-mRNA regulatory pathway for disease defense in Populus. Front. Genet. 2021, 12, 668940. [Google Scholar] [CrossRef]
- Ye, W.; Shen, C.H.; Lin, Y.; Chen, P.J.; Xu, X.; Oelmuller, R.; Yeh, K.W.; Lai, Z.X. Growth promotion-related miRNAs in Oncidium Orchid roots colonized by the endophytic fungus Piriformospora indica. PLoS ONE. 2014, 9, e84920. [Google Scholar] [CrossRef] [Green Version]
- Šečić, E.; Zanini, S.; Wibberg, D.; Jelonek, L.; Busche, T.; Kalinowski, J.; Nasfi, S.; Thielmann, J.; Imani, J.; Steinbrenner, J.; et al. A novel plant-fungal association reveals fundamental sRNA and gene expression reprogramming at the onset of symbiosis. BMC Biol. 2021, 19, 171. [Google Scholar] [CrossRef]
- Murashige, T.; Skoog, F. A revised medium for rapid growth and bio assays with tobacco tissue cultures. Physiol. Plant. 1962, 15, 473–497. [Google Scholar] [CrossRef]
- Varma, A.; Verma, S.; Sudha, X.; Sahay, N.; Bu¨tehorn, B.; Franken, P. Piriformospora indica, a cultivable plant-growth-promoting root endophyte. Appl. Environ. Microbiol. 1999, 65, 2741–2744. [Google Scholar] [CrossRef] [PubMed] [Green Version]
- Wang, L.; Feng, Z.; Wang, X.; Wang, X.; Zhang, X. DEGseq: An R package for identifying differentially expressed genes from RNA-seq data. Bioinformatics 2010, 26, 136–138. [Google Scholar] [CrossRef] [PubMed] [Green Version]
- Friedländer, M.R.; Mackowiak, S.D.; Li, N.; Chen, W.; Rajewsky, N. miRDeep2 accurately identifies known and hundreds of novel microRNA genes in seven animal clades. Nucleic Acids Res. 2011, 40, 37–52. [Google Scholar] [CrossRef] [Green Version]
- Wani, N.; Barh, D.; Raza, K. Modular network inference between miRNA-mRNA expression profiles using weighted co-expression network analysis. J. Integr. Bioinform. 2021, 18, 20210029. [Google Scholar] [CrossRef]
- Lavorgna, G.; Guffanti, A.; Borsani, G.; Ballabio, A.; Boncinelli, E. TargetFinder: Searching annotated sequence databases for target genes of transcription factors. Bioinformatics 1999, 15, 172–173. [Google Scholar] [CrossRef] [Green Version]
- Cline, M.S.; Smoot, M.; Cerami, E.; Kuchinsky, A.; Landys, N.; Workman, C.; Christmas, R.; Avila-Campilo, I.; Creech, M.; Gross, B.; et al. Integration of biological networks and gene expression data using Cytoscape. Nature Protocol. 2007, 2, 2366–2382. [Google Scholar] [CrossRef] [Green Version]
- Yu, Z.; Xu, Q.; Xiao, C.; Li, H.; Wu, W.; Du, W.; Zhao, J.; Liu, H.; Wang, H.; Liu, C. SYBR Green real-time qPCR method: Diagnose drowning more rapidly and accurately. Forensic. Sci. Int. 2021, 321, 110720. [Google Scholar] [CrossRef]
- Chen, C.; Ridzon, D.A.; Broomer, A.J.; Zhou, Z.; Lee, D.H.; Nguyen, J.T.; Barbisin, M.; Xu, N.; Mahuvakar, V.R.; Andersen, M.R.; et al. Realtime quantification of microRNAs by stem–loop RT-PCR. Nucleic Acids Res. 2005, 33, e179. [Google Scholar] [CrossRef]
- Kramer, M.F. Stem-loop RT-qPCR for miRNAs. Curr. Protoc. Mol. Biol. 2011, 95, Unit 15.10. [Google Scholar] [CrossRef]
- Alkan, A.H.; Akgül, B. Endogenous miRNA sponges. Methods Mol. Biol. 2022, 2257, 91–104. [Google Scholar] [PubMed]
- Bologna, N.G.; Voinnet, O. The diversity, biogenesis, and activities of endogenous silencing small RNAs in Arabidopsis. Annu. Rev. Plant Biol. 2014, 65, 473–503. [Google Scholar] [CrossRef]
- D’Ario, M.; Griffifiths-Jones, S.; Kim, M. Small RNAs: Big impact on plant development. Trends Plant Sci. 2017, 22, 1056–1068. [Google Scholar] [CrossRef] [PubMed] [Green Version]
- Khraiwesh, B.; Zhu, J.K.; Zhu, J. Role of miRNAs and siRNAs in biotic and abiotic stress responses of plants. Biochim. Biophys. Acta. 2012, 1819, 137–148. [Google Scholar] [CrossRef] [Green Version]
- Yadav, V.; Kumar, M.; Deep, D. A phosphate transporter from the root endophytic fungus Piriformospora indica plays a role in phosphate transport to the host plant. J. Biol.Chem. 2010, 285, 26532–26544. [Google Scholar] [CrossRef] [Green Version]
- Narayan, O.P.; Verma, N.; Jogawat, A.; Dua, M.; Johri, A.K. Sulfur transfer from the endophytic fungus Serendipita indica improves maize growth andrequires the sulfate transporter SiSulT. Plant Cell 2021, 33, 1268–1285. [Google Scholar] [CrossRef]
- Baulcombe, D. RNA silencing in plants. Nature 2004, 431, 356–363. [Google Scholar] [CrossRef]
- Hajdarpasic, A.; Ruggenthaler, P. Analysis of miRNA expression under stress in Arabidopsis thaliana. Bosn. J. Basic Med. Sci. 2012, 12, 169–176. [Google Scholar] [CrossRef] [Green Version]
- Chen, X. Small RNAs in development—Insights from plants. Curr. Opin. Genet. Dev. 2012, 22, 361–367. [Google Scholar] [CrossRef] [Green Version]
- Khan, G.; Declerck, M.; Sorin, C.; Hartmann, C.; Crespi, M.; Lelandais-Brière, C. MicroRNAs as regulators of root development and architecture. Plant Mol. Bio. 2011, 177, 1573–5028. [Google Scholar] [CrossRef]
- Luo, M.; Zhang, Z.M.; Gao, J.; Zeng, X.; Pan, G.T. The role of miR319 in plant development regulation. Yi Chuan. 2011, 33, 1203–1211. [Google Scholar] [CrossRef] [PubMed]
- Sunkar, R.; Li, Y.F.; Jagadeeswaran, G. Functions of microRNAs in plant stress responses. Trends Plant Sci. 2012, 17, 196–203. [Google Scholar] [CrossRef] [PubMed]
- Phillips, J.R.; Dalmay, T.; Bartels, D. The role of small RNAs in abiotic stress. FEBS Lett. 2007, 581, 3592–3597. [Google Scholar] [CrossRef] [PubMed]
- Guleria, P.; Mahajan, M.; Bhardwaj, J.; Yadav, S.K. Plant small RNAs: Biogenesis, mode of action and their roles in abiotic stresses. Genom. Proteom. Bioinf. 2011, 9, 183–199. [Google Scholar] [CrossRef] [Green Version]
- Chen, J.J.; Zhong, Y.Q.; Qi, X. LncRNA TCONS_00021861 is functionally associated with drought tolerance in rice (Oryza sativa L.) via competing endogenous RNA regulation. BMC Plant SBiol. 2021, 21, 410. [Google Scholar] [CrossRef]
Figure 1.
Root colonization by P. indica increases the growth and yield of barley. (A) Colonization pattern of P. indica on barley roots. Fluorescence microscopy showing WGA-AF488 staining of P. indica cell walls (λexc494 nm, λem515). (B,C) Total grain biomass of control vs. colonized plants at 3 dai and 7 dai. (D) Root branching between control and colonized roots at 3 dai. For b and c, barely seeds were seed soaking with 5 × 10⁵ chlamydospores per ml and grown in soil. (E) Shoot length of 3 dai vs. mock and 7 dai vs. mock. (F) weight of the seedlings from 3 dai vs. mock and 7 dai vs. mock Sample size n = 10. The results are from three independent biological replicates. The significance threshold for p values, corrected for multiple testing (Benjamini–Hochberg) was set at 0.05.

Figure 2.
Volcano plots of colonization-associated, differentially expressed miRNA in barley. (A) Barley differentially expressed miRNA identified by comparing reads from colonized roots at 3 dai vs. mock. (B) Barley differentially expressed miRNA identified by comparing reads from colonized roots at 7 dai vs. mock. (C) Barley differentially expressed miRNA identified by comparing reads from colonized roots at 7 dai vs. 3 dai. The dashed line in the figure shows the set threshold, vertical line (x = ±1) and horizontal line (y = 2). Genes with padj values less than 0.05 and absolute values of foldchange greater than 2 are generally considered as differential genes.

Figure 3.
Volcano plots of colonization-associated, differentially expressed genes (DEGs) in P. indica. (A) DEGs in P. indica identified by comparing reads from colonized roots at 3 dai vs. axenic mycelium. (B) DEGs in P. indica identified by comparing reads from colonized roots at 7 dai vs. axenic mycelium. (C) P. indica DEGs identified by comparing reads from colonized roots at 7 dai vs. 3 dai. The dashed line in the figure shows the set threshold, vertical line (x = ±1) and horizontal line (y = 2). Genes with padj values less than 0.05 and absolute values of foldchange greater than 2 are generally considered as differential genes.

Figure 4.
Go enrichment histogram of differentially expressed genes (DEGs) in P. indica. (A) GO enrichment in 3 days vs. control; (B) GO enrichment in 7 days vs. control. The abscissa denotes the name of GO entry, which is divided into three categories by box: BP: biological process, CC: cell component, MF: molecular function, distinguished by different frames, and the ordinate is the number of genes enriched by GO entry. The significance threshold for p values, corrected for multiple testing (Benjamini–Hochberg) was set at 0.05 (* ≤ 0.05).

Figure 5.
Venn diagrams showing the sample-exclusive or communal presence of unique putative endogenous miRNAs. (A) putative endogenous miRNAs in 7 dai-mock vs. 3 dai-mock, (B) miRNAs in 3 dai-mock vs. 7dai-3dai; (C) miRNAs in 7 dai-mock vs. 7 dai-3 dai; (D) miRNAs in 3 dai-mock vs. 7 dai-3 dai vs. 7 dai-mock.

Figure 6.
Go enrichment histogram of differentially expressed genes (DEGs) in barley. (A) GO enrichment in 3 dai vs. mock; (B) GO enrichment in 7 dai vs. mock. (C) GO enrichment in 7 dai vs. 3 dai. The abscissa denotes the name of GO entry, which is divided into three categories by box: BP: biological process, CC: cell component, MF: molecular function, distinguished by different frames, and the ordinate is the number of genes enriched by GO entry. (D) The chart shows that miRNA_novel 40 was downregulated and its target genes HORVU5Hr1G054420.4 was upregulated; another target gene HORVU7Hr1G088630 was downregulated. The experiments of q-PCR and the data analyses were performed in three biological replicates. ** Highly significant difference (p < 0.01).

Figure 7.
The relative expression of miRNAs and their target genes involved in the growth-regulating factor, promoter-binding-like protein, and transcription factor. (A) The chart shows that miRNA_novel 1 was downregulated and its target genes HORVU7Hr1G012380 and HORVU5Hr1G055920 were down-regulated. (B) The chart shows that miRNA_444b was downregulated and its target genes HORVU3Hr1G076030 was upregulated but HORVU5Hr1G006020.8 were down-regulated. (C) The chart shows that miRNA_novel 22 was upregulated and its target genes HORVU4Hr1G082910 was upregulated, too. The other target gene HORVU2Hr1G085210 was downregulated.

Figure 8.
Networks of miRNA–mRNA. (A) Network of miRNA–mRNA for 3 dai vs. mock. miRNA–mRNA network was constructed for 3 dai vs. mock based on the co-expression correlation of miRNA–mRNA (Circle node: miRNA. Diamond nodes: mRNA. Red color: up-regulation; green color: down-regulation). (B) Network of miRNA-mRNA for 7 dai vs. mock. miRNA–mRNA network was constructed for 7 dai vs. mock based on the co-expression correlation of miRNA-mRNA (Circle node: miRNA. Diamond nodes: mRNA. Red color: up-regulation; green color: down-regulation).


Table 1.
Top 20 P. indica differentially expressed genes (DEGs) during colonization (3 dai vs. control).
Table 1.
Top 20 P. indica differentially expressed genes (DEGs) during colonization (3 dai vs. control).
| Gene | Description | Log2FC | EXP |
|---|---|---|---|
| PIIN_mito_NAD4 | oxidoreductase activity | 16.468 | up |
| PIIN_mito_NAD2 | oxidoreductase activity | 11.841 | up |
| PIIN_mito_COX3 | membrane | 14.225 | up |
| PIIN_mito_ATP9 | ion transport | 13.467 | up |
| PIIN_mito_NAD5 | oxidoreductase activity | 13.356 | up |
| PIIN_mito_COX1 | Ion transmembrane transporter activity | 13.053 | up |
| PIIN_mito_NAD3 | oxidoreductase activity | 12.363 | up |
| PIIN_mito_COX2 | ion transmembrane transporter activity | 12.764 | up |
| PIIN_mito_COB | membrane | 12.641 | up |
| PIIN_mit_GIY1 | molecular_function | 12.236 | up |
| PIIN_mit_LAG4 | endonuclease activity | 11.708 | up |
| PIIN_mit_NAD2 | oxidoreductase activity | 11.65 | up |
| PIIN_08131 | phosphate transporter | 8.031 | up |
| PIIN_mit_LAG8 PIIN_mito_NAD6 PIIN_mito_NAD1 PIIN_mit_LAG7 PIIN_mito_ATP6 PIIN_05864 PIIN_03862 PIIN_mito_RPS3 | None oxidoreductase activity membrane endonuclease activity ion transport ion transport tRNA THr modification None | 11.505 11.444 11.201 11.166 11.087 10.883 10.583 10.045 | up up up up up up up up |
Table 2.
Top 20 P. indica differentially expressed genes (DEGs) during colonization (7 dai vs. control).
Table 2.
Top 20 P. indica differentially expressed genes (DEGs) during colonization (7 dai vs. control).
| Gene | Description | FC | EXP |
|---|---|---|---|
| PIIN_mito_NAD4 | cellular respiration | 16.297 | up |
| PIIN_09240 | None | 14.972 | up |
| PIIN_mito_COX3 | membrane | 13.926 | up |
| PIIN_mito_ATP9 | ion transport | 13.449 | up |
| PIIN_mito_NAD5 | cellular respiration | 13.182 | up |
| PIIN_mito_COX1 | Ion transmembrane transporter activity | 12.757 | up |
| PIIN_mito_NAD3 | oxidoreductase activity | 12.645 | up |
| PIIN_08131 | phosphate transporter | 12.531 | up |
| PIIN_mito_COX2 | ion transmembrane transporter activity | 12.391 | up |
| PIIN_mito_COB | membrane | 12.268 | up |
| PIIN_mito_NAD3 PIIN_mito_ATP6 PIIN_mit_GIY1 PIIN_03862 PIIN_mito_NAD6 PIIN_mit_NAD2 PIIN_mit_LAG7 PIIN_mito_NAD1 PIIN_mit_LAG8 PIIN_05864 PIIN_mito_RPS3 | oxidoreductase activity ion transport molecular_function tRNA THr modification oxidoreductase activity oxidoreductase activity endonuclease activity membrane None ion transport None | 12.363 11.975 11.899 11.875 11.858 11.841 11.62 11.379 10.883 10.596 10.353 | up up up up up up up up up up up |
Table 3.
P. indica differentially expressed genes (DEGs) during colonization (7 dai vs. 3 dai).
| Gene | Description | FC | EXP |
|---|---|---|---|
| PIIN_09391 | copper ion transmembrane transporter activity | 4.543 | up |
| PIIN_07598 | serine-type endopeptidase activity | 5.0228 | up |
| PIIN_04659 | None | 2.796 | up |
| PIIN_07107 | plasma membrane | 3.8174 | up |
| PIIN_05757 | None | 2.1593 | up |
| PIIN_08262 | lyase activity | 1.7341 | up |
| PIIN_08836 | pathogenesis | 2.4633 | up |
| PIIN_08345 | None | 2.9089 | up |
| PIIN_06899 | single-organism process | 2.3964 | up |
| PIIN_08131 | lyase activity | 1.8848 | up |
Table 4.
Functions of target mRNA corresponding to upregulated miRNA in 3 dai vs. mock.
| miRNA | Target mRNA | Score | The Function of mRNA |
|---|---|---|---|
| hvu-miR5049a | HORVU1Hr1G020490 | 0 | uncharacterized protein LOC123407470 |
| HORVU1Hr1G091240 | 0 | Serine/threonine-protein kinase STY13 | |
| HORVU1Hr1G041440 | 1 | uncharacterized protein LOC123431160 | |
| HORVU2Hr1G084120 | 0 | uncharacterized membrane protein YuiD | |
| HORVU2Hr1G078270 | 0 | protein LURP-one-related 6 | |
| HORVU2Hr1G096290 | 0 | thioredoxin-like 3-3 isoform X1 | |
| HORVU5Hr1G060310 | 0 | putative transcription factor RL9 | |
| HORVU6Hr1G018530 | 0 | uncharacterized protein LOC123402714 | |
| HORVU6Hr1G025780 | 0 | protein argonaute 1B | |
| HORVU5Hr1G112710 | 0 | leucine rich repeat family expressed | |
| HORVU7Hr1G096360 | 0 | uncharacterized protein LOC123411193 | |
| HORVU6Hr1G083120 | 0.5 | 60S ribosomal protein L35a-1 | |
| novel_22 | HORVU3Hr1G094730 | 1 | squamosa promoter-binding-like protein 2 |
| HORVU6Hr1G028980 | 1 | cinnamoyI-CoA reductase 1 | |
| HORVU6Hr1G031450 | 1 | squamosa promoter-binding-like protein 4 | |
| HORVU0Hr1G039170 | 1 | squamosa promoter-binding-like protein 16 | |
| hvu-miR171-3p | HORVU4Hr1G010490 | 0 | protein MIZU-KUSSEI 1 |
| HORVU4Hr1G087700 | 0 | scarecrow-like protein 6 | |
| HORVU6Hr1G063650 | 1 | scarecrow-like protein 27 | |
| HORVU7Hr1G001300 | 1 | scarecrow-like protein 22 |
Table 5.
Functions of target mRNA corresponding to down-regulated miRNA in 3 dai vs. mock.
| miRNA | Target mRNA | Score | The Function of Target mRNA |
|---|---|---|---|
| hvu-miR397a | HORVU6Hr1G025830 | 0 | Uncharacterized protein LOC123403149 |
| hvu-miR444b | HORVU6Hr1G073040 | 1 | MADS-box transcription factor 57 |
| hvu-miR1120 | HORVU1Hr1G080480 | 1 | 6-phosphogluconate dehydrogenase |
| HORVU3Hr1G039220 | 0 | pyruvate kinase, cytosolic. Isozyme | |
| HORVU3Hr1G067470 | 1 | 26S proteasome regulatory subunit 6B homolog | |
| HORVU4Hr1G002170 | 1 | general negative regulator of transcription subunit 3 isoform X4 | |
| HORVU7Hr1G030930 | 1 | AUGMIN subunit 3 | |
| novel_1 | HORVU2Hr1G101770 | 1 | growth-regulating factor 3-like |
| HORVU6Hr1G068370 | 1 | growth-regulating factor 4-like isoform X1 | |
| HORVU7Hr1G034610 | 1 | growth-regulating factor 2-like | |
| HORVU6Hr1G081210 | 1 | growth-regulating factor 1-like | |
| HORVU7Hr1G008680 | 1 | growth-regulating factor 5-like isoform X1 | |
| HORVU0Hr1G016610 | 1 | growth-regulating factor 4-like isoform X2 | |
| HORVU0Hr1G026650 | 1 | predicted protein | |
| HORVU0Hr1G016590 | 1 | predicted protein |
Table 6.
Several key miRNAs targets involved in the regulation of gene transcription.
| miRNA | Gene_names | GO_accession | pval | Description | log2FoldChange | |
|---|---|---|---|---|---|---|
| 3 dai vs.mock | hvu-miR6189 | HORVU3Hr1G055830 | GO:0008134 | 3.0700 × 10⁻⁷ | transcription factor binding | 0.94830 |
| hvu-miR6189 | HORVU5Hr1G021690 | GO:0001071 | 3.0700 × 10⁻⁷ | nucleic acid binding transcription factor activity | 0.94830 | |
| hvu-miR6189 | HORVU3Hr1G086270 | GO:0001071 | 3.0700 × 10⁻⁷ | nucleic acid binding transcription factor activity | 0.94830 | |
| hvu-miR6189 | HORVU1Hr1G095410 | GO:0098531 | 3.0700 × 10⁻⁷ | transcription factor activity, direct ligand regulated sequence-specific DNA binding | 0.94830 | |
| hvu-miR6189 | HORVU3Hr1G089580 | GO:0000989 | 3.0700 × 10⁻⁷ | transcription factor activity, transcription factor binding | 0.94830 | |
| hvu-miR6189 | HORVU3Hr1G026990 | GO:0001071 | 3.0700 × 10⁻⁷ | nucleic acid binding transcription factor activity | 0.94830 | |
| hvu-miR6214 | HORVU6Hr1G057060 | GO:0003700 | 1.3136 × 10⁻² | transcription factor activity, sequence-specific DNA binding | −1.41320 | |
| hvu-miR6214 | HORVU1Hr1G051970 | GO:0001071 | 1.3136 × 10⁻² | nucleic acid binding transcription factor activity | −1.41320 | |
| hvu-miR6214 | HORVU7Hr1G036130 | GO:0003700 | 1.3136 × 10⁻² | transcription factor activity, sequence-specific DNA binding | −1.41320 | |
| hvu-miR6214 | HORVU1Hr1G020620 | GO:0001071 | 1.3136 × 10⁻² | nucleic acid binding transcription factor activity | −1.41320 | |
| hvu-miR6214 | HORVU6Hr1G081340 | GO:0003700 | 1.3136 × 10⁻² | transcription factor activity, sequence-specific DNA binding | −1.41320 | |
| hvu-miR444b | HORVU0Hr1G032300 | GO:0001071 | 5.2200 × 10⁻⁶ | nucleic acid binding transcription factor activity | −2.59460 | |
| hvu-miR444b | HORVU2Hr1G079610 | GO:0001071 | 5.2200 × 10⁻⁶ | nucleic acid binding transcription factor activity | −2.59460 | |
| hvu-miR444b | HORVU2Hr1G080490 | GO:0001071 | 5.2200 × 10⁻⁶ | nucleic acid binding transcription factor activity | −2.59460 | |
| hvu-miR444b | HORVU3Hr1G055960 | GO:0001071 | 5.2200 × 10⁻⁶ | nucleic acid binding transcription factor activity | −2.59460 | |
| hvu-miR444b | HORVU1Hr1G051370 | GO:0001076 | 5.2200 × 10⁻⁶ | transcription factor activity, RNA polymerase II transcription factor binding | −2.59460 | |
| hvu-miR444b | HORVU0Hr1G030830 | GO:0003700 | 5.2200 × 10⁻⁶ | transcription factor activity, sequence-specific DNA binding | −2.59460 | |
| hvu-miR444b | HORVU4Hr1G069340 | GO:0003700 | 5.2200 × 10⁻⁶ | transcription factor activity, sequence-specific DNA binding | −2.59460 | |
| hvu-miR444b | HORVU5Hr1G055470 | GO:0001071 | 5.2200 × 10⁻⁶ | nucleic acid binding transcription factor activity | −2.59460 | |
| hvu-miR444b | HORVU5Hr1G092310 | GO:0001071 | 5.2200 × 10⁻⁶ | nucleic acid binding transcription factor activity | −2.59460 | |
| hvu-miR444b | HORVU5Hr1G119220 | GO:0008134 | 5.2200 × 10⁻⁶ | transcription factor binding | −2.59460 | |
| hvu-miR444b | HORVU4Hr1G087360 | GO:0000989 | 5.2200 × 10⁻⁶ | transcription factor activity, transcription factor binding | −2.59460 | |
| hvu-miR444b | HORVU2Hr1G108210 | GO:0000988 | 5.2200 × 10⁻⁶ | transcription factor activity, protein binding | −2.59460 | |
| hvu-miR444b | HORVU4Hr1G028610 | GO:0044798 | 5.2200 × 10⁻⁶ | nuclear transcription factor complex | −2.59460 | |
| hvu-miR444b | HORVU5Hr1G000370 | GO:0001071 | 5.2200 × 10⁻⁶ | nucleic acid binding transcription factor activity | −2.59460 | |
| hvu-miR444b | HORVU3Hr1G054770 | GO:0008134 | 5.2200 × 10⁻⁶ | transcription factor binding | −2.59460 | |
| hvu-miR444b | HORVU6Hr1G062340 | GO:0090575 | 5.2200 × 10⁻⁶ | RNA polymerase II transcription factor complex | −2.59460 | |
| hvu-miR444b | HORVU6Hr1G066140 | GO:0003700 | 5.2200 × 10⁻⁶ | transcription factor activity, sequence-specific DNA binding | −2.59460 | |
| hvu-miR444b | HORVU5Hr1G123770 | GO:0003700 | 5.2200 × 10⁻⁶ | transcription factor activity, sequence-specific DNA binding | −2.59460 | |
| hvu-miR444b | HORVU5Hr1G000370 | GO:0003700 | 5.2200 × 10⁻⁶ | transcription factor activity, sequence-specific DNA binding | −2.59460 | |
| hvu-miR444b | HORVU7Hr1G024000 | GO:0003700 | 5.2200 × 10⁻⁶ | transcription factor activity, sequence-specific DNA binding | −2.59460 | |
| hvu-miR444b | HORVU7Hr1G023940 | GO:0001071 | 5.2200 × 10⁻⁶ | nucleic acid binding transcription factor activity | −2.59460 | |
| hvu-miR444b | HORVU6Hr1G073040 | GO:0001071 | 5.2200 × 10⁻⁶ | nucleic acid binding transcription factor activity | −2.59460 | |
| hvu-miR444b | HORVU7Hr1G026940 | GO:0003700 | 5.2200 × 10⁻⁶ | transcription factor activity, sequence-specific DNA binding | −2.59460 | |
| hvu-miR444b | HORVU4Hr1G087570 | GO:0008134 | 5.2200 × 10⁻⁶ | transcription factor binding | −2.59460 | |
| hvu-miR444b | HORVU6Hr1G034130 | GO:0000989 | 5.2200 × 10⁻⁶ | transcription factor activity, transcription factor binding | −2.59460 | |
| hvu-miR6190 | HORVU1Hr1G082910 | GO:0003700 | 4.6930 × 10⁻² | transcription factor activity, sequence-specific DNA binding | 4.59780 | |
| hvu-miR6190 | HORVU1Hr1G063610 | GO:0003700 | 4.6930 × 10⁻² | transcription factor activity, sequence-specific DNA binding | 4.59780 | |
| hvu-miR6190 | HORVU6Hr1G008320 | GO:0090575 | 4.6930 × 10⁻² | RNA polymerase II transcription factor complex | 4.59780 | |
| hvu-miR6190 | HORVU7Hr1G091040 | GO:0003700 | 4.6930 × 10⁻² | transcription factor activity, sequence-specific DNA binding | 4.59780 | |
| hvu-miR6190 | HORVU5Hr1G120230 | GO:0001071 | 4.6930 × 10⁻² | nucleic acid binding transcription factor activity | 4.59780 | |
| hvu-miR6214 | HORVU0Hr1G012230 | GO:0000988 | 4.0994 × 10⁻³ | transcription factor activity, protein binding | −3.97730 | |
| hvu-miR6214 | HORVU1Hr1G047110 | GO:0000989 | 4.0994 × 10⁻³ | transcription factor activity, transcription factor binding | −3.97730 | |
| hvu-miR6214 | HORVU7Hr1G001070 | GO:0000989 | 4.0994 × 10⁻³ | transcription factor activity, transcription factor binding | −3.97730 | |
| hvu-miR6214 | HORVU3Hr1G024950 | GO:0003700 | 4.0994 × 10⁻³ | transcription factor activity, sequence-specific DNA binding | −3.97730 | |
| hvu-miR6184 | HORVU7Hr1G114030 | GO:0001071 | 3.6984 × 10⁻² | nucleic acid binding transcription factor activity | −4.76840 | |
| hvu-miR397a | HORVU2Hr1G059320 | GO:0000989 | 1.8131 × 10⁻² | transcription factor activity, transcription factor binding | −5.24440 | |
| hvu-miR397a | HORVU4Hr1G080350 | GO:0003700 | 1.8131 × 10⁻² | transcription factor activity, sequence-specific DNA binding | −5.24440 | |
| hvu-miR6214 | HORVU1Hr1G020620 | GO:0001071 | 3.0948 × 10⁻² | nucleic acid binding transcription factor activity | 0.78887 | |
| hvu-miR6214 | HORVU7Hr1G117010 | GO:0003700 | 3.0948 × 10⁻² | transcription factor activity, sequence-specific DNA binding | 0.78887 | |
| hvu-miR6180 | HORVU2Hr1G035310 | GO:0000989 | 4.8474 × 10⁻² | transcription factor activity, transcription factor binding | −1.65400 | |
| hvu-miR6180 | HORVU5Hr1G046390 | GO:0001071 | 4.8474 × 10⁻² | nucleic acid binding transcription factor activity | −1.65400 | |
| hvu-miR6180 | HORVU5Hr1G070260 | GO:0003700 | 4.8474 × 10⁻² | transcription factor activity, sequence-specific DNA binding | −1.64310 |
Table 7.
Examples of miRNAs and their up-and downregulated targets in barley.
| miRNA | Target_ Gene | p-Value | GO Term Accession | Function Description | log2 Fold Change | |
|---|---|---|---|---|---|---|
| 7 dai vs. 3 dai | hvu-miR6214 | HORVU7Hr1G036130 | 3.0948 × 10⁻² | GO:0005179 | hormone activity | 0.78887 |
| hvu-miR6180 | HORVU1Hr1G037250 | 4.8474 × 10⁻² | GO:0005179 | hormone activity | −1.65400 | |
| hvu-miR6180 | HORVU3Hr1G068970 | 4.8474 × 10⁻² | GO:0005184 | neuropeptide hormone activity | −1.65400 | |
| hvu-miR6189 | HORVU5Hr1G067480 | 3.0700 × 10⁻⁷ | GO:0051301 | cell division | 0.94830 | |
| hvu-miR6189 | HORVU4Hr1G036120 | 3.0700 × 10⁻⁷ | GO:0009725 | response to hormone | 0.94830 | |
| hvu-miR6189 | HORVU3Hr1G089580 | 3.0700 × 10⁻⁷ | GO:0035257 | nuclear hormone receptor binding | 0.94830 | |
| hvu-miR6189 | HORVU1Hr1G095410 | 3.0700 × 10⁻⁷ | GO:0015979 | photosynthesis | 0.94830 | |
| hvu-miR6189 | HORVU6Hr1G056490 | 3.0700 × 10⁻⁷ | GO:0015979 | photosynthesis | 0.94830 | |
| hvu-miR6214 | HORVU2Hr1G021110 | 1.3136 × 10⁻² | GO:0051301 | cell division | −1.41320 | |
| hvu-miR6214 | HORVU5Hr1G051090 | 1.3136 × 10⁻² | GO:0051301 | cell division | −1.41320 | |
| hvu-miR6214 | HORVU4Hr1G009990 | 1.3136 × 10⁻² | GO:0015979 | photosynthesis | −1.41320 | |
| 3 dai vs. mock | hvu-miR6214 | HORVU5Hr1G070630 | 1.3136 × 10⁻² | GO:0019684 | photosynthesis, light reaction | −1.41320 |
| hvu-miR6214 | HORVU6Hr1G074220 | 1.3136 × 10⁻² | GO:0015979 | photosynthesis | −1.41320 | |
| hvu-miR444b | HORVU5Hr1G092310 | 5.2200 × 10⁻⁶ | GO:0051301 | cell division | −2.59460 | |
| hvu-miR444b | HORVU6Hr1G009230 | 5.2200 × 10⁻⁶ | GO:0051301 | cell division | −2.59460 | |
| hvu-miR444b | HORVU5Hr1G069040 | 5.2200 × 10⁻⁶ | GO:0047746 | chlorophyllase activity | −2.59460 | |
| hvu-miR444b | ENSRNA049488557 | 5.2200 × 10⁻⁶ | GO:0007059 | chromosome segregation | −2.59460 | |
| hvu-miR444b | HORVU2Hr1G124270 | 5.2200 × 10⁻⁶ | GO:0098813 | nuclear chromosome segregation | −2.59460 | |
| hvu-miR444b | HORVU1Hr1G047730 | 5.2200 × 10⁻⁶ | GO:0005185 | neurohypophyseal hormone activity | −2.59460 | |
| hvu-miR444b | HORVU3Hr1G061700 | 5.2200 × 10⁻⁶ | GO:0005184 | neuropeptide hormone activity | −2.59460 | |
| hvu-miR444b | HORVU7Hr1G048310 | 5.2200 × 10⁻⁶ | GO:0005179 | hormone activity | −2.59460 | |
| hvu-miR444b | HORVU2Hr1G090100 | 5.2200 × 10⁻⁶ | GO:0015979 | photosynthesis | −2.59460 | |
| hvu-miR444b | HORVU4Hr1G087360 | 5.2200 × 10⁻⁶ | GO:0015979 | photosynthesis | −2.59460 | |
| hvu-miR6190 | HORVU7Hr1G040960 | 4.6930 × 10⁻² | GO:0005179 | hormone activity | 4.59780 | |
| hvu-miR6190 | HORVU7Hr1G068230 | 4.6930 × 10⁻² | GO:0005179 | hormone activity | 4.59780 | |
| hvu-miR6190 | HORVU2Hr1G057700 | 4.6930 × 10⁻² | GO:0042548 | regulation of photosynthesis, light reaction | 4.59780 | |
| hvu-miR6190 | HORVU3Hr1G016330 | 4.6930 × 10⁻² | GO:0015979 | photosynthesis | 4.59780 | |
| 7 dai vs. mock | hvu-miR6214 | HORVU3Hr1G021610 | 4.0994 × 10⁻³ | GO:0051301 | cell division | −3.97730 |
| hvu-miR6214 | HORVU5Hr1G051090 | 4.0994 × 10⁻³ | GO:0051301 | cell division | −3.97730 | |
| hvu-miR6214 | HORVU3Hr1G078090 | 4.0994 × 10⁻³ | GO:0005179 | hormone activity | −3.97730 | |
| hvu-miR6214 | HORVU5Hr1G070630 | 4.0994 × 10⁻³ | GO:0005179 | hormone activity | −3.97730 | |
| hvu-miR6214 | HORVU7Hr1G036130 | 4.0994 × 10⁻³ | GO:0005179 | hormone activity | −3.97730 | |
| hvu-miR397a | HORVU4Hr1G036120 | 1.8131 × 10⁻² | GO:0009733 | response to auxin | −5.24440 |
Disclaimer/Publisher’s Note: The statements, opinions and data contained in all publications are solely those of the individual author(s) and contributor(s) and not of MDPI and/or the editor(s). MDPI and/or the editor(s) disclaim responsibility for any injury to people or property resulting from any ideas, methods, instructions or products referred to in the content. |
© 2022 by the authors. Licensee MDPI, Basel, Switzerland. This article is an open access article distributed under the terms and conditions of the Creative Commons Attribution (CC BY) license (https://creativecommons.org/licenses/by/4.0/).
Share and Cite
MDPI and ACS Style
Li, L.; Guo, N.; Zhang, Y.; Yuan, Z.; Lu, A.; Li, S.; Wang, Z. Reprogramming of Fundamental miRNA and Gene Expression during the Barley-Piriformospora indica Interaction. J. Fungi 2023, 9, 24. https://doi.org/10.3390/jof9010024
AMA Style
Li L, Guo N, Zhang Y, Yuan Z, Lu A, Li S, Wang Z. Reprogramming of Fundamental miRNA and Gene Expression during the Barley-Piriformospora indica Interaction. Journal of Fungi. 2023; 9(1):24. https://doi.org/10.3390/jof9010024
Chicago/Turabian StyleLi, Liang, Nannan Guo, Yanze Zhang, Zhi Yuan, Aidang Lu, Si Li, and Ziwen Wang. 2023. "Reprogramming of Fundamental miRNA and Gene Expression during the Barley-Piriformospora indica Interaction" Journal of Fungi 9, no. 1: 24. https://doi.org/10.3390/jof9010024
Note that from the first issue of 2016, this journal uses article numbers instead of page numbers. See further details here.