
Microbiomic Analysis of Bacteria Associated with Rock Tripe Lichens in Continental and Maritime Antarctic Regions


 , , , and
Abstract
:1. Introduction
2. Materials and Methods
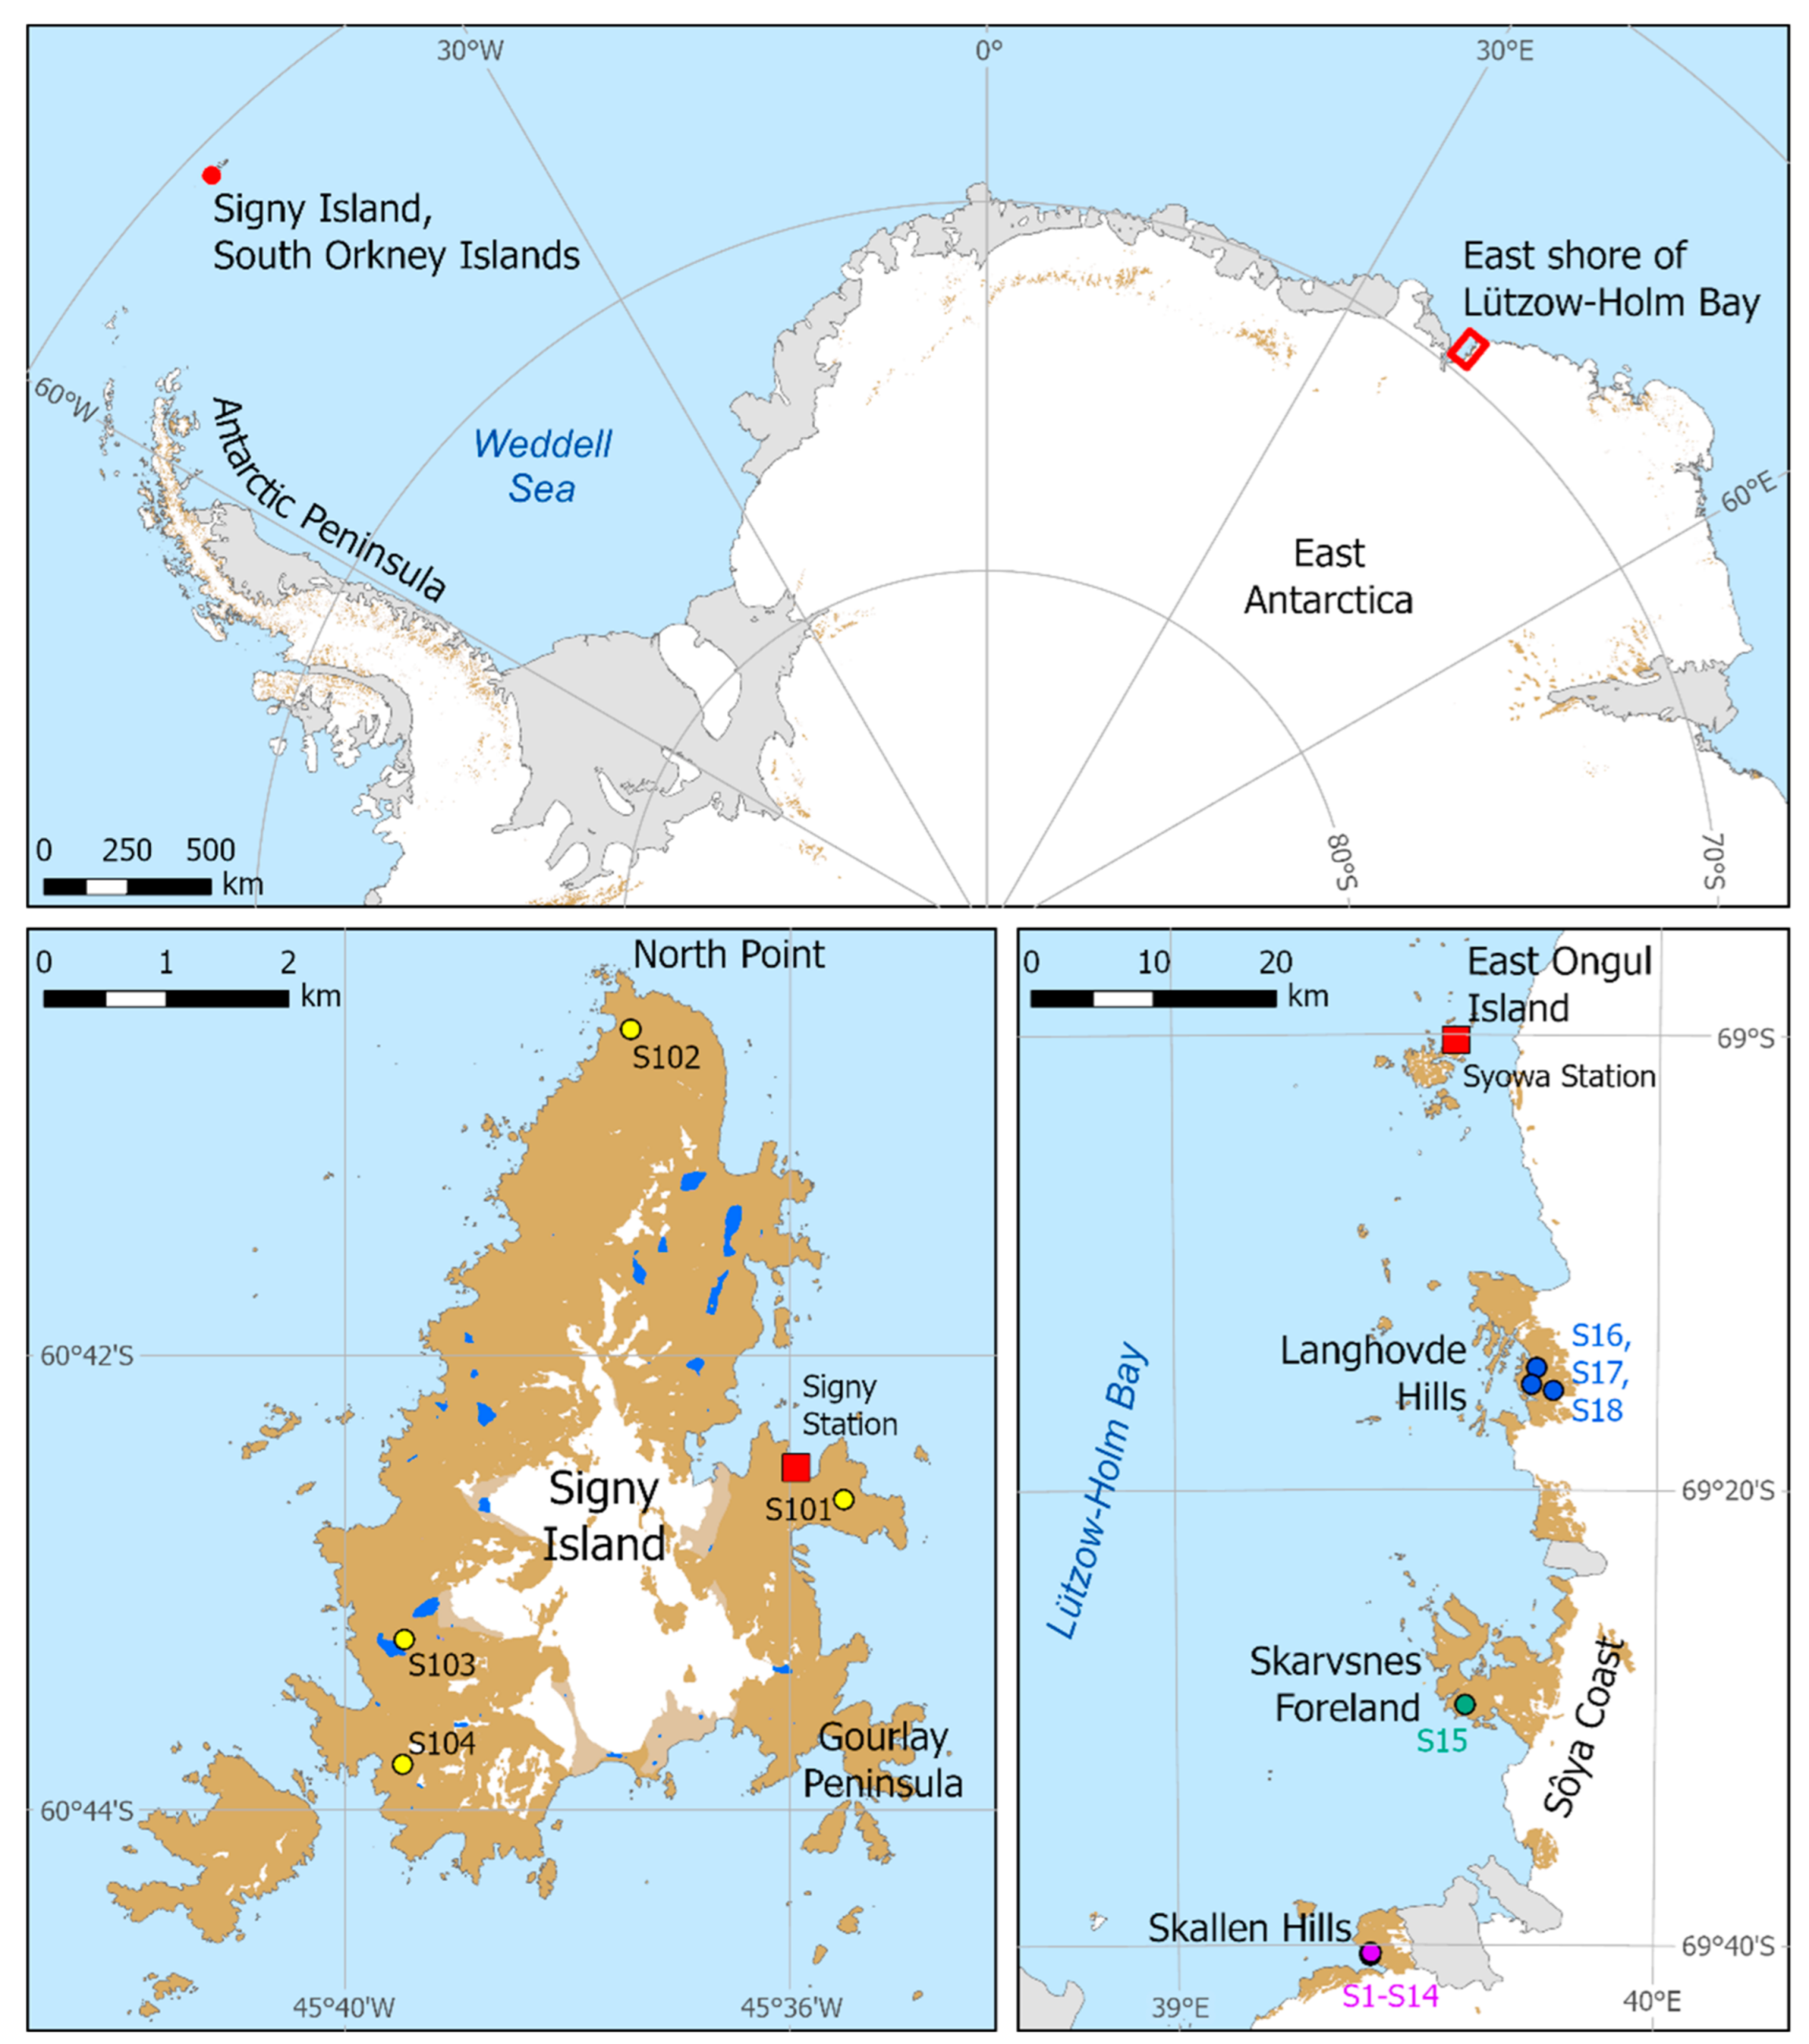
2.1. Collection of Rock Tripe Lichen Samples
2.2. Bulk DNA Extraction from Lichen Thalli
2.3. Amplification and Sequencing of Fungal/Algal 18S rRNA Gene
2.4. Amplification and Sequencing of V3-V4 Region of Bacterial 16S rRNA Gene
2.5. Sequence Data Analysis and OTU Determination
2.6. Diversity Indices and Bioinformatic Analyses of OTUs
3. Results
3.1. Identification of Rock Tripe Lichen-Forming Fungi and Algae
3.2. Evaluation of MiSeq-Generated V3-V4 Sequences and OTUs
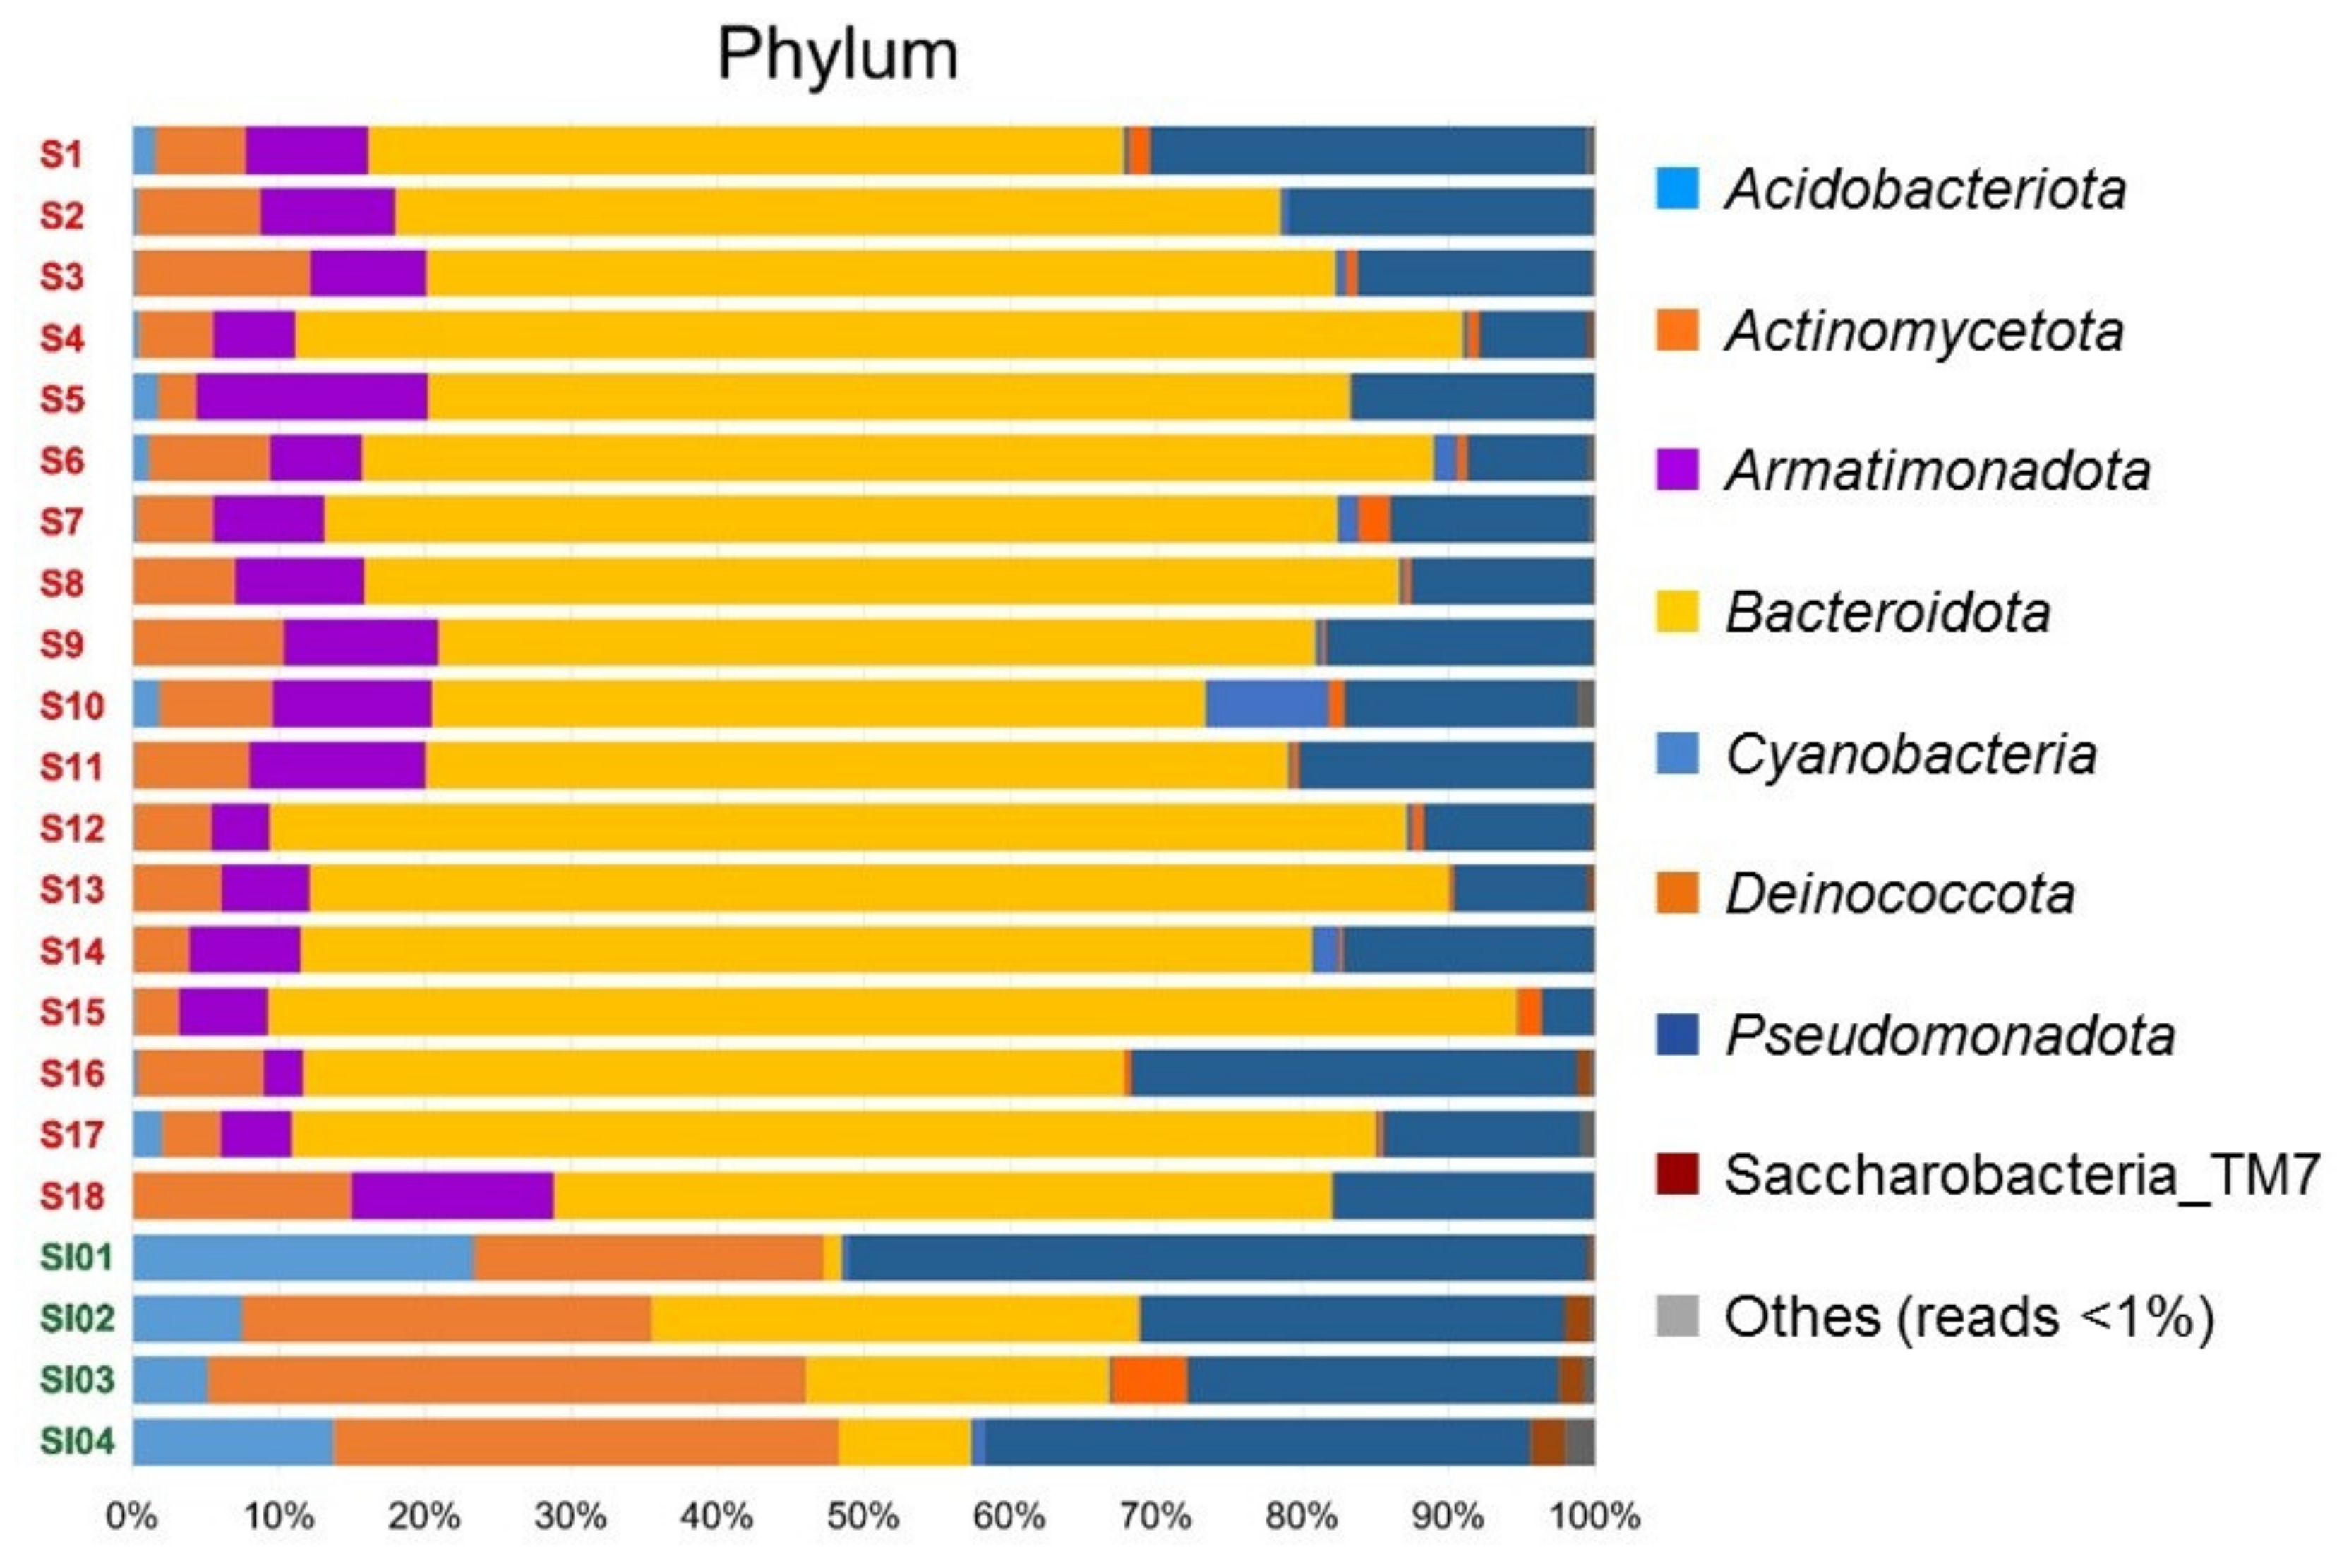
3.3. Taxonomic Composition of Lichen-Associated Bacterial Community
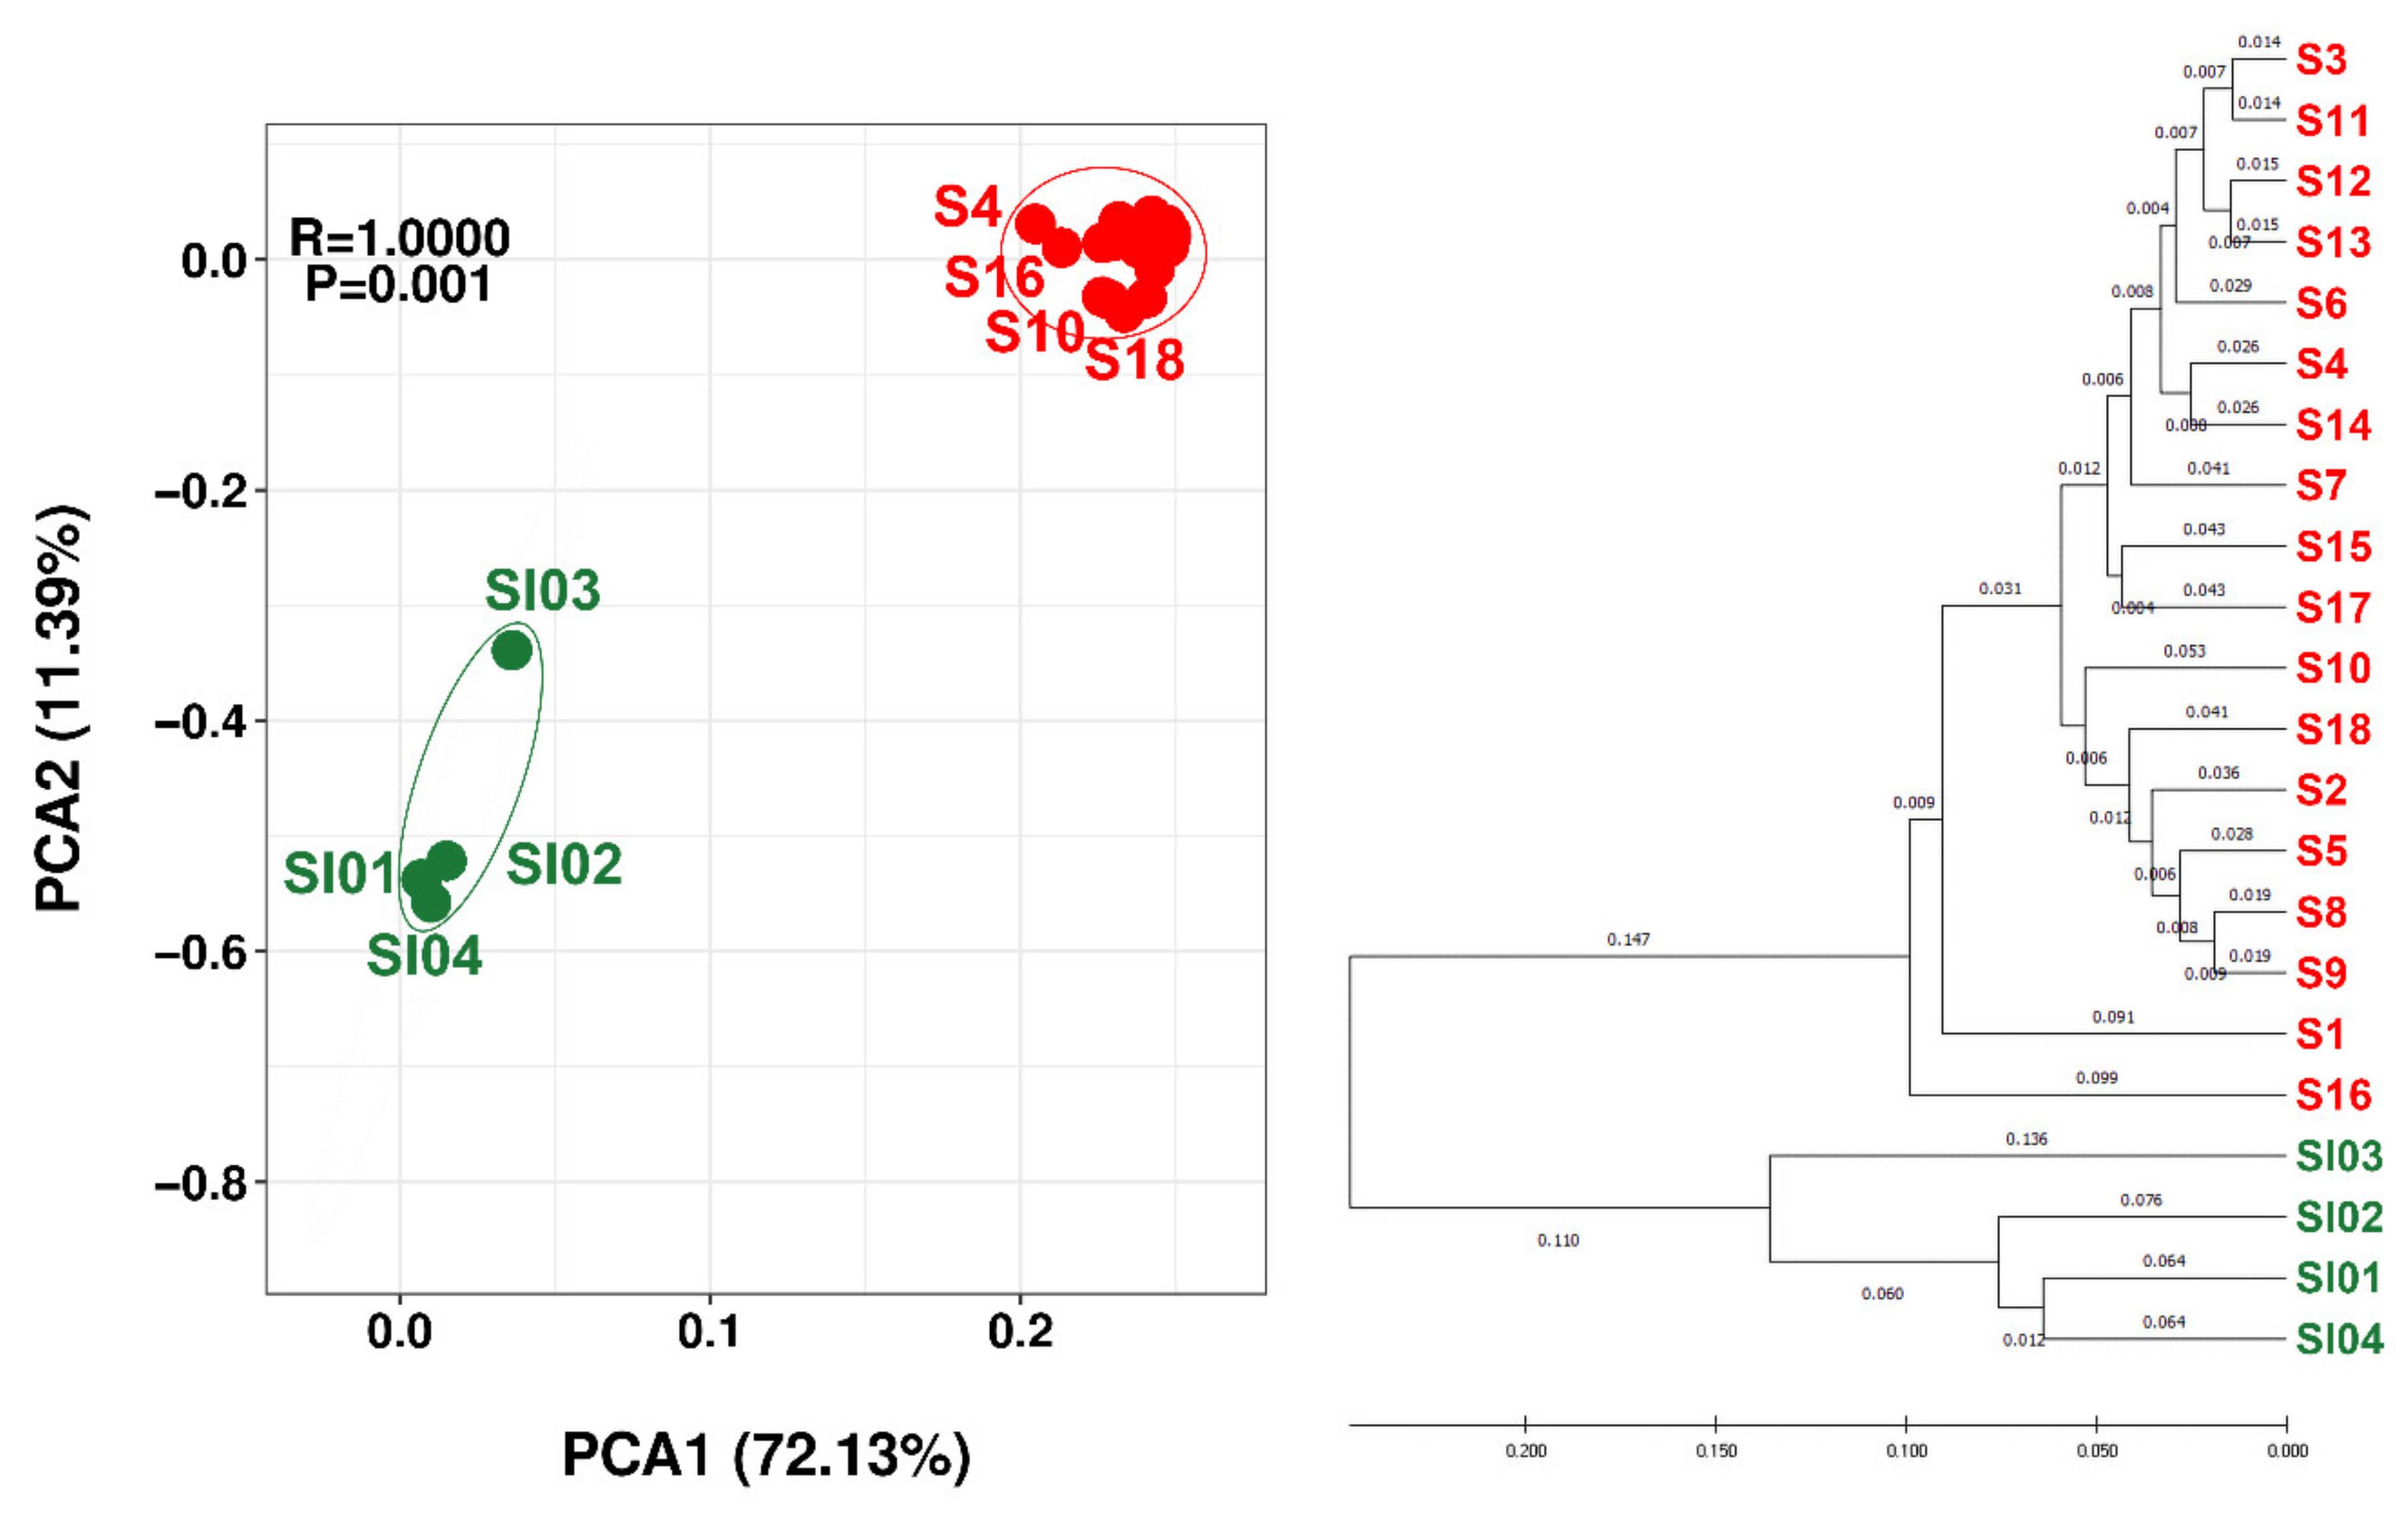
3.4. Alpha and Beta Diversity
4. Discussion
Supplementary Materials
Author Contributions
Funding
Institutional Review Board Statement
Informed Consent Statement
Data Availability Statement
Acknowledgments
Conflicts of Interest
References
- Brodo, I.M.; Sharnoff, S.D.; Sharnoff, S. Lichens of North America; Yale University Press: New Haven, CT, USA, 2001. [Google Scholar]
- Gasulla, F.; Herrero, J.; Esteban-Carrasco, A.; Ros-Barceló, A.; Barreno, E.; Zapata, J.M.; Guéra, A. Photosynthesis in lichen: Light reactions and protective mechanisms. In Advances in Photosynthesis: Fundamental Aspects; Najafpour, M., Ed.; IntechOpen: London, UK, 2012. [Google Scholar] [CrossRef] [Green Version]
- Meessen, J.; Sánchez, F.J.; Sadowsky, A.; de la Torre, R.; Ott, S.; de Vera, J.P. Extremotolerance and resistance of lichens: Comparative studies on five species used in astrobiological research II. Secondary lichen compounds. Orig. Life Evol. Biosph. 2013, 43, 501–526. [Google Scholar] [CrossRef] [PubMed] [Green Version]
- Vernon, A. The lichen photobiont: What can it tell us about lichen systematics? Bryologist 1993, 96, 310–313. [Google Scholar] [CrossRef]
- Rai, A.N.; Bergman, B.; Rasmussen, U. Chapter 6—Cyanolichens: Nitrogen metabolism. In Cyanobacteria in Symbiosis; Springer: Berlin/Heidelberg, Germany, 2002; pp. 97–116. [Google Scholar]
- Saini, K.C.; Nayaka, S.; Bast, F. Microbial diversity in ecosystem sustainability and biotechnological applications. In Diversity of Lichen Photobionts: Their Coevolution and Bioprospecting Potential; Springer: Berlin/Heidelberg, Germany, 2019; pp. 307–323. [Google Scholar]
- Voytsekhovich, A.; Lyudmyla, D.; Rai, H.; Upreti, D.K. Photobiont diversity of soil crust lichens along substrate ecology and altitudinal gradients in Himalayas: A case study from Garhwal Himalaya. In Terricolous Lichens in India; Rai, H., Upreti, D.K., Eds.; Springer: Berlin/Heidelberg, Germany, 2014; Volume 1, pp. 73–87. [Google Scholar]
- Watkinson, S.C.; Boddy, L.; Money, N. Chapter 7—Mutualistic symbiosis between fungi and autotrophs. In The Fungi, 3rd ed.; Academic Press: Cambridge, MA, USA, 2016; pp. 205–243. [Google Scholar]
- Longton, R.E. The Biology of Polar Bryophytes and Lichens; Cambridge University Press: Cambridge, UK, 1988; 400p. [Google Scholar]
- Grube, M.; Berg, G. Microbial consortia of bacteria and fungi with focus on the lichen symbiosis. Fung. Biol. Rev. 2009, 23, 72–85. [Google Scholar] [CrossRef]
- Cengia-Sambo, M. Ancora della polysimbiosi nei licheni ad alghe cianoficee. 1. Batteri simbionti. Atti Soc. Ital. Sc. Nat. 1926, 64, 191–195. [Google Scholar]
- Spribille, T.; Tagirdzhanova, G.; Goyette, S.; Tuovinen, V.; Case, R.; Zandberg, W. 3D biofilms: In search of the polysaccharides holding together lichen symbioses. FEMS Microbiol. Lett. 2020, 367, fnaa023. [Google Scholar] [CrossRef] [Green Version]
- Grimm, M.; Grube, M.; Schiefelbein, U.; Zühlke, D.; Bernhardt, J.; Riedel, K. The lichens’ microbiota, still a mystery? Front. Microbiol. 2021, 12, 623839. [Google Scholar] [CrossRef]
- Bates, S.T.; Cropsey, G.W.G.; Caporaso, J.G.; Knight, R.; Fierer, N. Bacterial communities associated with the lichen symbiosis. Appl. Environ. Microbiol. 2011, 77, 1309–1314. [Google Scholar] [CrossRef] [Green Version]
- Bates, S.T.; Berg-Lyons, D.; Lauber, C.L.; Walters, W.A.; Knight, R.; Fierer, N. A preliminary survey of lichen associated eukaryotes using pyrosequencing. Lichenologist 2012, 44, 137–146. [Google Scholar] [CrossRef] [Green Version]
- Cernava, T.; Aschenbrenner, I.A.; Grube, M.; Liebminger, S.; Berg, G. A novel assay for the detection of bioactive volatiles evaluated by screening of lichen-associated bacteria. Front. Microbiol. 2015, 6, 398. [Google Scholar] [CrossRef]
- Cardinale, M.; Grube, M.; Castro, J.V., Jr.; Mueller, H.; Berg, G. Bacterial taxa associated with the lung lichen Lobaria pulmonaria are differentially shaped by geography and habitat. FEMS Microbiol. Lett. 2012, 329, 111–115. [Google Scholar] [CrossRef]
- Cernava, T.; Erlacher, A.; Aschenbrenner, I.A.; Krug, L.; Lassek, C.; Riedel, K.; Grube, M.; Berg, G. Deciphering functional diversification within the lichen microbiota by meta-omics. Microbiome 2017, 5, 82. [Google Scholar] [CrossRef] [Green Version]
- Bjelland, T.; Grube, M.; Home, S.; Jorgensen, S.L.; Daae, F.L.; Thorseth, I.H.; Ovreas, L. Microbial metacommunities in the lichen-rock habitat. Environ. Microbiol. Rep. 2011, 3, 434–442. [Google Scholar] [CrossRef]
- Garg, N.; Zeng, Y.; Edlund, A.; Melnik, A.V.; Sanchez, L.M.; Mohimani, H.; Gurevich, A.; Miao, V.; Schiffler, S.; Lim, Y.W.; et al. Spatial molecular architecture of themicrobial community of a Peltigera lichen. Msystems 2016, 1, e00139-16. [Google Scholar] [CrossRef] [Green Version]
- Hodkinson, B.P.; Gottel, N.R.; Schadt, C.W.; Lutzoni, F. Photoautotrophic symbiont and geography are major factors affecting highly structured and diverse bacterial communities in the lichen microbiome. Environ. Microbiol. 2012, 14, 147–161. [Google Scholar] [CrossRef]
- Mushegian, A.A.; Peterson, C.N.; Baker, C.C.M.; Pringle, A. Bacterial diversity across individual lichens. Appl. Environ. Microbiol. 2011, 77, 4249–4252. [Google Scholar] [CrossRef] [Green Version]
- Schneider, T.; Schmid, E.; de Castro, J.V.; Cardinale, M.; Eberl, L.; Grube, M.; Berg, G.; Riedel, K. Structure and function of the symbiosis partners of the lung lichen (Lobaria pulmonaria L. Hoffm.) analyzed by metaproteomics. Proteomics 2011, 11, 2752–2756. [Google Scholar] [CrossRef]
- Oren, A.; Garrity, G.M. Valid publication of the names of forty-two phyla of prokaryotes. Int. J. Syst. Evol. Microbiol. 2021, 71, 005056. [Google Scholar] [CrossRef]
- Grube, M.; Cernava, T.; Soh, J.; Fuchs, S.; Aschenbrenner, I.; Lassek, C.; Wegner, U.; Becher, D.; Riedel, K.; Sensen, C.W.; et al. Exploring functional contexts of symbiotic sustain within lichen-associated bacteria by comparative omics. ISME J. 2015, 9, 412–424. [Google Scholar] [CrossRef] [Green Version]
- Convey, P. Antarctic ecosystems. In Encyclopedia of Biodiversity; Levin, S.A., Ed.; Academic Press: Cambridge, MA, USA, 2017; Volume 1, pp. 179–187. [Google Scholar] [CrossRef]
- Terauds, A.; Chown, S.L.; Morgan, F.; Peat, H.J.; Watts, D.; Keys, H.; Convey, P.; Bergstrom, D.M. Conservation biogeography of the Antarctic. Divers. Distrib. 2012, 18, 726–741. [Google Scholar] [CrossRef] [Green Version]
- Williams, E. Great Circle Calculator. Available online: http://edwilliams.org/gccalc.htm (accessed on 21 May 2022).
- Faluaburu, M.S.; Nakai, R.; Imura, S.; Naganuma, T. Phylotypic characterization of mycobionts and photobionts of rock tripe lichen in East Antarctica. Microorganisms 2019, 7, 203. [Google Scholar] [CrossRef] [Green Version]
- Gargas, A.; Taylor, J.W. Polymerase chain reaction (PCR) primers for amplifying and sequencing nuclear 18S rDNA from lichenized fungi. Mycologia 1992, 84, 589–592. [Google Scholar] [CrossRef]
- Medlin, L.; Elwood, H.J.; Stickel, S.; Sogin, M.L. The characterization of enzymatically amplified eukaryotic 16S-like rRNA-coding regions. Gene 1988, 71, 491–499. [Google Scholar] [CrossRef] [Green Version]
- Helms, G.; Friedl, T.; Rambold, G.; Mayrhofer, H. Identification of photobionts from the lichen family Physciaceae using algal-specific ITS rDNA sequences. Lichenologist 2001, 33, 73–86. [Google Scholar] [CrossRef]
- Klindworth, A.; Pruesse, E.; Schweer, T.; Peplies, J.; Quast, C.; Horn, M.; Glöckner, F.O. Evaluation of general 16S ribosomal RNA gene PCR primers for classical and next-generation sequencing-based diversity studies. Nucleic Acids Res. 2013, 41, e1. [Google Scholar] [CrossRef]
- Yergeau, E.; Bell, T.H.; Champagne, J.; Maynard, C.; Tardif, S.; Tremblay, J.; Greer, C.W. Transplanting soil microbiomes leads to lasting effects on willow growth, but not on the rhizosphere microbiome. Front. Microbiol. 2015, 6, 1436. [Google Scholar] [CrossRef] [PubMed] [Green Version]
- Thompson, J.D.; Higgins, D.G.; Gibson, T.J. CLUSTAL W: Improving the sensitivity of progressive multiple sequence alignment through sequence weighting, position-specific gap penalties and weight matrix choice. Nucleic Acids Res. 1994, 22, 4673–4680. [Google Scholar] [CrossRef] [Green Version]
- Hall, T.A. BioEdit: A user-friendly biological sequence alignment editor and analysis program for Windows 95/98/NT. Nucleic Acids Symp. Ser. 1999, 41, 95–98. [Google Scholar] [CrossRef]
- Jumpponen, A. Soil fungal communities underneath willow canopies on a primary successional glacier forefront: rDNA sequence results can be affected by primer selection and chimeric data. Microb. Ecol. 2007, 53, 233–246. [Google Scholar] [CrossRef]
- Yoon, S.H.; Ha, S.M.; Kwon, S.; Lim, J.; Kim, Y.; Seo, H.; Chun, J. Introducing EzBioCloud: A taxonomically united database of 16S rRNA and whole genome assemblies. Int. J. Syst. Evol. Microbiol. 2017, 67, 1613–1617. [Google Scholar] [CrossRef]
- Yarza, P.; Yilmaz, P.; Pruesse, E.; Glöckner, F.O.; Ludwig, W.; Schleifer, K.; Whitman, W.B.; Euzéby, J.; Amann, R.; Rosselló-Móra, R. Uniting the classification of cultured and uncultured bacteria and archaea using 16S rRNA gene sequences. Nat. Rev. Microbiol. 2014, 12, 635–645. [Google Scholar] [CrossRef]
- Mysara, M.; Vandamme, P.; Props, R.; Kerckhof, F.M.; Leys, N.; Boon, N.; Raes, J.; Monsieurs, P. Reconciliation between operational taxonomic units and species boundaries. FEMS Microbiol. Ecol. 2017, 93, fix029. [Google Scholar] [CrossRef]
- Lozupone, C.A.; Hamady, M.; Kelley, S.T.; Knight, R. Quantitative and qualitative beta diversity measures lead to different insights into factors that structure microbial communities. Appl. Environ. Microbiol. 2007, 73, 1576–1585. [Google Scholar] [CrossRef] [Green Version]
- Fisher, R.A. The use of multiple measurements in taxonomic problems. Ann. Eugen. 1936, 7, 179–188. [Google Scholar] [CrossRef]
- Segata, N.; Izard, J.; Waldron, L.; Gevers, D.; Miropolsky, L.; Garrett, W.S.; Huttenhower, C. Metagenomic biomarker discovery and explanation. Genome Biol. 2011, 12, R60. [Google Scholar] [CrossRef] [Green Version]
- Mezzasoma, A.; Coleine, C.; Sannino, C.; Selbmann, L. Endolithic Bacterial Diversity in Lichen-Dominated Communities Is Shaped by Sun Exposure in McMurdo Dry Valleys, Antarctica. Microb. Ecol. 2022, 83, 328–339. [Google Scholar] [CrossRef]
- Xu, H.; Wang, L.; Feng, X.; Gong, X. Core taxa and photobiont-microbial interaction within the lichen Heterodermia obscurata (Physcsiaceae, Heterodermia). Symbiosis 2022, 86, 187–204. [Google Scholar] [CrossRef]
- Lin, H.; Peddada, S.D. Analysis of compositions of microbiomes with bias correction. Nat. Commun. 2020, 11, 3514. [Google Scholar] [CrossRef]
- Kanehisa, M.; Goto, S.; Sato, Y.; Kawashima, M.; Furumichi, M.; Tanabe, M. Data, information, knowledge and principle: Back to metabolism in KEGG. Nucleic Acids Res. 2014, 42, D199–D205. [Google Scholar] [CrossRef] [Green Version]
- Junker, B.H.; Klukas, C.; Schreiber, F. VANTED: A system for advanced data analysis and visualization in the context of biological networks. BMC Bioinform. 2006, 7, 109. [Google Scholar] [CrossRef] [Green Version]
- Douglas, G.M.; Maffei, V.J.; Zaneveld, J.R.; Yurgel, S.N.; Brown, J.R.; Taylor, C.M.; Huttenhower, C.; Langille, M.G.I. PICRUSt2 for prediction of metagenome functions. Nat. Biotechnol. 2020, 38, 685–688. [Google Scholar] [CrossRef]
- Friedl, T.; Rokitta, C. Species relationships in the lichen alga Trebouxia (chlorophyta, trebouxiophyceae): Molecular phylogenetic analyses of nuclear-encoded large subunit rRNA gene sequences. Symbiosis 1997, 23, 125–148. Available online: http://hdl.handle.net/10222/77587 (accessed on 17 May 2022).
- Jost, L. Entropy and diversity. Oikos 2006, 113, 363–375. [Google Scholar] [CrossRef]
- Kers, J.G.; Saccenti, E. The power of microbiome studies: Some considerations on which alpha and beta metrics to use and how to report results. Front. Microbiol. 2022, 12, 796025. [Google Scholar] [CrossRef]
- Liu, Q.; He, Z.; Naganuma, T.; Nakai, R.; Rodríguez, L.M.; Carreño, R.; Urbani, F. Phylotypic diversity of bacteria associated with speleothems of a silicate cave in a Guiana Shield tepui, Venezuela. Microorganisms, 2022; submitted. [Google Scholar]
- Tzovaras, B.S.; Segers, F.H.I.D.; Bicker, A.; Dal Grande, F.; Otte, J.; Anvar, S.Y.; Hankeln, T.; Schmitt, I.; Ebersberger, I. What is in Umbilicaria pustulata? A metagenomic approach to reconstruct the holo-genome of a lichen. Genome Biol. Evol. 2020, 12, 309–324. [Google Scholar] [CrossRef]
- Romeike, J.; Friedl, T.; Helms, G.; Ott, S. Genetic diversity of algal and fungal partners in four species of Umbilicaria (lichenized ascomycetes) along a transect of the Antarctic Peninsula. Mol. Biol. Evol. 2002, 19, 1209–1217. [Google Scholar] [CrossRef] [Green Version]
- Trebouxia aggregata (Archibald) Gärtner 1985. Available online: https://www.algaebase.org/search/species/detail/?species_id=Ee4829abc009b048e (accessed on 31 May 2022).
- Convey, P.; Coulson, S.J.; Worland, M.R.; Sjöblom, A. The importance of understanding annual and shorter term temperature patterns and variation in the upper layers of polar soils for terrestrial biota. Polar Biol. 2018, 41, 1587–1605. [Google Scholar] [CrossRef] [Green Version]
- King, J.C.; Bannister, D.; Hosking, J.S.; Colwell, S.R. Causes of the Antarctic region record high temperature at Signy Island, 30th January 1982. Atmos. Sci. Lett. 2017, 18, 491–496. [Google Scholar] [CrossRef] [Green Version]
- Kudoh, S.; Wada, T.; Uchida, M.; Imura, S. Ground temperature data from an ice-free area at mid-range of Yukidori Zawa, Langhovde, East Antarctica during January 2010–January 2012. Polar Data J. 2021, 5, 37–46. [Google Scholar] [CrossRef]
- Clarke, A.; Fraser, K.P.P. Why does metabolism scale with temperature? Funct. Ecol. 2004, 18, 243–251. [Google Scholar] [CrossRef] [Green Version]


| Region | Area | Latitude | Longitude | Elevation (m) | Sample Code |
|---|---|---|---|---|---|
| Syowa Station region: East shore of Lützow-Holm Bay, coastal Queen Maud Land, continental Antarctica | Skallen Hills | 69°40′23″ S | 39°24′18″ E | 25 | S1, S2, S3 |
| 69°40′22″ S | 39°24′11″ E | 26 | S4 | ||
| 69°40′28″ S | 39°24′14″ E | 10 | S5 | ||
| 69°40′29″ S | 39°24′12″ E | 18 | S6 | ||
| 69°40′24″ S | 39°24′10″ E | 14 | S7, S8, S9 | ||
| 69°40′23″ S | 39°24′10″ E | 26 | S10 | ||
| 69°40′22″ S | 39°24′20″ E | 22 | S11, S12, S13, S14 | ||
| Skarvsnes Foreland | 69°29′27″ S | 39°36′10″ E | * 80 | S15 | |
| Langhovde Hills | 69°14′39″ S | 39°44′59″ E | 210 | S16 | |
| 69°15′23″ S | 39°44′21″ E | * 150 | S17 | ||
| 69°15′38″ S | 39°47′04″ E | * 100 | S18 | ||
| Northern maritime Antarctic region | Signy Island | 60°42′38″ S | 45°35′31″ W | 232 | SI01 |
| 60°40′34″ S | 45°37′26″ W | 42 | SI02 | ||
| 60°43′15″ S | 45°39′28″ W | 33 | SI03 | ||
| 60°43′48″ S | 45°39′29″ W | 79 | SI04 |
| Target Sequence | Primer Designation | F/R | Length (-mer) | 5′ → 3′ | Expected Product Size | Ref. |
|---|---|---|---|---|---|---|
| Fungal 18S rRNA gene | NS17UCB | F | 19 | CATGTCTAAGTTTAAGCAA | 2.0 kbp | [30] |
| NS24UCB | R | 20 | AAACCTTGTTACGACTTTTA | |||
| Algal 18S rRNA gene | Euk F | F | 21 | AACCTGGTTGATCCTGCCAGT | 1.8 kbp | [31] |
| Al1700r * | R | 18 | CTCCTTCCTCTAGGTGGG | [32] | ||
| V3-V4 region of 16S rRNA gene | 341F | F | 17 | CCTACGGGNGGCWGCAG | 460 bp | [33] |
| 806R | R | 21 | GACTACHVGGGTATCTAATCC | [34] |
| Sample | Raw Read | Valid Read | OTU | Species | Genus | Family | Order | Class | Phylum | Mean Length (bp) |
|---|---|---|---|---|---|---|---|---|---|---|
| S1 | 67,130 | 56,304 | 653 | 499 | 254 | 109 | 70 | 43 | 16 | 411.1 |
| S2 | 74,880 | 26,662 | 252 | 201 | 134 | 68 | 44 | 32 | 12 | 407.8 |
| S3 | 74,986 | 63,288 | 482 | 360 | 193 | 98 | 63 | 39 | 16 | 412.3 |
| S4 | 43,044 | 37,863 | 418 | 301 | 146 | 79 | 50 | 32 | 13 | 416.9 |
| S5 | 67,503 | 58,877 | 266 | 203 | 108 | 66 | 42 | 29 | 15 | 410.1 |
| S6 | 55,681 | 49,192 | 632 | 459 | 233 | 107 | 71 | 42 | 18 | 416.4 |
| S7 | 58,369 | 50,920 | 489 | 354 | 178 | 82 | 51 | 32 | 13 | 415.0 |
| S8 | 58,613 | 37,564 | 331 | 259 | 135 | 66 | 47 | 30 | 14 | 411.7 |
| S9 | 81,518 | 42,341 | 318 | 249 | 141 | 76 | 50 | 33 | 16 | 408.7 |
| S10 | 66,828 | 43,171 | 710 | 520 | 279 | 128 | 81 | 49 | 18 | 409.6 |
| S11 | 73,470 | 63,721 | 319 | 243 | 128 | 67 | 42 | 28 | 15 | 411.0 |
| S12 | 82,096 | 78,754 | 384 | 274 | 159 | 82 | 50 | 34 | 17 | 416.0 |
| S13 | 64,184 | 57,538 | 269 | 204 | 119 | 71 | 49 | 31 | 15 | 416.2 |
| S14 | 72,824 | 55,695 | 364 | 269 | 136 | 72 | 49 | 29 | 13 | 413.2 |
| S15 | 51,605 | 38,471 | 332 | 227 | 134 | 78 | 50 | 31 | 15 | 416.3 |
| S16 | 100,000 | 84,351 | 1212 | 392 | 230 | 107 | 68 | 38 | 18 | 413.5 |
| S17 | 77,514 | 53,736 | 599 | 442 | 240 | 104 | 61 | 38 | 15 | 413.8 |
| S18 | 77,614 | 34,540 | 193 | 159 | 93 | 63 | 47 | 32 | 14 | 409.2 |
| Sub-total | 1,247,859 | 932,988 | 2257 | 1370 | 623 | 244 | 129 | 72 | 25 | 412.7 |
| SI01 | 31,714 | 28,693 | 401 | 278 | 150 | 74 | 51 | 32 | 16 | 405.5 |
| SI02 | 33,691 | 29,667 | 553 | 302 | 162 | 76 | 45 | 29 | 14 | 410.7 |
| SI03 | 29,792 | 24,259 | 714 | 490 | 234 | 96 | 59 | 36 | 15 | 411.4 |
| SI04 | 14,517 | 12,819 | 617 | 476 | 233 | 110 | 63 | 36 | 18 | 407.6 |
| Sub-total | 109,714 | 95,438 | 1290 | 809 | 369 | 150 | 82 | 47 | 20 | 408.8 |
| Total | 1,357,573 | 1,028,426 | 3147 | 1829 | 762 | 286 | 144 | 79 | 27 | 412.0 |
| Distribution | Observed OTU | Species | Genus | Family | Order | Class | Phylum |
|---|---|---|---|---|---|---|---|
| Only in the Syowa Station region | 1857 | 1020 | 393 | 136 | 62 | 32 | 7 |
| Only in the Signy Island region | 890 | 459 | 139 | 42 | 15 | 7 | 2 |
| Common to both regions | 400 | 350 | 230 | 108 | 67 | 40 | 18 |
| Total | 3147 | 1829 | 762 | 286 | 144 | 79 | 27 |
| Sample | Observed OTU | Chao1 | Shannon (ENS) | Simpson (ENS) | ||
|---|---|---|---|---|---|---|
| S1 | 653 | 733.8 | 3.15 | 23.3 | 0.16 | 6.3 |
| S2 | 252 | 298.1 | 2.14 | 8.5 | 0.29 | 3.5 |
| S3 | 482 | 526.8 | 2.44 | 11.5 | 0.19 | 5.3 |
| S4 | 418 | 448.9 | 2.49 | 12.1 | 0.21 | 4.8 |
| S5 | 266 | 297.5 | 2.11 | 8.3 | 0.24 | 4.2 |
| S6 | 632 | 723.3 | 2.66 | 14.3 | 0.24 | 4.2 |
| S7 | 489 | 547.1 | 2.70 | 14.9 | 0.22 | 4.6 |
| S8 | 331 | 408.7 | 2.28 | 9.8 | 0.29 | 3.5 |
| S9 | 318 | 360.4 | 2.22 | 9.2 | 0.27 | 3.7 |
| S10 | 710 | 804.7 | 3.48 | 32.5 | 0.10 | 10.0 |
| S11 | 319 | 347.9 | 2.39 | 10.9 | 0.19 | 5.3 |
| S12 | 384 | 418.5 | 2.35 | 10.5 | 0.22 | 4.6 |
| S13 | 269 | 307.7 | 1.91 | 6.8 | 0.32 | 3.1 |
| S14 | 364 | 389.7 | 2.47 | 11.8 | 0.20 | 5.0 |
| S15 | 332 | 348.3 | 1.99 | 7.3 | 0.30 | 3.3 |
| S16 | 1212 | 1232.5 | 2.55 | 12.8 | 0.25 | 4.0 |
| S17 | 599 | 652.0 | 3.05 | 21.1 | 0.16 | 6.3 |
| S18 | 193 | 218.5 | 2.27 | 9.7 | 0.20 | 5.0 |
| Average | 456.8 | 503.6 | 2.48 | 13.1 | 0.23 | 4.8 |
| SI01 | 401 | 429.7 | 2.92 | 18.5 | 0.15 | 6.7 |
| SI02 | 553 | 593.6 | 2.94 | 18.9 | 0.14 | 7.1 |
| SI03 | 714 | 756.4 | 4.43 | 83.9 | 0.03 | 33.3 |
| SI04 | 617 | 690.5 | 4.41 | 82.3 | 0.04 | 25.0 |
| Average | 571.3 | 617.6 | 3.68 | 50.9 | 0.09 | 18.0 |
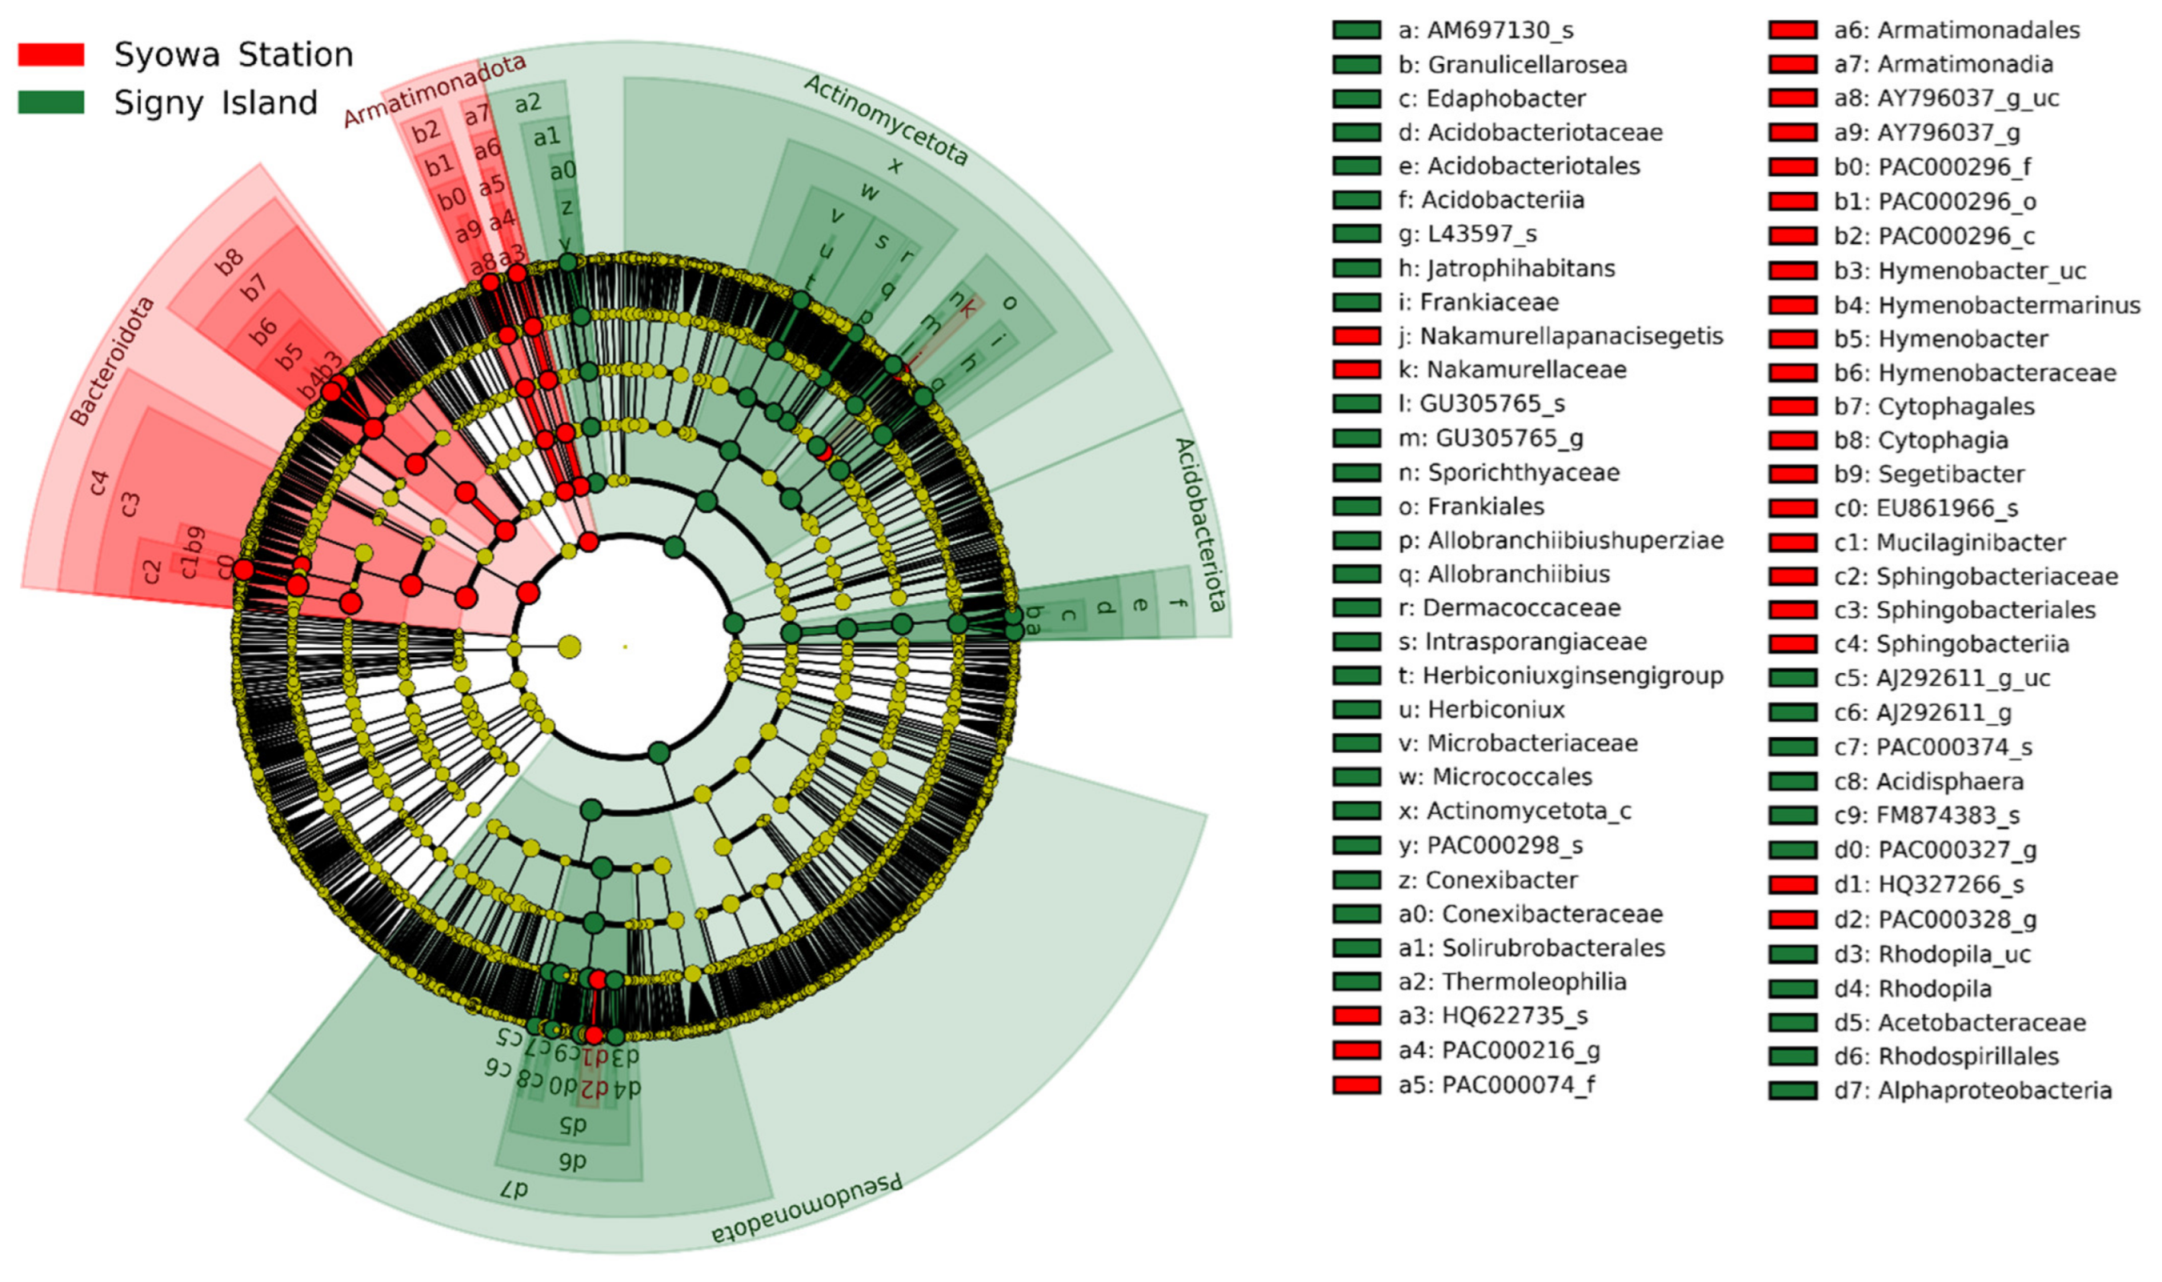
| Region | Code in Figure 4 | Rank of Biomarker | LDA Score | p-Value | |||||
|---|---|---|---|---|---|---|---|---|---|
| Phylum | Class | Order | Family | Genus | Species | ||||
| Syowa Station | - | Bacteroidota | 5.46 | 0.002 | |||||
| c4 | Bacteroidota | Sphingobacteria | 5.34 | 0.002 | |||||
| c3 | Bacteroidota | Sphingobacteria | Sphingobacteriales | 5.34 | 0.002 | ||||
| c2 | Bacteroidota | Sphingobacteria | Sphingobacteriales | Sphingobacteriaceae | 5.34 | 0.002 | |||
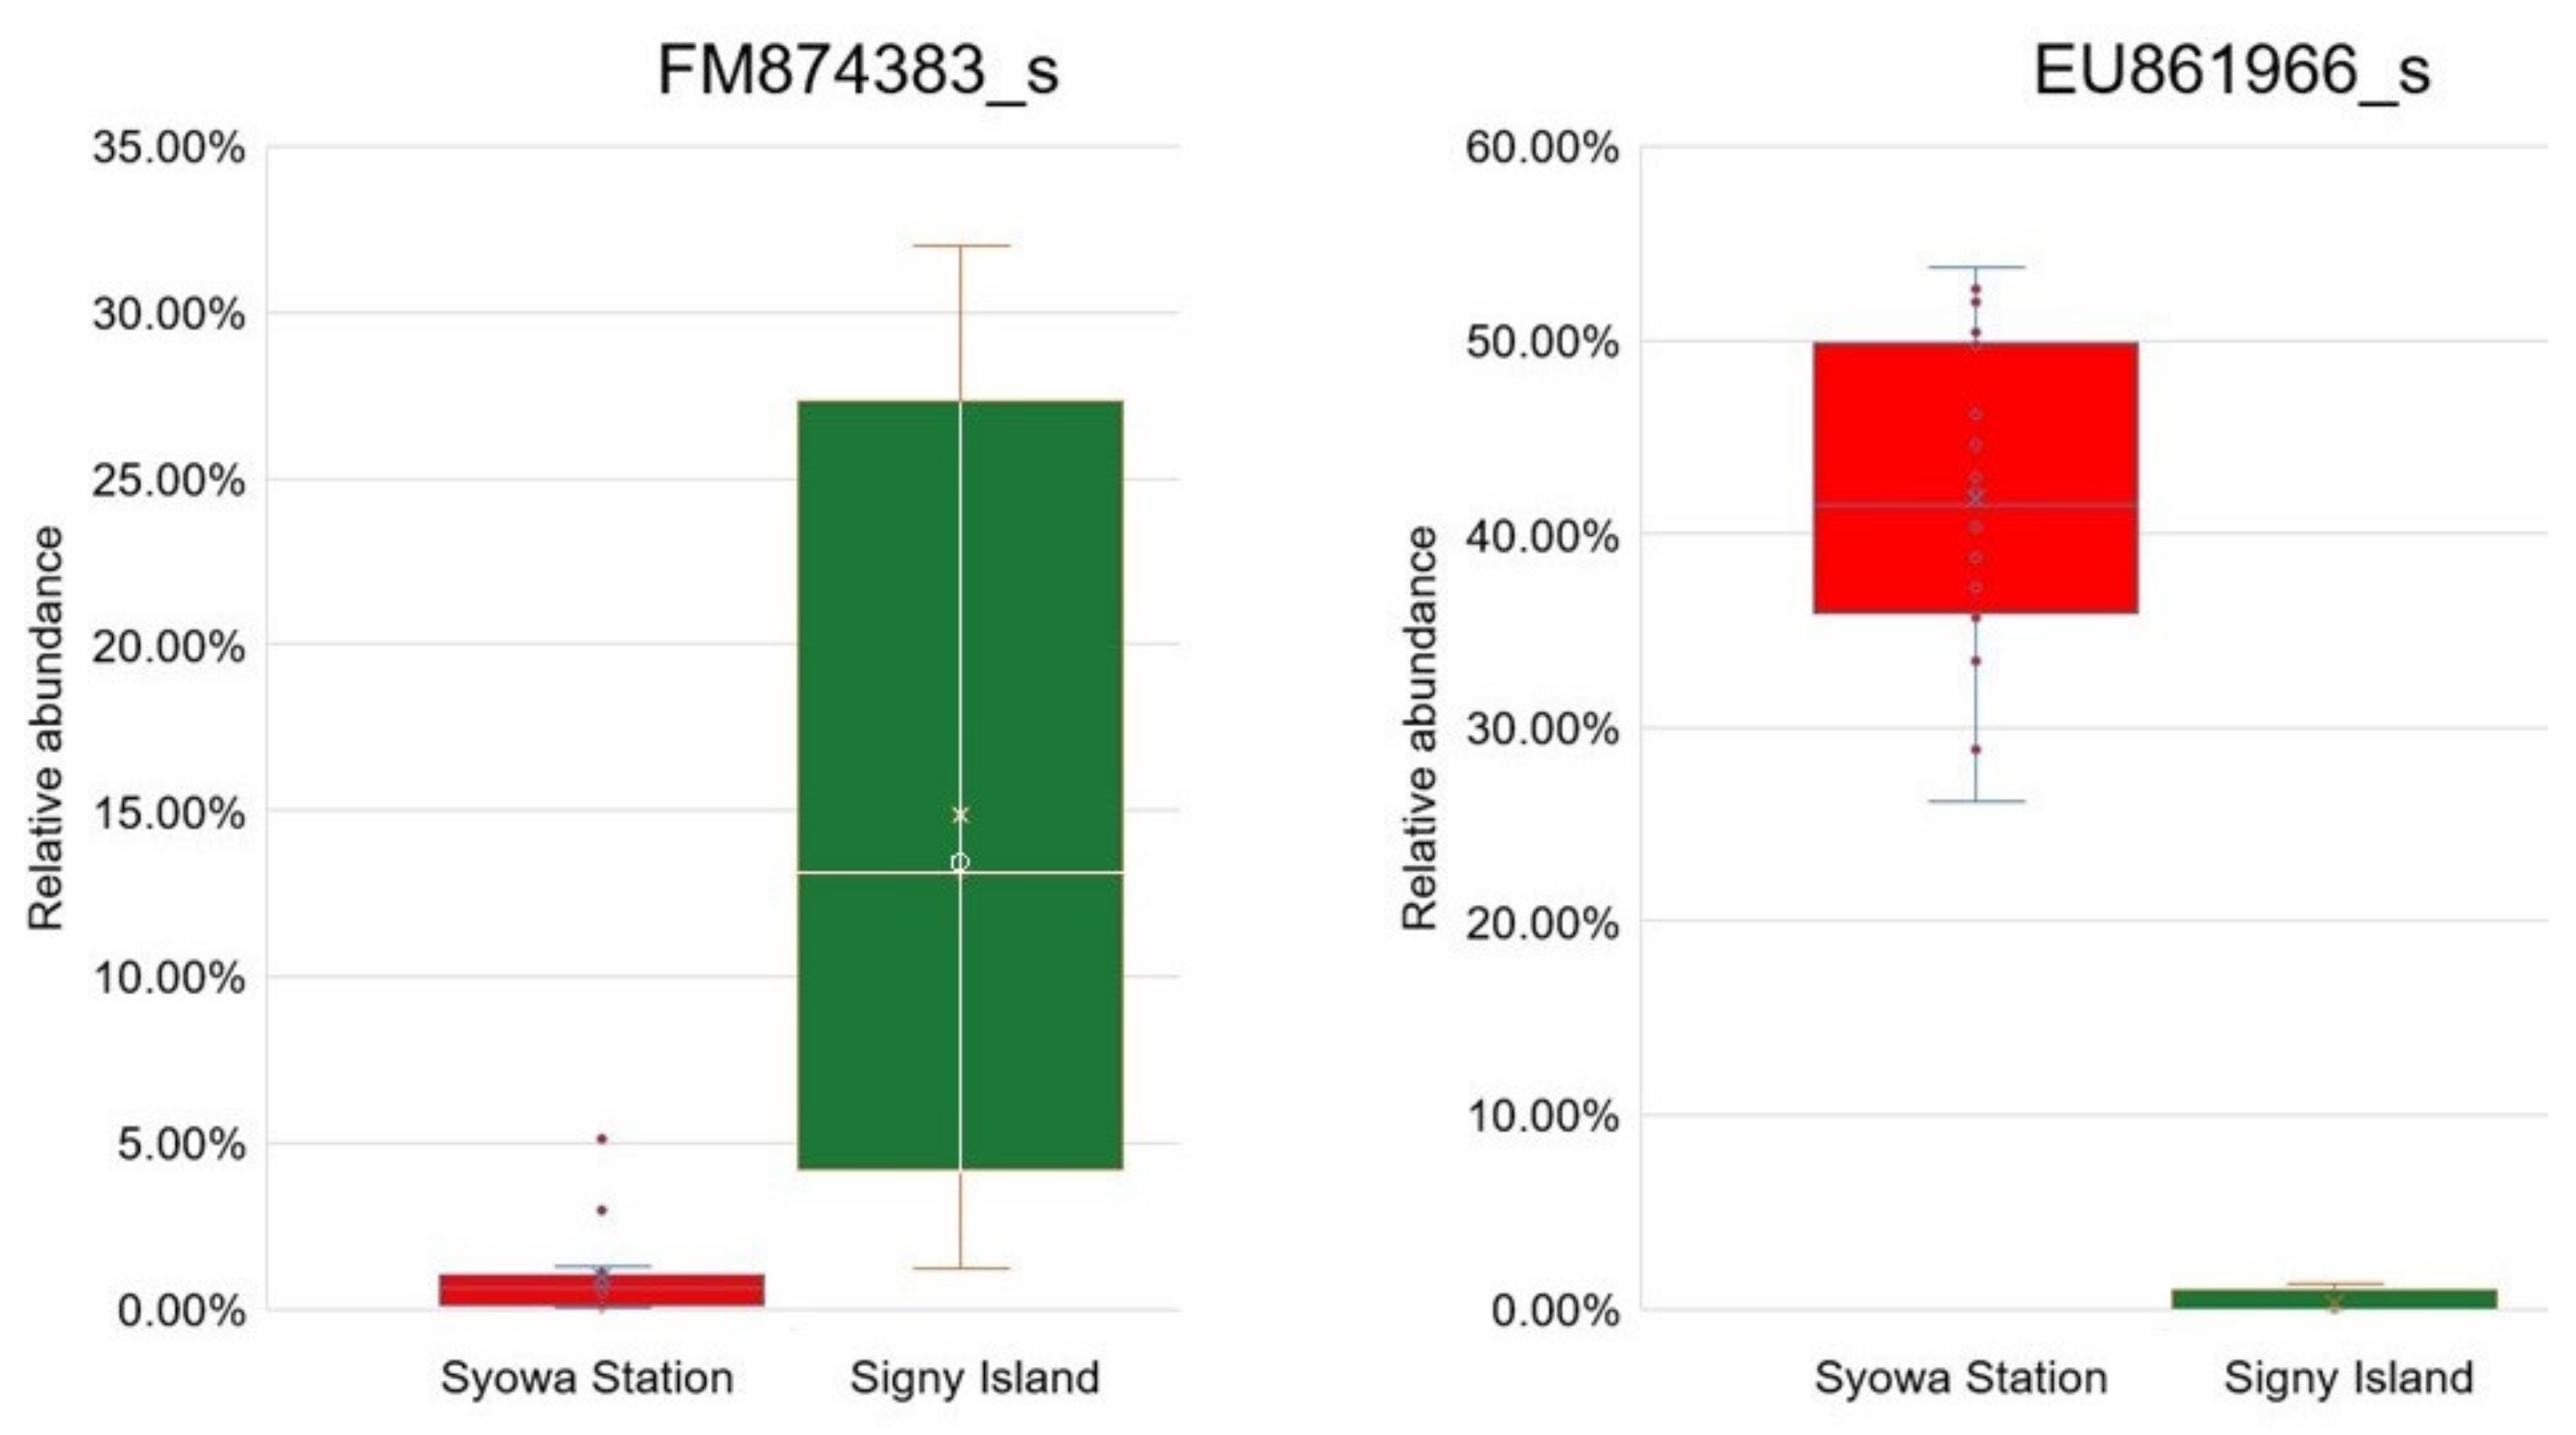
| c1 | Bacteroidota | Sphingobacteria | Sphingobacteriales | Sphingobacteriaceae | Mucilaginibacter | 5.34 | 0.002 | ||
| c0 | Bacteroidota | Sphingobacteria | Sphingobacteriales | Sphingobacteriaceae | Mucilaginibacter | EU861966_s | 5.32 | 0.002 | |
| Signy Island | - | Actinomycetota | 5.13 | 0.002 | |||||
| y | Actinomycetota | Actinomycetota_c | 5.03 | 0.002 | |||||
| - | Pseudomonadota | 5.07 | 0.004 | ||||||
| d7 | Pseudomonadota | Alphaproteobacteria | 5.07 | 0.004 | |||||
| d6 | Pseudomonadota | Alphaproteobacteria | Rhodospirillales | 5.09 | 0.005 | ||||
| d5 | Pseudomonadota | Alphaproteobacteria | Rhodospirillales | Acetobacteraceae | 5.07 | 0.005 | |||
Publisher’s Note: MDPI stays neutral with regard to jurisdictional claims in published maps and institutional affiliations. |
© 2022 by the authors. Licensee MDPI, Basel, Switzerland. This article is an open access article distributed under the terms and conditions of the Creative Commons Attribution (CC BY) license (https://creativecommons.org/licenses/by/4.0/).
Share and Cite
He, Z.; Naganuma, T.; Nakai, R.; Imura, S.; Tsujimoto, M.; Convey, P. Microbiomic Analysis of Bacteria Associated with Rock Tripe Lichens in Continental and Maritime Antarctic Regions. J. Fungi 2022, 8, 817. https://doi.org/10.3390/jof8080817
He Z, Naganuma T, Nakai R, Imura S, Tsujimoto M, Convey P. Microbiomic Analysis of Bacteria Associated with Rock Tripe Lichens in Continental and Maritime Antarctic Regions. Journal of Fungi. 2022; 8(8):817. https://doi.org/10.3390/jof8080817
Chicago/Turabian StyleHe, Zichen, Takeshi Naganuma, Ryosuke Nakai, Satoshi Imura, Megumu Tsujimoto, and Peter Convey. 2022. "Microbiomic Analysis of Bacteria Associated with Rock Tripe Lichens in Continental and Maritime Antarctic Regions" Journal of Fungi 8, no. 8: 817. https://doi.org/10.3390/jof8080817