Article

Geo-Distribution Patterns of Soil Fungal Community of Pennisetum flaccidum in Tibet

Lhasa Plateau Ecosystem Research Station, Key Laboratory of Ecosystem Network Observation and Modeling, Institute of Geographic Sciences and Natural Resources Research, Chinese Academy of Sciences, Beijing 100101, China
*
Author to whom correspondence should be addressed.
J. Fungi 2022, 8(11), 1230; https://doi.org/10.3390/jof8111230
Submission received: 1 October 2022 / Revised: 14 November 2022 / Accepted: 15 November 2022 / Published: 21 November 2022

Abstract

:
Pennisetum flaccidum can be used as a pioneer species for the restoration of degraded grasslands and as a high-quality forage for local yak and sheep in alpine regions. The geographical distribution pattern of soil fungal community can modify that of P. flaccidum. A field survey along 32 sampling sites was conducted to explore the geo-distribution patterns of soil fungal community of P. flaccidum in Tibet. Soil fungal species, phylogenetic and function diversity generally had a closer correlation with longitude/elevation than latitude. The geo-distribution patterns of soil fungal species, phylogenetic and function diversity varied with soil depth. Soil fungal species, phylogenetic and function diversity had dissimilar geo-distribution patterns. Precipitation had stronger impacts on total abundance, species α-diversity, phylogenetic α-diversity, and function β-diversity than temperature for both topsoil (0–10 cm depth) and subtopsoil (10–20 cm depth). Furthermore, precipitation had stronger impacts on function α-diversity for topsoil, species β-diversity for topsoil, and phylogenetic β-diversity for subtopsoil than temperature. The combination of species, phylogenetic and function diversity can better reflect geo-distribution patterns of soil fungal community. Compared to global warming, the impact of precipitation change on the variation in soil fungal community of P. flaccidum should be given more attention.

1. Introduction

The Tibetan plateau is a vital alpine area that endures simultaneous changes from both climate change (e.g., global warming) and human activities (e.g., grazing) [1,2,3,4,5,6,7]. Due to the implementation of various ecological projects (e.g., grazing withdrawal project), and warmer and wetter climate conditions, alpine ecosystems overall have become better on the Qinghai-Tibet Plateau. However, alpine ecosystems tend to show varying degrees of degradation due to climatic changes such as increase in global temperature and low precipitation and overgrazing in some local areas [1,4,8,9,10]. The great theory that green mountains and water are equal to gold and silver mountains inspires us to restore these local degraded ecosystems. Natural restoration of degraded grasslands is an advocated, great scientific theory, and species selection is the key step for the restoration of degraded ecosystems. Native species with high stress resistance might be the best choice for species selection to achieve natural restoration of degraded ecosystems. On the other hand, along with the elimination of absolute poverty, the living standards of local residents have been gradually improved, and the demand for meat (e.g., yak meat) and milk by local community is rising on the Qinghai-Tibet Plateau. However, forage shortage is still a key bottleneck restricting the development of local animal husbandry on the Qinghai-Tibet Plateau. Planting local forage grass with high quality might be an important way to alleviate the contradiction between livestock and forage grass on the Qinghai-Tibet Plateau [3,4]. Thus, it is essential to select and promote the production of high-quality native forages and herbs on the Qinghai-Tibet Plateau.
Pennisetum flaccidum can be chosen as a pioneer species for the restoration of degraded grasslands and as a high-quality forage for local yak and sheep because of its developed rhizome systems, strong resistance to environmental stresses (e.g., dry, cold conditions), great nutritive value and wide geographical distribution on the Qinghai-Tibet Plateau [11]. Soil fungal community is an important bridge of nutrient elements (e.g., nitrogen and phosphorus) between plants and soils, and some fungal species might have favorable impacts on plants [12,13,14,15]. Soil fungal community can modify plant root activities and sequentially botany physiology and growth from various aspects [12,16]. The geographical distribution pattern of soil fungal community can modify that of host plant (e.g., P. flaccidum). However, to our knowledge, no reports have examined the geographical distribution pattern of soil fungal community associated with P. flaccidum on the Qinghai-Tibet Plateau. Consequently, we explored the geographical distribution pattern of soil fungal community of P. flaccidum and related driving mechanisms for their interaction in Tibet.

2. Materials and Methods
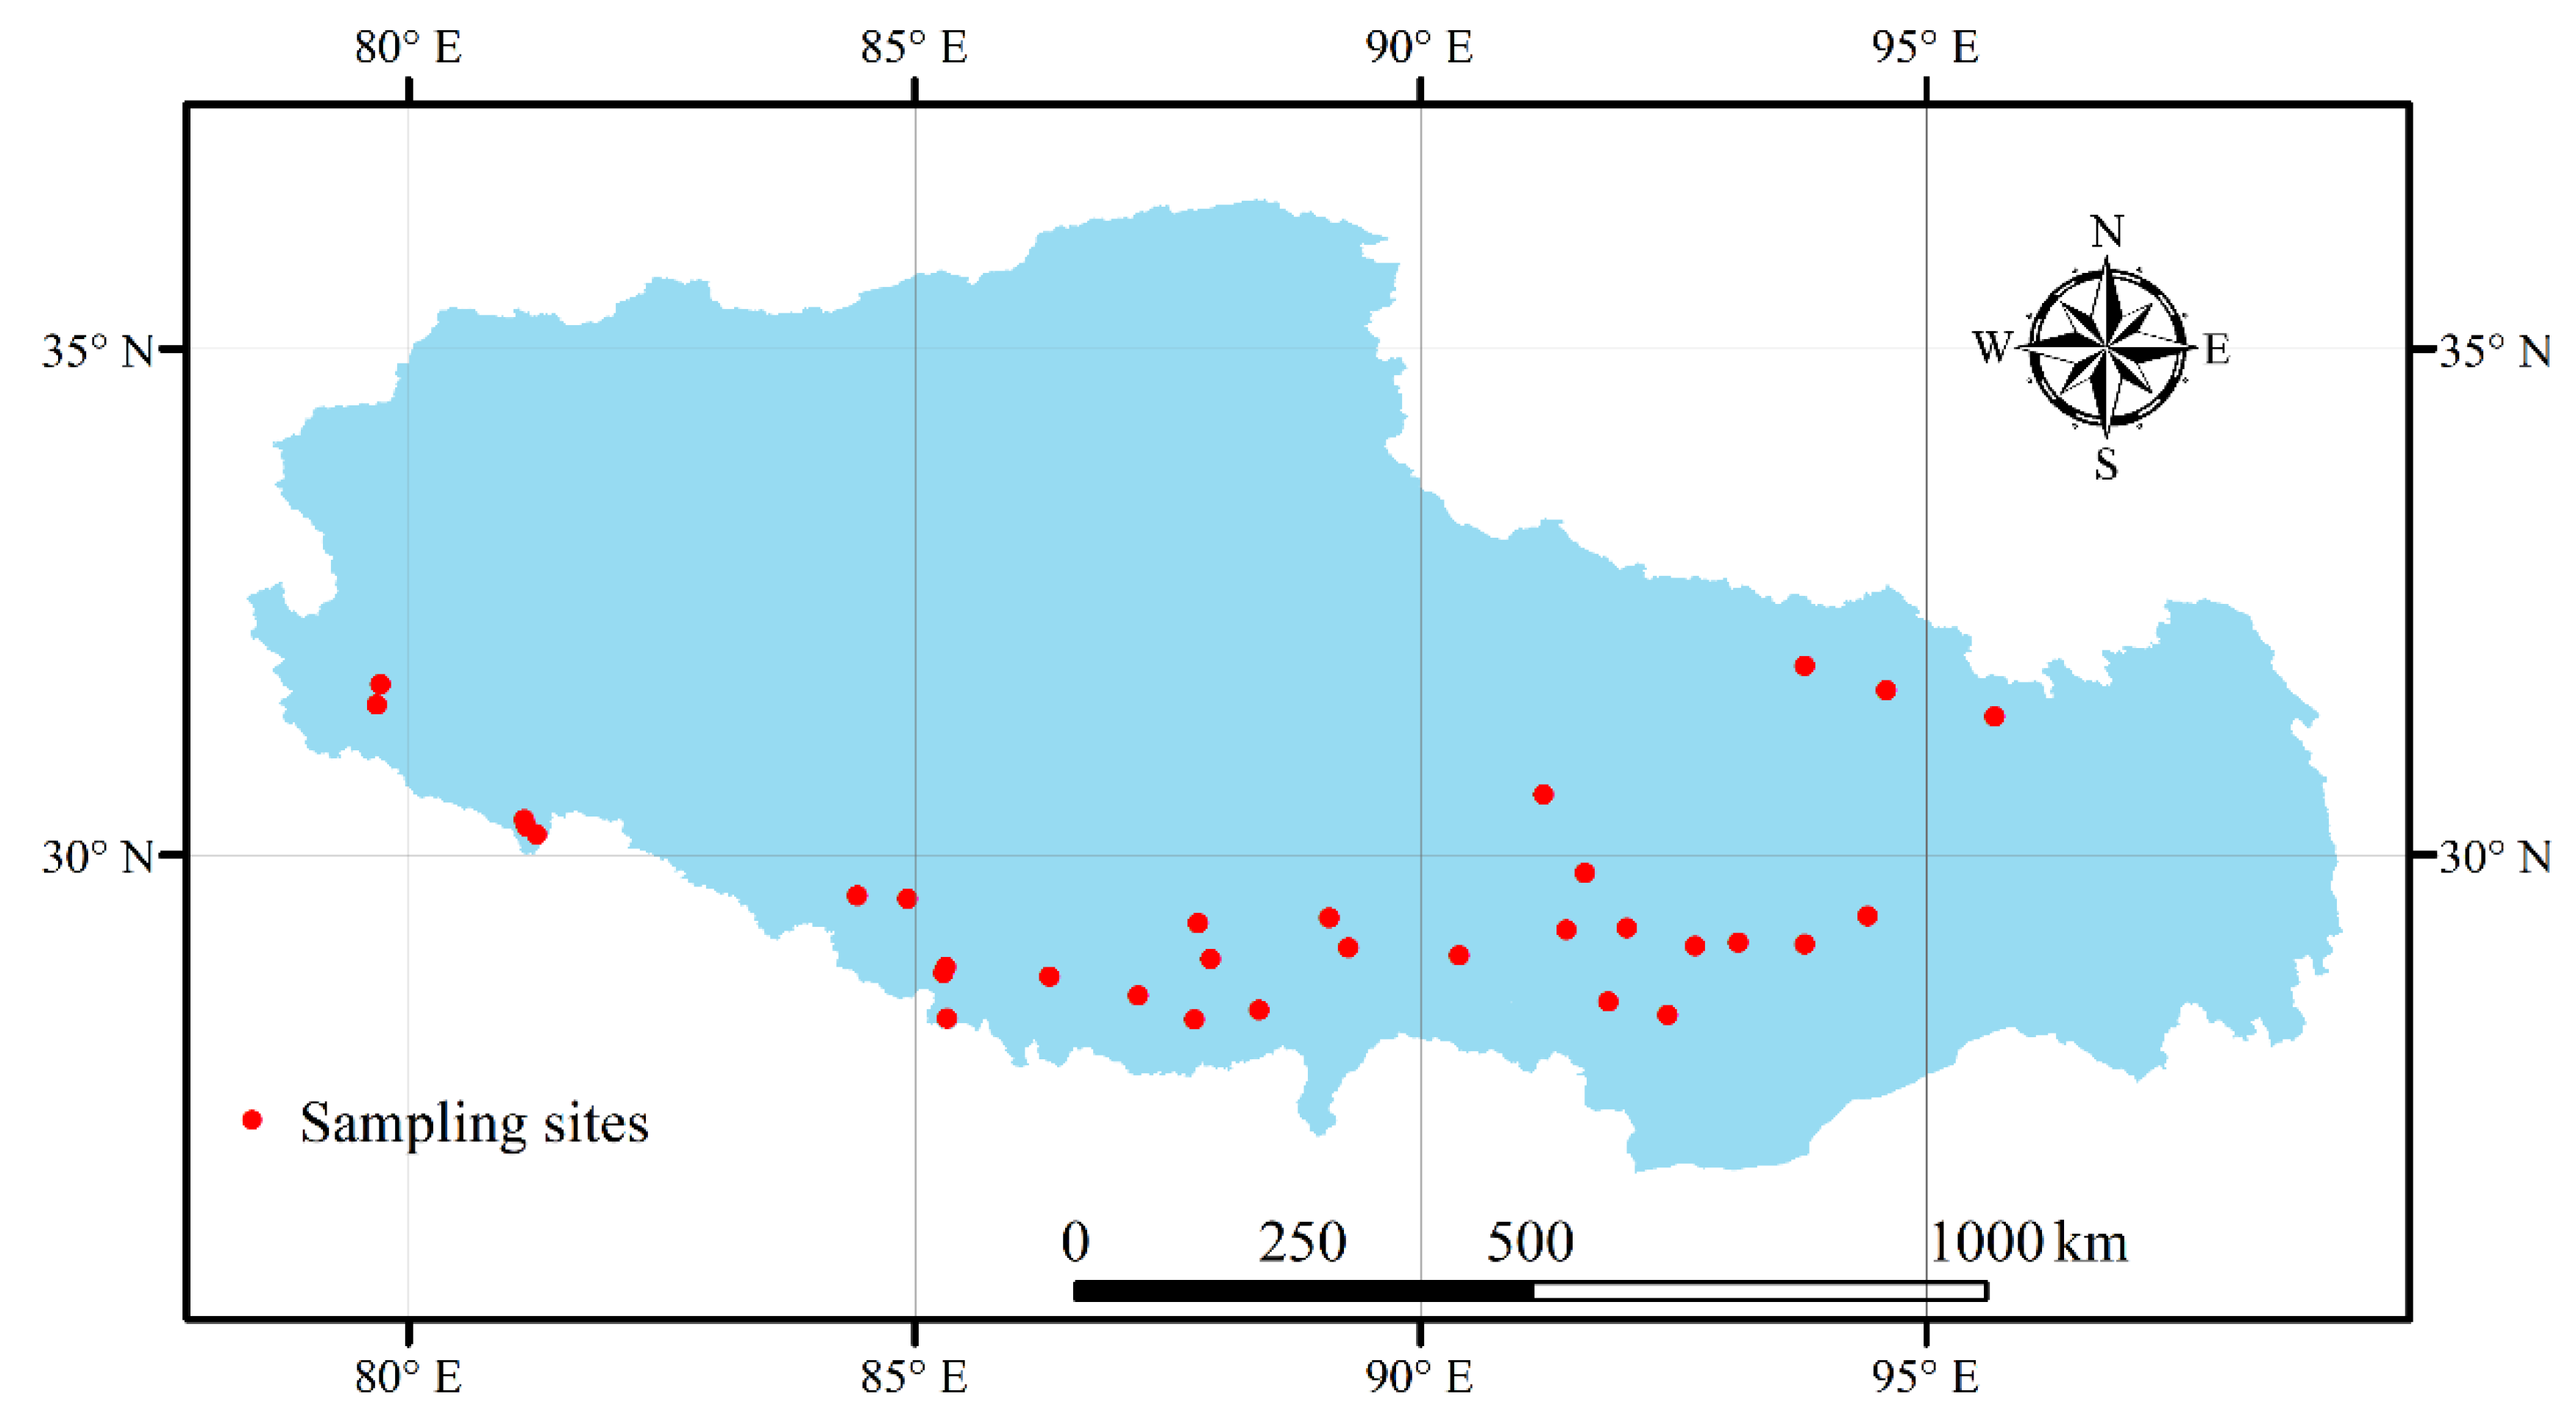
2.1. Study Area

Field samples were collected from 32 sampling sites in 2020 in Tibet (Figure A1 in Appendix A). Three geographic variables (i.e., latitude, longitude, elevation) and four climatic variables (MAP: mean annual precipitation in 1982–2020, MAT: mean annual temperature in 1982–2020, AP2020: annual precipitation in 2020, AT2020: annual temperature in 2020) were acquired for each one of the 32 sampling sites. Original monthly air temperature and precipitation were acquired from the China Meteorological Data Sharing Service System and later spatially interpolated to acquire the climate data for the whole area with a spatial resolution of 1 km × 1 km using the ANUSPLIN 4.3 software [3,4]. The four climatic variables were based on interpolated climate data. The elevation ranged from 2785 m to 4578 m. The longitude ranged from 79.69° E to 95.68° E. The latitude ranged from 28.37° N to 31.86° N. The MAT ranged from 2.33 °C to 13.02 °C. The MAP ranged from 73.70 mm to 640.16 mm. The AT2020 ranged from 2.91 °C to 12.25 °C. The AP2020 ranged from 26.88 mm to 785.87 mm for the 32 sampling sites.

2.2. Plant Sampling and Observation, Soil Sampling and Analyses

We observed stem diameter (SD), plant height and leaf area (LA). Subsequently, topsoil (0–10 cm depth) and subtopsoil (10–20 cm depth) were gathered at each one of the 32 sites. There were three replicates for each one of the 32 sites. Subsamples of these soils were stored in liquid nitrogen to observe soil fungal community. The PCR amplification primers for soil fungal community were BD-ITS1F (CTTGGTCATTTAGAGGAAGTAA) and ITS2-2043R (GCTGCGTTCTTCATCGATGC). The purified 50 ng DNA was mixed with 25 μL 2× Premix Taq, 1 μL Primer-F (10 μM) and 1 μL Primer-R (10 μM), and then mixture was determined to 50 μL by adding nuclease-free water. The PCR amplification included the following procedures (1) pre-degeneration for 5 min at 94 °C, (2) 30 cycles of denaturation at 94 °C for 30 s, annealing at 52 °C for 30 s, and extension at 72 °C for 30 s, (3) final elongation at 72 °C for 10 min. The PCR amplification instrument was the BioRad S1000 (Bio-Rad Laboratory, Hercules, CA, USA). The fragment length and concentration of the amplification PCR products were detected by 1% agarose gel electrophoresis. After the concentration of PCR products was compared by GeneTools Analysis Software (Version 4.03.05.0, SynGene), the PCR products were mixed according to the principle of equal mass. The PCR mixture was purified using the E.Z.N.A.® Gel Extraction Kit (Omega, Norcross, GA, USA) gel recovery kit. The NEBNext® Ultra™ II DNA Library Prep Kit for Illumina® (New England Biolabs, Ipswich, MA, USA) was used for library construction. The Illumina Nova 6000 platform was used for PE250 sequencing (Guangdong Magigene Biotechnology Co., Ltd. Guangzhou, China). The double-ended raw reads data were clipped by sliding window quality (-W 4-M 20) on the fastp tool (an ultra-fast all-in-one FASTQ preprocessor, version 0.14.1, https://github.com/OpenGene/fastp, accessed on 30 September 2022). According to the sequence at the ends of the fore and aft primer information, the cutadapt software (https://github.com/marcelm/cutadapt/, accessed on 30 September 2022) was used to remove primers. Then, the paired-end clean reads were obtained. The usearch -fastq_mergepairs (V10, http://www.drive5.com/usearch/, accessed on 30 September 2022) was used to filter out tags that do not conform to default parameter and obtain raw tags. The fastp (an ultra-fast all-in-one FASTQ preprocessor, version 0.14.1, https://github.com/OpenGene/fastp, accessed on 30 September 2022) was used to clip the raw tags by sliding window quality (-W 4-M 20), and then clean tags were obtained. The Unite (for ITS, http://unite.ut.ee/index.php, accessed on 30 September 2022) database was used to annotate taxonomic information by usearch-sintax (the default confidence threshold was ≥0.8) for each representative sequence. Subsamples of these soils were used to observe electrical conductivity (EC), pH, soil organic carbon (SOC), total nitrogen (TN), total phosphorus (TP), total potassium (TK), ammonium nitrogen (NH4+-N), nitrate nitrogen (NO3--N), available phosphorus (AP), and available potassium (AK). The ratio of SOC to TN (C:N), ratio of SOC to TP (C:P), ratio of SOC to TK (C:K), ratio of TN to TP (N:P), ratio of TN to TK (N:K), ratio of TP to TK (P:K), ratio of available nitrogen (sum of NH4+-N and NO3--N) to AP (available N:P), ratio of available nitrogen to AK (available N:K), and ratio of AP to AK (available P:K) were determined.

2.3. Statistical Analyses
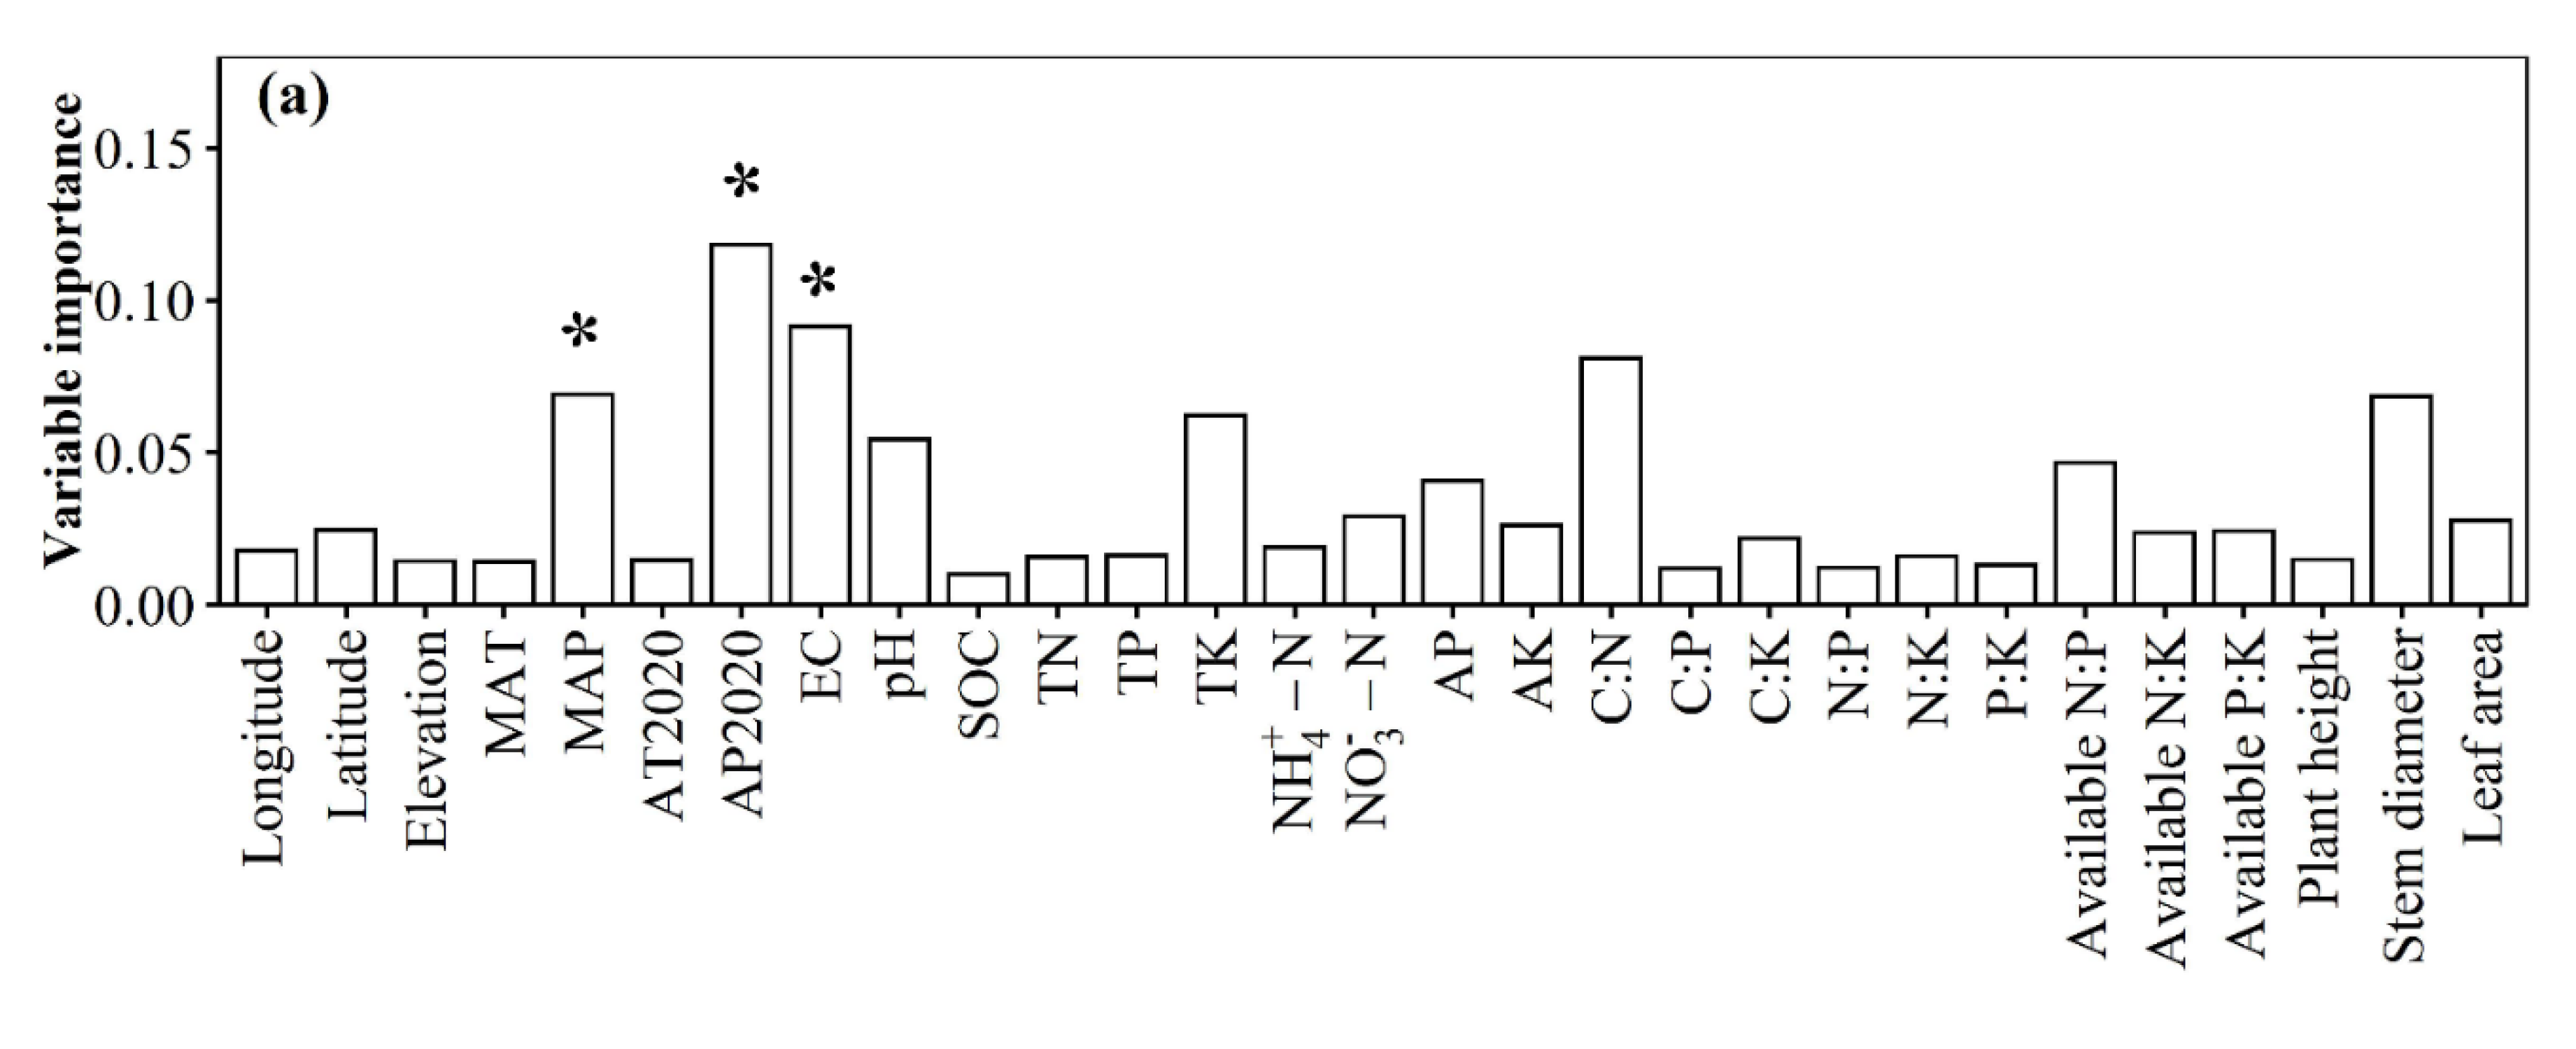
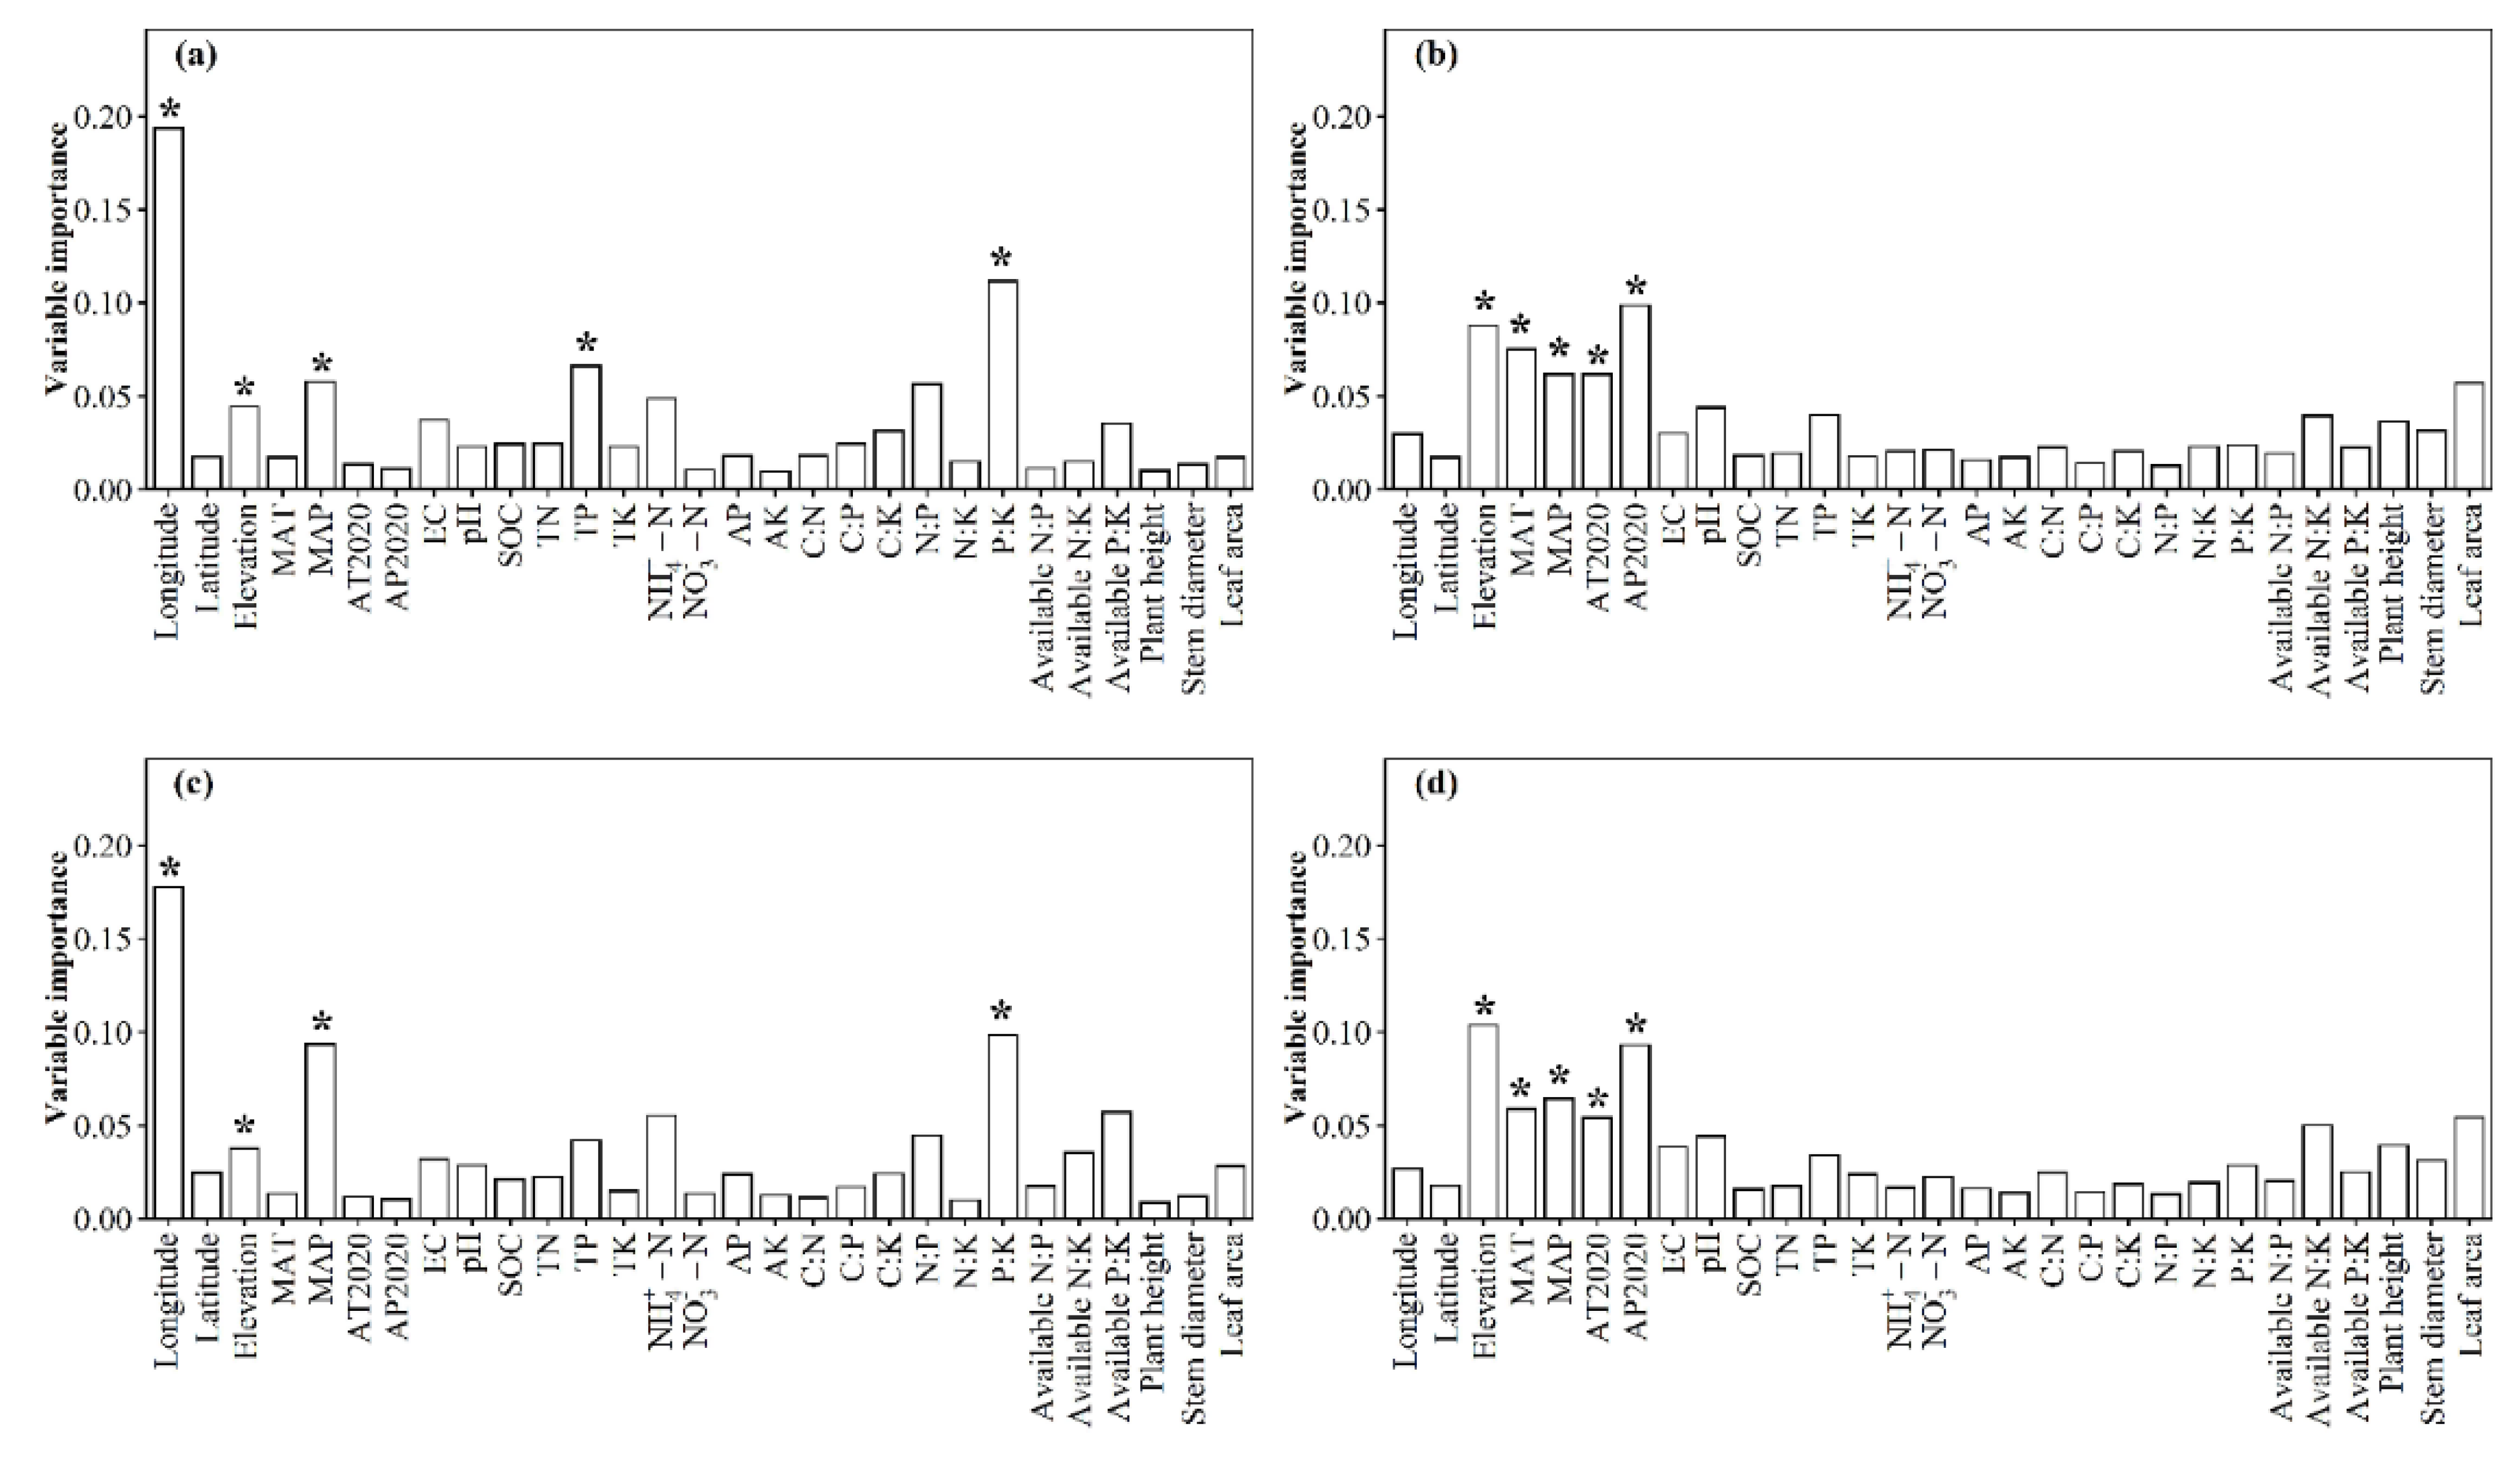
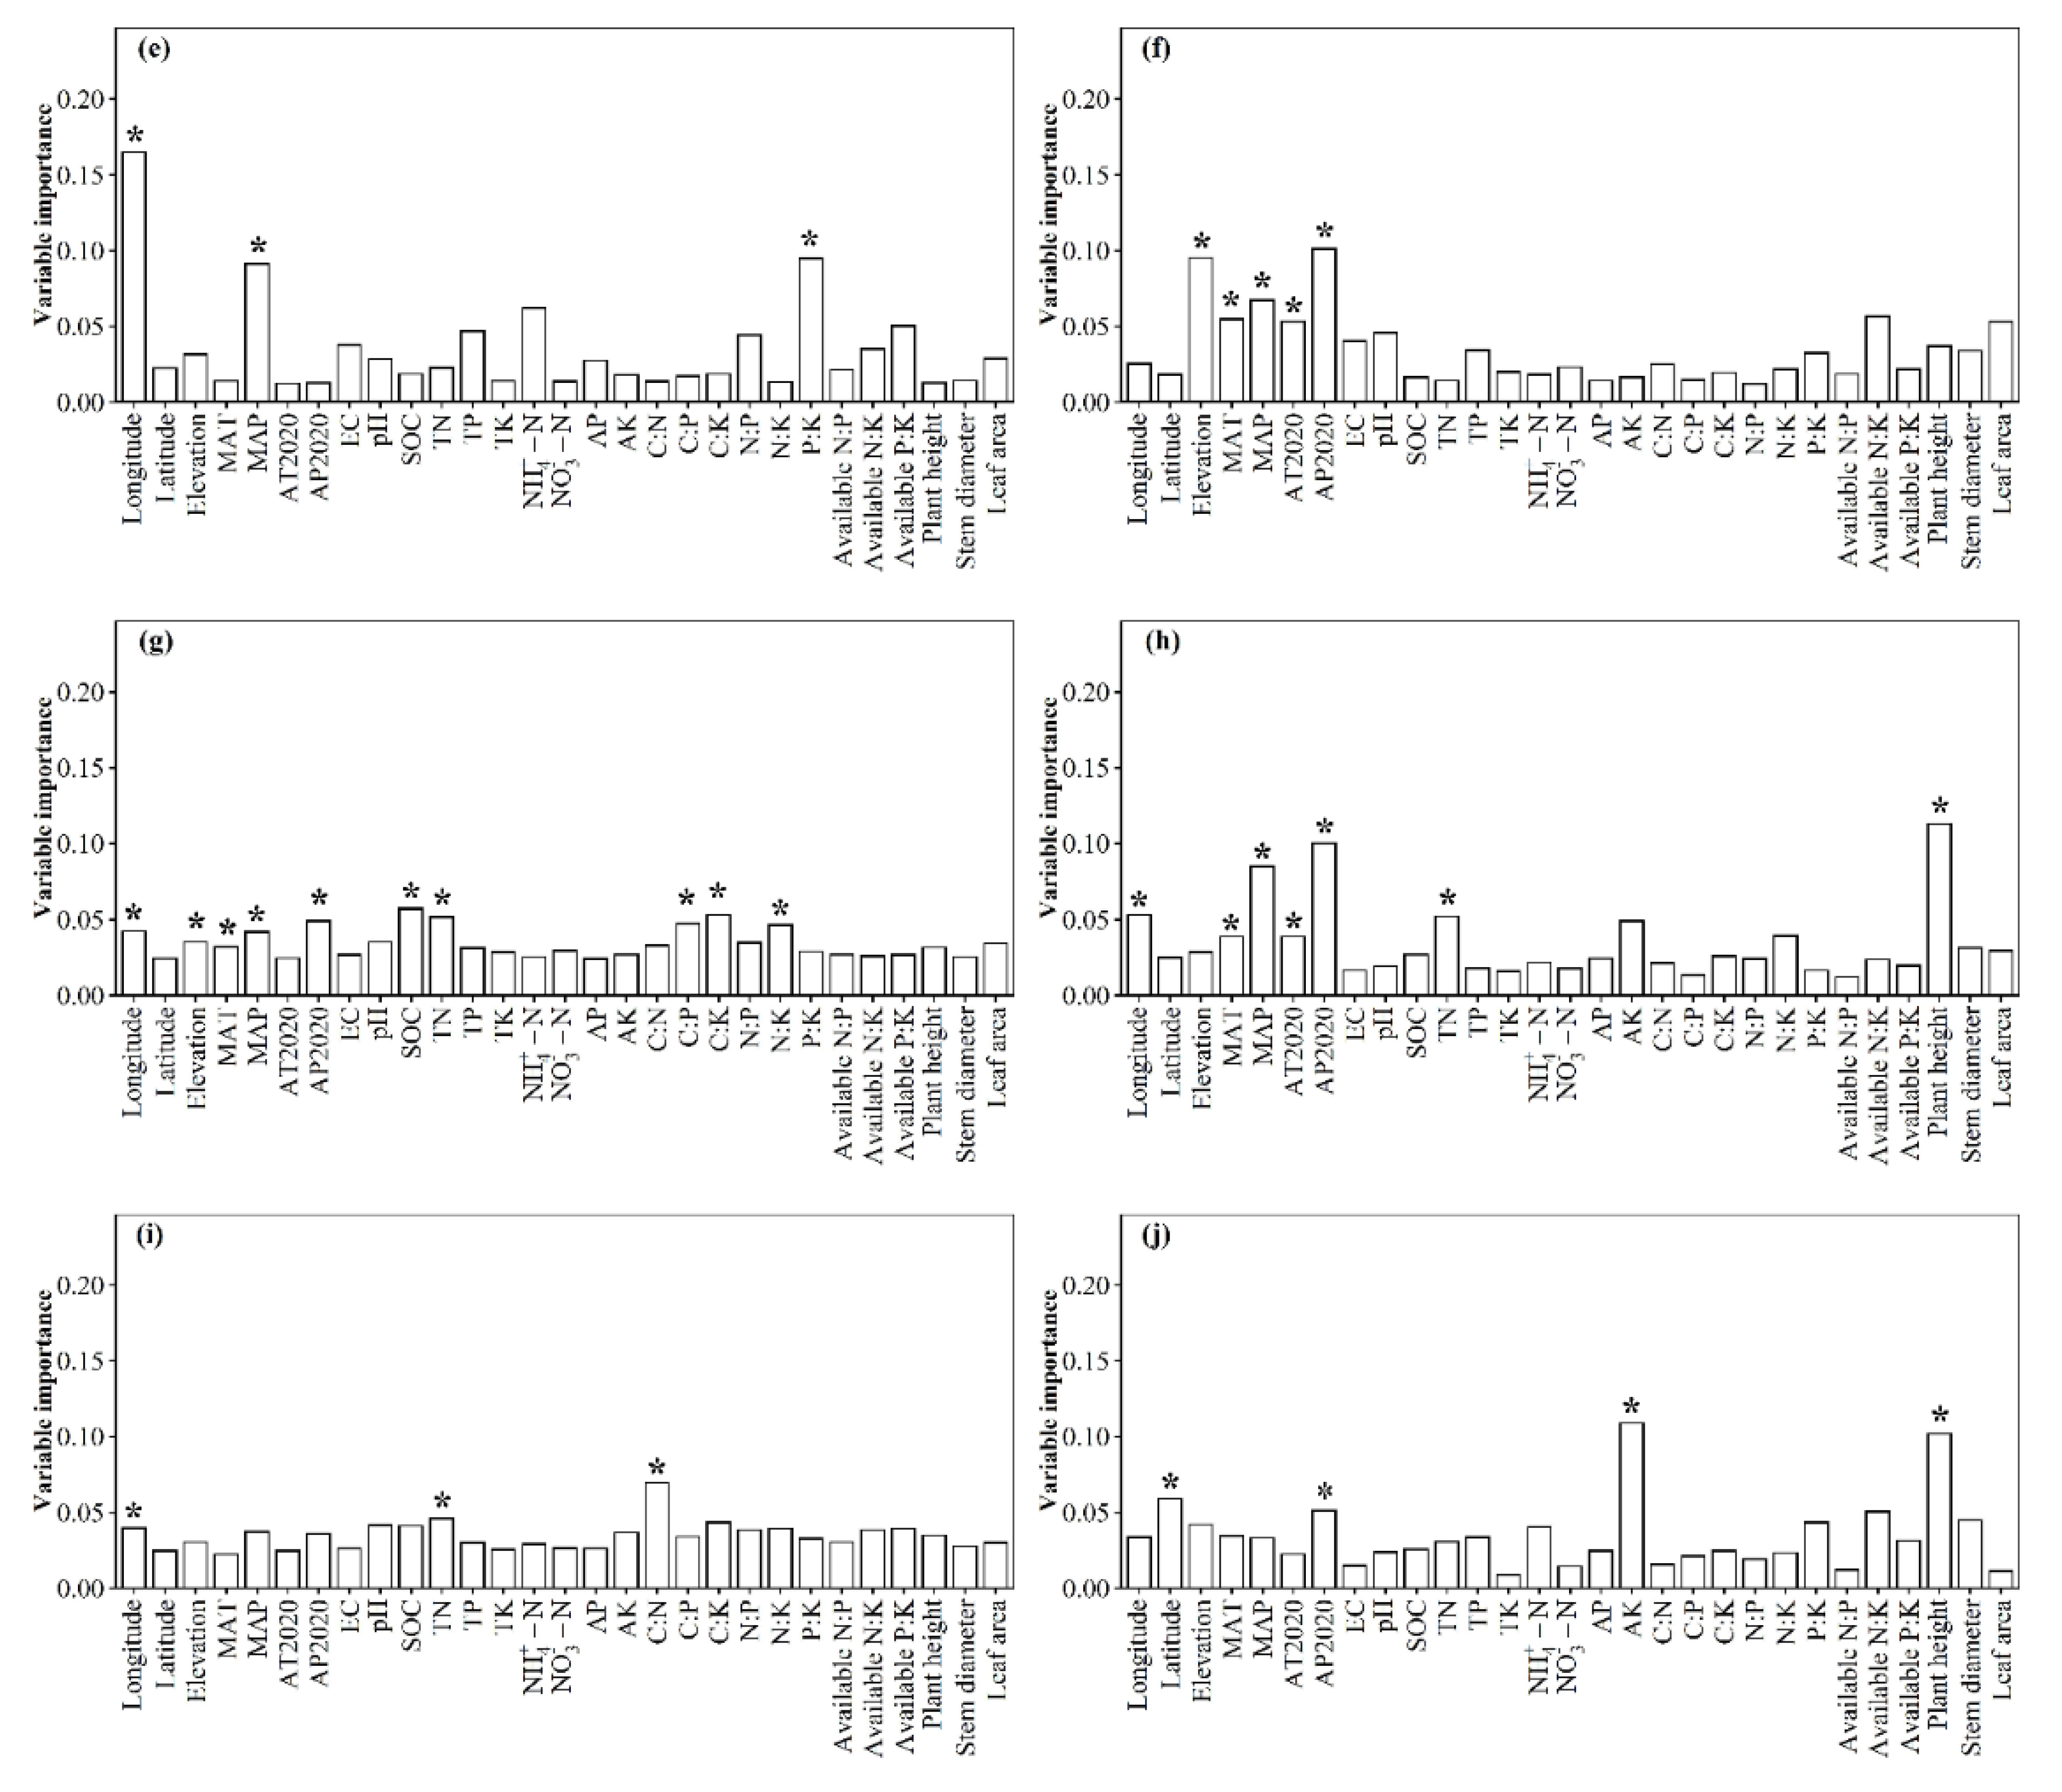
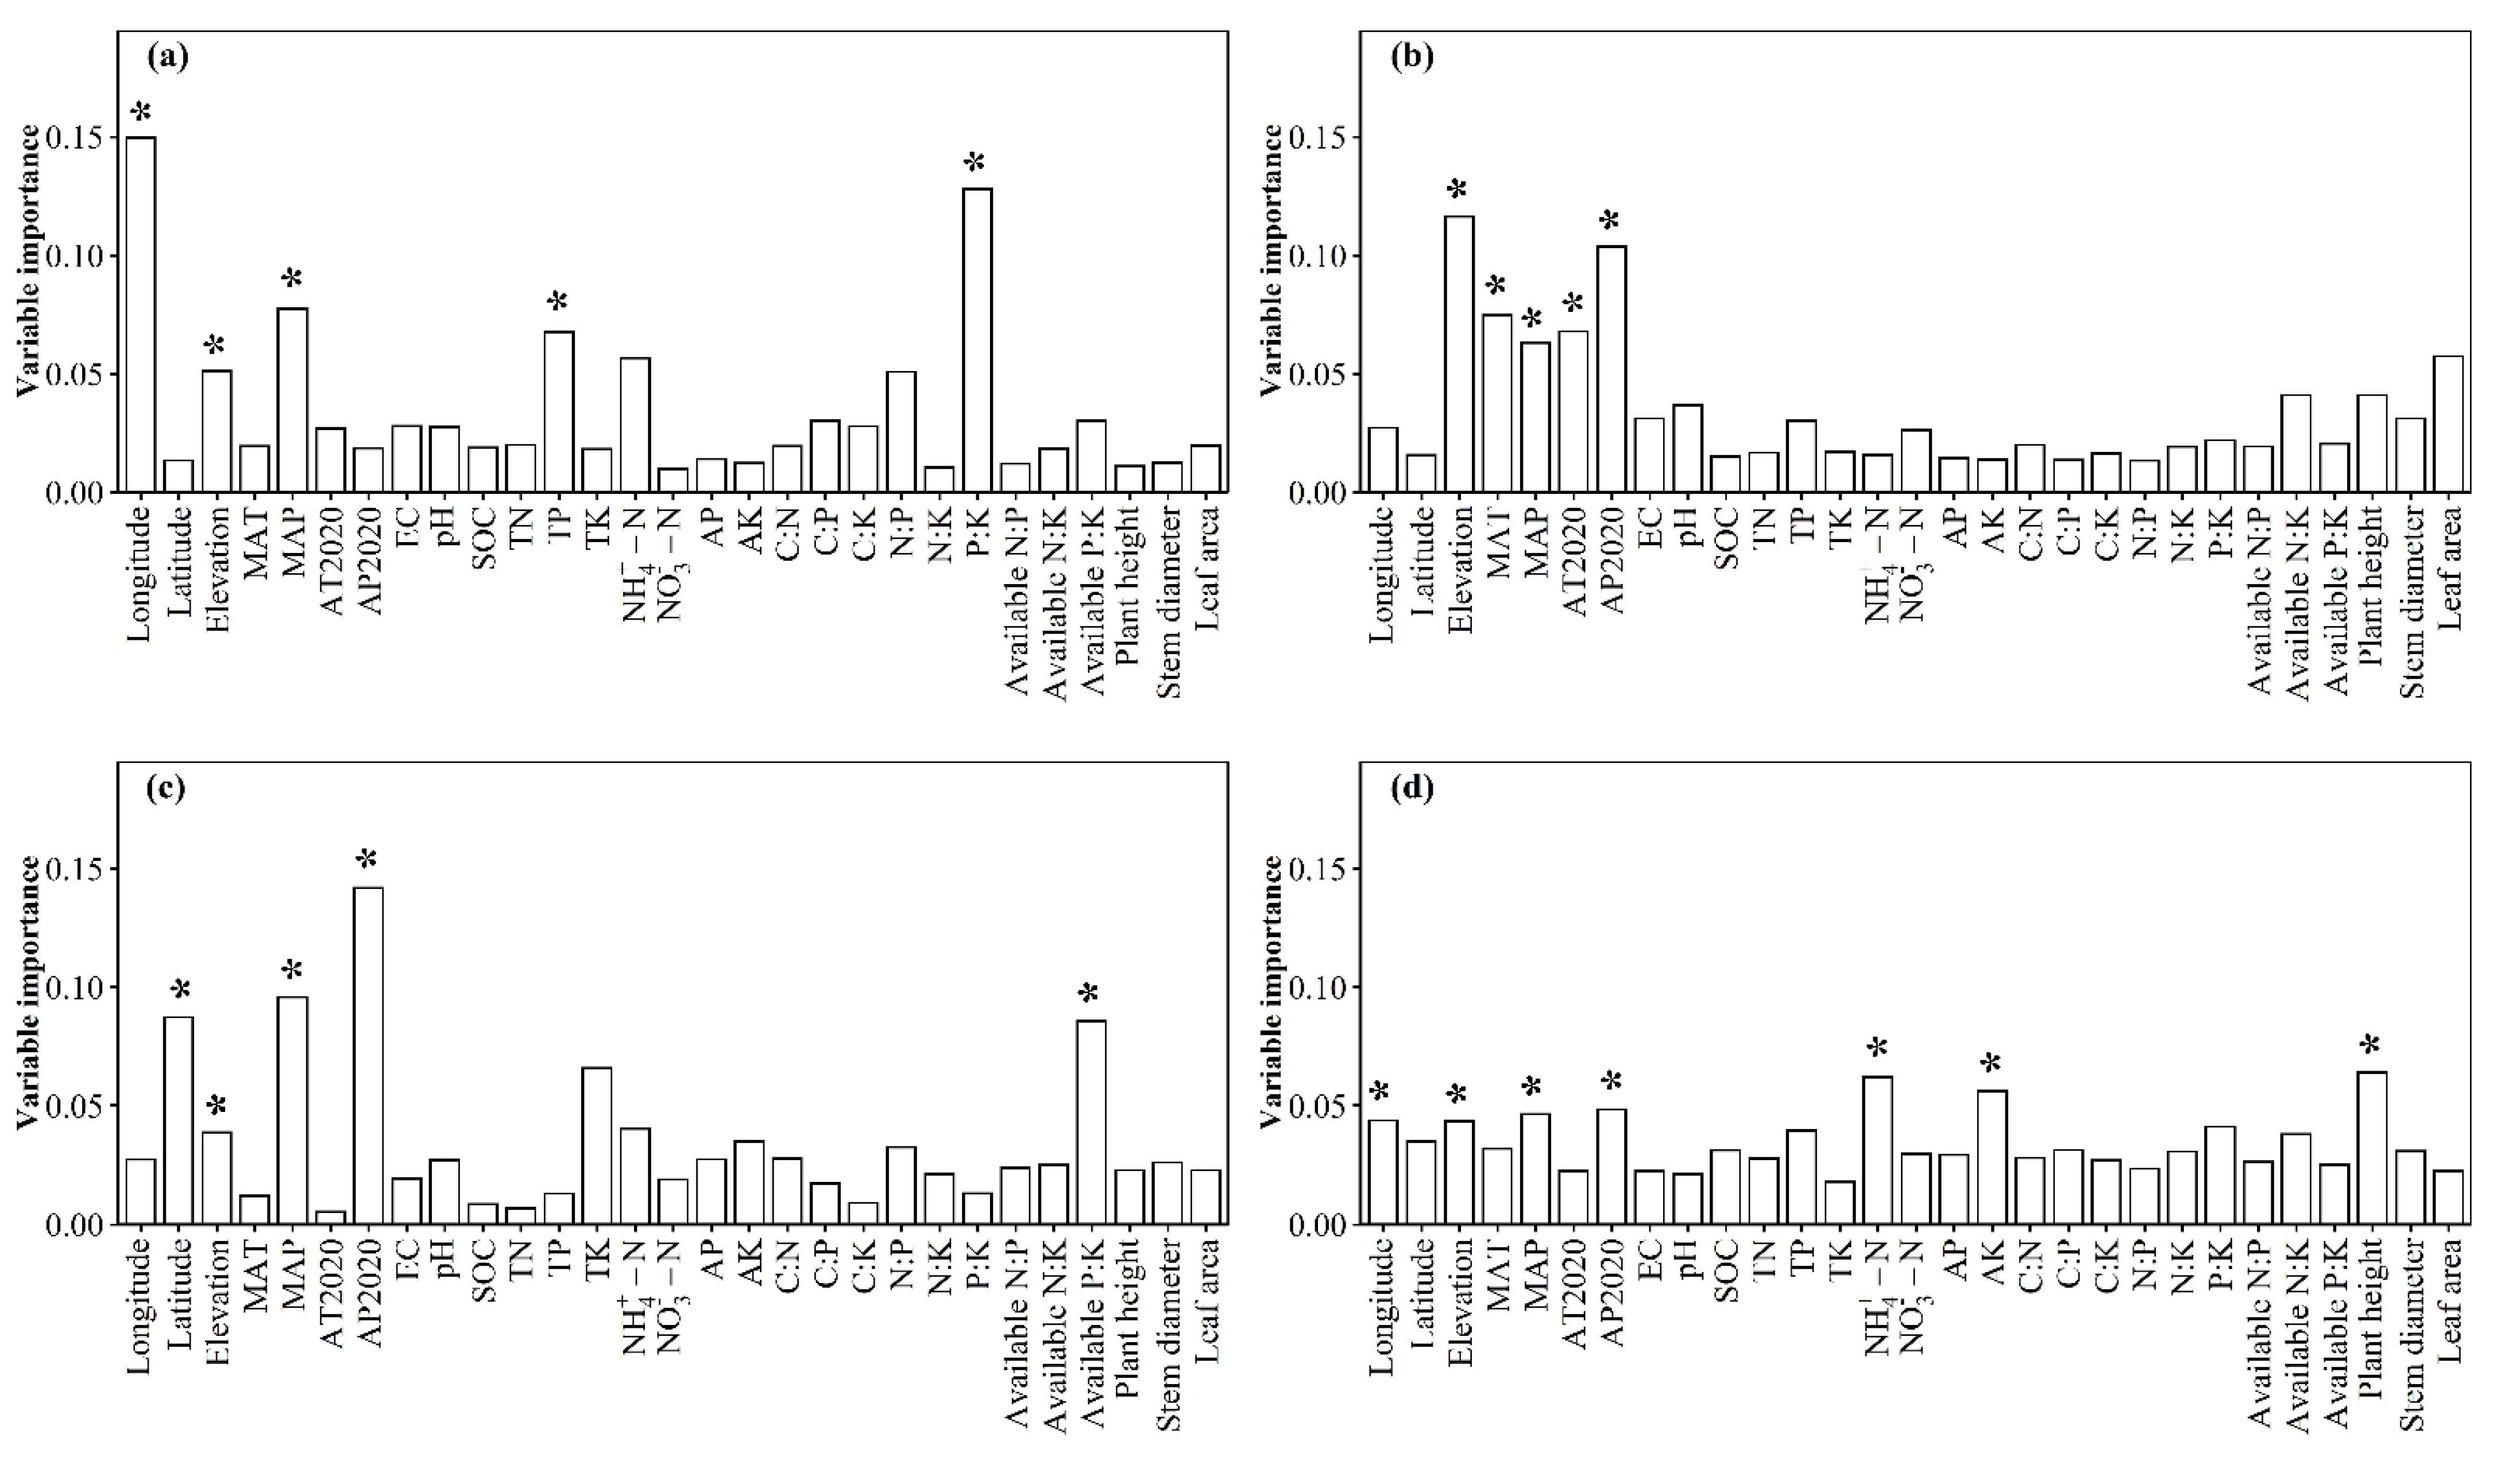
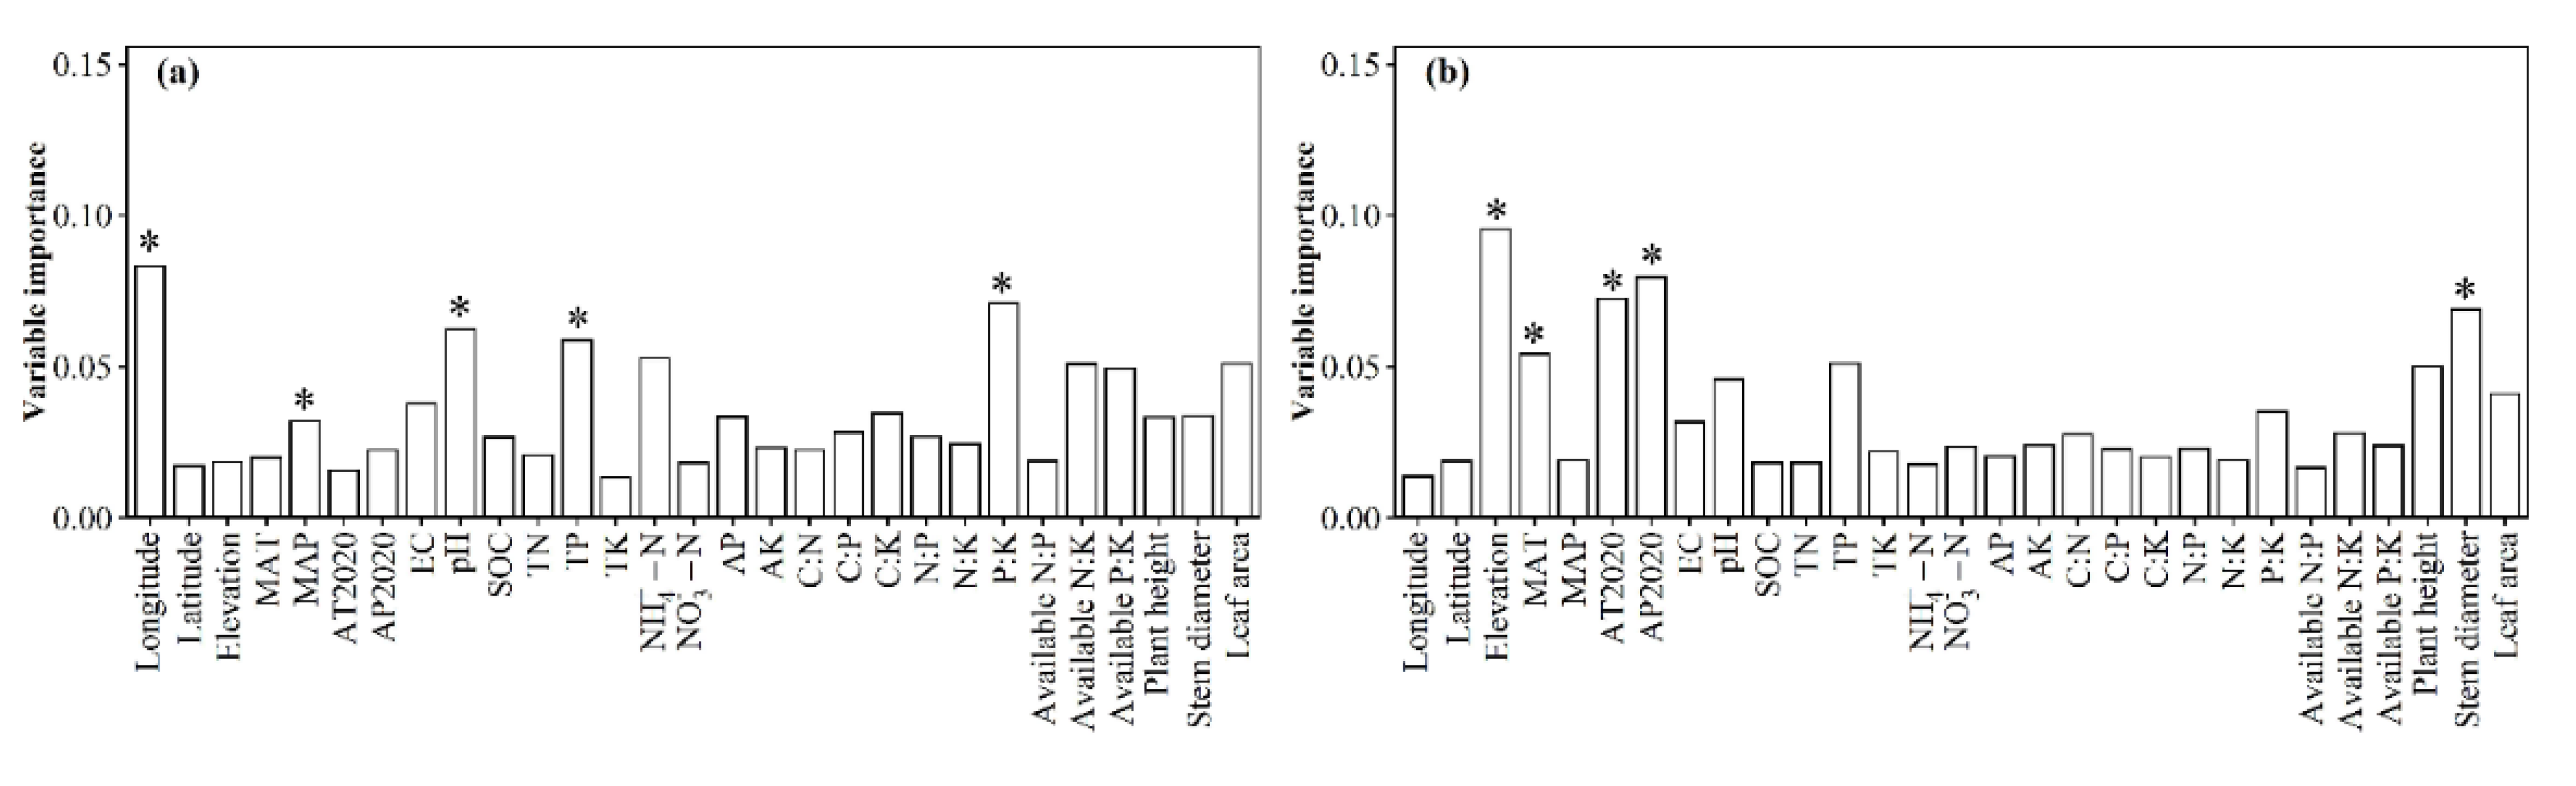
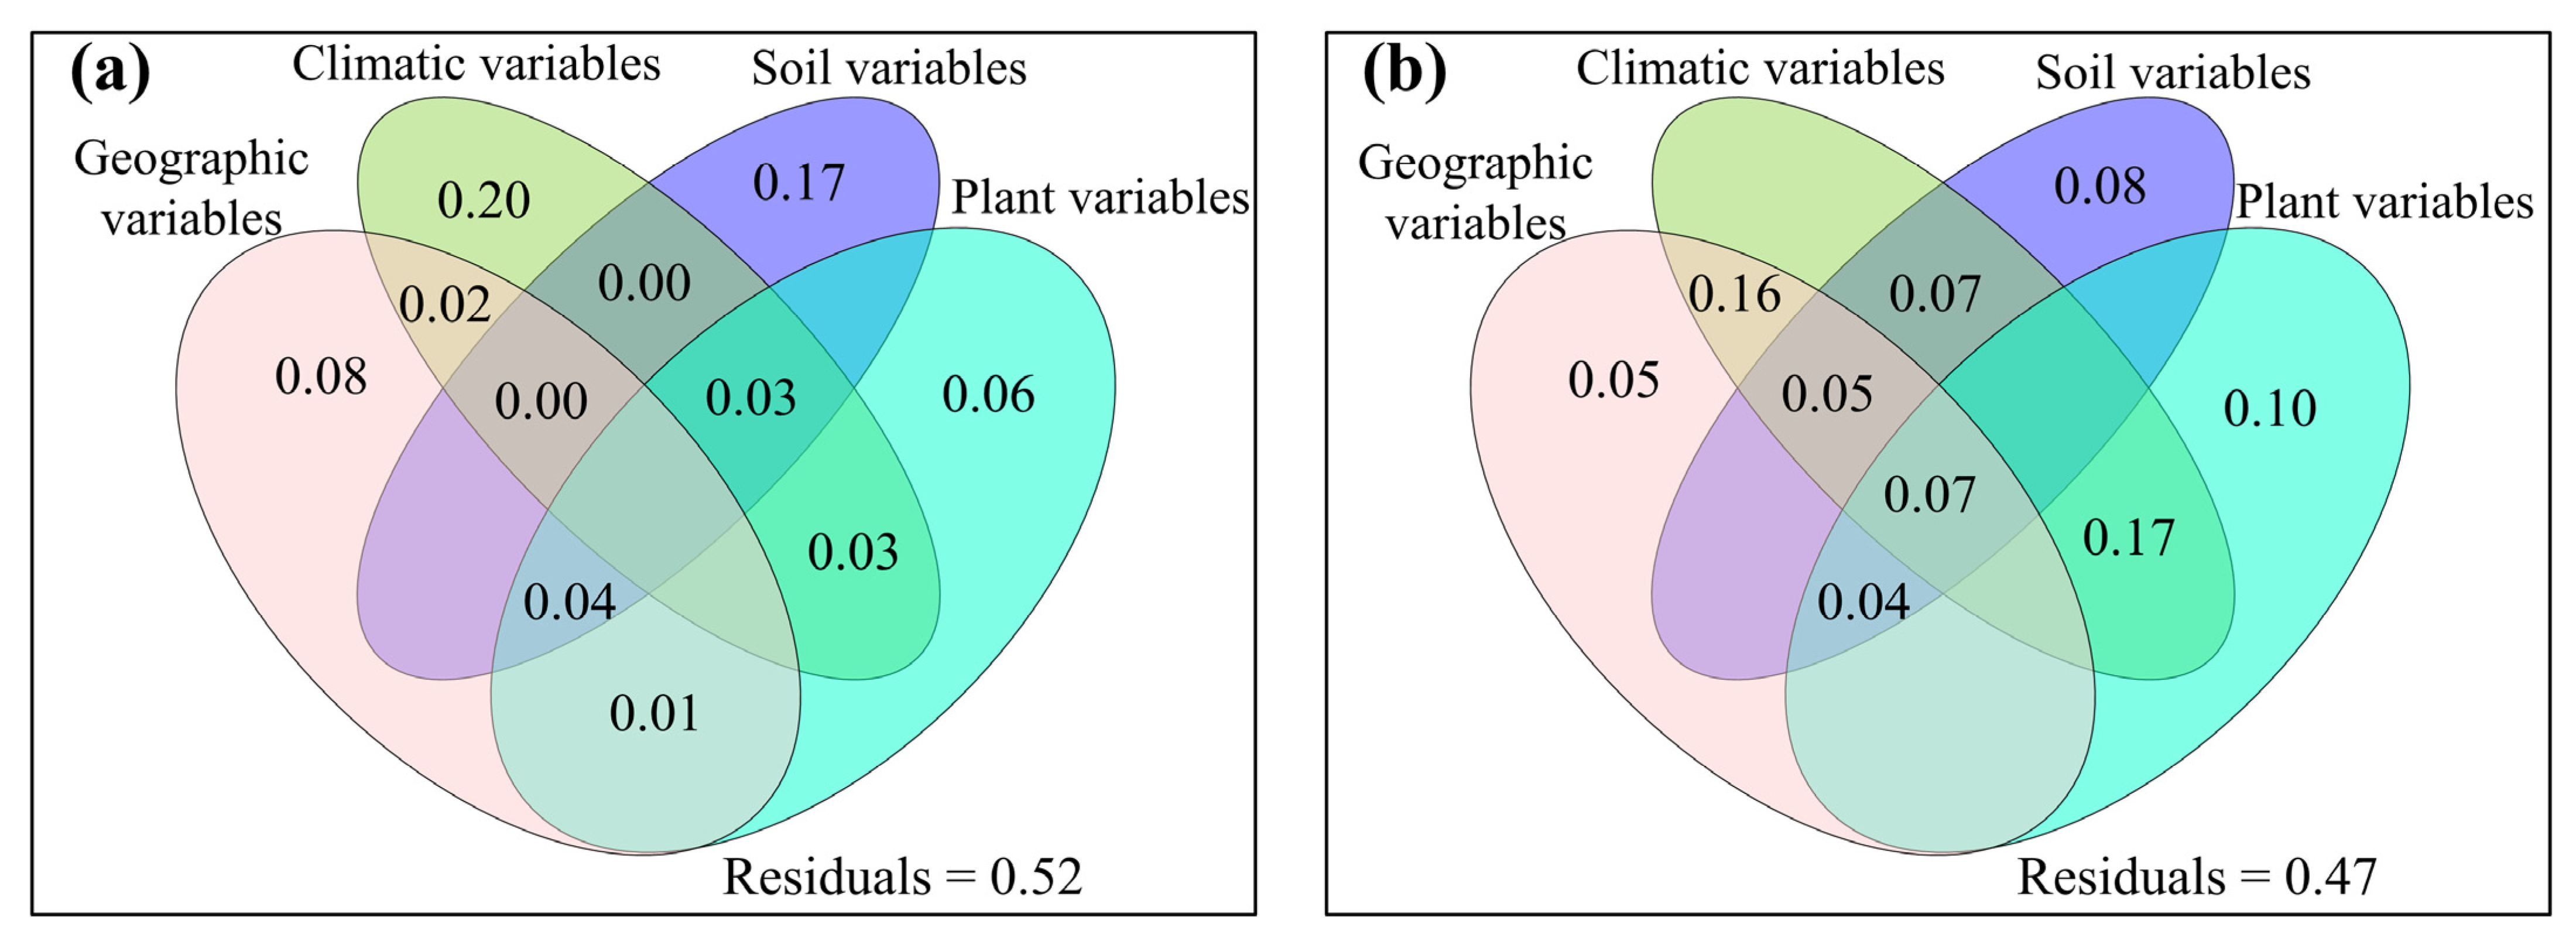
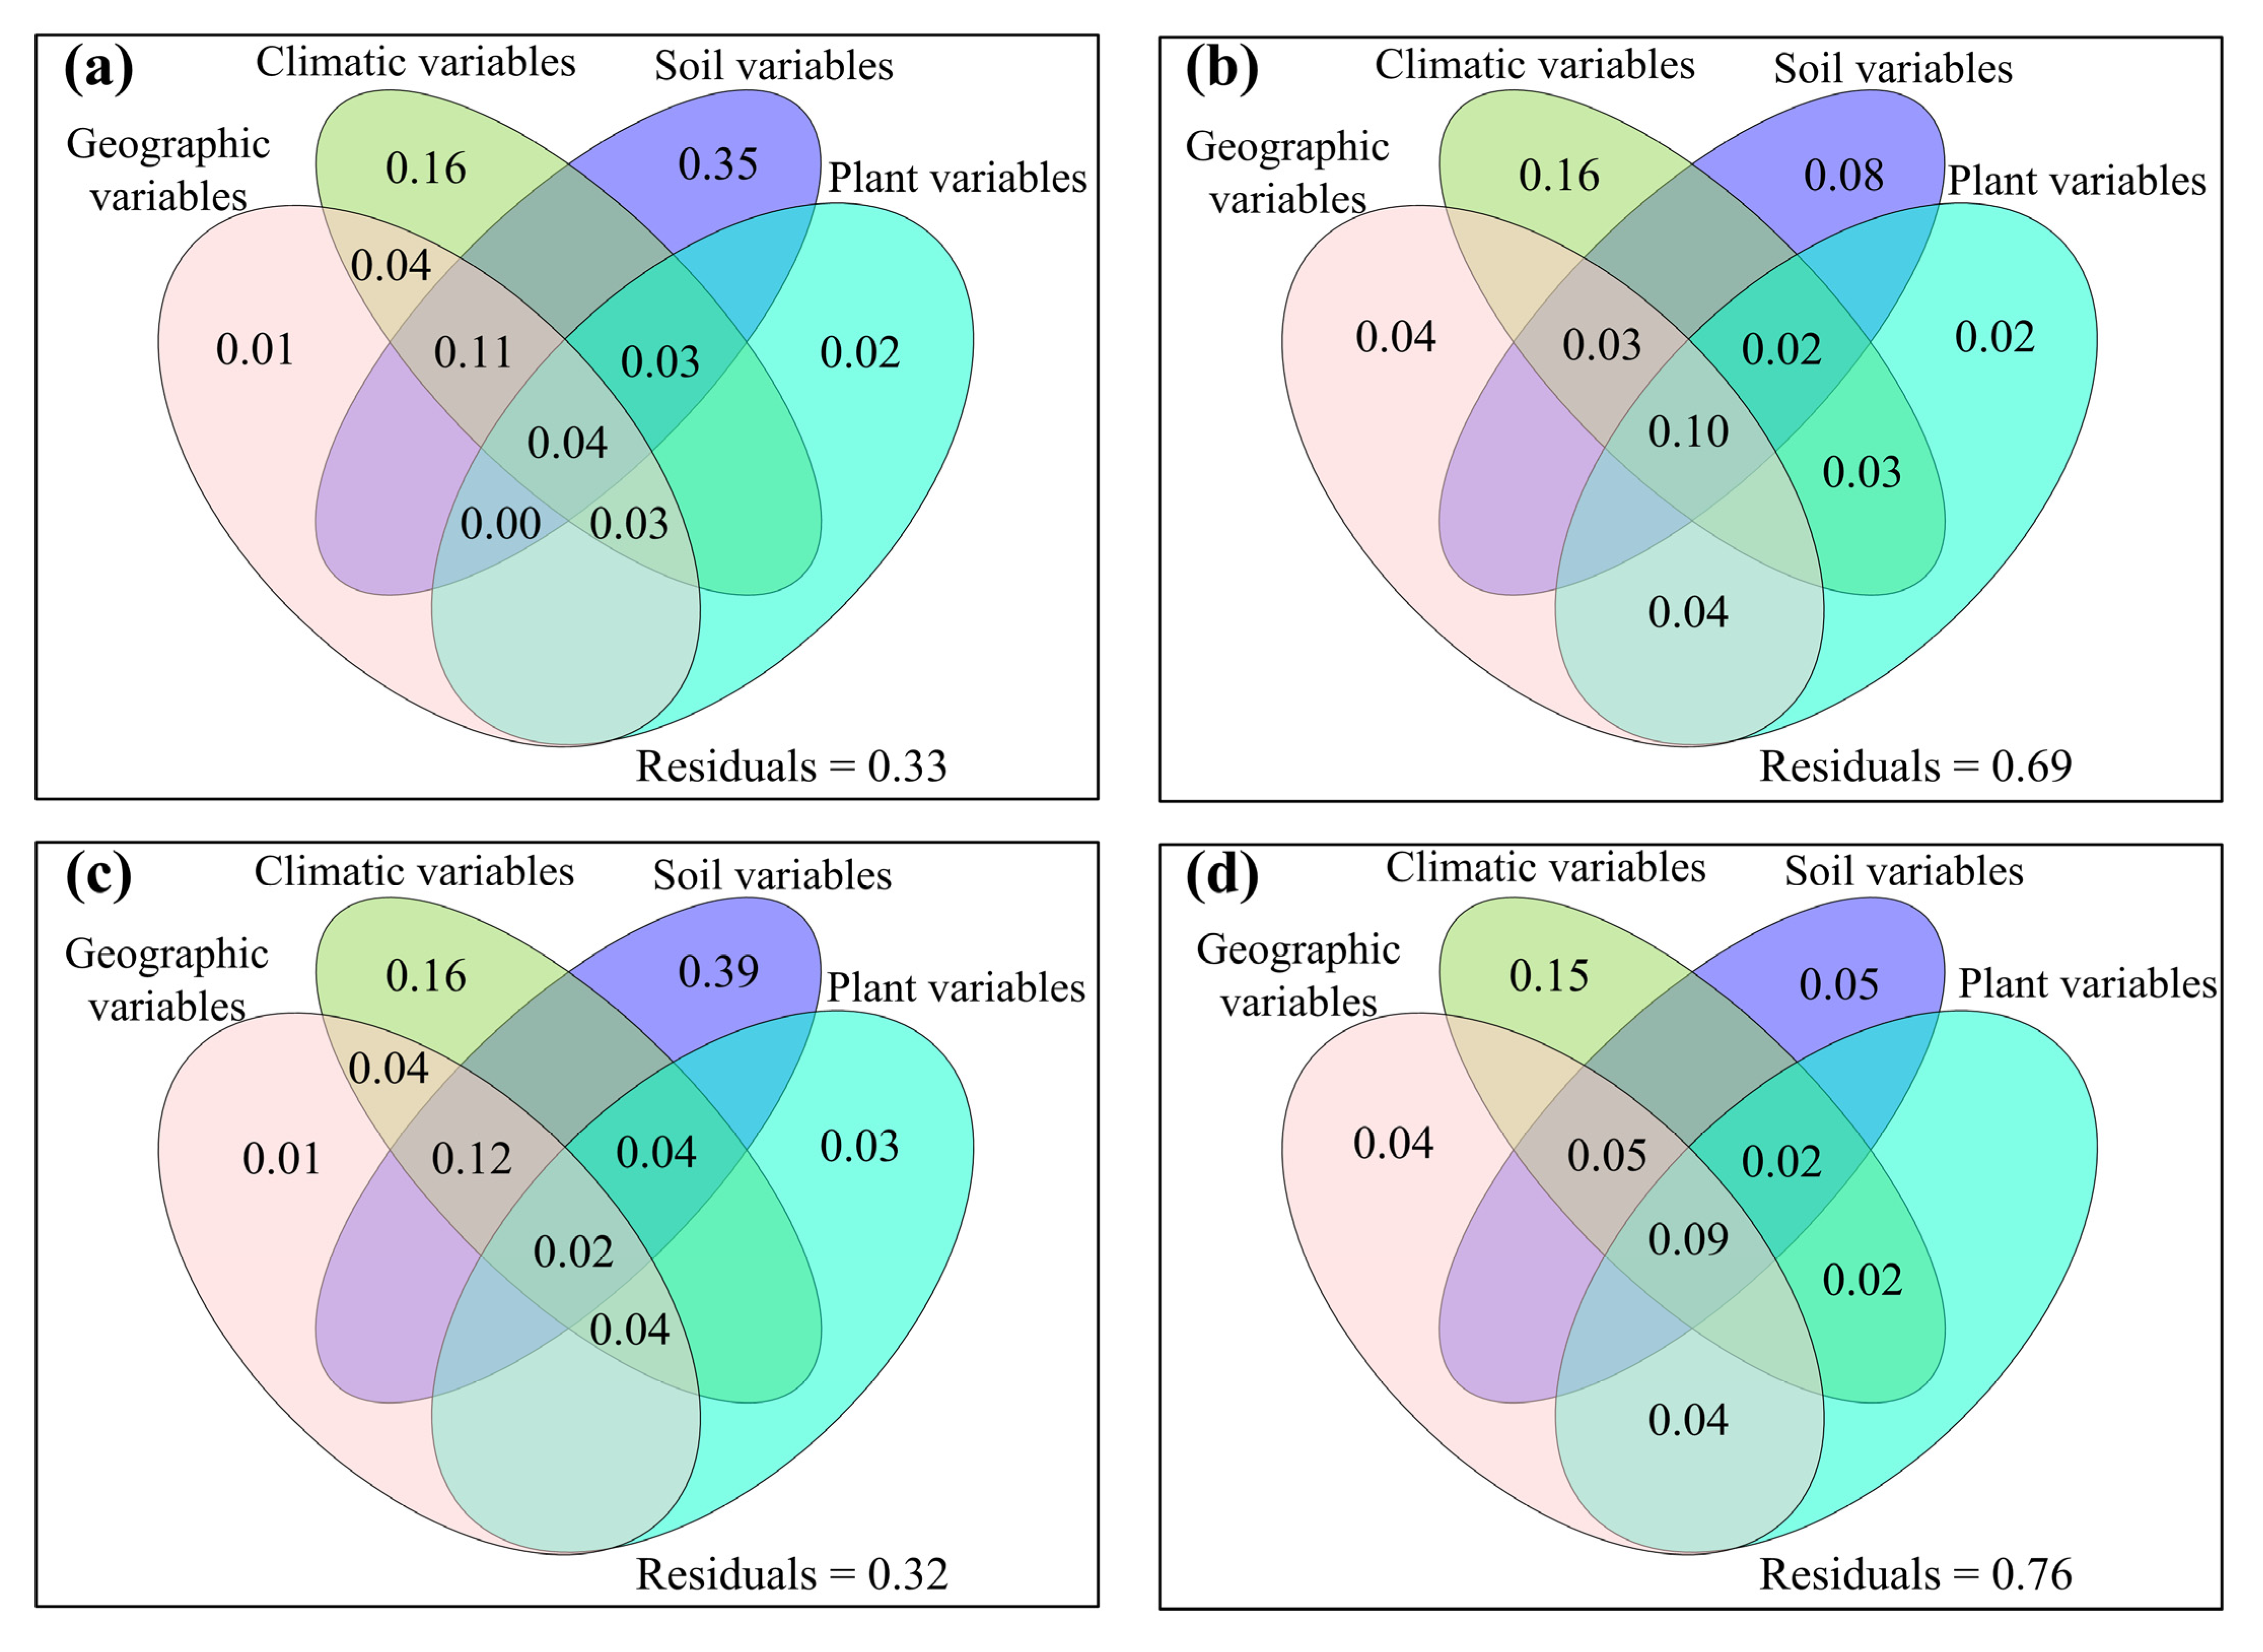
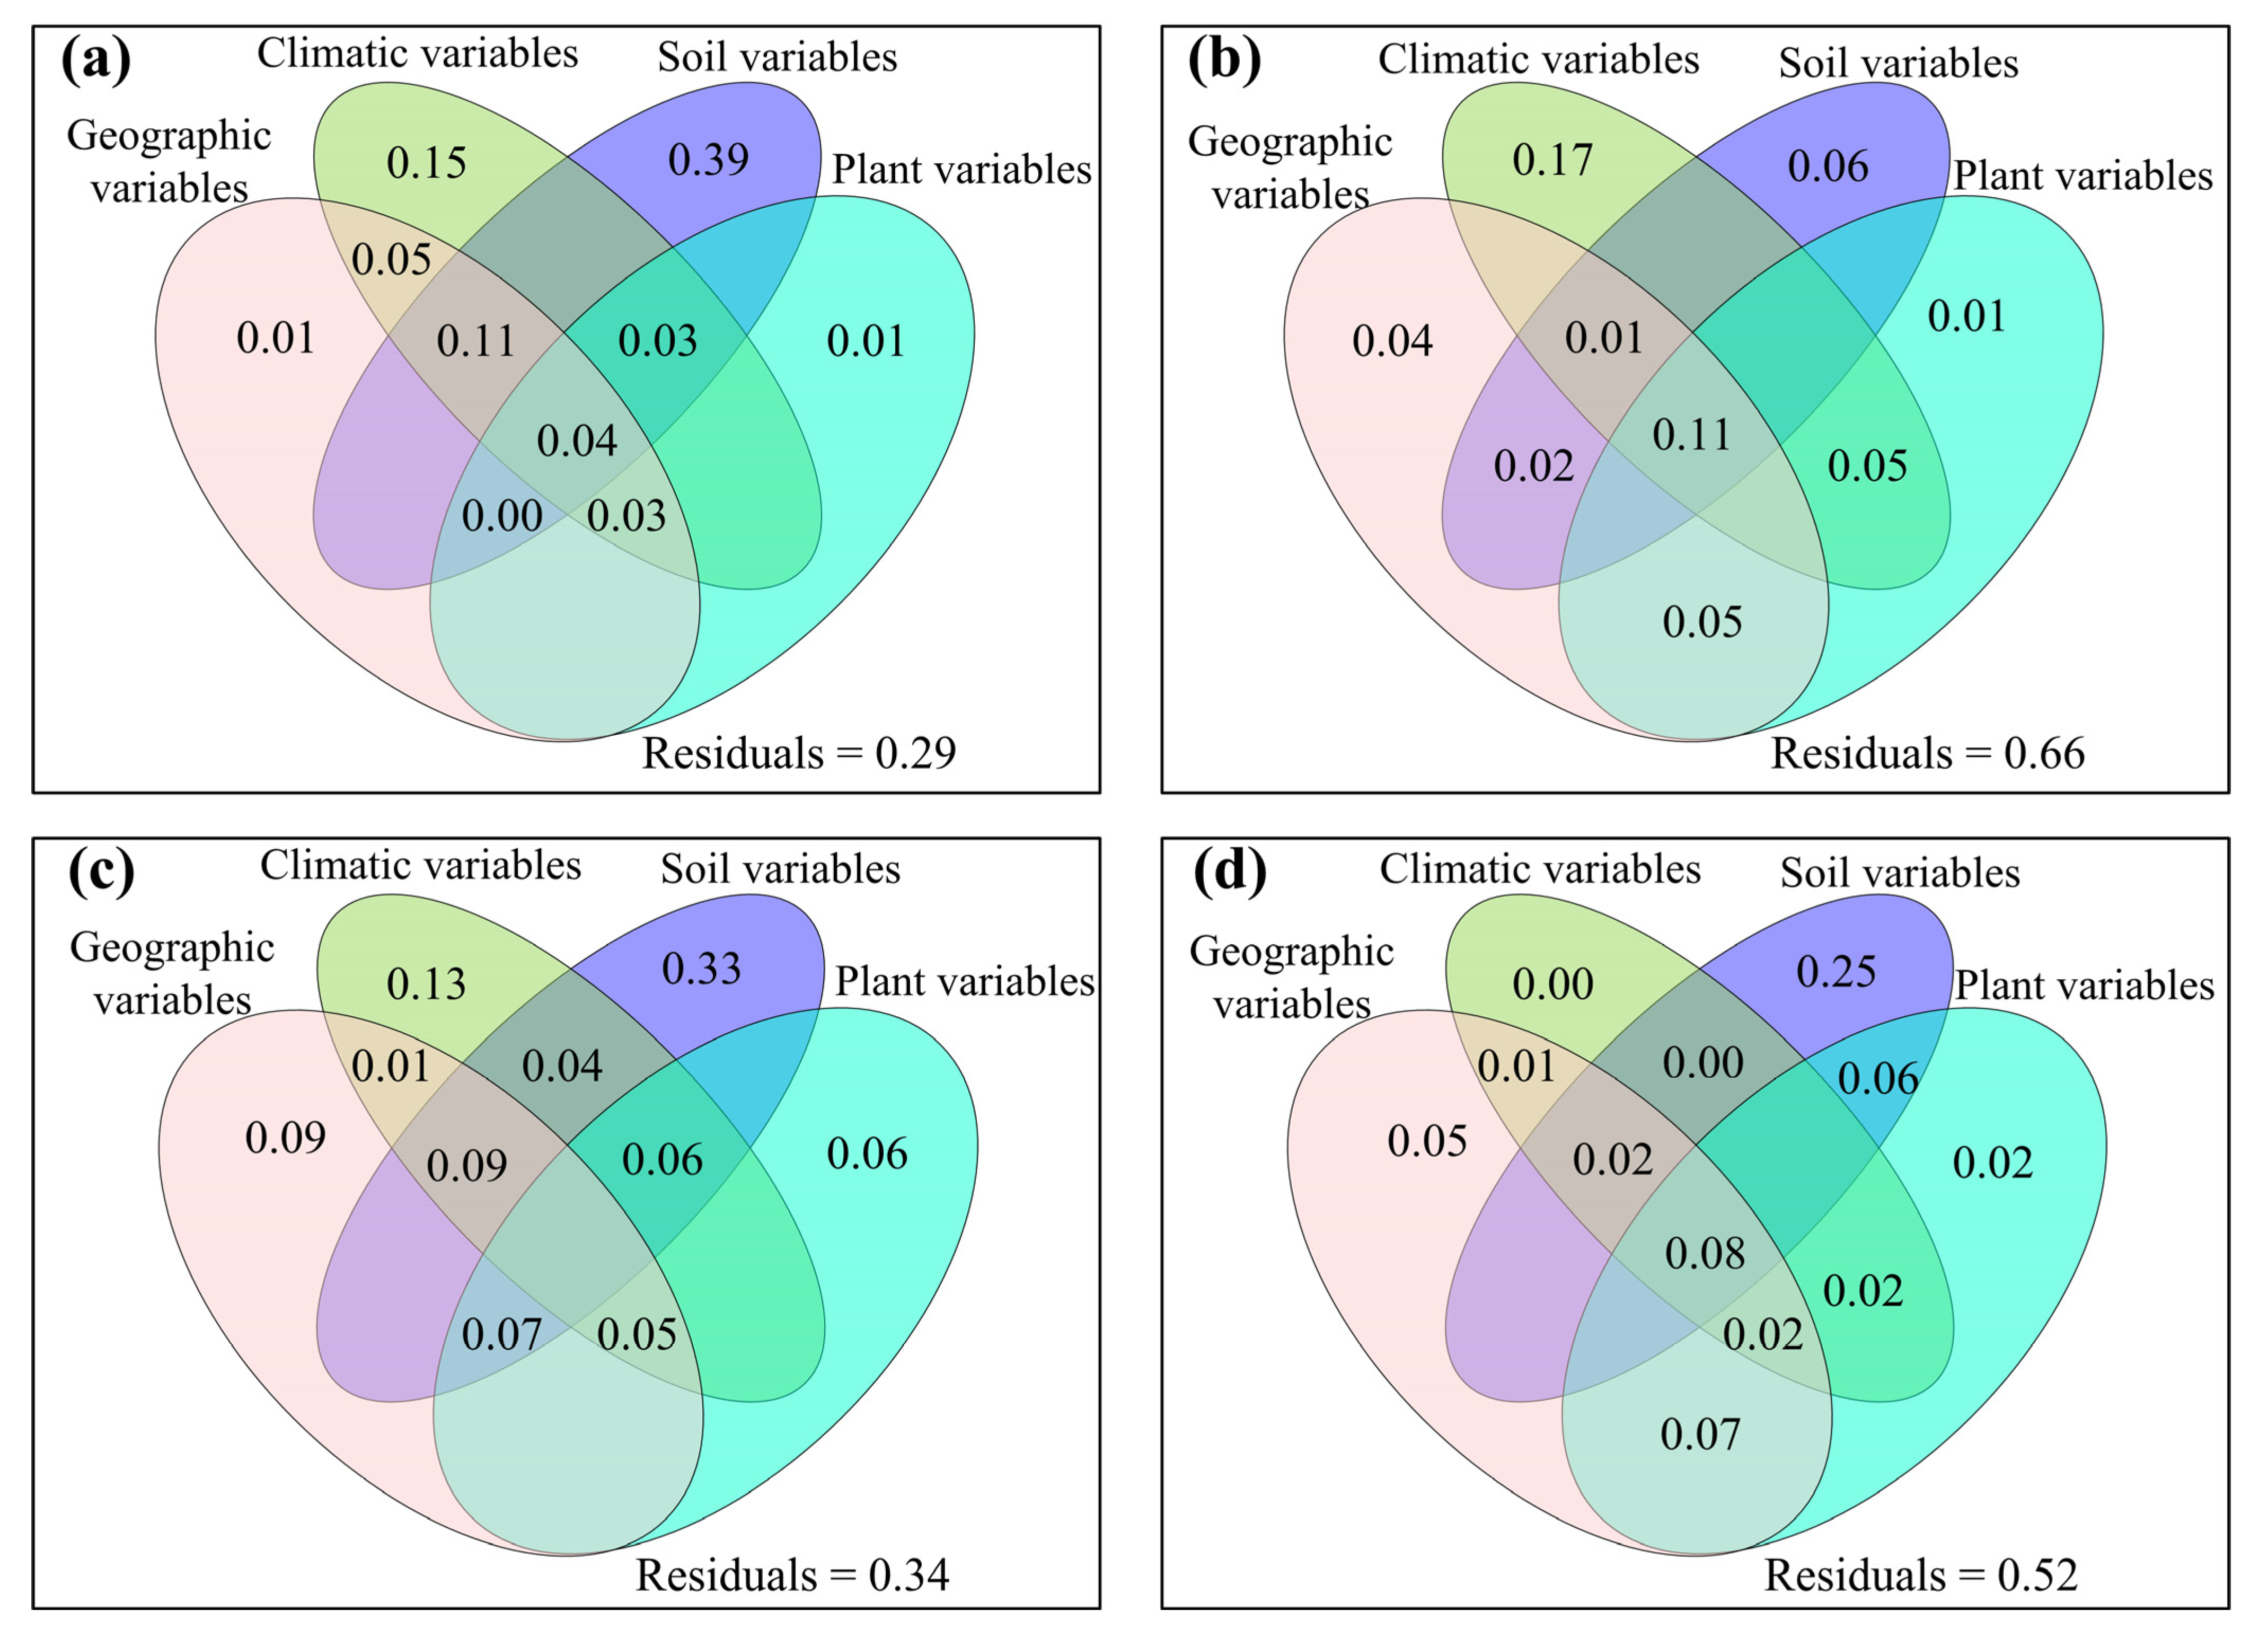
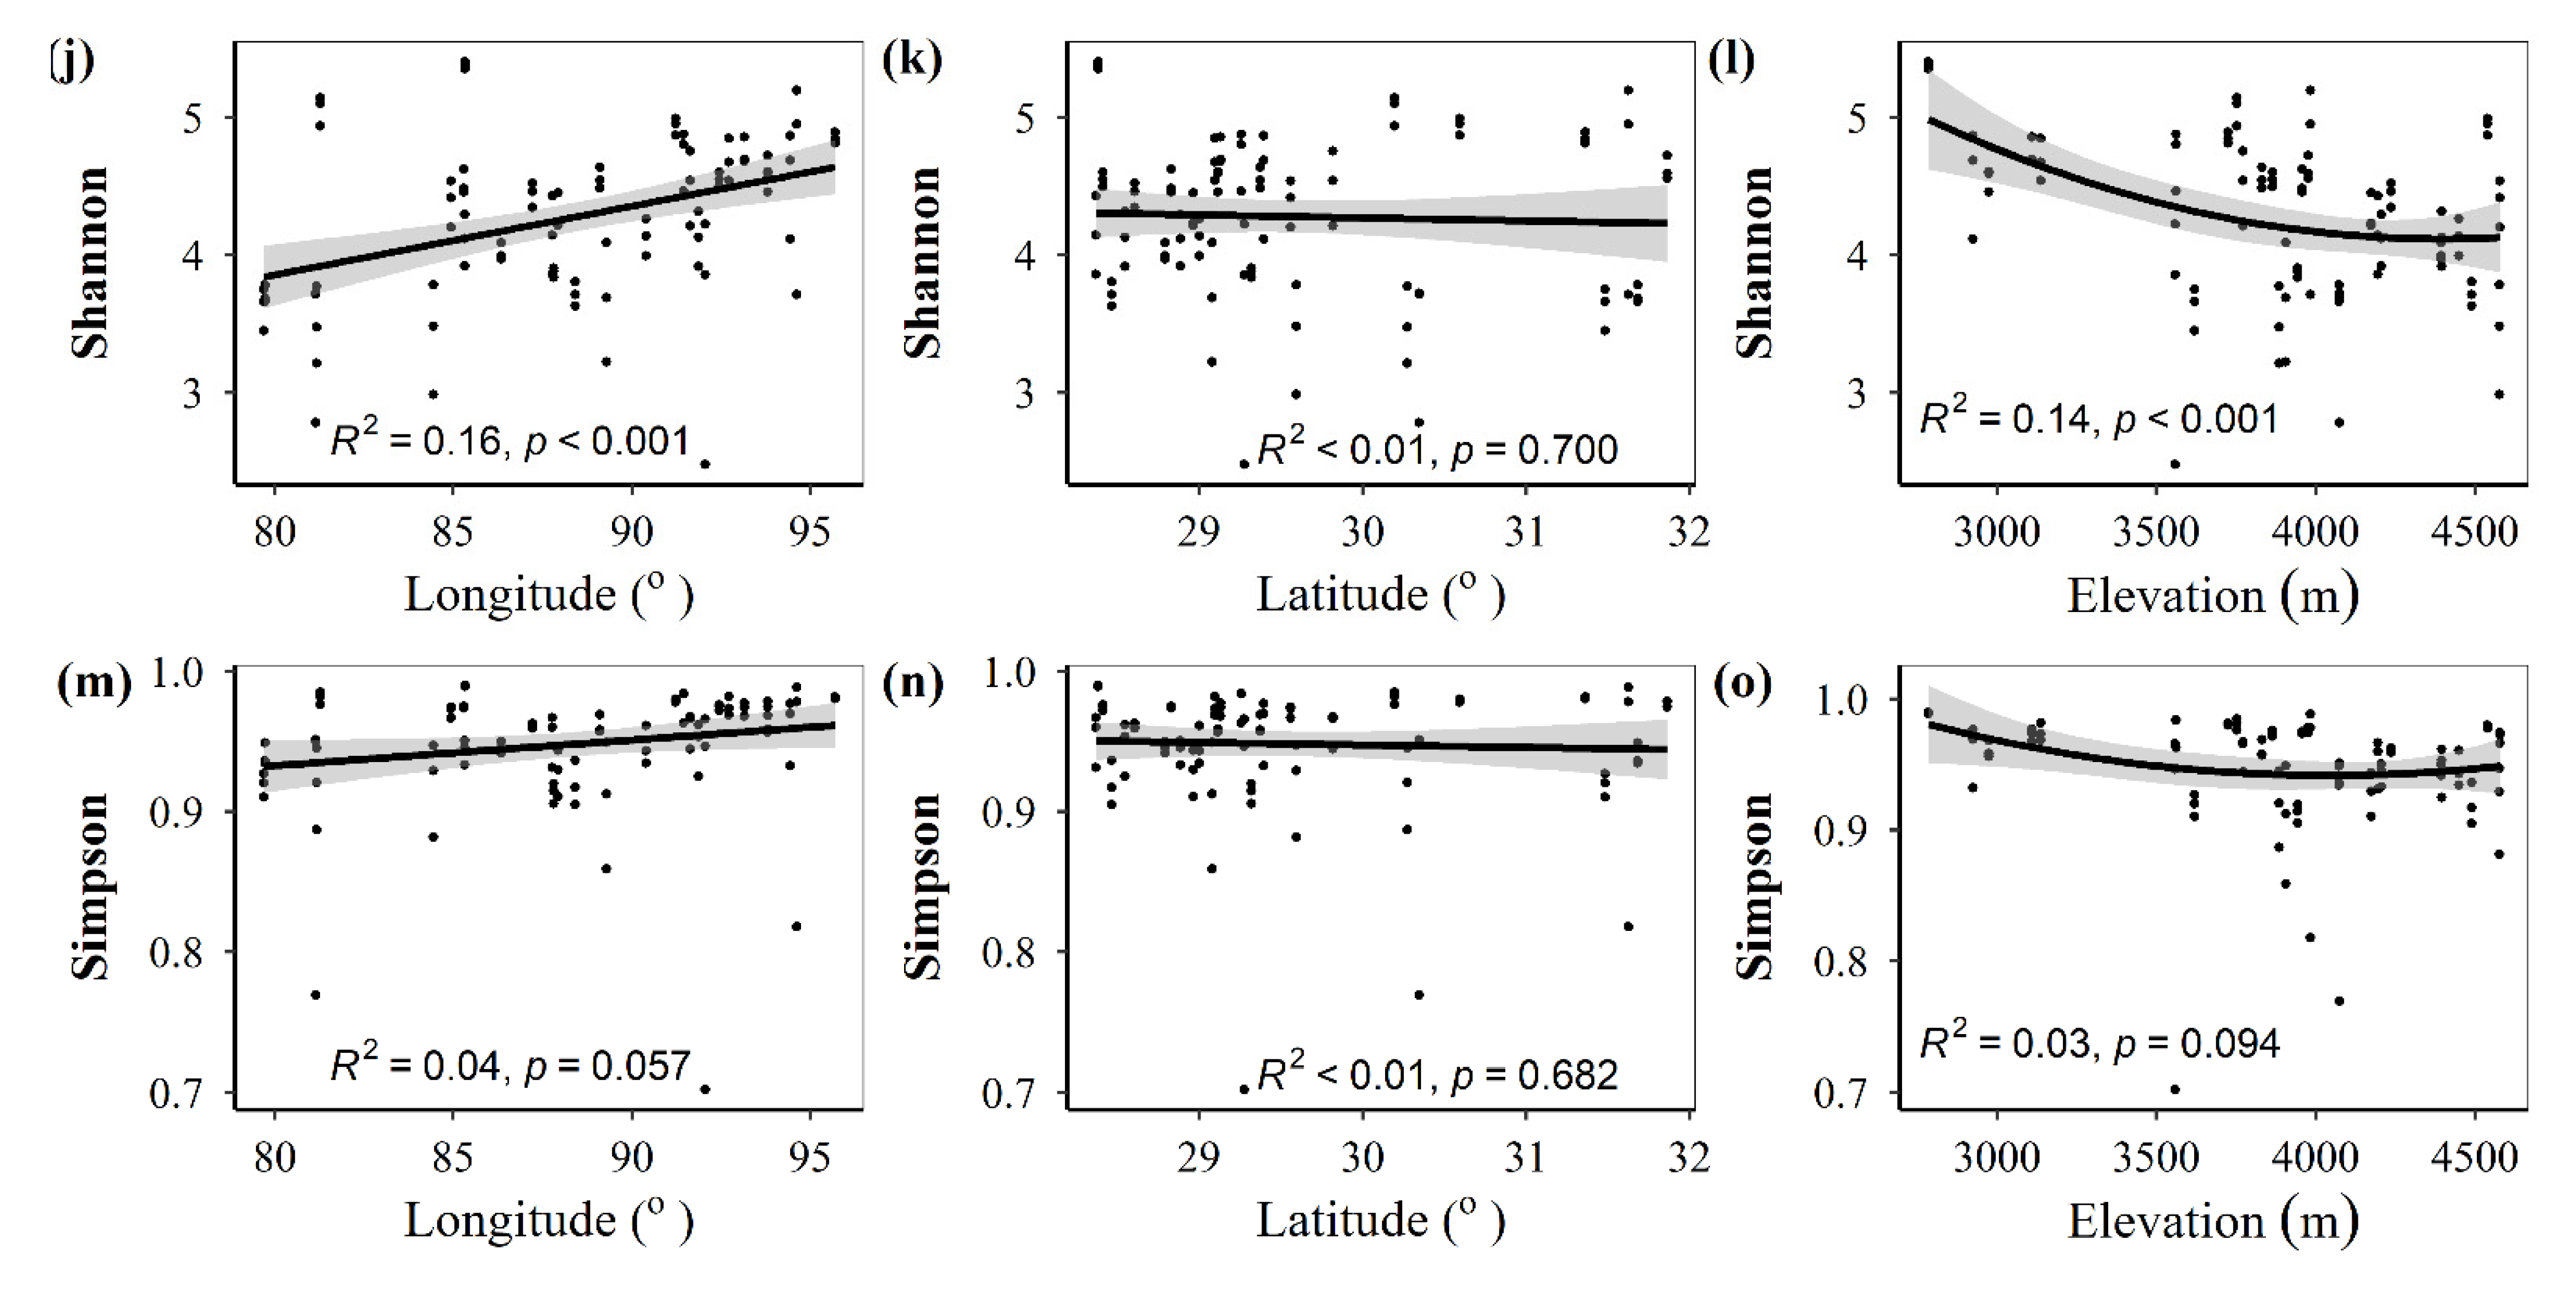
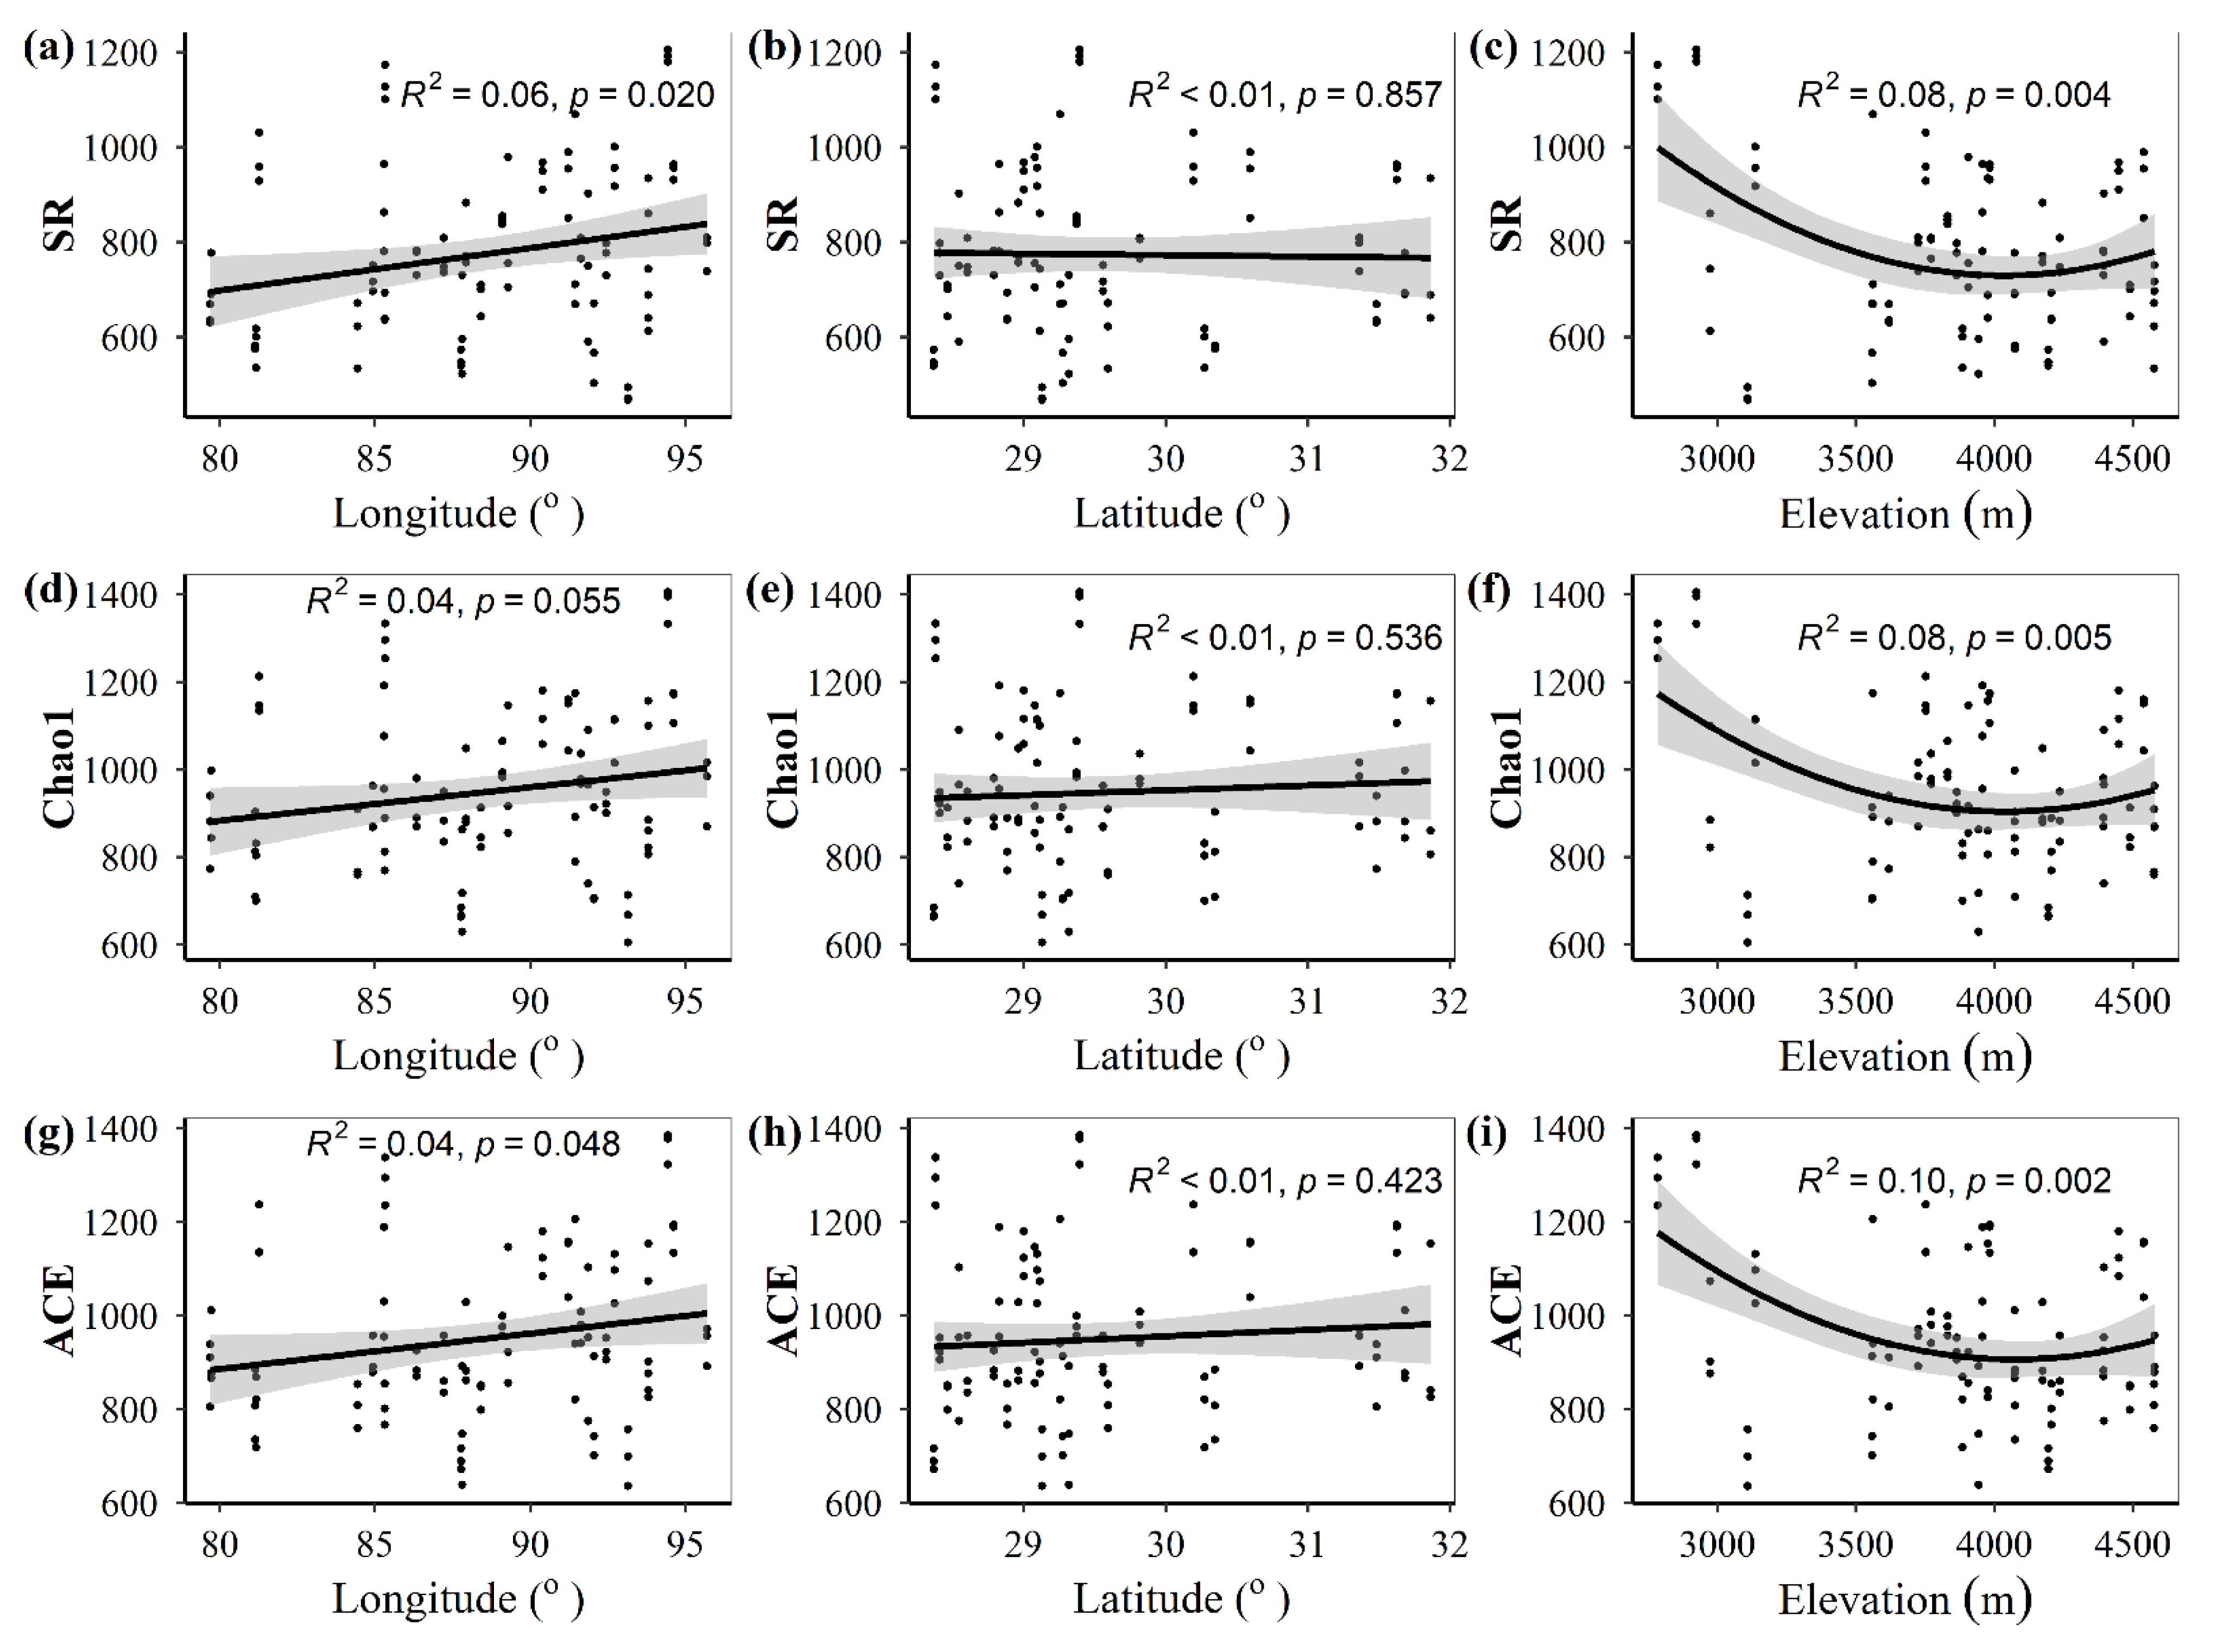
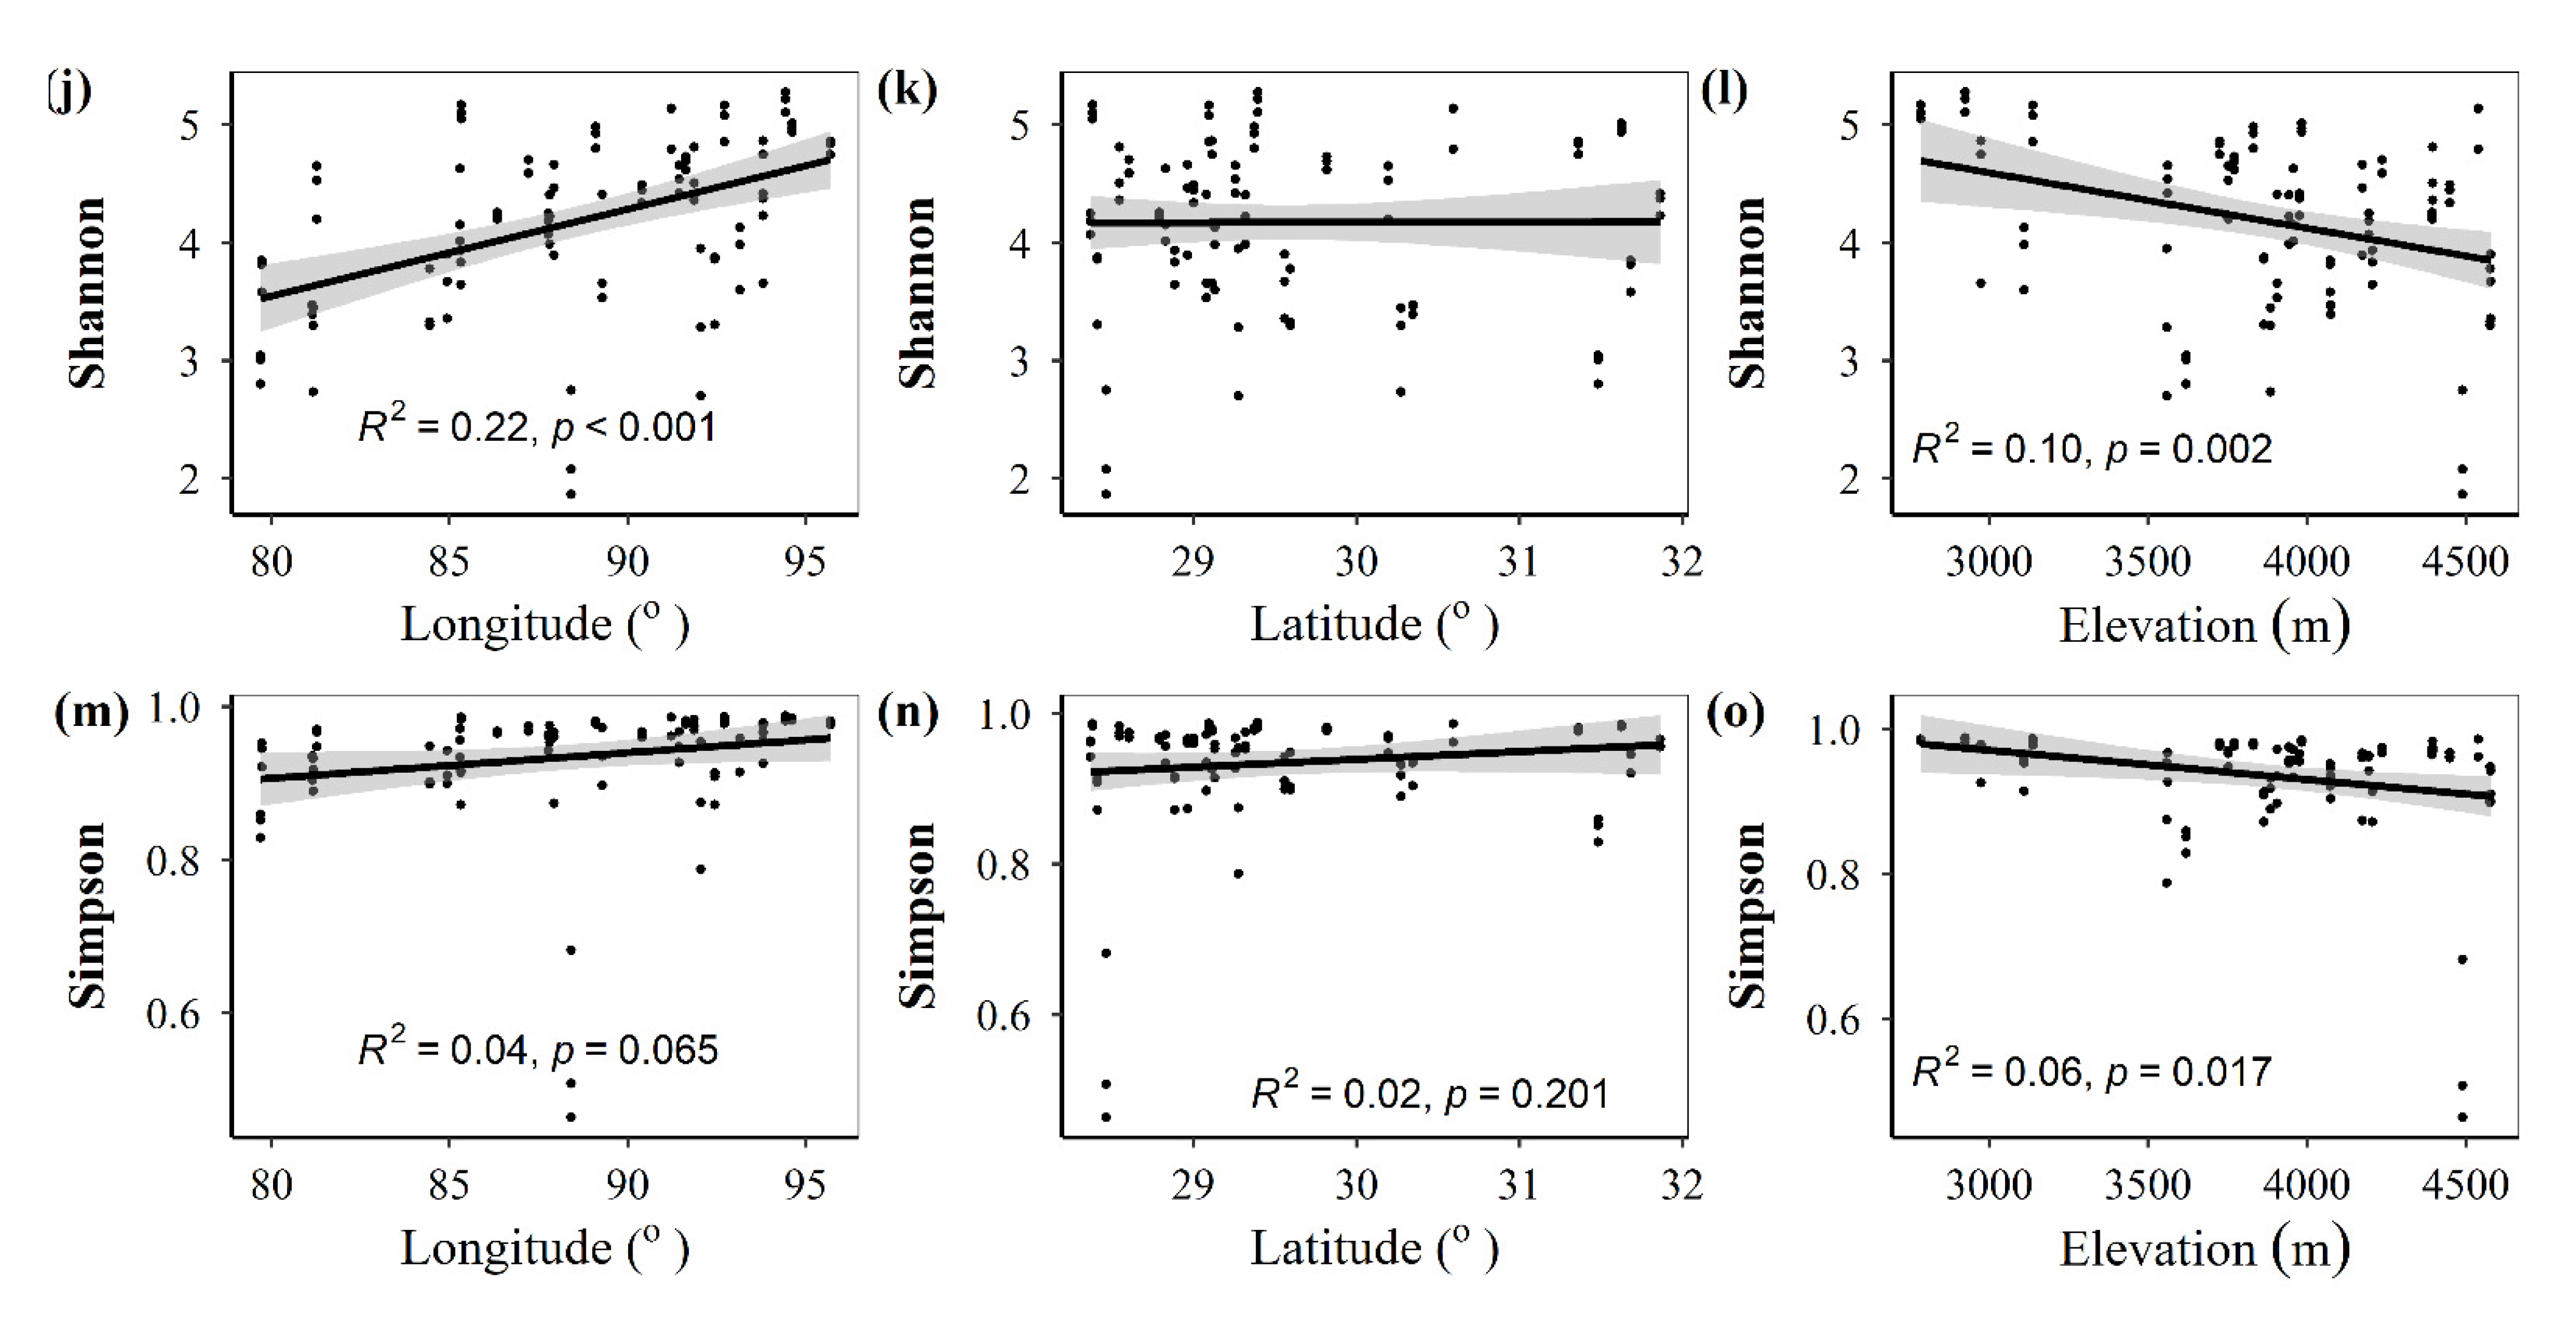
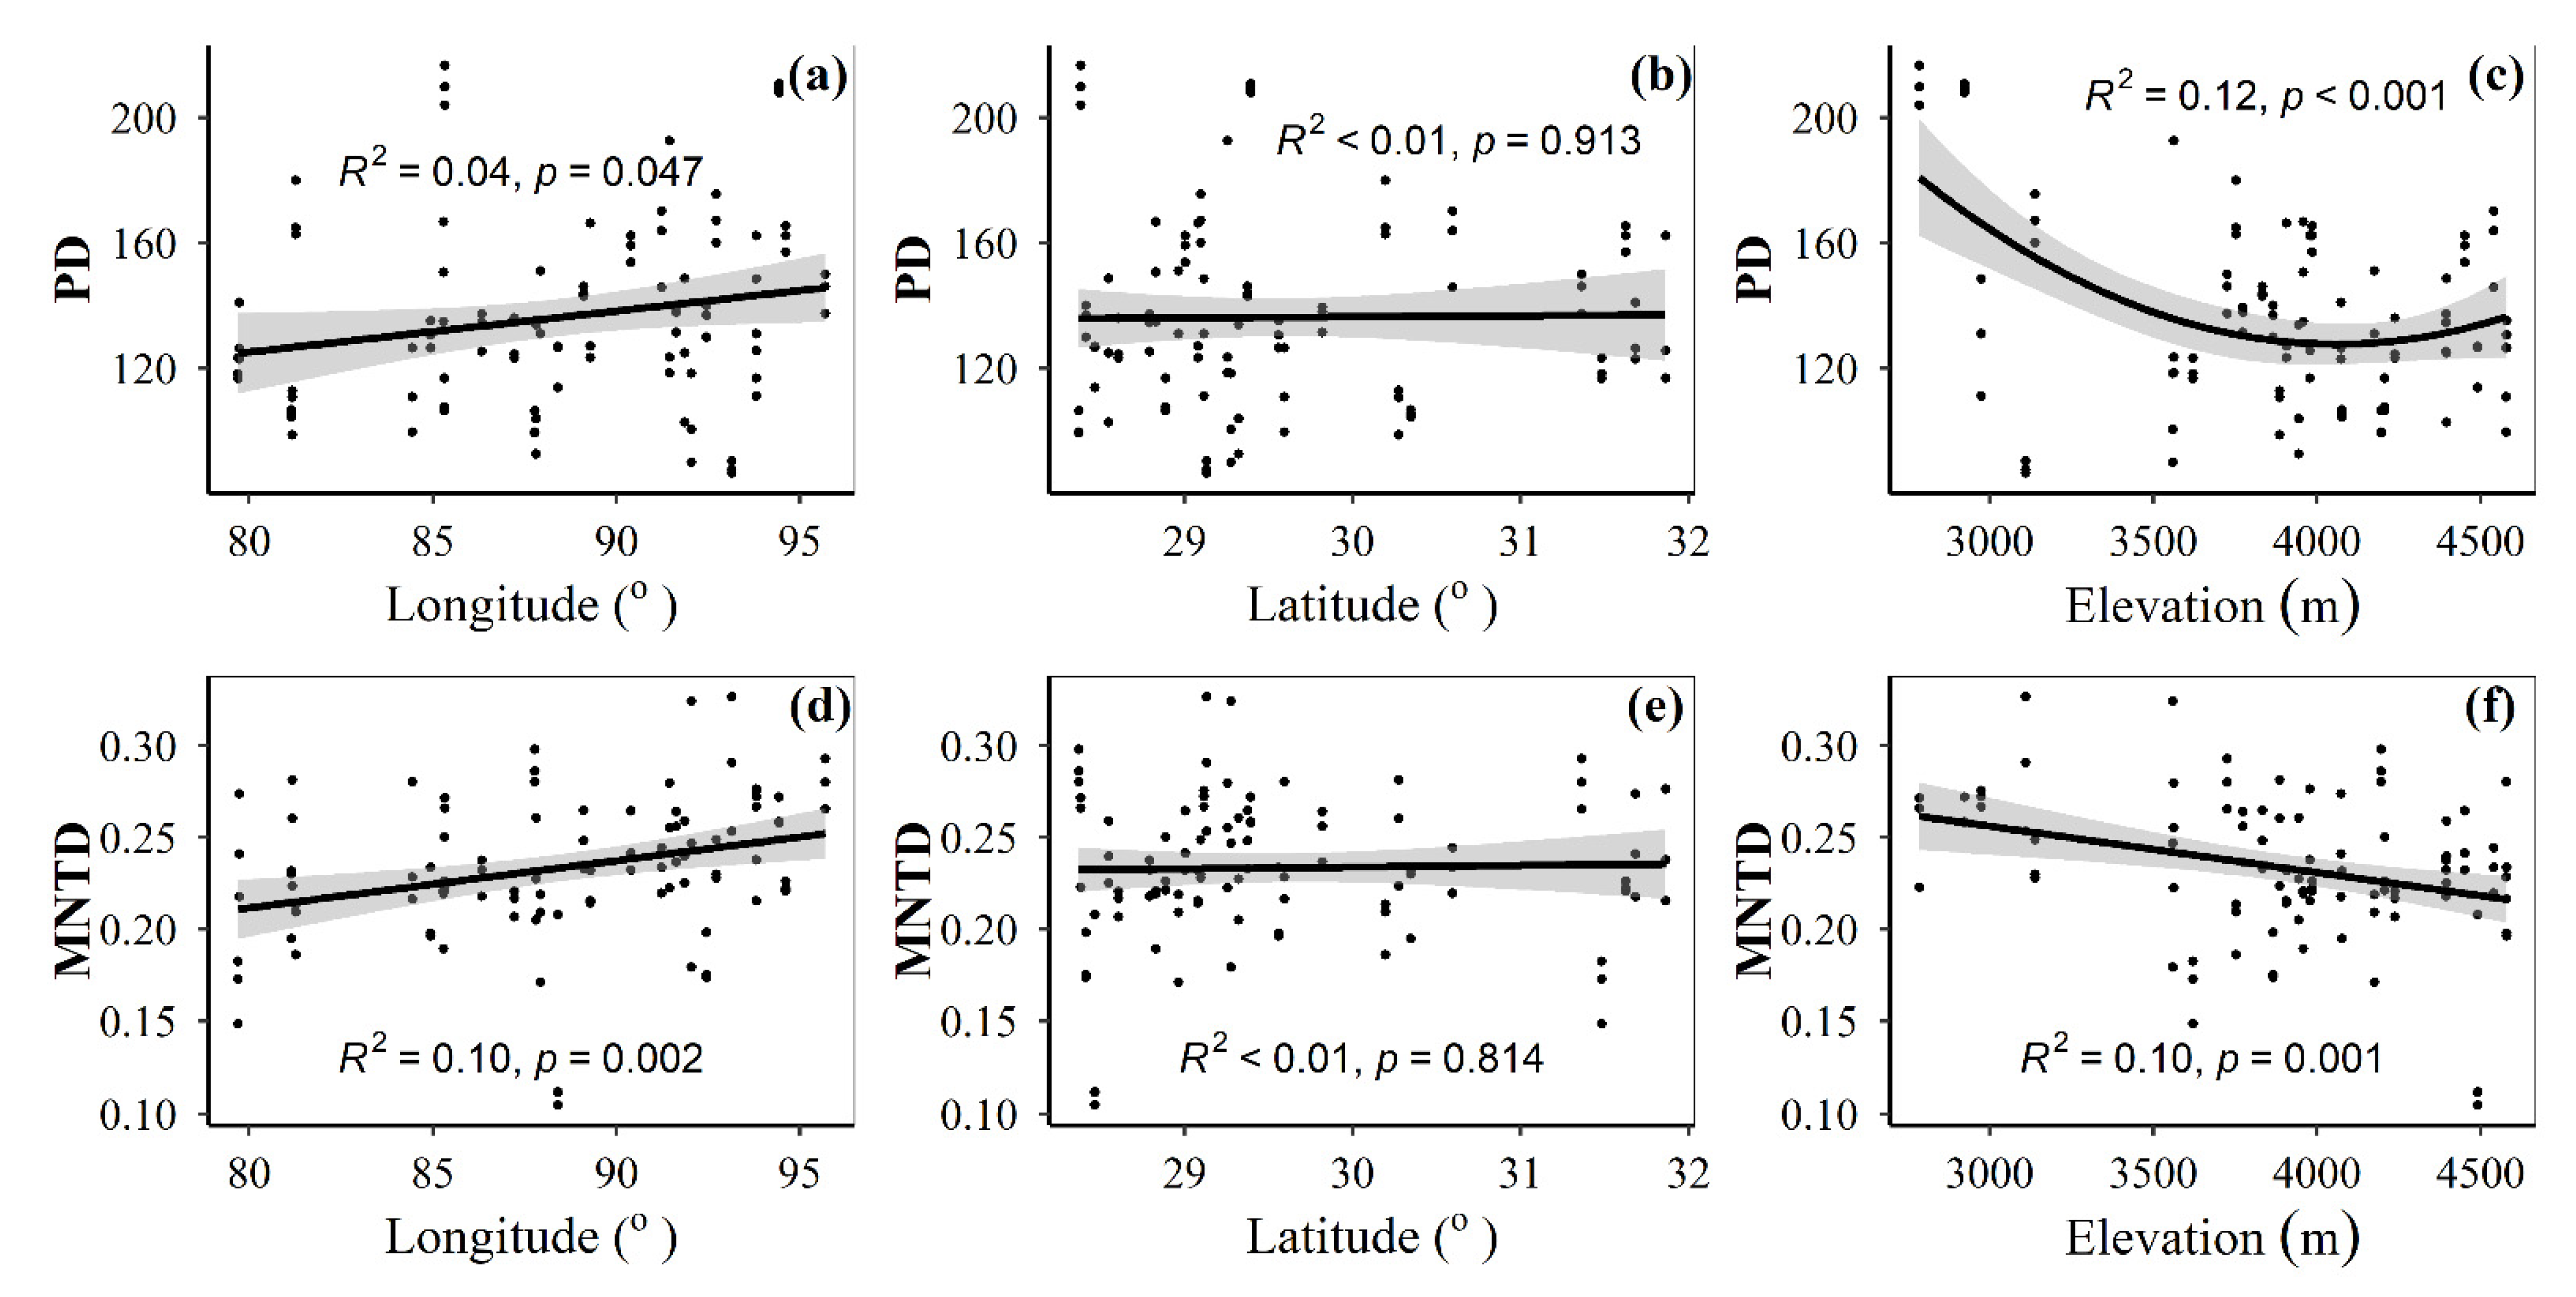
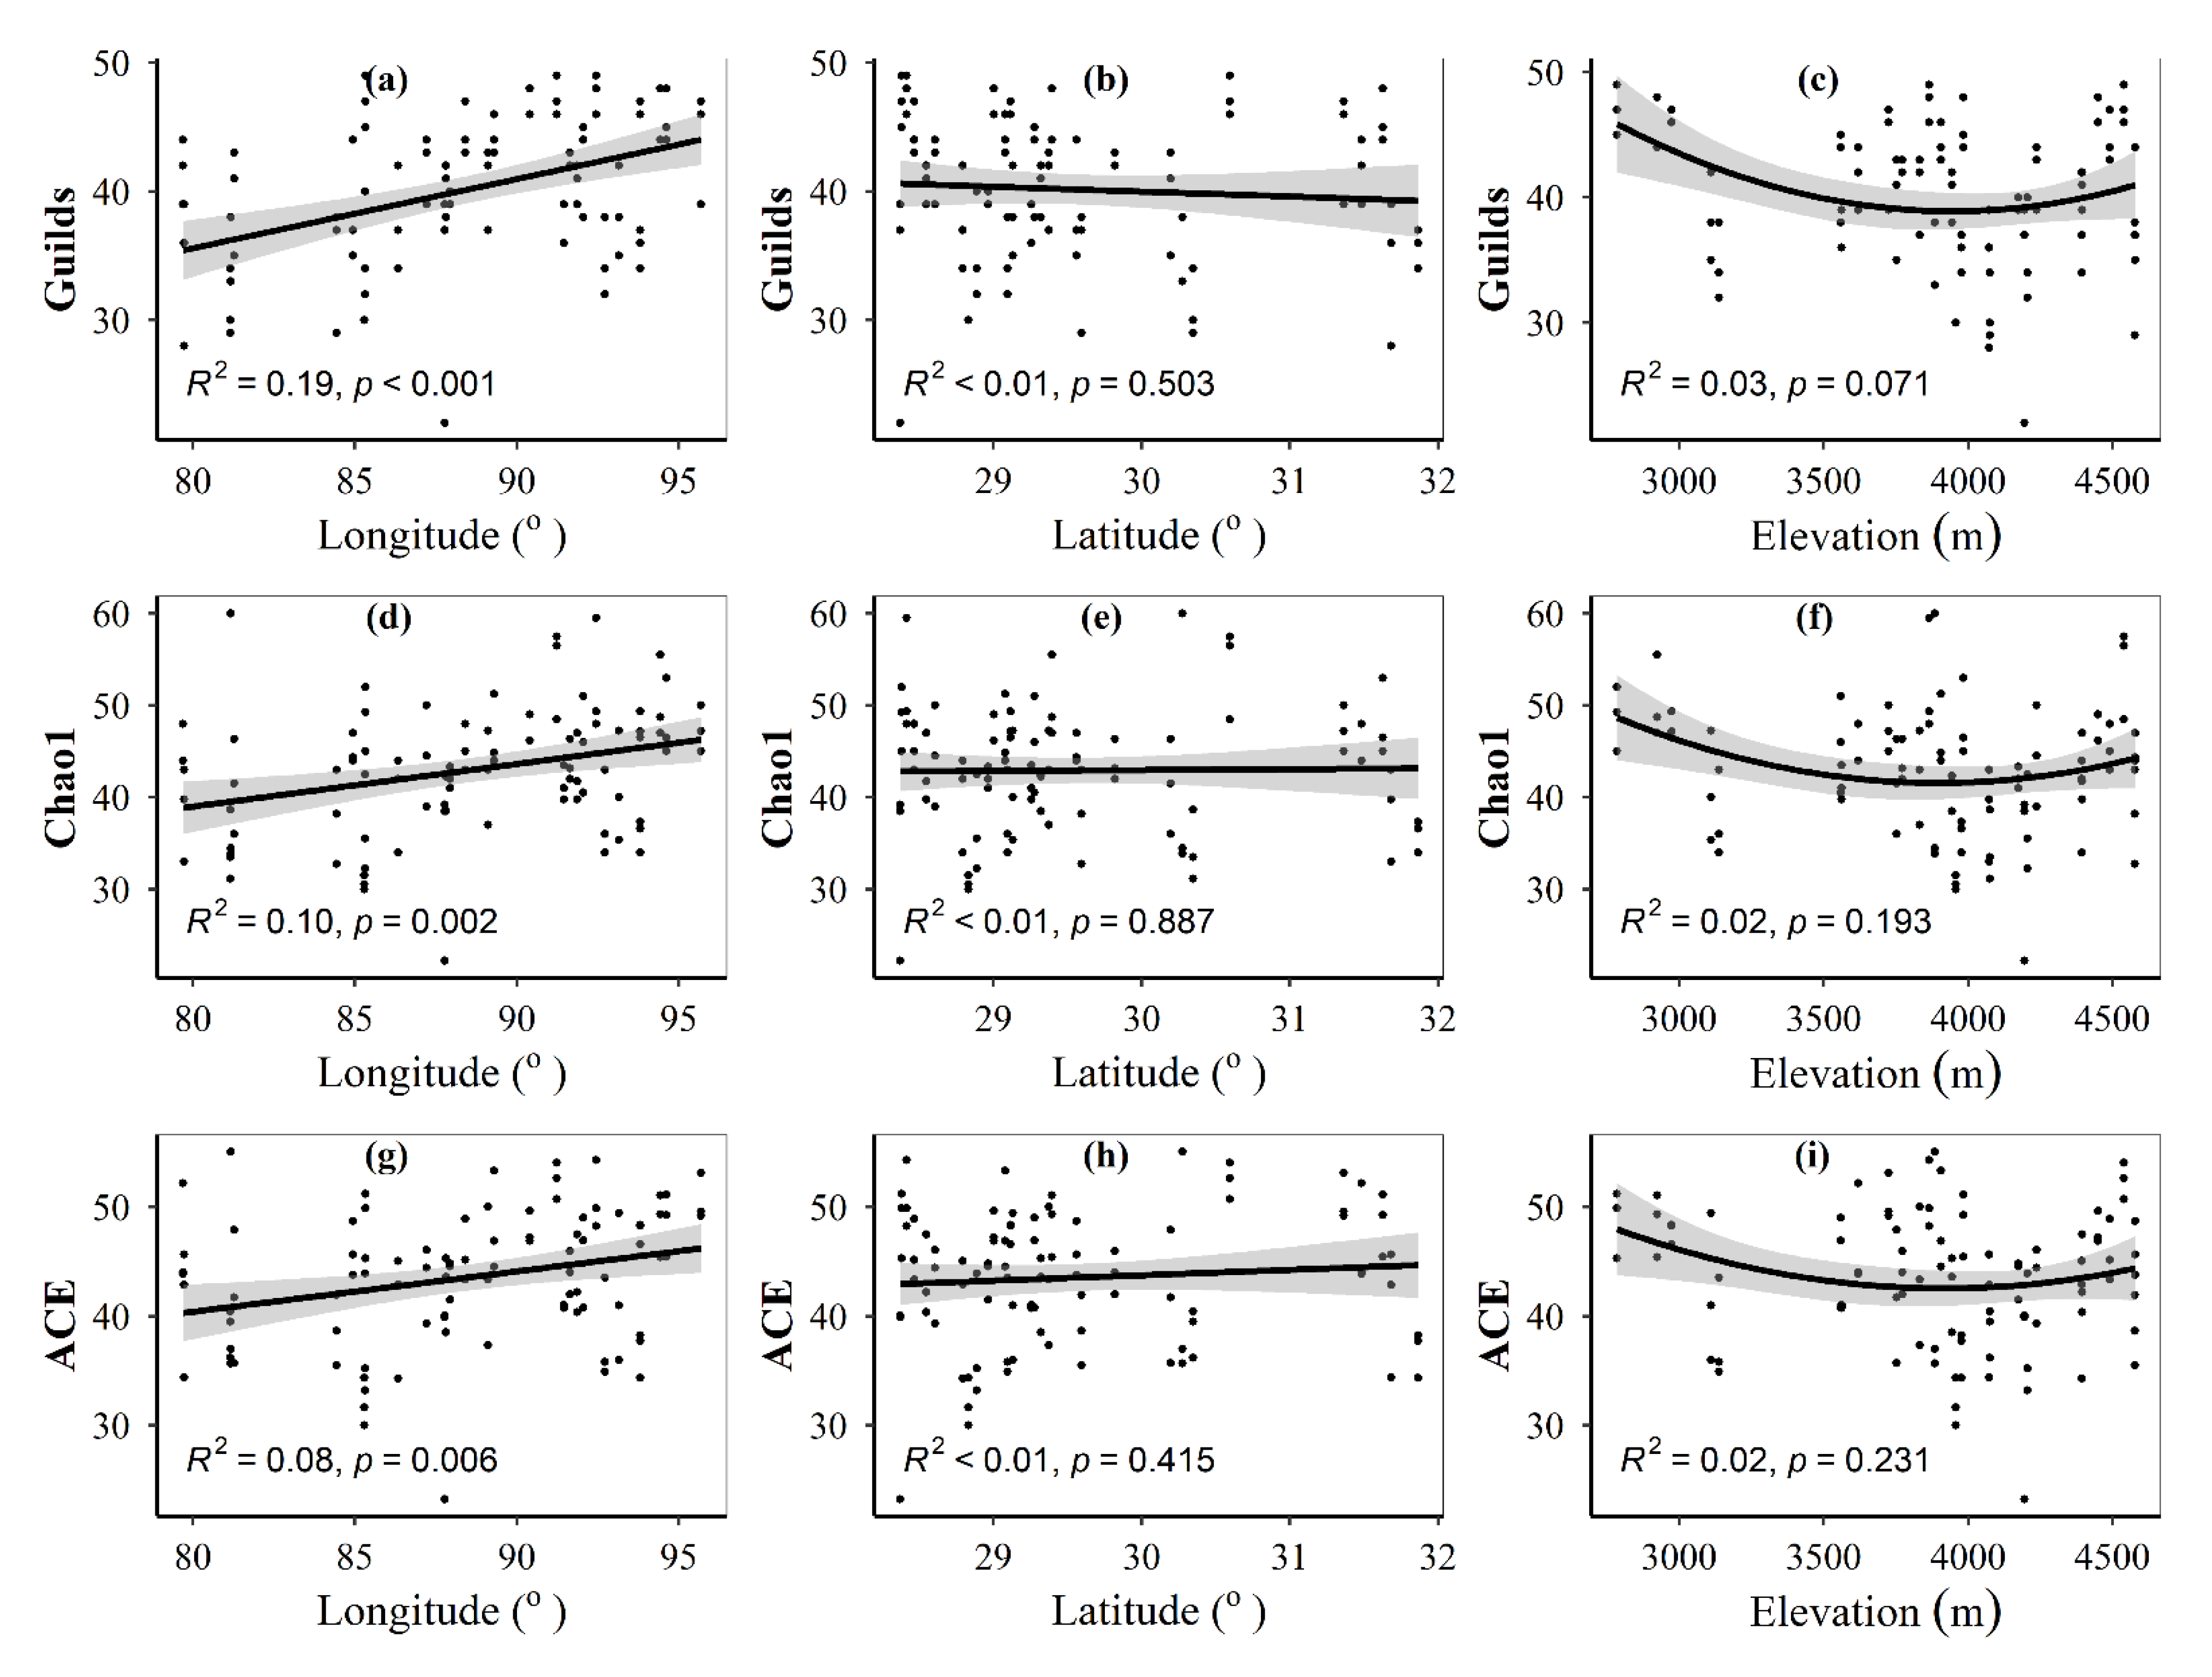
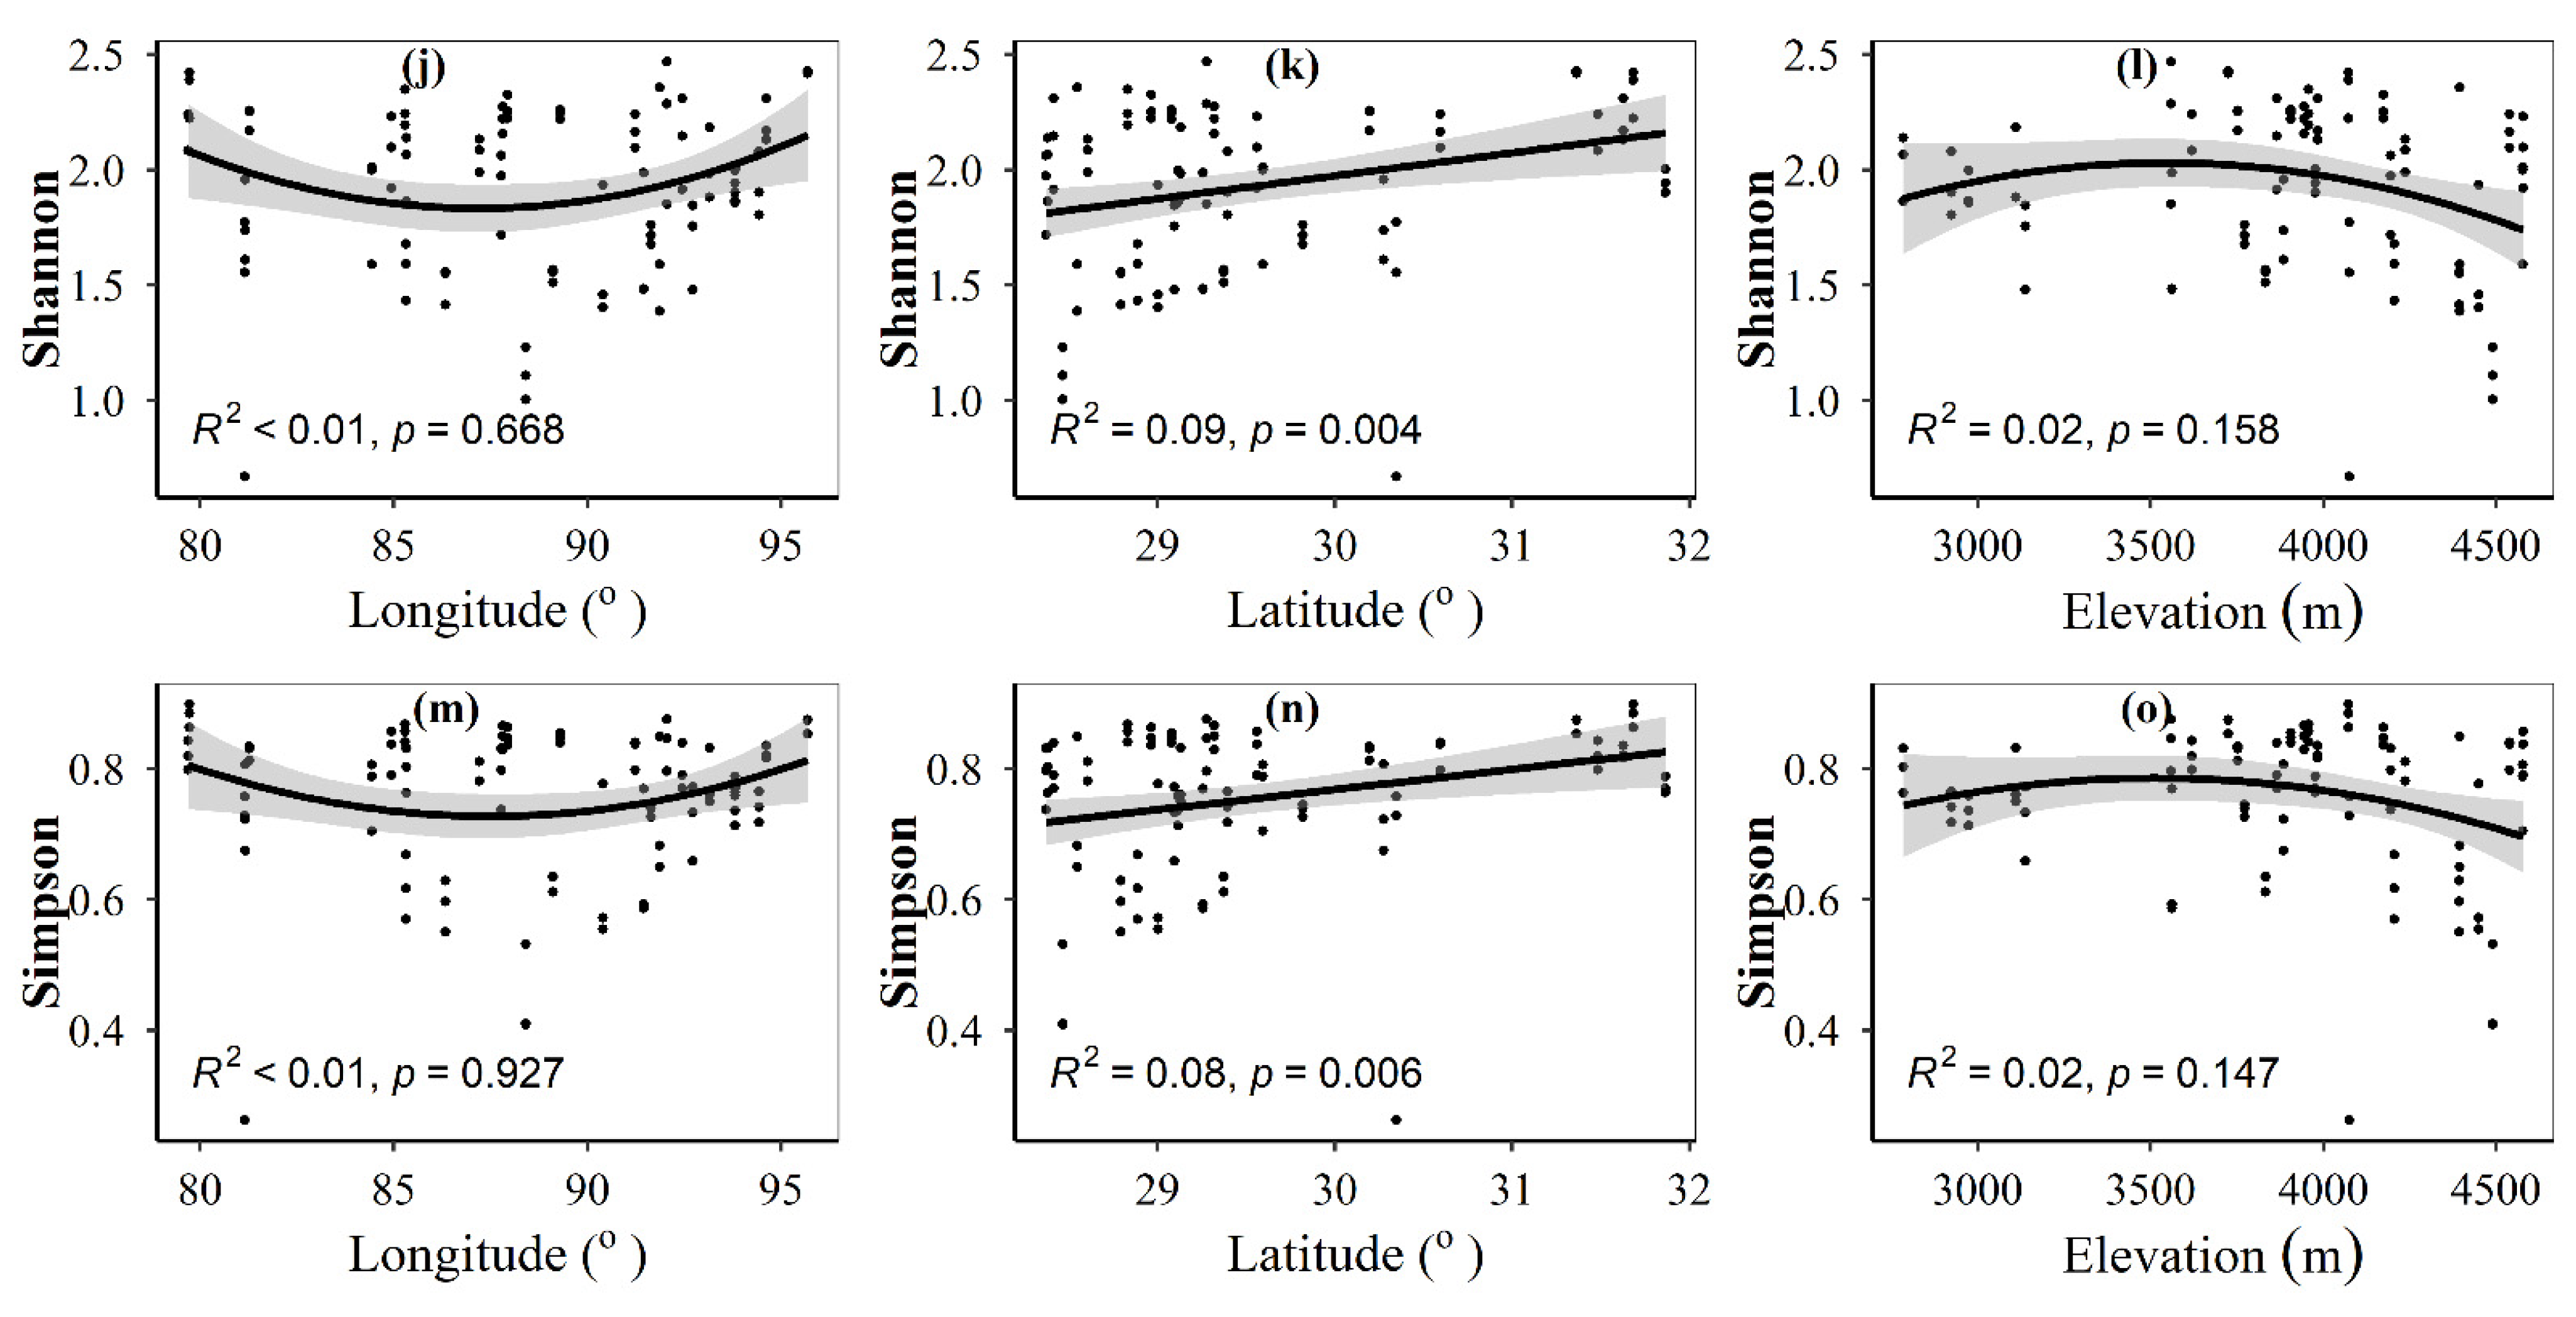
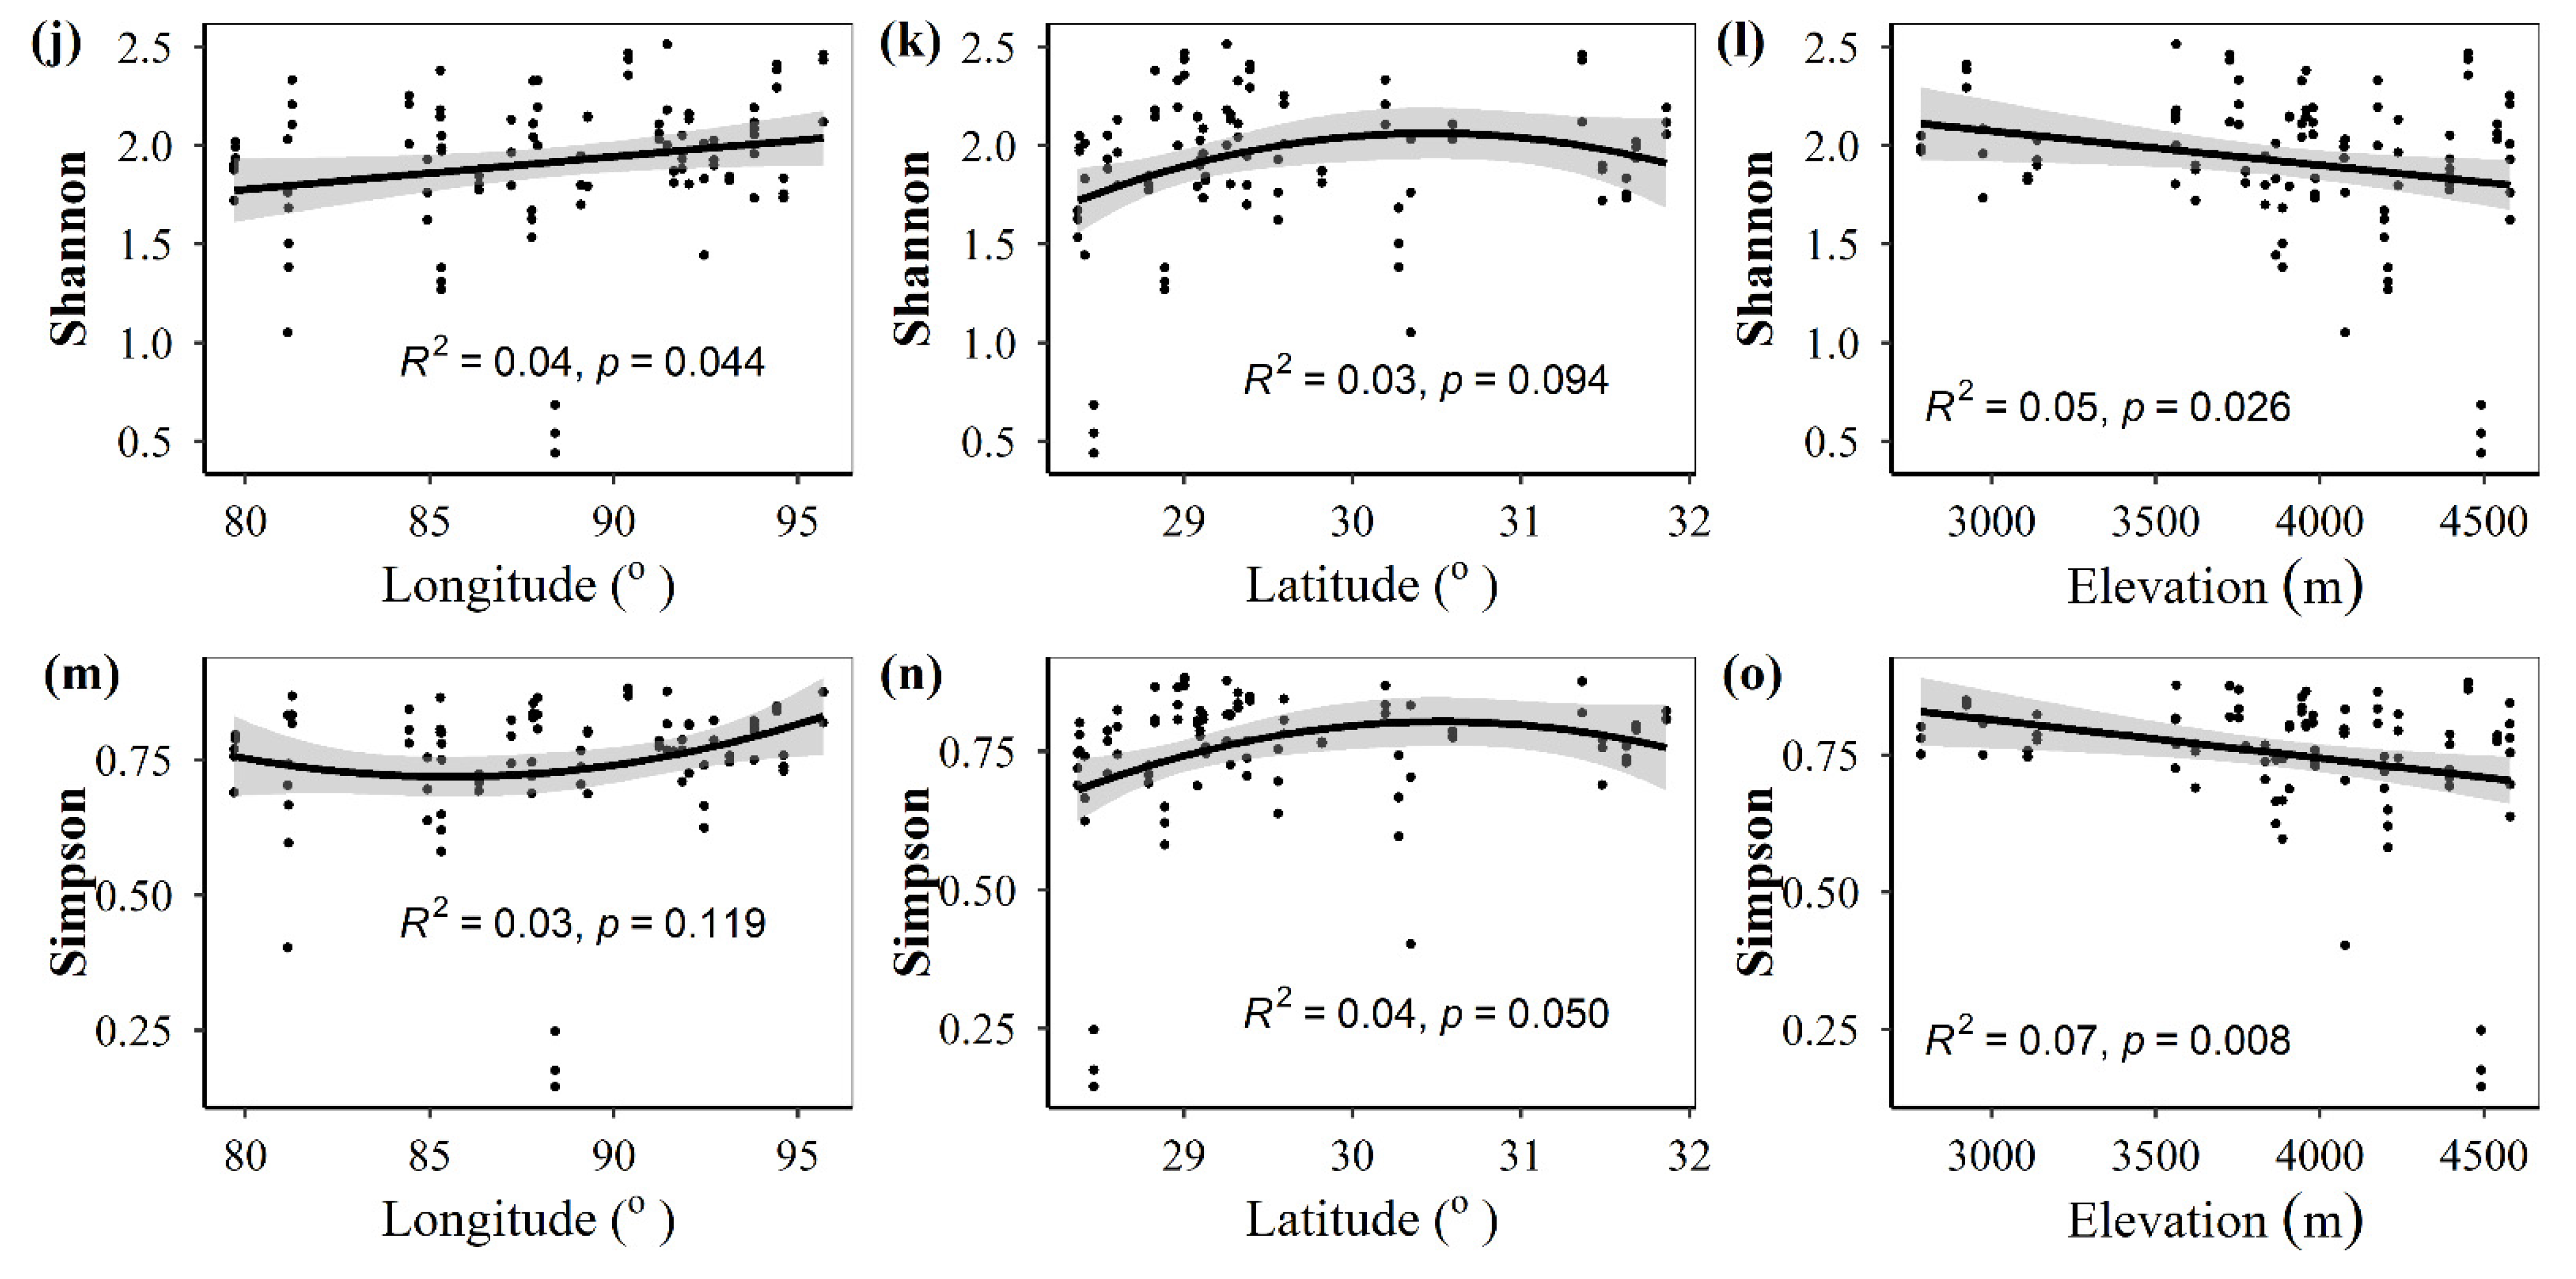
Correlation analyses among all the variables, including three geographic variables, four climatic variables, three plant variables (plant height, stem diameter and leaf area), and 19 soil variables (EC, pH, SOC, TN, TP, TK, NH4+-N, NO3-N, AP, AK, C:N, C:P, C:K, N:P, N:K, P:K, available N:P, available N:K, and available P:K), were conducted, respectively. The Trophic Mode and Guild were acquired using microeco package [13,16,17]. The original FunGuild tools provide three levels of confidence ranking (i.e., ‘Highly Probable’, ‘Probable’ and ‘Possible’) data [12,13]. Referring to earlier research [12,13], only the ‘Highly Probable’ and ‘Probable’ confidence rankings function data were utilized in this study. The species and function α-diversity and β-diversity (βBrays: species β-diversity, βBrayf: function β-diversity) were determined by the microeco package [13,16,17]. Species α-diversity included species richness, ACEs, Chao1s, Shannons and Simpsons. Function α-diversity included guild number, ACEf, Chao1f, Shannonf and Simpsonf. Phylogenetic α-diversity indices involved Faith’s phylogenetic diversity (PD) and mean nearest taxon distance (MNTD), which were determined by picante package [18]. The phylogenetic β-diversity (βMNTD) was determined by bmntd.big function of iCAMP package. Linear discriminant analysis (LDA) was utilized to determine which of taxa and ecological functions were significant among sampling sites for topsoil and subtopsoil, respectively [15]. The relative impact of environmental variable to total abundance, species, phylogenetic and function α-diversity were determined by randomForest and rfPermute packages [16]. We used mantel.partial function of vegan package to determine the partial matrix correlation between β-diversity matrix and environmental variables matrix. We used varpart function to split the variations of total abundance, the α- and β-diversity into four elucidatory parts (i.e., geographic variables, climatic variables, soil variables, and plant variables) [2,10,19,20,21,22].

3. Results

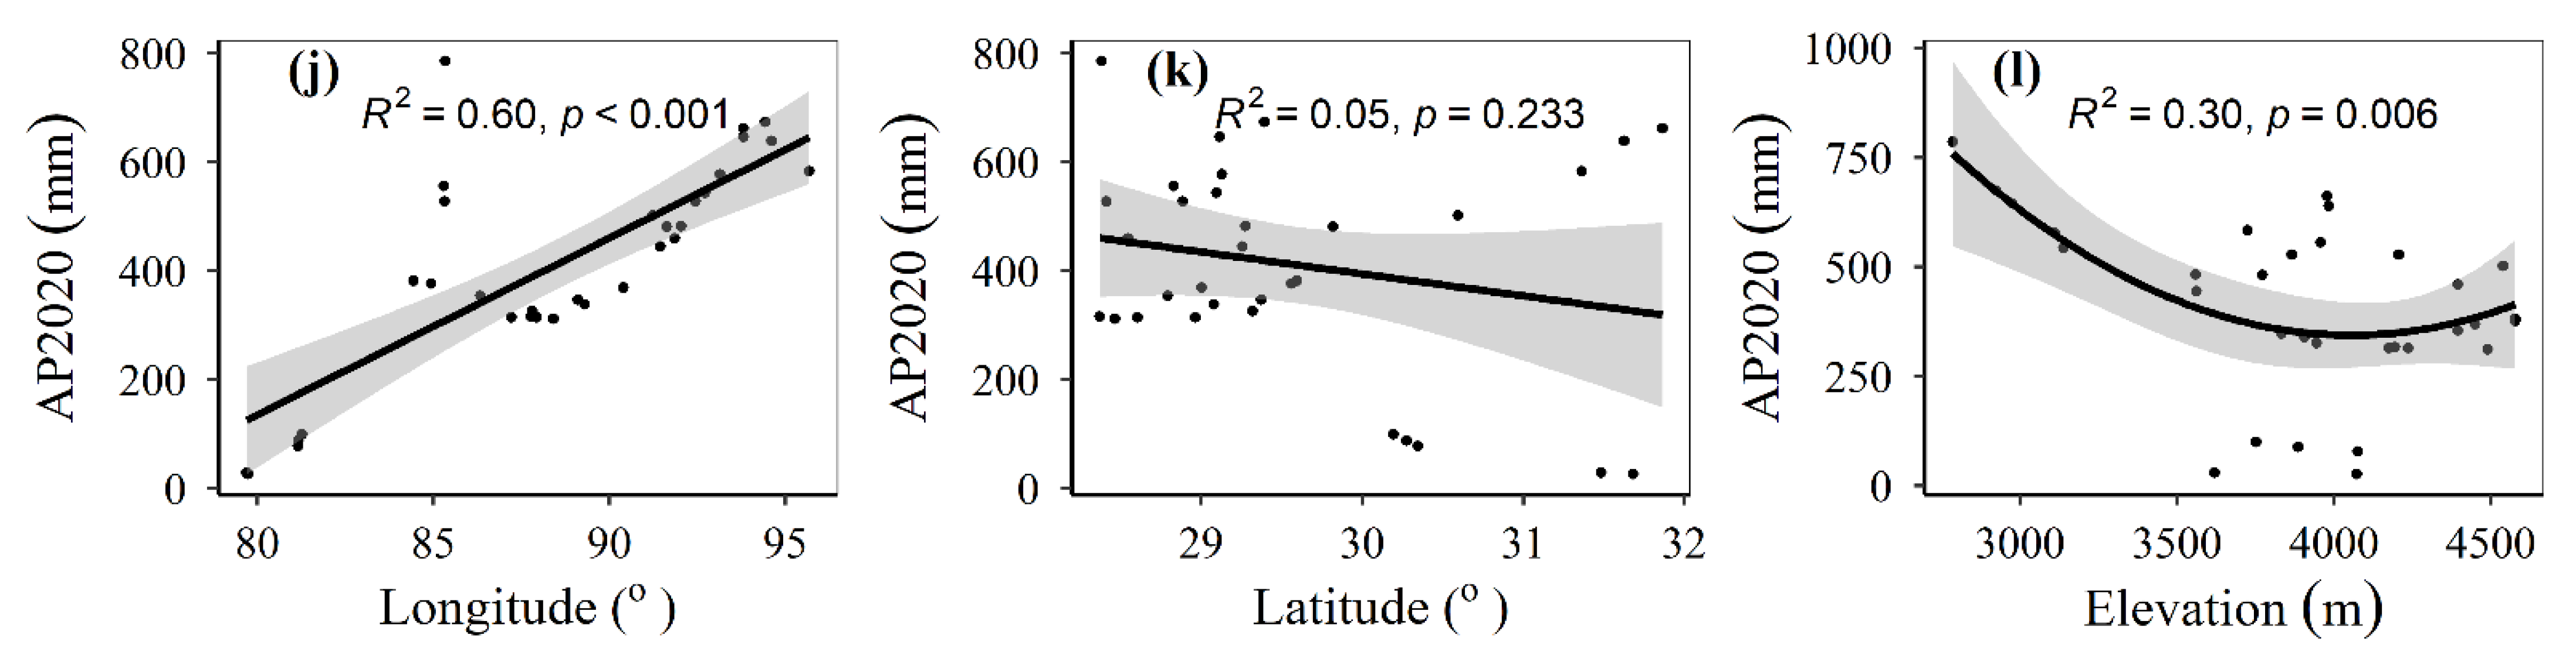
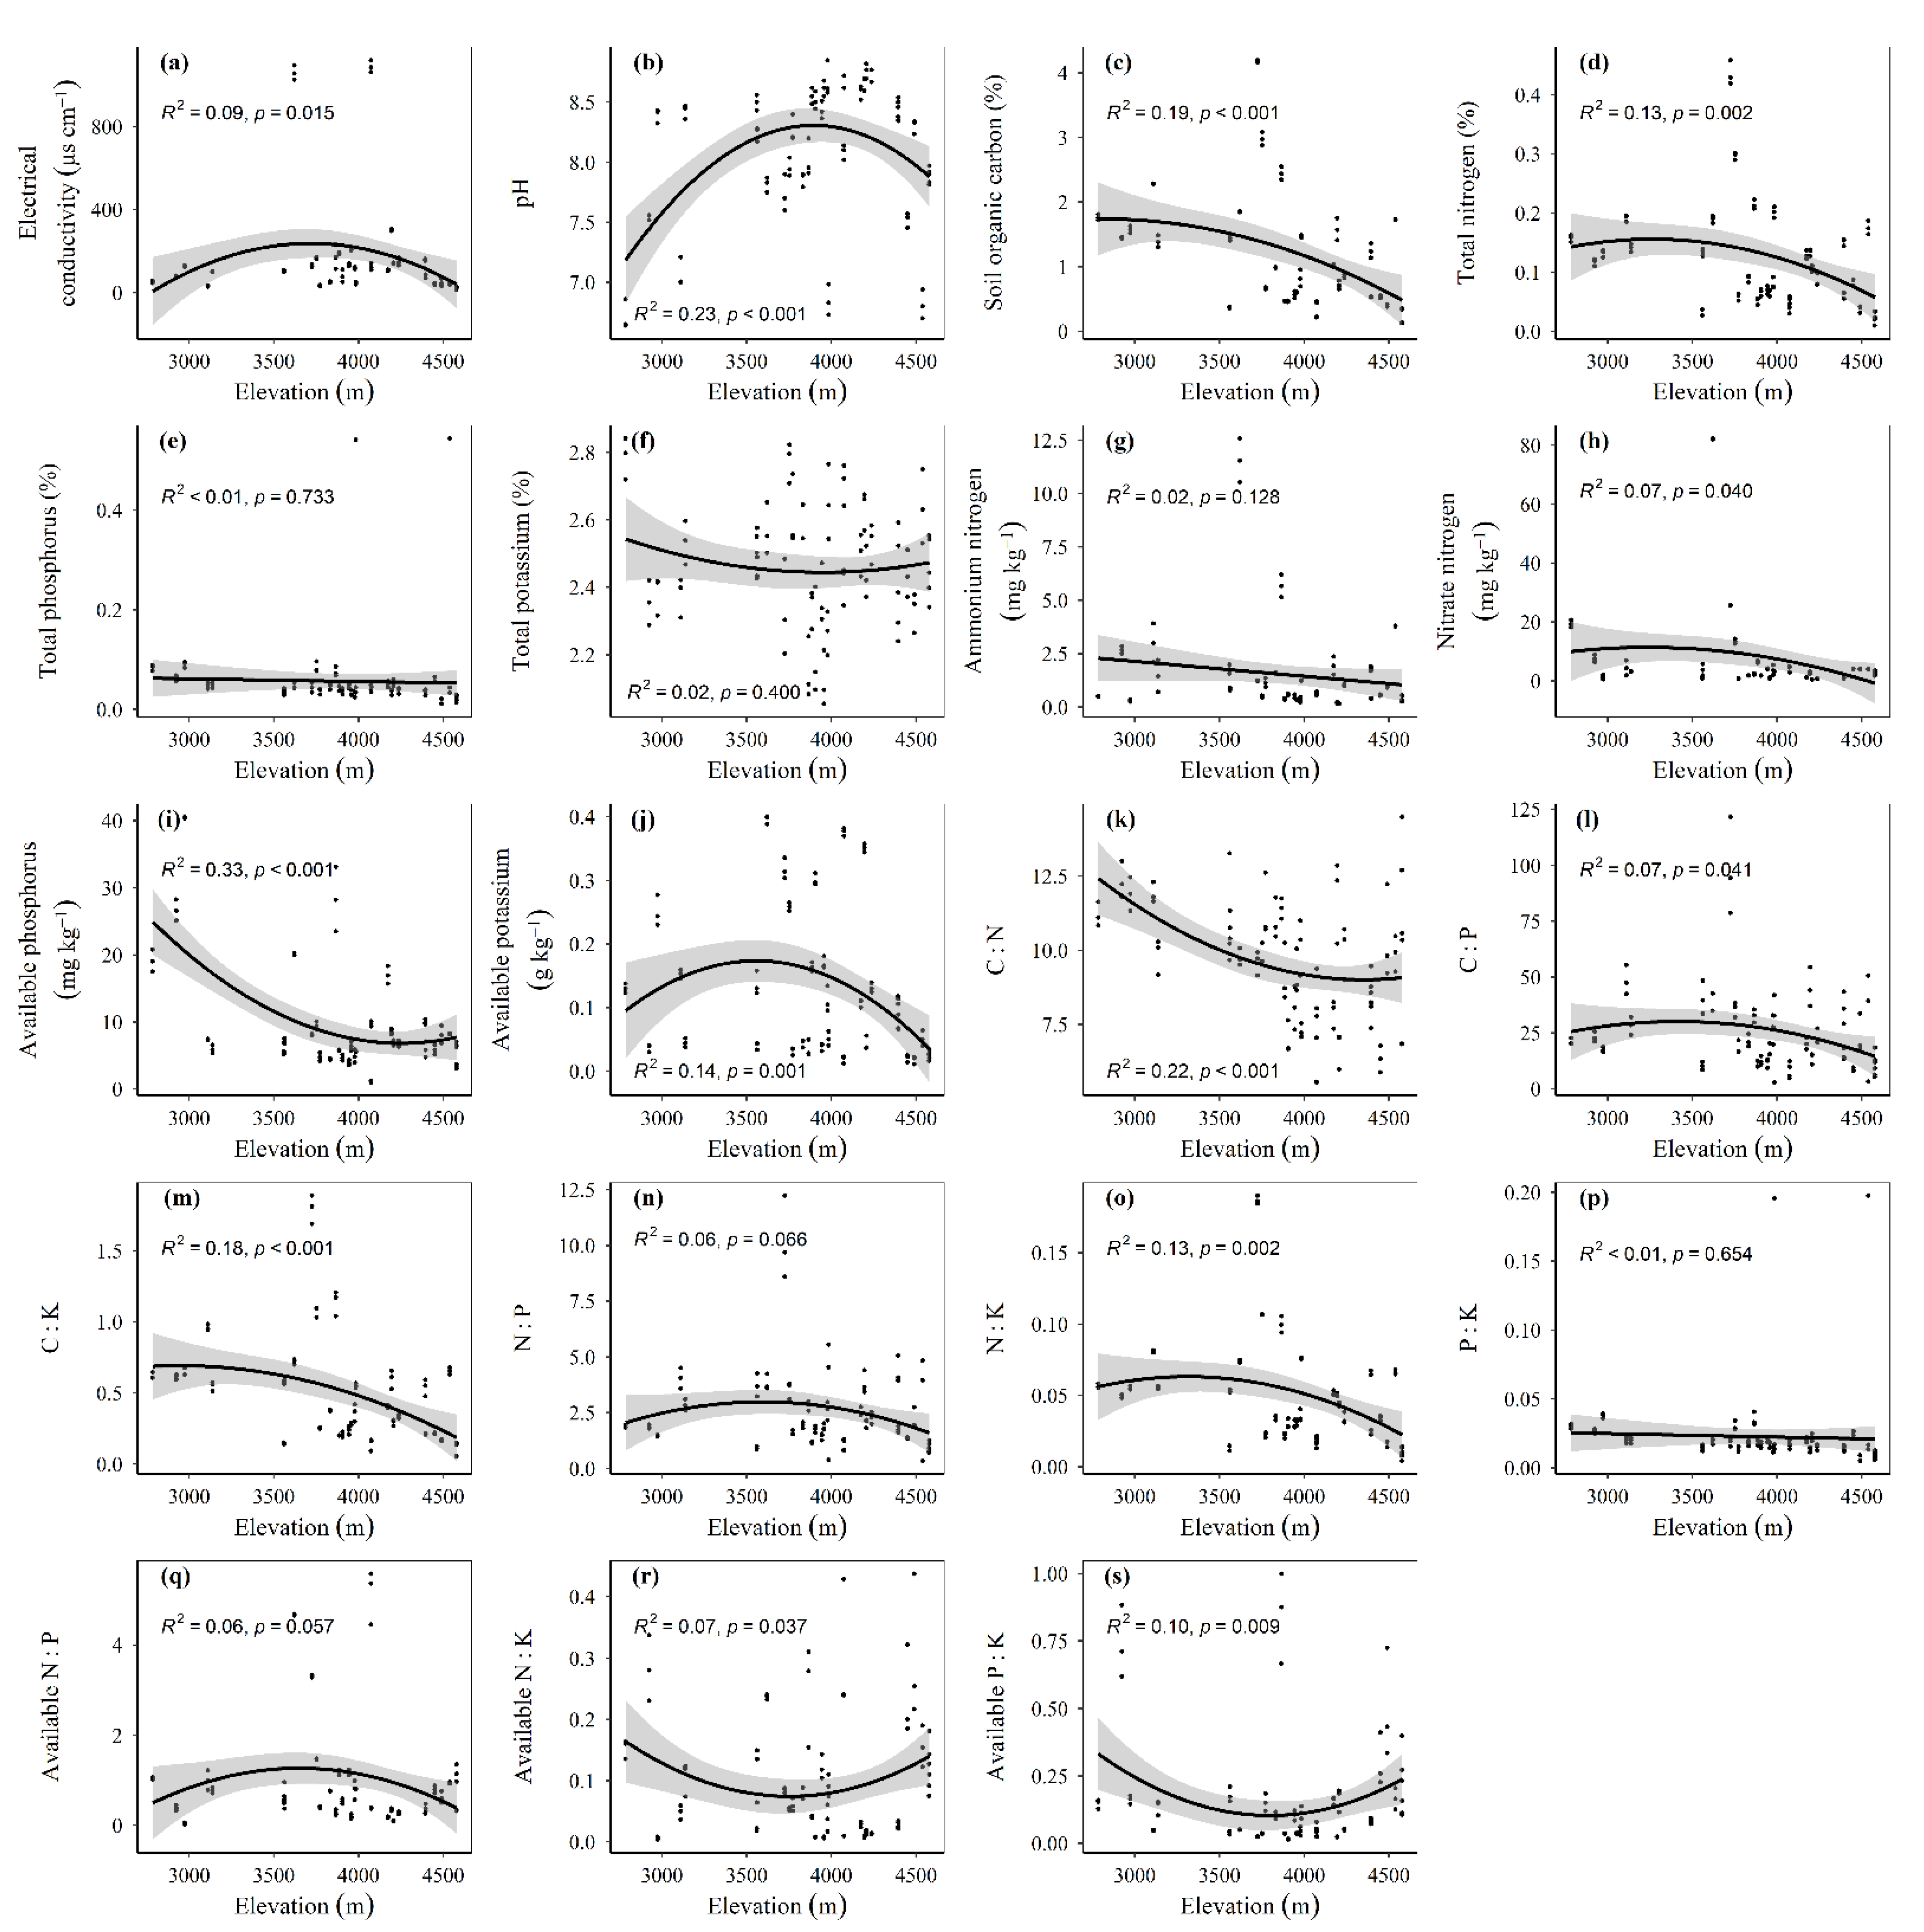
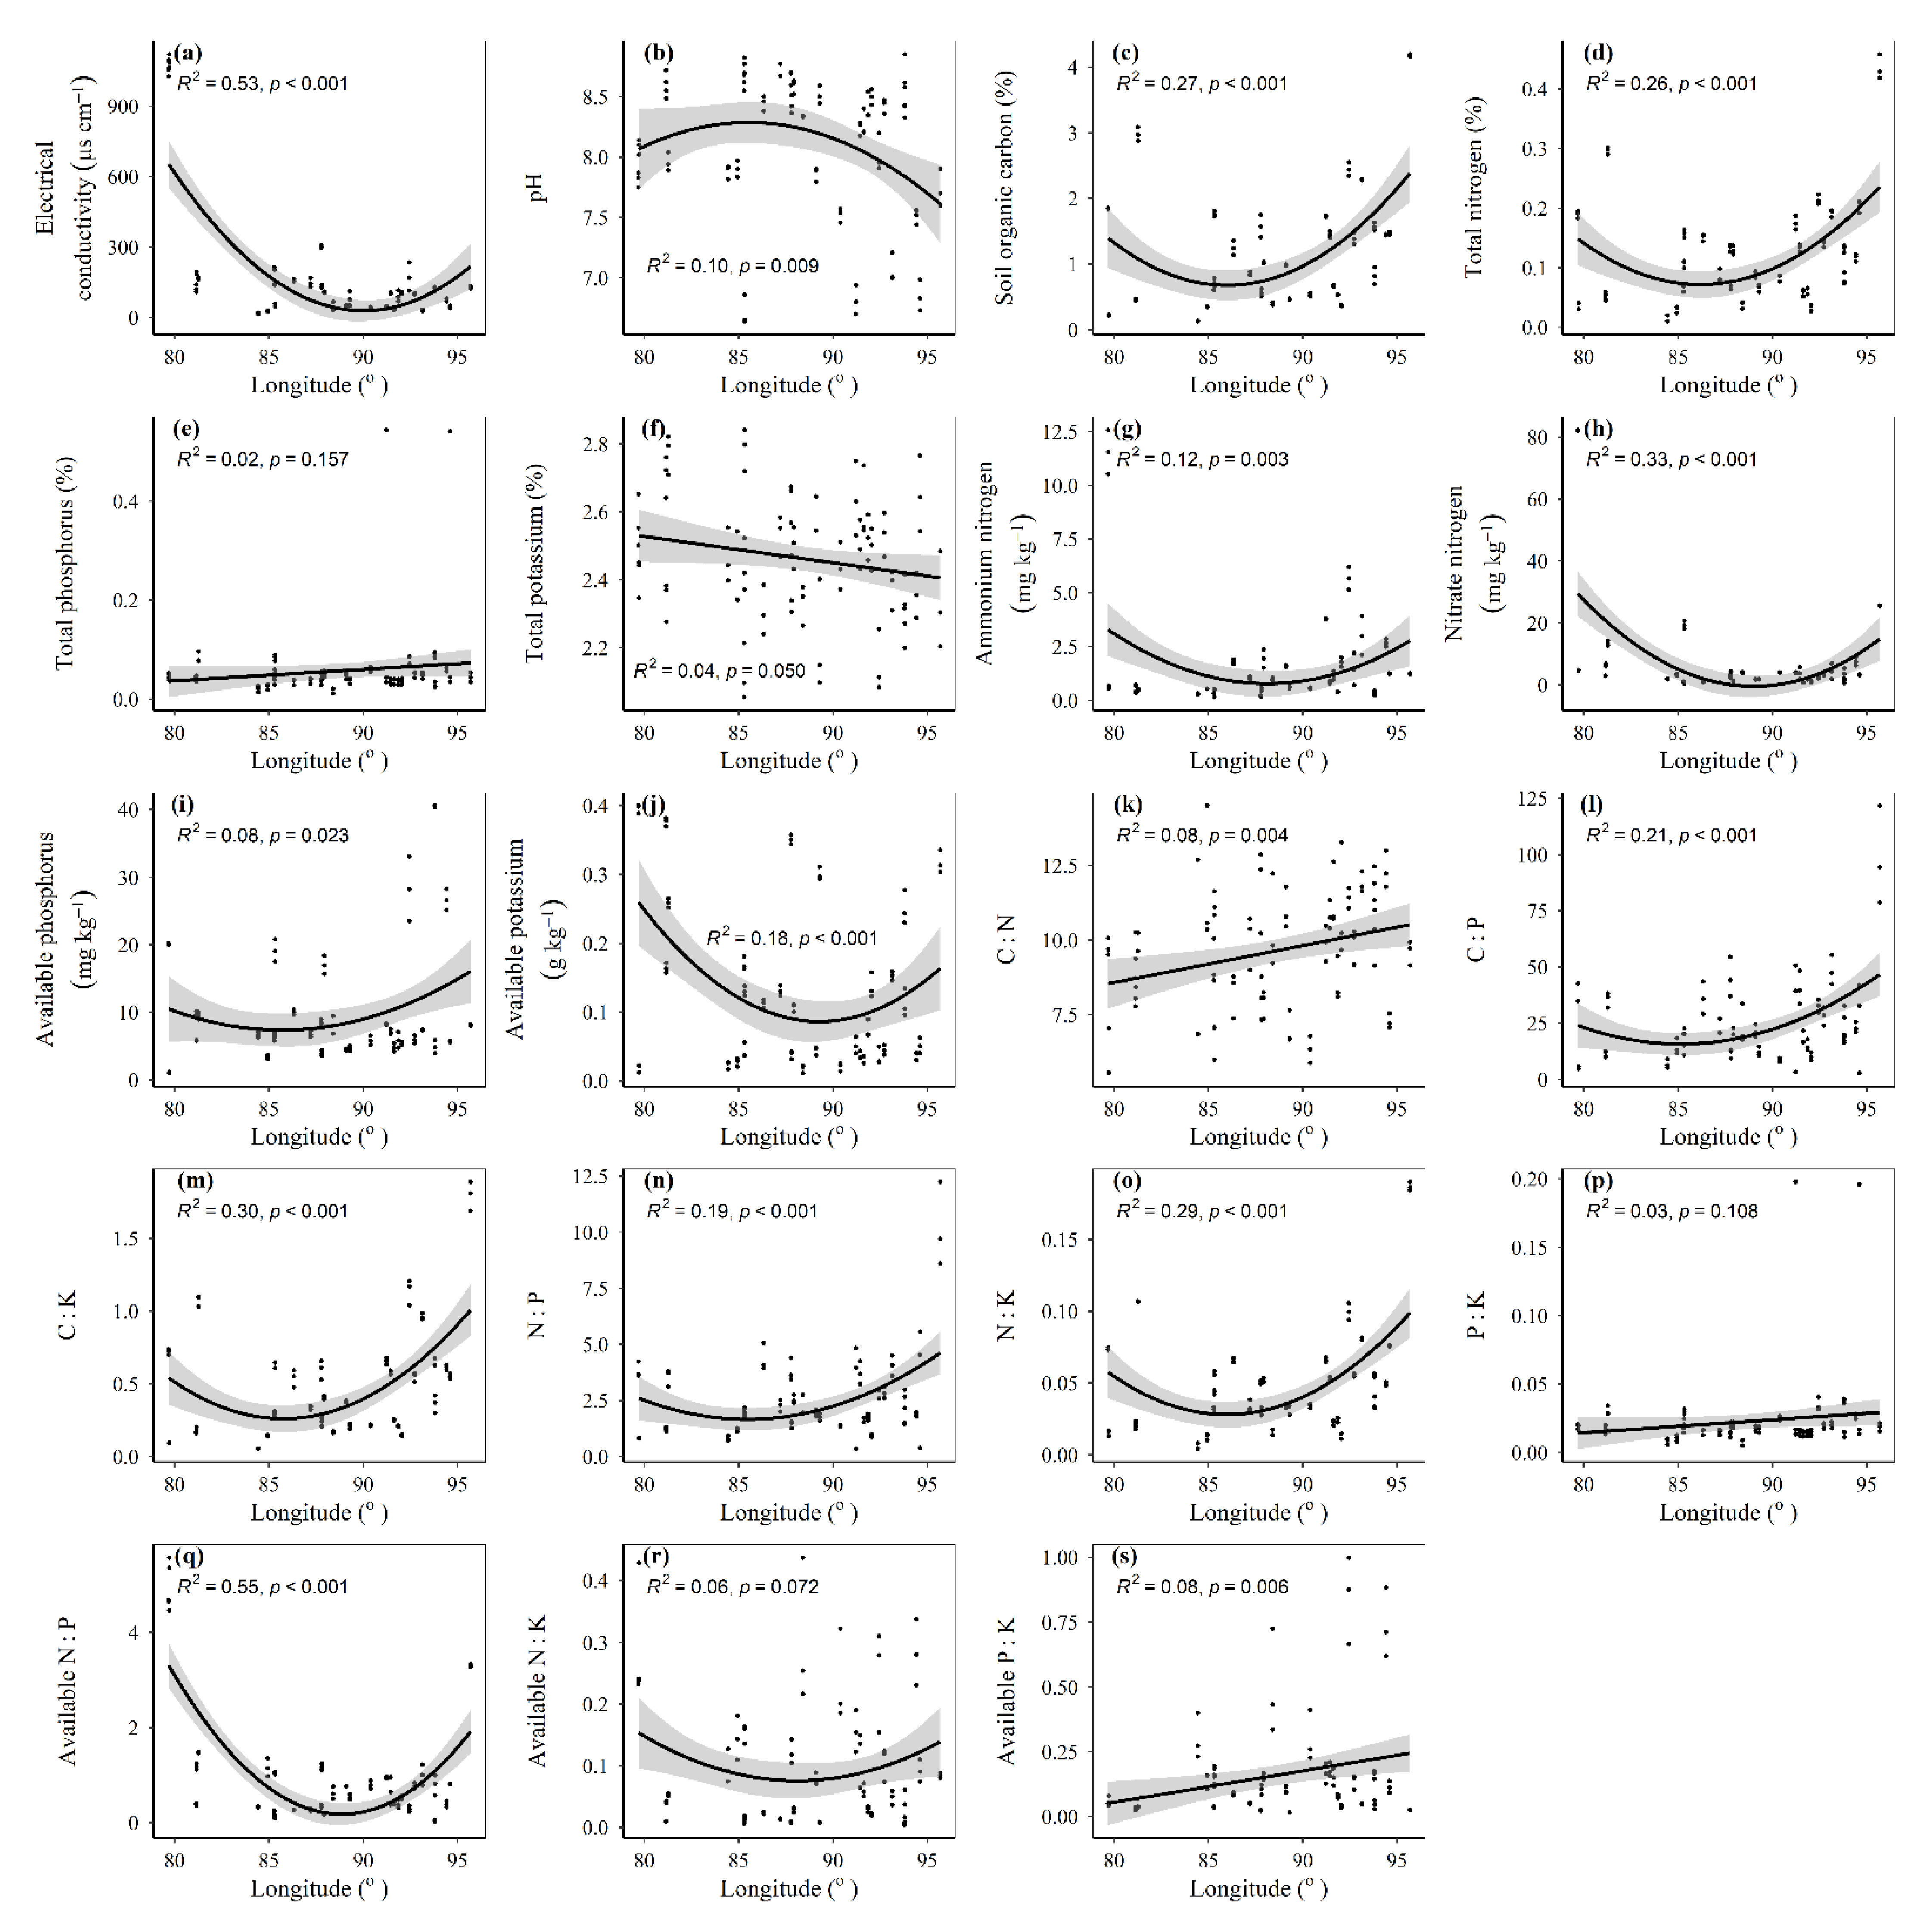
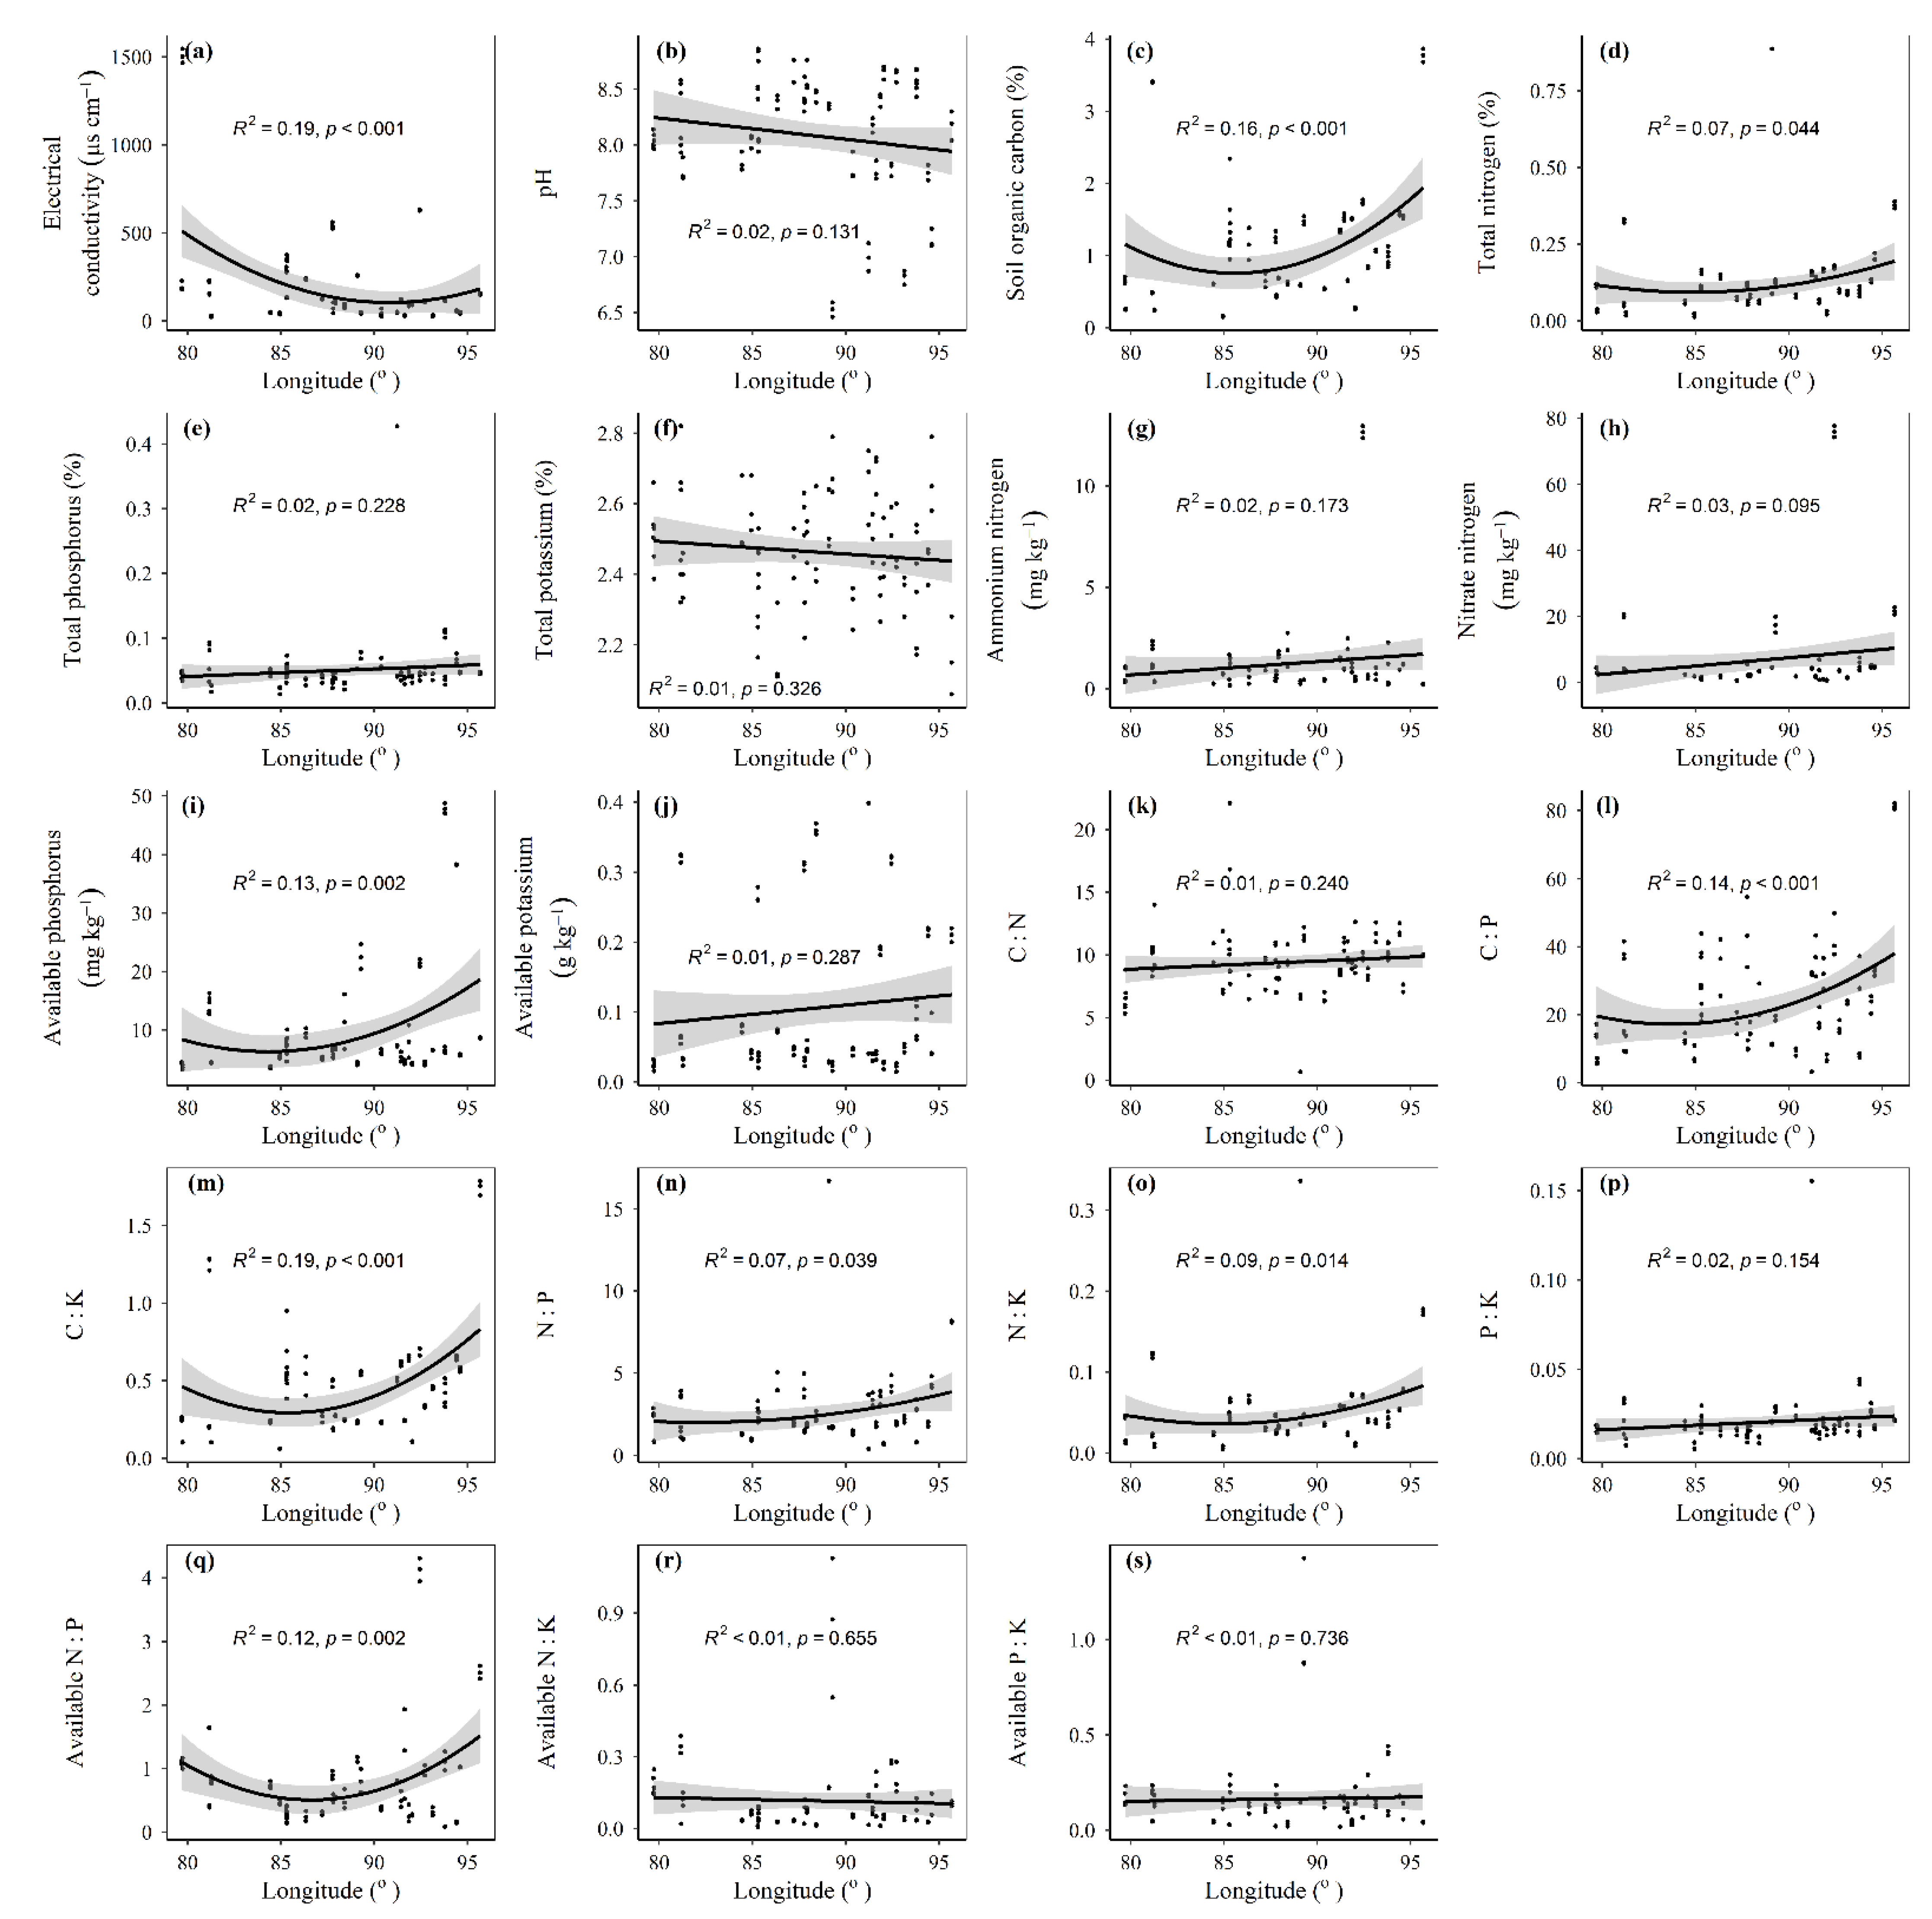
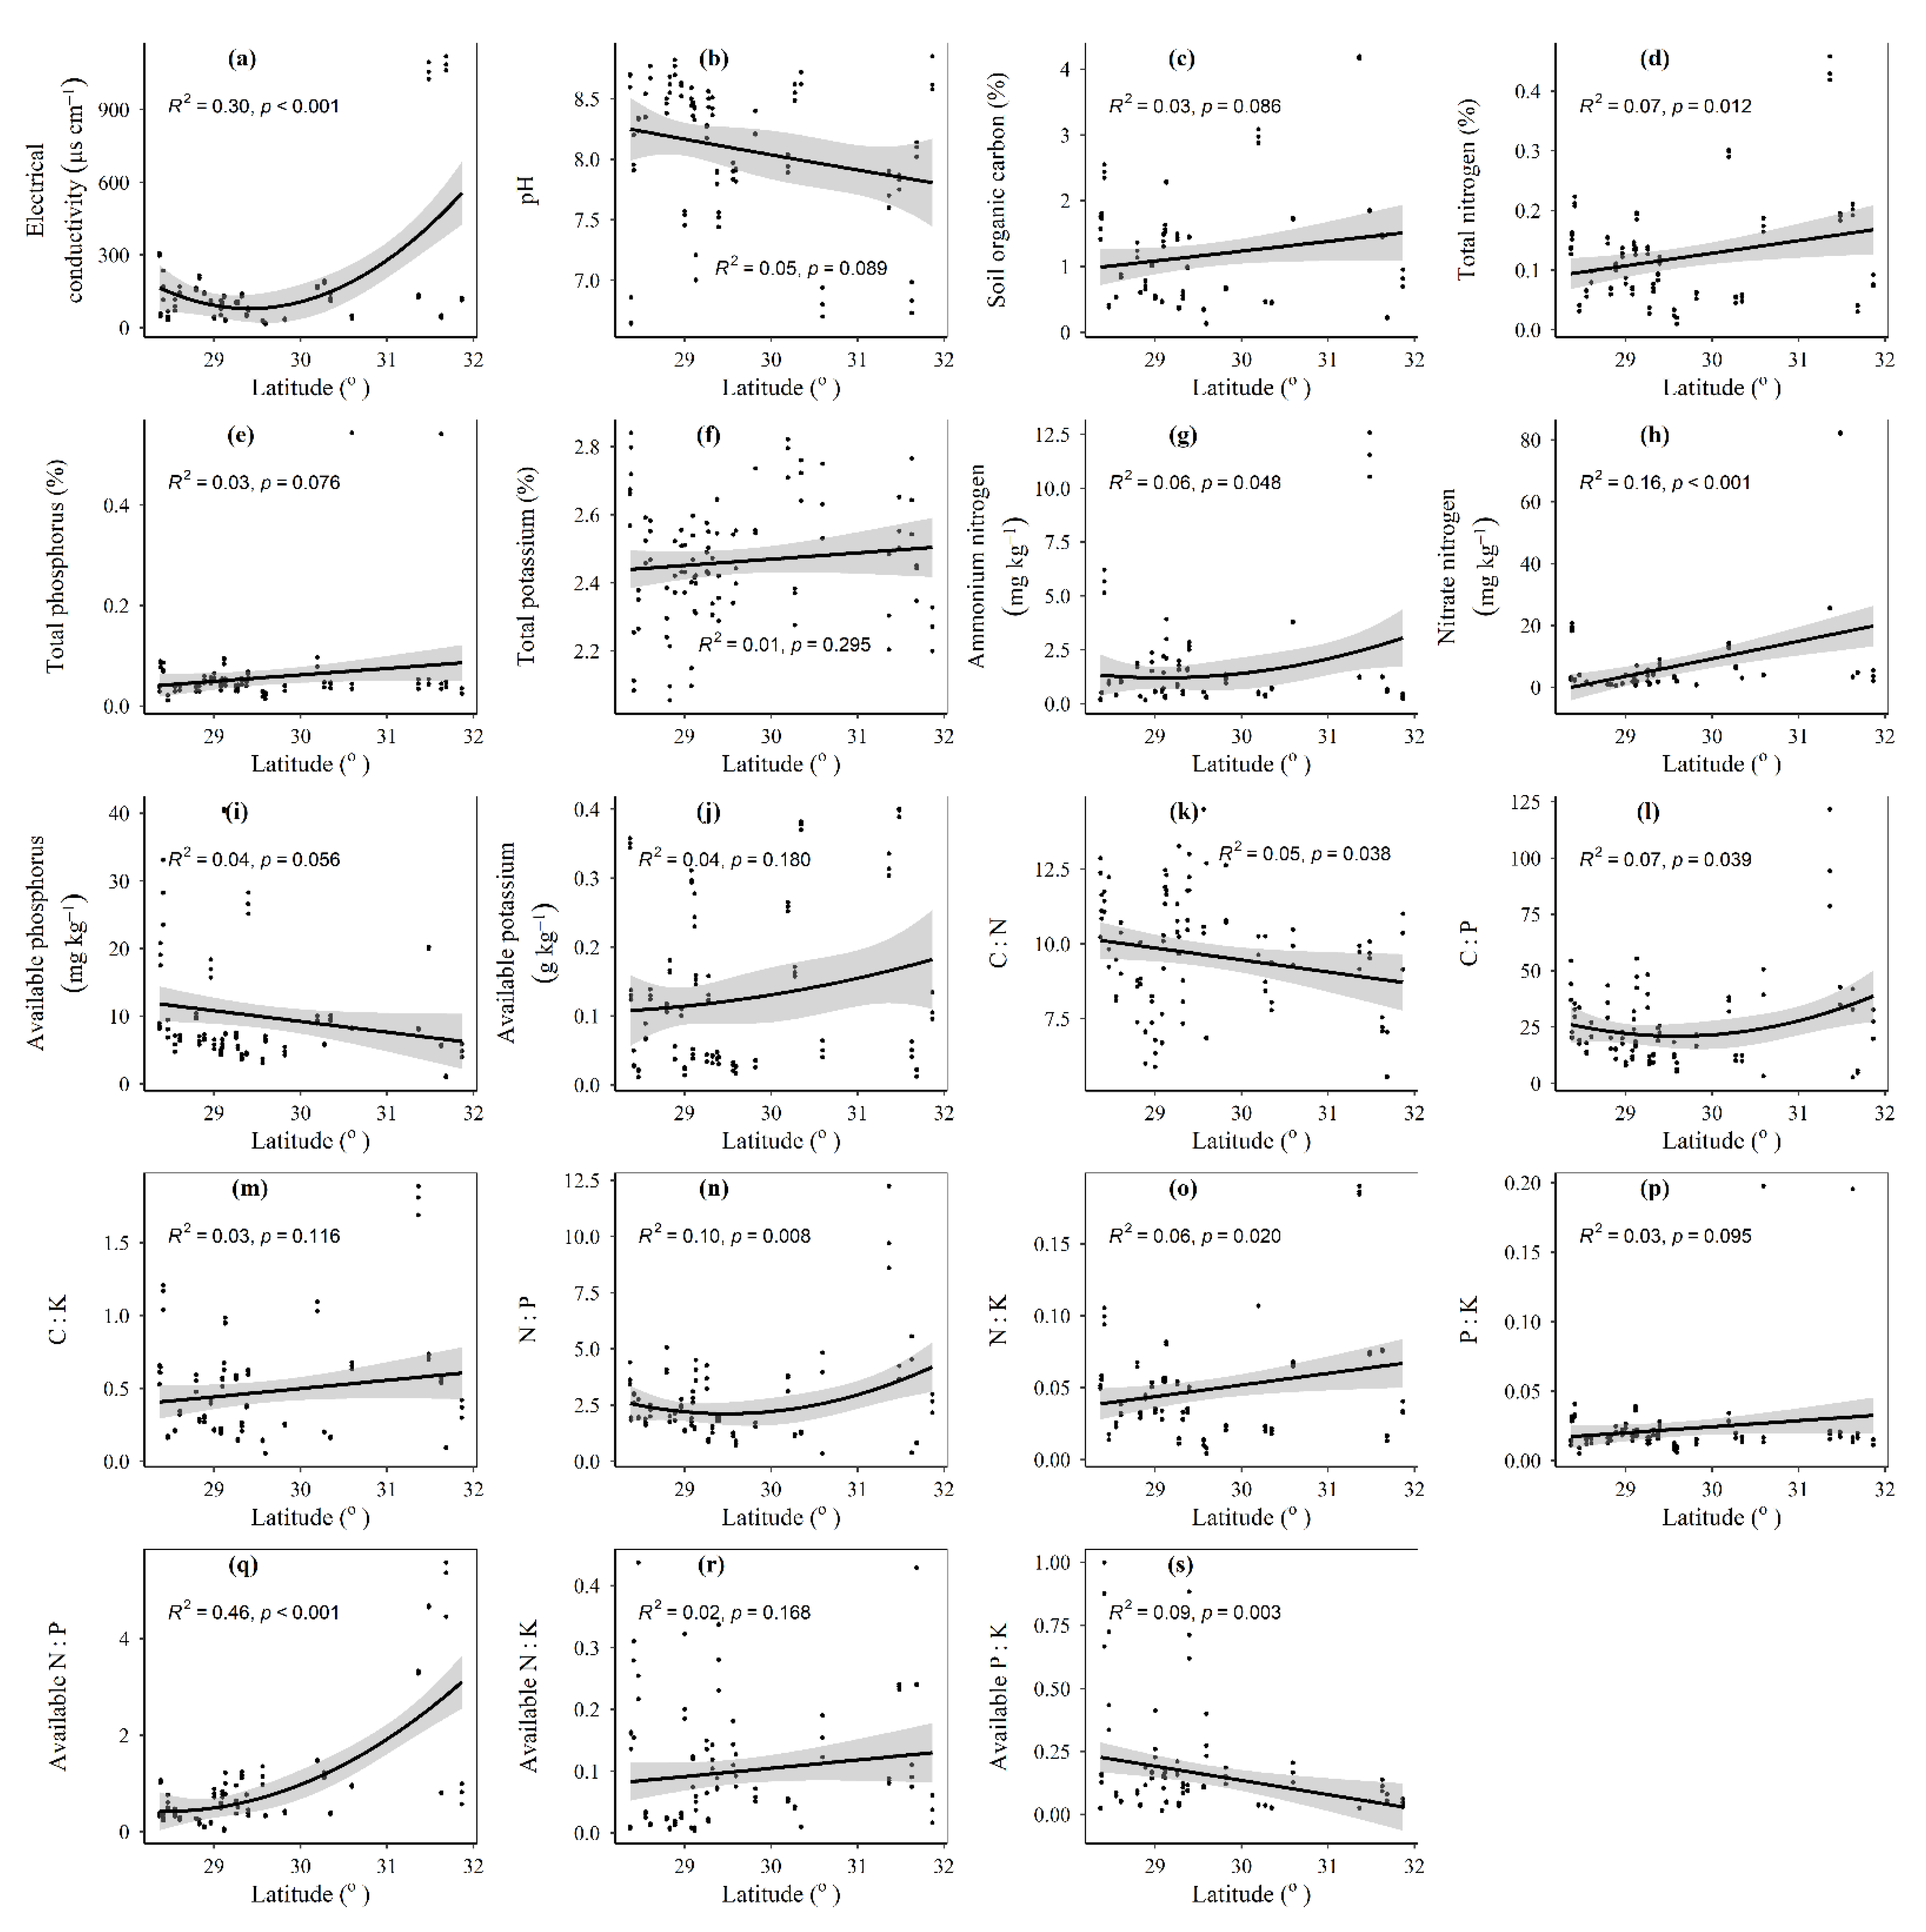
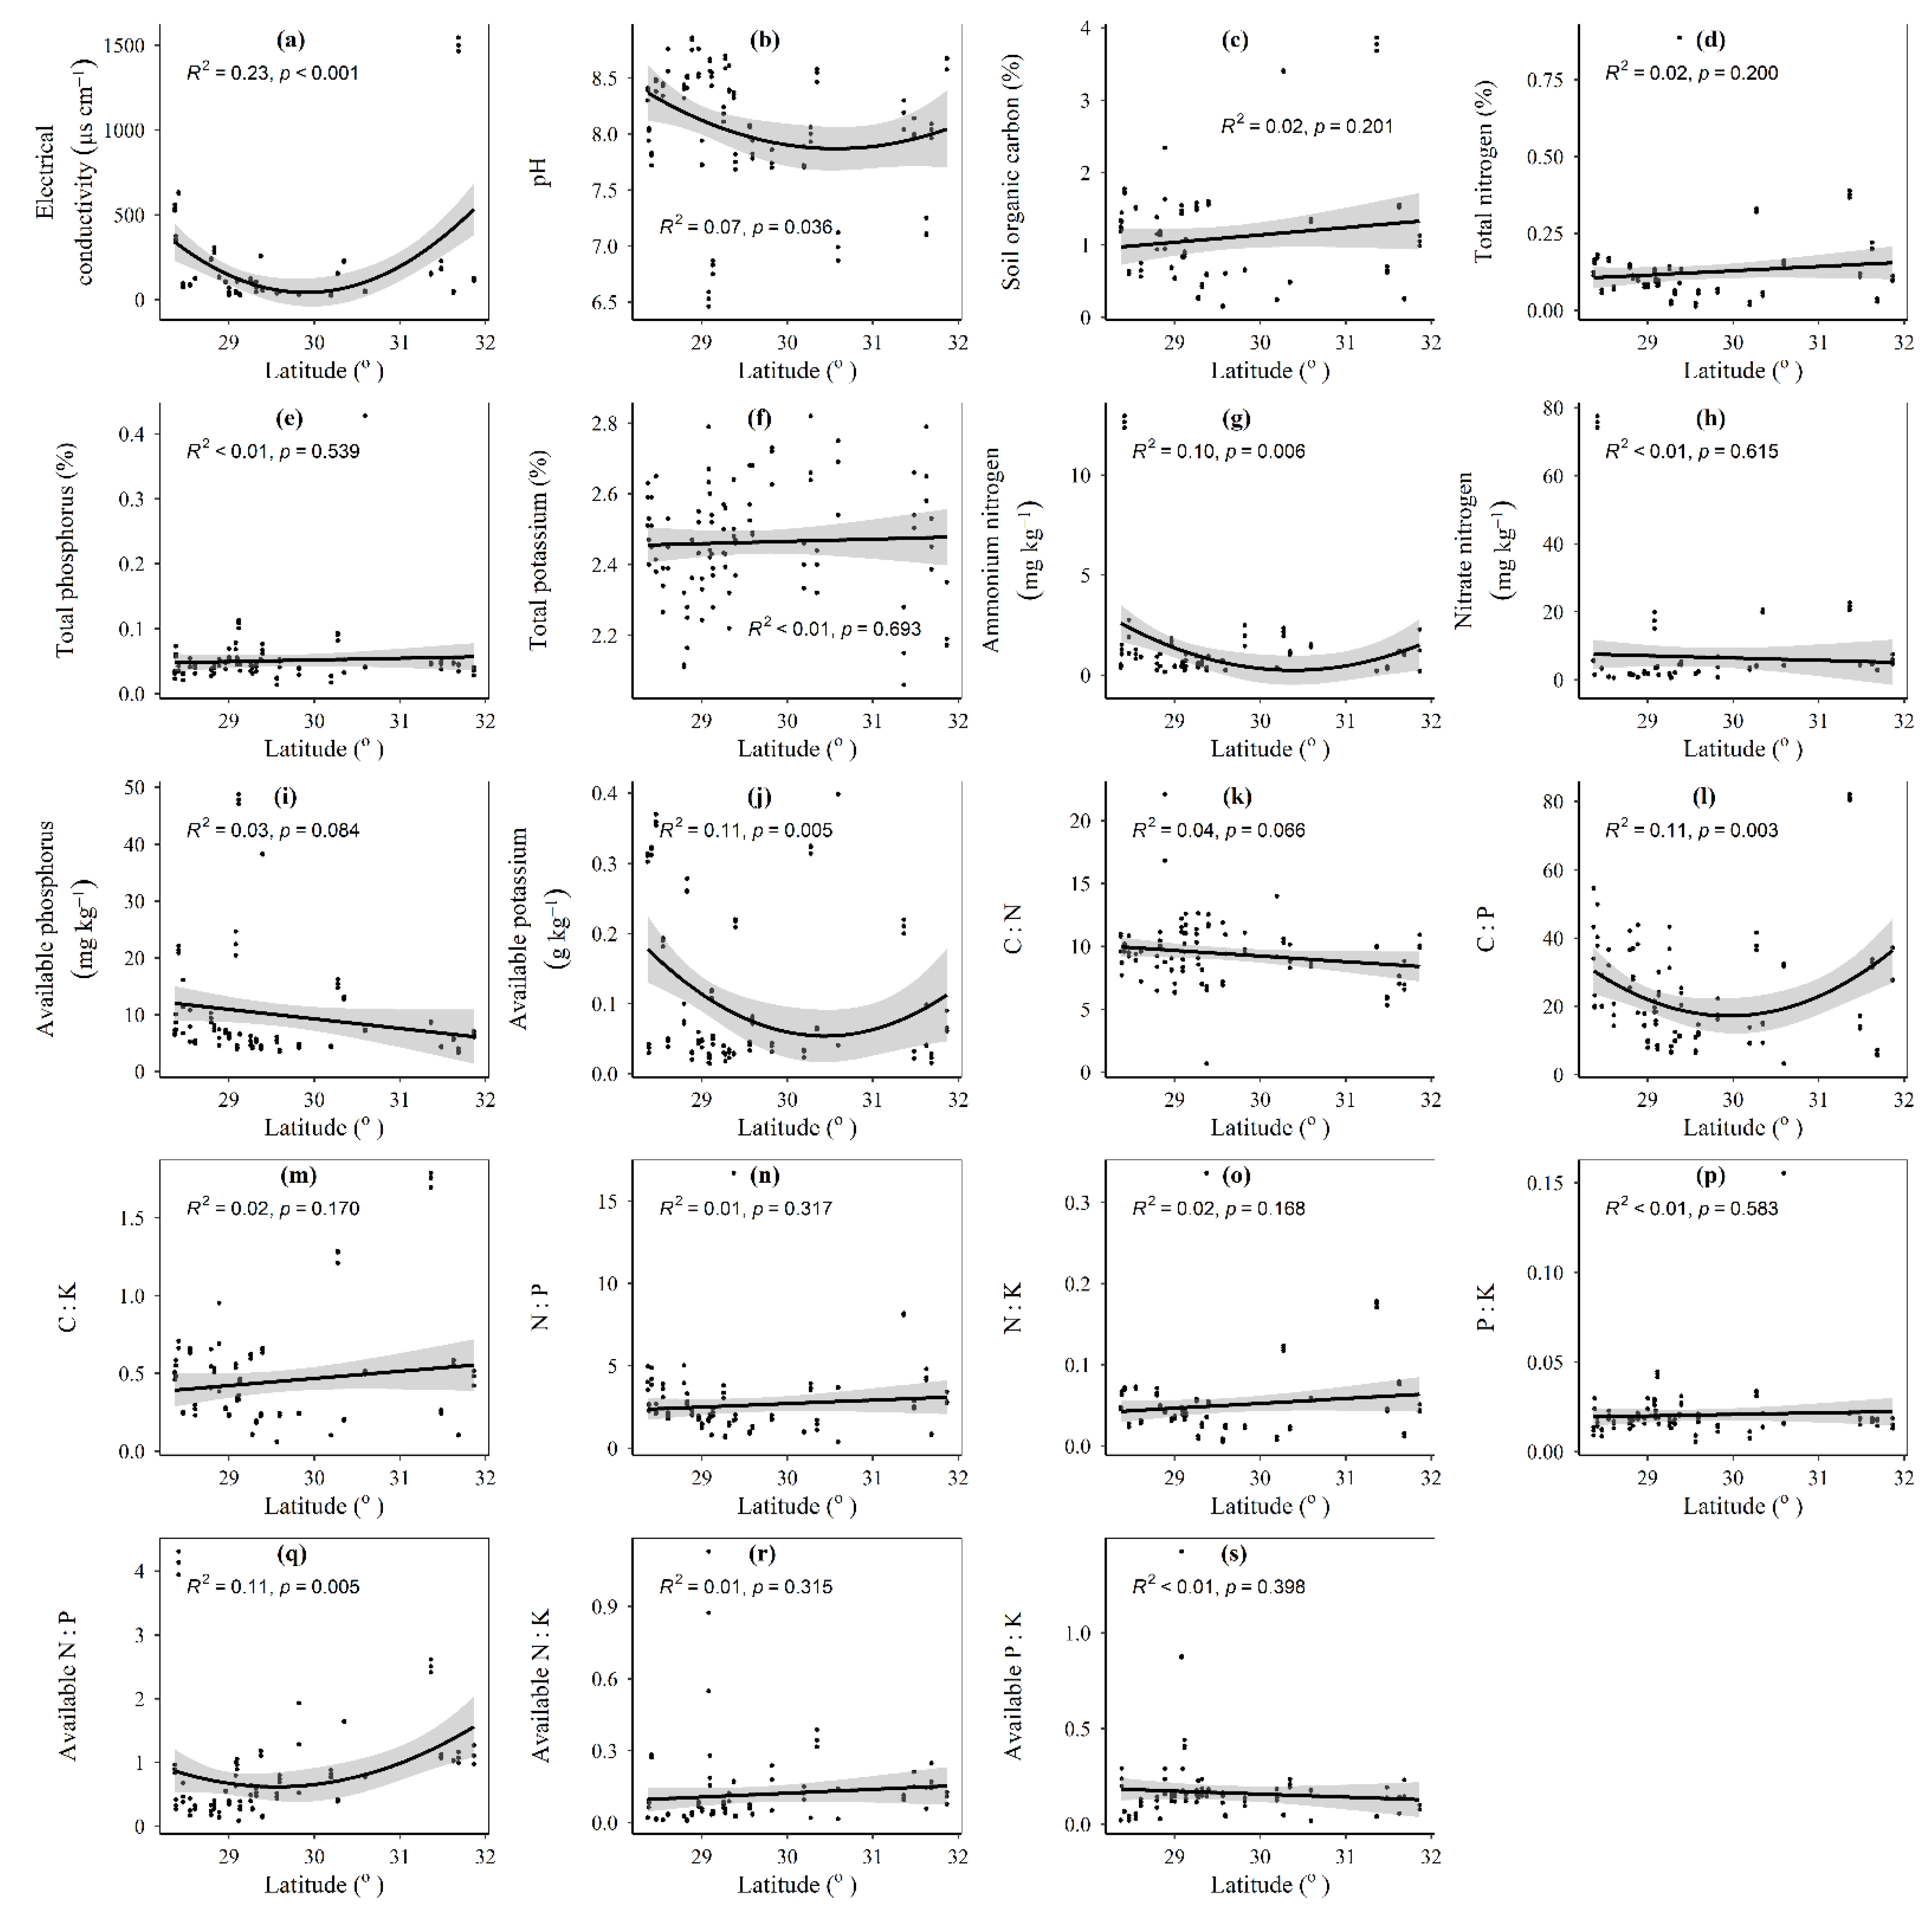
3.1. Spatial Distributions of Environmental Variables, and Total Abundance and Diversity of Soil Fungal Community

The MAT and AT2020 exhibited quadratic tendencies with latitude from 28.37° N to 31.86° N but decreased linearly with elevation from 2785 m to 4578 m (Figure A2). The MAP and AP2020 increased linearly with longitude from 79.69° E to 95.68° E, but exhibited quadratic correlations with elevation from 2785 m to 4578 m (Figure A2). Both stem diameter and plant height exhibited quadratic correlations with longitude (79.69°–95.68° E) and elevation (2785–4578 m) (Figure A3). Leaf area increased with longitude from 79.69° E to 95.68° E (Figure A3). The correlations between the 19 soil variables and the 3 geographic variables are presented in Figure A4, Figure A5, Figure A6, Figure A7, Figure A8 and Figure A9.
Different α-diversity indices had different relationships with longitude, latitude, and elevation (Figure A10, Figure A11, Figure A12, Figure A13, Figure A14, Figure A15 and Figure A16). Species, phylogenetic and function β-diversity had marginally significant or significant correlations with longitude (Table 1). Species β-diversity increased with increasing latitude and elevation (Table 1).

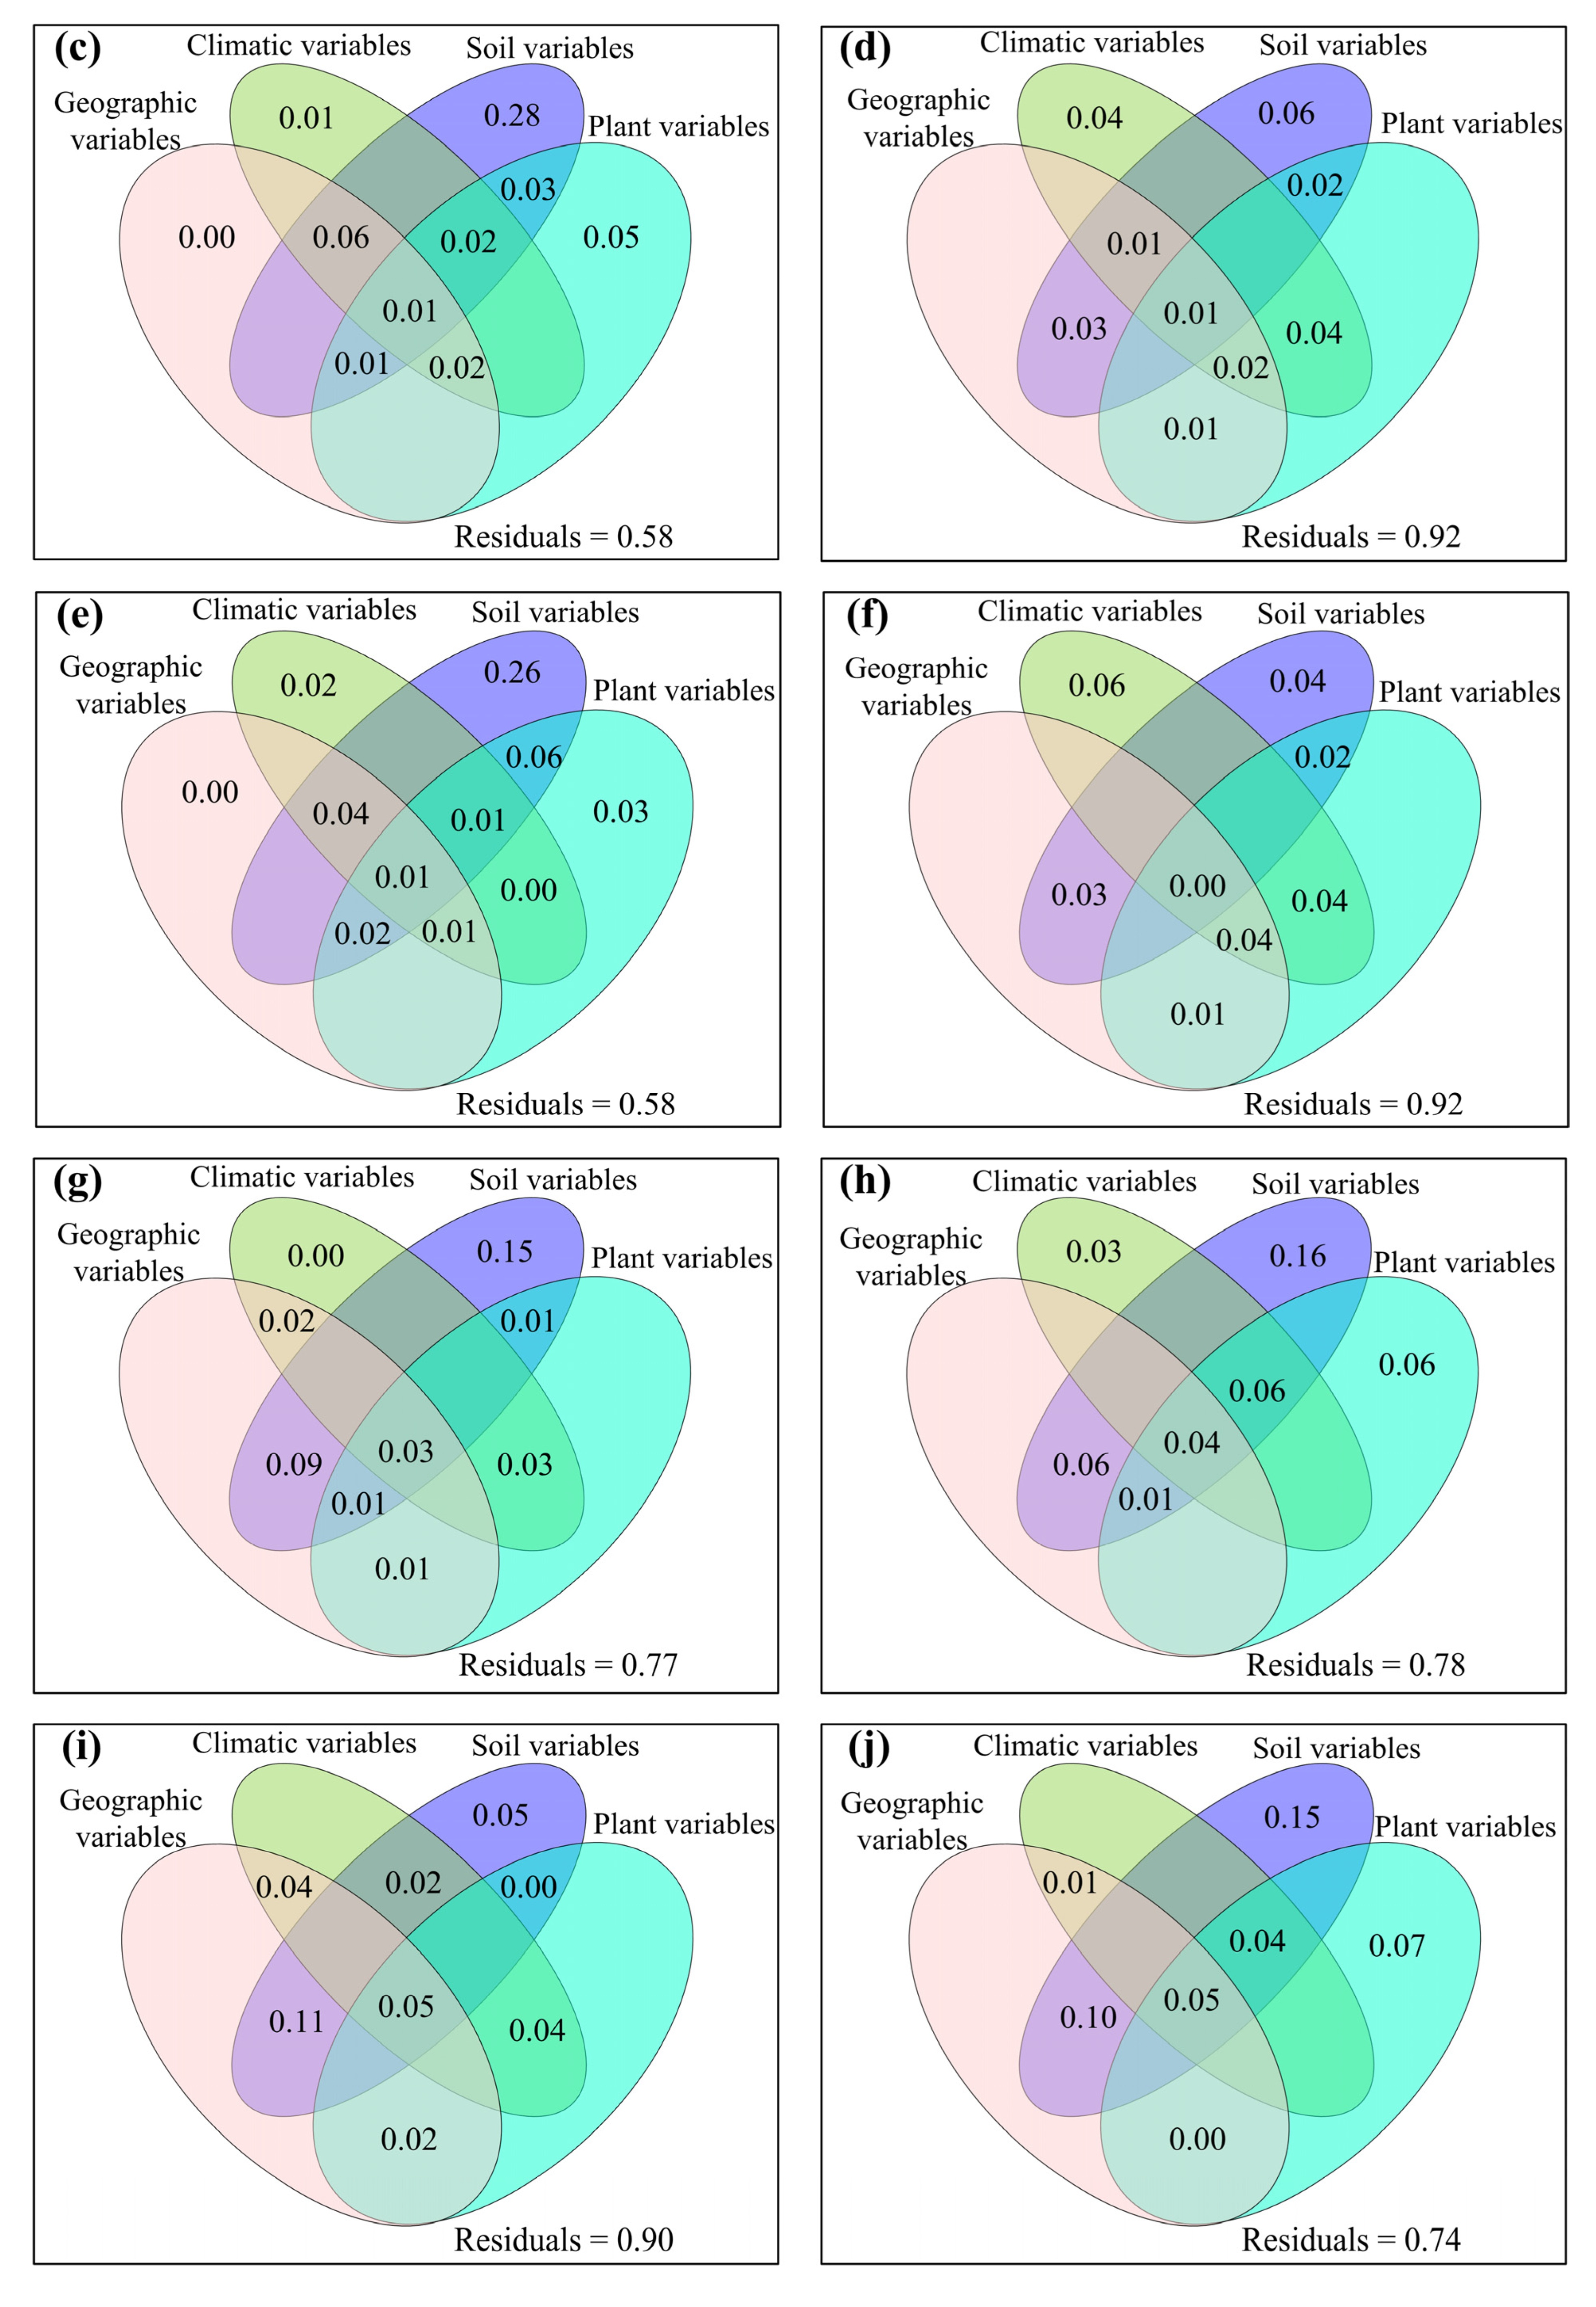
3.2. Correlations between Fungal Community and Environmental Factors

The relative impacts of environmental variables to total abundance andα-diversity varied (Figure 1, Figure 2, Figure 3 and Figure 4). Different α-diversity indices had different predominated factors (Figure 2 and Figure 3). Species, phylogenetic and function β-diversity had dissimilar correlations with environmental variable, and their predominated factors also differed (Table 1). The relative impacts of geographic, climatic, variables and variables to total abundance and diversity were elucidated in Figure 5, Figure 6, Figure 7, Figure 8 and Figure 9. Climatic variables and plant variables had the greatest and least excluded impacts on total abundance for topsoil, respectively (Figure 5). In contrast, climatic variables and plant variables had the least and greatest excluded impacts on total abundance for subtopsoil, respectively (Figure 5). Soil variables had the greatest excluded impacts on species, phylogenetic and function α- and β-diversity for topsoil (Figure 6, Figure 7, Figure 8 and Figure 9). Climatic variables had the greatest excluded impacts on OTUs, Chao1s, ACEs, PD, Guild numbers and ACEf, but soil variables had the greatest excluded impacts on Shannons, Simpsons, Chao1f, MNTD, Shannonf, Simpsonf, species, phylogenetic and function β-diversity for subtopsoil (Figure 6, Figure 7, Figure 8 and Figure 9).

4. Discussion

Based on our discoveries, the total abundance and diversity of soil fungal community overall had less correlations with latitude than longitude and elevation. This discovery could be explained by at least one of the following reasons. Firstly, the elevation range, longitude span, and latitude span were 1793 m (2785–4578 m), 15.99° (79.69–95.68°), and 3.49° (28.37–31.86°), respectively. Secondly, temperature and/or precipitation, which can modify the total abundance and diversity of soil fungal community [13,23], had lower correlations with latitude than longitude and elevation. Thirdly, plant height, stem diameter and/or leaf area, which might also modify total abundance and diversity of soil fungal community (Figure 1, Figure 2, Figure 3, Figure 4, Figure 5, Figure 6, Figure 7, Figure 8 and Figure 9), had less correlations with latitude than longitude and elevation (Figure A3).
Based on our discoveries, the geo-distribution patterns of total abundance and diversity of soil fungal community for topsoil were dissimilar from those for subtopsoil. Similarly, some earlier studies found that soil fungal community at different soil depths had different responses to external disturbance on the Tibetan Plateau [13,16,24]. All these cautioned that investigating soil microbial community in single soil depth may not fully reflect the spatial distribution pattern of soil microbial community structure and function, and the response mechanism of soil microbial community to external disturbance. It is necessary to strengthen the study of soil microbial community at multiple soil depths. This finding could be explained by at least one of the following reasons. Firstly, both soil temperature as well as moisture can alter soil fungal abundance, α-diversity, and community composition [13,16,25]. Both soil temperature as well as moisture can adjust with soil depth [13,24]. On the other hand, climate change (e.g., global warming; precipitation change) can alter soil temperature as well as soil moisture, and their change magnitudes can adjust with soil depth [13,26,27]. Secondly, soil carbon, nitrogen, phosphorus, potassium contents and obtainability, as well as their ratios might also alter soil fungal abundance, α-diversity and community composition [14,15]. The correlations between these soil variables and total abundance α-diversity and community composition of soil fungal community varied with soil depth in the current study. On the other hand, global warming as well as precipitation change can also result in the changes in soil carbon, nitrogen, phosphorus and potassium, and their change levels can also adjust with soil depth [28]. Thirdly, the total abundance as well as diversity of soil fungal community might be also correlated with soil mechanical composition, soil bulk density, and/or soil compaction [16], which might also adjust with soil depth.
Based on our discoveries, the geo-distribution patterns of soil fungal species, phylogenetic and function diversity of P. flaccidum were not completely the same. For example, species and function β-diversity had closer correlations with longitude than phylogenetic β-diversity (Table 1). This discovery was similar to earlier reports [12,13,14,15,16,29,30]. This discovery cautioned that a single aspect of diversity cannot completely reveal the geo-distribution patterns of soil fungal diversity and could be explained by at least one of the succeeding reasons. Firstly, species, phylogenetic and function diversity can represent biodiversity from dissimilar perspectives, and they are fundamentally dissimilar [18,31]. Dissimilar species might have similar phylogenetic information and/or biological functions [32,33,34]. Secondly, both temperature and water obtainability can modify soil fungal diversity [14,16], which was strengthened by the current study. Soil fungal species, phylogenetic and function diversity can have dissimilar correlations with temperature as well as water obtainability [13,16]. Thirdly, soil variables (e.g., pH) can also modify soil fungal diversity [14]. Soil fungal species, phylogenetic and function diversity can have dissimilar correlations with soil variables. Fourthly, soil fungal diversity can be also closely correlated with plant variables [14], which can have dissimilar correlations with soil fungal species, phylogenetic and function diversity [12,14].
Based on our discoveries, compared to temperature, precipitation had stronger impacts on total abundance, species α-diversity, phylogenetic α-diversity, and function β-diversity of soil fungal community for both topsoil and subtopsoil. Furthermore, compared to temperature, precipitation had stronger impacts on function α-diversity for topsoil, species β-diversity for topsoil, and phylogenetic β-diversity for subtopsoil. These discoveries were similar with earlier reports [2,4,27], and further supported that the Tibetan Plateau is a cold and dry region [35]. Furthermore, this phenomenon cautioned that we should not only pay attention to the impacts of global warming on the Qinghai-Tibet Plateau, but also pay attention to the impacts of precipitation change on the Tibetan Plateau. More field experiments of precipitation change are needed to better capture the impacts of future climate change on the Qinghai-Tibet Plateau.

5. Conclusions

The geo-distribution patterns for soil fungal community of P. flaccidum were explored along 32 sites in alpine areas across Tibet. Total abundance and α- and β-diversity of soil fungal community overall had lower correlations with latitude than longitude and elevation. The geo-distribution pattern of soil fungal community at 0–10 cm depth was different from that at 10–20 cm depth. Soil fungal species, phylogenetic and function diversity had dissimilar geo-distribution patterns, indicating that it is necessary to combine species, phylogenetic and function diversity to better reflect geo-distribution patterns of soil fungal community. This study warned that both global warming and precipitation change can affect soil fungal communities of P. flaccidum, but the effect of precipitation change should be given more attention.

Author Contributions

Conceptualization, G.F. and G.Z.; methodology, G.F.; software, Z.S.; validation, G.F. and G.Z.; formal analysis, G.F. and G.Z.; investigation, G.Z.; resources, Z.S.; data curation, G.F. and G.Z.; writing—original draft preparation, G.F. and G.Z.; writing—review and editing, G.F., Z.S., and G.Z.; visualization, G.F., Z.S., and G.Z.; supervision, G.F., Z.S., and G.Z.; project administration, Z.S.; funding acquisition, Z.S. and G.F. All authors have read and agreed to the published version of the manuscript.

Funding

This research was funded by the Youth Innovation Promotion Association of Chinese Academy of Sciences [2020054]; the National Natural Science Foundation of China [31600432]; the Second Comprehensive Scientific Expedition on the Tibetan Plateau [2019QZKK0302]; the Bingwei Outstanding Young Talents Program of the Institute of Geographic Sciences and Natural Resources Research, Chinese Academy of Sciences [2018RC202]; the Science and Technology Project of the Tibet Autonomous Region [XZ202101ZD0007G, XZ202201ZY0003N, XZ202101ZD0003N; XZ202202YD0009C]; the STS Project of the Chinese Academy of Sciences [KFJ-STS-QYZD2021-22-003]; and the construction of the fixed Observation and Experimental Station of the first Support System for Agricultural Green Development in Zhongba County.

Institutional Review Board Statement

Not applicable.

Informed Consent Statement

Not applicable.

Data Availability Statement

Not applicable.

Acknowledgments

We appreciate the editor and reviewers for their profound and professional comments which greatly improved this study.

Conflicts of Interest

The authors declare no conflict of interest.

Appendix A

Figure A1. Location of sampling sites in Tibet.
Jof 08 01230 g0a1
Figure A2. Relationships between (a) mean annual temperature (MAT) and longitude, (b) MAT and latitude, (c) MAT and elevation, (d) mean annual precipitation (MAP) and longitude, (e) MAP and latitude, (f) MAP and elevation, (g) annual temperature in 2020 (AT2020) and longitude, (h) AT2020 and latitude, (i) AT2020 and elevation, (j) annual precipitation in 2020 (AP2020) and longitude, (k) AP2020 and latitude, and (l) AP2020 and elevation.
Jof 08 01230 g0a2aJof 08 01230 g0a2b
Figure A3. Relationships between (a) stem diameter and longitude, (b) stem diameter and latitude, (c) stem diameter and elevation, (d) plant height and longitude, (e) plant height and latitude, (f) plant height and elevation, (g) leaf area and longitude, (h) leaf area and latitude, and (i) leaf area and elevation.
Jof 08 01230 g0a3
Figure A4. Relationships of elevation with soil (a) electrical conductivity, (b) pH, (c) soil organic carbon (SOC), (d) total nitrogen (TN), (e) total phosphorus (TP), (f) total potassium (TK), (g) ammonium nitrogen (NH4+-N), (h) nitrate nitrogen (NO3-N), (i) available phosphorus (AP), (j) available potassium (AK), (k) ratio of SOC to TN (C:N), (l) ratio of SOC to TP (C:P), (m) ratio of SOC to TK (C:K), (n) ratio of TN to TP (N:P), (o) ratio of TN to TK (N:K), (p) ratio of TP to TK (P:K), (q) ratio of available nitrogen to AP (available N:P), (r) ratio of available nitrogen to AK (available N:K) and (s) ratio of AP to AK (available P:K) at a depth of 0–10 cm.
Jof 08 01230 g0a4
Figure A5. Relationships of elevation with soil (a) electrical conductivity, (b) pH, (c) soil organic carbon (SOC), (d) total nitrogen (TN), (e) total phosphorus (TP), (f) total potassium (TK), (g) ammonium nitrogen (NH4+-N), (h) nitrate nitrogen (NO3-N), (i) available phosphorus (AP), (j) available potassium (AK), (k) ratio of SOC to TN (C:N), (l) ratio of SOC to TP (C:P), (m) ratio of SOC to TK (C:K), (n) ratio of TN to TP (N:P), (o) ratio of TN to TK (N:K), (p) ratio of TP to TK (P:K), (q) ratio of available nitrogen to AP (available N:P), (r) ratio of available nitrogen to AK (available N:K) and (s) ratio of AP to AK (available P:K) at a depth of 10–20 cm.
Jof 08 01230 g0a5
Figure A6. Relationships of longitude with soil (a) electrical conductivity, (b) pH, (c) soil organic carbon (SOC), (d) total nitrogen (TN), (e) total phosphorus (TP), (f) total potassium (TK), (g) ammonium nitrogen (NH4+-N), (h) nitrate nitrogen (NO3-N), (i) available phosphorus (AP), (j) available potassium (AK), (k) ratio of SOC to TN (C:N), (l) ratio of SOC to TP (C:P), (m) ratio of SOC to TK (C:K), (n) ratio of TN to TP (N:P), (o) ratio of TN to TK (N:K), (p) ratio of TP to TK (P:K), (q) ratio of available nitrogen to AP (available N:P), (r) ratio of available nitrogen to AK (available N:K) and (s) ratio of AP to AK (available P:K) at a depth of 0–10 cm.
Jof 08 01230 g0a6
Figure A7. Relationships of longitude with soil (a) electrical conductivity, (b) pH, (c) soil organic carbon (SOC), (d) total nitrogen (TN), (e) total phosphorus (TP), (f) total potassium (TK), (g) ammonium nitrogen (NH4+-N), (h) nitrate nitrogen (NO3-N), (i) available phosphorus (AP), (j) available potassium (AK), (k) ratio of SOC to TN (C:N), (l) ratio of SOC to TP (C:P), (m) ratio of SOC to TK (C:K), (n) ratio of TN to TP (N:P), (o) ratio of TN to TK (N:K), (p) ratio of TP to TK (P:K), (q) ratio of available nitrogen to AP (available N:P), (r) ratio of available nitrogen to AK (available N:K) and (s) ratio of AP to AK (available P:K) at a depth of 10–20 cm.
Jof 08 01230 g0a7
Figure A8. Relationships of latitude with soil (a) electrical conductivity, (b) pH, (c) soil organic carbon (SOC), (d) total nitrogen (TN), (e) total phosphorus (TP), (f) total potassium (TK), (g) ammonium nitrogen (NH4+-N), (h) nitrate nitrogen (NO3-N), (i) available phosphorus (AP), (j) available potassium (AK), (k) ratio of SOC to TN (C:N), (l) ratio of SOC to TP (C:P), (m) ratio of SOC to TK (C:K), (n) ratio of TN to TP (N:P), (o) ratio of TN to TK (N:K), (p) ratio of TP to TK (P:K), (q) ratio of available nitrogen to AP (available N:P), (r) ratio of available nitrogen to AK (available N:K) and (s) ratio of AP to AK (available P:K) at a depth of 0–10 cm.
Jof 08 01230 g0a8
Figure A9. Relationships of latitude with soil (a) electrical conductivity, (b) pH, (c) soil organic carbon (SOC), (d) total nitrogen (TN), (e) total phosphorus (TP), (f) total potassium (TK), (g) ammonium nitrogen (NH4+-N), (h) nitrate nitrogen (NO3-N), (i) available phosphorus (AP), (j) available potassium (AK), (k) ratio of SOC to TN (C:N), (l) ratio of SOC to TP (C:P), (m) ratio of SOC to TK (C:K), (n) ratio of TN to TP (N:P), (o) ratio of TN to TK (N:K), (p) ratio of TP to TK (P:K), (q) ratio of available nitrogen to AP (available N:P), (r) ratio of available nitrogen to AK (available N:K) and (s) ratio of AP to AK (available P:K) at a depth of 10–20 cm.
Jof 08 01230 g0a9
Figure A10. Relationships between total abundance and geographic variables (longitude, latitude, and elevation) at (ac) 0–10 cm and (df) 10–20 cm depth.
Jof 08 01230 g0a10
Figure A11. Relationships between species α-diversity and geographic variables (longitude, latitude, and elevation) at 0–10 cm depth. (ac) species richness (SR), (df) Chao1, (gi) ACE, (jl) Shannon, and (mo) Simpson.
Jof 08 01230 g0a11aJof 08 01230 g0a11b
Figure A12. Relationships between species α-diversity and geographic variables (longitude, latitude, and elevation) at 10–20 cm depth. (ac) species richness (SR), (df) Chao1, (gi) ACE, (jl) Shannon, and (mo) Simpson.
Jof 08 01230 g0a12aJof 08 01230 g0a12b
Figure A13. Relationships between phylogenetic α-diversity and geographic variables (longitude, latitude, and elevation) at 0–10 cm depth. (ac) phylogenetic diversity (PD), and (df) mean nearest taxon distance (MNTD).
Jof 08 01230 g0a13
Figure A14. Relationships between phylogenetic α-diversity and geographic variables (longitude, latitude, and elevation) at 10–20 cm depth. (ac) phylogenetic diversity (PD), and (df) mean nearest taxon distance (MNTD).
Jof 08 01230 g0a14
Figure A15. Relationships between functional α-diversity and geographic variables (longitude, latitude, and elevation) at 0–10 cm depth. (ac) numbers of FunGuild at guild level (Guilds), (df) Chao1, (gi) ACE, (jl) Shannon, and (mo) Simpson.
Jof 08 01230 g0a15aJof 08 01230 g0a15b
Figure A16. Relationships between functional α-diversity and geographic variables (longitude, latitude, and elevation) at 10–20 cm depth. (ac) numbers of FunGuild at guild level (Guilds), (df) Chao1, (gi) ACE, (jl) Shannon, and (mo) Simpson.
Jof 08 01230 g0a16aJof 08 01230 g0a16b

References

  1. Chen, B.; Zhang, X.; Tao, J.; Wu, J.; Wang, J.; Shi, P.; Zhang, Y.; Yu, C. The impact of climate change and anthropogenic activities on alpine grassland over the Qinghai-Tibet Plateau. Agric. For. Meteorol. 2014, 189, 11–18. [Google Scholar] [CrossRef]
  2. Wang, J.; Li, M.; Yu, C.; Fu, G. The change in environmental variables linked to climate change has a stronger effect on aboveground net primary productivity than does phenological change in alpine grasslands. Front. Plant Sci. 2021, 12, 798633. [Google Scholar] [CrossRef] [PubMed]
  3. Han, F.; Fu, G.; Yu, C.; Wang, S. Modeling Nutrition Quality and Storage of Forage Using Climate Data and Normalized-Difference Vegetation Index in Alpine Grasslands. Remote Sens. 2022, 14, 3410. [Google Scholar] [CrossRef]
  4. Fu, G.; Wang, J.; Li, S. Response of forage nutritional quality to climate change and human activities in alpine grasslands. Sci. Total Environ. 2022, 845, 157552. [Google Scholar] [CrossRef]
  5. Tian, Y.; Fu, G. Quantifying plant species α-diversity using normalized difference vegetation index and climate data in alpine grasslands. Remote Sens. 2022, 14, 5007. [Google Scholar] [CrossRef]
  6. Yu, C.Q.; Wang, J.W.; Shen, Z.X.; Fu, G. Effects of experimental warming and increased precipitation on soil respiration in an alpine meadow in the Northern Tibetan Plateau. Sci. Total Environ. 2019, 647, 1490–1497. [Google Scholar] [CrossRef]
  7. Fu, G.; Zhang, H.R.; Sun, W. Response of plant production to growing/non-growing season asymmetric warming in an alpine meadow of the Northern Tibetan Plateau. Sci. Total Environ. 2019, 650, 2666–2673. [Google Scholar] [CrossRef]
  8. Sun, J.; Hou, G.; Liu, M.; Fu, G.; Zhan, T.; Zhou, H.; Tsunekawa, A.; Haregeweyn, N. Effects of climatic and grazing changes on desertification of alpine grasslands, Northern Tibet. Ecol. Indic. 2019, 107, 105647. [Google Scholar] [CrossRef]
  9. Han, F.S.; Yu, C.Q.; Fu, G. Warming alters elevation distributions of soil bacterial and fungal communities in alpine grasslands. Glob. Ecol. Conserv. 2022, 39, e02306. [Google Scholar] [CrossRef]
  10. Zha, X.; Tian, Y.; Ou, Z.; Fu, G. Response of forage nutrient storages to grazing in alpine grasslands. Front. Plant Sci. 2022, 13, 991287. [Google Scholar] [CrossRef]
  11. Mao, W.; Zhang, T.; Li, Y. Allometric response of perennial Pennisetum centrasiaticum Tzvel to nutrient and water limitation in the Horqin Sand Land of China. J. Arid Land 2012, 4, 161–170. [Google Scholar] [CrossRef] [Green Version]
  12. Zhang, G.; Shen, Z.; Fu, G. Function diversity of soil fungal community has little exclusive effects on the response of aboveground plant production to experimental warming in alpine grasslands. Appl. Soil Ecol. 2021, 168, 104153. [Google Scholar] [CrossRef]
  13. Zhong, Z.; Fu, G. Response of soil fungal species, phylogenetic and functional diversity to diurnal asymmetric warming in an alpine agricultural ecosystem. Agr. Ecosyst. Environ. 2022, 335, 107993. [Google Scholar] [CrossRef]
  14. Yu, C.Q.; Han, F.S.; Fu, G. Effects of 7 years experimental warming on soil bacterial and fungal community structure in the Northern Tibet alpine meadow at three elevations. Sci. Total Environ. 2019, 655, 814–822. [Google Scholar] [CrossRef]
  15. Zhang, H.; Fu, G. Responses of plant, soil bacterial and fungal communities to grazing vary with pasture seasons and grassland types, northern Tibet. Land Degrad. Dev. 2021, 32, 1821–1832. [Google Scholar] [CrossRef]
  16. Zong, N.; Fu, G. Variations in species and function diversity of soil fungal community along a desertification gradient in an alpine steppe. Ecol. Indic. 2021, 131, 108197. [Google Scholar] [CrossRef]
  17. Liu, C.; Cui, Y.; Li, X.; Yao, M. microeco: An R package for data mining in microbial community ecology. FEMS Microbiol. Ecol. 2021, 97, fiaa255. [Google Scholar] [CrossRef]
  18. Sun, W.; Li, S.; Wang, J.; Fu, G. Effects of grazing on plant species and phylogenetic diversity in alpine grasslands, Northern Tibet. Ecol. Eng. 2021, 170, 106331. [Google Scholar] [CrossRef]
  19. Fu, G.; Shen, Z. Asymmetrical warming of growing/non-growing season increases soil respiration during growing season in an alpine meadow. Sci. Total Environ. 2022, 812, 152591. [Google Scholar] [CrossRef]
  20. Fu, G.; Sun, W. Temperature sensitivities of vegetation indices and aboveground biomass are primarily linked with warming magnitude in high-cold grasslands. Sci. Total Environ. 2022, 843, 157002. [Google Scholar] [CrossRef]
  21. Wang, J.; Yu, C.; Fu, G. Warming reconstructs the elevation distributions of aboveground net primary production, plant species and phylogenetic diversity in alpine grasslands. Ecol. Indic. 2021, 133, 108355. [Google Scholar] [CrossRef]
  22. Wang, J.W.; Yu, C.Q.; Fu, G. Asymmetrical warming between elevations may result in similar plant community composition between elevations in alpine grasslands. Front. Ecol. Evol. 2021, 9, 757943. [Google Scholar] [CrossRef]
  23. Rinnan, R.; Michelsen, A.; Baath, E.; Jonasson, S. Fifteen years of climate change manipulations alter soil microbial communities in a subarctic heath ecosystem. Glob. Chang. Biol. 2007, 13, 28–39. [Google Scholar] [CrossRef]
  24. Fu, G.; Sun, W.; Li, S.; Zhong, Z. Response of microbial communities in soil to multi-level warming in a highland barley system of the Lhasa River. J. Resour. Ecol. 2019, 10, 373–378. [Google Scholar]
  25. Xiong, J.; Peng, F.; Sun, H.; Xue, X.; Chu, H. Divergent responses of soil fungi functional groups to short-term warming. Microb. Ecol. 2014, 68, 708–715. [Google Scholar] [CrossRef]
  26. Xia, J.Y.; Chen, S.P.; Wan, S.G. Impacts of day versus night warming on soil microclimate: Results from a semiarid temperate steppe. Sci. Total Environ. 2010, 408, 2807–2816. [Google Scholar] [CrossRef]
  27. Fu, G.; Shen, Z.X.; Zhang, X.Z. Increased precipitation has stronger effects on plant production of an alpine meadow than does experimental warming in the Northern Tibetan Plateau. Agr. For. Meteorol. 2018, 249, 11–21. [Google Scholar] [CrossRef]
  28. Rui, Y.C.; Wang, Y.F.; Chen, C.R.; Zhou, X.Q.; Wang, S.P.; Xu, Z.H.; Duan, J.C.; Kang, X.M.; Lu, S.B.; Luo, C.Y. Warming and grazing increase mineralization of organic P in an alpine meadow ecosystem of Qinghai-Tibet Plateau, China. Plant Soil 2012, 357, 73–87. [Google Scholar] [CrossRef]
  29. Ogwu, M.C.; Kerfahi, D.; Song, H.; Dong, K.; Seo, H.; Lim, S.; Srinivasan, S.; Kim, M.K.; Waldman, B.; Adams, J.M. Changes in soil taxonomic and functional diversity resulting from gamma irradiation. Sci. Rep. 2019, 9, 7894. [Google Scholar] [CrossRef] [Green Version]
  30. Zhang, H.; Fu, G. Responses of phylogenetic diversity of soil fungal community to grazing in alpine grasslands of the Northern Tibet. Acta Agrestia Sin. 2022, 30, 21–28. [Google Scholar]
  31. Zhou, J.Z.; Ning, D.L. Stochastic community assembly: Does it matter in microbial ecology? Microbiol. Mol. Biol. Rev. 2017, 81, e00002-17. [Google Scholar] [CrossRef] [PubMed] [Green Version]
  32. Violle, C.; Nemergut, D.R.; Pu, Z.C.; Jiang, L. Phylogenetic limiting similarity and competitive exclusion. Ecol. Lett. 2011, 14, 782–787. [Google Scholar] [CrossRef]
  33. Hahn, P.G.; Buffington, L.; Larkin, B.; LaFlamme, K.; Maron, J.L.; Lekberg, Y. Effects of short- and long-term variation in resource conditions on soil fungal communities and plant responses to soil biota. Front. Plant Sci. 2018, 9, 1605. [Google Scholar] [CrossRef] [PubMed]
  34. Chesson, P. Mechanisms of maintenance of species diversity. Annu. Rev. Ecol. Syst. 2000, 31, 343–366. [Google Scholar] [CrossRef]
  35. Li, W.H. An overview of ecological research conducted on the Qinghai-Tibetan Plateau. J. Resour. Ecol. 2017, 8, 1–4. [Google Scholar]
Figure 1. Relative impacts of environmental variables on total abundance of soil fungal community for (a) topsoil and (b) subtopsoil. The * above the bar indicated this variable had a significant influence on total abundance of soil fungal community at p < 0.05 level. MAT: mean annual temperature in 1982–2020; MAP: mean annual precipitation in 1982–2020; AT2020: annual temperature in 2020; AP2020: annual precipitation in 2020; EC: soil electrical conductivity; pH: soil pH; SOC: soil organic carbon; TN: soil total nitrogen; TP: soil total phosphorus; TK: soil total potassium; NH4+-N: soil ammonium nitrogen; NO3-N: soil nitrate nitrogen; AP: soil available phosphorus; AK: soil available potassium; C:N: ratio of SOC to TN; C:P: ratio of SOC to TP; C:K: ratio of SOC to TK; N:P: ratio of TN to TP; N:K: ratio of TN to TK; P:K: ratio of TP to TK; available N:P: ratio of available nitrogen to phosphorus; available N:K: ratio of available nitrogen to potassium; available P:K: ratio of available phosphorus to potassium.
Jof 08 01230 g001aJof 08 01230 g001b
Figure 2. Relative impacts of environmental variables on (a,b) operational taxonomic units (OTUs), (c,d) Chao1s, (e,f) ACEs, (g,h) Shannons and (i,j) Simpsons for (a,c,e,g,i) topsoil and (b,d,f,h,j) subtopsoil, respectively. The * above the bar indicated this variable had a significant influence on species α-diversity of soil fungal community at p < 0.05 level. MAT: mean annual temperature in 1982–2020; MAP: mean annual precipitation in 1982–2020; AT2020: annual temperature in 2020; AP2020: annual precipitation in 2020; EC: soil electrical conductivity; pH: soil pH; SOC: soil organic carbon; TN: soil total nitrogen; TP: soil total phosphorus; TK: soil total potassium; NH4+-N: soil ammonium nitrogen; NO3-N: soil nitrate nitrogen; AP: soil available phosphorus; AK: soil available potassium; C:N: ratio of SOC to TN; C:P: ratio of SOC to TP; C:K: ratio of SOC to TK; N:P: ratio of TN to TP; N:K: ratio of TN to TK; P:K: ratio of TP to TK; available N:P: ratio of available nitrogen to phosphorus; available N:K: ratio of available nitrogen to potassium; available P:K: ratio of available phosphorus to potassium.
Jof 08 01230 g002aJof 08 01230 g002b
Figure 3. Relative impacts of environmental variables on (a,b) Faith’s phylogenetic diversity (PD), and (c,d) mean nearest taxon distance (MNTD) for (a,c) topsoil and (b,d) subtopsoil, respectively. The * above the bar indicated this variable had a significant influence on phylogenetic α-diversity of soil fungal community at p < 0.05 level. MAT: mean annual temperature in 1982–2020; MAP: mean annual precipitation in 1982–2020; AT2020: annual temperature in 2020; AP2020: annual precipitation in 2020; EC: soil electrical conductivity; pH: soil pH; SOC: soil organic carbon; TN: soil total nitrogen; TP: soil total phosphorus; TK: soil total potassium; NH4+-N: soil ammonium nitrogen; NO3-N: soil nitrate nitrogen; AP: soil available phosphorus; AK: soil available potassium; C:N: ratio of SOC to TN; C:P: ratio of SOC to TP; C:K: ratio of SOC to TK; N:P: ratio of TN to TP; N:K: ratio of TN to TK; P:K: ratio of TP to TK; available N:P: ratio of available nitrogen to phosphorus; available N:K: ratio of available nitrogen to potassium; available P:K: ratio of available phosphorus to potassium.
Jof 08 01230 g003
Figure 4. Relative impacts of environmental variables on (a,b) guild numbers, (c,d) Chao1f, (e,f) ACEf, (g,h) Shannonf and (i,j) Simpsonf for (a,c,e,g,i) topsoil and (b,d,f,h,j) subtopsoil, respectively. The * above the bar indicated this variable had a significant influence on function α-diversity of soil fungal community at p < 0.05 level. MAT: mean annual temperature in 1982–2020; MAP: mean annual precipitation in 1982–2020; AT2020: annual temperature in 2020; AP2020: annual precipitation in 2020; EC: soil electrical conductivity; pH: soil pH; SOC: soil organic carbon; TN: soil total nitrogen; TP: soil total phosphorus; TK: soil total potassium; NH4+-N: soil ammonium nitrogen; NO3-N: soil nitrate nitrogen; AP: soil available phosphorus; AK: soil available potassium; C:N: ratio of SOC to TN; C:P: ratio of SOC to TP; C:K: ratio of SOC to TK; N:P: ratio of TN to TP; N:K: ratio of TN to TK; P:K: ratio of TP to TK; available N:P: ratio of available nitrogen to phosphorus; available N:K: ratio of available nitrogen to potassium; available P:K: ratio of available phosphorus to potassium.
Jof 08 01230 g004aJof 08 01230 g004b
Figure 5. The mutual as well as excluded impacts of geographic variables, climatic variables, soil variables and plant variables on total abundance for (a) topsoil and (b) subtopsoil, respectively.
Jof 08 01230 g005
Figure 6. The mutual as well as excluded impacts of geographic variables, climatic variables, soil variables and plant variables on (a,b) operational taxonomic units (OTUs), (c,d) Chao1s, (e,f) ACEs, (g,h) Shannons and (i,j) Simpsons of soil fungal community for (a,c,e,g,i) topsoil and (b,d,f,h,j) subtopsoil, respectively.
Jof 08 01230 g006aJof 08 01230 g006b
Figure 7. The mutual as well as excluded impacts of geographic variables, climatic variables, soil variables and plant variables on (a,b) Faith’s phylogenetic diversity (PD), and (c,d) mean nearest taxon distance (MNTD) of soil fungal community for (a,c) topsoil and (b,d) subtopsoil, respectively.
Jof 08 01230 g007
Figure 8. The mutual as well as excluded impacts of geographic variables, climatic variables, soil variables and plant variables on (a,b) guild numbers, (c,d) Chao1f, (e,f) ACEf, (g,h) Shannonf and (i,j) Simpsonf of soil fungal community for (a,c,e,g,i) topsoil and (b,d,f,h,j) subtopsoil, respectively.
Jof 08 01230 g008aJof 08 01230 g008b
Figure 9. The mutual as well as excluded impacts of geographic variables, climatic variables, soil variables and plant variables on (a,b) species β-diversity, (c,d) phylogenetic β-diversity, and (e,f) function β-diversity of soil fungal community for (a,c,e) topsoil and (b,d,f) subtopsoil, respectively.
Jof 08 01230 g009
Table 1. Partial mantel tests between β-diversity and environmental variables.
Soil DepthVariablesSpecies β-
Diversity
Phylogenetic β-
Diversity
Function β-
Diversity
0–10 cmLongitude0.19 ***0.06 +0.13 **
Latitude0.16 ***−0.010.03
Elevation0.24 ***0.010.04
MAT0.07 *0.08 *0.03
MAP0.16 ***0.000.12 *
AT20200.040.030.03
AP20200.16 ***0.08 +0.12 *
EC0.22***−0.070.15 **
pH0.19 ***0.13**−0.08
SOC0.19 ***−0.070.16 ***
TN0.20 ***−0.100.20 ***
TP−0.05−0.070.04
TK0.13 ***0.10 *−0.05
NH4+-N0.05 +0.08 *0.01
NO3-N0.040.08 +−0.02
AP−0.05−0.03−0.01
AK0.12 ***−0.050.09 **
C:N0.04−0.040.06 +
C:P0.16 ***−0.070.06 +
C:K0.19 ***−0.070.16 ***
N:P0.17 ***−0.090.09 *
N:K0.20 ***−0.100.21 ***
P:K−0.04−0.070.05
Available N:P0.000.07 +0.00
Available N:K0.13 ***0.08 **0.04
Available P:K0.14 ***−0.030.07 *
Plant height0.08 *0.030.09 *
Leaf area0.15 ***0.00−0.09
Stem diameter0.09 *0.020.06 +
10–20 cmLongitude0.17 ***0.10 *0.25 ***
Latitude0.14 ***-0.050.03
Elevation0.19 ***0.010.00
MAT0.11 **0.02−0.06
MAP0.08 *0.10 +0.23 ***
AT20200.08 **0.01−0.11
AP20200.050.19 **0.26 ***
EC0.13 ***0.020.08 *
pH0.19 ***0.010.00
SOC0.11 **−0.010.09 *
TN0.09 *−0.020.04
TP−0.020.070.01
TK0.12 ***0.010.05
NH4+-N0.12 ***0.13 **0.13 **
NO3-N0.15 ***−0.020.10 *
AP−0.040.020.04
AK0.09 **0.010.15 ***
C:N0.03−0.01−0.05
C:P0.13 ***0.000.03
C:K0.11 **−0.020.08 *
N:P0.11 **0.00−0.03
N:K0.09 *−0.030.04
P:K0.000.050.00
Available N:P0.08 *0.07 +0.00
Available N:K0.09 **0.07 +0.17 ***
Available P:K0.12 **−0.010.17 ***
Plant height0.14 ***0.000.18 ***
Stem diameter0.10 **0.06 +0.06
Leaf area0.18 ***−0.01−0.07
+, *, ** and *** indicates p < 0.10, p < 0.05, p < 0.01 and p < 0.001, respectively.
Publisher’s Note: MDPI stays neutral with regard to jurisdictional claims in published maps and institutional affiliations.

