
Mucochytrium quahogii (=QPX) Is a Commensal, Opportunistic Pathogen of the Hard Clam (Mercenaria mercenaria): Evidence and Implications for QPX Disease Management


Abstract
:
1. Introduction
2. Methods
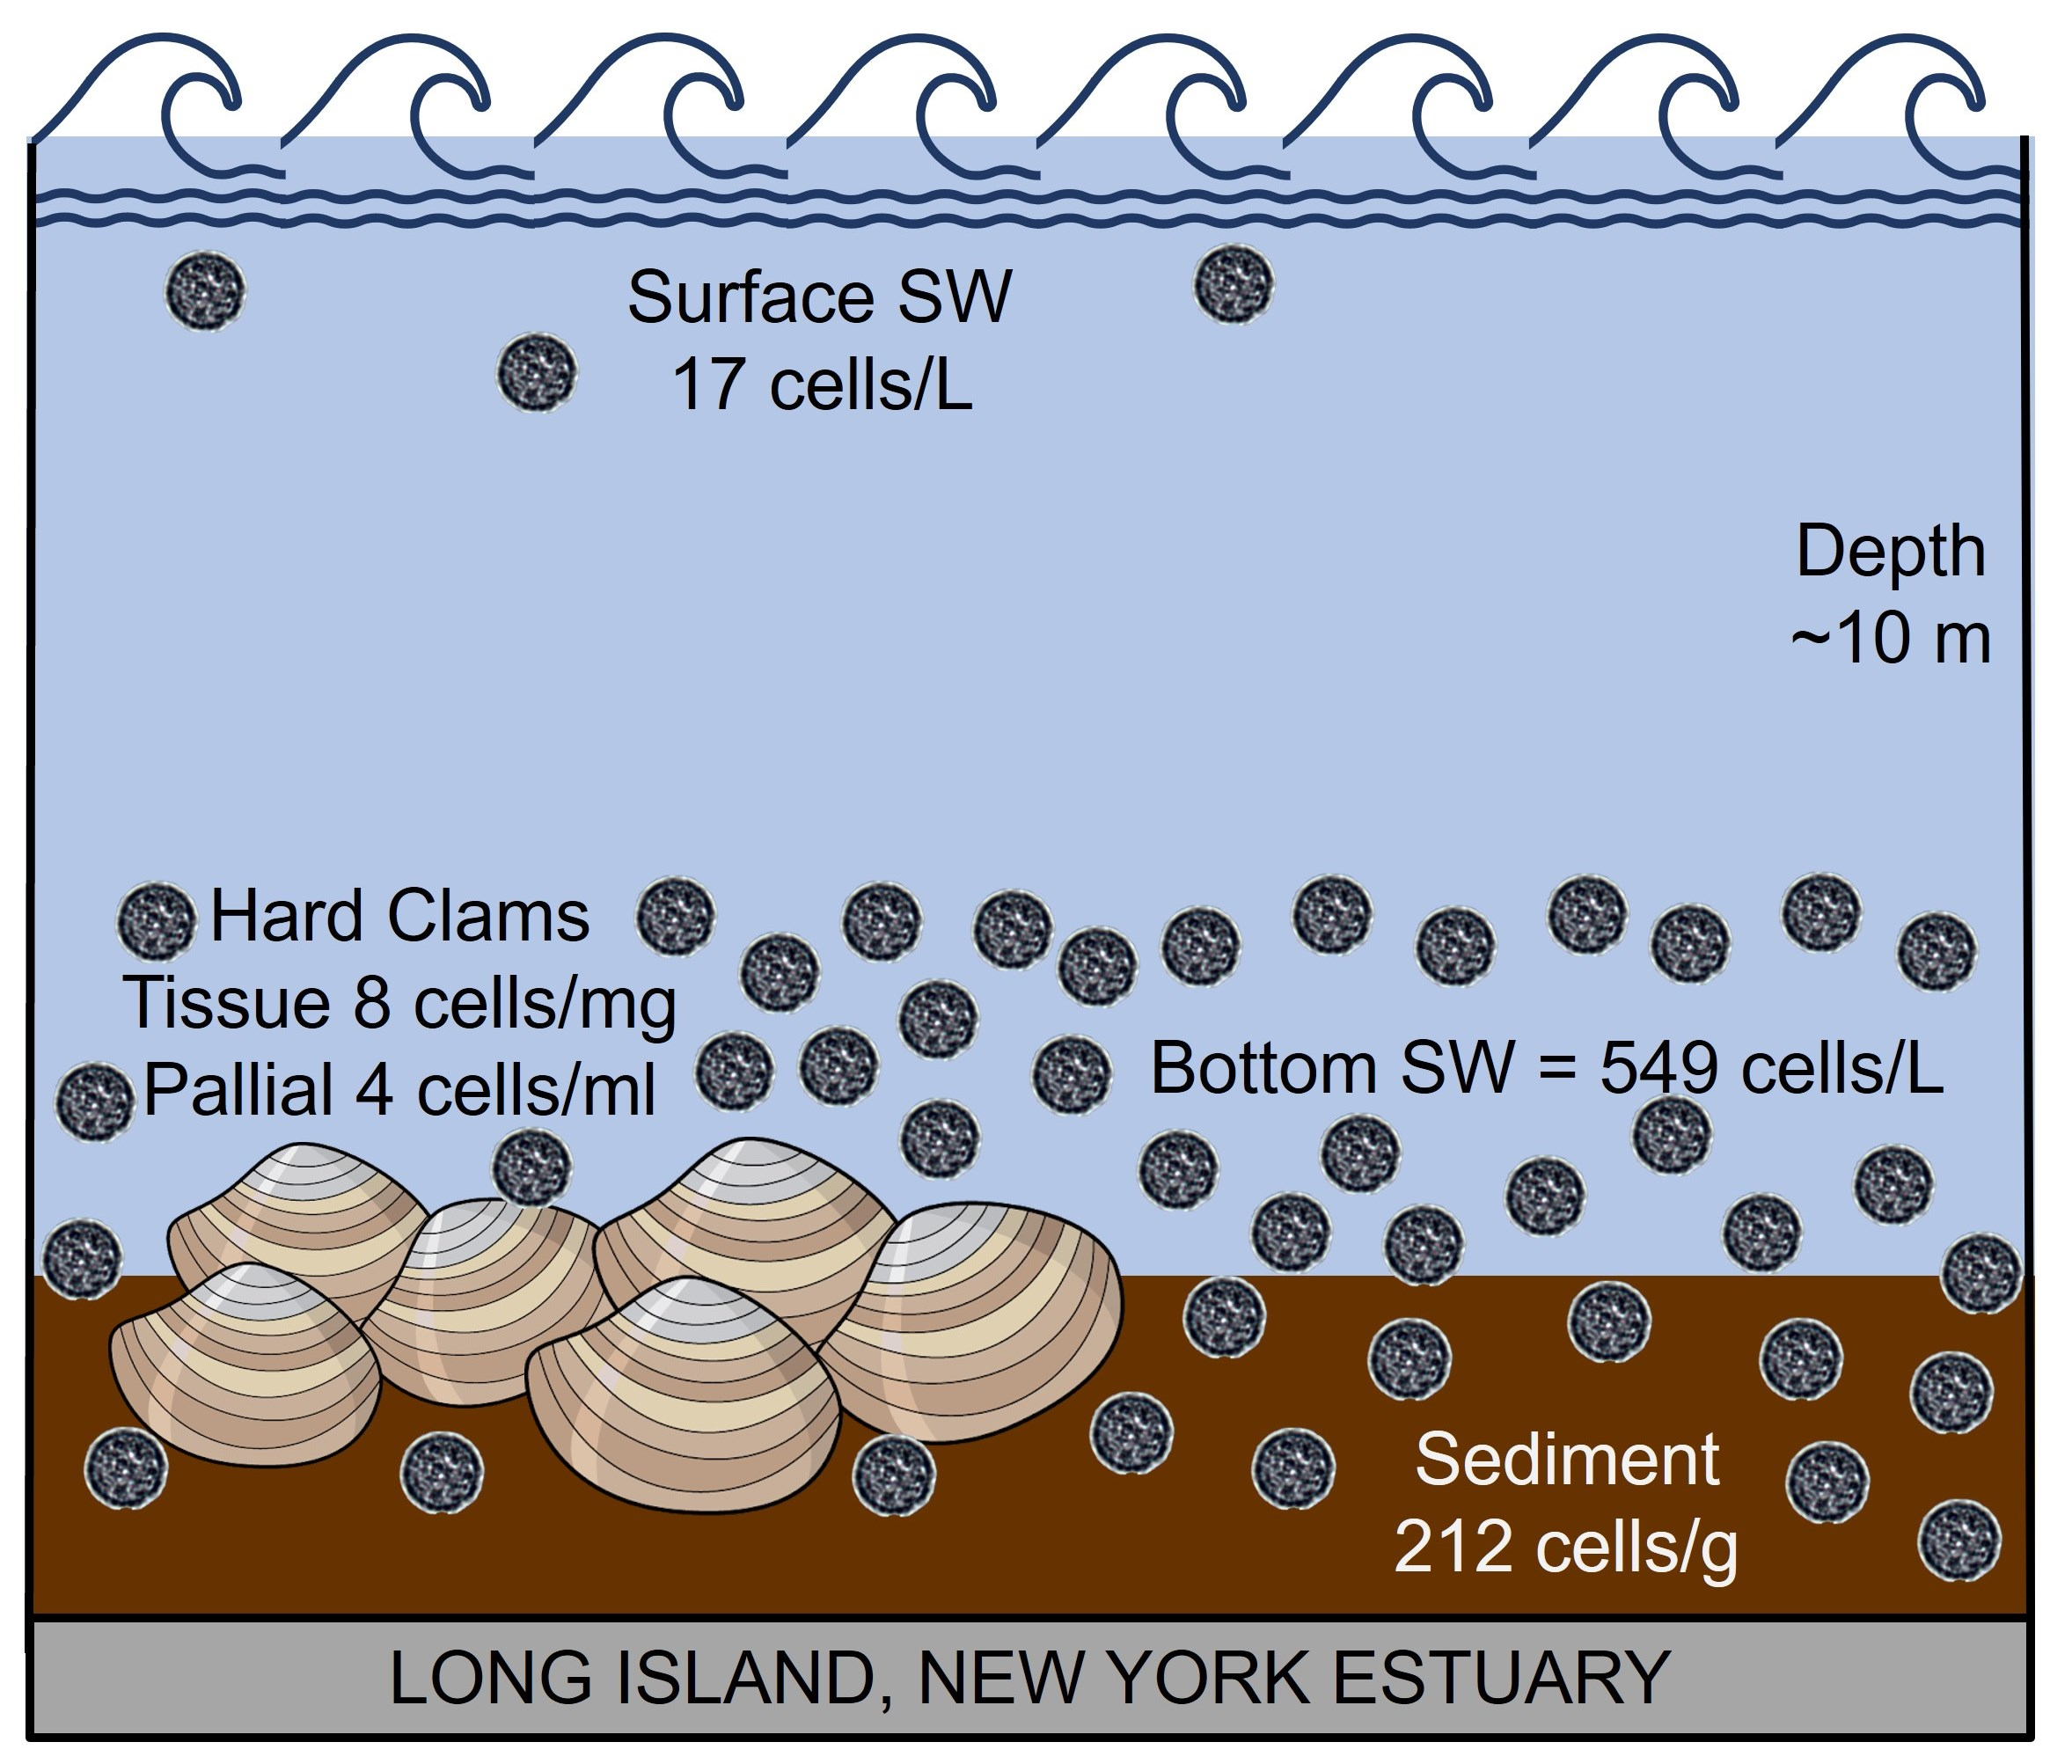
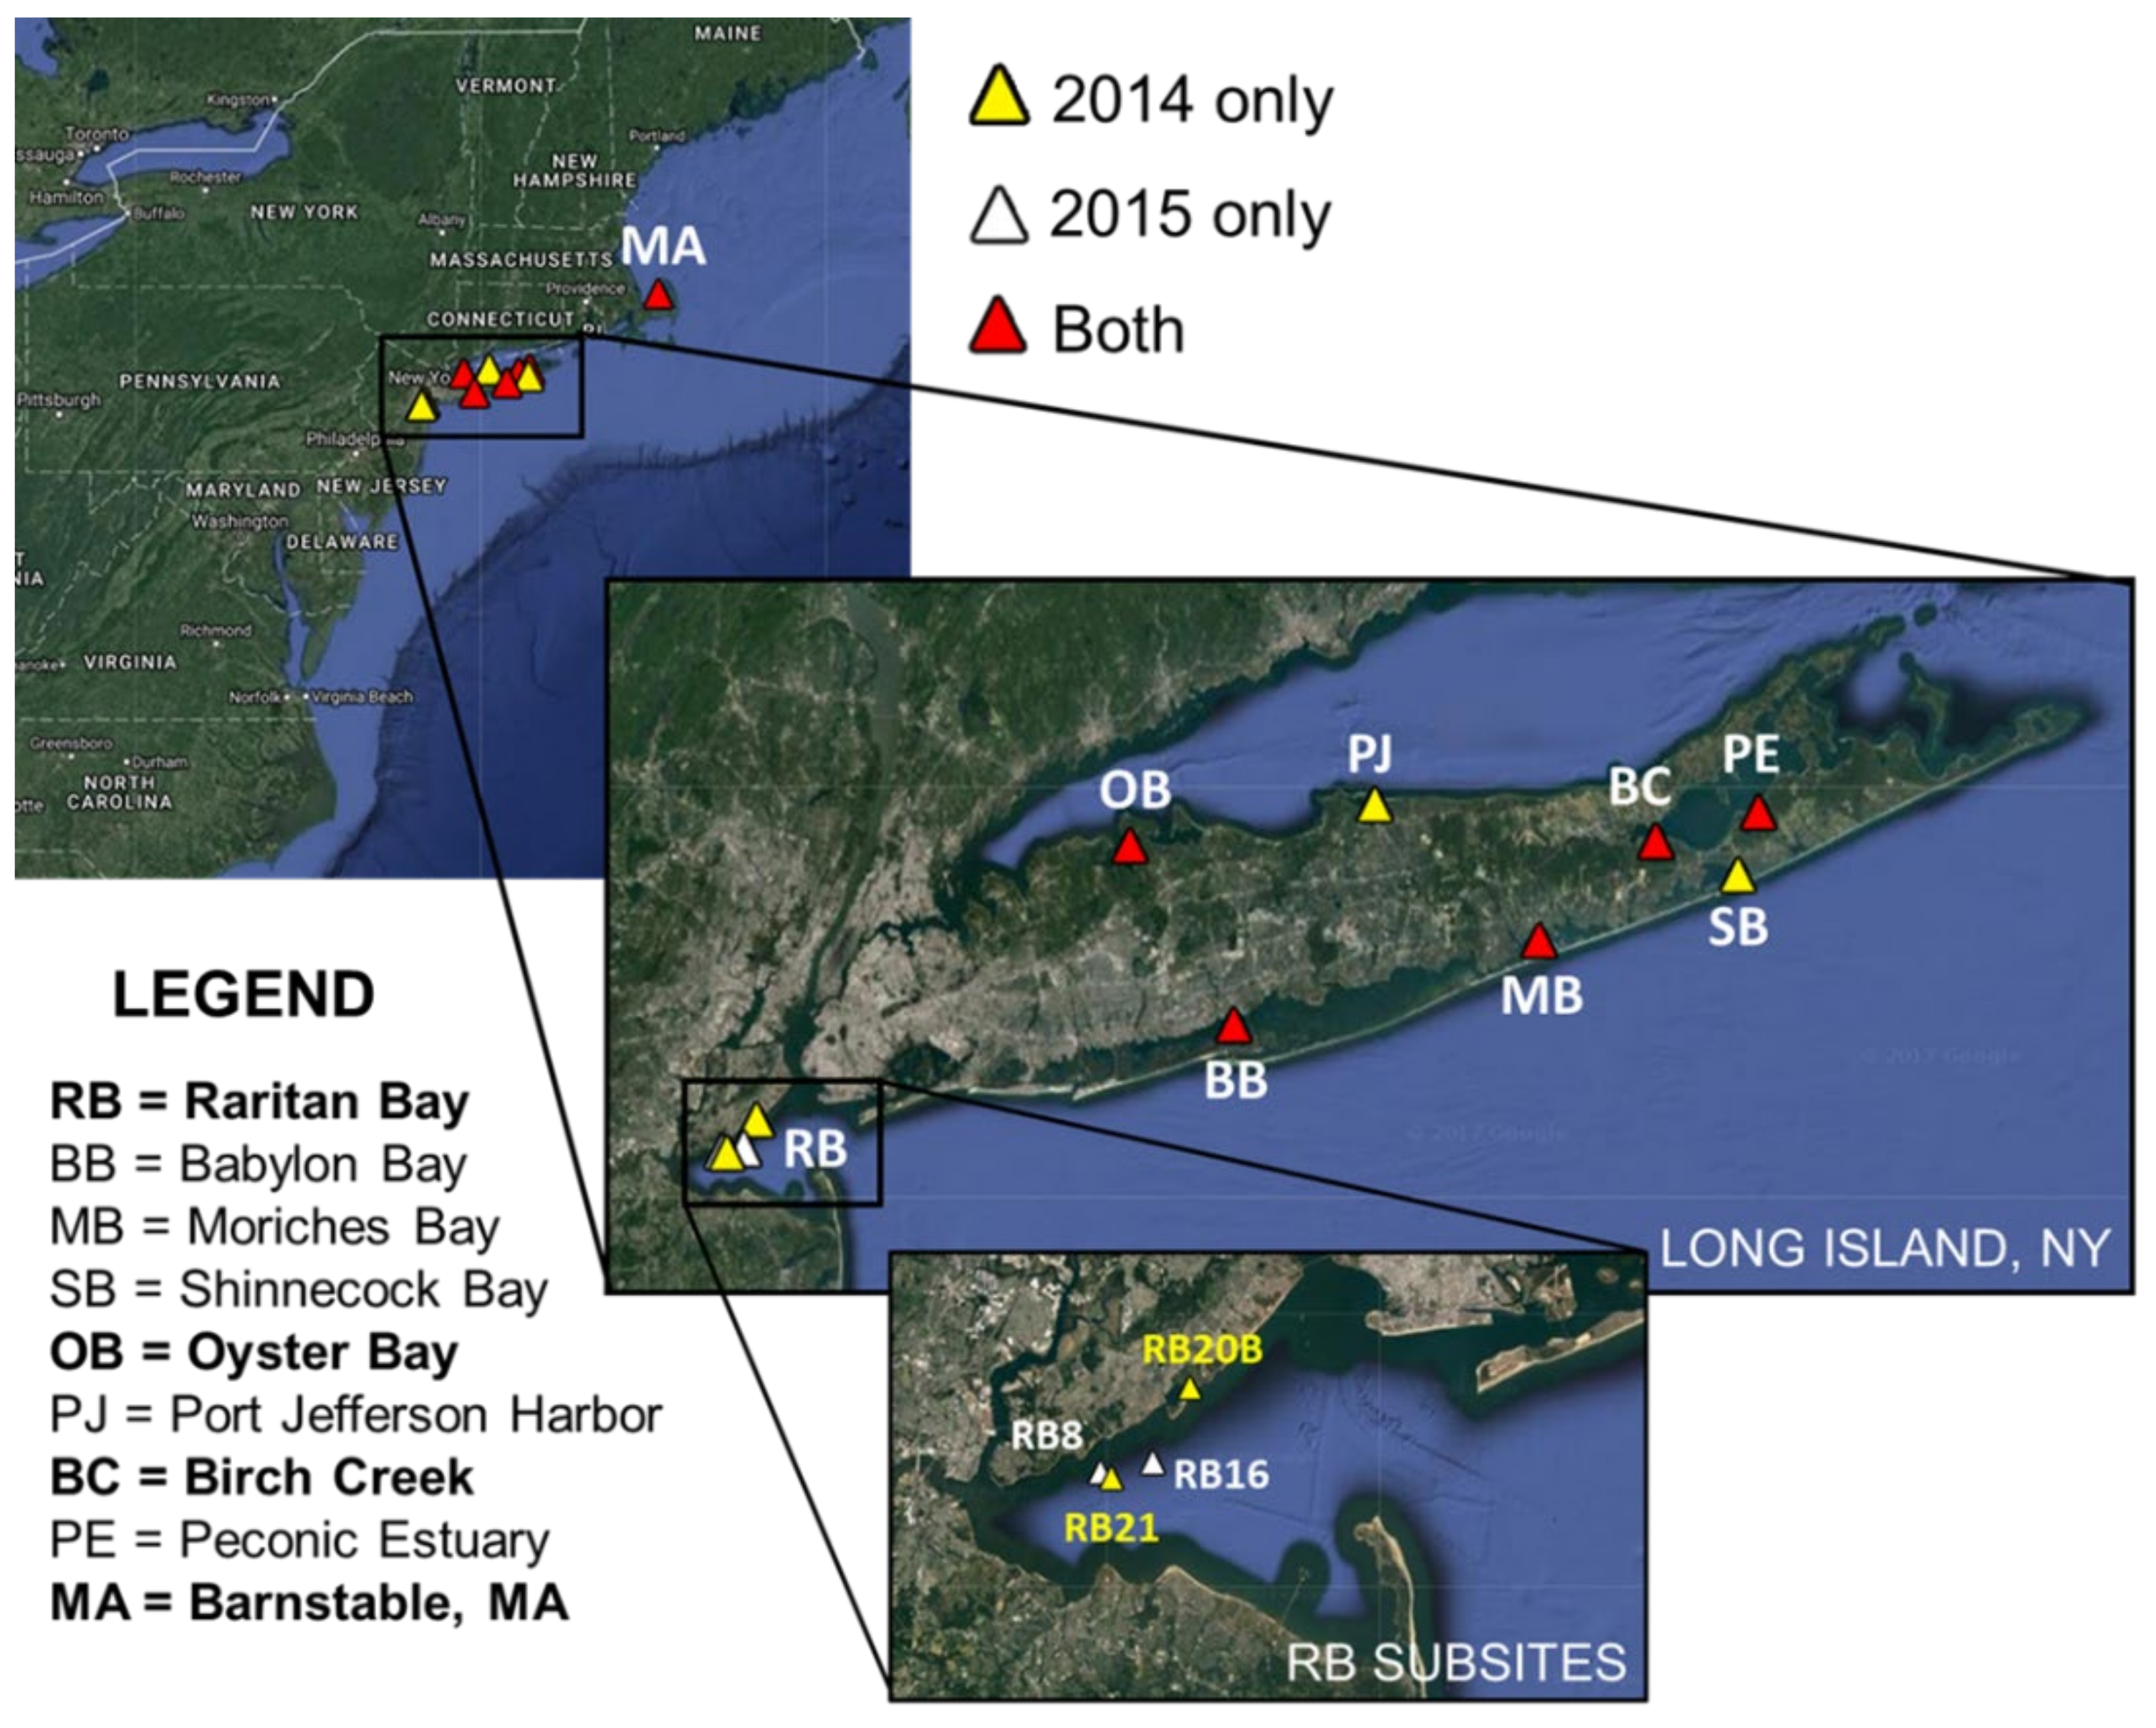
2.1. Sampling Sites
2.2. Sample Collection and Processing
2.3. Labyrinthulomycete Diversity in Hard Clam Pallial Fluid
2.4. Metadata
2.5. Data Analyses
3. Results
3.1. Environmental Parameters
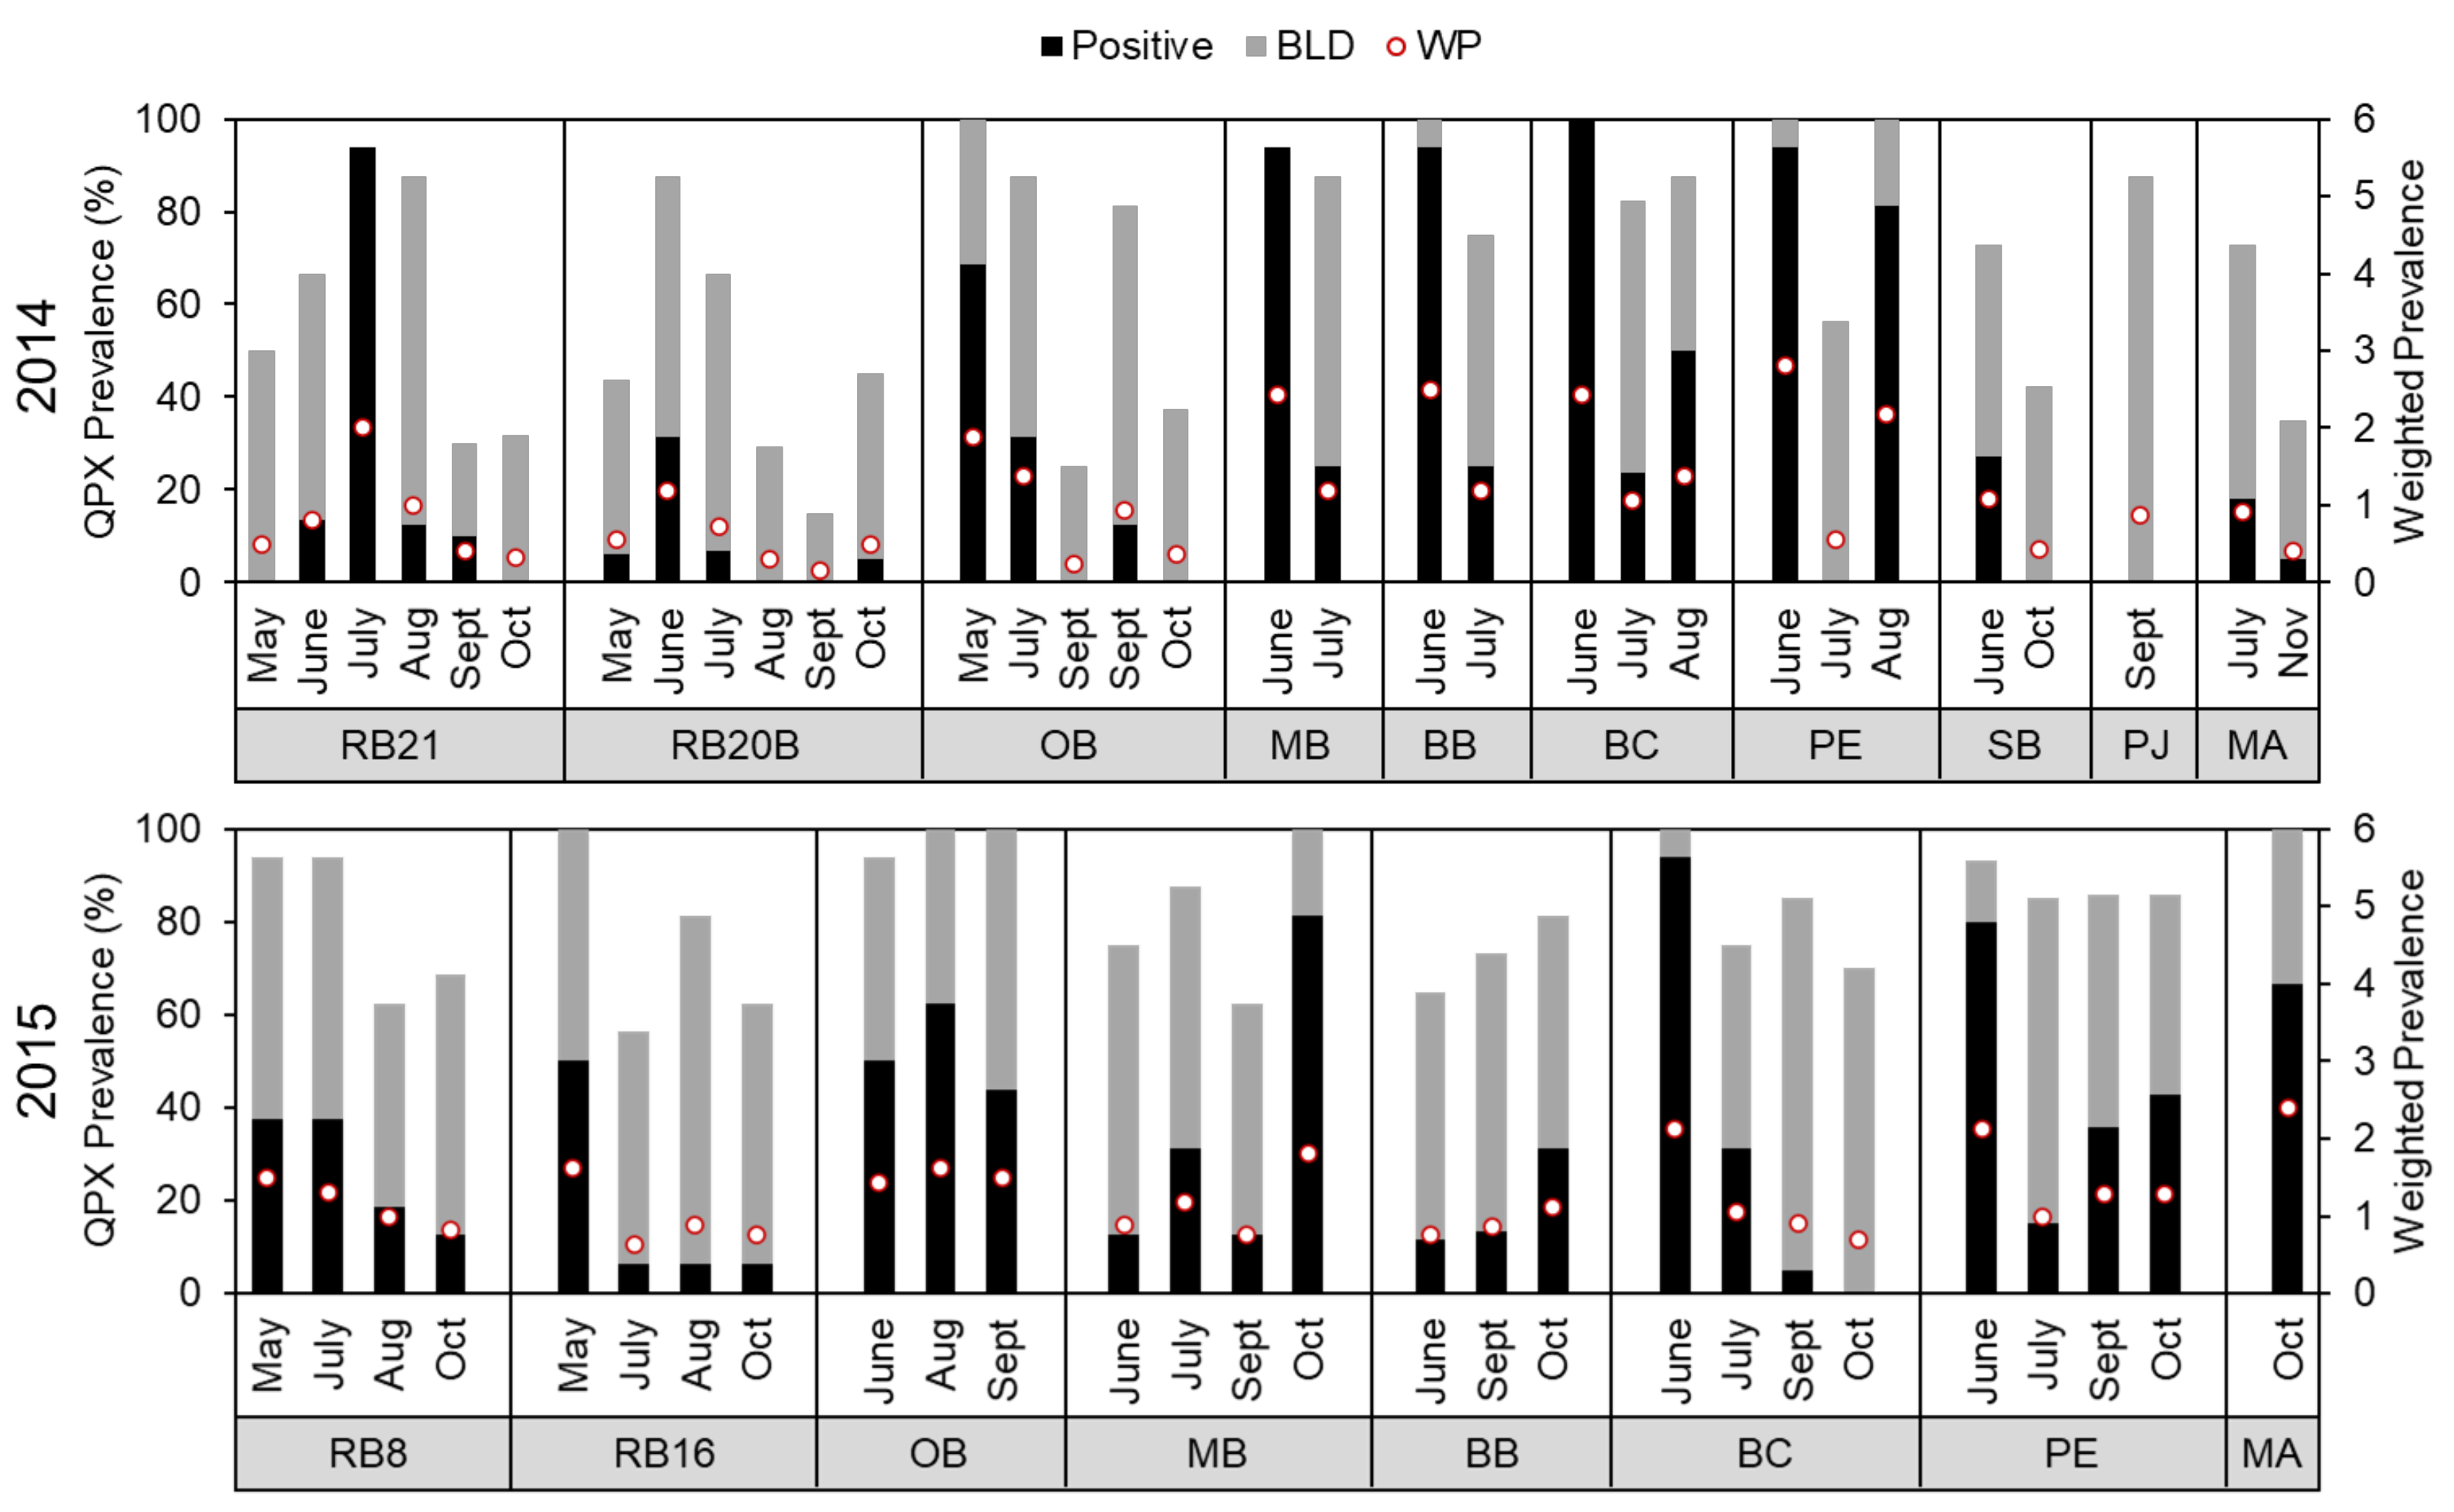
3.2. M. quahogii in Hard Clams
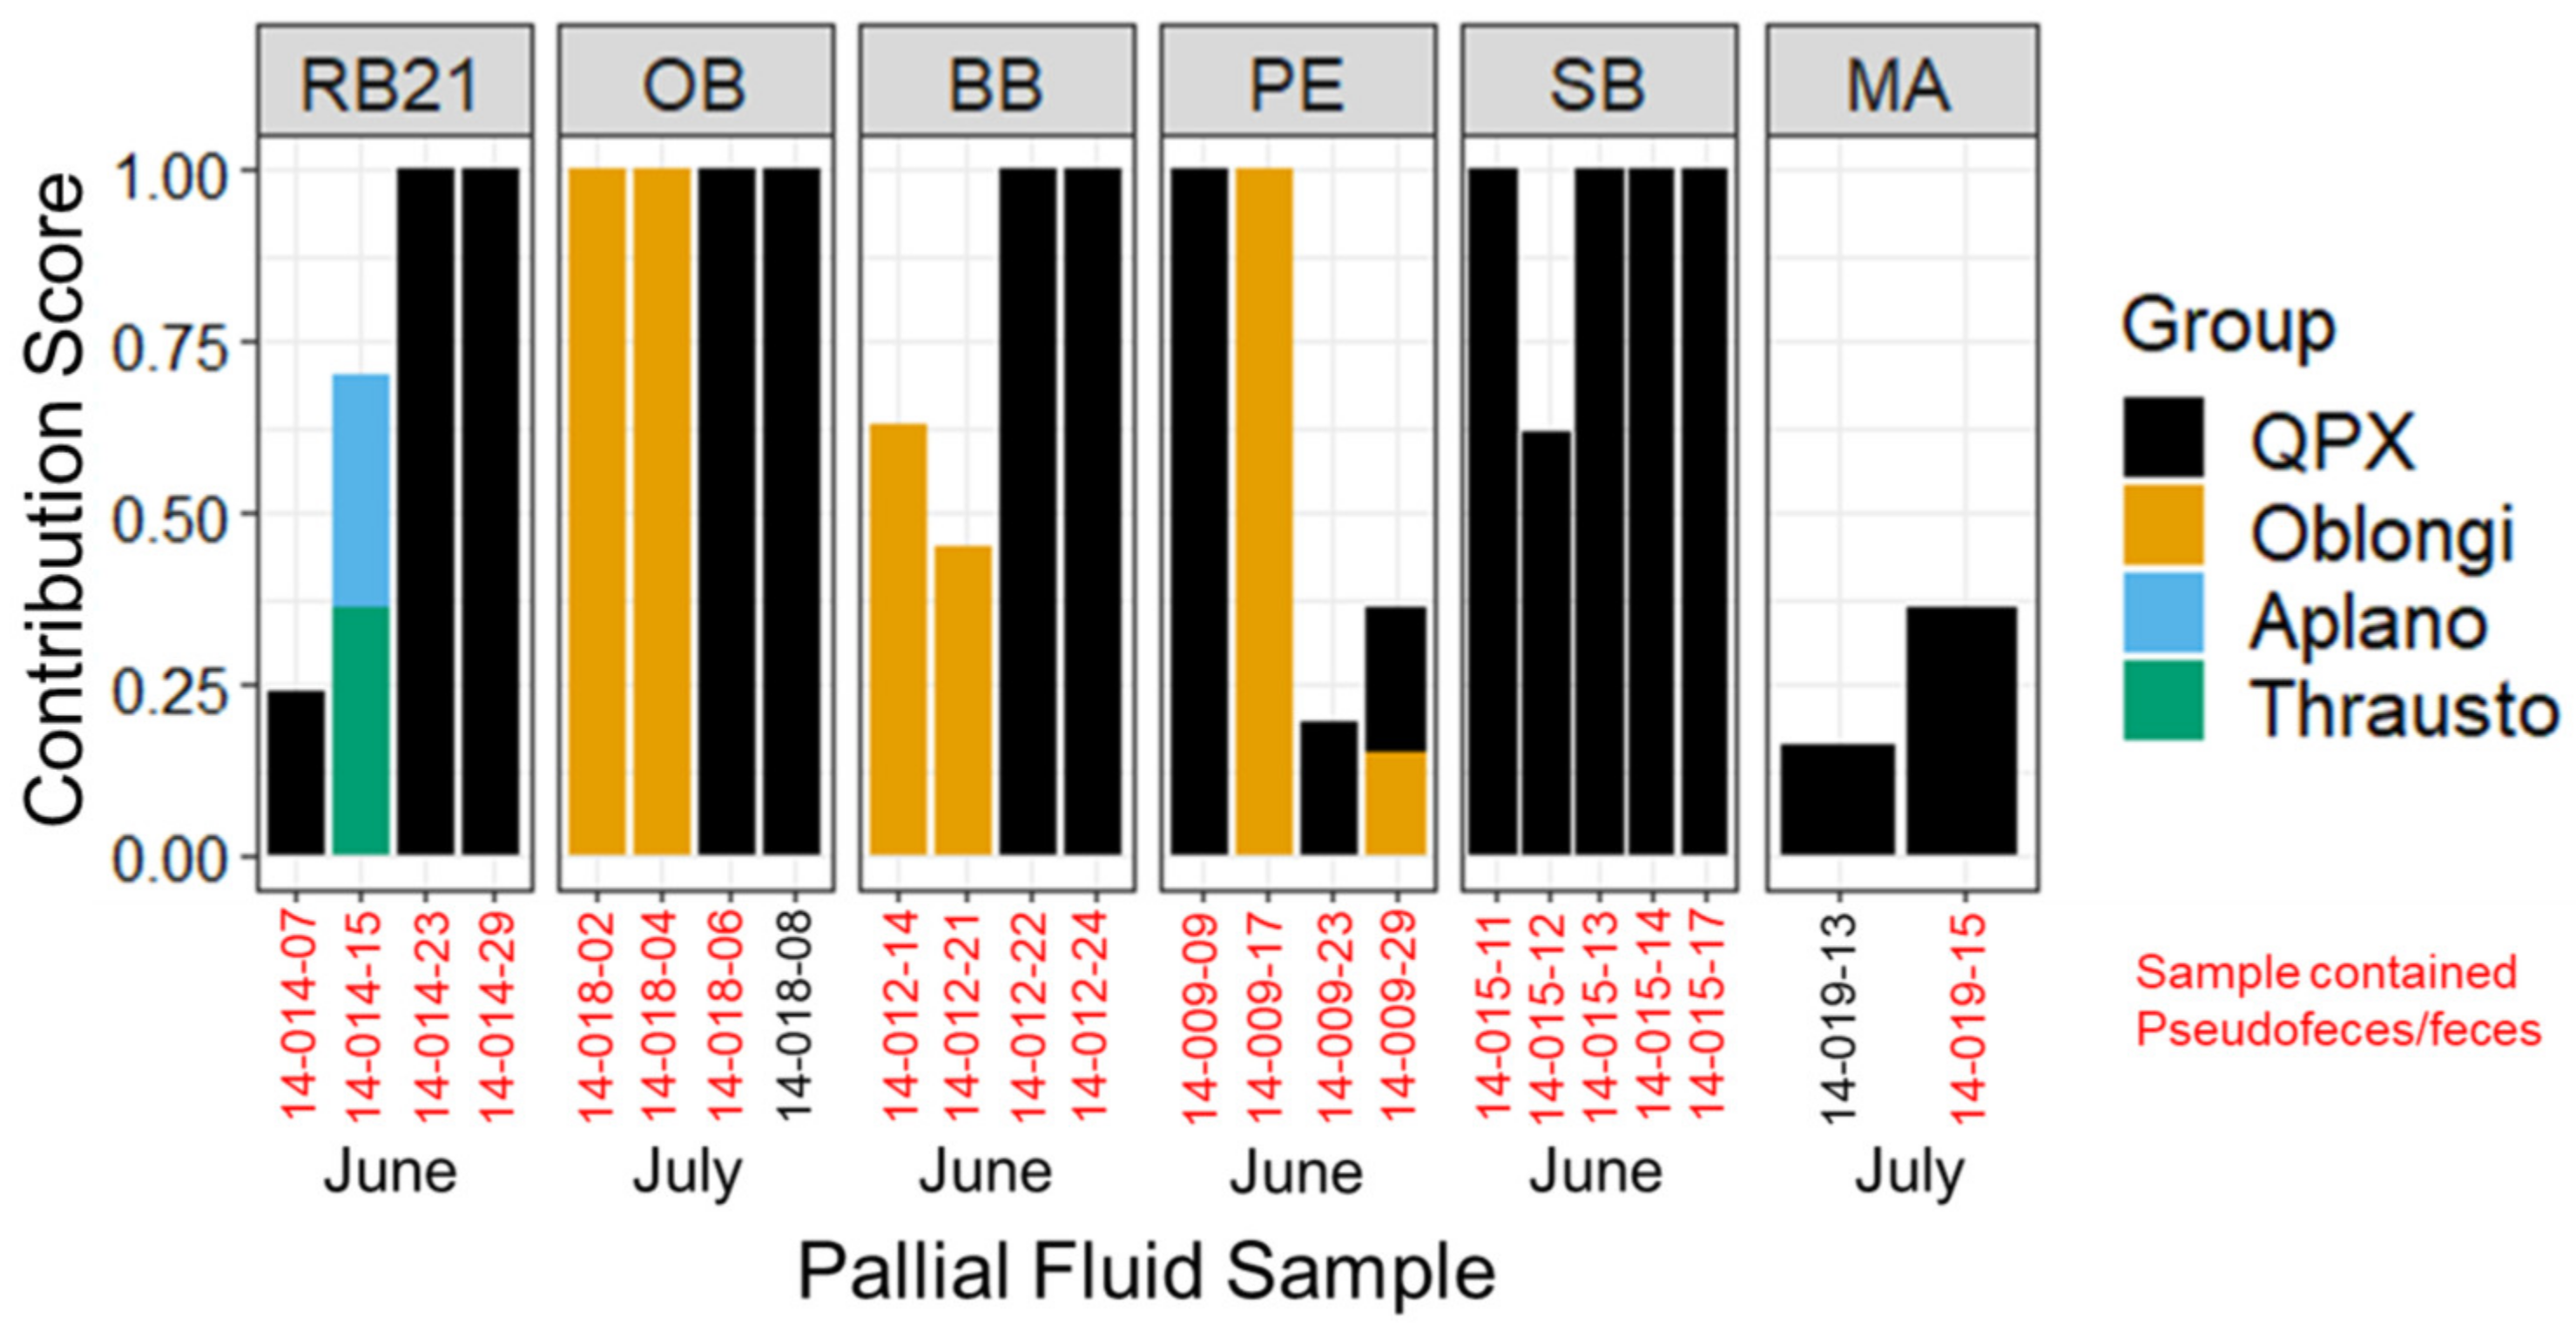
3.3. Labyrinthulomycete Composition of Hard Clam Pallial Fluid
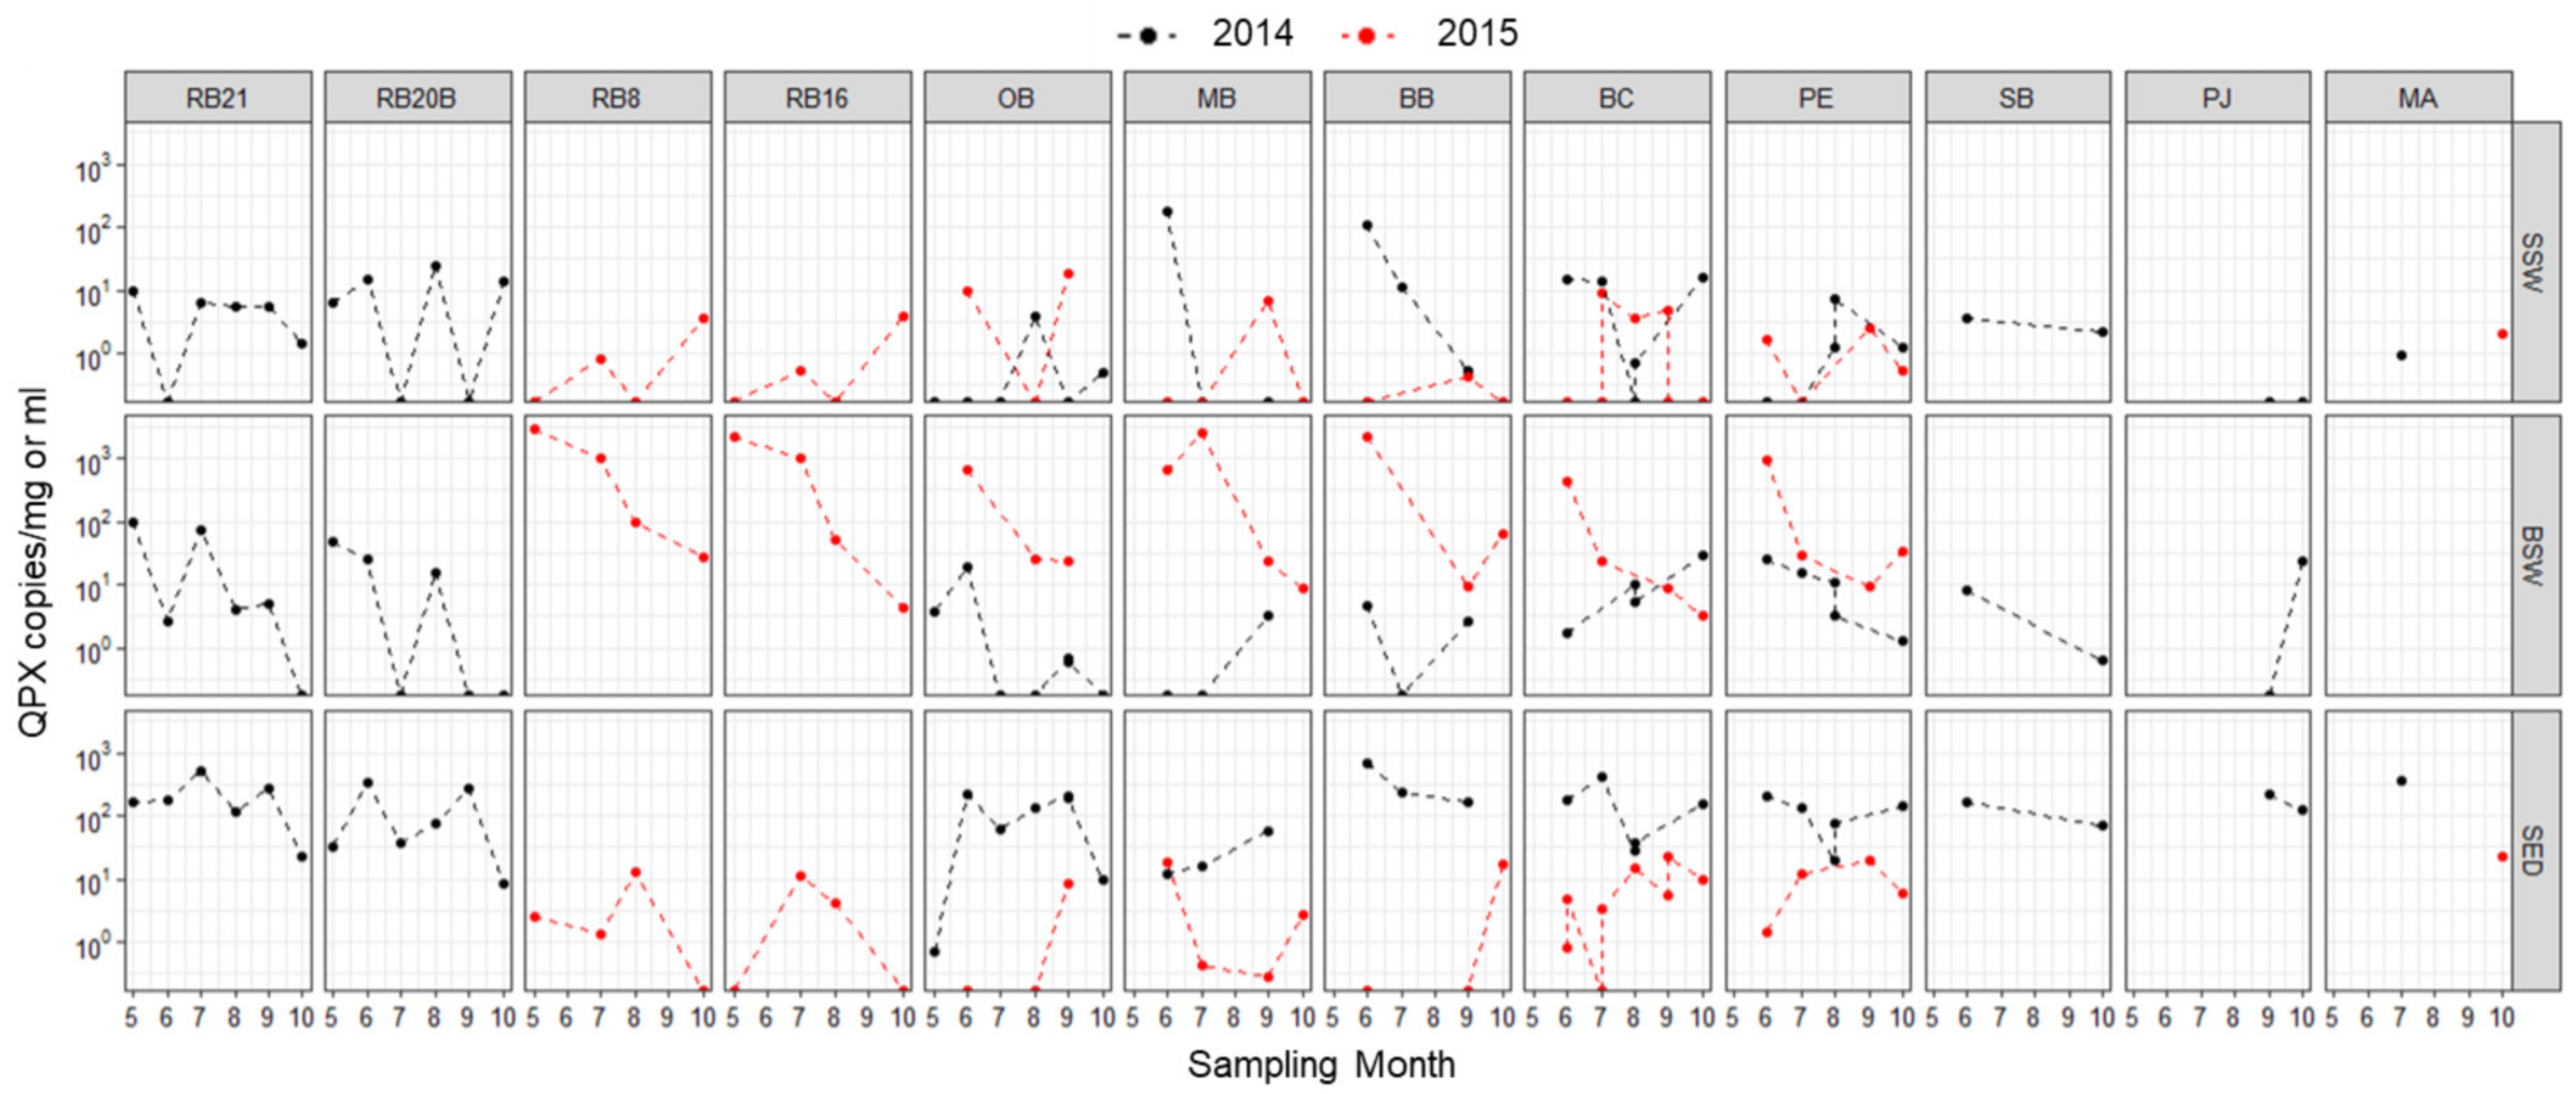
3.4. M. quahogii and Labyrinthulomycetes in the Environment
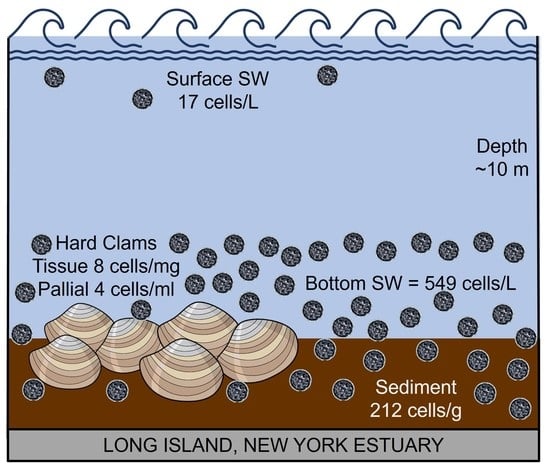
3.5. Conversion to Cellular Concentration
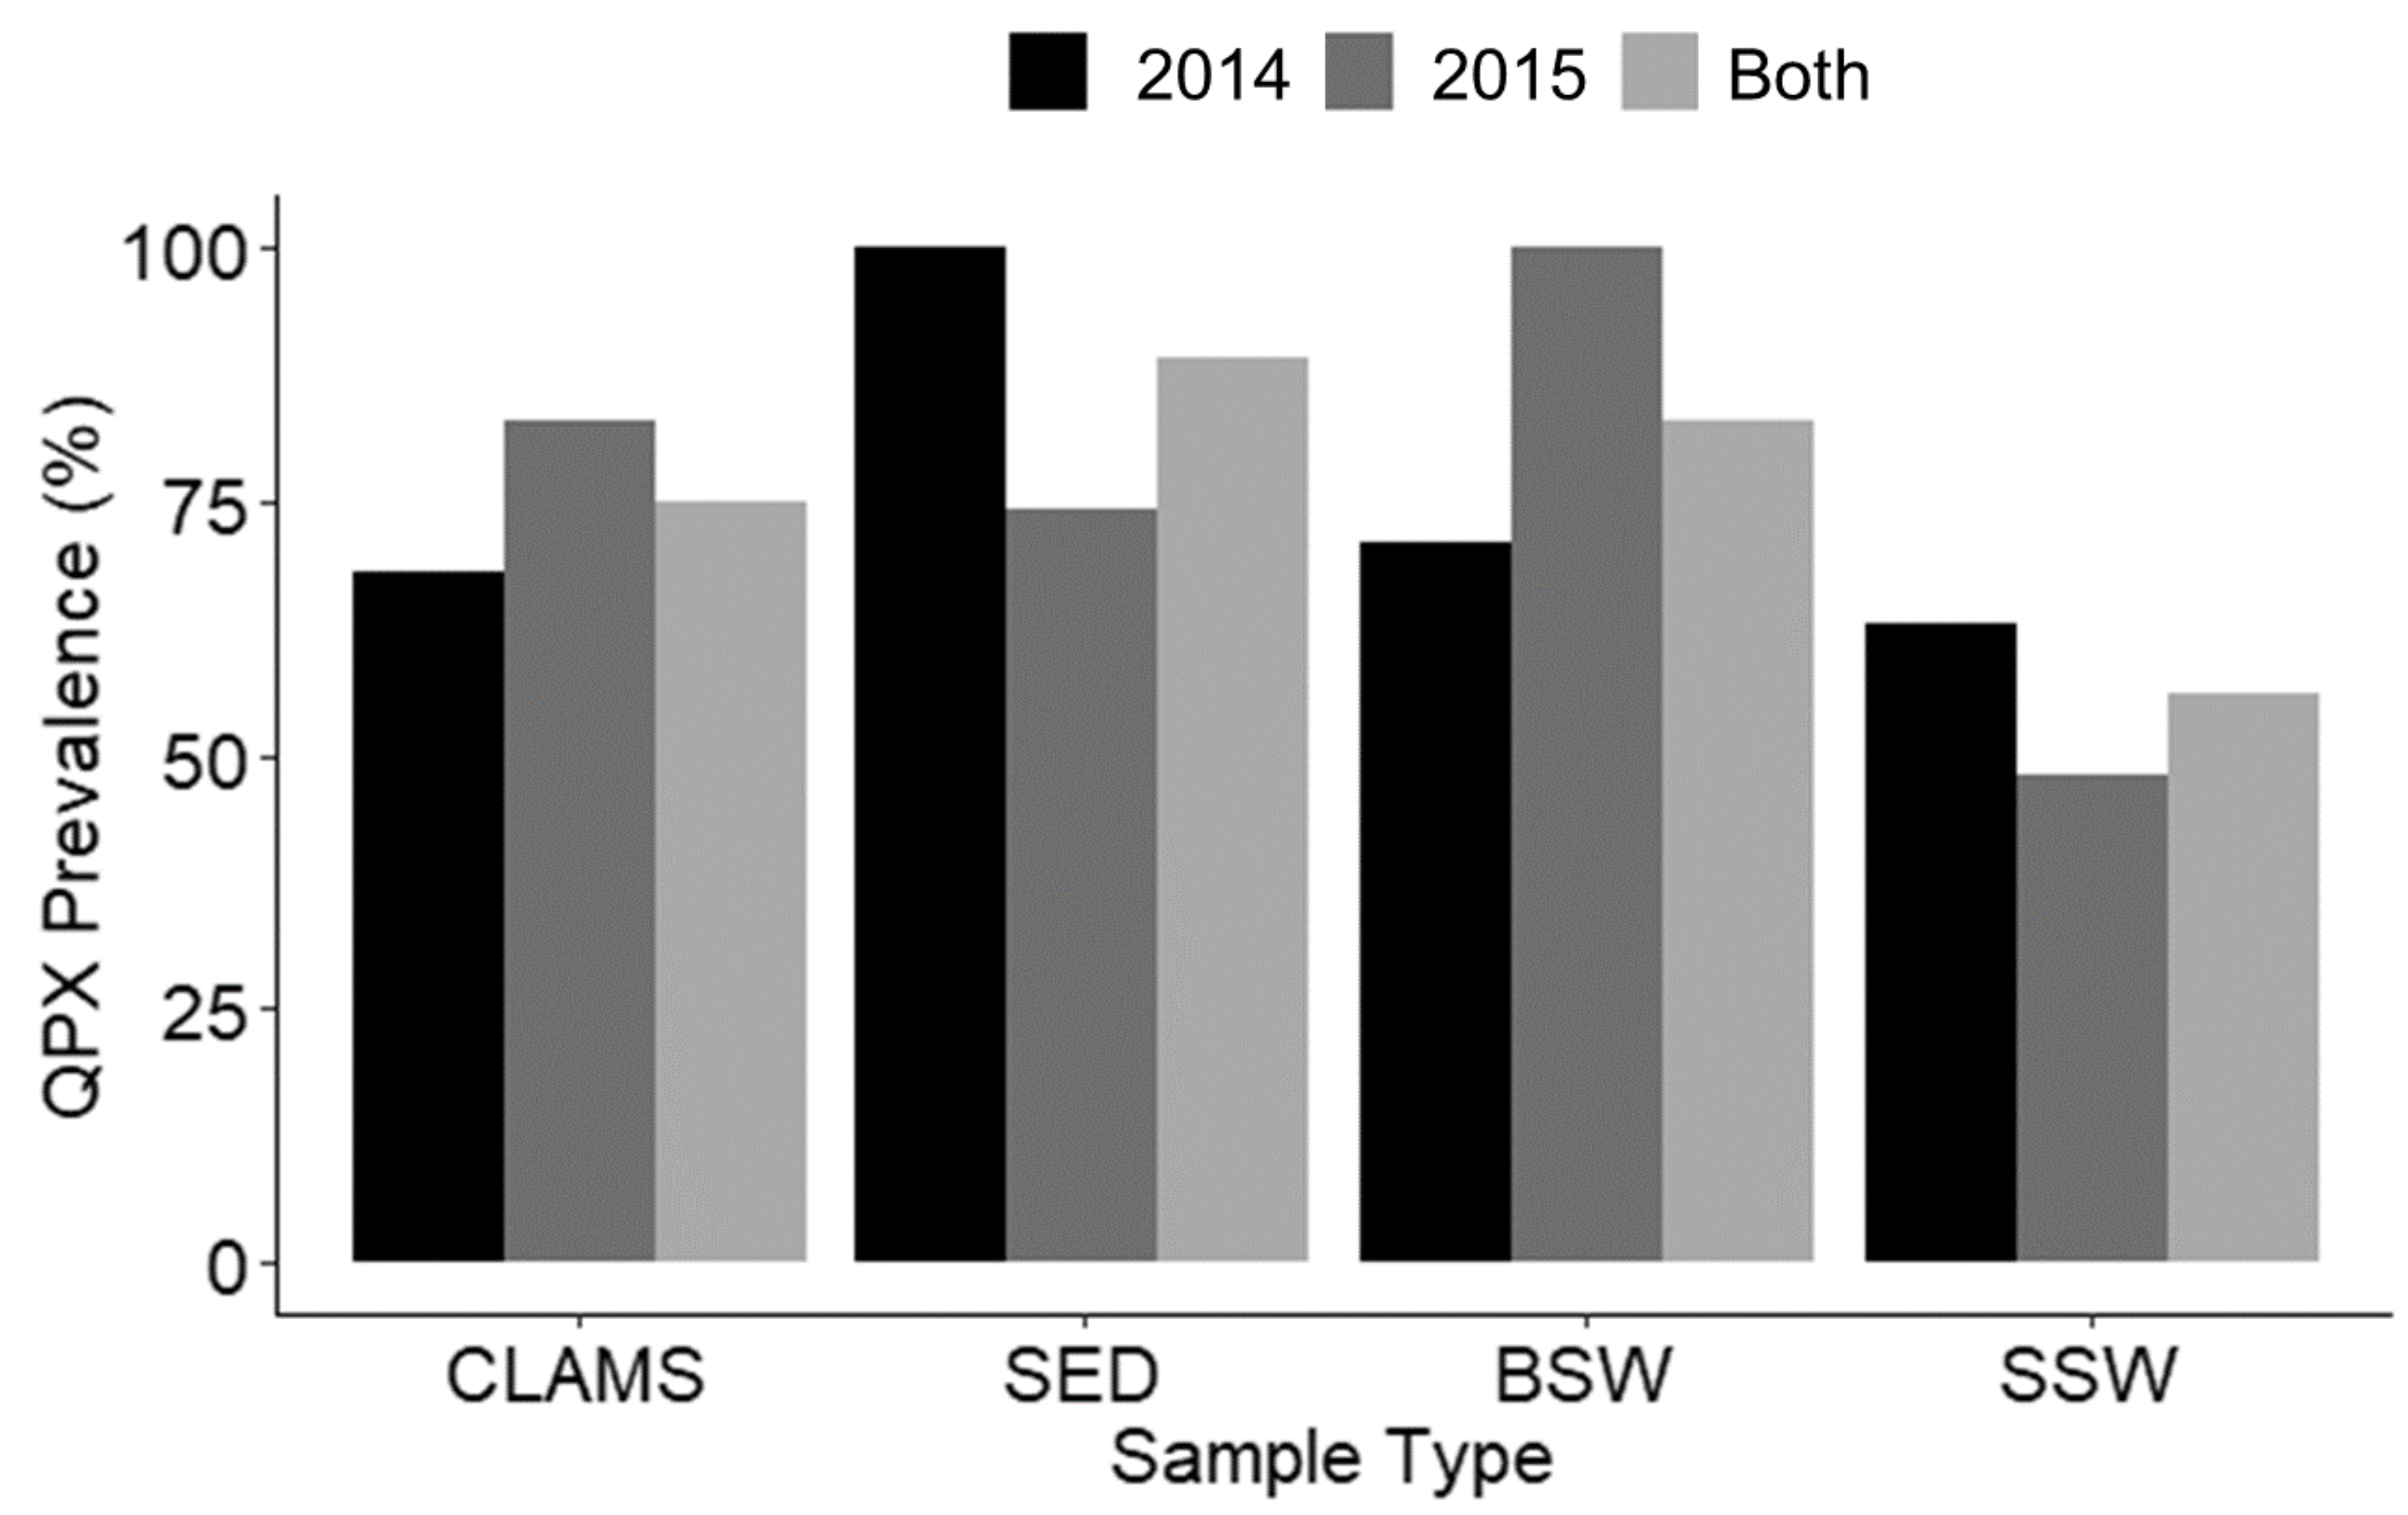
3.6. Group Comparisons
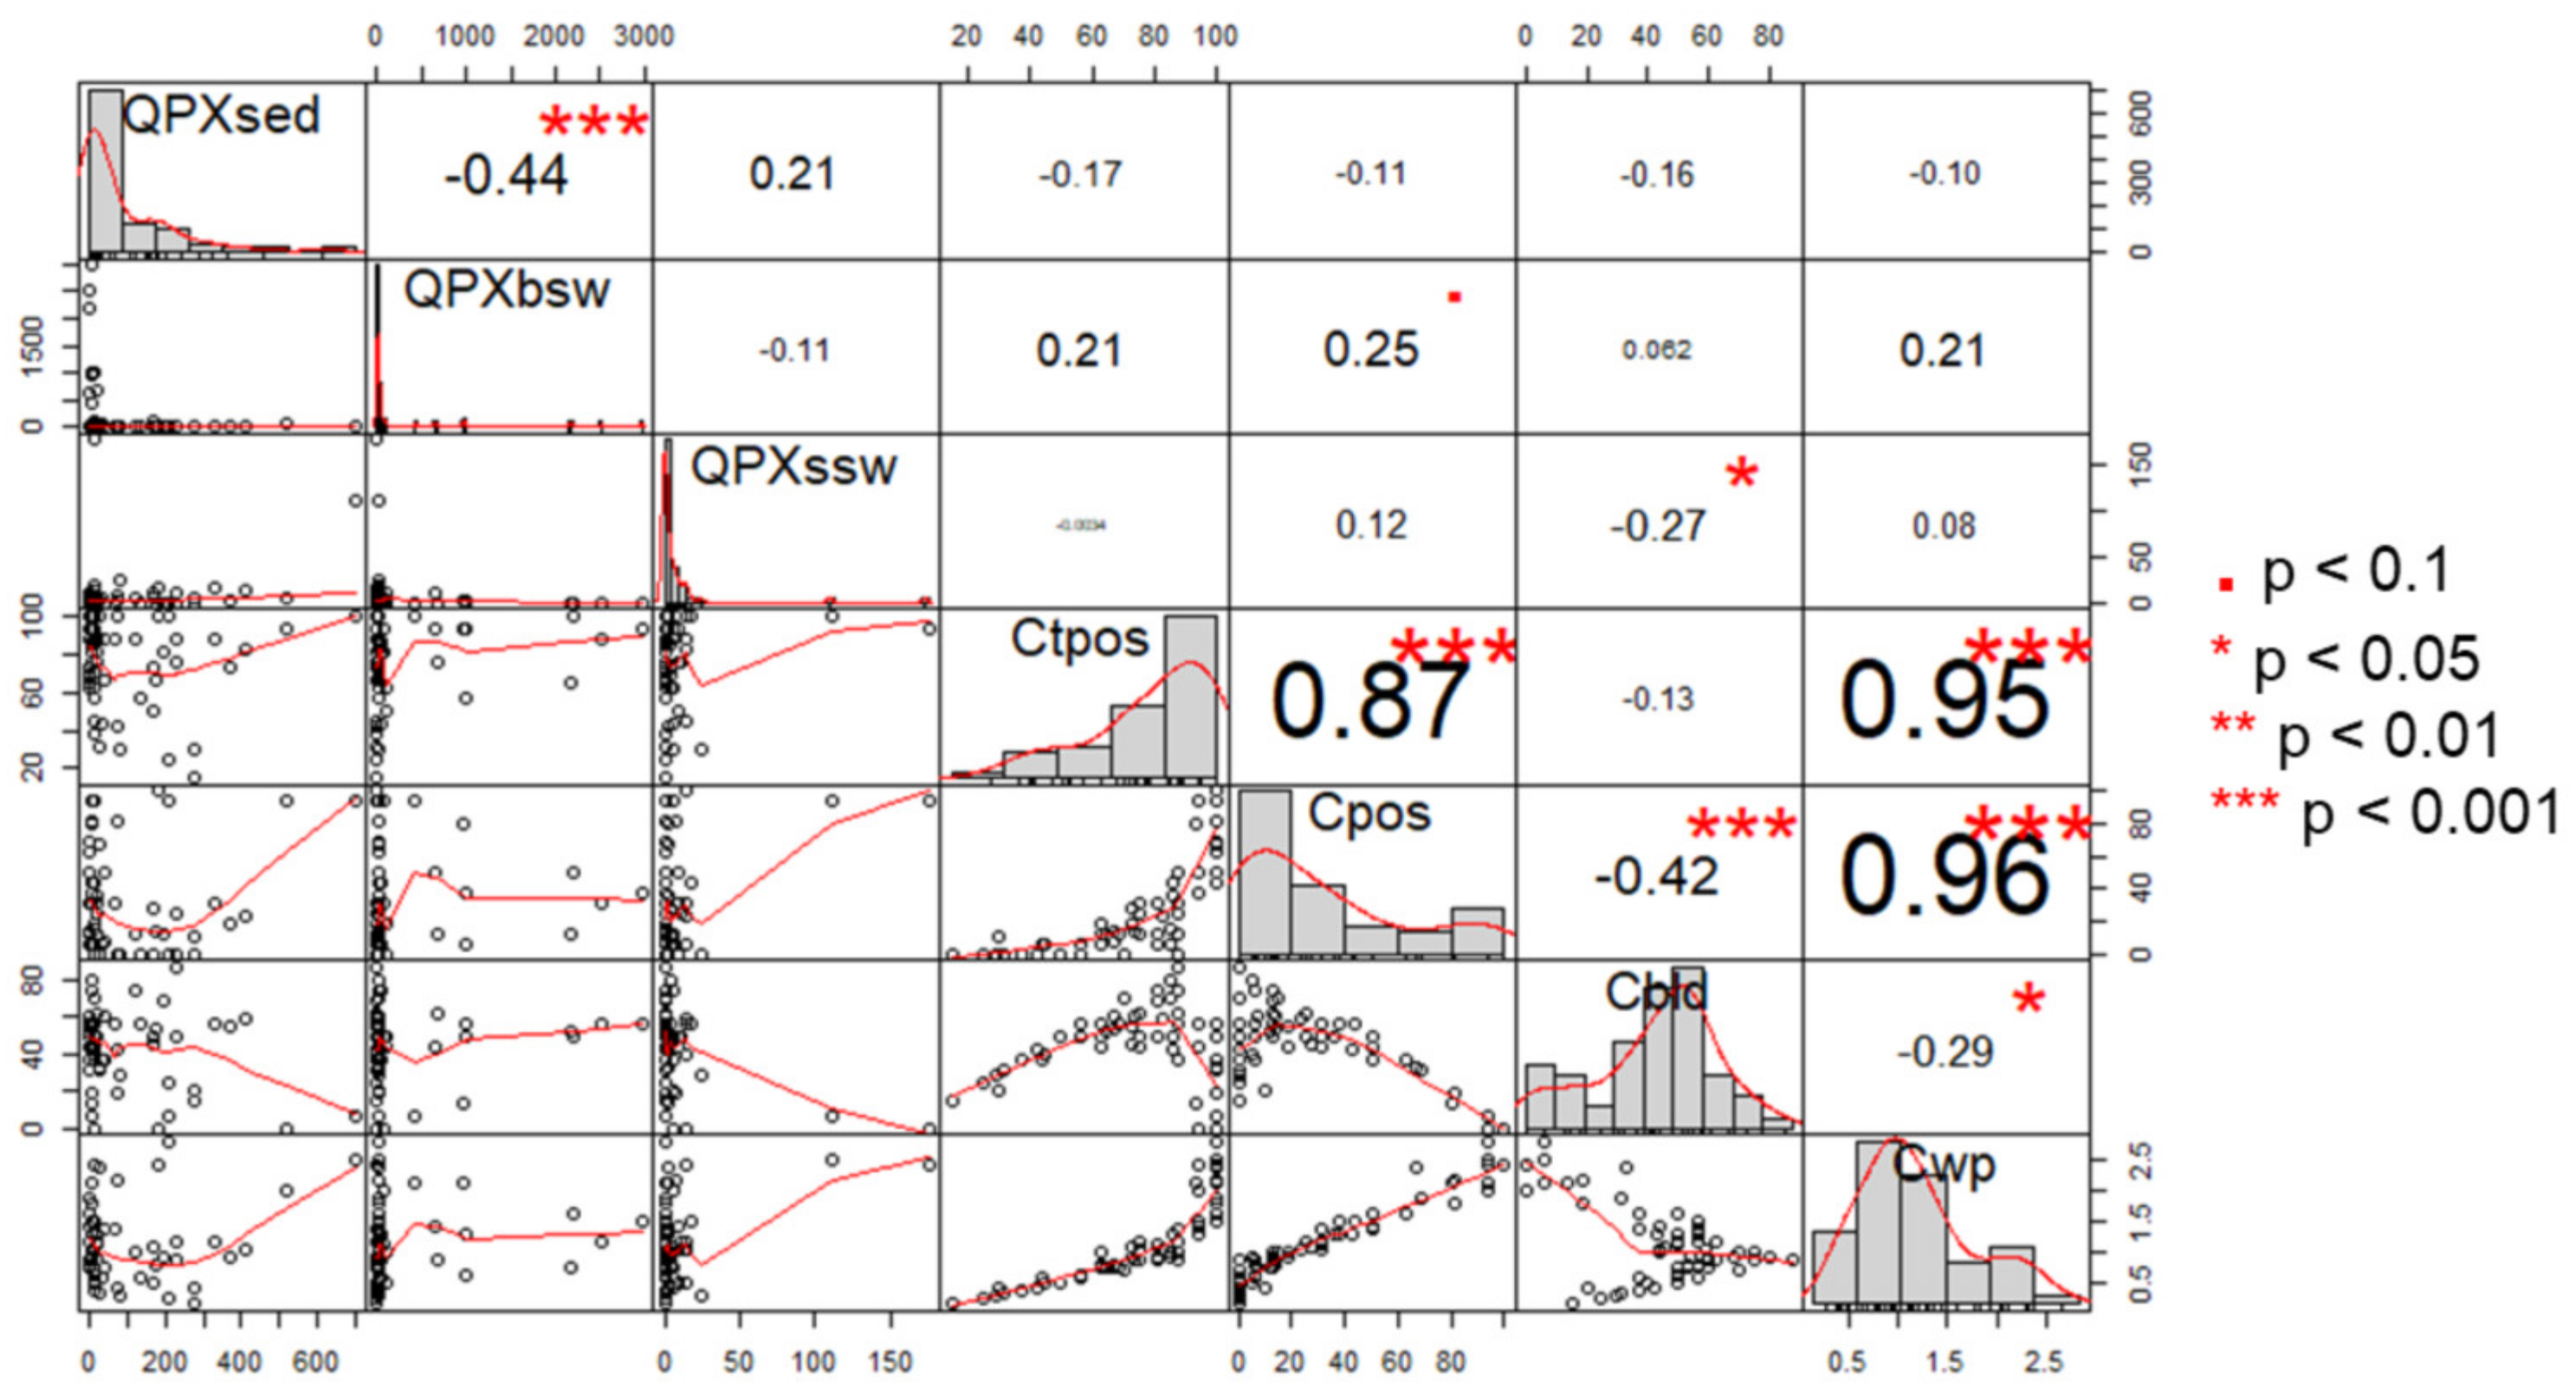
3.7. Correlations
4. Discussion
4.1. Site-Specific Differences
4.2. Seasonal Variability
4.3. Interannual Variability
4.4. Chlorophyll
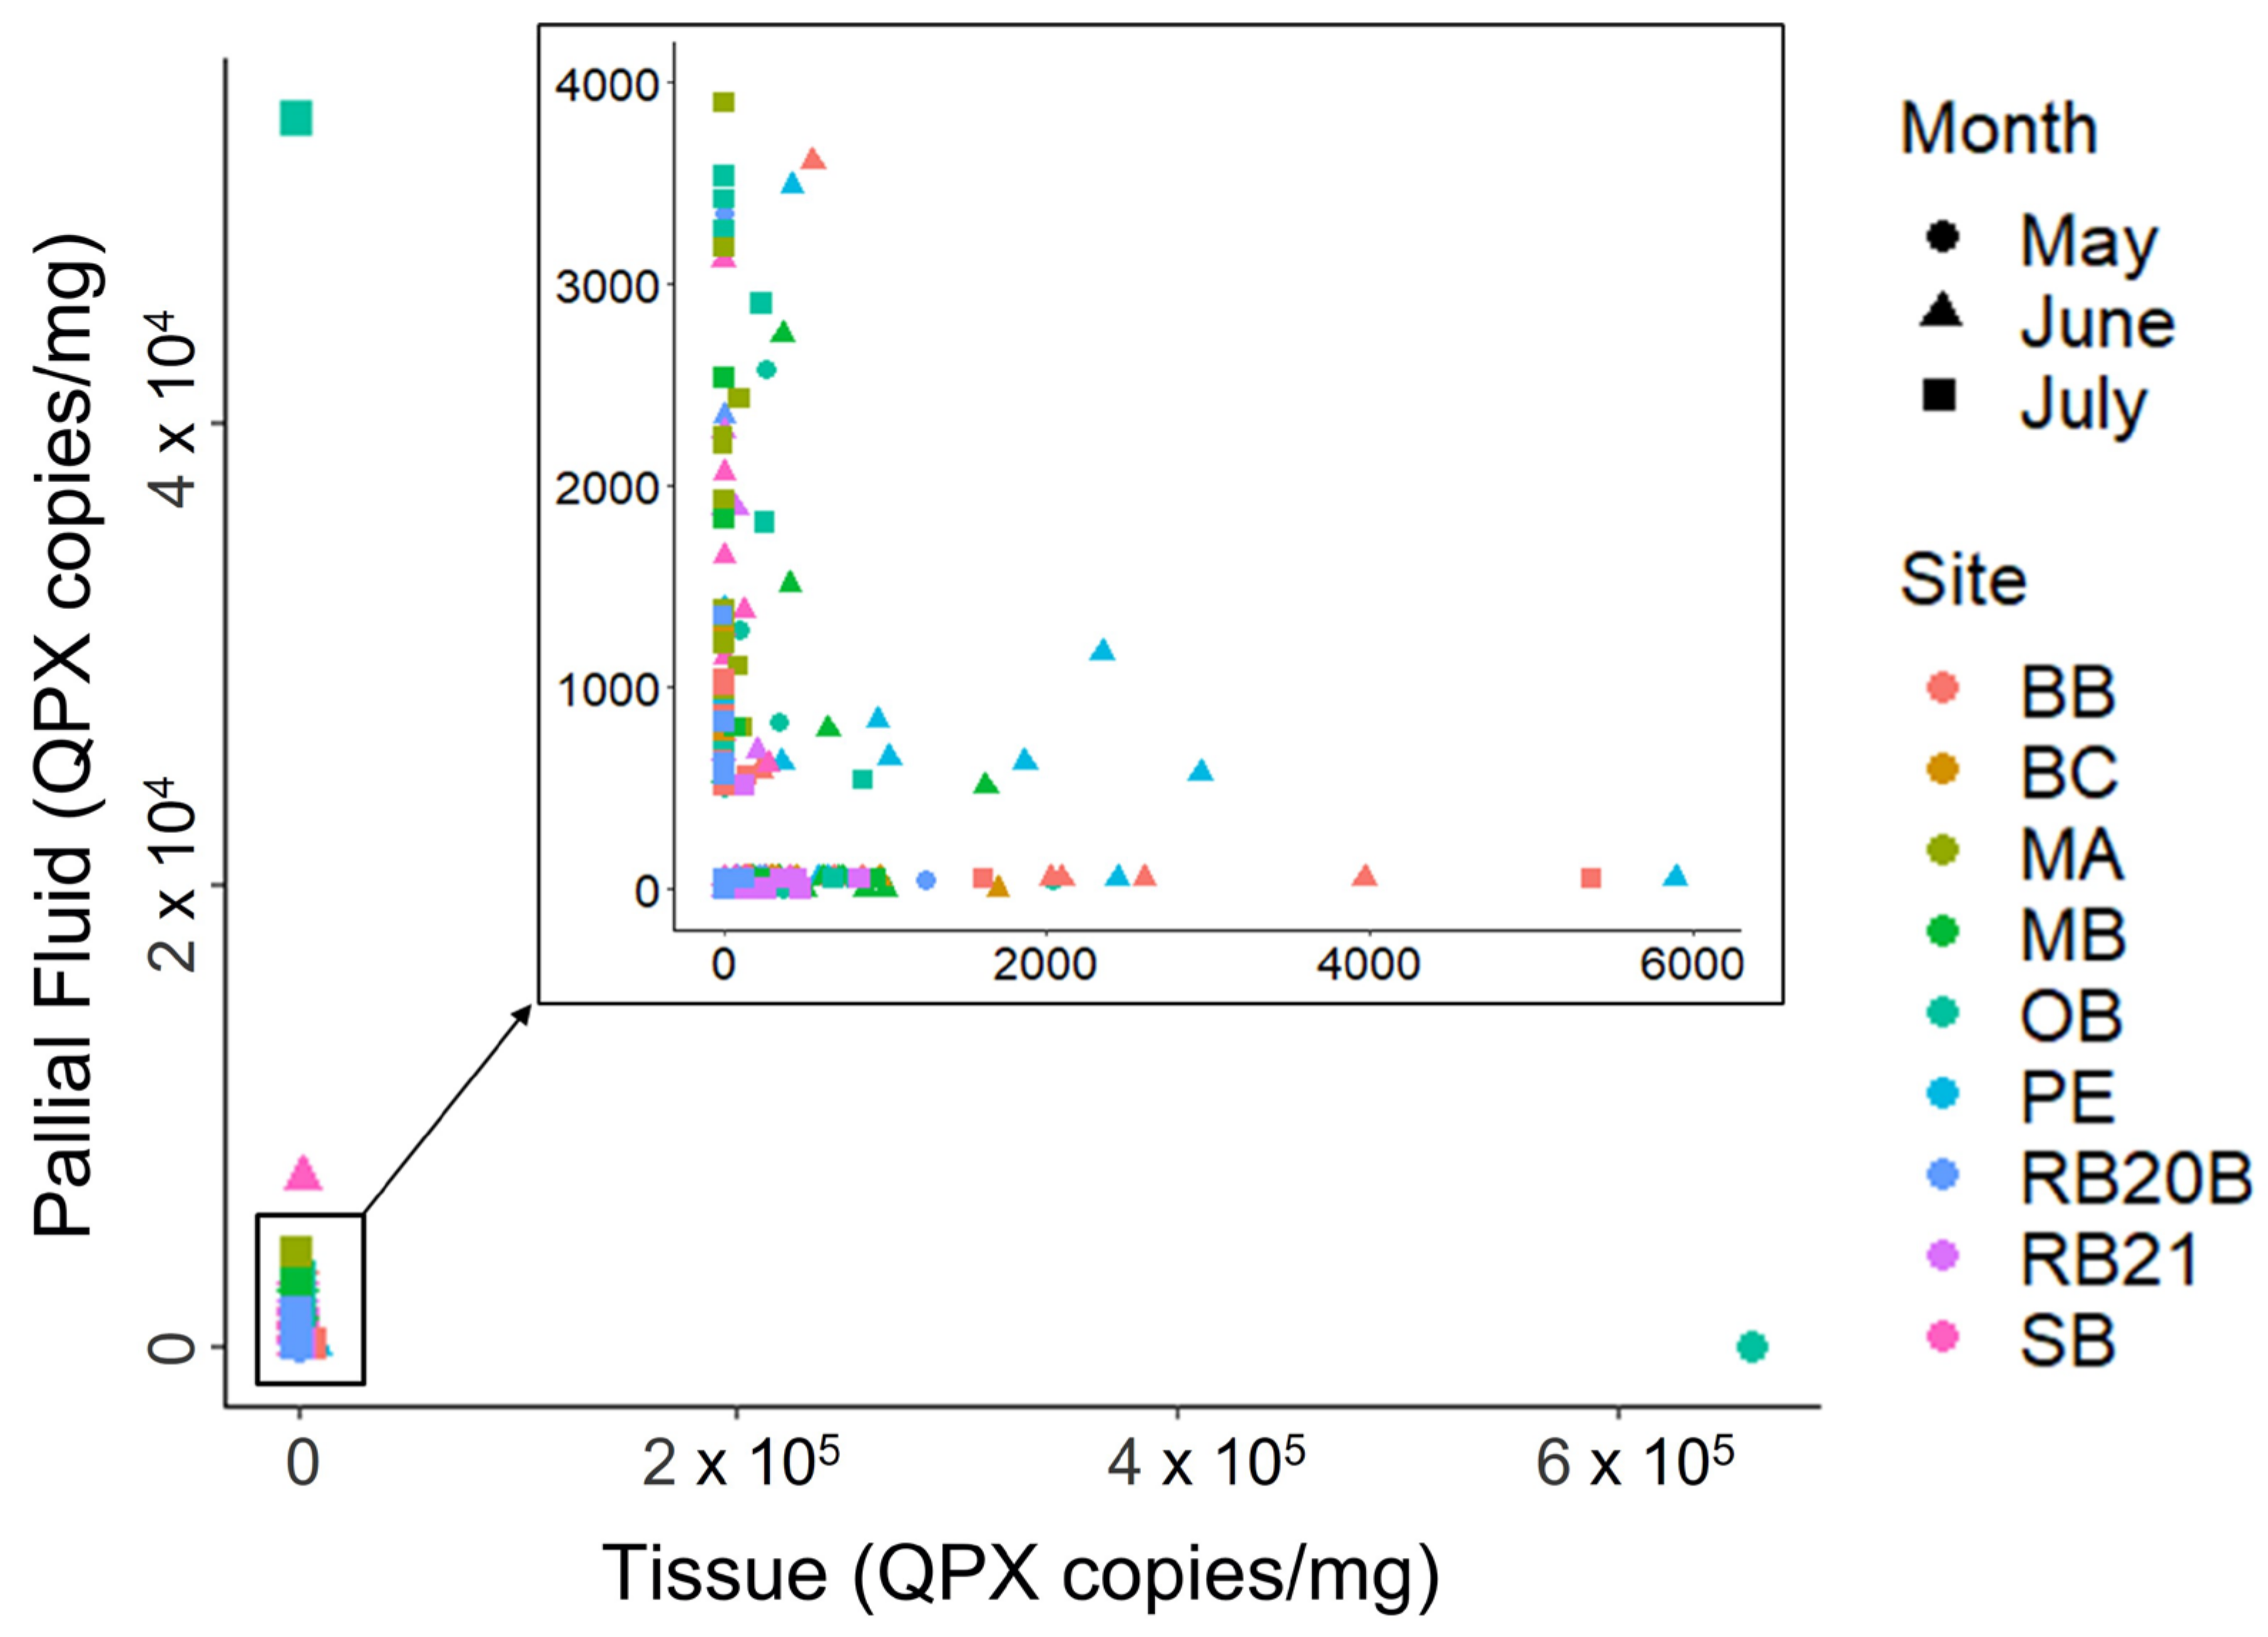
4.5. Hard Clam Pallial Fluid and Tissue
5. Conclusions
Supplementary Materials
Author Contributions
Funding
Institutional Review Board Statement
Informed Consent Statement
Data Availability Statement
Acknowledgments
Conflicts of Interest
References
- Geraci-Yee, S.; Brianik, C.J.; Rubin, E.; Collier, J.L.; Allam, B. Erection of a New Genus and Species for the Pathogen of Hard Clams ‘Quahog Parasite Unknown’ (QPX): Mucochytrium quahogii gen. nov., sp. nov. Protist 2021, 172, 125793. [Google Scholar] [CrossRef]
- Burge, C.A.; Kim, C.J.; Lyles, J.M.; Harvell, C.D. Special issue oceans and humans health: The ecology of marine opportunists. Microb. Ecol. 2013, 65, 869–879. [Google Scholar] [CrossRef] [PubMed]
- Collier, J.L.; Geraci-Yee, S.; Lilje, O.; Gleason, F.H. Possible impacts of zoosporic parasites in diseases of commercially important marine mollusc species: Part II. Labyrinthulomycota. Bot. Mar. 2017, 60, 409–417. [Google Scholar] [CrossRef]
- Raghukumar, S. Ecology of the marine protists, the Labyrinthulomycetes (Thraustochytrids and Labyrinthulids). Eur. J. Protistol. 2002, 38, 127–145. [Google Scholar] [CrossRef]
- Harvell, D.; Aronson, R.; Baron, N.; Connell, J.; Dobson, A.; Ellner, S.; Gerber, L.; Kim, K.; Kuris, A.; McCallum, H.; et al. The rising tide of ocean diseases: Unsolved problems and research priorities. Front. Ecol. Environ. 2004, 2, 375–382. [Google Scholar] [CrossRef]
- Burge, C.A.; Mark Eakin, C.; Friedman, C.S.; Froelich, B.; Hershberger, P.K.; Hofmann, E.E.; Petes, L.E.; Prager, K.C.; Weil, E.; Willis, B.L.; et al. Climate change influences on marine infectious diseases: Implications for management and society. Ann. Rev. Mar. Sci. 2014, 6, 249–277. [Google Scholar] [CrossRef] [Green Version]
- McCallum, H.; Kuris, A.; Harvell, C.; Lafferty, K.; Smith, G.; Porter, J. Does terrestrial epidemiology apply to marine systems? Trends Ecol. Evol. 2004, 19, 585–591. [Google Scholar] [CrossRef]
- Geraci-Yee, S.; Collier, J.L.; Allam, B. Labyrinthulomycete pathogens of marine mollusks. In Aquaculture Parasitology; Freeman, M., Ed.; Elsevier: Amsterdam, The Netherlands, submitted.
- Smolowitz, R. A review of QPX disease in the northern quahog(= hard clam) Mercenaria mercenaria. J. Shellfish Res. 2018, 37, 807–819. [Google Scholar] [CrossRef]
- Lyons, M.M.; Smolowitz, R.; Uhlinger, K.R.; Gast, R.J.; Ward, J.E. Lethal marine snow: Pathogen of bivalve mollusc concealed in marine aggregates. Limnol. Oceanogr. 2005, 50, 1983–1988. [Google Scholar] [CrossRef] [Green Version]
- Perkins, F.O. A new species of marine labyrinthulid Labyrinthuloides yorkensis gen. nov. spec. nov.—Cytology and fine structure. Arch. Mikrobiol. 1973, 90, 1–17. [Google Scholar] [CrossRef]
- Gast, R.J.; Cushman, E.; Moran, D.M.; Uhlinger, K.R.; Leavitt, D.; Smolowitz, R. DGGE-based detection method for Quahog Parasite Unknown (QPX). Dis. Aquat. Organ. 2006, 70, 115–122. [Google Scholar] [CrossRef] [PubMed] [Green Version]
- Gast, R.J.; Moran, D.M.; Audemard, C.; Lyons, M.M.; DeFavari, J.; Reece, K.S.; Leavitt, D.; Smolowitz, R. Environmental distribution and persistence of Quahog Parasite Unknown (QPX). Dis. Aquat. Organ. 2008, 81, 219–229. [Google Scholar] [CrossRef] [PubMed] [Green Version]
- Ford, S.E.; Kraeuter, J.N.; Robert, D.B.; Mathis, G. Aquaculture-associated factors in QPX disease of hard clams: Density and seed source. Aquaculture 2002, 208, 23–28. [Google Scholar] [CrossRef]
- Allam, B. Marine Animal Disease Laboratory, Stony Brook University: Stony Brook, NY, USA, unpublished work.
- Geraci-Yee, S. Taking the "X" out of QPX Disease: Distribution and Dynamics of the Hard Clam Pathogen, Mucochytrium quahogii (Formerly QPX = Quahog Parasite Unknown). Ph.D. Thesis, Stony Brook University, Stony Brook, NY, USA, 2021. [Google Scholar]
- Geraci-Yee, S.; Allam, B.; Collier, J.L. Keeping up with advances in qPCR pathogen detection: An example for QPX disease in hard clams. Dis. Aquat. Organ. 2022, 148, 127–144. [Google Scholar] [CrossRef]
- Liu, Q.; Allam, B.; Collier, J.L. Quantitative real-time PCR assay for QPX (Thraustochytriidae), a parasite of the hard clam (Mercenaria mercenaria). Appl. Environ. Microbiol. 2009, 75, 4913–4918. [Google Scholar] [CrossRef] [Green Version]
- Geraci-Yee, S.; Allam, B.; Collier, J.L. A nested, quantitative PCR assay for detection of the hard clam pathogen, Mucochytrium quahogii (=QPX), in environmental samples. Froniters Mar. Sci. 2022. in review. [Google Scholar]
- Irwin, P.L.; Nguyen, L.H.; Chen, C.Y.; Uhlich, G.A.; Paoli, G.C. A method for correcting standard-based real-time PCR DNA quantitation when the standard’s polymerase reaction efficiency is significantly different from that of the unknown’s. Anal. Bioanal. Chem. 2012, 402, 2713–2725. [Google Scholar] [CrossRef]
- Stokes, N.A.; Calvo, L.M.R.; Reece, K.S.; Burreson, E.M. Molecular diagnostics, field validation, and phylogenetic analysis of Quahog Parasite Unknown (QPX), a pathogen of the hard clam Mercenaria mercenaria. Dis. Aquat. Organ. 2002, 52, 233–247. [Google Scholar] [CrossRef] [PubMed] [Green Version]
- Fantin, Y.S.; Neverov, A.D.; Favorov, A.V.; Alvarez-Figueroa, M.V.; Braslavskaya, S.I.; Gordukova, M.A.; Karandashova, I.V.; Kuleshov, K.V.; Myznikova, A.I.; Polishchuk, M.S.; et al. Base-calling algorithm with vocabulary (BCV) method for analyzing population sequencing chromatograms. PLoS ONE 2013, 8, e54835. [Google Scholar] [CrossRef] [PubMed]
- Hall, T.A. BioEdit: A user-friendly biological sequence alignment editor and analysis program for Windows 95/98/NT. Nucleic Acids Symp. Ser. 1999, 41, 95–98. [Google Scholar]
- Thompson, J.D.; Higgins, D.G.; Gibson, T.J. CLUSTAL W: Improving the sensitivity of progressive multiple sequence alignment through sequence weighting, position specific gap penalties and weight matrix choice. Nucleic Acids Res. 1994, 22, 4673–4680. [Google Scholar] [CrossRef] [Green Version]
- Nei, M.; Kumar, S. Molecular Evolution and Phylogenetics; Oxford University Press: Oxford, UK, 2000; p. 333. [Google Scholar]
- Kumar, S.; Stecher, G.; Li, M.; Knyaz, C.; Tamura, K. MEGA X: Molecular Evolutionary Genetics Analysis across computing platforms. Mol. Biol. Evol. 2018, 35, 1547–1549. [Google Scholar] [CrossRef]
- Strickland, J.D.H.; Parsons, T.R. A Practical Handbook of Seawater Analysis; Fisheries Research Board of Canada: Ottawa, ON, Canada, 1972. [Google Scholar]
- Jeffrey, S.T.; Humphrey, G. New spectrophotometric equations for determining chlorophylls a, b, c1 and c2 in higher plants, algae and natural phytoplankton. Biochem. Physiol. Pflanz. 1975, 167, 191–194. [Google Scholar] [CrossRef]
- Wickham, H. ggplot2: Elegant Graphics for Data Analysis; Springer: New York, NY, USA, 2016. [Google Scholar]
- RStudioTeam. RStudio: Integrated Develpoment for R; RStudio, Inc.: Boston, MA, USA, 2018. [Google Scholar]
- Peterson, B.G.; Carl, P.; Boudt, K.; Bennett, R.; Ulrich, J.; Zivot, E.; Cornilly, D.; Hung, E.; Lestel, M.; Balkissoon, K.; et al. Package ‘Performanceanalytics’. R Team Coop. 2018, 3, 13–14. [Google Scholar]
- Audemard, C.; Ragone-Calvo, L.M.; Paynter, K.T.; Reece, K.S.; Burreson, E.M. Real-time PCR investigation of parasite ecology: In situ determination of oyster parasite Perkinsus marinus transmission dynamics in lower Chesapeak Bay. Parasitology 2006, 132, 827–842. [Google Scholar] [CrossRef] [PubMed] [Green Version]
- Tsui, C.K.; Vrijmoed, L.L. A re-visit to the evolution and ecophysiology of the Labyrinthulomycetes. In Marine Ecosystems; IntechOpen: Rijeka, Croatia, 2012; pp. 161–176. [Google Scholar]
- Tsui, C.K.M.; Fan, K.W.; Chow, R.K.K.; Jones, E.B.G.; Vrijmoed, L.L.P. Zoospore production and motility of mangrove thraustochytrids from Hong Kong under various salinities. Mycoscience 2012, 53, 1–9. [Google Scholar] [CrossRef]
- Ueda, M.; Nomura, Y.; Doi, K.; Nakajima, M.; Honda, D. Seasonal dynamics of culturable thraustochytrids (Labyrinthulomycetes, Stramenopiles) in estuarine and coastal waters. Aquat. Microb. Ecol. 2015, 74, 187–204. [Google Scholar] [CrossRef]
- Kimura, H.; Sato, M.; Sugiyama, C.; Naganuma, T. Coupling of thraustochytrids and POM, and of bacterio- and phytoplankton in a semi-enclosed coastal area: Implication for different substrate preference by the planktonic decomposers. Aquat. Microb. Ecol. 2001, 25, 293–300. [Google Scholar] [CrossRef] [Green Version]
- Brothers, C.; Marks, E., III; Smolowitz, R. Conditions affecting the growth and zoosporulation of the protistan parasite QPX in culture. Biol. Bull. 2000, 199, 200–201. [Google Scholar] [CrossRef] [Green Version]
- Perrigault, M.; Buggé, D.M.; Allam, B. Effect of environmental factors on survival and growth of quahog parasite unknown (QPX) in vitro. J. Invertebr. Pathol. 2010, 104, 83–89. [Google Scholar] [CrossRef]
- Liu, Q.; Collier, J.L.; Allam, B. Seasonality of QPX disease in the Raritan Bay (NY) wild hard clam (Mercenaria mercenaria) population. Aquac. Res. 2017, 48, 1269–1278. [Google Scholar] [CrossRef]
- Dahl, S.F.; Perrigault, M.; Liu, Q.; Collier, J.L.; Barnes, D.A.; Allam, B. Effects of temperature on hard clam (Mercenaria mercenaria) immunity and QPX (Quahog Parasite Unknown) disease development: I. Dynamics of QPX disease. J. Invertebr. Pathol. 2011, 106, 314–321. [Google Scholar] [CrossRef] [PubMed]
- Dahl, S.F.; Allam, B. Laboratory transmission studies of QPX disease in the northern quahog (=hard clam): Development of an infection procedure. J. Shellfish Res. 2007, 26, 383–389. [Google Scholar] [CrossRef]
- Dahl, S.F.; Thiel, J.; Allam, B. Field Performance and QPX Disease Progress in Cultured and Wild-Type Strains of Mercenaria mercenaria in New York Waters. J. Shellfish Res. 2010, 29, 83–90. [Google Scholar] [CrossRef]
- Lyons, M.M.; Smolowitz, R.; Gomez-Chiarri, M.; Ward, J.E. Epizootiology of Quahog Parasite Unknown (QPX) Disease in Northern Quahogs (=Hard Clams) Mercenaria mercenaria. J. Shellfish Res. 2007, 26, 371–381. [Google Scholar] [CrossRef] [Green Version]
- Bongiorni, L.; Dini, F. Distribution and abundance of thraustochytrids in different Mediterranean coastal habitats. Aquat. Microb. Ecol. 2002, 30, 49–56. [Google Scholar] [CrossRef]
- Liu, Y.; Singh, P.; Liang, Y.; Li, J.; Xie, N.; Song, Z.; Daroch, M.; Leng, K.; Johnson, Z.I.; Wang, G. Abundance and molecular diversity of thraustochytrids in coastal waters of southern China. FEMS Microbiol. Ecol. 2017, 93, fix070. [Google Scholar] [CrossRef] [Green Version]
- Bai, M.; Sen, B.; Wang, Q.; Xie, Y.; He, Y.; Wang, G. Molecular Detection and Spatiotemporal Characterization of Labyrinthulomycete Protist Diversity in the Coastal Waters Along the Pearl River Delta. Microb. Ecol. 2019, 77, 394–405. [Google Scholar] [CrossRef] [PubMed]
- Raghukumar, S.; Damare, V.S. Increasing evidence for the important role of Labyrinthulomycetes in marine ecosystems. Bot. Mar. 2011, 54, 3–11. [Google Scholar] [CrossRef] [Green Version]
- Gaertner, A.; Raghukumar, S. Ecology of thraustochytrids (lower marine fungi) in the Fladen Ground and other parts of the North Sea I. Meteor Forsch. A 1980, 22, 165–185. [Google Scholar]
- Raghukumar, C.; Gaertner, A. Ecology of the thraustochytrids (lower marine fungi) in the Fladen Ground and otehr parts of the North Sea II. Veroff. Inst. Meereforsch. Bremerhav. 1980, 18, 289–308. [Google Scholar]
- Li, Q.; Wang, X.; Liu, X.; Jiao, N.; Wang, G. Abundance and novel lineages of thraustochytrids in Hawaiian waters. Microb. Ecol. 2013, 66, 823–830. [Google Scholar] [CrossRef] [PubMed]
- Duan, Y.; Sen, B.; Xie, N.; Paterson, J.S.; Chen, Z.; Wang, G. Flow Cytometry for Rapid Enumeration and Biomass Quantification of Thraustochytrids in Coastal Seawaters. Microbes Environ. 2018, 33, 195–204. [Google Scholar] [CrossRef] [PubMed] [Green Version]
- Buggé, D.M.; Allam, B. Effects of starvation and macroalgae extracts on the survival and growth of quahog parasite unknown (QPX). J. Exp. Mar. Biol. Ecol. 2007, 348, 60–69. [Google Scholar] [CrossRef]
- Lyons, M.M.; Smolowitz, R.; Dungan, C.F.; Roberts, S. Development of a real time quantitative PCR assay for the hard clam pathogen Quahog Parasite Unknown (QPX). Dis. Aquat. Organ. 2006, 72, 45–52. [Google Scholar] [CrossRef] [PubMed]
- Pan, J.; Campo, J.d.; Keeling, P.J. Reference Tree and Environmental Sequence Diversity of Labyrinthulomycetes. J. Eukaryot. Microbiol. 2017, 64, 88–96. [Google Scholar] [CrossRef]
- Allam, B.; Espinosa, E.P. Bivalve immunity and response to infections: Are we looking at the right place? Fish Shellfish Immunol. 2016, 53, 4–12. [Google Scholar] [CrossRef] [Green Version]
- Casadevall, A.; Pirofski, L.A. Accidental virulence, cryptic pathogenesis, martians, lost hosts, and the pathogenicity of environmental microbes. Eukaryot. Cell 2007, 6, 2169–2174. [Google Scholar] [CrossRef]


| Sample Type | 2014 | 2015 | Total |
|---|---|---|---|
| Hard Clams | 539 | 438 | 977 |
| Surface Seawater (SSW) | 40 | 31 | 71 |
| Bottom Seawater (BSW) | 38 | 26 | 64 |
| Sediment (SED) | 40 | 31 | 71 |
| TOTAL | 657 | 526 | 1183 |
| Statistic | Sample Type | 2014 | 2015 | Both Years |
|---|---|---|---|---|
| Mean ± Standard Deviation | CLAM TIS * | 12 ± 126 | 3 ± 20 | 8 ± 90 |
| CLAM PF * | 3.6 ± 4.3 | n/a | n/a | |
| SED | 0.364 ± 0.34 | 0.0148 ± 0.02 | 0.211 ± 0.31 | |
| BSW | 0.267 ± 0.05 | 1.311 ± 2 | 0.548 ± 1.43 | |
| SSW | 0.258 ± 0.07 | 0.005 ± 0.01 | 0.0168 ± 0.06 | |
| Range (Minimum, Non-zero Minimum—Maximum) | CLAM TIS | 0, 0.2–1502 | 0, 0.2–191 | 0, 0.2–1502 |
| CLAM PF | 0, 0.04–121 | n/a | n/a | |
| SED | 0.2–1.6 | 0, 0.0006–0.05 | 0, 0.0006–1.6 | |
| BSW | 0, 0.0013–0.23 | 0.007–6.77 | 0, 0.0013–6.77 | |
| SSW | 0, 0.0011–0.4 | 0, 0.001–0.04 | 0, 0.001–0.4 |
Publisher’s Note: MDPI stays neutral with regard to jurisdictional claims in published maps and institutional affiliations. |
© 2022 by the authors. Licensee MDPI, Basel, Switzerland. This article is an open access article distributed under the terms and conditions of the Creative Commons Attribution (CC BY) license (https://creativecommons.org/licenses/by/4.0/).
Share and Cite
Geraci-Yee, S.; Collier, J.L.; Allam, B. Mucochytrium quahogii (=QPX) Is a Commensal, Opportunistic Pathogen of the Hard Clam (Mercenaria mercenaria): Evidence and Implications for QPX Disease Management. J. Fungi 2022, 8, 1128. https://doi.org/10.3390/jof8111128
Geraci-Yee S, Collier JL, Allam B. Mucochytrium quahogii (=QPX) Is a Commensal, Opportunistic Pathogen of the Hard Clam (Mercenaria mercenaria): Evidence and Implications for QPX Disease Management. Journal of Fungi. 2022; 8(11):1128. https://doi.org/10.3390/jof8111128
Chicago/Turabian StyleGeraci-Yee, Sabrina, Jackie L. Collier, and Bassem Allam. 2022. "Mucochytrium quahogii (=QPX) Is a Commensal, Opportunistic Pathogen of the Hard Clam (Mercenaria mercenaria): Evidence and Implications for QPX Disease Management" Journal of Fungi 8, no. 11: 1128. https://doi.org/10.3390/jof8111128