
Epidemiological Correlation of Pulmonary Aspergillus Infections with Ambient Pollutions and Influenza A (H1N1) in Southern Taiwan

 ,
,
Abstract
:1. Introduction
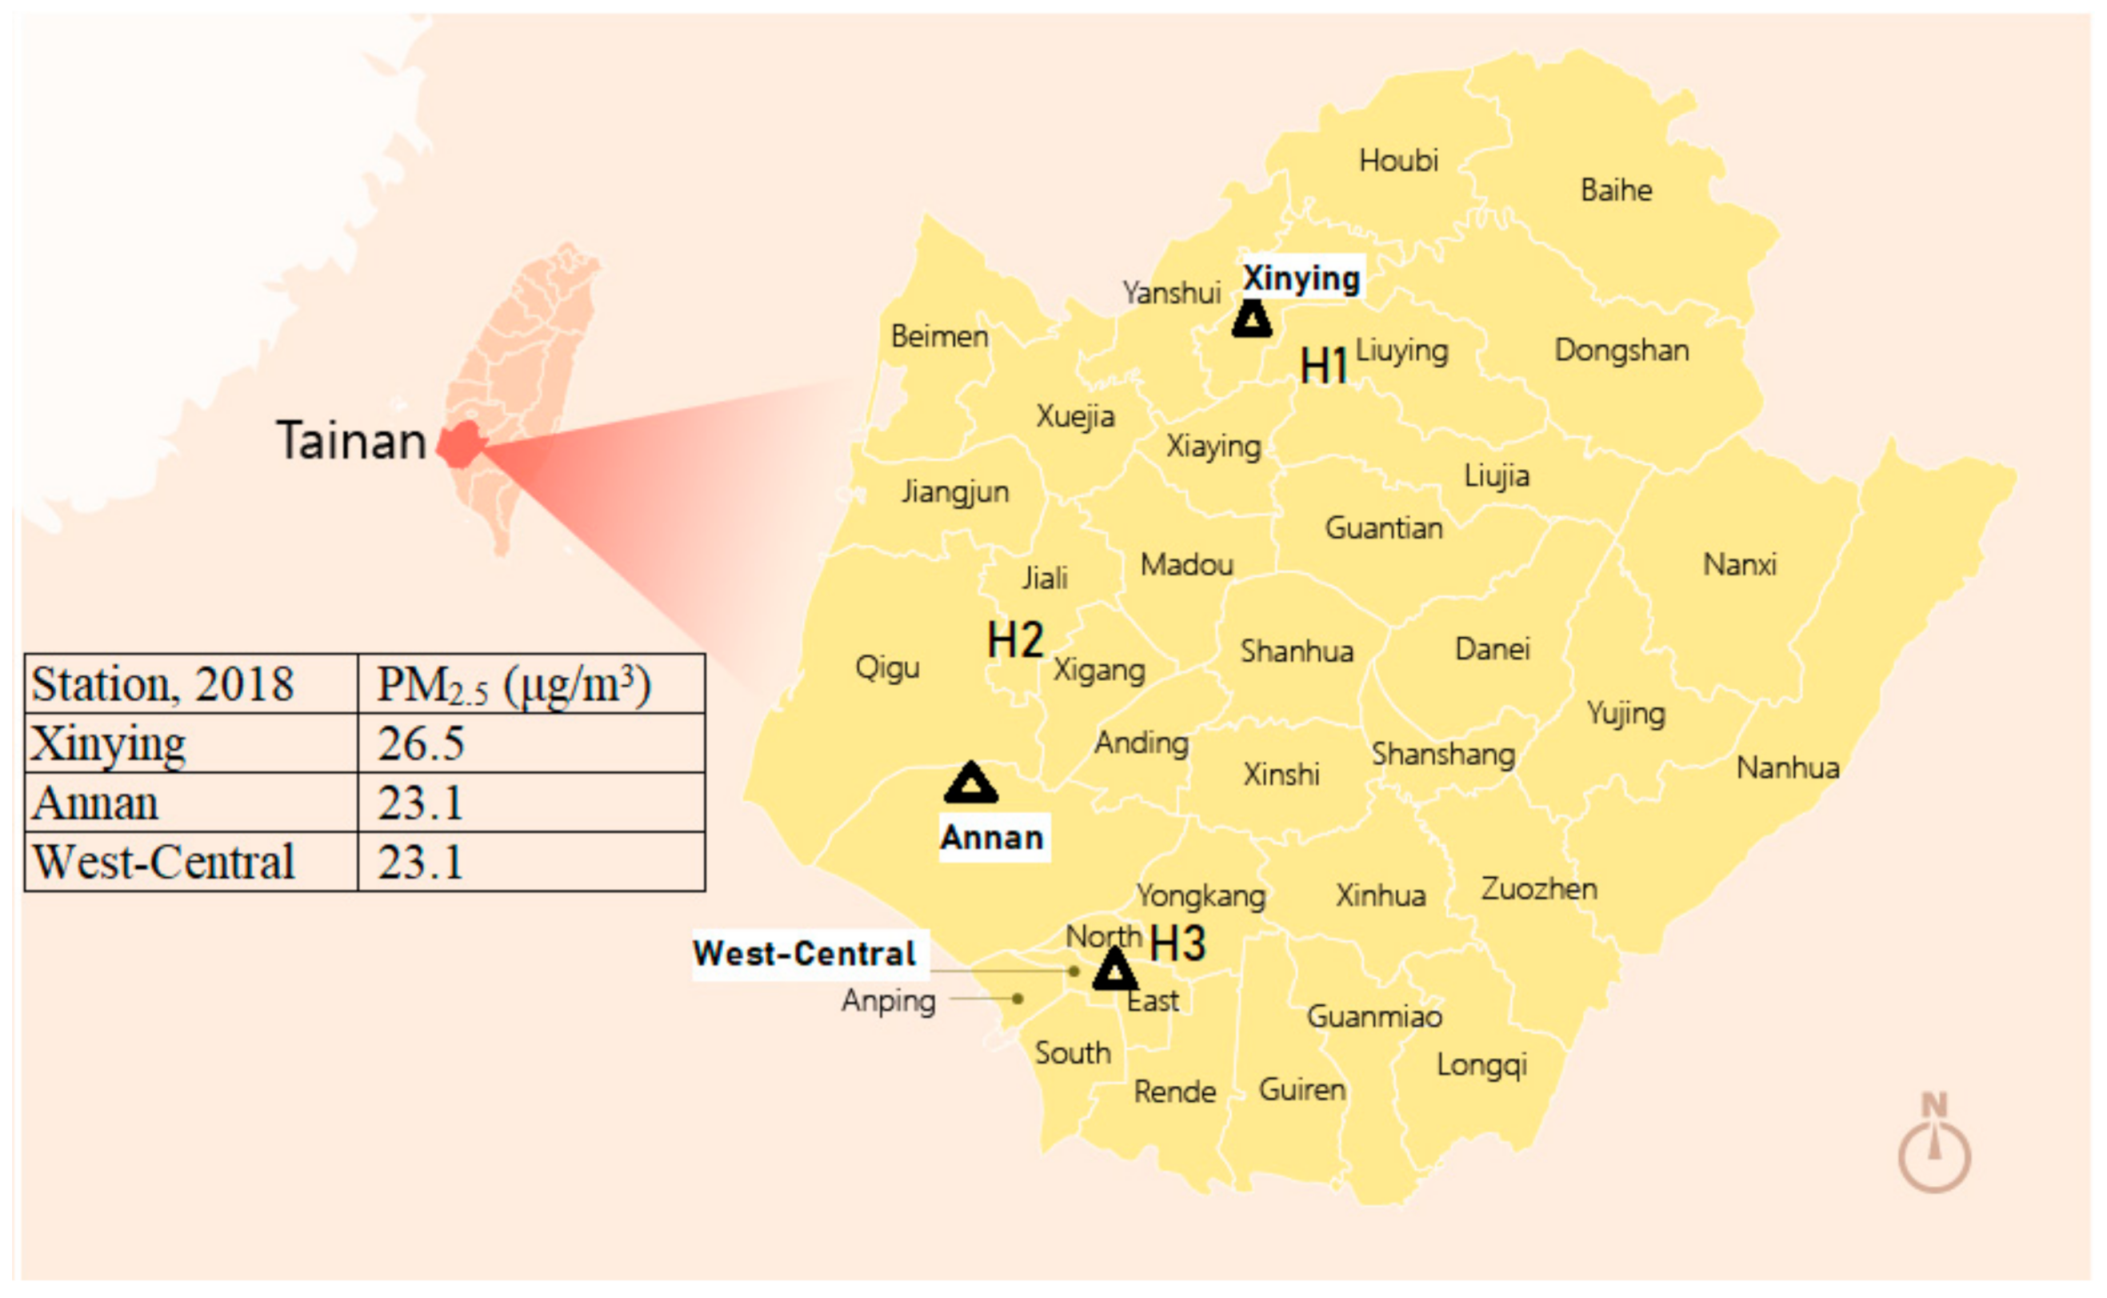
2. Materials and Methods
3. Results
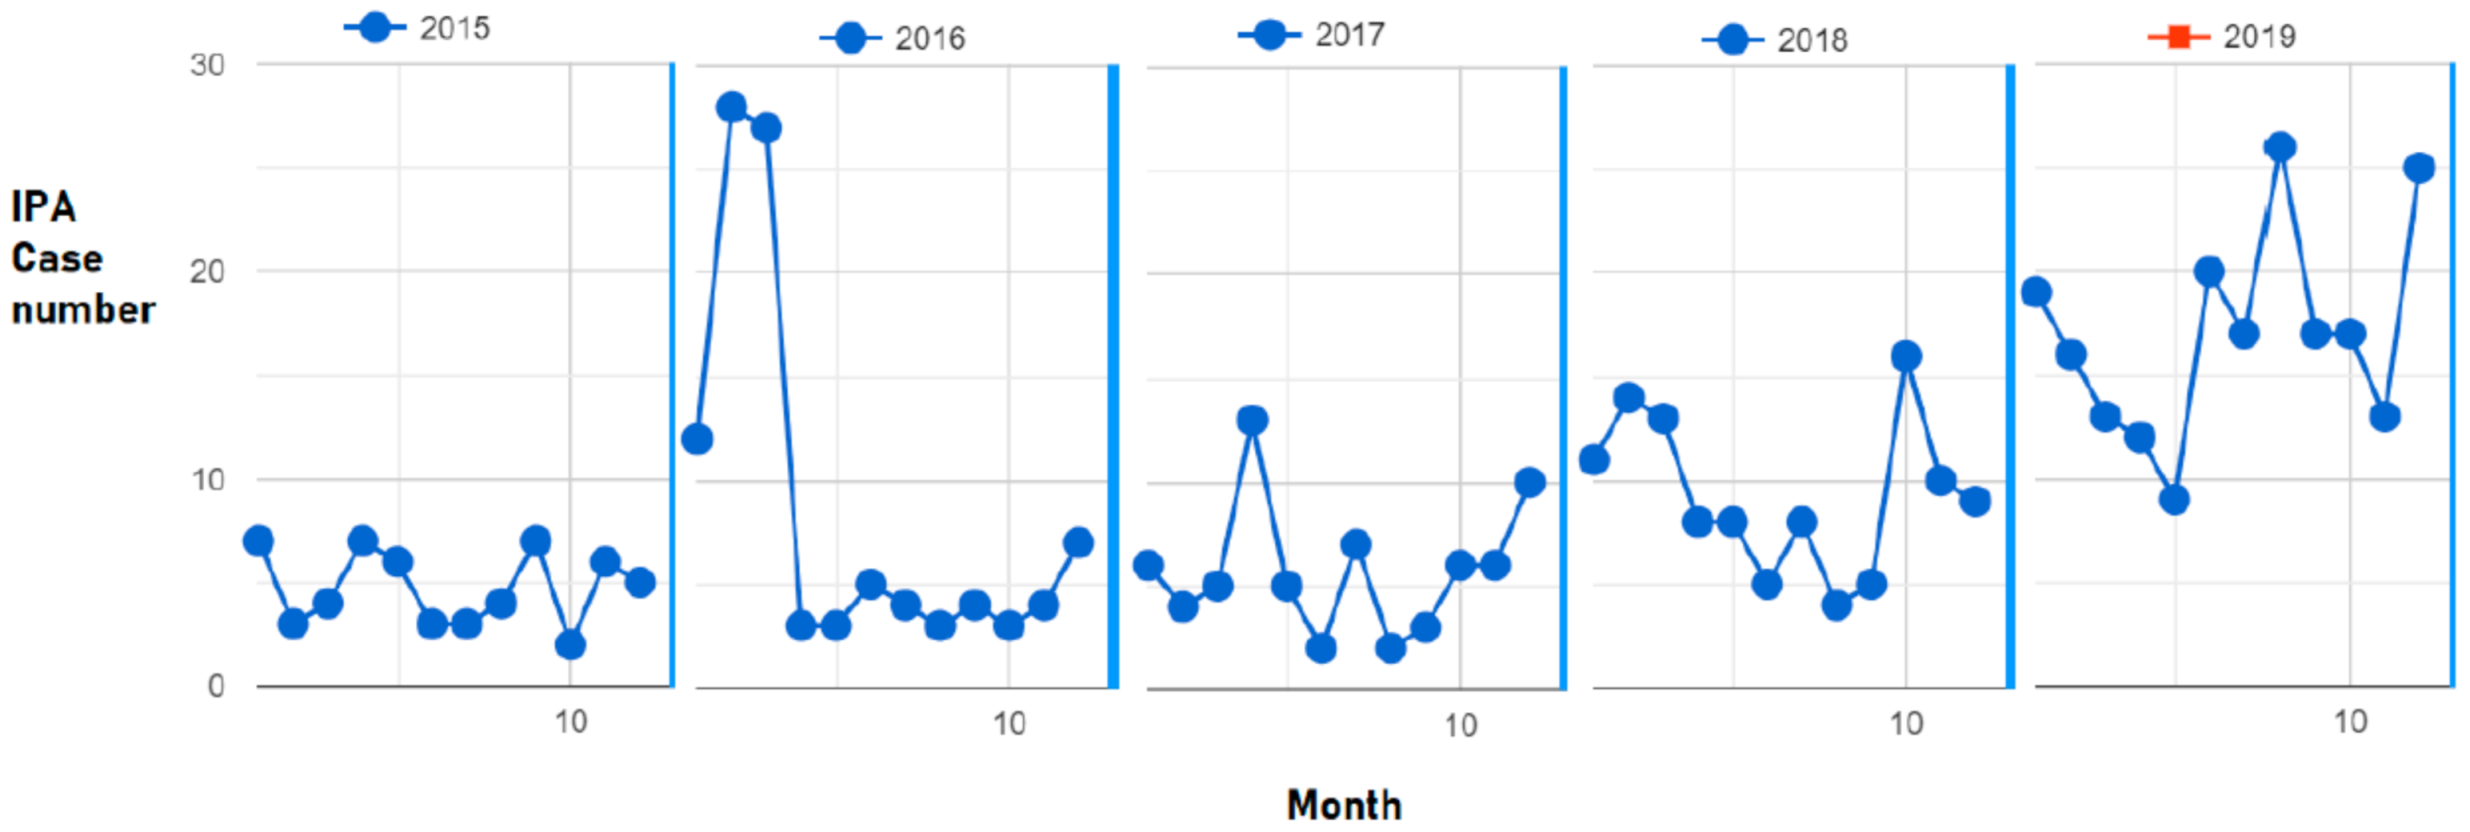
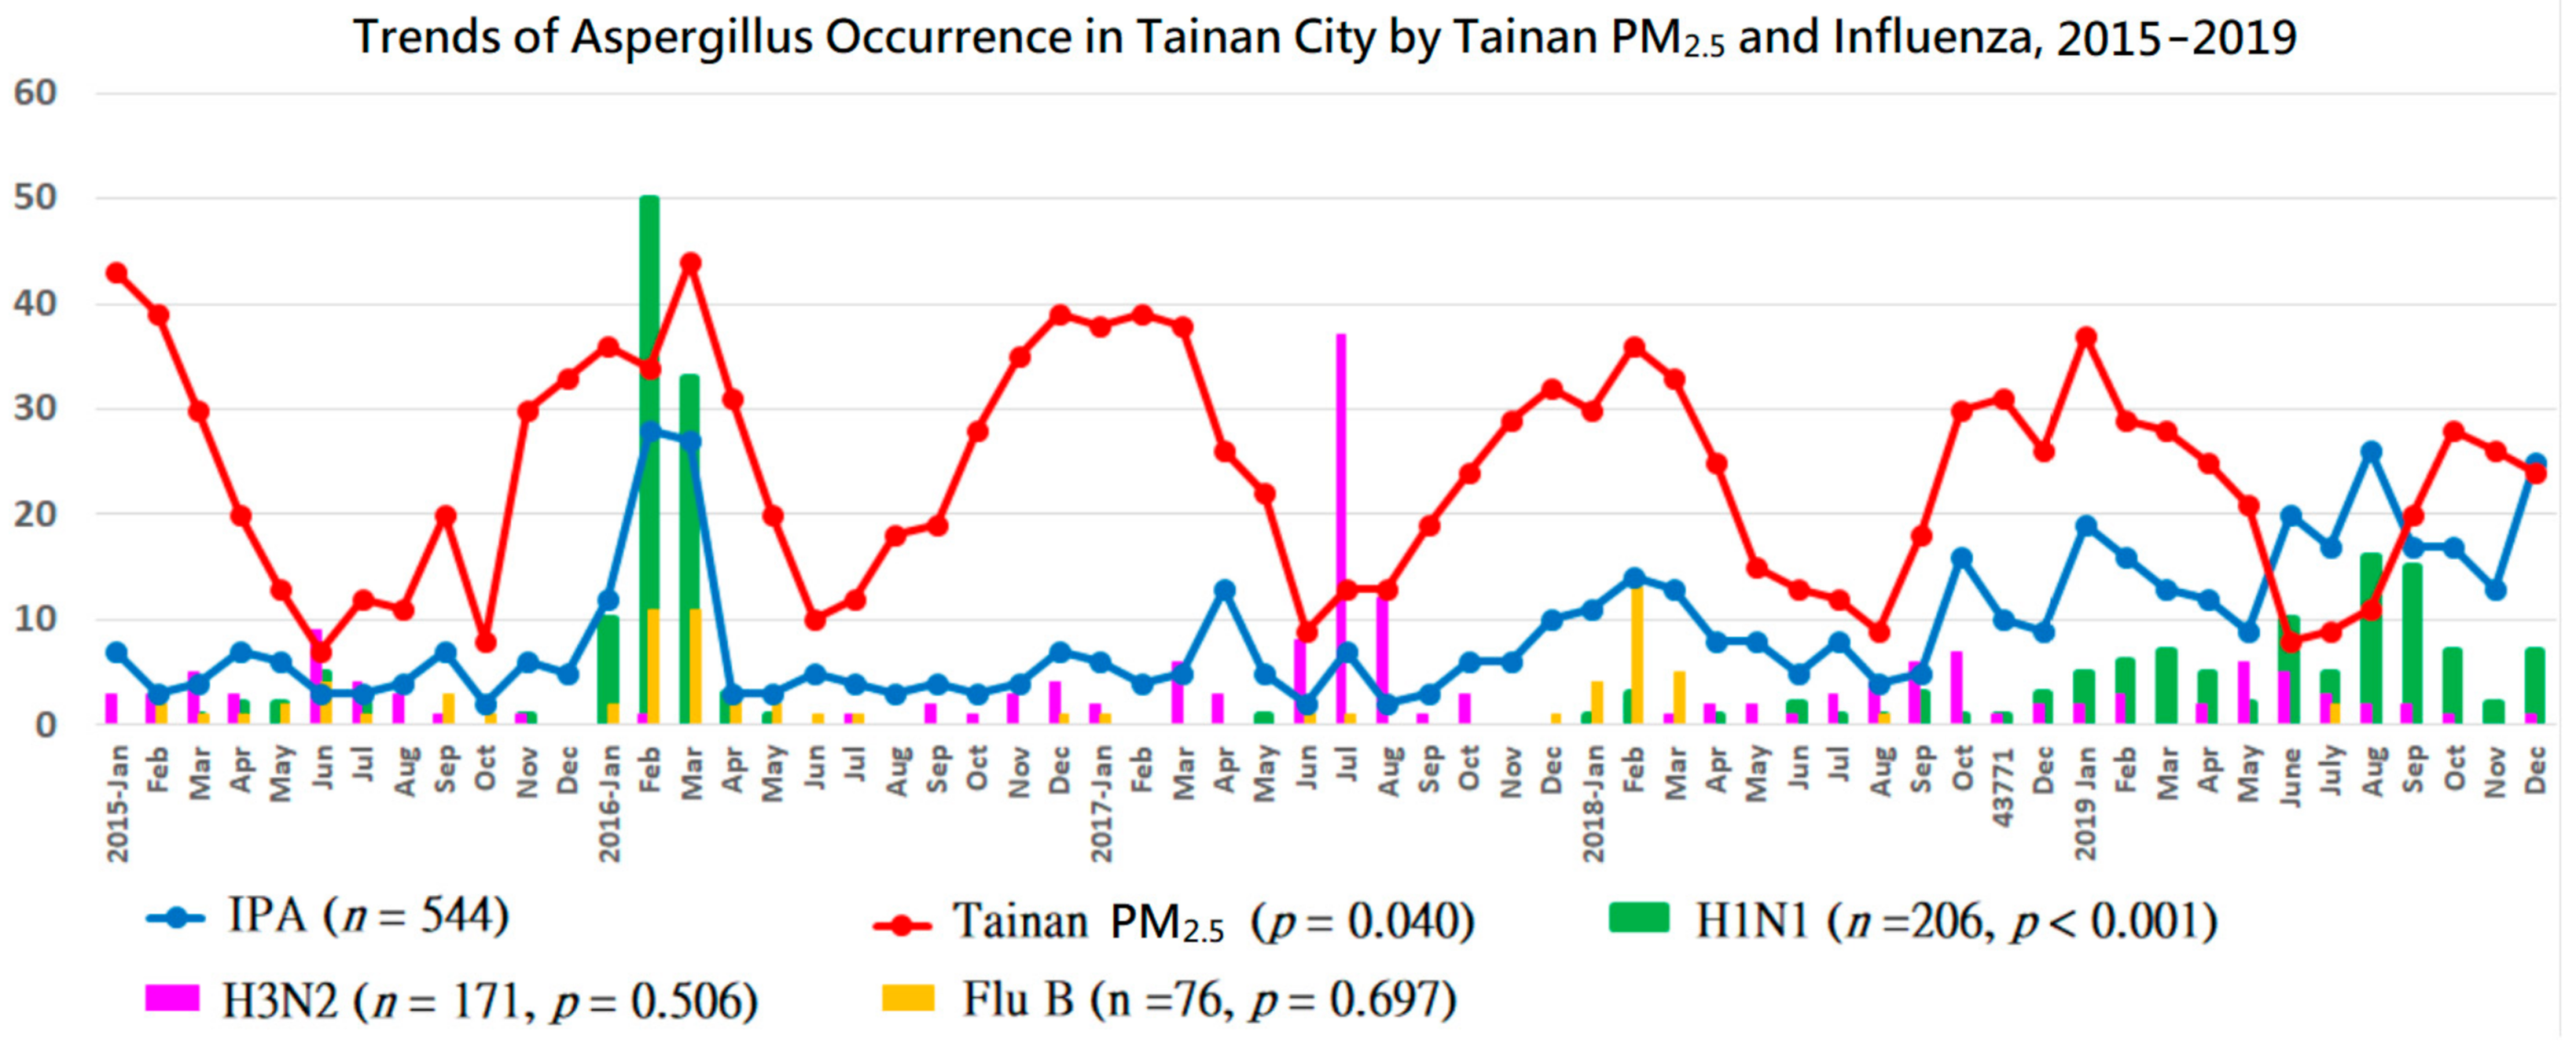
3.1. Trend Analysis
3.2. Correlation Analysis
3.2.1. First Stage (2015–2018)
3.2.2. Second Stage (2019)
3.2.3. Overall (2015–2019)
3.3. Regression Analysis
Predictors for IPA (2015–2019)
4. Discussion
5. Conclusions
Supplementary Materials
Author Contributions
Funding
Acknowledgments
Ethical
Conflicts of Interest
References
- Wu, P.C.; Tsai, J.C.; Li, F.C.; Lung, S.C.; Su, H.J. Increased levels of ambient fungal spores in Taiwan are associated with dust events from China. Atmos. Environ. 2004, 38, 4879–4886. [Google Scholar] [CrossRef]
- Cao, C.; Jiang, W.; Wang, B.; Fang, J.; Lang, J.; Tian, G.; Jiang, J.; Zhu, T.F. Inhalable microorganisms in Beijing’s PM2.5 and PM10 pollutants during a severe smog event. Environ. Sci. Technol. 2014, 48, 1499–1507. [Google Scholar] [CrossRef]
- Chao, H.J.; Chan, C.-C.; Rao, C.Y.; Lee, C.-T.; Chuang, Y.-C.; Chiu, Y.-H.; Hsu, H.-H.; Wu, Y.-H. The effects of transported Asian dust on the composition and concentration of ambient fungi in Taiwan. Int. J. Biometeorol. 2012, 56, 211–219. [Google Scholar] [CrossRef]
- Kallawicha, K.; Tsai, Y.J.; Chuang, Y.C.; Lung, S.C.C.; Wu, C.D.; Chen, T.H.; Chen, P.C.; Chompuchan, C.; Chao, H.J. The spatiotemporal distributions and determinants of ambient fungal spores in the Greater Taipei area. Environ. Pollut. 2015, 204, 173–180. [Google Scholar] [CrossRef] [PubMed]
- Guervilly, C.; Roch, A.; Ranque, S.; Forel, J.-M.; Hraiech, S.; Xeridat, F.; Adda, M.; Papazian, L. A strategy based on galactomannan antigen detection and PCR for invasive pulmonary aspergillosis following influenza A (H1N1) pneumonia. J. Infect 2012, 65, 470–473. [Google Scholar] [CrossRef] [PubMed]
- Wauters, J.; Baar, I.; Meersseman, P.; Meersseman, W.; Dams, K.; De Paep, R.; Lagrou, K.; Wilmer, A.; Jorens, P.; Hermans, G. Invasive pulmonary aspergillosis is a frequent complication of critically ill H1N1 patients: A retrospective study. Intensive Care Med. 2012, 38, 1761–1768. [Google Scholar] [CrossRef] [PubMed]
- Schauwvlieghe, A.F.A.D.; Rijnders, B.J.A.; Philips, N.; Verwijs, R.; Vanderbeke, L.; Van Tienen, C.; Lagrou, K.; Verweij, P.E.; Van De Veerdonk, F.L.; Gommers, D.; et al. Invasive aspergillosis in patients admitted to the intensive care unit with severe influenza: A retrospective cohort study. Lancet Respir. Med. 2018, 6, 782–792. [Google Scholar] [CrossRef]
- Ku, Y.H.; Chan, K.S.; Yang, C.C.; Tan, C.K.; Chuang, Y.C.; Yu, W.L. Higher mortality of severe influenza patients with probable aspergillosis than those with and without other coinfections. J. Formos. Med. Assoc. 2017, 116, 660–670. [Google Scholar] [CrossRef]
- Yu, W.-L.; Liu, W.-L.; Chan, K.-S.; Yang, C.-C.; Tan, C.-K.; Tsai, C.-L.; Chen, C.-M.; Chuang, Y.-C. High-level ambient particulate matter before influenza attack with increased incidence of Aspergillus antigenemia in southern Taiwan, 2016. J. Microbiol. Immunol. Infect. 2018, 51, 141–147. [Google Scholar] [CrossRef]
- Schroeder, M.; Simon, M.; Katchanov, J.; Wijaya, C.; Rohde, H.; Christner, M.; Laqmani, A.; Wichmann, D.; Fuhrmann, V.; Kluge, S. Does galactomannan testing increase diagnostic accuracy for IPA in the ICU? A prospective observational study. Crit. Care 2016, 20, 139. [Google Scholar] [CrossRef] [Green Version]
- Liu, J.-W.; Chen, Y.-H.; Lee, W.-S.; Lin, J.-C.; Chuang, Y.-C.; Lin, H.-H.; Liu, Y.-C.; Tang, H.-J.; Chen, Y.-S.; Ko, W.-C.; et al. Randomized noninferiority trial of cefoperazone-sulbactam versus cefepime in the treatment of hospital-acquired and healthcare-associated pneumonia. Antimicrob. Agents Chemother. 2019, 63, e00023-19. [Google Scholar] [CrossRef] [PubMed] [Green Version]
- Donnelly, J.P.; Chen, S.C.; Kauffman, C.A.; Steinbach, W.J.; Baddley, J.W.; E Verweij, P.E.; Clancy, C.J.; Wingard, J.R.; Lockhart, S.R.; Groll, A.H.; et al. Revision and update of the consensus definitions of invasive fungal disease from the European Organization for Research and Treatment of Cancer and the Mycoses Study Group Education and Research Consortium. Clin. Infect. Dis. 2020, 71, 1367–1376. [Google Scholar] [CrossRef] [PubMed] [Green Version]
- Liu, W.L.; Yu, W.L.; Chan, K.S.; Yang, C.C.; Wauters, J.; Verweij, P.E. Aspergillosis related to severe influenza: A worldwide phenomenon? Clin. Respir. J. 2019, 13, 540–542. [Google Scholar] [CrossRef]
- Chang, S.Y.; Fang, G.C.; Chou, C.C.; Chen, W.N. Source identifications of PM10 aerosols depending on hourly measurements of soluble components characterization among different events in Taipei Basin during spring season of 2004. Chemosphere 2006, 65, 792–801. [Google Scholar] [CrossRef] [PubMed]
- Chuang, M.T.; Lee, C.T.; Hsu, H.C. Quantifying PM2.5 from long-range transport and local pollution in Taiwan during winter monsoon: An efficient estimation method. J. Environ. Manag. 2018, 227, 10–22. [Google Scholar] [CrossRef]
- Madhwal, S.; Prabhu, V.; Sundriyal, S.; Shridhar, V. Ambient bioaerosol distribution and associated health risks at a high traffic density junction at Dehradun city, India. Environ. Monit. Assess. 2020, 192, 196. [Google Scholar] [CrossRef] [PubMed] [Green Version]
- Liu, Y.; Wu, J.; Yu, D.; Ma, Q. The relationship between urban form and air pollution depends on seasonality and city size. Environ. Sci. Pollut. Res. Int. 2018, 25, 15554–15567. [Google Scholar] [CrossRef]
- Schwartz, I.S.; Friedman, D.Z.P.; Zapernick, L.; Dingle, T.C.; Lee, N.; Sligl, W.; Zelyas, N.; Smith, S.W. High rates of influenza-associated invasive pulmonary aspergillosis may not be universal: A retrospective cohort study from Alberta, Canada. Clin. Infect. Dis. 2020, 71, 1760–1763. [Google Scholar] [CrossRef]
- Thevissen, K.; Jacobs, C.; Holtappels, M.; Toda, M.; Verweij, P.; Wauters, J. International survey on influenza-associated pulmonary aspergillosis (IAPA) in intensive care units: Responses suggest low awareness and potential underdiagnosis outside Europe. Crit. Care 2020, 24, 84. [Google Scholar] [CrossRef] [Green Version]
- Toda, M.; Beekmann, S.E.; Polgreen, P.M.; Chiller, T.M.; Jackson, B.R.; Beer, K.D. Knowledge of infectious disease specialists regarding aspergillosis complicating influenza, United States. Emerg. Infect. Dis. 2020, 26, 809–811. [Google Scholar] [CrossRef]
- Lai, C.C.; Chen, C.M.; Liao, K.M.; Chao, C.M.; Chan, K.S.; Yu, W.L. A mysterious surge of aspergillosis among non-SARS-CoV-2 patients during COVID-19 pandemic. J. Microbiol. Immunol. Infect. 2021, 54, 156–158. [Google Scholar] [CrossRef] [PubMed]
- Verweij, P.E.; Rijnders, B.J.A.; Brüggemann, R.J.M.; Azoulay, E.; Bassetti, M.; Blot, S.; Calandra, T.; Clancy, C.J.; Cornely, O.A.; Chiller, T.; et al. Review of influenza-associated pulmonary aspergillosis in ICU patients and proposal for a case definition: An expert opinion. Intensive Care Med. 2020, 46, 1524–1535. [Google Scholar] [CrossRef] [PubMed]
- Rozaliyani, A.; Sedono, R.; Jusuf, A.; Rumende, C.M.; Aniwidyaningsih, W.; Burhan, E.; Prasenohadi, P.; Handayani, D.; Yunihastuti, E.; Siagian, F.E.; et al. A novel diagnosis scoring model to predict invasive pulmonary aspergillosis in the intensive care unit. Saudi Med. J. 2019, 40, 140–146. [Google Scholar] [CrossRef] [PubMed]


| Year | 2015 a | 2016 a | 2017 a | 2018 a | 2019 b | p for mean |
|---|---|---|---|---|---|---|
| Mean | 4.75 | 8.58 | 5.75 | 9.25 | 17.00 | <0.0001 |
| SD | 1.82 | 9.20 | 3.19 | 3.74 | 5.05 | |
| Slope | 0 | −0.394 | 0.134 | −0.444 | 0.171 | |
| CI 90% | (0, 0) | (−1.024, 0.236) | (−0.325, 0.593) | (−1.333, 0.444) | (−0.240, 0.583) | |
| P for slope | 0.681 | 0.303 | 0.631 | 0.411 | 0.493 | |
| Year | 2015–2016 | 2015–2017 | 2015–2018 | 2015–2019 | ||
| Slope | 0 | 0 | 0.077 | 0.185 | ||
| CI 90% | (0, 0) | (0, 0) | (0.021, 0.133) | (0.122, 0.248) | ||
| P for slope | 0.823 | 0.806 | 0.023 | <0.00001 | ||
| Year | 2015–2017 | 2018–2019 | ||||
| Slope | 0 | 0.500 | ||||
| CI 90% | (0, 0) | (0.209, 0.791) | ||||
| P for slope | 0.806 | 0.005 | ||||
| Year | 2015–2017 vs. 2018–2019 | |||||
| Slope difference | −0.500 | |||||
| CI 90% | (0, 0) | |||||
| p for slope difference | 0.005 | |||||
| IPA in 3 Tainan Institutes (n) | Influenza(all) (n, p Values) | Flu A (H3N2) (n, p Values) | Non-typed FluA (n, p Values) | Influenza B (n, p Values) | Flu A (H1N1) (n, p Values) | PM2.5 in Tainan | PM10 in Tainan |
|---|---|---|---|---|---|---|---|
| Retrospective (Stage 1) | |||||||
| 2015 (57) | 92, 0.710 | 32, 0.479 | 32, 0.906 | 15, 0.526 | 13, 0.882 | 0.122 | 0.455 |
| 2016 (103) | 235, 0.039 | 12, 0.654 | 94, 0.077 | 32, 0.089 | 97, 0.111 | 0.094 | 0.078 |
| 2017 (69) | 133, 0.203 | 72, 0.627 | 56, 0.041 * | 4, 0.466 | 1, 0.785 | 0.284 | 0.121 |
| 2018 (111) | 89, 0.792 | 29, 0.257 | 20, 0.271 | 23, 0.220 | 17, 0.698 | 0.002 | 0.005 |
| Subtotal (340) | 549, 0.340 | 145, 0.335 | 202, 0.567 | 74, 0.301 | 128, 0.042 | 0.001 | 0.001 |
| Prospective (Stage 2) | |||||||
| 2019 (204) | 165, 0.198 | 27, 0.956 | 62, 0.724 | 2, 0.892 | 78, 0.015 | 0.334 | 0.552 |
| Overall (544) | 714, 0.002 | 171, 0.506 | 261, 0.124 | 76, 0.697 | 206, < 0.001 | 0.040 | 0.061 |
| IPA in Severe Influenza (%, n/N) | IPA in Severe H1N1 (%, n/N) | IPA in Severe H3N2 (%, n/N) | IPA in Severe other Flu A (%, n/N) | IPA in Severe Flu B (%, n/N) | Tainan PM2.5 | Tainan PM10 |
|---|---|---|---|---|---|---|
| Retrospective (Stage 1) | ||||||
| 2015 (11.3, 7/62) | 8.3, 1/12 | 10.7, 3/28 | 13.3, 2/15 | 14.3, 1/7 | 0.654 | 0.787 |
| 2016 (16,2, 22/136) | 16.7, 13/78 | 0, 0/12 | 34.6, 9/26 | 0, 0/20 | 0.058 | 0.064 |
| 2017 (3.2, 2/62) | 0, 0/0 | 1.8, 1/57 | 0, 0/2 | 33.3, 1/3 | 0.894 | 0.809 |
| 2018 (18.2, 10/55) | 7.7, 1/13 | 11.1, 3/27 | 25, 1/4 | 45.5, 5/11 | 0.403 | 0.738 |
| Subtotal (13.0, 41/315) P for 2015–2018 | 14.6, 15/103 0.007 | 5.6, 7/124 <0.001 | 25.5, 12/47 0.004 | 17.1, 7/41 <0.001 | 0.189 | 0.198 |
| Prospective (Stage 2) | ||||||
| 2019 (21.7, 20/92) P for 2019 | 27.9, 19/68 <0.001 | 0/20 NA | 33.3, 1/3 0.786 | 0/1 NA | 0.221 | 0.427 |
| Overall | ||||||
| 2015–2019 (15.0, 61/407) | 19.9, 34/171 | 4.9, 7/144 | 26.0, 13/50 | 16.7, 7/42 | ||
| P for 2015–2019 | <0.001 | 0.003 | 0.010 | <0.001 | 0.201 | 0.203 |
| Univariate | Model A (Stepwise) | Model B (p < 0.1) | Model C (p < 0.05) | |||||
|---|---|---|---|---|---|---|---|---|
| Variables | β | p | β | p | β | p | β | p |
| Influenza (all) | 0.21 | <0.0001 | 0.34 | 0.0564 | 0.27 | 0.1158 | ||
| H1N1 | 0.60 | <0.0001 | 0.90 | <0.0001 | 0.72 | <0.0001 | 0.76 | <0.0001 |
| H3N2 | –0.15 | 0.3717 | 0.25 | 0.1258 | ||||
| Non-typed FluA | 0.46 | <0.0001 | –0.44 | 0.0302 | –0.92 | 0.0136 | –0.82 | 0.0267 |
| FluB | 0.93 | 0.0034 | –0.46 | 0.1302 | –0.32 | 0.2761 | ||
| Tainan PM2.5 | 0.14 | 0.0932 | 0.27 | 0.0845 | 0.09 | 0.1194 | ||
| Tainan PM10 | 0.06 | 0.2142 | 0.27 | 0.0161 | ||||
| Zuoying PM2.5 | 0.06 | 0.4098 | −0.28 | 0.1151 | ||||
| Zuoying PM10 | 0.00 | 0.9259 | −0.16 | 0.1397 | ||||
| R square | 0.6860 | 0.6072 | 0.5890 | |||||
Publisher’s Note: MDPI stays neutral with regard to jurisdictional claims in published maps and institutional affiliations. |
© 2021 by the authors. Licensee MDPI, Basel, Switzerland. This article is an open access article distributed under the terms and conditions of the Creative Commons Attribution (CC BY) license (http://creativecommons.org/licenses/by/4.0/).
Share and Cite
Liu, J.-W.; Ku, Y.-H.; Chao, C.-M.; Ou, H.-F.; Ho, C.-H.; Chan, K.-S.; Yu, W.-L. Epidemiological Correlation of Pulmonary Aspergillus Infections with Ambient Pollutions and Influenza A (H1N1) in Southern Taiwan. J. Fungi 2021, 7, 227. https://doi.org/10.3390/jof7030227
Liu J-W, Ku Y-H, Chao C-M, Ou H-F, Ho C-H, Chan K-S, Yu W-L. Epidemiological Correlation of Pulmonary Aspergillus Infections with Ambient Pollutions and Influenza A (H1N1) in Southern Taiwan. Journal of Fungi. 2021; 7(3):227. https://doi.org/10.3390/jof7030227
Chicago/Turabian StyleLiu, Jien-Wei, Yee-Huang Ku, Chien-Ming Chao, Hsuan-Fu Ou, Chung-Han Ho, Khee-Siang Chan, and Wen-Liang Yu. 2021. "Epidemiological Correlation of Pulmonary Aspergillus Infections with Ambient Pollutions and Influenza A (H1N1) in Southern Taiwan" Journal of Fungi 7, no. 3: 227. https://doi.org/10.3390/jof7030227