

Relationship between the Hemoglobin-to-Red Cell Distribution Width Ratio and All-Cause Mortality in Septic Patients with Atrial Fibrillation: Based on Propensity Score Matching Method

Abstract
:1. Introduction
2. Materials and Methods
2.1. Data Sources
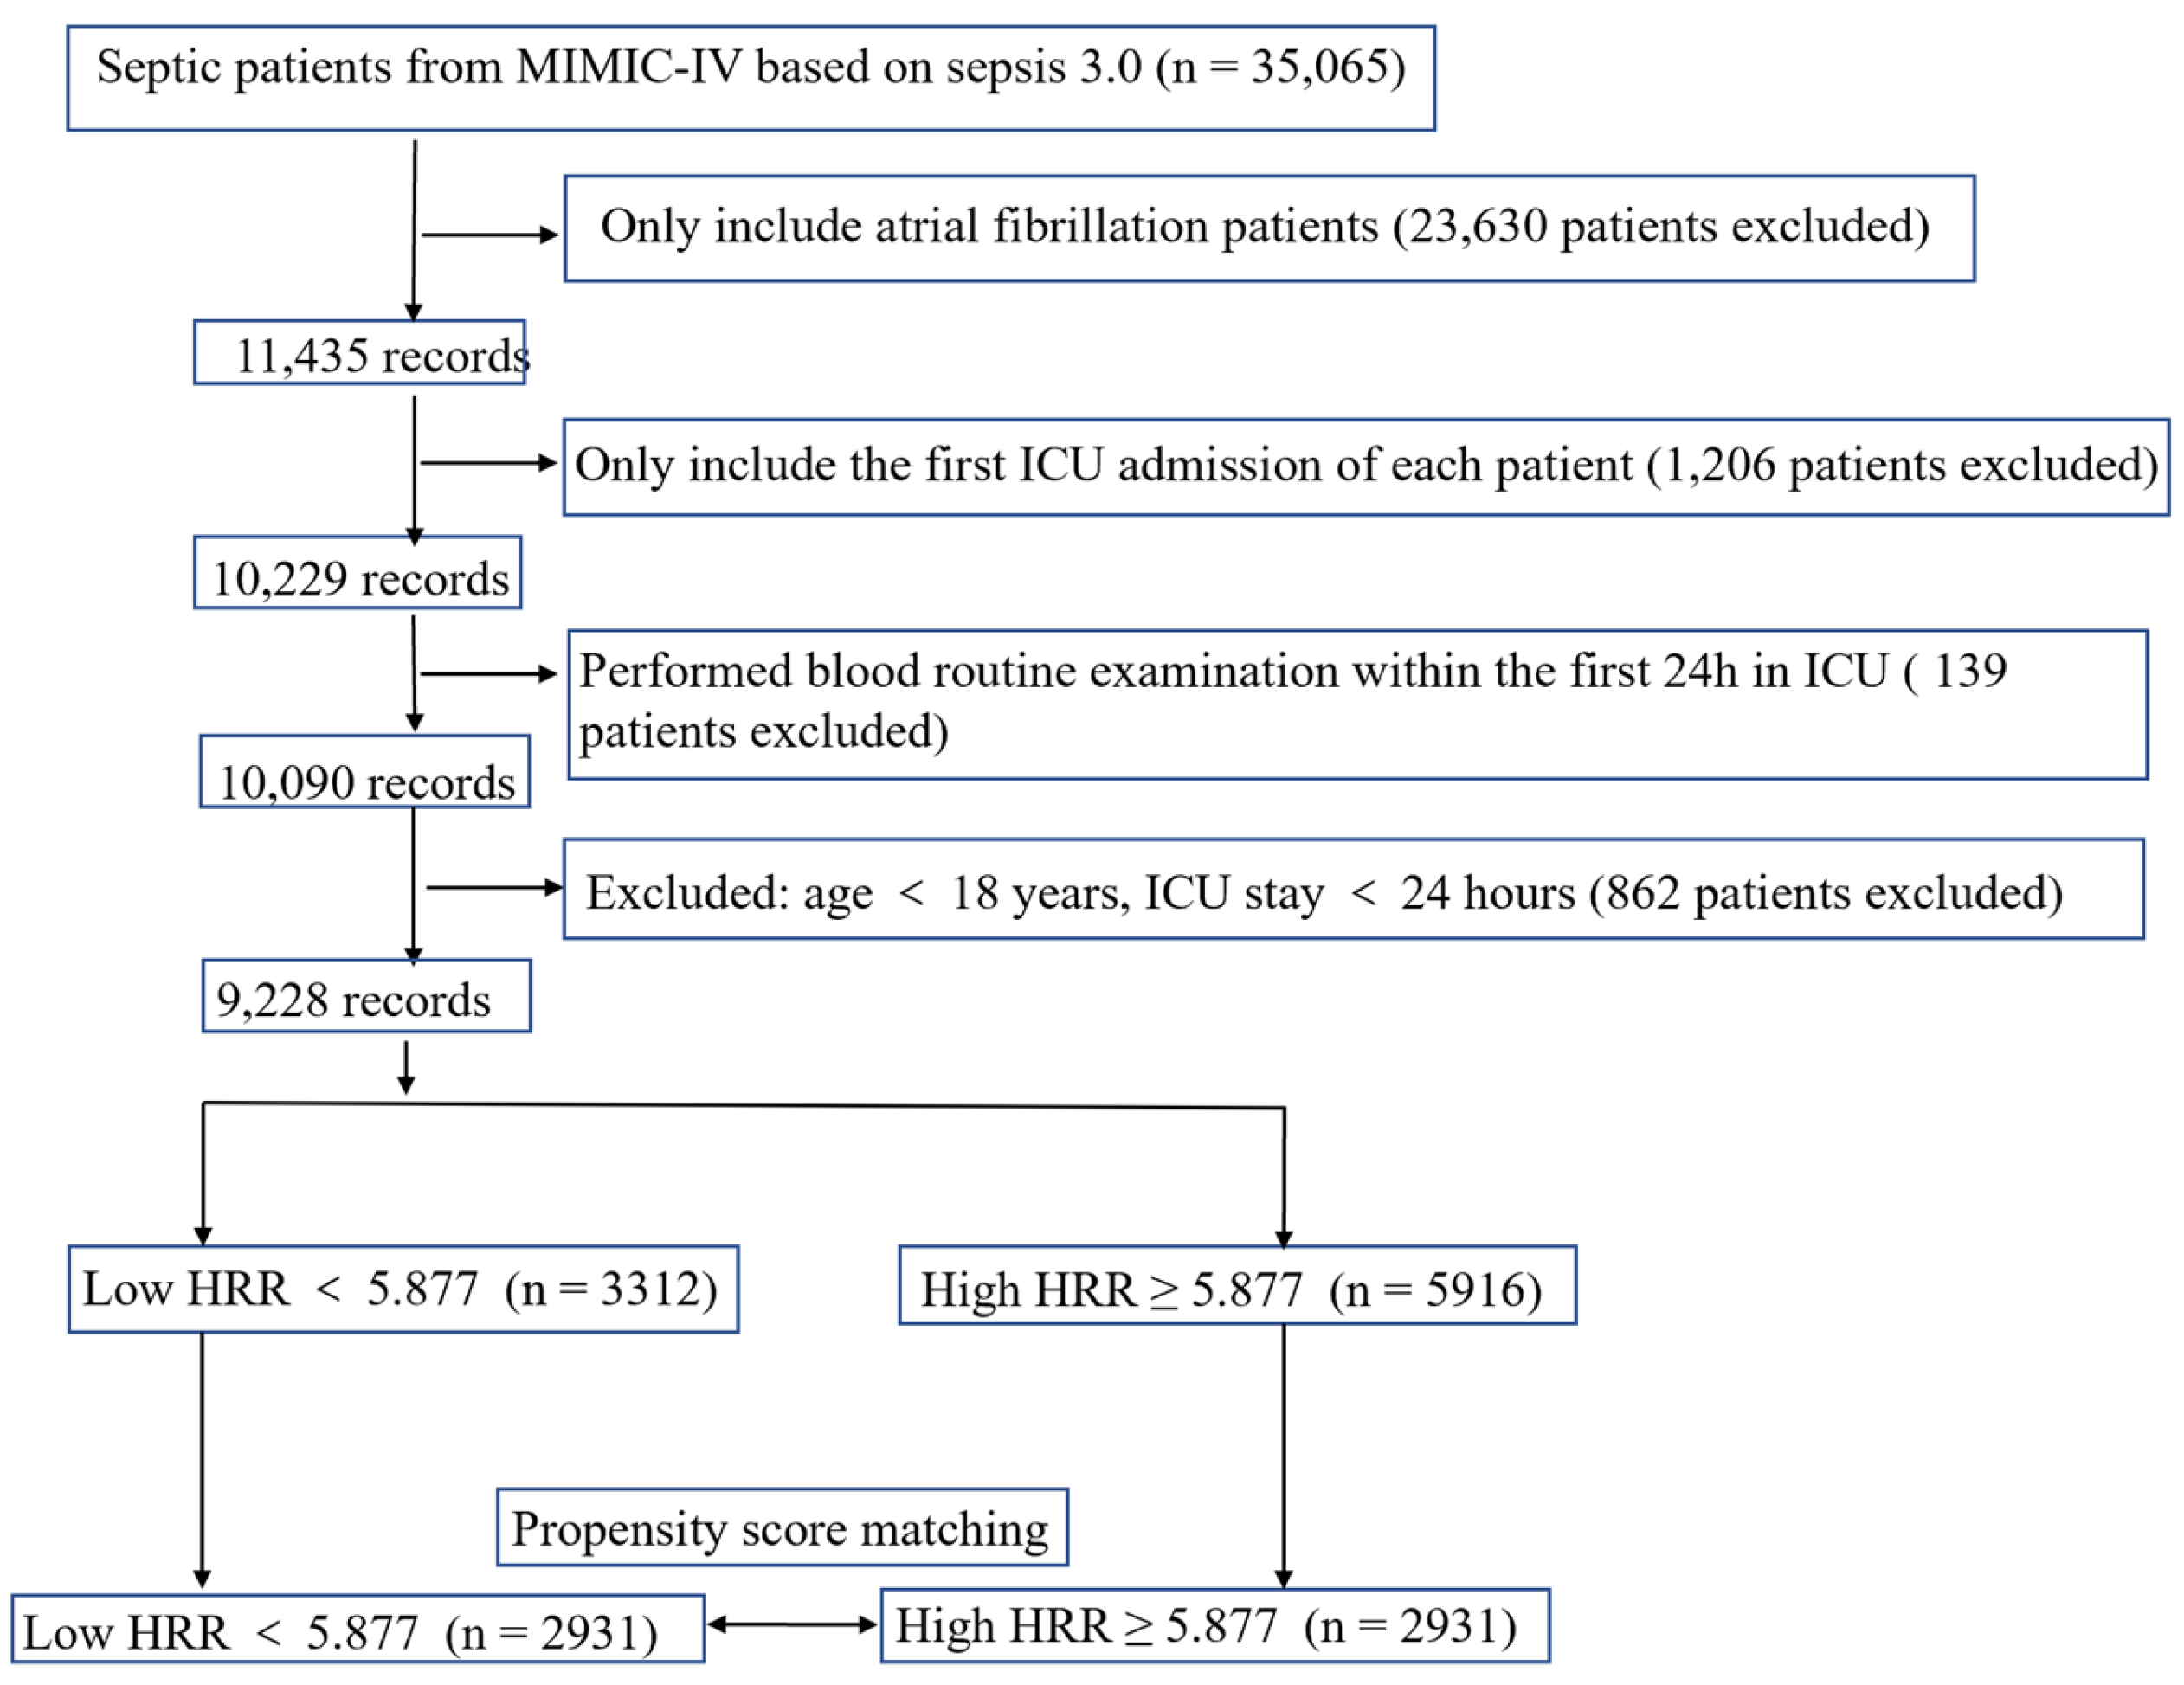
2.2. Study Population
2.3. Data Extraction
2.4. Endpoints
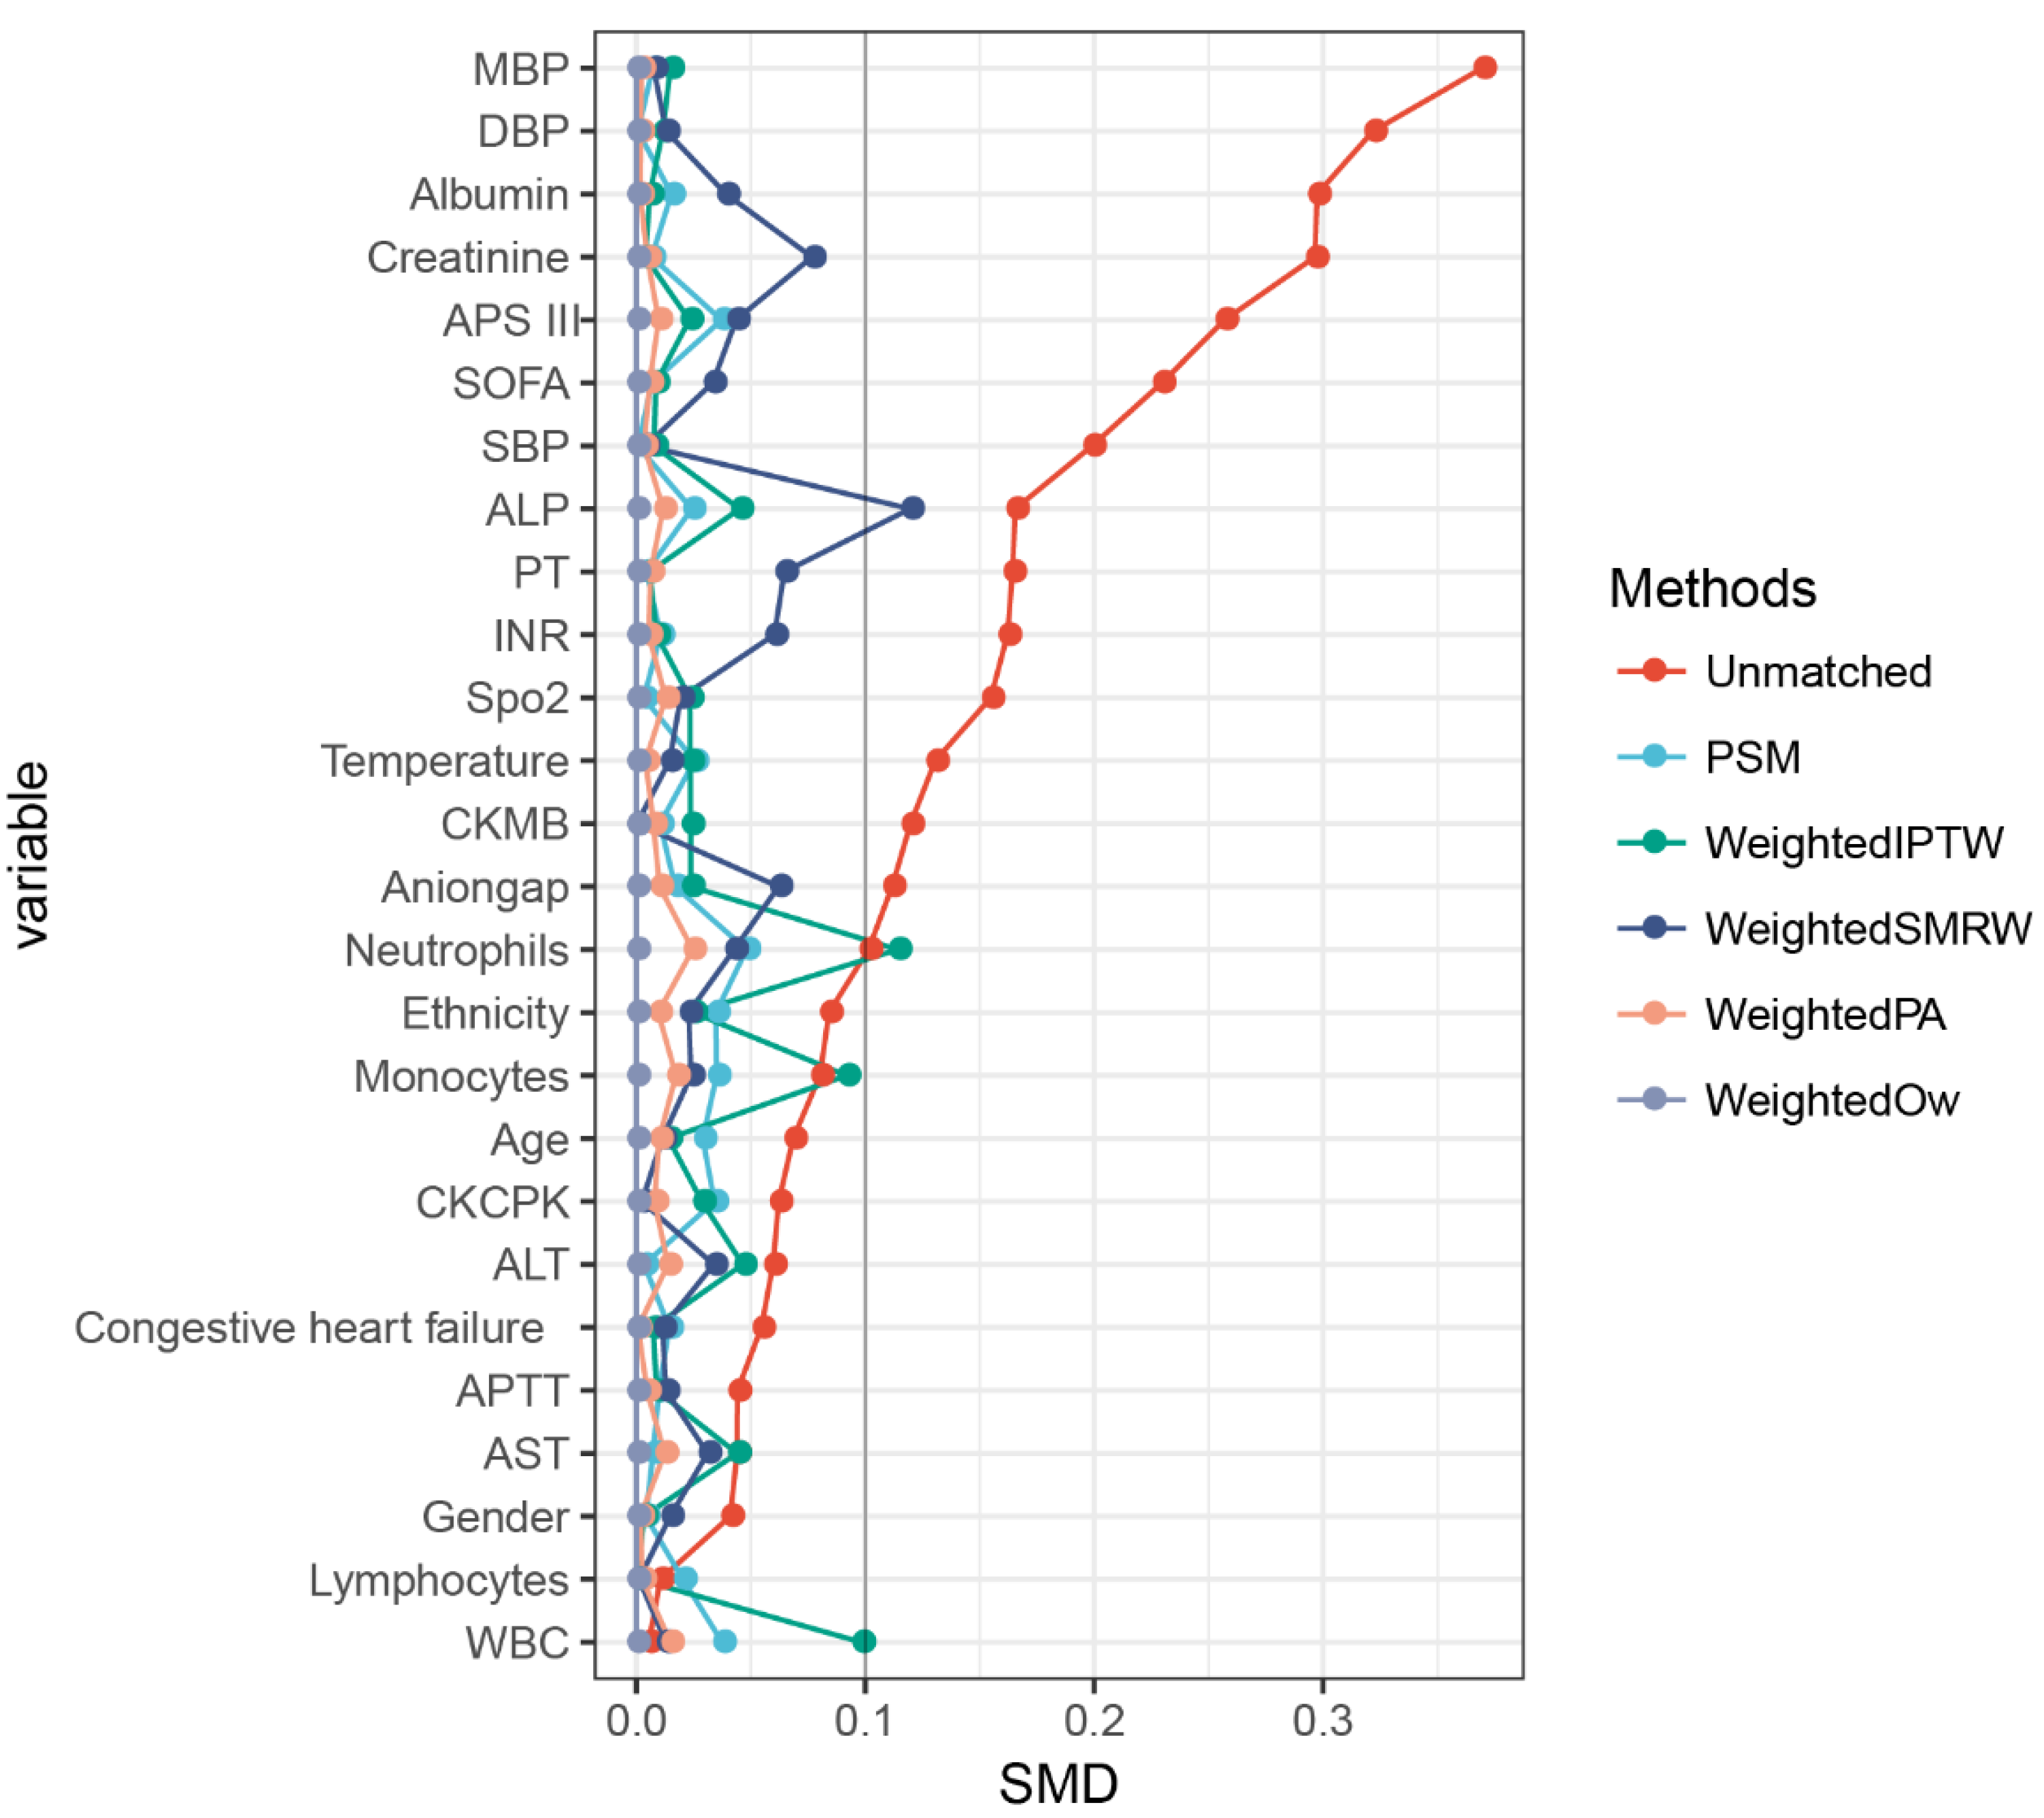
2.5. Statistical Analysis
3. Results
3.1. Data Sources
3.2. Clinical Characteristics of Study Subjects
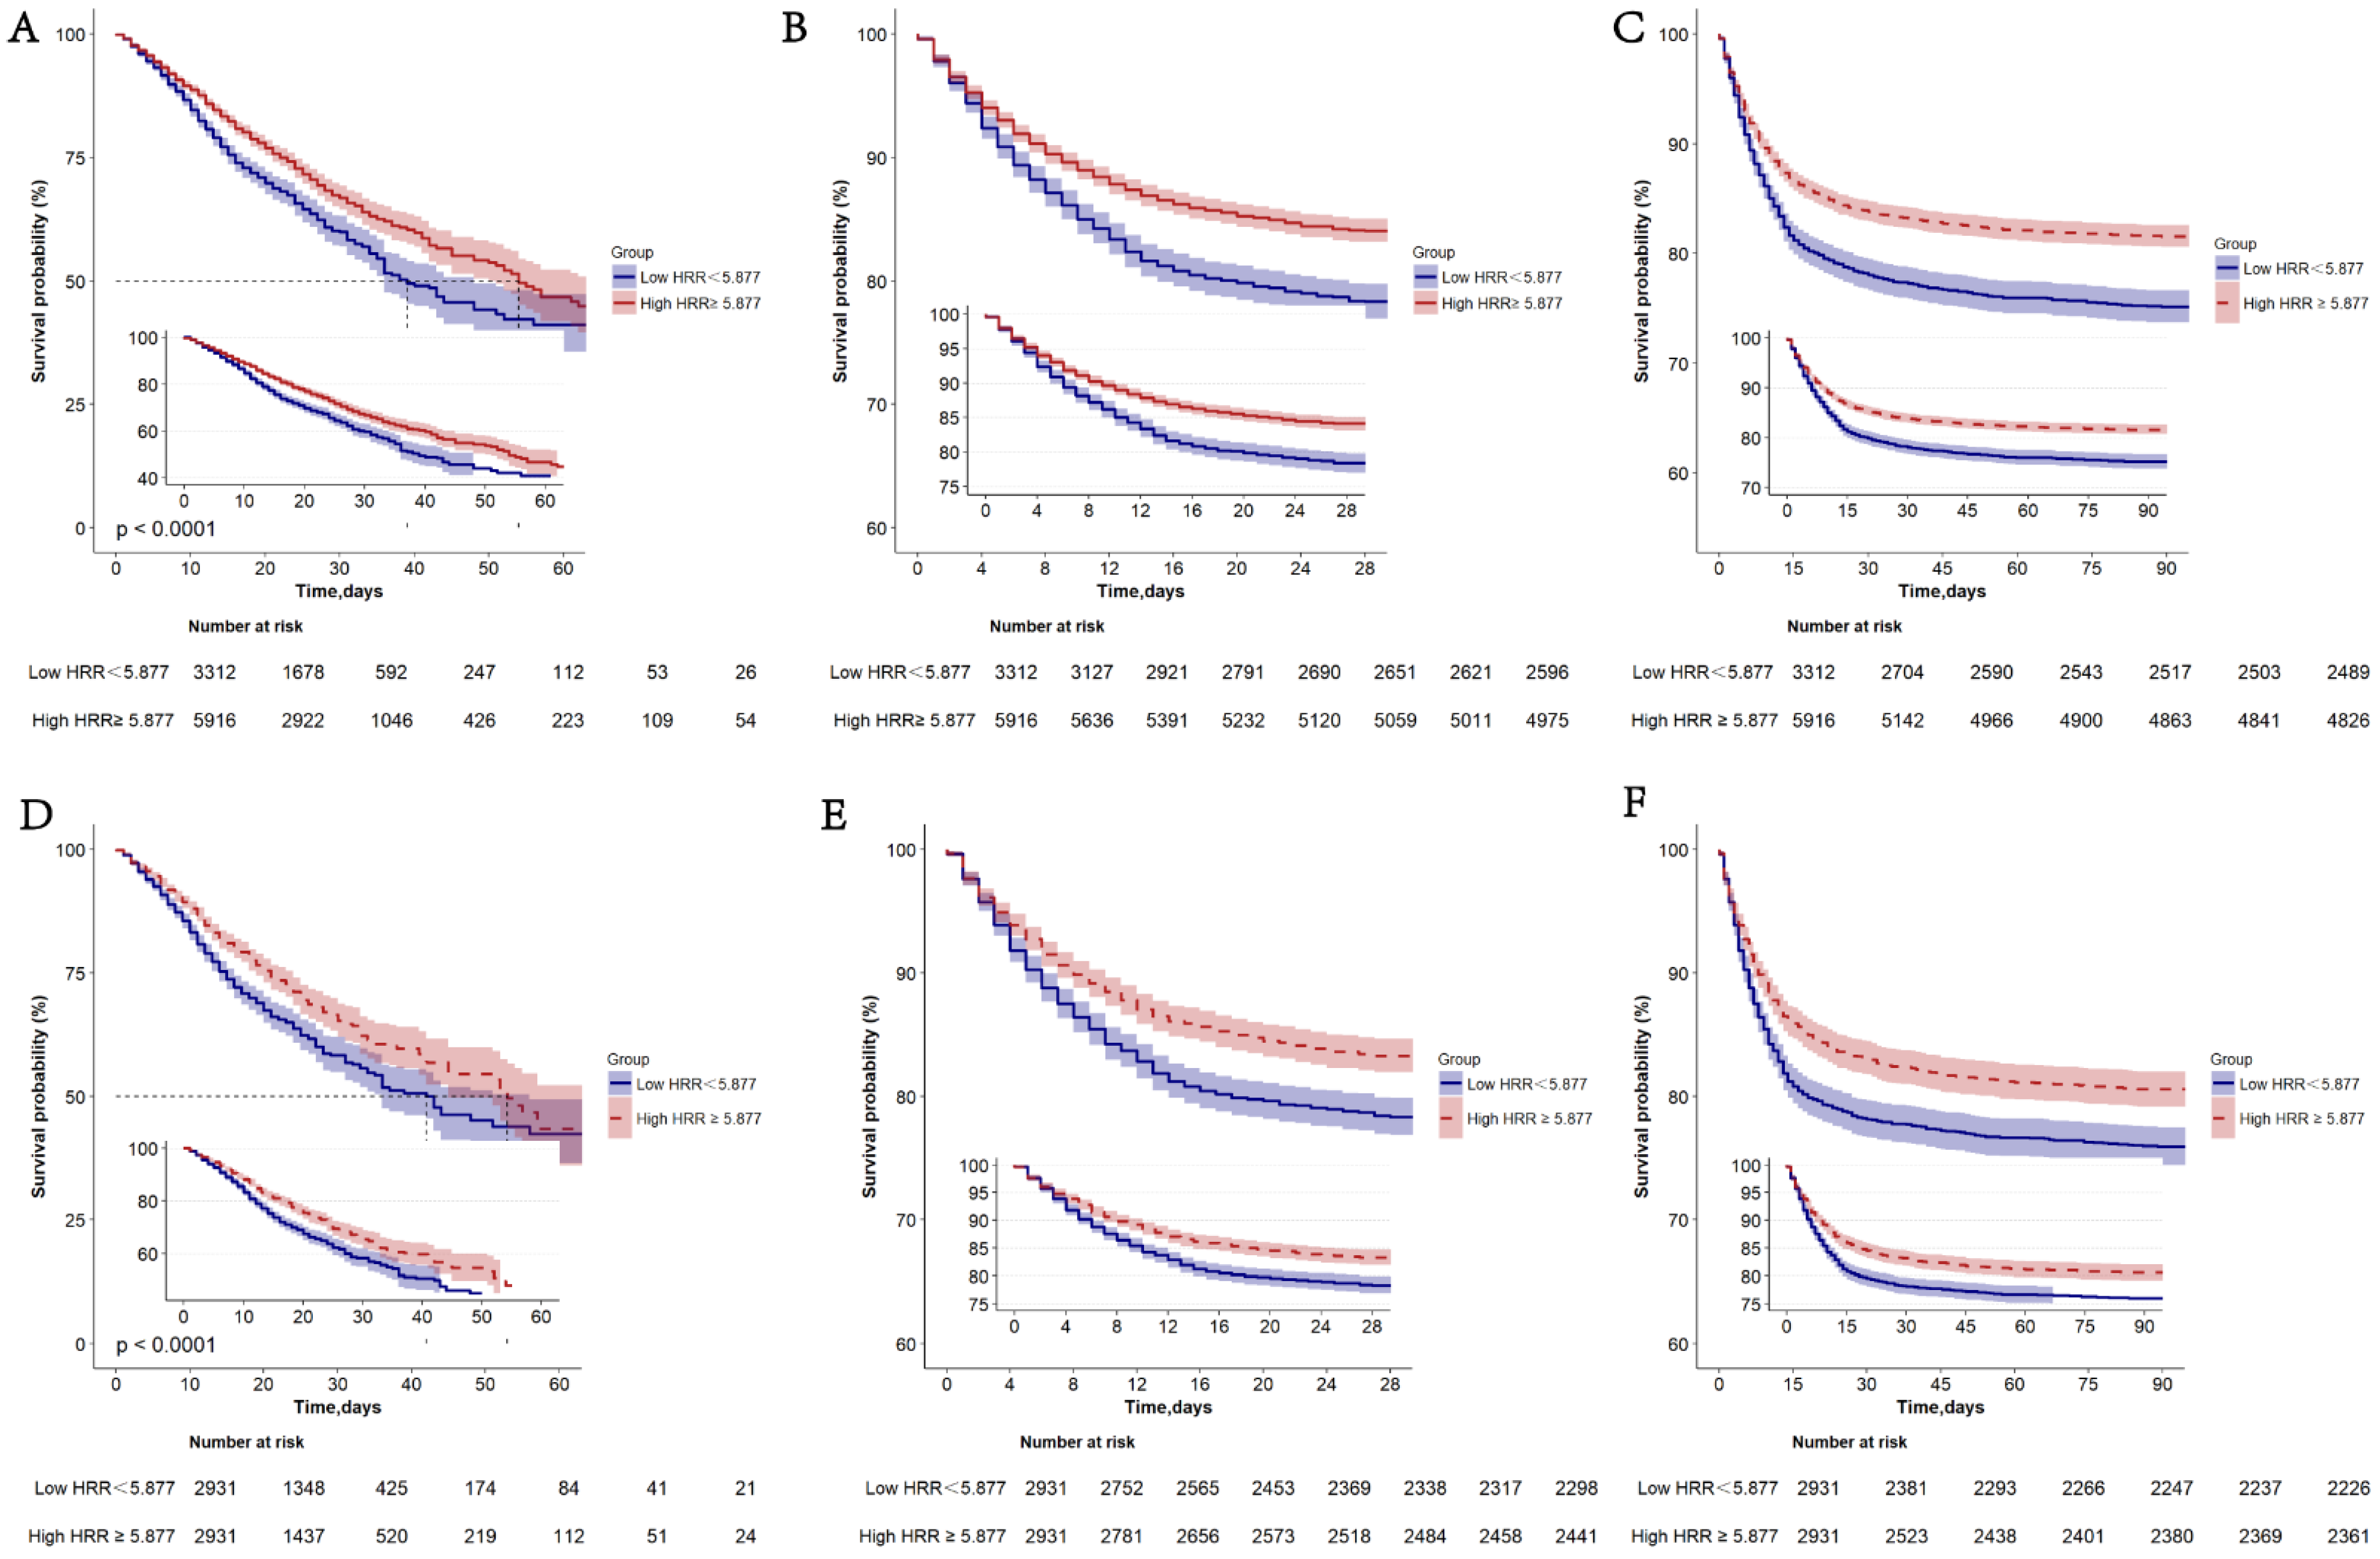
3.3. The Prognostic Significance of HRR before PSM
3.4. Association between HRR and All-Cause Mortality in Septic Patients with Atrial Fibrillation before PSM
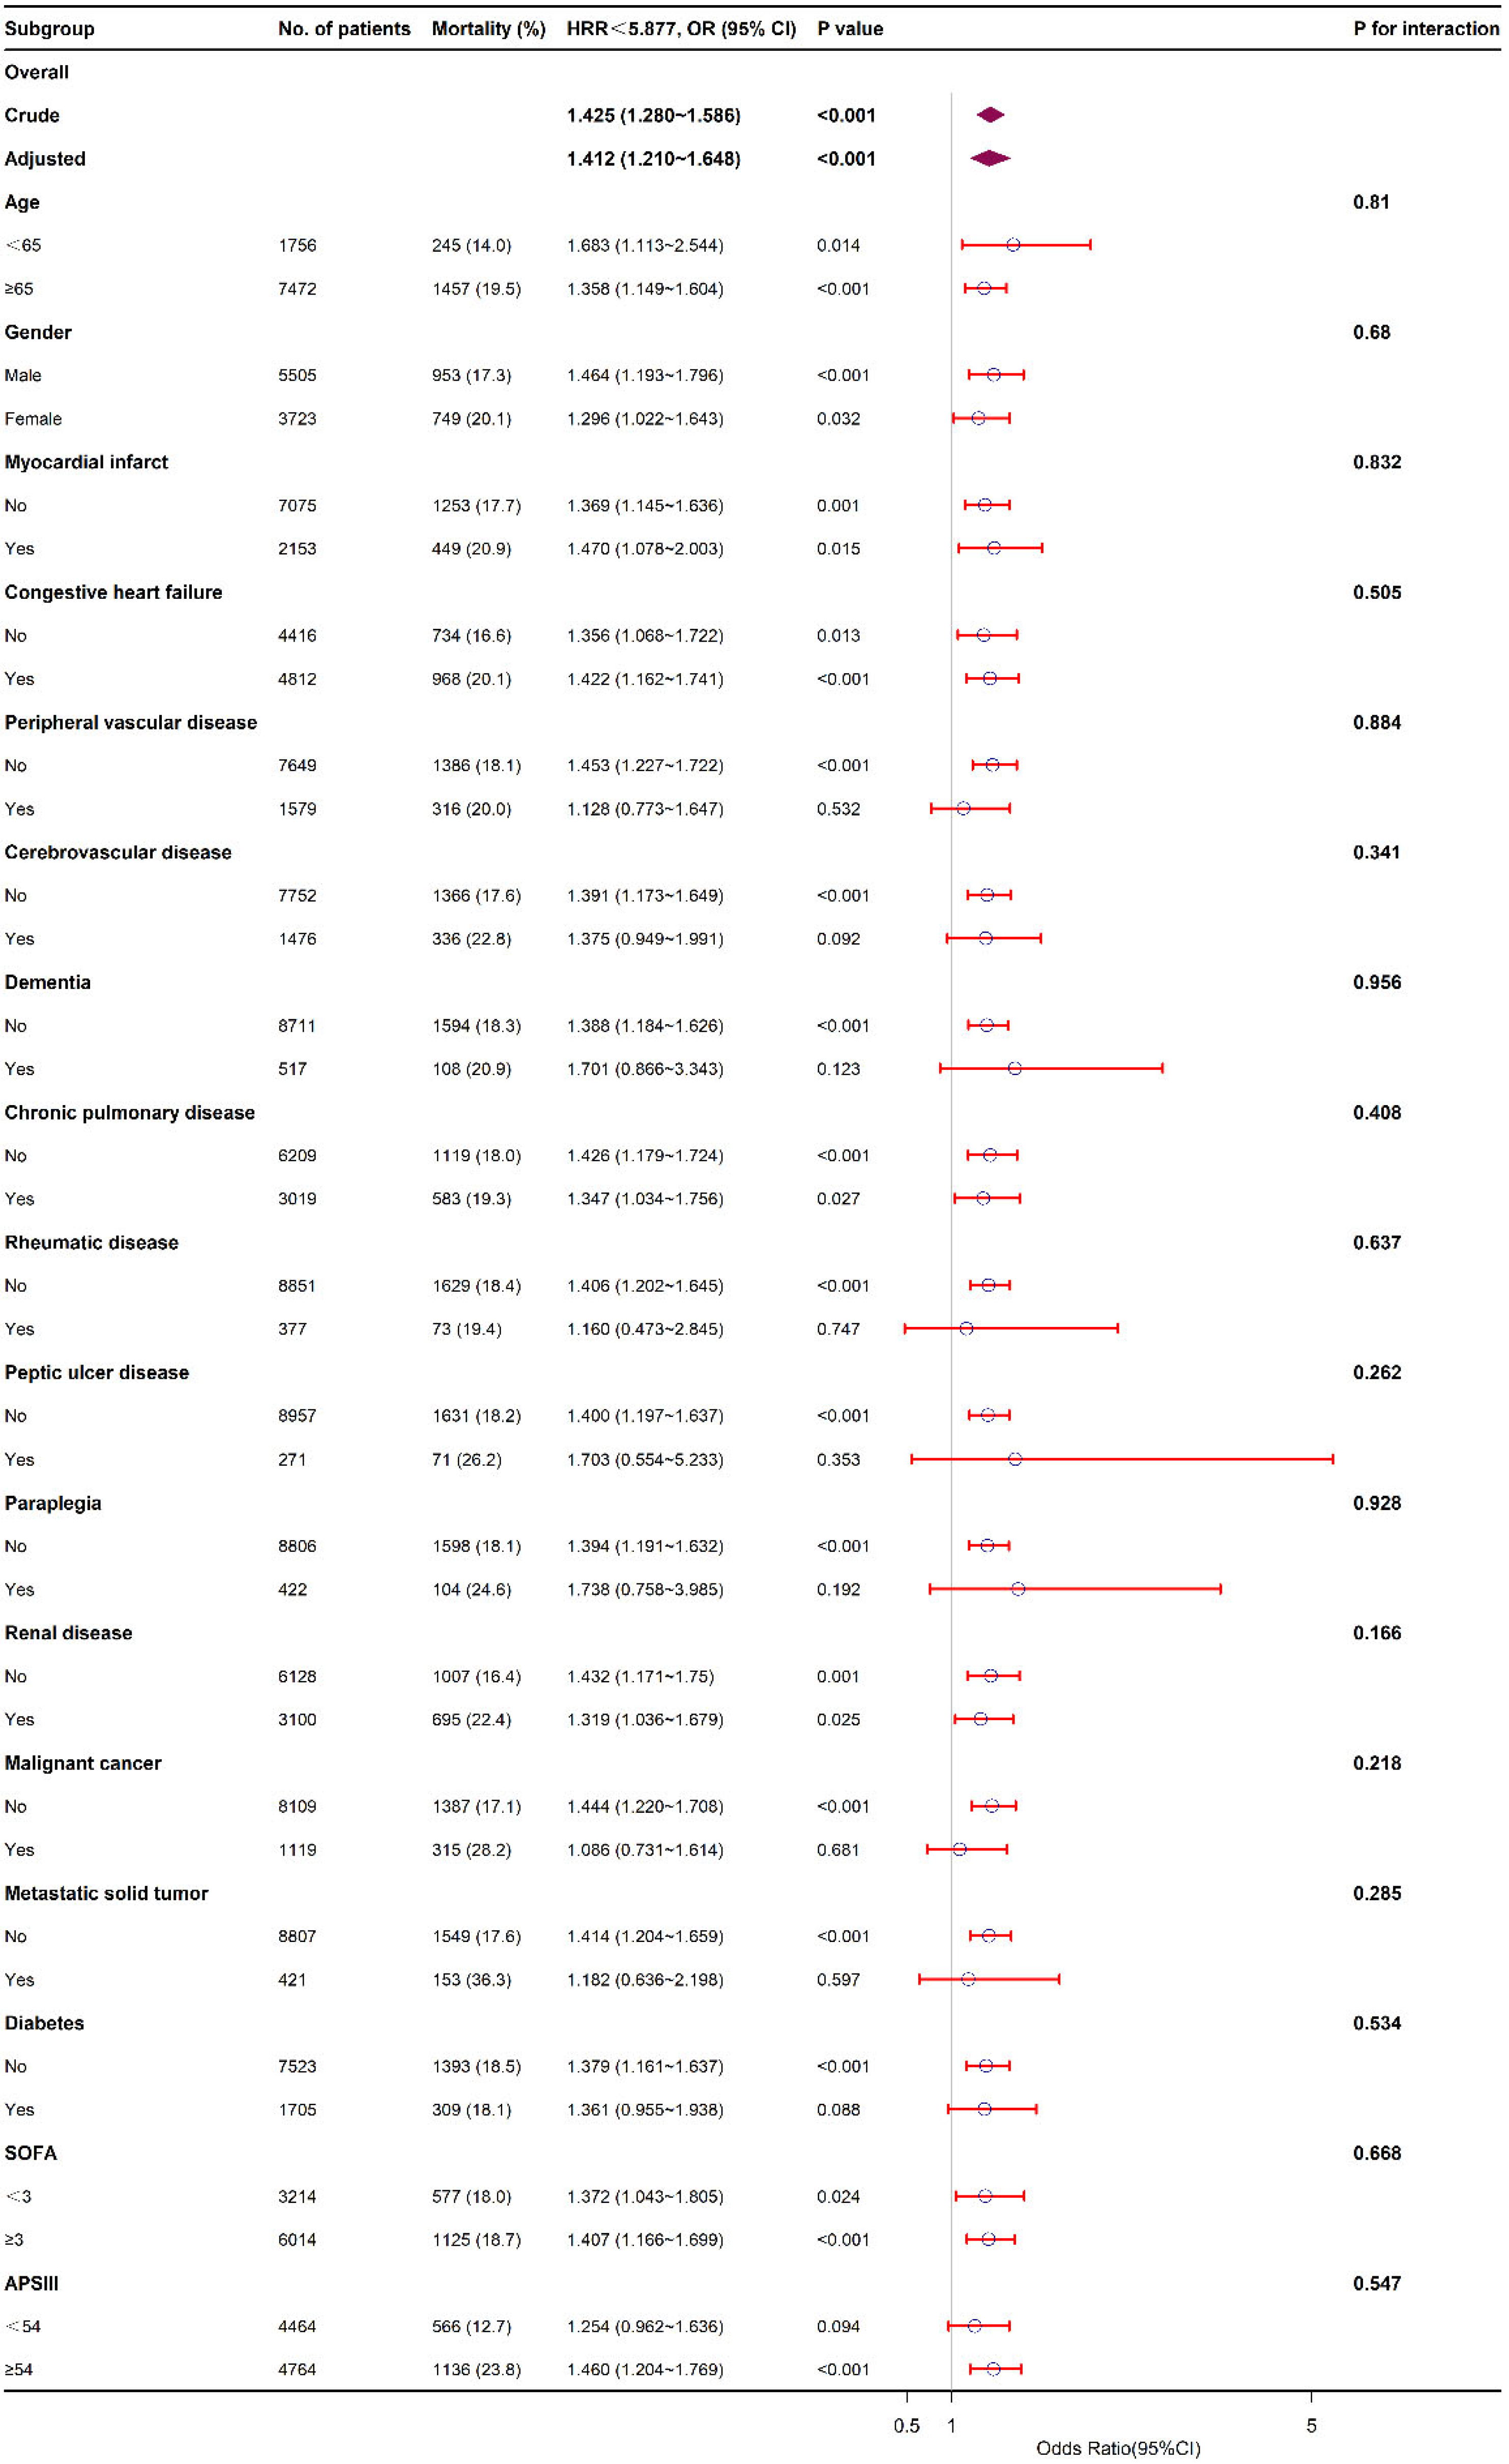
3.5. Subgroup Analysis
3.6. Prognostic Value of HRR after PSM
3.7. Association between HRR and All-Cause Mortality in Septic Patients with Atrial Fibrillation after PSM
4. Discussion
5. Conclusions
Supplementary Materials
Author Contributions
Funding
Institutional Review Board Statement
Informed Consent Statement
Data Availability Statement
Acknowledgments
Conflicts of Interest
Abbreviations
References
- Bashar, S.K.; Hossain, M.B.; Ding, E.; Walkey, A.J.; McManus, D.D.; Chon, K.H. Atrial Fibrillation Detection During Sepsis: Study on MIMIC III ICU Data. IEEE J. Biomed. Health Inform. 2020, 24, 3124–3135. [Google Scholar] [CrossRef] [PubMed]
- Kuipers, S.; Klein Klouwenberg, P.M.; Cremer, O.L. Incidence, risk factors and outcomes of new-onset atrial fibrillation in patients with sepsis: A systematic review. Crit. Care 2014, 18, 688. [Google Scholar] [CrossRef] [PubMed] [Green Version]
- Singer, M.; Deutschman, C.S.; Seymour, C.W.; Shankar-Hari, M.; Annane, D.; Bauer, M.; Bellomo, R.; Bernard, G.R.; Chiche, J.D.; Coopersmith, C.M.; et al. The Third International Consensus Definitions for Sepsis and Septic Shock (Sepsis-3). JAMA 2016, 315, 801–810. [Google Scholar] [CrossRef] [PubMed]
- Ou, S.M.; Chu, H.; Chao, P.W.; Lee, Y.J.; Kuo, S.C.; Chen, T.J.; Tseng, C.M.; Shih, C.J.; Chen, Y.T. Long-Term Mortality and Major Adverse Cardiovascular Events in Sepsis Survivors. A Nationwide Population-based Study. Am. J. Respir. Crit. Care Med. 2016, 194, 209–217. [Google Scholar] [CrossRef] [PubMed]
- Yende, S.; Linde-Zwirble, W.; Mayr, F.; Weissfeld, L.A.; Reis, S.; Angus, D.C. Risk of cardiovascular events in survivors of severe sepsis. Am. J. Respir. Crit. Care Med. 2014, 189, 1065–1074. [Google Scholar] [CrossRef] [PubMed] [Green Version]
- Annane, D.; Sebille, V.; Duboc, D.; Le Heuzey, J.Y.; Sadoul, N.; Bouvier, E.; Bellissant, E. Incidence and prognosis of sustained arrhythmias in critically ill patients. Am. J. Respir. Crit. Care Med. 2008, 178, 20–25. [Google Scholar] [CrossRef] [Green Version]
- Walkey, A.J.; Wiener, R.S.; Ghobrial, J.M.; Curtis, L.H.; Benjamin, E.J. Incident stroke and mortality associated with new-onset atrial fibrillation in patients hospitalized with severe sepsis. JAMA 2011, 306, 2248–2254. [Google Scholar] [CrossRef] [Green Version]
- Walkey, A.J.; Greiner, M.A.; Heckbert, S.R.; Jensen, P.N.; Piccini, J.P.; Sinner, M.F.; Curtis, L.H.; Benjamin, E.J. Atrial fibrillation among Medicare beneficiaries hospitalized with sepsis: Incidence and risk factors. Am. Heart J. 2013, 165, 949–955.e3. [Google Scholar] [CrossRef] [Green Version]
- Altman, A.D.; Liu, X.Q.; Nelson, G.; Chu, P.; Nation, J.; Ghatage, P. The effects of anemia and blood transfusion on patients with stage III-IV ovarian cancer. Int. J. Gynecol. Cancer 2013, 23, 1569–1576. [Google Scholar] [CrossRef]
- Fyles, A.W.; Milosevic, M.; Pintilie, M.; Syed, A.; Hill, R.P. Anemia, hypoxia and transfusion in patients with cervix cancer: A review. Radiother. Oncol. 2000, 57, 13–19. [Google Scholar] [CrossRef]
- Holgersson, G.; Sandelin, M.; Hoye, E.; Bergstrom, S.; Henriksson, R.; Ekman, S.; Nyman, J.; Helsing, M.; Friesland, S.; Holgersson, M.; et al. Swedish lung cancer radiation study group: The prognostic value of anaemia, thrombocytosis and leukocytosis at time of diagnosis in patients with non-small cell lung cancer. Med. Oncol. 2012, 29, 3176–3182. [Google Scholar] [CrossRef] [PubMed]
- Ray-Coquard, I.; Morere, J.F.; Scotte, F.; Cals, L.; Antoine, E.C. Management of anemia in advanced breast and lung cancer patients in daily practice: Results of a French survey. Adv. Ther. 2012, 29, 124–133. [Google Scholar] [CrossRef] [PubMed]
- Vannella, L.; Lahner, E.; Osborn, J.; Annibale, B. Systematic review: Gastric cancer incidence in pernicious anaemia. Aliment. Pharmacol. Ther. 2013, 37, 375–382. [Google Scholar] [CrossRef] [PubMed]
- Tonelli, M.; Sacks, F.; Arnold, M.; Moye, L.; Davis, B.; Pfeffer, M.; Cholesterol and Recurrent Events (CARE) Trial Investigators. Relation Between Red Blood Cell Distribution Width and Cardiovascular Event Rate in People With Coronary Disease. Circulation 2008, 117, 163–168. [Google Scholar] [CrossRef] [Green Version]
- Xu, W.S.; Qiu, X.M.; Ou, Q.S.; Liu, C.; Lin, J.P.; Chen, H.J.; Lin, S.; Wang, W.H.; Lin, S.R.; Chen, J. Red blood cell distribution width levels correlate with liver fibrosis and inflammation: A noninvasive serum marker panel to predict the severity of fibrosis and inflammation in patients with hepatitis B. Medicine 2015, 94, e612. [Google Scholar] [CrossRef]
- Petrella, F.; Casiraghi, M.; Radice, D.; Cara, A.; Maffeis, G.; Prisciandaro, E.; Rizzo, S.; Spaggiari, L. Prognostic Value of the Hemoglobin/Red Cell Distribution Width Ratio in Resected Lung Adenocarcinoma. Cancers 2021, 13, 710. [Google Scholar] [CrossRef]
- Su, Y.C.; Wen, S.C.; Li, C.C.; Su, H.C.; Ke, H.L.; Li, W.M.; Lee, H.Y.; Li, C.Y.; Yang, S.F.; Tu, H.P.; et al. Low Hemoglobin-to-Red Cell Distribution Width Ratio Is Associated with Disease Progression and Poor Prognosis in Upper Tract Urothelial Carcinoma. Biomedicines 2021, 9, 672. [Google Scholar] [CrossRef]
- Wu, F.; Yang, S.; Tang, X.; Liu, W.; Chen, H.; Gao, H. Prognostic value of baseline hemoglobin-to-red blood cell distribution width ratio in small cell lung cancer: A retrospective analysis. Thorac. Cancer 2020, 11, 888–897. [Google Scholar] [CrossRef] [Green Version]
- Yılmaz, H.; Yılmaz, A.; Demirağ, G. Prognostic significance of hemoglobin-to-red cell distribution width ratio in patients with metastatic renal cancer. Future Oncol. 2021, 17, 3853–3864. [Google Scholar] [CrossRef]
- Zhai, Z.; Gao, J.; Zhu, Z.; Cong, X.; Lou, S.; Han, B.; Yin, X.; Zhang, Y.; Xue, Y. The Ratio of the Hemoglobin to Red Cell Distribution Width Combined with the Ratio of Platelets to Lymphocytes Can Predict the Survival of Patients with Gastric Cancer Liver Metastasis. BioMed Res. Int. 2021, 2021, 8729869. [Google Scholar] [CrossRef]
- Zhao, W.; Shi, M.; Zhang, J. Preoperative hemoglobin-to-red cell distribution width ratio as a prognostic factor in pulmonary large cell neuroendocrine carcinoma: A retrospective cohort study. Ann. Transl. Med. 2022, 10, 42. [Google Scholar] [CrossRef] [PubMed]
- Johnson, A.; Bulgarelli, L.; Pollard, T.; Horng, S.; Celi, L.A.; Mark, R. MIMIC-IV (version 1.0). PhysioNet 2021. [Google Scholar] [CrossRef]
- Skrivankova, V.W.; Richmond, R.C.; Woolf, B.A.R.; Yarmolinsky, J.; Davies, N.M.; Swanson, S.A.; VanderWeele, T.J.; Higgins, J.P.T.; Timpson, N.J.; Dimou, N.; et al. Strengthening the Reporting of Observational Studies in Epidemiology Using Mendelian Randomization: The STROBE-MR Statement. JAMA 2021, 326, 1614–1621. [Google Scholar] [CrossRef] [PubMed]
- Bozkaya, Y.; Kurt, B.; Gürler, F. A prognostic parameter in advanced non-small cell lung cancer: The ratio of hemoglobin-to-red cell distribution width. Int. J. Clin. Oncol. 2019, 24, 798–806. [Google Scholar] [CrossRef]
- Qu, J.; Zhou, T.; Xue, M.; Sun, H.; Shen, Y.; Chen, Y.; Tang, L.; Qian, L.; You, J.; Yang, R.; et al. Correlation Analysis of Hemoglobin-to-Red Blood Cell Distribution Width Ratio and Frailty in Elderly Patients With Coronary Heart Disease. Front. Cardiovasc. Med. 2021, 8, 728800. [Google Scholar] [CrossRef]
- Rahamim, E.; Zwas, D.R.; Keren, A.; Elbaz-Greener, G.; Ibrahimli, M.; Amir, O.; Gotsman, I. The Ratio of Hemoglobin to Red Cell Distribution Width: A Strong Predictor of Clinical Outcome in Patients with Heart Failure. J. Clin. Med. 2022, 11, 886. [Google Scholar] [CrossRef]
- Austin, P.C. An Introduction to Propensity Score Methods for Reducing the Effects of Confounding in Observational Studies. Multivar. Behav. Res. 2011, 46, 399–424. [Google Scholar] [CrossRef] [Green Version]
- Austin, P.C.; Stuart, E.A. Moving towards best practice when using inverse probability of treatment weighting (IPTW) using the propensity score to estimate causal treatment effects in observational studies. Stat. Med. 2015, 34, 3661–3679. [Google Scholar] [CrossRef] [Green Version]
- Li, L.; Greene, T. A weighting analogue to pair matching in propensity score analysis. Int. J. Biostat. 2013, 9, 215–234. [Google Scholar] [CrossRef]
- Cheng, C.; Li, F.; Thomas, L.E.; Li, F.F. Addressing Extreme Propensity Scores in Estimating Counterfactual Survival Functions via the Overlap Weights. Am. J. Epidemiol. 2022, 191, 1140–1151. [Google Scholar] [CrossRef]
- Arbel, Y.; Weitzman, D.; Raz, R.; Steinvil, A.; Zeltser, D.; Berliner, S.; Chodick, G.; Shalev, V. Red blood cell distribution width and the risk of cardiovascular morbidity and all-cause mortality. A population-based study. Thromb. Haemost. 2014, 111, 300–307. [Google Scholar] [CrossRef] [PubMed]
- Pascual-Figal, D.A.; Bonaque, J.C.; Redondo, B.; Caro, C.; Manzano-Fernandez, S.; Sanchez-Mas, J.; Garrido, I.P.; Valdes, M. Red blood cell distribution width predicts long-term outcome regardless of anaemia status in acute heart failure patients. Eur. J. Heart Fail. 2009, 11, 840–846. [Google Scholar] [CrossRef] [PubMed]
- Wang, A.Y.; Ma, H.P.; Kao, W.F.; Tsai, S.H.; Chang, C.K. Red blood cell distribution width is associated with mortality in elderly patients with sepsis. Am. J. Emerg. Med. 2018, 36, 949–953. [Google Scholar] [CrossRef] [PubMed]
- Moreno-Torres, V.; Royuela, A.; Munez-Rubio, E.; Gutierrez-Rojas, A.; Mills-Sanchez, P.; Ortega, A.; Tejado-Bravo, S.; Garcia-Sanz, J.; Munoz-Serrano, A.; Calderon-Parra, J.; et al. Red blood cell distribution width as prognostic factor in sepsis: A new use for a classical parameter. J. Crit. Care 2022, 71, 154069. [Google Scholar] [CrossRef] [PubMed]
- Sadaka, F.; O’Brien, J.; Prakash, S. Red cell distribution width and outcome in patients with septic shock. J. Intensive Care Med. 2013, 28, 307–313. [Google Scholar] [CrossRef]
- Wang, L.; Wang, C.; Wu, S.; Li, Y.; Guo, W.; Liu, M. Red blood cell distribution width is associated with mortality after acute ischemic stroke: A cohort study and systematic review. Ann. Transl. Med. 2020, 8, 81. [Google Scholar] [CrossRef]
- Topaz, G.; Kitay-Cohen, Y.; Peled, L.; Gharra, W.; Kaminer, K.; Eitan, M.; Mahamid, L.; Shilo, L. The association between red cell distribution width and poor outcomes in hospitalized patients with influenza. J. Crit. Care 2017, 41, 166–169. [Google Scholar] [CrossRef]
- Acosta, J.N.; Leasure, A.C.; Kuohn, L.R.; Both, C.P.; Petersen, N.H.; Sansing, L.H.; Matouk, C.C.; Testai, F.; Langefeld, C.D.; Woo, D.; et al. Admission Hemoglobin Levels Are Associated With Functional Outcome in Spontaneous Intracerebral Hemorrhage. Crit. Care Med. 2021, 49, 828–837. [Google Scholar] [CrossRef]
- Gauthier, I.; Ding, K.; Winton, T.; Shepherd, F.A.; Livingston, R.; Johnson, D.H.; Rigas, J.R.; Whitehead, M.; Graham, B.; Seymour, L. Impact of hemoglobin levels on outcomes of adjuvant chemotherapy in resected non-small cell lung cancer: The JBR.10 trial experience. Lung Cancer 2007, 55, 357–363. [Google Scholar] [CrossRef]
- Xiu, W.J.; Zheng, Y.Y.; Wu, T.T.; Hou, X.G.; Yang, Y.; Ma, Y.T.; Xie, X. Hemoglobin-to-Red-Cell Distribution Width Ratio Is a Novel Predictor of Long-Term Patient Outcomes After Percutaneous Coronary Intervention: A Retrospective Cohort Study. Front. Cardiovasc. Med. 2022, 9, 726025. [Google Scholar] [CrossRef]
- Chen, J.L.; Wu, J.N.; Lv, X.D.; Yang, Q.C.; Chen, J.R.; Zhang, D.M. The value of red blood cell distribution width, neutrophil-to-lymphocyte ratio, and hemoglobin-to-red blood cell distribution width ratio in the progression of non-small cell lung cancer. PLoS ONE 2020, 15, e0237947. [Google Scholar] [CrossRef] [PubMed]
- Yilmaz, A.; Mirili, C.; Tekin, S.B.; Bilici, M. The ratio of hemoglobin to red cell distribution width predicts survival in patients with gastric cancer treated by neoadjuvant FLOT: A retrospective study. Ir. J. Med. Sci. 2020, 189, 91–102. [Google Scholar] [CrossRef] [PubMed]
- Zheng, Y.Y.; Wu, T.T.; Chen, Y.; Hou, X.G.; Yang, Y.; Ma, X.; Ma, Y.T.; Zhang, J.Y.; Xie, X. Gamma-Glutamyl Transferase-to-Platelet Ratio as a Novel Predictor of Long-Term Adverse Outcomes in Patients after Undergoing Percutaneous Coronary Intervention: A Retrospective Cohort Study. Thromb. Haemost. 2019, 119, 1021–1030. [Google Scholar] [CrossRef] [PubMed]
- Ridker, P.M.; Rifai, N.; Clearfield, M.; Downs, J.R.; Weis, S.E.; Miles, J.S.; Gotto, A.M., Jr.; Air Force/Texas Coronary Atherosclerosis Prevention Study Investigators. Measurement of C-reactive protein for the targeting of statin therapy in the primary prevention of acute coronary events. N. Engl. J. Med. 2001, 344, 1959–1965. [Google Scholar] [CrossRef]
- Sesso, H.D.; Buring, J.E.; Rifai, N.; Blake, G.J.; Gaziano, J.M.; Ridker, P.M. C-reactive protein and the risk of developing hypertension. JAMA 2003, 290, 2945–2951. [Google Scholar] [CrossRef] [Green Version]
- Forhecz, Z.; Gombos, T.; Borgulya, G.; Pozsonyi, Z.; Prohaszka, Z.; Janoskuti, L. Red cell distribution width in heart failure: Prediction of clinical events and relationship with markers of ineffective erythropoiesis, inflammation, renal function, and nutritional state. Am. Heart J. 2009, 158, 659–666. [Google Scholar] [CrossRef]


 and
and  represent the HR value. Red bands present the 95% confidence interval.
and represent the HR value. Red bands present the 95% confidence interval.
represent the HR value. Red bands present the 95% confidence interval.
and represent the HR value. Red bands present the 95% confidence interval.


| Variables | Total (n = 9228) | Survival (n = 7526) | Non-Survival (n = 1702) | p-Value |
|---|---|---|---|---|
| Demographic | ||||
| Female, n (%) | 3723 (40.3) | 2974 (39.5) | 749 (44) | <0.001 |
| Age, years | 76.0 (67.0, 84.0) | 75.0 (67.0, 83.0) | 78.0 (70.0, 85.0) | <0.001 |
| Ethnicity, n (%) | <0.001 | |||
| Asian | 244 (2.6) | 208 (2.8) | 36 (2.1) | |
| White | 6793 (73.6) | 5613 (74.6) | 1180 (69.3) | |
| Black | 658 (7.1) | 542 (7.2) | 116 (6.8) | |
| Other | 1533 (16.6) | 1163 (15.5) | 370 (21.7) | |
| Vital signs | ||||
| HR, beats/minute | 85.0 (75.0, 97.0) | 84.0 (75.0, 96.0) | 88.0 (75.0, 102.0) | <0.001 |
| SBP, mmHg | 111.0 (104.0, 120.0) | 111.0 (104.0, 119.0) | 113.0 (103.0, 133.0) | <0.001 |
| DBP, mmHg | 59.0 (53.0, 65.0) | 58.0 (53.0, 64.0) | 61.0 (55.0, 69.0) | <0.001 |
| MBP, mmHg | 74.0 (69.0, 80.0) | 74.0 (69.0, 79.0) | 75.5 (69.0, 84.0) | <0.001 |
| RR, times/minute | 19.0 (17.0, 22.0) | 19.0 (17.0, 22.0) | 20.0 (18.0, 23.0) | <0.001 |
| Temperature, °C | 36.8 (36.6, 37.0) | 36.8 (36.6, 37.0) | 36.8 (36.5, 37.1) | 0.149 |
| SpO2, % | 97.0 (96.0, 98.0) | 97.0 (96.0, 98.0) | 97.0 (95.0, 98.0) | <0.001 |
| Comorbidities, n (%) | ||||
| Myocardial infarct | 2153 (23.3) | 1704 (22.6) | 449 (26.4) | 0.001 |
| Congestive heart failure | 4812 (52.1) | 3844 (51.1) | 968 (56.9) | <0.001 |
| Peripheral vascular disease | 1579 (17.1) | 1263 (16.8) | 316 (18.6) | 0.084 |
| Cerebrovascular disease | 1476 (16.0) | 1140 (15.1) | 336 (19.7) | <0.001 |
| Chronic pulmonary disease | 3019 (32.7) | 2436 (32.4) | 583 (34.3) | 0.142 |
| Rheumatic disease | 377 (4.1) | 304 (4) | 73 (4.3) | 0.688 |
| Peptic ulcer disease | 271 (2.9) | 200 (2.7) | 71 (4.2) | 0.001 |
| Paraplegia | 422 (4.6) | 318 (4.2) | 104 (6.1) | <0.001 |
| Renal disease | 3100 (33.6) | 2405 (32) | 695 (40.8) | <0.001 |
| Malignant cancer | 1119 (12.1) | 804 (10.7) | 315 (18.5) | <0.001 |
| Diabetes | 1705 (18.5) | 1396 (18.5) | 309 (18.2) | 0.731 |
| Hypertension | 543 (5.9) | 173 (2.3) | 370 (21.7) | <0.001 |
| Therapies, n (%) | ||||
| Warfarin | 737 (8.0) | 656 (8.7) | 81 (4.8) | <0.001 |
| Amiodarone | 1739 (18.8) | 1432 (19) | 307 (18) | 0.364 |
| Dopamine | 514 (5.6) | 388 (5.2) | 126 (7.4) | <0.001 |
| Epinephrine | 937 (10.2) | 777 (10.3) | 160 (9.4) | 0.274 |
| Vasopressin | 1256 (13.6) | 907 (12.1) | 349 (20.5) | <0.001 |
| Antibiotic | 1801 (19.5) | 1509 (20.1) | 292 (17.2) | 0.007 |
| Ventilation | 4823 (52.3) | 3906 (51.9) | 917 (53.9) | 0.148 |
| Laboratory events | ||||
| Hemoglobin, g/dL | 10.0 (8.6, 11.5) | 9.9 (8.6, 11.5) | 10.0 (8.6, 11.5) | 0.890 |
| RDW, % | 15.0 (13.9, 16.8) | 14.9 (13.8, 16.6) | 15.7 (14.4, 17.6) | <0.001 |
| HRR | 6.5 (5.3, 7.9) | 6.6 (5.4, 8.0) | 6.3 (5.0, 7.7) | <0.001 |
| Platelets, 109/L | 198.0 (145.0, 268.0) | 195.0 (145.0, 263.0) | 206.0 (148.0, 288.0) | <0.001 |
| WBC, 109/L | 13.9 (10.0, 18.8) | 14.1 (10.1, 18.9) | 13.4 (9.6, 18.4) | 0.007 |
| Albumin, g/dL | 3.2 (3.2, 3.2) | 3.2 (3.2, 3.2) | 3.2 (3.1, 3.2) | 0.706 |
| Anion gap, mmol/L | 16.0 (13.0, 19.0) | 16.0 (13.0, 19.0) | 17.0 (15.0, 21.0) | <0.001 |
| Bicarbonate, mmol/L | 24.0 (22.0, 27.0) | 24.0 (22.0, 27.0) | 24.0 (21.0, 28.0) | 0.177 |
| Bun, mg/dL | 28.0 (18.0, 46.0) | 27.0 (18.0, 44.0) | 33.5 (21.0, 54.0) | <0.001 |
| Calcium, mg/dL | 8.6 (8.1, 8.9) | 8.6 (8.1, 8.9) | 8.6 (8.2, 9.1) | <0.001 |
| Chloride, mmol/L | 106.0 (101.0, 110.0) | 106.0 (102.0, 110.0) | 104.0 (100.0, 109.0) | <0.001 |
| Creatinine, mg/dL | 1.3 (0.9, 2.1) | 1.2 (0.9, 2.0) | 1.5 (1.0, 2.5) | <0.001 |
| Sodium, mmol/L | 140.0 (137.0, 142.0) | 140.0 (137.0, 142.0) | 140.0 (137.0, 143.0) | 0.049 |
| Lymphocytes, 109/L | 88.6 (2.2, 88.6) | 88.6 (2.4, 88.6) | 88.6 (1.5, 88.6) | <0.001 |
| Monocytes, 109/L | 34.9 (1.3, 35.3) | 34.9 (1.4, 35.0) | 34.9 (1.1, 36.5) | 0.096 |
| Neutrophils, 109/L | 642.2 (17.6, 753.6) | 642.2 (19.0, 750.6) | 642.2 (13.8, 774.5) | 0.012 |
| INR | 1.5 (1.3, 2.0) | 1.5 (1.3, 2.0) | 1.6 (1.3, 2.3) | <0.001 |
| PT, s | 16.5 (14.1, 21.8) | 16.3 (14.1, 21.8) | 17.5 (14.0, 25.1) | <0.001 |
| APTT, s | 36.4 (30.4, 48.0) | 36.1 (30.4, 48.0) | 37.7 (30.5, 51.5) | <0.001 |
| ALT, IU/L | 146.0 (23.0, 146.0) | 146.0 (24.0, 146.0) | 52.0 (20.0, 146.0) | <0.001 |
| AST, U/L | 218.5 (35.0, 255.0) | 255.0 (37.0, 255.0) | 85.0 (30.0, 255.0) | <0.001 |
| CK-MB, U/L | 19.0 (8.0, 19.0) | 19.0 (9.0, 19.0) | 19.0 (5.0, 19.0) | <0.001 |
| Glucose, mg/dL | 642.2 (17.6, 753.6) | 642.2 (19.0, 750.6) | 642.2 (13.8, 774.5) | 0.012 |
| Scores | ||||
| APSIII | 54.0 (40.0, 73.0) | 52.0 (39.0, 70.0) | 65.0 (48.0, 85.0) | <0.001 |
| SOFA | 3.0 (2.0, 5.0) | 3.0 (2.0, 5.0) | 3.0 (2.0, 5.0) | 0.084 |
| GCS | 13.0 (9.0, 15.0) | 14.0 (10.0, 15.0) | 12.0 (7.0, 14.0) | <0.001 |
| OASIS | 36.0 (30.0, 43.0) | 35.0 (29.0, 42.0) | 39.0 (32.0, 45.0) | <0.001 |
| Outcomes | ||||
| Length of ICU stay, days | 4.0 (2.0, 7.0) | 3.0 (2.0, 6.0) | 5.0 (3.0, 10.0) | <0.001 |
| Length of hospital stay, days | 9.0 (6.0, 16.0) | 10.0 (6.0, 16.0) | 9.0 (4.0, 15.0) | <0.001 |
| Characteristic | Before PSM | |||
|---|---|---|---|---|
| All Patients | Low HRR < 5.877 | High HRR ≥ 5.877 | p | |
| N | 9228 | 3312 | 5916 | |
| Demographic | ||||
| Female, n (%) | 3723 (40.3) | 1379 (41.6) | 2344 (39.6) | 0.061 |
| Age, years | 76.0 (67.0, 84.0) | 76.0 (68.0, 84.0) | 76.0 (67.0, 83.0) | 0.005 |
| Ethnicity, n (%) | 0.002 | |||
| Asian | 244 (2.6) | 92 (2.8) | 152 (2.6) | |
| White | 6793 (73.6) | 2498 (75.4) | 4295 (72.6) | |
| Black | 658 (7.1) | 237 (7.2) | 421 (7.1) | |
| Other | 1533 (16.6) | 485 (14.6) | 1048 (17.7) | |
| Vital signs | ||||
| HR, beats/minute | 85 (75, 97) | 85 (75, 97) | 84 (75, 97) | 0.937 |
| SBP, mmHg | 111 (104, 120) | 109 (102, 118) | 112 (105, 122) | <0.001 |
| DBP, mmHg | 59 (53, 65) | 57 (52, 63) | 60 (54, 66) | <0.001 |
| MBP, mmHg | 74 (69, 80) | 72 (67, 77) | 75 (70, 81) | <0.001 |
| RR, times/minute | 19 (17, 22) | 19 (17, 22) | 19 (17, 22) | 0.904 |
| Temperature, °C | 36.8 (36.6, 37.0) | 36.8 (36.5, 37.0) | 36.8 (36.6, 37.1) | <0.001 |
| SpO2, % | 97 (96, 98) | 97 (96, 99) | 97 (96, 98) | <0.001 |
| Comorbidities, n (%) | ||||
| Myocardial infarct | 2153 (23.3) | 799 (24.1) | 1354 (22.9) | 0.186 |
| Congestive heart failure | 4812 (52.1) | 1785 (53.9) | 3027 (51.2) | 0.013 |
| Peripheral vascular disease | 1579 (17.1) | 580 (17.5) | 999 (16.9) | 0.461 |
| Cerebrovascular disease | 1476 (16.0) | 534 (16.1) | 942 (15.9) | 0.824 |
| Dementia | 517 (5.6) | 174 (5.3) | 343 (5.8) | 0.297 |
| Chronic pulmonary disease | 3019 (32.7) | 1094 (33) | 1925 (32.5) | 0.645 |
| Rheumatic disease | 377 (4.1) | 135 (4.1) | 242 (4.1) | 1 |
| Peptic ulcer disease | 271 (2.9) | 103 (3.1) | 168 (2.8) | 0.501 |
| Paraplegia | 422 (4.6) | 133 (4) | 289 (4.9) | 0.062 |
| Renal disease | 3100 (33.6) | 1138 (34.4) | 1962 (33.2) | 0.253 |
| Malignant cancer | 1119 (12.1) | 387 (11.7) | 732 (12.4) | 0.348 |
| Metastatic solid tumor | 421 (4.6) | 145 (4.4) | 276 (4.7) | 0.56 |
| Diabetes | 1705 (18.5) | 612 (18.5) | 1093 (18.5) | 1 |
| Hypertension | 543 (5.9) | 159 (4.8) | 384 (6.5) | 0.001 |
| Therapies, n (%) | ||||
| Warfarin | 737 (8.0) | 271 (8.2) | 466 (7.9) | 0.632 |
| Amiodarone | 1739 (18.8) | 539 (16.3) | 1200 (20.3) | <0.001 |
| Dopamine | 514 (5.6) | 180 (5.4) | 334 (5.6) | 0.707 |
| Epinephrine | 937 (10.2) | 343 (10.4) | 594 (10) | 0.656 |
| Vasopressin | 1256 (13.6) | 503 (15.2) | 753 (12.7) | 0.001 |
| Antibiotic | 1801 (19.5) | 554 (16.7) | 1247 (21.1) | <0.001 |
| Ventilation | 4823 (52.3) | 1706 (51.5) | 3117 (52.7) | 0.287 |
| Laboratory events | ||||
| Hemoglobin, g/dL | 10.0 (8.6, 11.5) | 8.2 (7.5, 9.0) | 11.0 (9.9, 12.2) | <0.001 |
| RDW, % | 15.0 (13.9, 16.8) | 17.2 (15.6, 18.8) | 14.3 (13.5, 15.4) | <0.001 |
| HRR | 6.5 (5.3, 7.9) | 4.9 (4.3, 5.4) | 7.5 (6.6, 8.6) | <0.001 |
| Platelets, 109/L | 198.0 (145.0, 268.0) | 200.0 (138.0, 289.0) | 196.0 (149.0, 258.0) | 0.630 |
| WBC, 109/L | 13.9 (10.0, 18.8) | 13.3 (9.1, 18.7) | 14.2 (10.5, 18.9) | <0.001 |
| Albumin, g/dL | 3.2 (3.2, 3.2) | 3.2 (3.0, 3.2) | 3.2 (3.2, 3.2) | <0.001 |
| Anion gap, mmol/L | 16.0 (13.0, 19.0) | 16.0 (14.0, 20.0) | 16.0 (13.0, 19.0) | <0.001 |
| Bicarbonate, mmol/L | 24.0 (22.0, 27.0) | 24.0 (21.0, 27.0) | 24.0 (22.0, 27.0) | 0.012 |
| Bun, mg/dL | 28.0 (18.0, 46.0) | 34.0 (21.0, 57.0) | 25.0 (17.0, 39.0) | <0.001 |
| Calcium, mg/dL | 8.6 (8.1, 8.9) | 8.6 (8.1, 8.9) | 8.6 (8.2, 8.9) | <0.001 |
| Chloride, mmol/L | 106.0 (101.0, 110.0) | 105.0 (100.0, 110.0) | 106.0 (102.0, 110.0) | <0.001 |
| Creatinine, mg/dL | 1.3 (0.9, 2.1) | 1.5 (1.0, 2.6) | 1.2 (0.9, 1.8) | <0.001 |
| Sodium, mmol/L | 140.0 (137.0, 142.0) | 140.0 (137.0, 143.0) | 140.0 (137.0, 142.0) | 0.001 |
| Lymphocytes, 109/L | 88.6 (2.2, 88.6) | 88.6 (1.5, 88.6) | 88.6 (2.8, 88.6) | <0.001 |
| Monocytes, 109/L | 34.9 (1.3, 35.3) | 34.9 (1.1, 34.9) | 34.9 (1.6, 38.9) | <0.001 |
| Neutrophils, 109/L | 642.2 (17.6, 753.6) | 642.2 (14.2, 642.2) | 642.2 (21.1, 824.8) | <0.001 |
| INR | 1.5 (1.3, 2.0) | 1.6 (1.3, 2.3) | 1.4 (1.2, 2.0) | <0.001 |
| PT, s | 16.5 (14.1, 21.8) | 17.7 (14.8, 24.1) | 15.9 (13.8, 21.6) | <0.001 |
| APTT, s | 36.4 (30.4, 48.0) | 37.6 (31.3, 49.6) | 35.6 (29.9, 48.0) | <0.001 |
| ALT, IU/L | 146.0 (23.0, 146.0) | 67.0 (19.0, 146.0) | 146.0 (26.0, 146.0) | <0.001 |
| AST, U/L | 218.5 (35.0, 255.0) | 105.5 (30.0, 255.0) | 255.0 (39.0, 255.0) | <0.001 |
| CK-MB, U/L | 19.0 (8.0, 19.0) | 19.0 (7.0, 19.0) | 19.0 (9.0, 19.0) | <0.001 |
| Glucose, mg/dL | 131.5 (115.3, 158.6) | 130.6 (112.0, 158.8) | 132.0 (116.7, 158.5) | 0.002 |
| Scores | ||||
| APSIII | 54.0 (40.0, 73.0) | 59.0 (45.0, 76.0) | 52.0 (38.0, 71.0) | <0.001 |
| SOFA | 3.0 (2.0, 5.0) | 3.0 (2.0, 5.0) | 3.0 (2.0, 4.0) | <0.001 |
| GCS | 13.0 (9.0, 15.0) | 13.0 (9.0, 14.0) | 13.0 (9.0, 15.0) | 0.683 |
| OASIS | 36.0 (30.0, 43.0) | 36.0 (30.0, 43.0) | 36.0 (30.0, 43.0) | 0.120 |
| Outcomes | ||||
| 28-day mortality, n (%) | 1660 (18.0) | 718 (21.7) | 942 (15.9) | <0.001 |
| 60-day mortality, n (%) | 1850 (20.0) | 795 (24) | 1055 (17.8) | <0.001 |
| 90-day mortality, n (%) | 1913 (20.7) | 823 (24.8) | 1090 (18.4) | <0.001 |
| In-hospital mortality, n (%) | 1702 (18.4) | 727 (22) | 975 (16.5) | <0.001 |
| Length of ICU stay, days | 4.0 (2.0, 7.0) | 4.0 (2.0, 7.0) | 3.0 (2.0, 7.0) | 0.008 |
| Length of hospital stay, days | 9.0 (6.0, 16.0) | 10.0 (6.0, 16.0) | 9.0 (6.0, 16.0) | 0.134 |
| Characteristic | Non-Adjust Model | Model I | Model II | Model III | ||||
|---|---|---|---|---|---|---|---|---|
| HR (95% CI) | p-Value | HR (95% CI) | p-Value | HR (95% CI) | p-Value | HR (95% CI) | p-Value | |
| Before PSM | ||||||||
| HRR | 0.919 (0.892~0.946) | <0.001 | 0.915 (0.888~0.942) | <0.001 | 0.834 (0.795~0.875) | <0.001 | 0.873 (0.829~0.920) | <0.001 |
| High HRR (≥5.877) | 1 (Ref.) | 1 (Ref.) | 1 (Ref.) | 1 (Ref.) | ||||
| Low HRR (<5.877) | 1.425 (1.280~1.586) | <0.001 | 1.432 (1.286~1.596) | <0.001 | 1.561 (1.352~1.803) | <0.001 | 1.412 (1.210~1.648) | <0.001 |
| After PSM | ||||||||
| HRR | 0.931 (0.895~0.968) | <0.001 | 0.930 (0.894~0.968) | 0.0003 | 0.887 (0.835~0.943) | 0.0001 | 0.902 (0.846~0.962) | 0.0006 |
| High HRR (≥5.877) | 1 (Ref.) | 1 (Ref.) | 1 (Ref.) | 1 (Ref.) | ||||
| Low HRR (<5.877) | 1.321 (1.159~1.504) | <0.001 | 1.320 (1.158~1.504) | <0.001 | 1.366 (1.149~1.623) | <0.001 | 1.374 (1.144~1.649) | <0.001 |
| Characteristic | After PSM | |||
|---|---|---|---|---|
| All Patients | Low HRR < 5.877 | High HRR ≥ 5.877 | p | |
| N | 5862 | 2931 | 2931 | |
| Demographic | ||||
| Female, n (%) | 2388 (40.7) | 1197 (40.8) | 1191 (40.6) | 0.894 |
| Age, years | 76.0 (67.0, 84.0) | 76.0 (68.0, 84.0) | 76.0 (67.0, 84.0) | 0.345 |
| Ethnicity, n (%) | 0.622 | |||
| Asian | 151 (2.6) | 77 (2.6) | 74 (2.5) | |
| White | 4433 (75.6) | 2228 (76) | 2205 (75.2) | |
| Black | 393 (6.7) | 201 (6.9) | 192 (6.6) | |
| Other | 885 (15.1) | 425 (14.5) | 460 (15.7) | |
| Vital signs | ||||
| HR, beats/minute | 84 (75.0, 97.0) | 85 (75.0, 97.0) | 84 (75.0, 96.0) | 0.091 |
| SBP, mmHg | 110 (103.0, 119.0) | 110 (103.0, 119.0) | 110 (103.0, 118.0) | 0.531 |
| DBP, mmHg | 57 (52.0, 63.0) | 57 (52.0, 63.0) | 58 (52.0, 63.0) | 0.898 |
| MBP, mmHg | 73 (68.0, 78.0) | 73 (67.5, 78.0) | 72 (68.0, 77.0) | 0.911 |
| RR, times/minute | 19 (17.0, 22.0) | 19 (17.0, 22.0) | 19 (17.0, 22.0) | 0.831 |
| Temperature, °C | 36.8 (36.5, 37.0) | 36.8 (36.6, 37.0) | 36.8 (36.5, 37.0) | 0.958 |
| SpO2, % | 97 (96.0, 99.0) | 97 (96.0, 99.0) | 97 (96.0, 99.0) | 0.758 |
| Comorbidities, n (%) | ||||
| Myocardial infarct | 1363 (23.3) | 704 (24) | 659 (22.5) | 0.174 |
| Congestive heart failure | 3091 (52.7) | 1556 (53.1) | 1535 (52.4) | 0.601 |
| Peripheral vascular disease | 992 (16.9) | 510 (17.4) | 482 (16.4) | 0.347 |
| Cerebrovascular disease | 927 (15.8) | 470 (16) | 457 (15.6) | 0.668 |
| Dementia | 312 (5.3) | 153 (5.2) | 159 (5.4) | 0.771 |
| Chronic pulmonary disease | 1957 (33.4) | 982 (33.5) | 975 (33.3) | 0.868 |
| Rheumatic disease | 247 (4.2) | 121 (4.1) | 126 (4.3) | 0.795 |
| Peptic ulcer disease | 178 (3.0) | 84 (2.9) | 94 (3.2) | 0.493 |
| Paraplegia | 571 (9.7) | 291 (9.9) | 280 (9.6) | 0.66 |
| Renal disease | 250 (4.3) | 111 (3.8) | 139 (4.7) | 0.081 |
| Malignant cancer | 1937 (33.0) | 976 (33.3) | 961 (32.8) | 0.697 |
| Metastatic solid tumor | 726 (12.4) | 355 (12.1) | 371 (12.7) | 0.552 |
| Diabetes | 198 (3.4) | 107 (3.7) | 91 (3.1) | 0.278 |
| Hypertension | 280 (4.8) | 132 (4.5) | 148 (5) | 0.358 |
| Therapies, n (%) | ||||
| Warfarin | 497 (8.5) | 244 (8.3) | 253 (8.6) | 0.708 |
| Amiodarone | 1116 (19.0) | 486 (16.6) | 630 (21.5) | <0.001 |
| Dopamine | 343 (5.9) | 155 (5.3) | 188 (6.4) | 0.075 |
| Epinephrine | 643 (11.0) | 306 (10.4) | 337 (11.5) | 0.21 |
| Vasopressin | 888 (15.1) | 414 (14.1) | 474 (16.2) | 0.032 |
| Antibiotic | 1101 (18.8) | 518 (17.7) | 583 (19.9) | 0.032 |
| Ventilation | 3075 (52.5) | 1508 (51.5) | 1567 (53.5) | 0.129 |
| Laboratory events | ||||
| Hemoglobin, g/dL | 9.4 (8.2, 10.8) | 8.3 (7.5, 9.1) | 10.7 (9.7, 11.9) | <0.001 |
| RDW, % | 15.6 (14.2, 17.4) | 17.1 (15.6, 18.7) | 14.5 (13.6, 15.6) | <0.001 |
| HRR | 5.9 (5.0, 7.2) | 5.0 (4.4, 5.4) | 7.2 (6.5, 8.2) | <0.001 |
| Platelets, 109/L | 198.0 (143.0, 271.0) | 201.0 (140.0, 286.0) | 194.0 (145.0, 258.0) | 0.141 |
| WBC, 109/L | 13.9 (9.8, 18.9) | 13.3 (9.1, 18.5) | 14.3 (10.5, 19.2) | <0.001 |
| Albumin, g/dL | 3.2 (3.2, 3.2) | 3.2 (3.2, 3.2) | 3.2 (3.2, 3.2) | 0.609 |
| Anion gap, mmol/L | 16.0 (13.0, 19.0) | 16.0 (13.0, 19.0) | 16.0 (13.0, 19.0) | 0.785 |
| Bicarbonate, mmol/L | 24.0 (22.0, 27.0) | 24.0 (22.0, 27.0) | 24.0 (22.0, 27.0) | 0.209 |
| BUN, mg/dL | 31.0 (20.0, 50.0) | 33.0 (21.0, 53.0) | 29.0 (19.0, 47.0) | <0.001 |
| Calcium, mg/dL | 8.6 (8.1, 8.9) | 8.6 (8.1, 8.9) | 8.6 (8.1, 8.9) | 0.393 |
| Chloride, mmol/L | 106.0 (101.0, 110.0) | 105.0 (101.0, 110.0) | 106.0 (102.0, 110.0) | <0.001 |
| Creatinine, mg/dL | 1.4 (1.0, 2.3) | 1.4 (1.0, 2.4) | 1.3 (0.9, 2.2) | 0.003 |
| Sodium, mmol/L | 140.0 (137.0, 142.0) | 140.0 (137.0, 143.0) | 140.0 (137.0, 142.0) | 0.130 |
| Lymphocytes, 109/L | 88.6 (2.0, 88.6) | 88.6 (1.6, 88.6) | 88.6 (2.3, 88.6) | 0.004 |
| Monocytes, 109/L | 34.9 (1.2, 34.9) | 34.9 (1.1, 34.9) | 34.9 (1.4, 36.2) | <0.001 |
| Neutrophils, 109/L | 642.2 (16.3, 714.6) | 642.2 (14.3, 647.4) | 642.2 (19.2, 783.0) | <0.001 |
| INR | 1.6 (1.3, 2.1) | 1.6 (1.3, 2.2) | 1.5 (1.3, 2.0) | <0.001 |
| PT, s | 16.9 (14.4, 22.8) | 17.4 (14.7, 23.4) | 16.5 (14.1, 21.8) | <0.001 |
| APTT, s | 36.9 (30.6, 48.6) | 37.2 (31.1, 48.3) | 36.5 (30.2, 49.0) | 0.050 |
| ALT, IU/L | 126.0 (22.0, 146.0) | 76.0 (20.0, 146.0) | 146.0 (25.0, 146.0) | <0.001 |
| AST, U/L | 176.0 (35.0, 255.0) | 119.0 (31.0, 255.0) | 255.0 (39.0, 255.0) | <0.001 |
| CK-MB, U/L | 19.0 (7.0, 19.0) | 19.0 (7.0, 19.0) | 19.0 (7.0, 19.0) | 0.928 |
| Glucose, mg/dL | 131.4 (114.6, 159.7) | 131.0 (112.5, 158.8) | 132.2 (116.0, 160.4) | 0.037 |
| Scores | ||||
| APSIII | 57.0 (43.0, 75.0) | 57.0 (44.0, 73.0) | 57.0 (42.0, 77.0) | 0.633 |
| SOFA | 3.0 (2.0, 5.0) | 3.0 (2.0, 5.0) | 3.0 (2.0, 5.0) | 0.636 |
| GCS | 13.0 (9.0, 14.0) | 14.0 (10.0, 15.0) | 13.0 (9.0, 14.0) | <0.001 |
| OASIS | 36.0 (30.0, 43.0) | 36.0 (30.0, 42.0) | 37.0 (31.0, 44.0) | <0.001 |
| Outcomes | ||||
| 28-day mortality, n (%) | 1125 (19.2) | 635 (21.7) | 490 (16.7) | <0.001 |
| 60-day mortality, n (%) | 1237 (21.1) | 684 (23.3) | 553 (18.9) | <0.001 |
| 90-day mortality, n (%) | 1275 (21.8) | 705 (24.1) | 570 (19.4) | <0.001 |
| In-hospital mortality, n (%) | 1137 (19.4) | 632 (21.6) | 505 (17.2) | <0.001 |
| Length of ICU stay, days | 4.0 (2.0, 7.0) | 3.0 (2.0, 7.0) | 4.0 (2.0, 7.0) | 0.326 |
| Length of hospital stay, days | 9.0 (6.0, 15.0) | 9.0 (6.0, 14.0) | 9.0 (6.0, 16.0) | 0.004 |
Publisher’s Note: MDPI stays neutral with regard to jurisdictional claims in published maps and institutional affiliations. |
© 2022 by the authors. Licensee MDPI, Basel, Switzerland. This article is an open access article distributed under the terms and conditions of the Creative Commons Attribution (CC BY) license (https://creativecommons.org/licenses/by/4.0/).
Share and Cite
Wang, J.; Chen, Z.; Yang, H.; Li, H.; Chen, R.; Yu, J. Relationship between the Hemoglobin-to-Red Cell Distribution Width Ratio and All-Cause Mortality in Septic Patients with Atrial Fibrillation: Based on Propensity Score Matching Method. J. Cardiovasc. Dev. Dis. 2022, 9, 400. https://doi.org/10.3390/jcdd9110400
Wang J, Chen Z, Yang H, Li H, Chen R, Yu J. Relationship between the Hemoglobin-to-Red Cell Distribution Width Ratio and All-Cause Mortality in Septic Patients with Atrial Fibrillation: Based on Propensity Score Matching Method. Journal of Cardiovascular Development and Disease. 2022; 9(11):400. https://doi.org/10.3390/jcdd9110400
Chicago/Turabian StyleWang, Junhong, Zirong Chen, Hongkuan Yang, Hua Li, Rudong Chen, and Jiasheng Yu. 2022. "Relationship between the Hemoglobin-to-Red Cell Distribution Width Ratio and All-Cause Mortality in Septic Patients with Atrial Fibrillation: Based on Propensity Score Matching Method" Journal of Cardiovascular Development and Disease 9, no. 11: 400. https://doi.org/10.3390/jcdd9110400