
Magnetic Resonance Left Ventricle Mass-Index/Fibrosis: Long-Term Predictors for Ventricular Arrhythmia in Hypertrophic Cardiomyopathy—A Retrospective Registry
 ,
,
Abstract
:1. Introduction
2. Objectives
- To evaluate the association of LVMI and LVLGE with VT.
- To compare differences in the ESC risk score using TTE and CMR.
3. Methods
- NSVT: ≥3 consecutive ventricular beats ≥120 beats per minute captured on ECG, Holter monitoring or cardiac implantable electronic device (CIED) during follow-up.
- Therapy: Appropriate anti-tachycardia pacing (ATP) or cardioversion/defibrillation provided by ICD or external cardioversion for sustained ventricular tachycardia (VT) or ventricular fibrillation (VF).
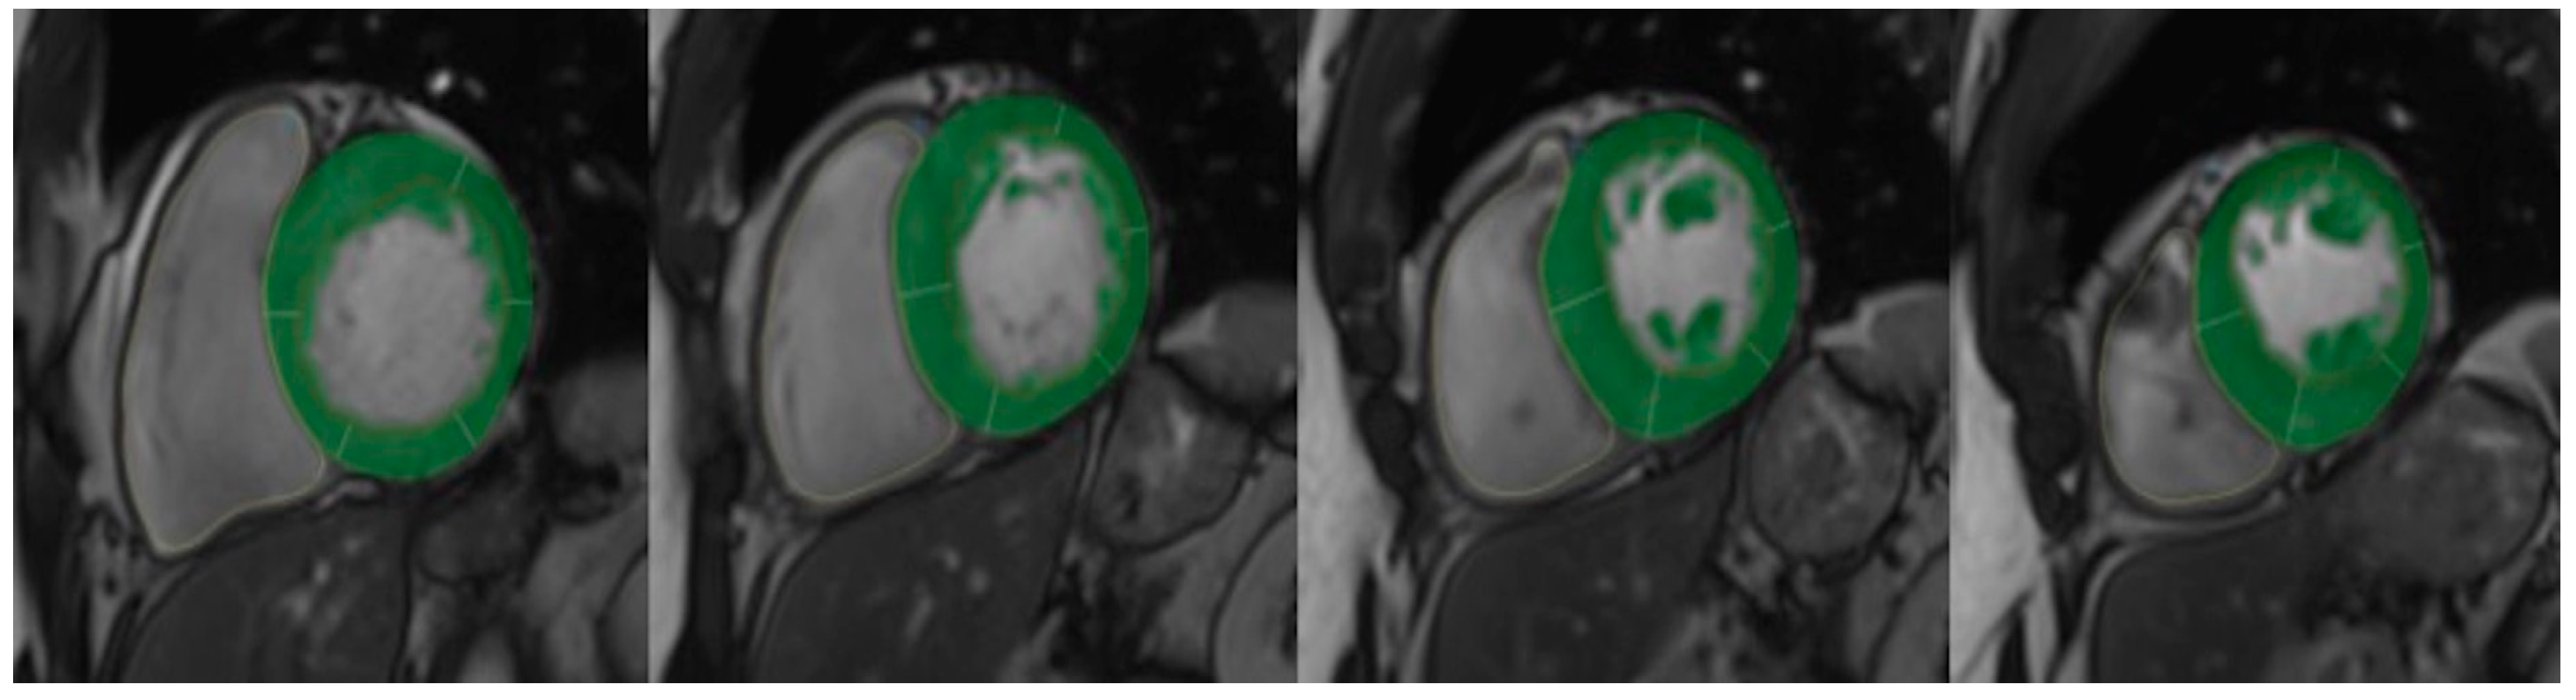
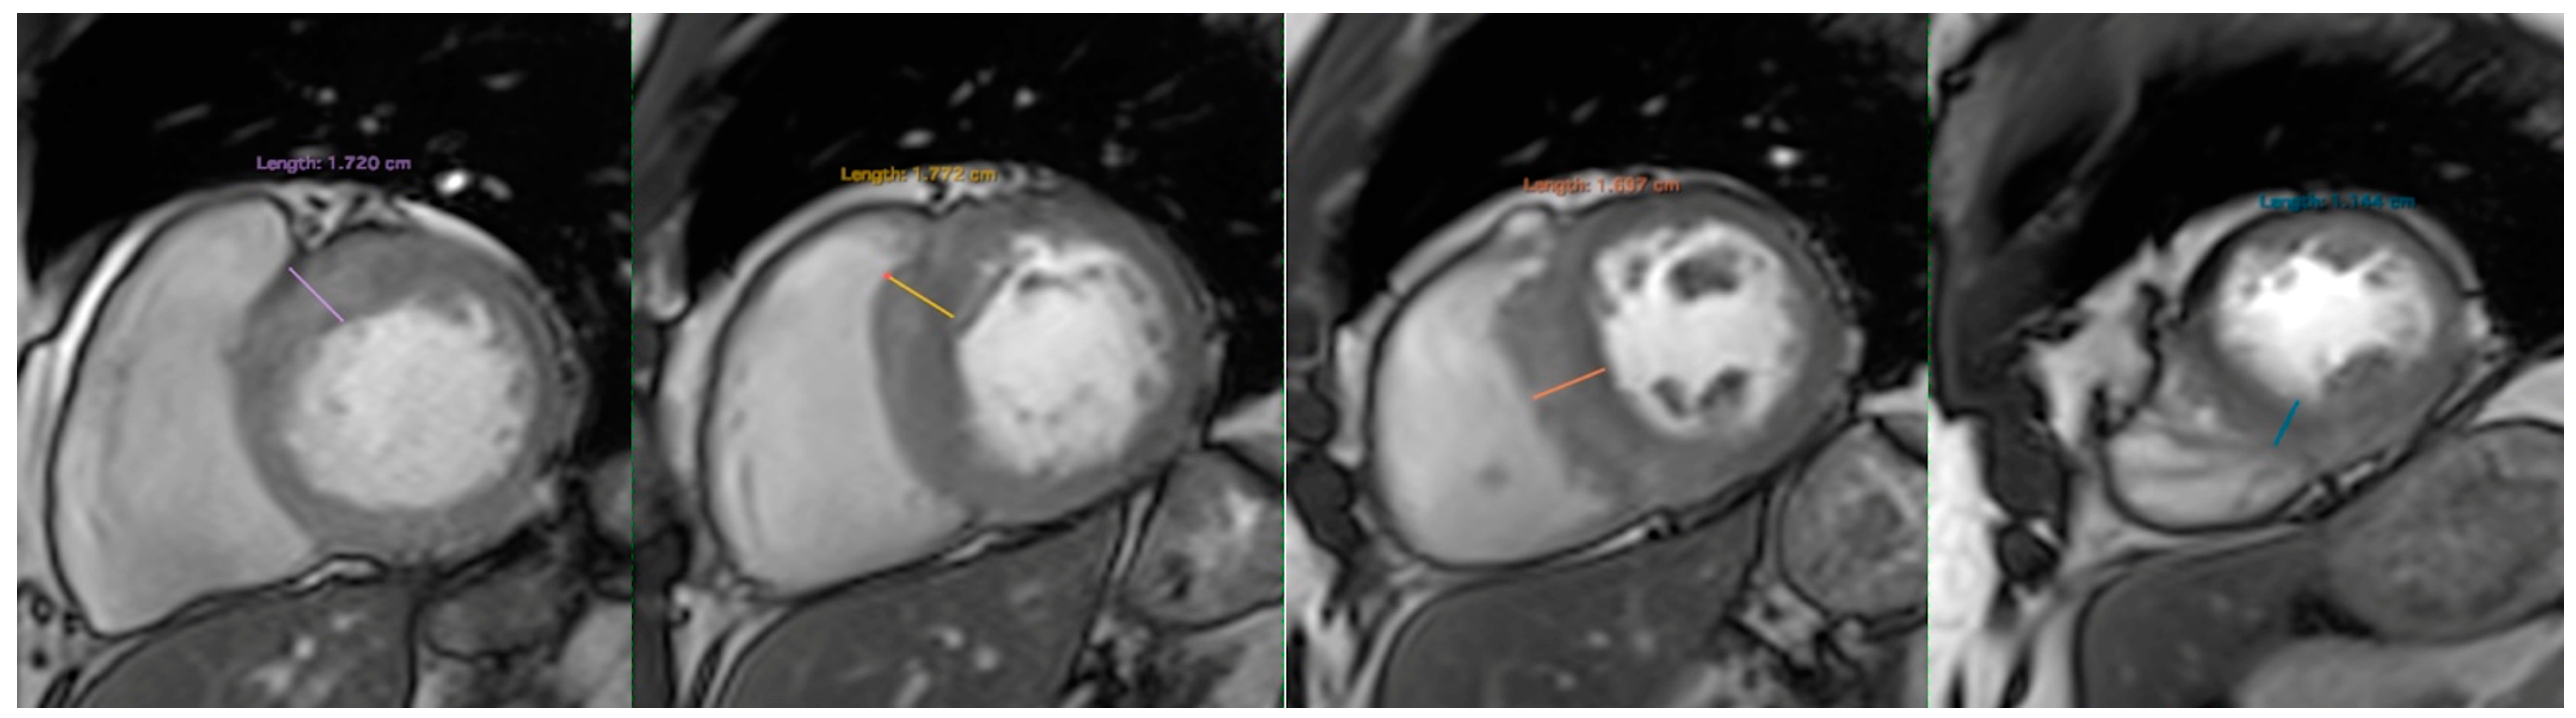
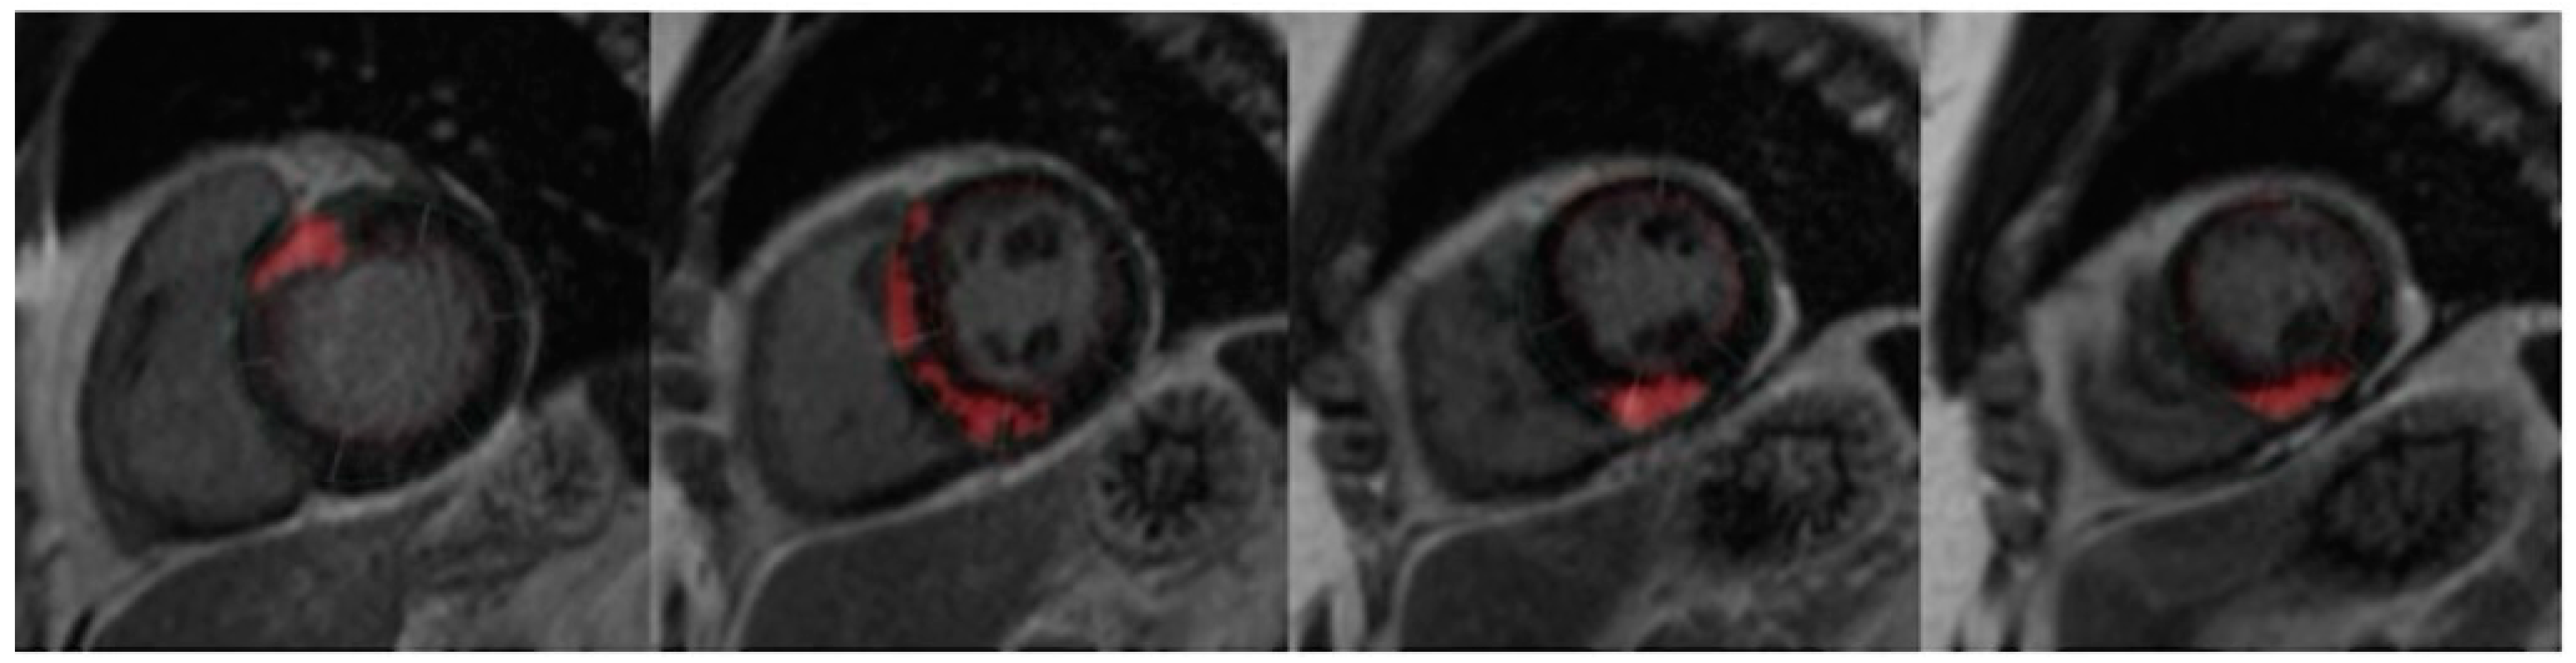
4. Cardiac MRI
5. Statistics
6. Results
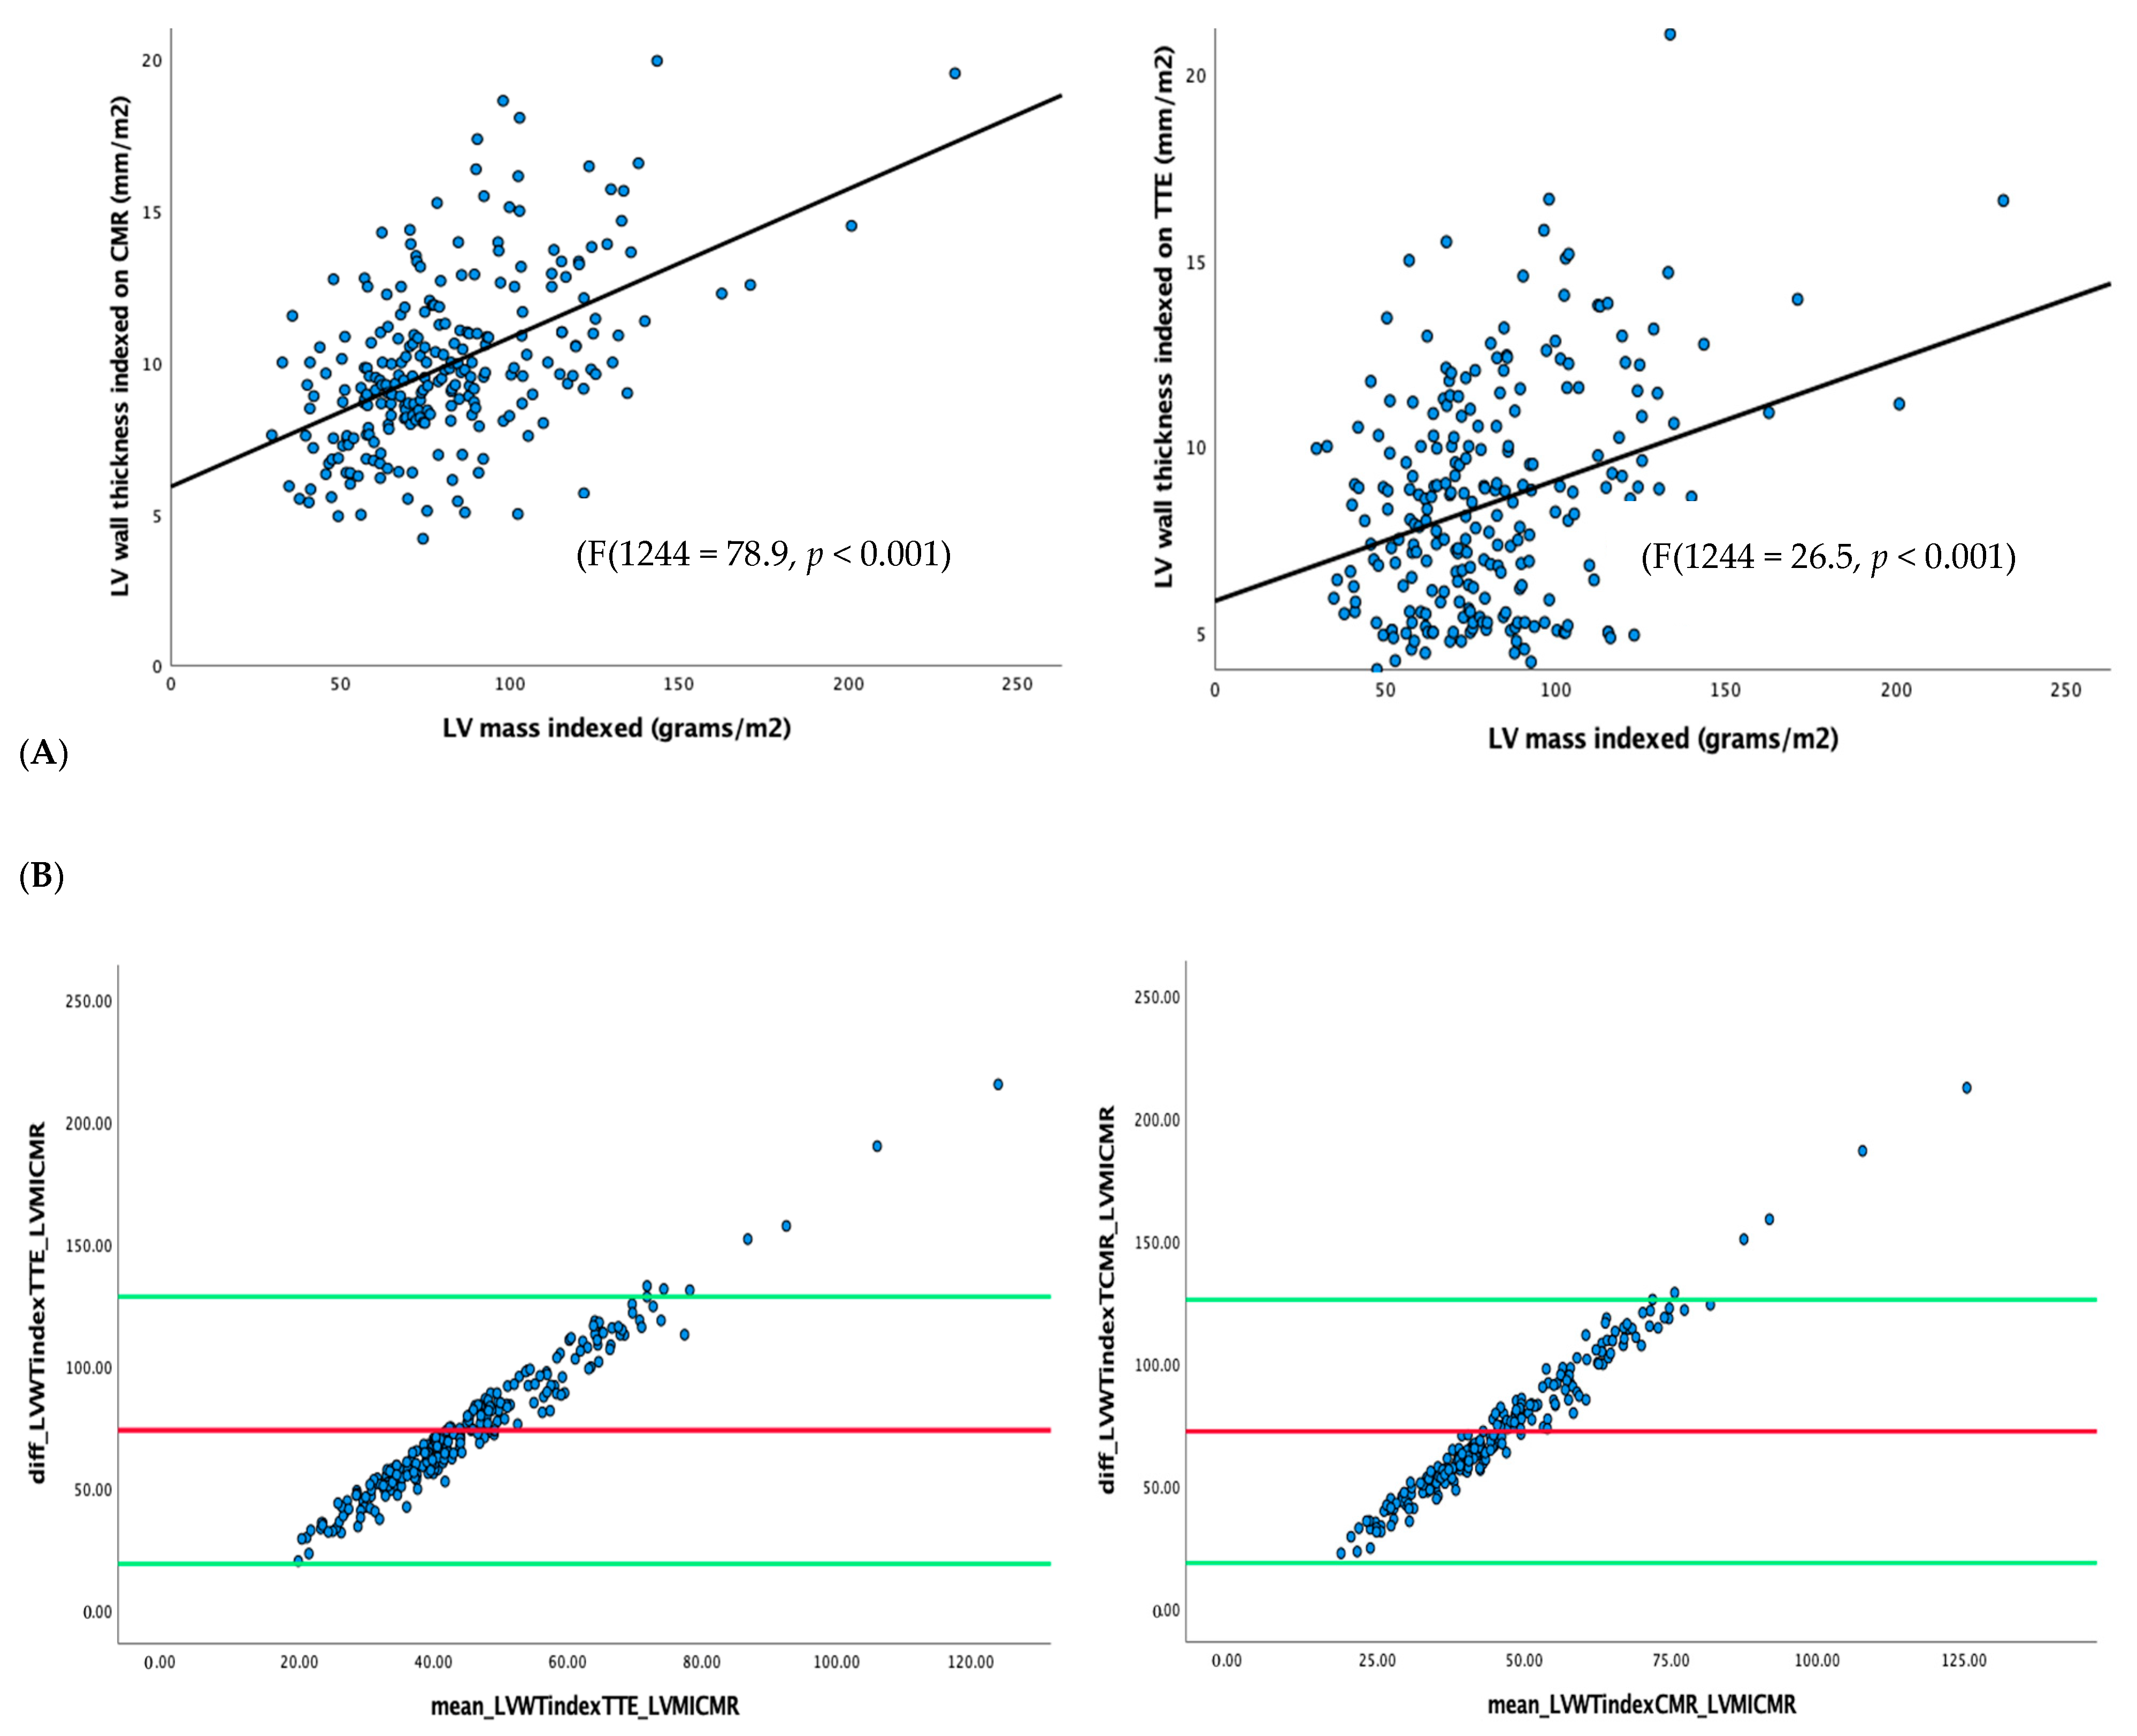
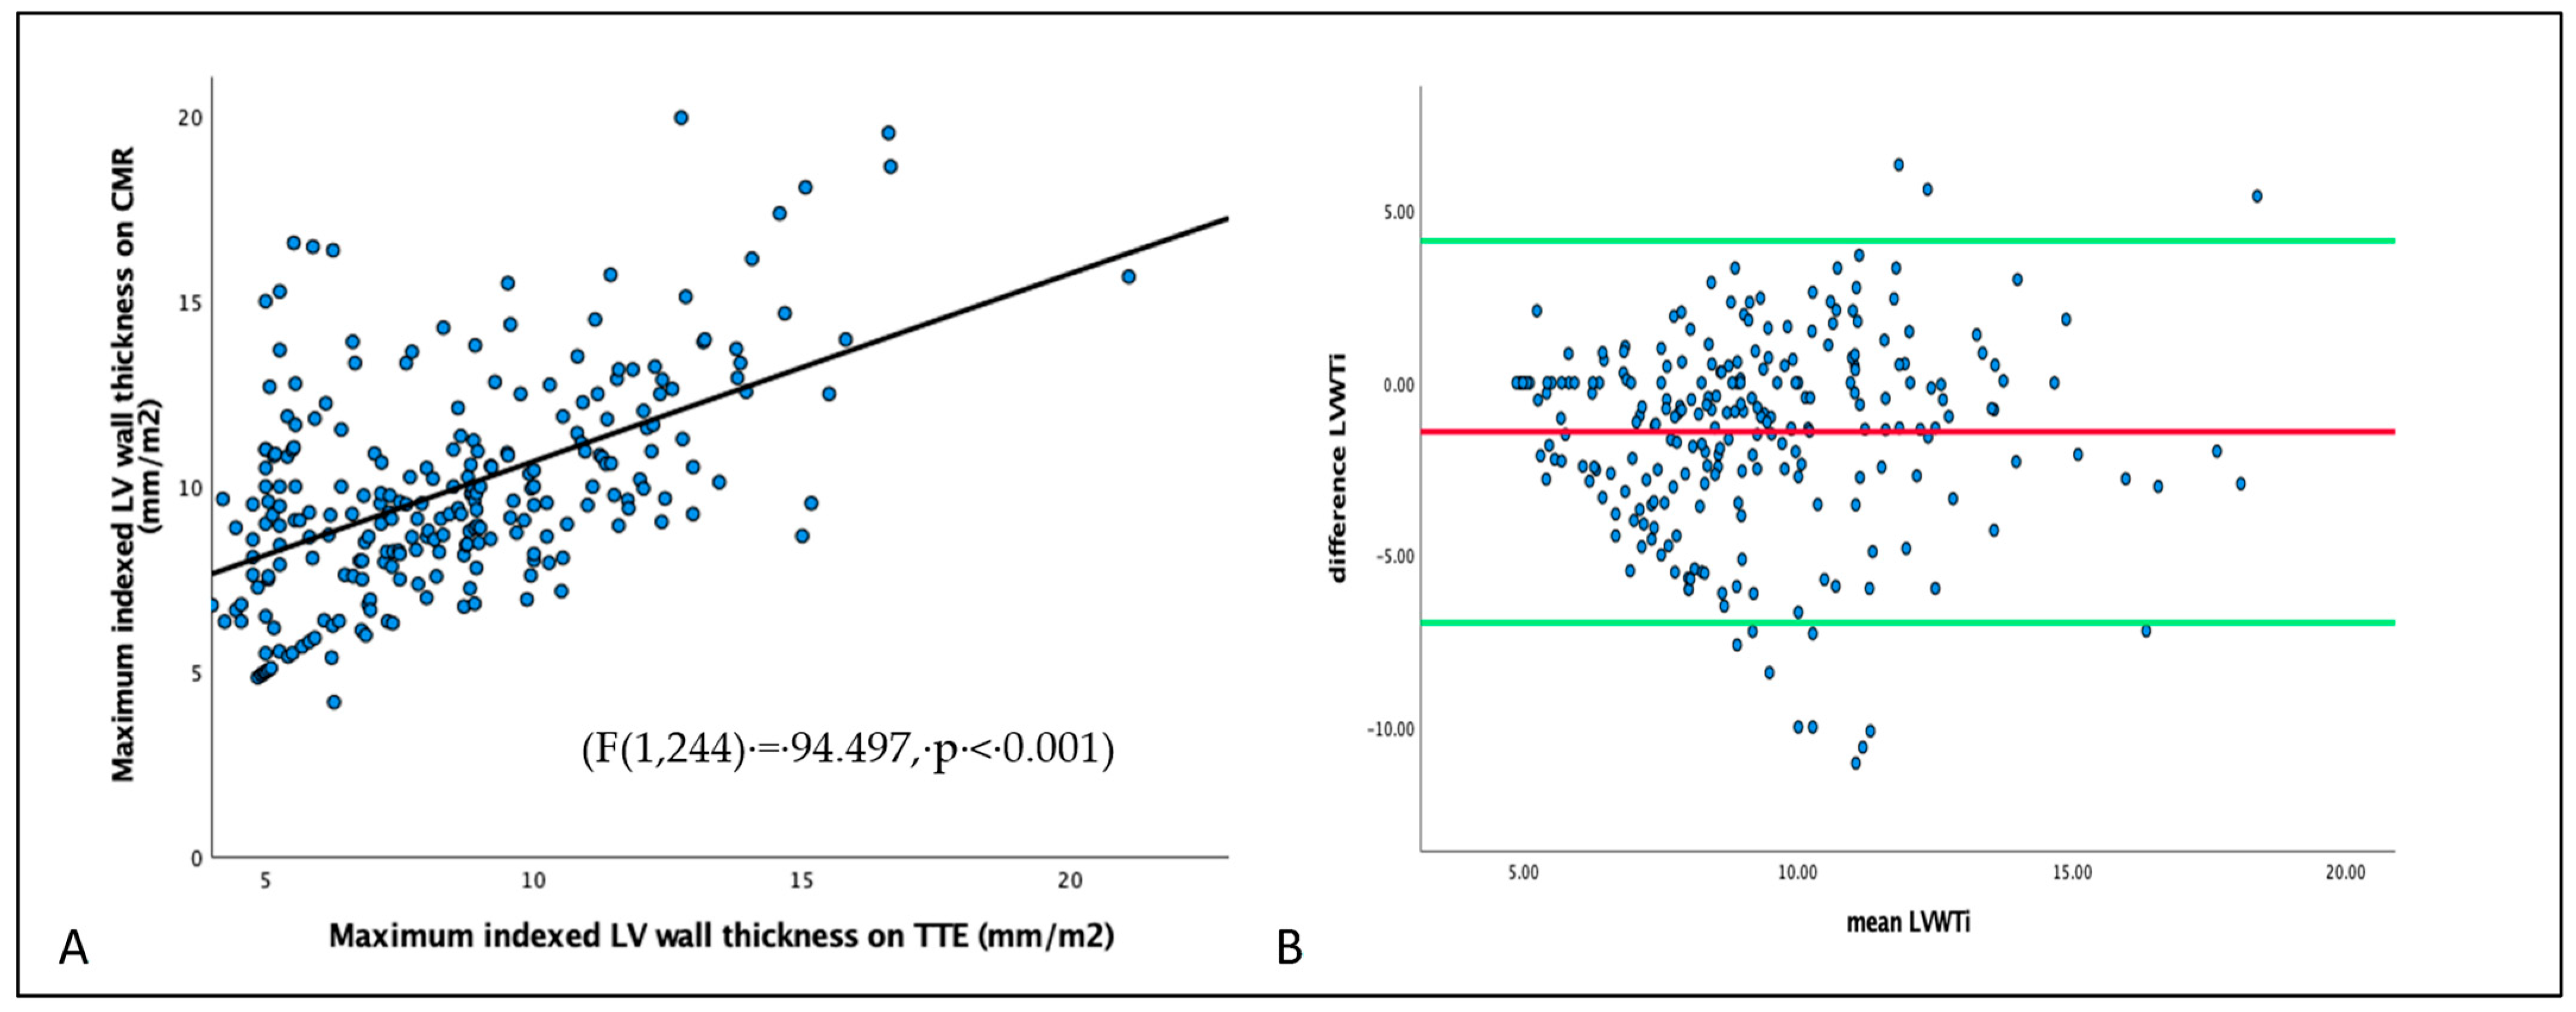
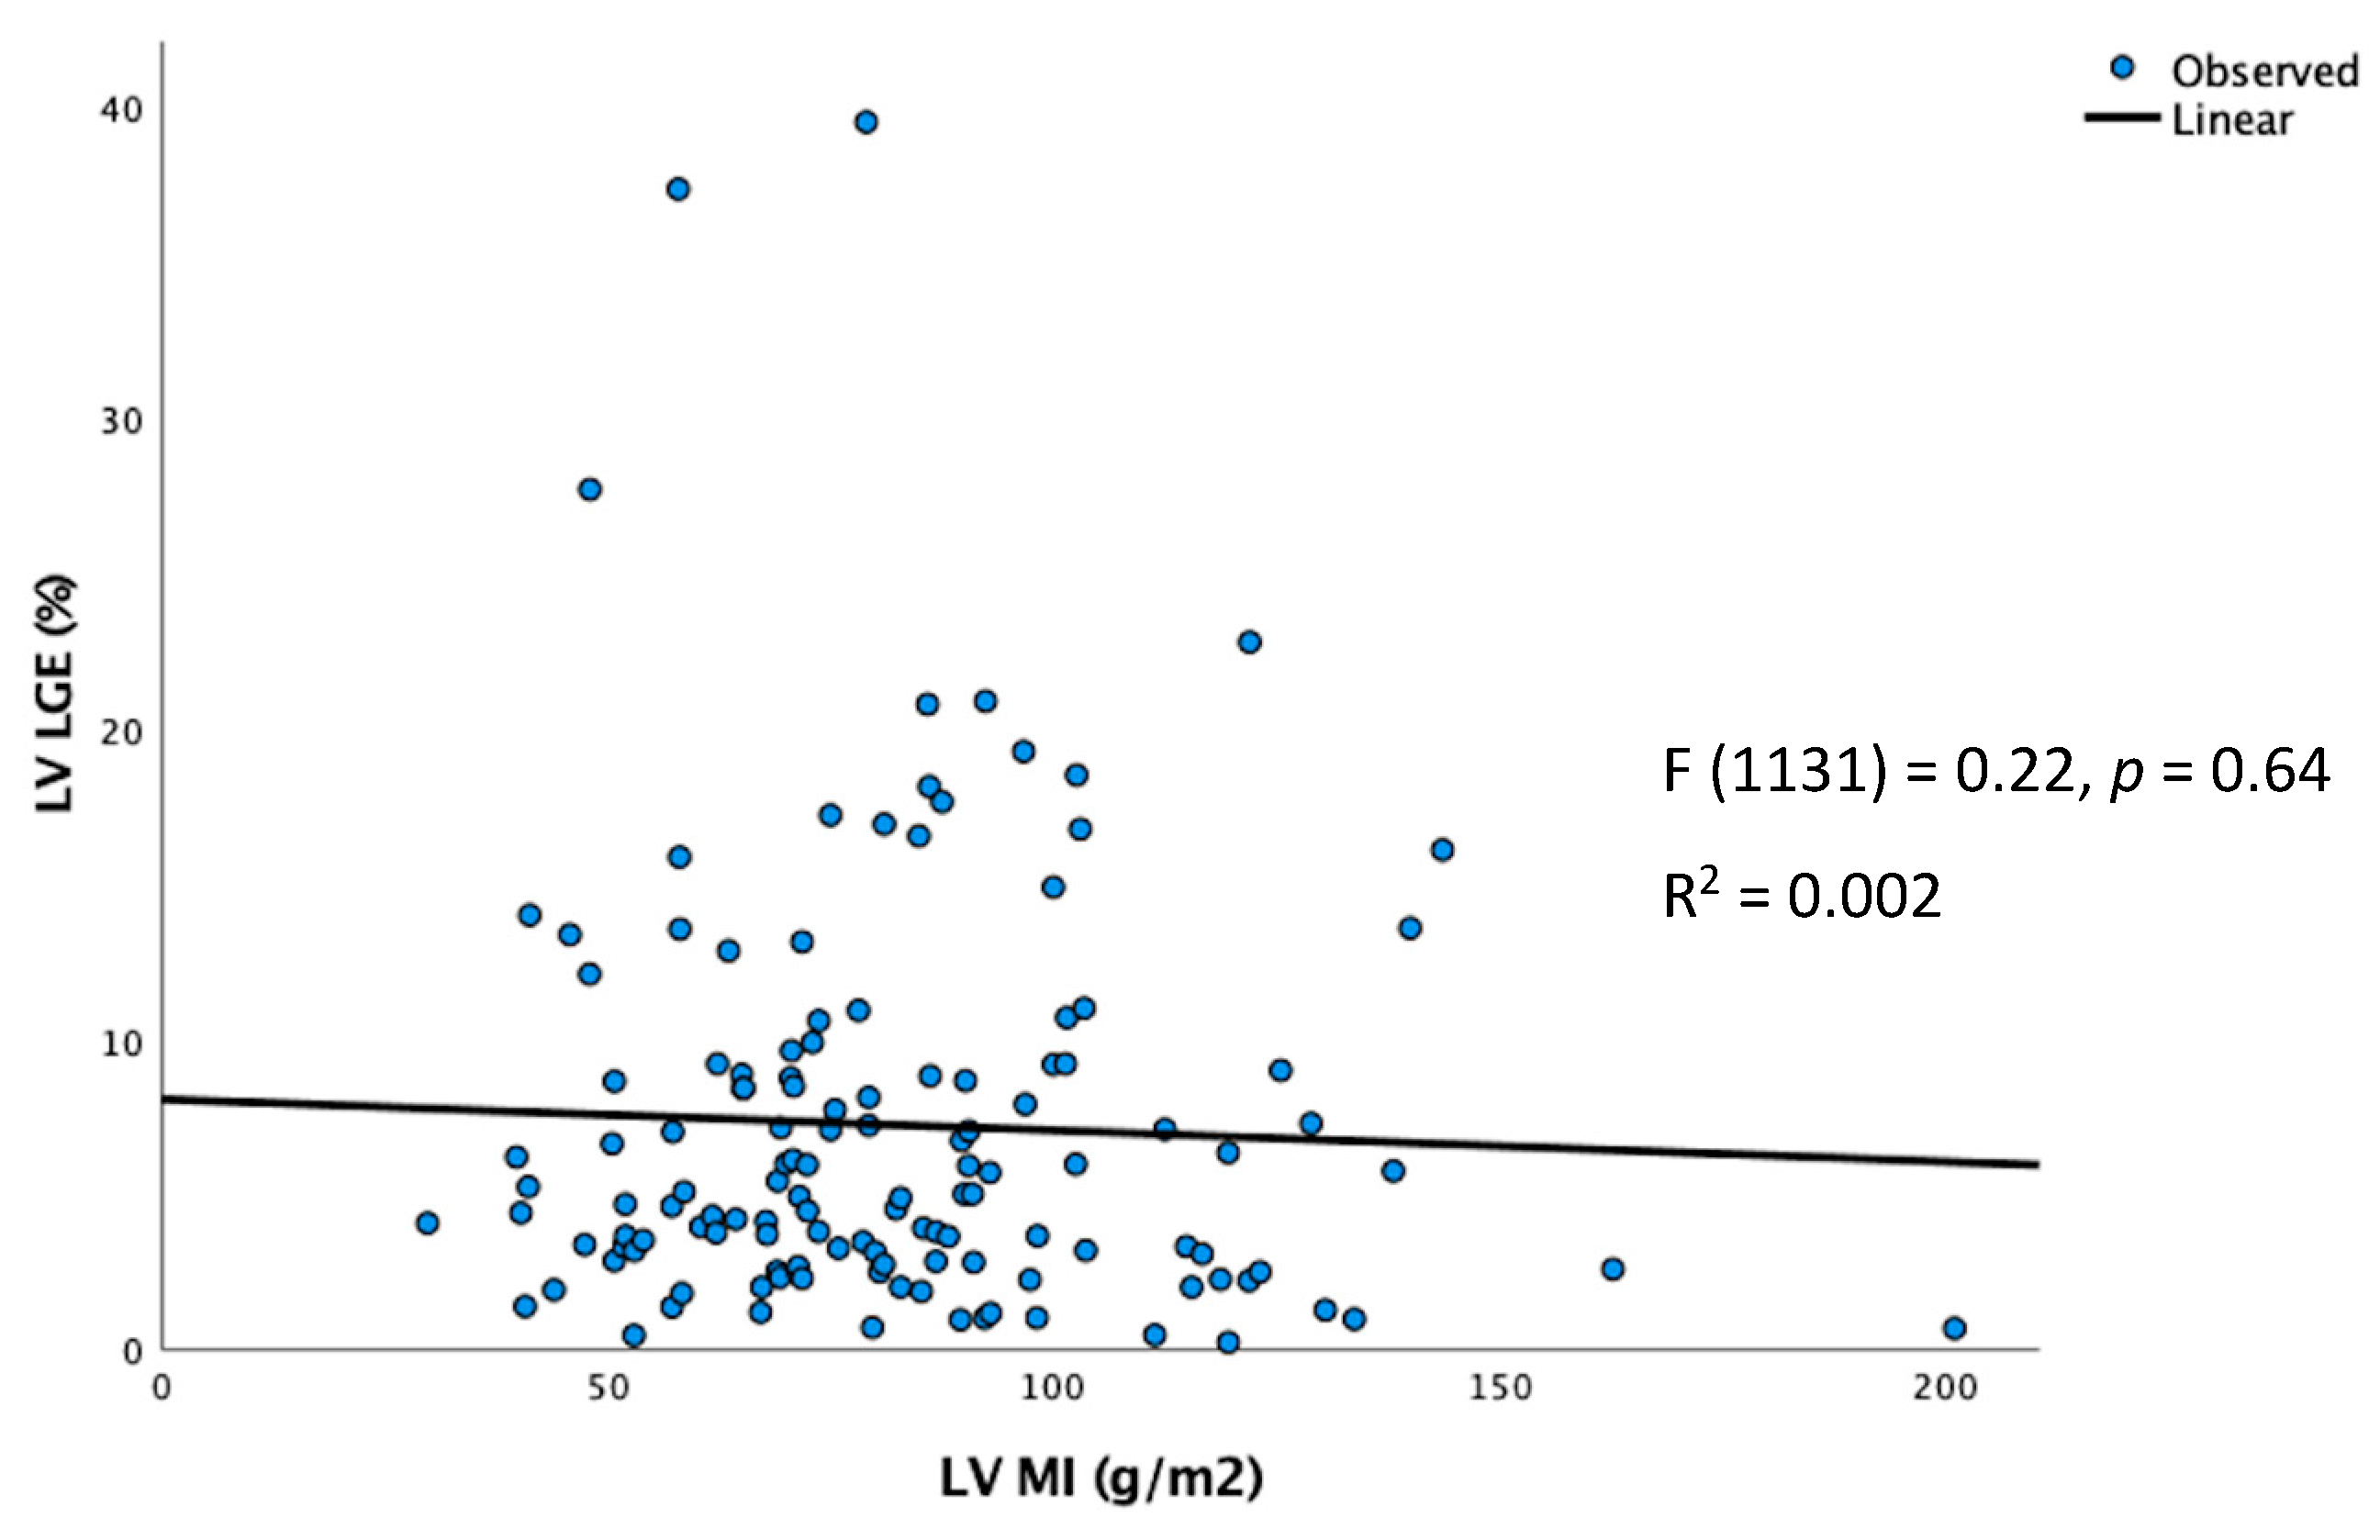
6.1. Correlation of LVWT and LVMI with LV Fibrosis
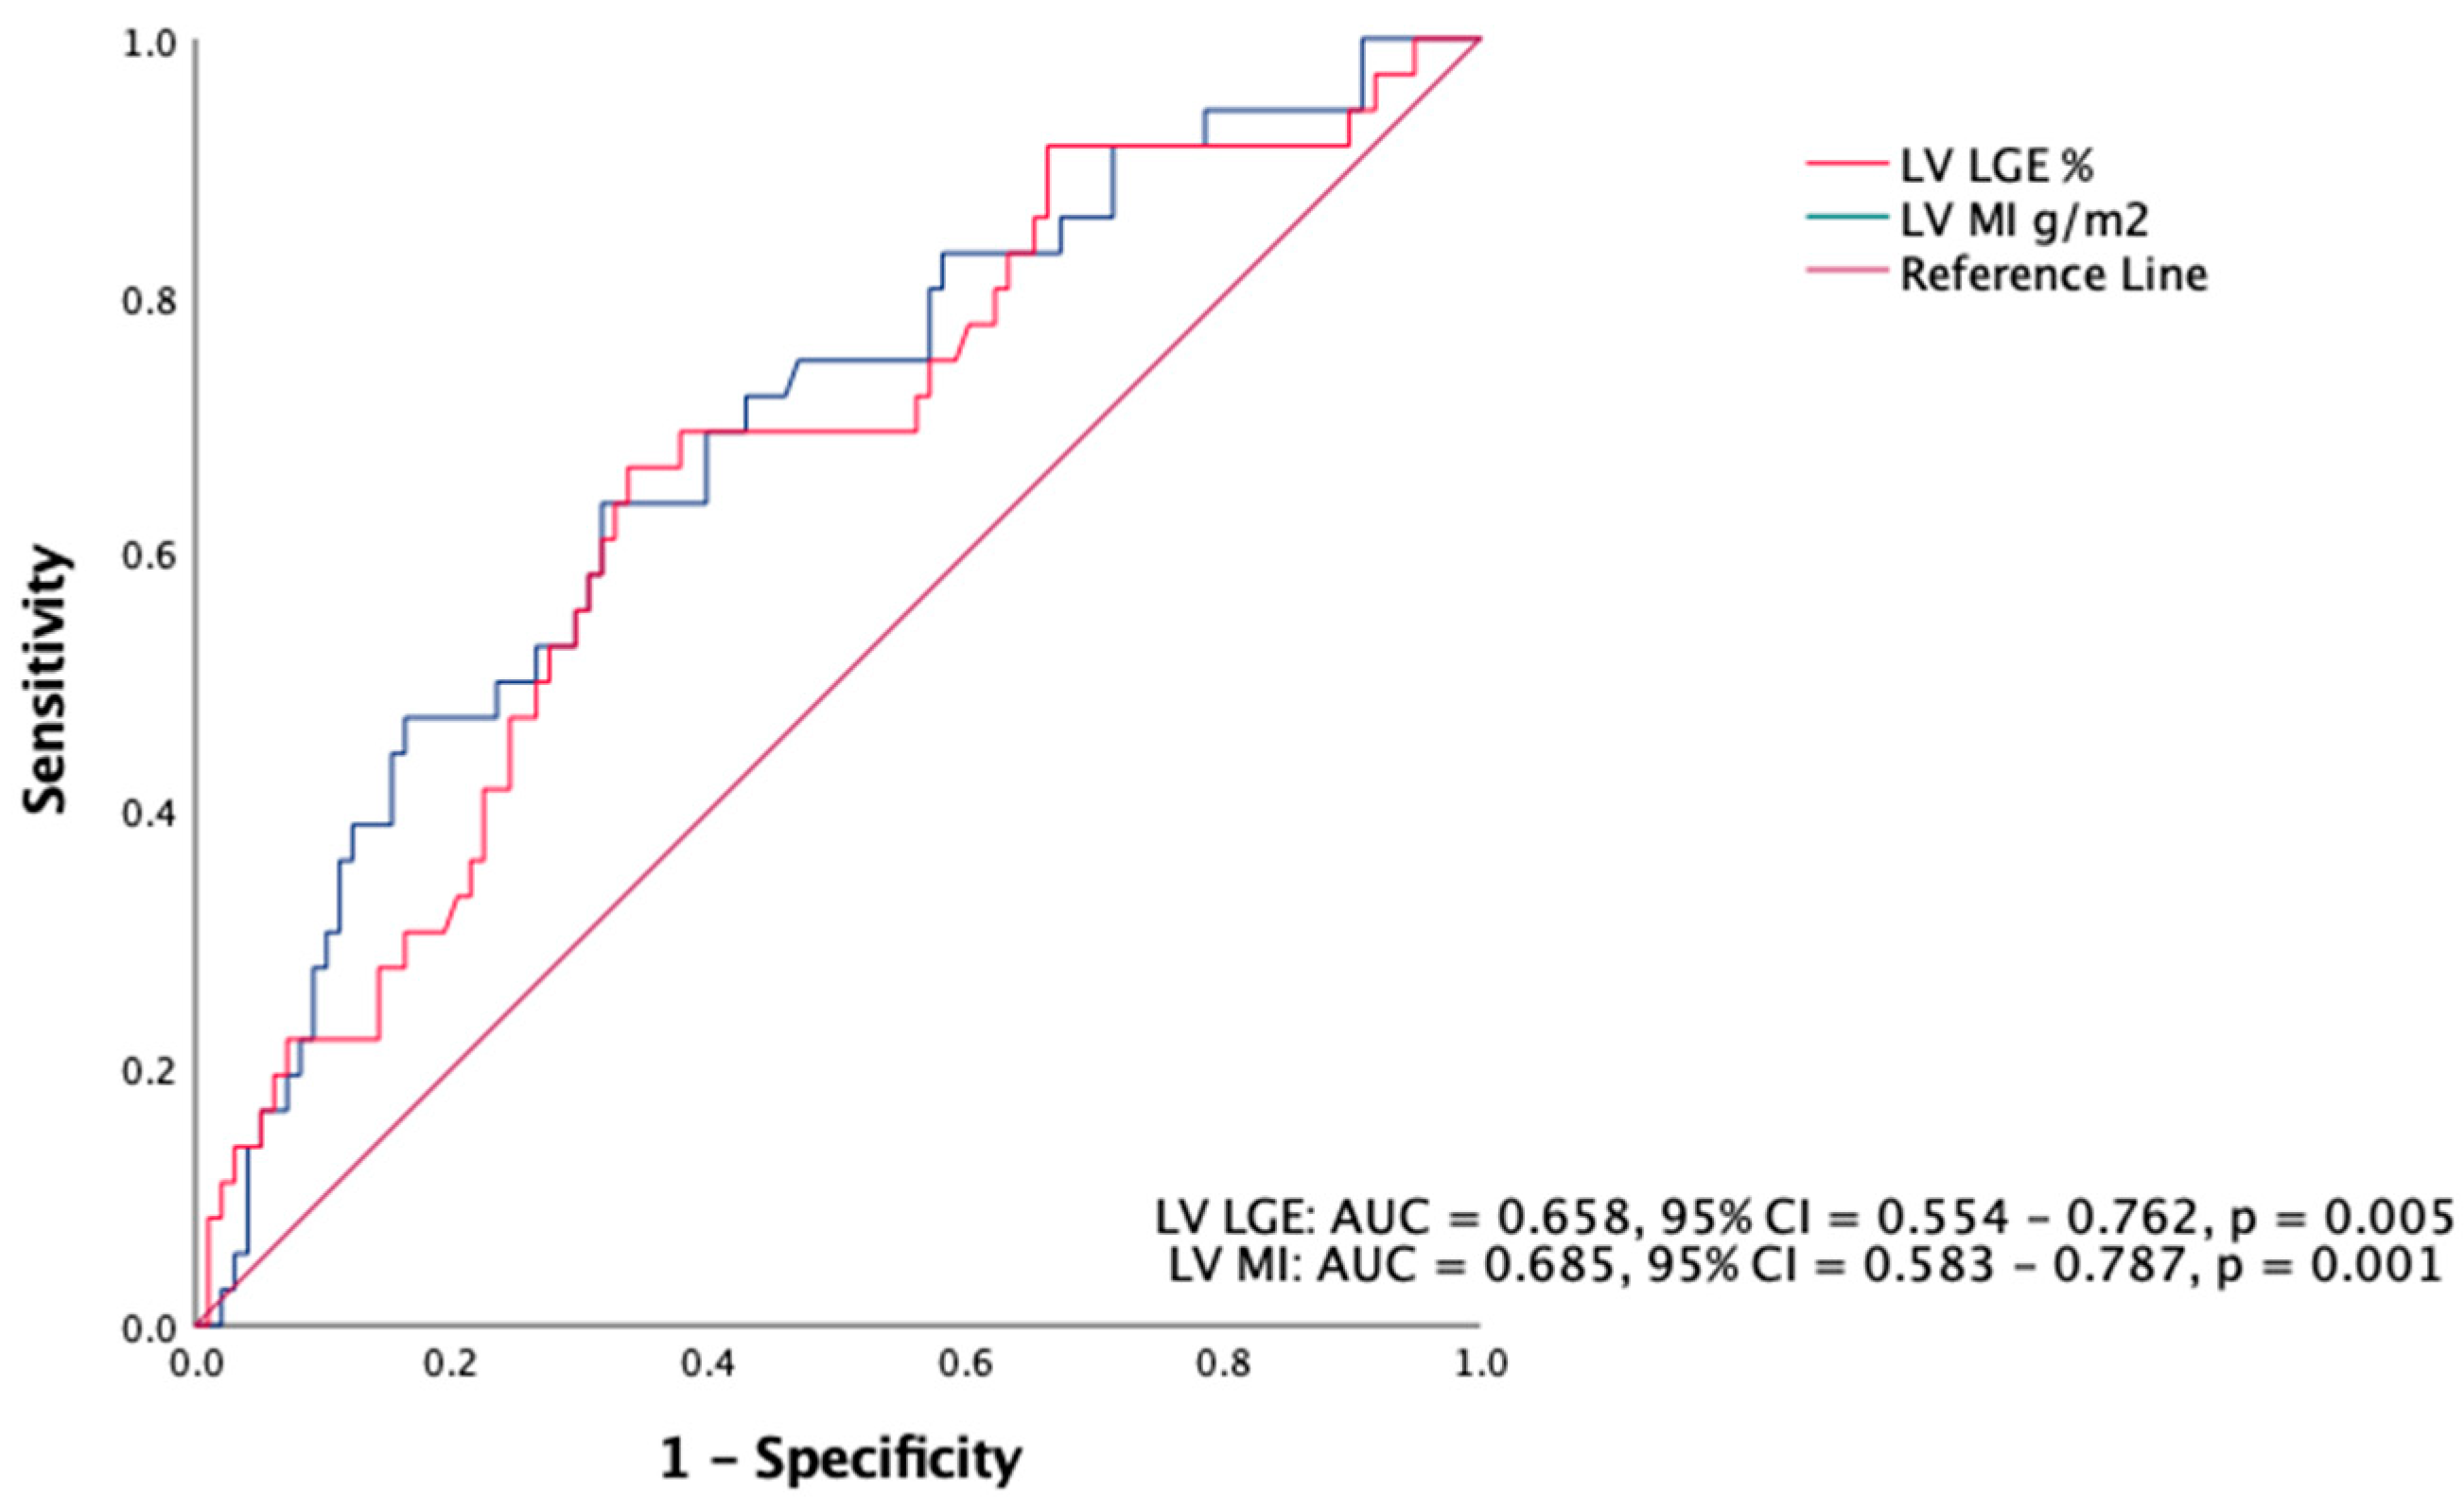
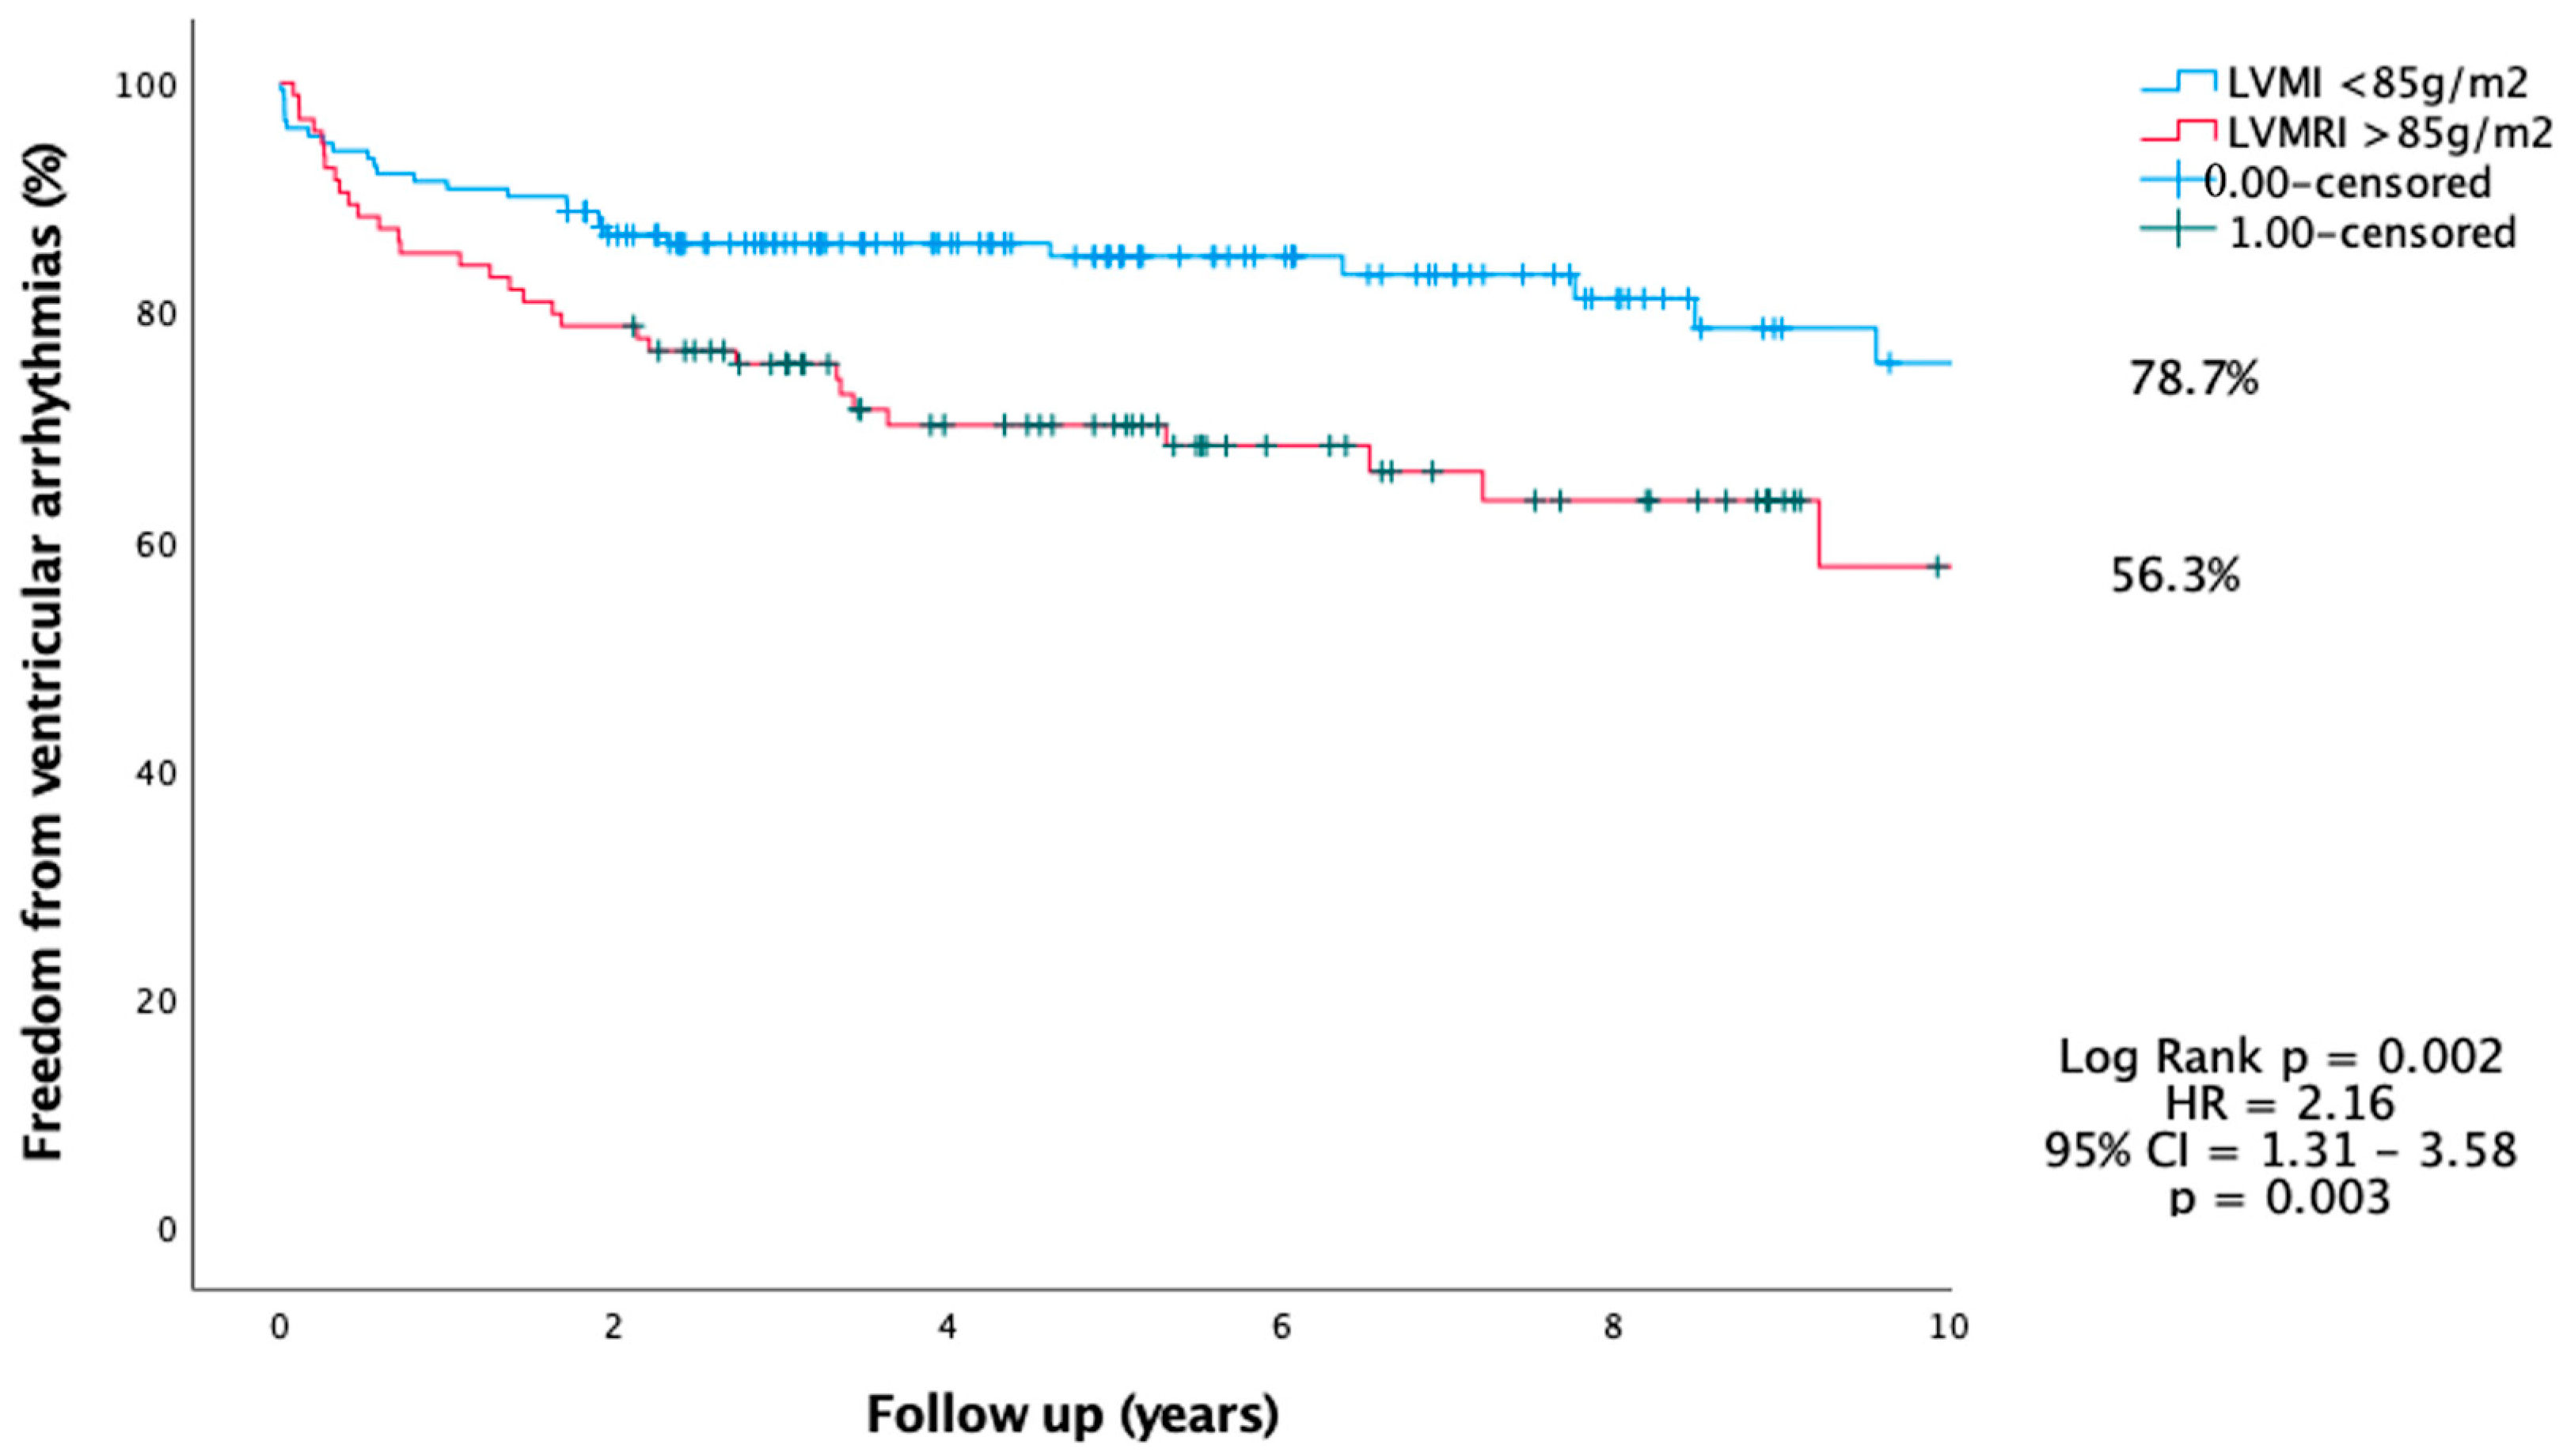
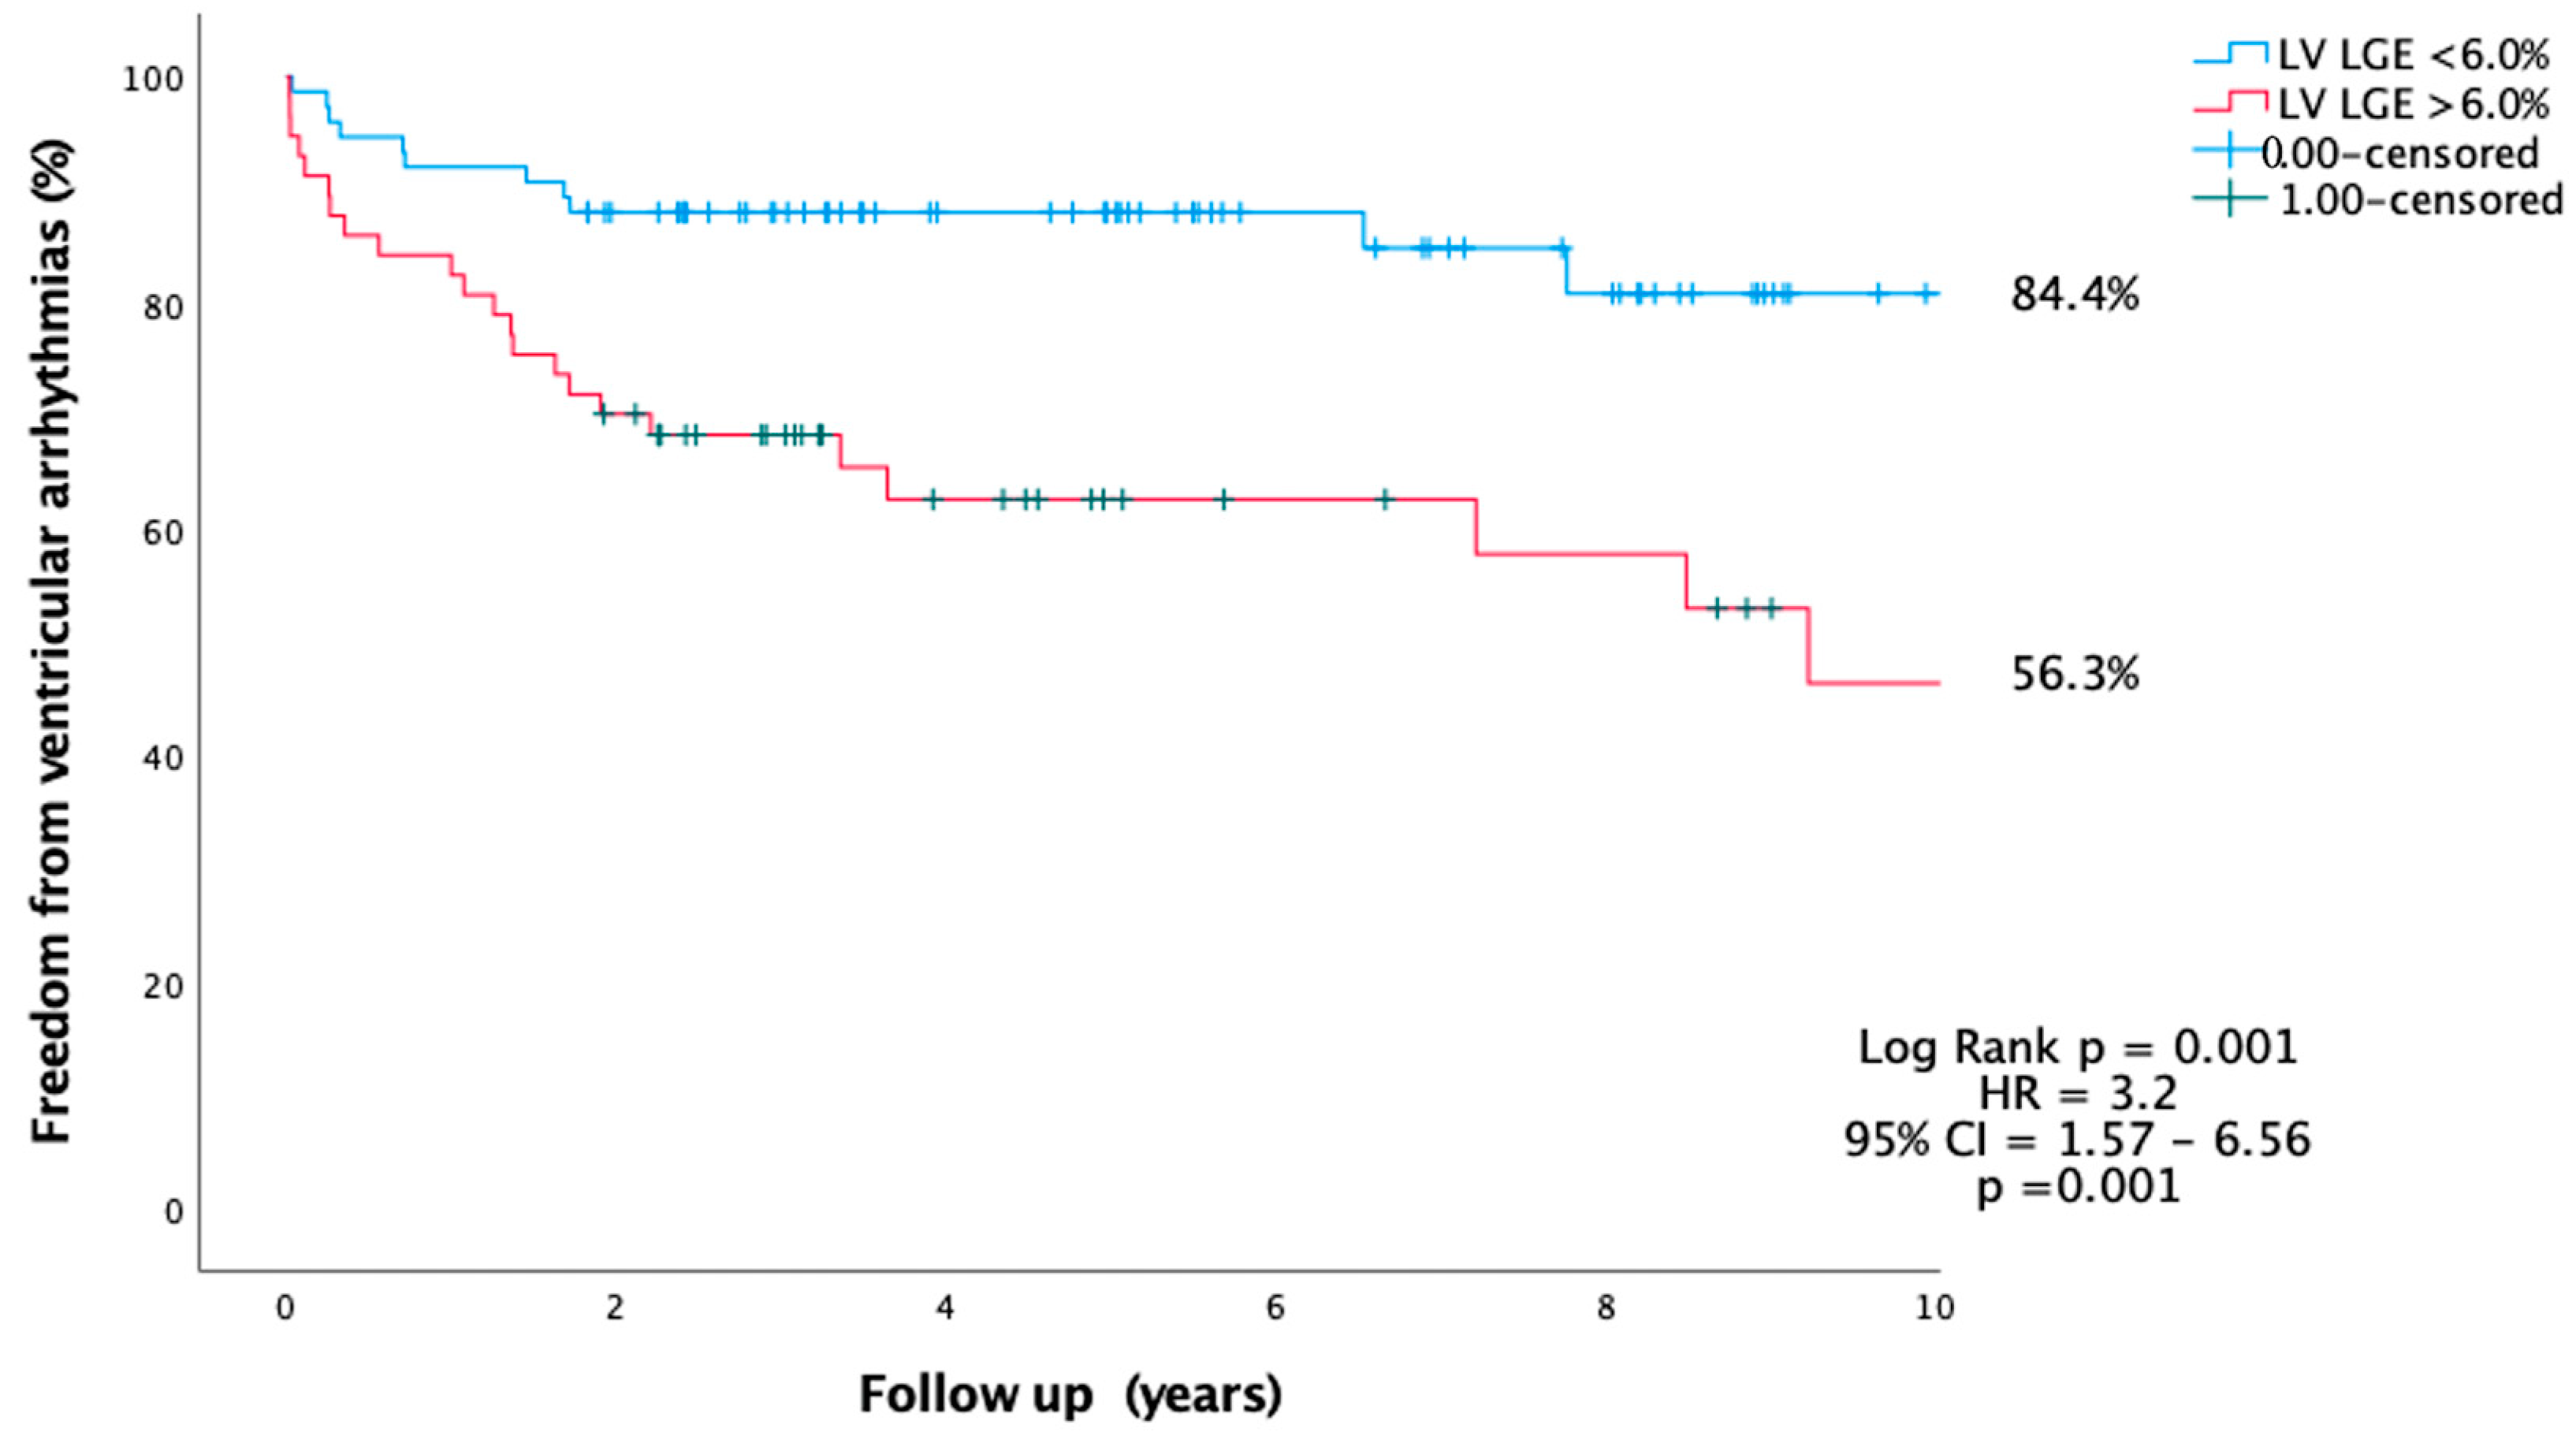
6.2. Predictors of VT
7. Discussion
- Higher LVMI is associated with VA and can be considered for risk stratification of SCD in HCM.
- LVMI > 85 g/m2 and LVLGE > 6% are associated with VA.
- LVWT using TTE or CMR was only weakly correlated with LVMI on CMR.
- LVMI and LVLGE were independent predictors of VA during follow-up.
- HCM risk score using TTE and CMR
- Impact of LVWT, LVMI and myocardial fibrosis on cardiac events and prevention of SCD
8. Implications of LV Mass/Fibrosis on Future Research in Hypertrophic Cardiomyopathy
9. Limitations
10. Conclusions
Author Contributions
Funding
Institutional Review Board Statement
Informed Consent Statement
Data Availability Statement
Conflicts of Interest
List of Abbreviations
| ACC | American College of Cardiology |
| AHA | American Heart Association |
| ATP | anti-tachycardia pacing |
| CI | confidence interval |
| CMR | cardiac magnetic resonance imaging |
| ECG | electrocardiogram |
| ESC | European Society of Cardiology |
| HR | hazard ratio |
| HCM | hypertrophic cardiomyopathy |
| ICD | implantable cardioverter defibrillator |
| LGE | late gadolinium enhancement |
| LV | Left ventricle |
| LVLGE | left ventricle late gadolinium enhancement |
| LVMI | Left ventricle mass indexed to body surface area |
| LVOT | left ventricle outflow tract |
| LVWT | left ventricle wall thickness |
| NPV | negative predictive value |
| NSVT | non-sustained ventricular tachycardia |
| PPV | positive predictive value |
| ROC | receiver operative characteristic |
| SCA | sudden cardiac arrest |
| SCD | sudden cardiac death |
| SD | standard deviation |
| TTE | transthoracic echocardiogram |
| VA | ventricular arrythmia |
| VT | ventricular tachycardia |
| VF | ventricular fibrillation |
| HRK | Conceptualization: data gathering, data analysis, drafting of manuscript, and editing. |
| PR | Data gathering, editing and proofreading of manuscript. |
| AHT | Data gathering, MRI analysis, drafting of manuscript, editing and proofreading. |
| MA | MRI analysis, editing manuscript and proofreading. |
| APT | Editing manuscript and proofreading. |
| KS | Data gathering, editing and proofreading of manuscript. |
| AAA | Data gathering, editing and proofreading of manuscript. |
| BE | Editing manuscript and proofreading. |
| AU | Editing manuscript and proofreading. |
| TM | Conceptualization, editing and proofreading. |
| AG | Editing manuscript and proofreading. |
References
- Maron, B.J.; McKenna, W.J.; Danielson, G.K.; Kappenberger, L.J.; Kuhn, H.J.; Seidman, C.E.; Shah, P.M.; Spencer, W.H., 3rd; Spirito, P.; Ten Cate, F.J.; et al. American College of Cardiology/European Society of Cardiology clinical expert consensus document on hypertrophic cardiomyopathy. A report of the American College of Cardiology Foundation Task Force on Clinical Expert Consensus Documents and the European Society of Cardiology Committee for Practice Guidelines. J. Am. Coll. Cardiol. 2003, 42, 1687–1713. [Google Scholar]
- Nicholls, M. The 2014 ESC Guidelines on the Diagnosis and Management of Hypertrophic Cardiomyopathy have been published. Eur. Heart J. 2014, 35, 2849–2850. [Google Scholar] [CrossRef] [PubMed] [Green Version]
- Gersh, B.J.; Maron, B.J.; Bonow, R.O.; Dearani, J.A.; Fifer, M.A.; Link, M.S.; Naidu, S.S.; Nishimura, R.A.; Ommen, S.R.; Rakowski, H.; et al. 2011 ACCF/AHA Guideline for the Diagnosis and Treatment of Hypertrophic Cardiomyopathy: A report of the American College of Cardiology Foundation/American Heart Association Task Force on Practice Guidelines. Developed in collaboration with the American Association for Thoracic Surgery, American Society of Echocardiography, American Society of Nuclear Cardiology, Heart Failure Society of America, Heart Rhythm Society, Society for Cardiovascular Angiography and Interventions, and Society of Thoracic Surgeons. J. Am. Coll. Cardiol. 2011, 58, e212–e260. [Google Scholar] [CrossRef] [PubMed] [Green Version]
- Spirito, P.; Bellone, P.; Harris, K.M.; Bernabo, P.; Bruzzi, P.; Maron, B.J. Magnitude of left ventricular hypertrophy and risk of sudden death in hypertrophic cardiomyopathy. N. Engl. J. Med. 2000, 342, 1778–1785. [Google Scholar] [CrossRef] [PubMed]
- Nagueh, S.F.; Phelan, D.; Abraham, T.; Armour, A.; Desai, M.Y.; Dragulescu, A.; Gilliland, Y.; Lester, S.J.; Maldonado, Y.; Mohiddin, S.; et al. Recommendations for Multimodality Cardiovascular Imaging of Patients with Hypertrophic Cardiomyopathy: An Update from the American Society of Echocardiography, in Collaboration with the American Society of Nuclear Cardiology, the Society for Cardiovascular Magnetic Resonance, and the Society of Cardiovascular Computed Tomography. J. Am. Soc. Echocardiogr. 2022, 35, 533–569. [Google Scholar] [CrossRef]
- Marian, A.J.; Braunwald, E. Hypertrophic Cardiomyopathy: Genetics, Pathogenesis, Clinical Manifestations, Diagnosis, and Therapy. Circ. Res. 2017, 121, 749–770. [Google Scholar] [CrossRef]
- Cheng, Z.; Fang, T.; Huang, J.; Guo, Y.; Alam, M.; Qian, H. Hypertrophic Cardiomyopathy: From Phenotype and Pathogenesis to Treatment. Front. Cardiovasc. Med. 2021, 8, 722340. [Google Scholar] [CrossRef]
- Soler, R.; Mendez, C.; Rodriguez, E.; Barriales, R.; Ochoa, J.P.; Monserrat, L. Phenotypes of hypertrophic cardiomyopathy. An illustrative review of MRI findings. Insights Imaging 2018, 9, 1007–1020. [Google Scholar] [CrossRef] [Green Version]
- Ommen, S.R.; Mital, S.; Burke, M.A.; Day, S.M.; Deswal, A.; Elliott, P.; Evanovich, L.L.; Hung, J.; Joglar, J.A.; Kantor, P.; et al. 2020 AHA/ACC Guideline for the Diagnosis and Treatment of Patients With Hypertrophic Cardiomyopathy: Executive Summary: A Report of the American College of Cardiology/American Heart Association Joint Committee on Clinical Practice Guidelines. Circulation 2020, 142, e533–e557. [Google Scholar] [CrossRef]
- Bogaert, J.; Olivotto, I. MR Imaging in Hypertrophic Cardiomyopathy: From Magnet to Bedside. Radiology 2014, 273, 329–348. [Google Scholar] [CrossRef]
- Elliott, P. The New European Society of Cardiology guidelines on hypertrophic cardiomyopathy. Heart 2015, 101, 506–508. [Google Scholar] [CrossRef] [PubMed]
- Shen, H.; Dong, S.Y.; Ren, M.S.; Wang, R. Ventricular arrhythmia and sudden cardiac death in hypertrophic cardiomyopathy: From bench to bedside. Front. Cardiovasc. Med. 2022, 9, 949294. [Google Scholar] [CrossRef] [PubMed]
- Maron, M.S.; Rowin, E.J.; Wessler, B.S.; Mooney, P.J.; Fatima, A.; Patel, P.; Koethe, B.C.; Romashko, M.; Link, M.S.; Maron, B.J. Enhanced American College of Cardiology/American Heart Association Strategy for Prevention of Sudden Cardiac Death in High-Risk Patients With Hypertrophic Cardiomyopathy. JAMA Cardiol. 2019, 4, 644–657. [Google Scholar] [CrossRef] [Green Version]
- Authors/Task Force Members; Elliott, P.M.; Anastasakis, A.; Borger, M.A.; Borggrefe, M.; Cecchi, F.; Charron, P.; Hagege, A.A.; Lafont, A.; Limongelli, G.; et al. 2014 ESC Guidelines on diagnosis and management of hypertrophic cardiomyopathy: The Task Force for the Diagnosis and Management of Hypertrophic Cardiomyopathy of the European Society of Cardiology (ESC). Eur. Heart J. 2014, 35, 2733–2779. [Google Scholar] [CrossRef] [PubMed]
- Norrish, G.; Ding, T.; Field, E.; McLeod, K.; Ilina, M.; Stuart, G.; Bhole, V.; Uzun, O.; Brown, E.; Daubeney, P.E.F.; et al. A validation study of the European Society of Cardiology guidelines for risk stratification of sudden cardiac death in childhood hypertrophic cardiomyopathy. Europace 2019, 21, 1559–1565. [Google Scholar] [CrossRef] [PubMed]
- Leong, K.M.W.; Chow, J.J.; Ng, F.S.; Falaschetti, E.; Qureshi, N.; Koa-Wing, M.; Linton, N.W.F.; Whinnett, Z.I.; Lefroy, D.C.; Davies, D.W.; et al. Comparison of the Prognostic Usefulness of the European Society of Cardiology and American Heart Association/American College of Cardiology Foundation Risk Stratification Systems for Patients With Hypertrophic Cardiomyopathy. Am. J. Cardiol. 2018, 121, 349–355. [Google Scholar] [CrossRef] [Green Version]
- Maron, B.J.; Spirito, P.; Ackerman, M.J.; Casey, S.A.; Semsarian, C.; Estes, N.A., 3rd; Shannon, K.M.; Ashley, E.A.; Day, S.M.; Pacileo, G.; et al. Prevention of sudden cardiac death with implantable cardioverter-defibrillators in children and adolescents with hypertrophic cardiomyopathy. J. Am. Coll. Cardiol. 2013, 61, 1527–1535. [Google Scholar] [CrossRef]
- SOSIN, M.D.; KHAN, H.R.; TOTMAN, J.J.; POINTON, K.S. Review of clinical cardiac MRI. Imaging 2013, 22, 20110004. [Google Scholar] [CrossRef]
- Habib, M.; Hoss, S.; Rakowski, H. Evaluation of Hypertrophic Cardiomyopathy: Newer Echo and MRI Approaches. Curr. Cardiol. Rep. 2019, 21, 75. [Google Scholar] [CrossRef]
- Weng, Z.; Yao, J.; Chan, R.H.; He, J.; Yang, X.; Zhou, Y.; He, Y. Prognostic Value of LGE-CMR in HCM: A Meta-Analysis. JACC Cardiovasc. Imaging 2016, 9, 1392–1402. [Google Scholar] [CrossRef]
- Hong, Y.; Su, W.W.; Li, X. Risk factors of sudden cardiac death in hypertrophic cardiomyopathy. Curr. Opin. Cardiol. 2022, 37, 15. [Google Scholar] [CrossRef] [PubMed]
- Du, D.; Li, C.O.Y.; Ong, K.; Parsa, A.; Weissler-Snir, A.; Geske, J.B.; Laksman, Z. Arrhythmia Monitoring for Risk Stratification in Hypertrophic Cardiomyopathy. CJC Open 2022, 4, 406–415. [Google Scholar] [CrossRef] [PubMed]
- Monserrat, L.; Elliott, P.M.; Gimeno, J.R.; Sharma, S.; Penas-Lado, M.; McKenna, W.J. Non-sustained ventricular tachycardia in hypertrophic cardiomyopathy: An independent marker of sudden death risk in young patients. J. Am. Coll. Cardiol. 2003, 42, 873–879. [Google Scholar] [CrossRef] [Green Version]
- Kou, S.; Caballero, L.; Dulgheru, R.; Voilliot, D.; De Sousa, C.; Kacharava, G.; Athanassopoulos, G.D.; Barone, D.; Baroni, M.; Cardim, N.; et al. Echocardiographic reference ranges for normal cardiac chamber size: Results from the NORRE study. Eur. Heart J. Cardiovasc. Imaging 2014, 15, 680–690. [Google Scholar] [CrossRef] [Green Version]
- Schulz-Menger, J.; Bluemke, D.A.; Bremerich, J.; Flamm, S.D.; Fogel, M.A.; Friedrich, M.G.; Kim, R.J.; von Knobelsdorff-Brenkenhoff, F.; Kramer, C.M.; Pennell, D.J.; et al. Standardized image interpretation and post processing in cardiovascular magnetic resonance: Society for Cardiovascular Magnetic Resonance (SCMR) board of trustees task force on standardized post processing. J. Cardiovasc. Magn. Reson. 2013, 15, 35. [Google Scholar] [CrossRef] [Green Version]
- Suinesiaputra, A.; Bluemke, D.A.; Cowan, B.R.; Friedrich, M.G.; Kramer, C.M.; Kwong, R.; Plein, S.; Schulz-Menger, J.; Westenberg, J.J.; Young, A.A.; et al. Quantification of LV function and mass by cardiovascular magnetic resonance: Multi-center variability and consensus contours. J. Cardiovasc. Magn. Reson. 2015, 17, 63. [Google Scholar] [CrossRef] [PubMed] [Green Version]
- Harrigan, C.J.; Peters, D.C.; Gibson, C.M.; Maron, B.J.; Manning, W.J.; Maron, M.S.; Appelbaum, E. Hypertrophic cardiomyopathy: Quantification of late gadolinium enhancement with contrast-enhanced cardiovascular MR imaging. Radiology 2011, 258, 128–133. [Google Scholar] [CrossRef]
- Śpiewak, M.; Kłopotowski, M.; Kowalik, E.; Kubik, A.; Ojrzyńska-Witek, N.; Petryka-Mazurkiewicz, J.; Michalak, E.; Mazurkiewicz, Ł.; Gawor, M.; Kożuch, K.; et al. Sudden cardiac death risk in hypertrophic cardiomyopathy: Comparison between echocardiography and magnetic resonance imaging. Sci. Rep. 2021, 11, 7146. [Google Scholar] [CrossRef]
- Hindieh, W.; Weissler-Snir, A.; Hammer, H.; Adler, A.; Rakowski, H.; Chan, R.H. Discrepant Measurements of Maximal Left Ventricular Wall Thickness Between Cardiac Magnetic Resonance Imaging and Echocardiography in Patients With Hypertrophic Cardiomyopathy. Circ. Cardiovasc. Imaging 2017, 10, e006309. [Google Scholar] [CrossRef] [Green Version]
- Turvey, L.; Augustine, D.X.; Robinson, S.; Oxborough, D.; Stout, M.; Smith, N.; Harkness, A.; Williams, L.; Steeds, R.P.; Bradlow, W. Transthoracic echocardiography of hypertrophic cardiomyopathy in adults: A practical guideline from the British Society of Echocardiography. Echo Res. Pract. 2021, 8, G61–G86. [Google Scholar] [CrossRef]
- Noureldin, R.A.; Liu, S.; Nacif, M.S.; Judge, D.P.; Halushka, M.K.; Abraham, T.P.; Ho, C.; Bluemke, D.A. The diagnosis of hypertrophic cardiomyopathy by cardiovascular magnetic resonance. J. Cardiovasc. Magn. Reson. 2012, 14, 17. [Google Scholar] [CrossRef] [Green Version]
- Bois, J.P.; Geske, J.B.; Foley, T.A.; Ommen, S.R.; Pellikka, P.A. Comparison of Maximal Wall Thickness in Hypertrophic Cardiomyopathy Differs Between Magnetic Resonance Imaging and Transthoracic Echocardiography. Am. J. Cardiol. 2017, 119, 643–650. [Google Scholar] [CrossRef]
- Windram, J.D.; Dragelescu, A.; Benson, L.; Forsey, J.; Shariat, M.; Yoo, S.J.; Mertens, L.; Wong, D.; Grosse-Wortmann, L. Myocardial Dimensions in Children With Hypertrophic Cardiomyopathy: A Comparison Between Echocardiography and Cardiac Magnetic Resonance Imaging. Can. J. Cardiol. 2016, 32, 1507–1512. [Google Scholar] [CrossRef] [PubMed]
- Freitas, P.; Ferreira, A.M.; Arteaga-Fernandez, E.; de Oliveira Antunes, M.; Mesquita, J.; Abecasis, J.; Marques, H.; Saraiva, C.; Matos, D.N.; Rodrigues, R.; et al. The amount of late gadolinium enhancement outperforms current guideline-recommended criteria in the identification of patients with hypertrophic cardiomyopathy at risk of sudden cardiac death. J. Cardiovasc. Magn. Reson. 2019, 21, 50. [Google Scholar] [CrossRef] [PubMed] [Green Version]
- Maeda, R.; Minami, Y.; Haruki, S.; Kanbayashi, K.; Itani, R.; Suzuki, A.; Ejima, K.; Shiga, T.; Shoda, M.; Hagiwara, N. Implantable cardioverter defibrillator therapy and sudden death risk stratification in hypertrophic cardiomyopathy patients with midventricular obstruction: A single-center experience. Int. J. Cardiol. 2016, 214, 419–422. [Google Scholar] [CrossRef] [PubMed]
- Todiere, G.; Nugara, C.; Gentile, G.; Negri, F.; Bianco, F.; Falletta, C.; Novo, G.; Di Bella, G.; De Caterina, R.; Zachara, E.; et al. Prognostic Role of Late Gadolinium Enhancement in Patients With Hypertrophic Cardiomyopathy and Low-to-Intermediate Sudden Cardiac Death Risk Score. Am. J. Cardiol. 2019, 124, 1286–1292. [Google Scholar] [CrossRef] [PubMed]
- Maurizi, N.; Passantino, S.; Spaziani, G.; Girolami, F.; Arretini, A.; Targetti, M.; Pollini, I.; Tomberli, A.; Pradella, S.; Calabri, G.B.; et al. Long-term Outcomes of Pediatric-Onset Hypertrophic Cardiomyopathy and Age-Specific Risk Factors for Lethal Arrhythmic Events. JAMA Cardiol. 2018, 3, 520–525. [Google Scholar] [CrossRef] [PubMed] [Green Version]
- Vriesendorp, P.A.; Schinkel, A.F.; Liebregts, M.; Theuns, D.A.; van Cleemput, J.; Ten Cate, F.J.; Willems, R.; Michels, M. Validation of the 2014 European Society of Cardiology guidelines risk prediction model for the primary prevention of sudden cardiac death in hypertrophic cardiomyopathy. Circ. Arrhythm. Electrophysiol. 2015, 8, 829–835. [Google Scholar] [CrossRef] [Green Version]
- O’Mahony, C.; Jichi, F.; Ommen, S.R.; Christiaans, I.; Arbustini, E.; Garcia-Pavia, P.; Cecchi, F.; Olivotto, I.; Kitaoka, H.; Gotsman, I.; et al. International External Validation Study of the 2014 European Society of Cardiology Guidelines on Sudden Cardiac Death Prevention in Hypertrophic Cardiomyopathy (EVIDENCE-HCM). Circulation 2018, 137, 1015–1023. [Google Scholar] [CrossRef] [Green Version]
- Nakagawa, S.; Okada, A.; Nishimura, K.; Hamatani, Y.; Amano, M.; Takahama, H.; Amaki, M.; Hasegawa, T.; Kanzaki, H.; Kusano, K.; et al. Validation of the 2014 European Society of Cardiology Sudden Cardiac Death Risk Prediction Model Among Various Phenotypes in Japanese Patients With Hypertrophic Cardiomyopathy. Am. J. Cardiol. 2018, 122, 1939–1946. [Google Scholar] [CrossRef] [PubMed]
- O’Mahony, C.; Akhtar, M.M.; Anastasiou, Z.; Guttmann, O.P.; Vriesendorp, P.A.; Michels, M.; Magri, D.; Autore, C.; Fernandez, A.; Ochoa, J.P.; et al. Effectiveness of the 2014 European Society of Cardiology guideline on sudden cardiac death in hypertrophic cardiomyopathy: A systematic review and meta-analysis. Heart 2019, 105, 623–631. [Google Scholar] [CrossRef] [PubMed]
- Rowin, E.J.; Maron, M.S.; Adler, A.; Albano, A.J.; Varnava, A.M.; Spears, D.; Marsy, D.; Heitner, S.B.; Cohen, E.; Leong, K.M.W.; et al. Importance of newer cardiac magnetic resonance-based risk markers for sudden death prevention in hypertrophic cardiomyopathy: An international multicenter study. Heart Rhythm. 2022, 19, 782–789. [Google Scholar] [CrossRef] [PubMed]
- Reid, A.; Miller, C.; Farrant, J.P.; Polturi, R.; Clark, D.; Ray, S.; Cooper, G.; Schmitt, M. Copper chelation in patients with hypertrophic cardiomyopathy. Open Heart 2022, 9, 1145. [Google Scholar] [CrossRef] [PubMed]


| Parameter | All N = 252 Mean ± SD (95% CI) | Group A VT +ve N = 68 Mean ± SD (95% CI) | Group B VT −ve N = 184 Mean ± SD (95% CI) | p Value | |
|---|---|---|---|---|---|
| Age of diagnosis (mean ± SD) | 56.2 ± 16.3 (54.2–58.2) | 53.9 ± 17.4 (49.3–57.7) | 57.2 ± 15.8 (54.8–59.5) | 0.18 | |
| Follow-up years (median, IQR) | 5.9, (3.6–9.2) | 7.7, (4.3–10.9) | 5.5 (3.5–8.5) | 0.01 | |
| Male, n (%) | 174 (69.0) | 49 (72.1) | 125 (67.9) | 0.33 | |
| SCD family history, n (%) | 64 (25.9) | 16 (23.5) | 48 (26.1) | 0.41 | |
| ICD insertion < 2014 | 19 | 16(25.4) | 3 (1.6) | 0.03 | |
| ICD insertion > 2014 | 16 | 8 (12.7) | 8 (4.4) | 0.04 | |
| Holter monitor captured arrhythmia, n (%) | 39 (15.9) | 39 (61.9) | 0 | n/a | |
| Death—all causes, n (%) | 29 (11.5) | 11(16.2) | 18 (9.8) | 0.18 | |
| Aborted SCD ICD/external defibrillator | 7 | 5/2 | 0 | <0.001 | |
| TTE | LVWT (mm), mean ± SD (95% CI) | 16.7 ± 5.6 (16.0–17.4) | 17.5 ± 6.2 (15.9–19.0) | 16.4 ± 5.4 (15.6–17.2) | 0.18 |
| LVOT gradient (mmHg), mean ± SD (95% CI) | 9.5 ± 18.7 (7.2–11.8) | 9.9 ± 22.9 (4.4–15.5) | 9.3 ± 17.0 (6.9–11.8) | 0.83 | |
| LA diameter (mm), mean ± SD (95% CI) | 39.3 ± 8.8 (38.2–40.4) | 39.0 ± 9.1 (36.8–41.2) | 39.4 ± 8.7 (38.2–40.7) | 0.75 | |
| ESC risk score, mean ± SD (95% CI) | 2.15 ± 1.97% (1.91–2.40) | 3.65 ± 2.85 (2.96–4.34) | 1.57 ± 1.04 (1.42–1.73) | <0.001 | |
| CMR | LVEF (%), mean ± SD (95% CI) | 71.1 ± 10.0 (69.8–72.4) | 68.8 ± 10.3 (66.2–71.5) | 71.9 ± 9.8 (70.5–73.4) | 0.04 |
| LVEDV (mL/m2) mean ± SD (95% CI) | 72.0 ± 16.1 (69.9–74.1) | 72.0 ± 17.1 (67.4–76.6) | 72.0 ± 15.8 (69.7–74.4) | 0.75 | |
| LVESV (mL/m2) mean ± SD (95% CI) | 21.6 ± 10.5 (20.2–23.0) | 21.9 ± 12.1 (18.5 ± 25.3) | 21.5 ± 9.9 (19.9–23.0) | 0.83 | |
| LAVI (mL/m2), mean ± SD (95% CI) | 51.3 ± 26.2 (47.1–55.6) | 50.9 ± 23.7 (43.1–58.7) | 51.5 ± 27.1 (46.3–56.6) | 0.91 | |
| LA diameter (mm), mean ± SD (95% CI) | 36.5 ± 9.1 (35.4–38.4) | 36.1 ± 9.3 (33.7–38.4) | 36.7 ± 9.0 (35.4–38.0) | 0.65 | |
| LVWT (mm), mean ± SD (95% CI) | 19.5 ± 5.2 (18.9–20.2) | 20.9 ± 7.0 (19.2–22.7) | 19.0 ± 4.4 (18.4–19.7) | 0.01 | |
| LVMI, g/m2 mean ± SD (95% CI) | 81.8 ± 28.4 (78.3–85.4) | 90.3 ± 27.3 (83.7–96.9) | 78.7 ± 28.3 (74.6–82.8) | 0.004 | |
| LGE, g/m2 mean ± SD (95% CI) | 5.5 ± 5.4 (4.6–6.4) | 7.3 ± 6.3 (5.7–8.9) | 4.7 ± 4.3 (3.5–5.3) | 0.01 | |
| LGE %, mean ± SD (95% CI) | 7.1 ± 6.6 (6.0–8.2) | 9.2 ± 7.9 (6.7–11.8) | 6.2 ± 5.9 (5.1–7.4) | 0.02 | |
| ESC risk score, mean ± SD (95% CI) | 2.37 ± 1.95 (2.13–2.62) | 3.95 ± 2.78 (3.27–4.62) | 1.77 ± 1.02 (1.62–1.92) | <0.001 | |
| Parameters | Cox Regression Analysis | ||
|---|---|---|---|
| HR | 95% CI | p Value | |
| Univariable | |||
| Age | 0.99 | 0.97–1.01 | 0.16 |
| Family history | 0.87 | 0.46–1.67 | 0.68 |
| LA diameter (TTE) | 0.99 | 0.96–1.03 | 0.75 |
| LVOT gradient | 1.01 | 0.99–1.02 | 0.83 |
| TTE LVWT | 1.03 | 0.99–1.09 | 0.18 |
| CMR LVWT * | 1.07 | 1.02–1.13 | 0.01 |
| CMR LVMI | 1.01 | 1.004–1.02 | 0.006 |
| LVLGE | 1.07 | 1.01–1.13 | 0.03 |
| Multivariable | |||
| CMR LVMI | 1.02 | 1.01–1.04 | 0.003 |
| LVLGE | 1.08 | 1.02–1.14 | 0.02 |
Disclaimer/Publisher’s Note: The statements, opinions and data contained in all publications are solely those of the individual author(s) and contributor(s) and not of MDPI and/or the editor(s). MDPI and/or the editor(s) disclaim responsibility for any injury to people or property resulting from any ideas, methods, instructions or products referred to in the content. |
© 2023 by the authors. Licensee MDPI, Basel, Switzerland. This article is an open access article distributed under the terms and conditions of the Creative Commons Attribution (CC BY) license (https://creativecommons.org/licenses/by/4.0/).
Share and Cite
Khan, H.R.; Rodwell, P.; Taha, A.H.; Goha, A.; Ahmed, M.; Thain, A.P.; Somarakis, K.; Al-Atta, A.; Erhayiem, B.; Uddin, A.; et al. Magnetic Resonance Left Ventricle Mass-Index/Fibrosis: Long-Term Predictors for Ventricular Arrhythmia in Hypertrophic Cardiomyopathy—A Retrospective Registry. J. Cardiovasc. Dev. Dis. 2023, 10, 120. https://doi.org/10.3390/jcdd10030120
Khan HR, Rodwell P, Taha AH, Goha A, Ahmed M, Thain AP, Somarakis K, Al-Atta A, Erhayiem B, Uddin A, et al. Magnetic Resonance Left Ventricle Mass-Index/Fibrosis: Long-Term Predictors for Ventricular Arrhythmia in Hypertrophic Cardiomyopathy—A Retrospective Registry. Journal of Cardiovascular Development and Disease. 2023; 10(3):120. https://doi.org/10.3390/jcdd10030120
Chicago/Turabian StyleKhan, Habib Rehman, Philip Rodwell, Ahmed Hasan Taha, Ahmed Goha, Mobeen Ahmed, Andrew Peter Thain, Konstantinos Somarakis, Ayman Al-Atta, Bara Erhayiem, Akhlaque Uddin, and et al. 2023. "Magnetic Resonance Left Ventricle Mass-Index/Fibrosis: Long-Term Predictors for Ventricular Arrhythmia in Hypertrophic Cardiomyopathy—A Retrospective Registry" Journal of Cardiovascular Development and Disease 10, no. 3: 120. https://doi.org/10.3390/jcdd10030120