
Cross-Sectional Analysis of Fall-Related Factors with a Focus on Fall Prevention Self-Efficacy and Self-Cognition of Physical Performance among Community-Dwelling Older Adults
Abstract
:1. Introduction
2. Materials and Methods
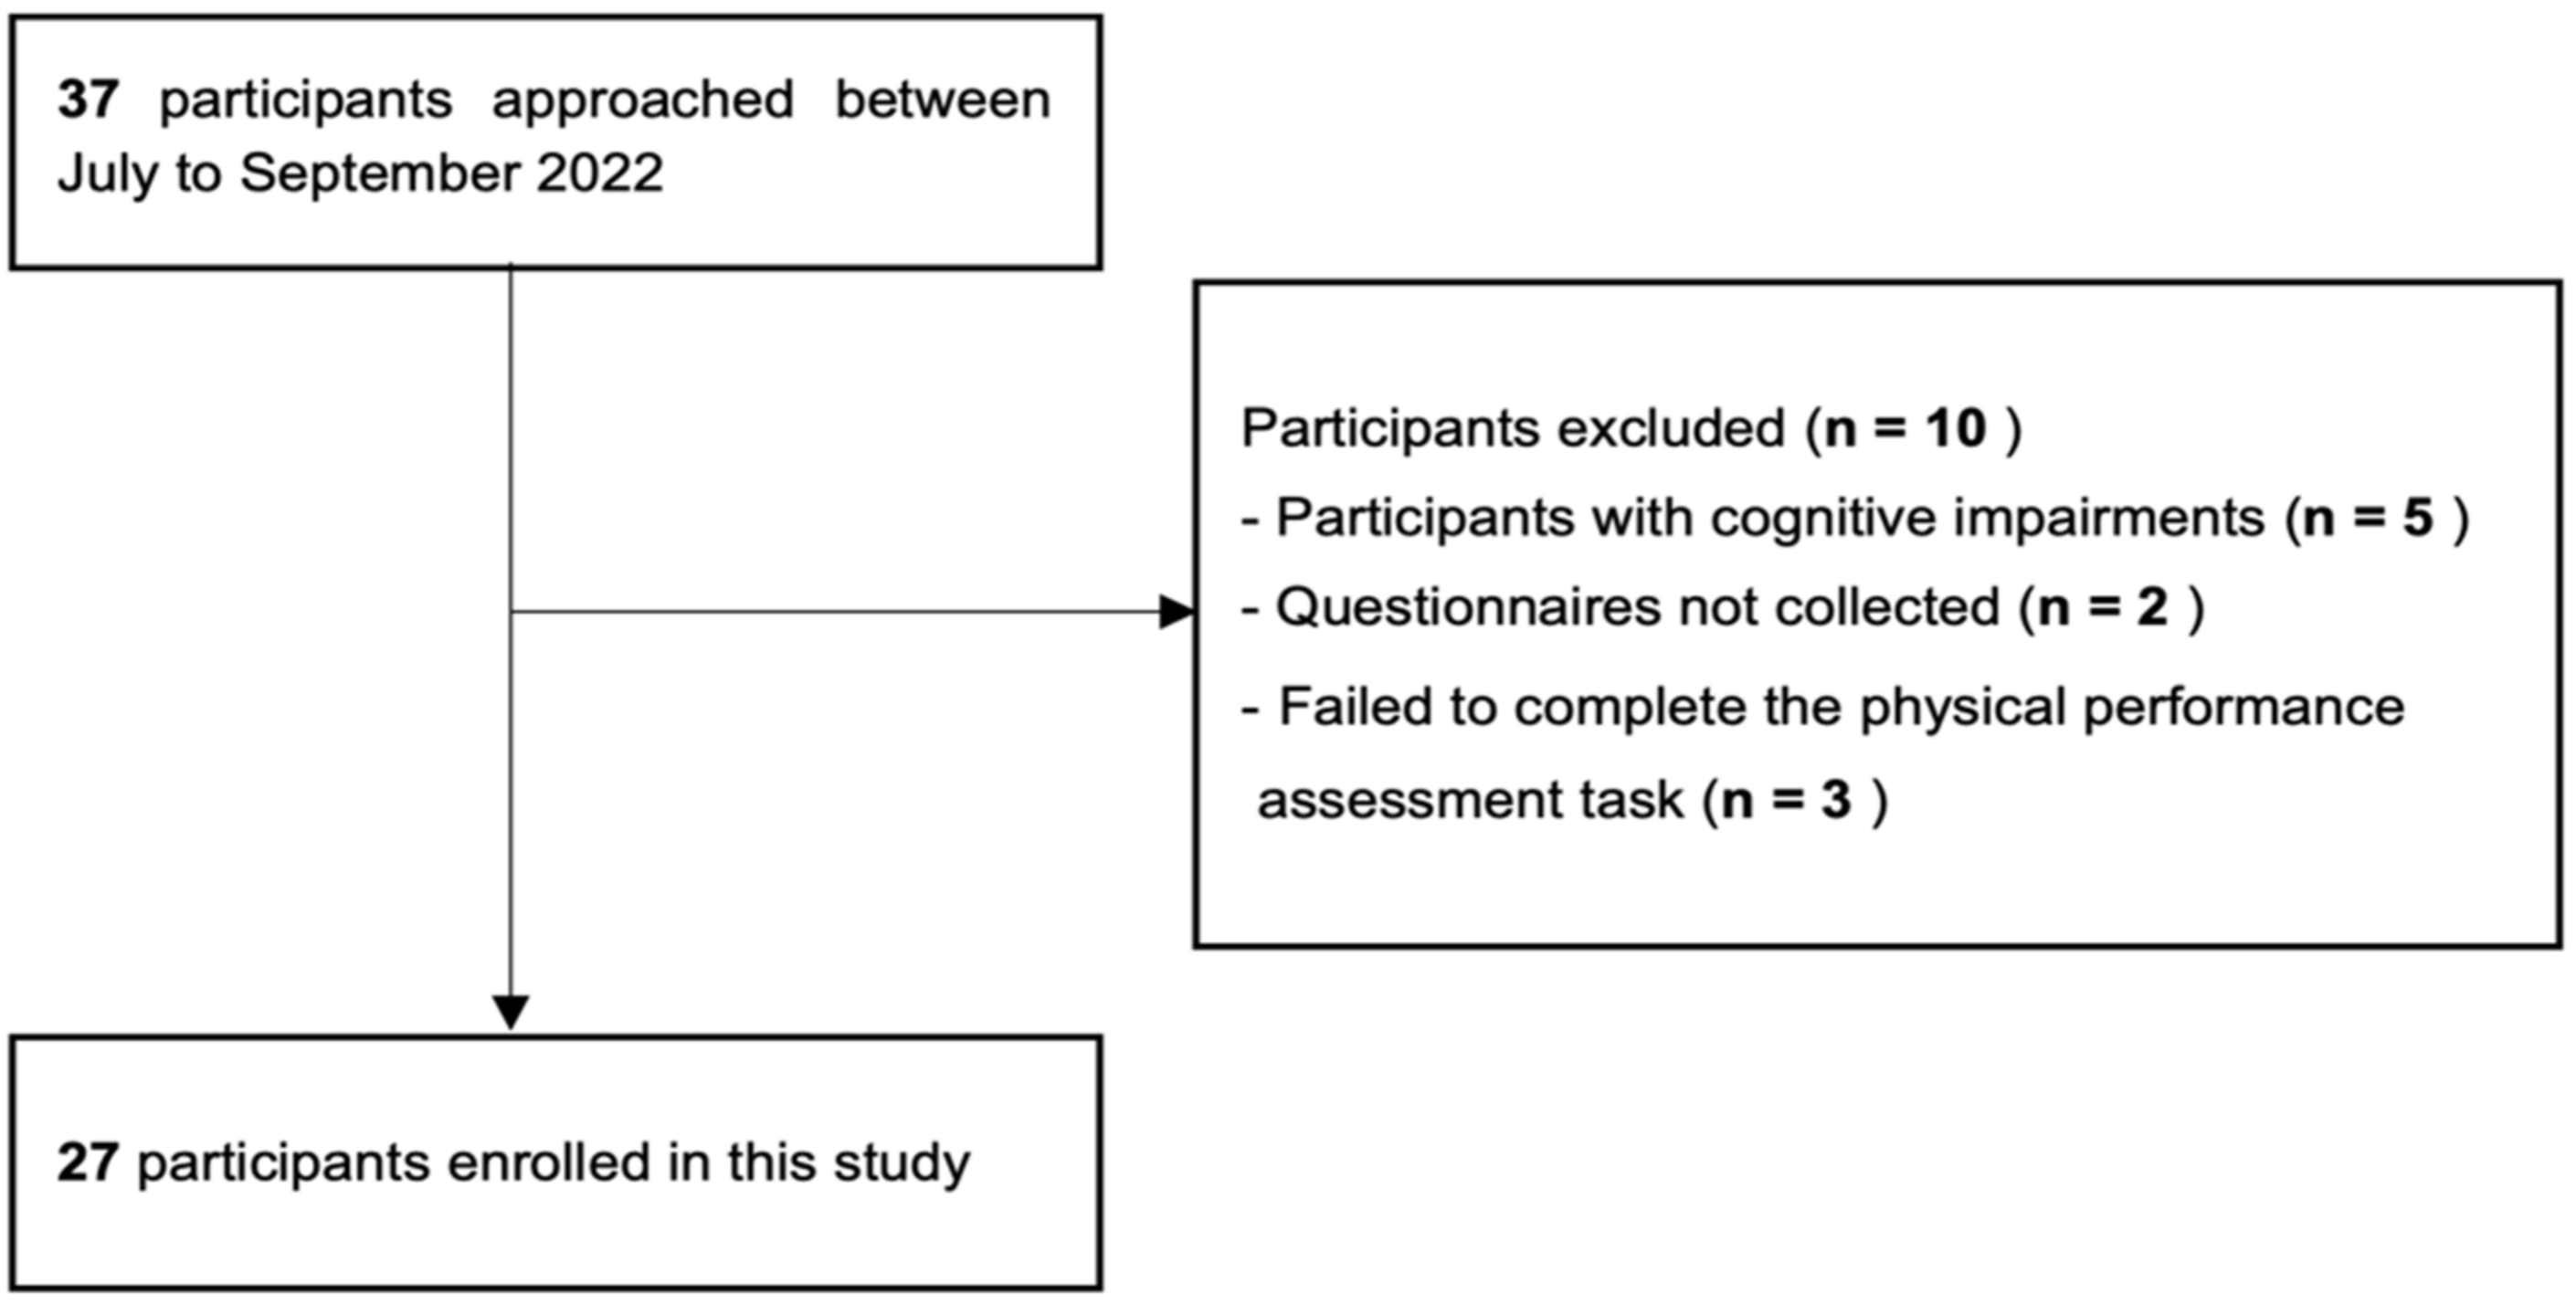
2.1. Participants
2.2. Study Design
2.3. Instruments
2.3.1. Questionnaire Survey
- 1.
- History of falls in the past year and conditions at the time of the fall.
- 2.
- Learning experience about fall prevention (e.g., attending courses, receiving individual guidance from therapists, and collecting information from pamphlets, TV, and the internet).
- 3.
- Fall prevention self-efficacy (modified fall efficacy scale [MFES]) [29]
- 4.
2.3.2. Assessment of Physical Performance and Self-Cognition
- 1.
- FRT: measurement of the maximum reach distance of the upper limb forward from a stationary standing position (spatial cognition).
- 2.
- Stepping over test: measurement of the height at which a bar was stepped over by lifting one leg on each side (spatial cognition)
- 3.
- TUG: measurement of the time required for standing up out of a chair, walking 3 m, turning around, walking back to the chair, and sitting down (timed cognition)
2.4. Data Collection
2.5. Deviation of Self-Cognition of Physical Performance
2.6. Statistical Analysis
3. Results
3.1. Participants
3.2. Results of the Questionnaire and of the Physical Performance and Self-Cognition Error
4. Discussion
4.1. Results and Characteristics of the Study Participants
4.2. Association between Self-Cognition Errors in Physical Performance and Falls
4.3. Association between Fall Prevention Self-Efficacy and Falls
4.4. Limitations
4.5. Further Study
5. Conclusions
Author Contributions
Funding
Institutional Review Board Statement
Informed Consent Statement
Data Availability Statement
Acknowledgments
Conflicts of Interest
References
- Shimada, H. (Ed.) Geriatric Physical Therapy, 1st ed.; Ishiyaku Publishers, Inc.: Tokyo, Japan, 2017; pp. 41–63. [Google Scholar]
- Komiyama, Y. A Basic Direction for Comprehensive Implementation of National Health Promotion. Health Japan 21. Available online: https://www.mhlw.go.jp/file/06-Seisakujouhou-10900000-Kenkoukyoku/0000047330.pdf (accessed on 18 November 2022).
- Yearly, U. Vital statistics, vital statistics of Japan final Data General mortality. In Deaths by Cause (the List of Three-Character Categories), Sex and Age (5-Year Age Groups): Japan; (2) ICD-10 Codes V-Y|File|Browse Statistics; 2019; Volume 3; pp. 1–1. Available online: https://www.e-stat.go.jp/en/stat-search/files?page=1&layout=datalist&toukei=00450011&tstat=000001028897&cycle=7&year=20190&tclass1=000001053058&tclass2=000001053061&tclass3=000001053065&stat_infid=000031982789&tclass4val=0 (accessed on 18 November 2022).
- Suzuki, M. Evidence and practice of fall prevention from the viewpoint of the elderly with dementia. Jpn. J. Fall Prev. 2016, 2, 3–9. [Google Scholar]
- Tinetti, M.E.; Speechley, M.; Ginter, S.F. Risk factors for falls among elderly persons living in the community. N. Engl. J. Med. 1988, 319, 1701–1707. [Google Scholar] [CrossRef] [PubMed]
- Otaka, Y. Fall prevention in older people: Present and future perspectives. Jpn. J. Fall Prev. 2015, 1, 11–20. [Google Scholar]
- Hartholt, K.A.; Lee, R.; Burns, E.R.; van Beeck, E.F. Mortality from falls among US adults aged 75 years or older, 2000–2016. JAMA 2019, 321, 2131–2133. [Google Scholar] [CrossRef] [PubMed] [Green Version]
- Comprehensive Survey of Living Conditions|Summary Report 2019. Available online: https://www.mhlw.go.jp/english/database/db-hss/cslc-report2019.html (accessed on 18 November 2022).
- World Health Organization. Ageing; Life Course Unit. In WHO Global Report on Falls Prevention in Older Age; World Health Organization: Geneva, Switzerland, 2008; ISBN 92-4-156353-2. [Google Scholar]
- Tinetti, M.E.; Kumar, C. The patient who falls: “It’s always a trade-off”. JAMA 2010, 303, 258–266. [Google Scholar] [CrossRef] [Green Version]
- Hiyama, A.; Nakamura, K. Behaviors of hospitalized patients at high risk of fall. J. Jpn. Soc. Nurs. Res. 2017, 40, 657–665. [Google Scholar]
- Cheng, P.; Tan, L.; Ning, P.; Li, L.; Gao, Y.; Wu, Y.; Schwebel, D.C.; Chu, H.; Yin, H.; Hu, G. Comparative effectiveness of published interventions for elderly fall prevention: A systematic review and network meta-analysis. Int. J. Environ. Res. Public Health 2018, 15, 498. [Google Scholar] [CrossRef] [Green Version]
- Hagino, H. Epidemiology and evidence of prevention for falls. Jpn. J. Rehabil. Med. 2018, 55, 898–904. [Google Scholar] [CrossRef] [Green Version]
- Tinetti, M.E.; Mendes de Leon, C.F.; Doucette, J.T.; Baker, D.I. Fear of falling and fall-related efficacy in relationship to functioning among community-living elders. J. Gerontol. 1994, 49, M140–M147. [Google Scholar] [CrossRef]
- Kato, C.; Ida, K.; Harada, A. Influence of high fall-related self-efficacy on falls due to dissociation with ADL among elderly women in nursing homes. Nihon Ronen Igakkai Zasshi 2009, 46, 428–435. [Google Scholar] [CrossRef] [Green Version]
- Sugihara, T.; Go, T.; Mishima, S.; Tanaka, M.; Shibata, E.; Takagi, M.; Kikuchi, E.; Tsushima, E. Elderly people’s physical strength awareness and falling. Rigakuryoho Kagaku 2005, 20, 13–16. [Google Scholar] [CrossRef] [Green Version]
- Sakurai, R.; Fujiwara, Y.; Ishihara, M.; Higuchi, T.; Uchida, H.; Imanaka, K. Age-related self-overestimation of step-over ability in healthy older adults and its relationship to fall risk. BMC Geriatr. 2013, 13, 44. [Google Scholar] [CrossRef] [Green Version]
- Okada, Y.; Takatori, K.; Nagino, K.; Tokuhisa, K.; Ikuno, K.; Turuta, K.; Shomoto, K. Relationship between error in estimated reach distance and falls in community-dwelling elderly people. Phys. Ther. Jpn. 2008, 35, 279–284. [Google Scholar]
- Tinetti, M.E.; Richman, D.; Powell, L. Falls efficacy as a measure of fear of falling. J. Gerontol. 1990, 45, P239–P243. [Google Scholar] [CrossRef]
- Fujiwara, K.; Hasegawa, Y.; Matsuda, N.; Iwahara, A.; Ito, E.; Nagahara, N.; Hatta, T.; Hatta, J.; Hotta, C.; Meuma, R.; et al. Relation between falls self-efficacy and physical, cognitive factors in the community-dwelling elderly. JHES 2012, 10, 65–70. [Google Scholar] [CrossRef] [Green Version]
- Kluft, N.; van Dieën, J.H.; Pijnappels, M. The degree of misjudgment between perceived and actual gait ability in older adults. Gait Posture 2017, 51, 275–280. [Google Scholar] [CrossRef] [Green Version]
- Nakano, H.; Murata, S.; Shiraiwa, K.; Nonaka, K. Increased time difference between imagined and physical walking in older adults at a high risk of falling. Brain Sci. 2020, 10, 332. [Google Scholar] [CrossRef]
- Tinetti, M.E.; Powell, L. Fear of falling and low self-efficacy: A cause of dependence in elderly persons. J. Gerontol. 1993, 48, 35–38. [Google Scholar] [CrossRef]
- Robinovitch, S.N.; Cronin, T. Perception of postural limits in elderly nursing home and day care participants. J. Gerontol. A Biol. Sci. Med. Sci. 1999, 54, B124–B130. [Google Scholar] [CrossRef] [Green Version]
- Jeannerod, M. Neural simulation of action: A unifying mechanism for motor cognition. NeuroImage 2001, 14, S103–S109. [Google Scholar] [CrossRef]
- Sakurai, R.; Fujiwara, Y.; Yasunaga, M.; Suzuki, H.; Murayama, Y.; Imanaka, K.; Kanosue, K.; Ishii, K. Neural correlates of older adults’ self-overestimation of stepping-over ability. Age 2016, 38, 351–361. [Google Scholar] [CrossRef] [Green Version]
- Haruyama, K.; Kawakami, M. Using the imagined timed up and go test to identify fall risk over the 6-month period after discharge in patients with stroke. Jpn. J. Rehabil. Med. 2015, 52, 352–357. [Google Scholar] [CrossRef] [Green Version]
- Kendrick, D.; Kumar, A.; Carpenter, H.; Zijlstra, G.A.R.; Skelton, D.A.; Cook, J.R.; Stevens, Z.; Belcher, C.M.; Haworth, D.; Gawler, S.J.; et al. Exercise for Reducing Fear of Falling in Older People Living in the Community. Cochrane Database Syst. Rev. 2014, 2014, CD009848. [Google Scholar] [CrossRef] [PubMed]
- Hill, K.D.; Schwarz, J.A.; Kalogeropoulos, A.J.; Gibson, S.J. Fear of falling revisited. Arch. Phys. Med. Rehabil. 1996, 77, 1025–1029. [Google Scholar] [CrossRef] [PubMed]
- Parker, M.; Baker, P.S.; Allman, R.M. A Life-Space Approach to functional assessment of mobility in the elderly. J. Gerontol. Soc. Work. 2002, 35, 35–55. [Google Scholar] [CrossRef]
- Harada, K.; Shimada, H.; Sawyer, P.; Asakawa, Y.; Nihei, K.; Kaneya, S.; Furuna, T.; Ishizaki, T.; Yasumura, S. Life-space of community-dwelling older adults using preventive health care services in Japan and the validity of composite scoring methods for assessment. Nihon Koshu Eisei Zasshi (Nihon Koshu Eisei Zasshi) 2010, 57, 526–537. [Google Scholar]
- Duncan, P.W.; Weiner, D.K.; Chandler, J.; Studenski, S. Functional reach: A new clinical measure of balance. J. Gerontol. 1990, 45, M192–M197. [Google Scholar] [CrossRef]
- Konczak, J.; Meeuwsen, H.J.; Cress, M.E. Changing affordances in stair climbing: The perception of maximum climbability in young and older adults. J. Exp. Psychol. Hum. Percept. Perform. 1992, 18, 691–697. [Google Scholar] [CrossRef]
- Podsiadlo, D.; Richardson, S. The timed “up & Go”: A test of basic functional mobility for frail elderly persons. J. Am. Geriatr. Soc. 1991, 39, 142–148. [Google Scholar] [CrossRef]
- Shimizu, H. Bayesian statistical modeling in psychology. Jpn. Psychol. Rev. 2018, 61, 22–41. [Google Scholar]
- Hayase, A.; Kimura, Y.; Itoh, N. Assessment of anxiety and mood disorder in veterinary students and its related factors via a Bayesian statistics. J. Vet. Epidemol. 2019, 23, 47–52. [Google Scholar] [CrossRef] [Green Version]
- Decety, J.; Jeannerod, M. Mentally simulated movements in virtual reality: Does Fitt’s law hold in motor imagery? Behav. Brain Res. 1995, 72, 127–134. [Google Scholar] [CrossRef] [PubMed]
- Collet, C.; Guillot, A.; Lebon, F.; MacIntyre, T.; Moran, A. Measuring motor imagery using psychometric, behavioral, and psychophysiological tools. Exerc. Sport Sci. Rev. 2011, 39, 85–92. [Google Scholar] [CrossRef] [PubMed] [Green Version]
- Sakurai, R.; Fujiwara, Y.; Yasunaga, M.; Suzuki, H.; Kanosue, K.; Montero-Odasso, M.; Ishii, K. Association between hypometabolism in the supplementary motor area and fear of falling in older adults. Front. Aging Neurosci. 2017, 9, 251. [Google Scholar] [CrossRef] [Green Version]


| Fall Group (n = 14) | Non-Fall Group (n = 13) | |||
|---|---|---|---|---|
| Age, mean (SD 1), years | 79.64 | (8.22) | 83.31 | (6.60) |
| Sex, n (%) | ||||
| Male | 4 | (28.6) | 2 | (15.4) |
| Female | 10 | (71.4) | 11 | (57.1) |
| Learning Experience, n (%) | 12 | (85.7) | 8 | (61.5) |
| Care requirement level, n (%) | ||||
| Support level 1 | 2 | (14.3) | 5 | (38.5) |
| Support level 2 | 8 | (57.1) | 4 | (30.8) |
| Long-term care level 1 | 1 | (7.1) | 4 | (30.8) |
| Long-term care level 2 | 1 | (7.1) | 0 | (0.0) |
| Long-term care level 3 | 0 | (0.0) | 0 | (0.0) |
| Long-term care level 4 | 2 | (14.3) | 0 | (0.0) |
| Long-term care level 5 | 0 | (0.0) | 0 | (0.0) |
| Fall Group (n = 14) | Non-Fall Group (n = 13) | |||
|---|---|---|---|---|
| Mean | SD | Mean | SD | |
| HDS-R 1 | 27.1 | 2.89 | 27.5 | 1.76 |
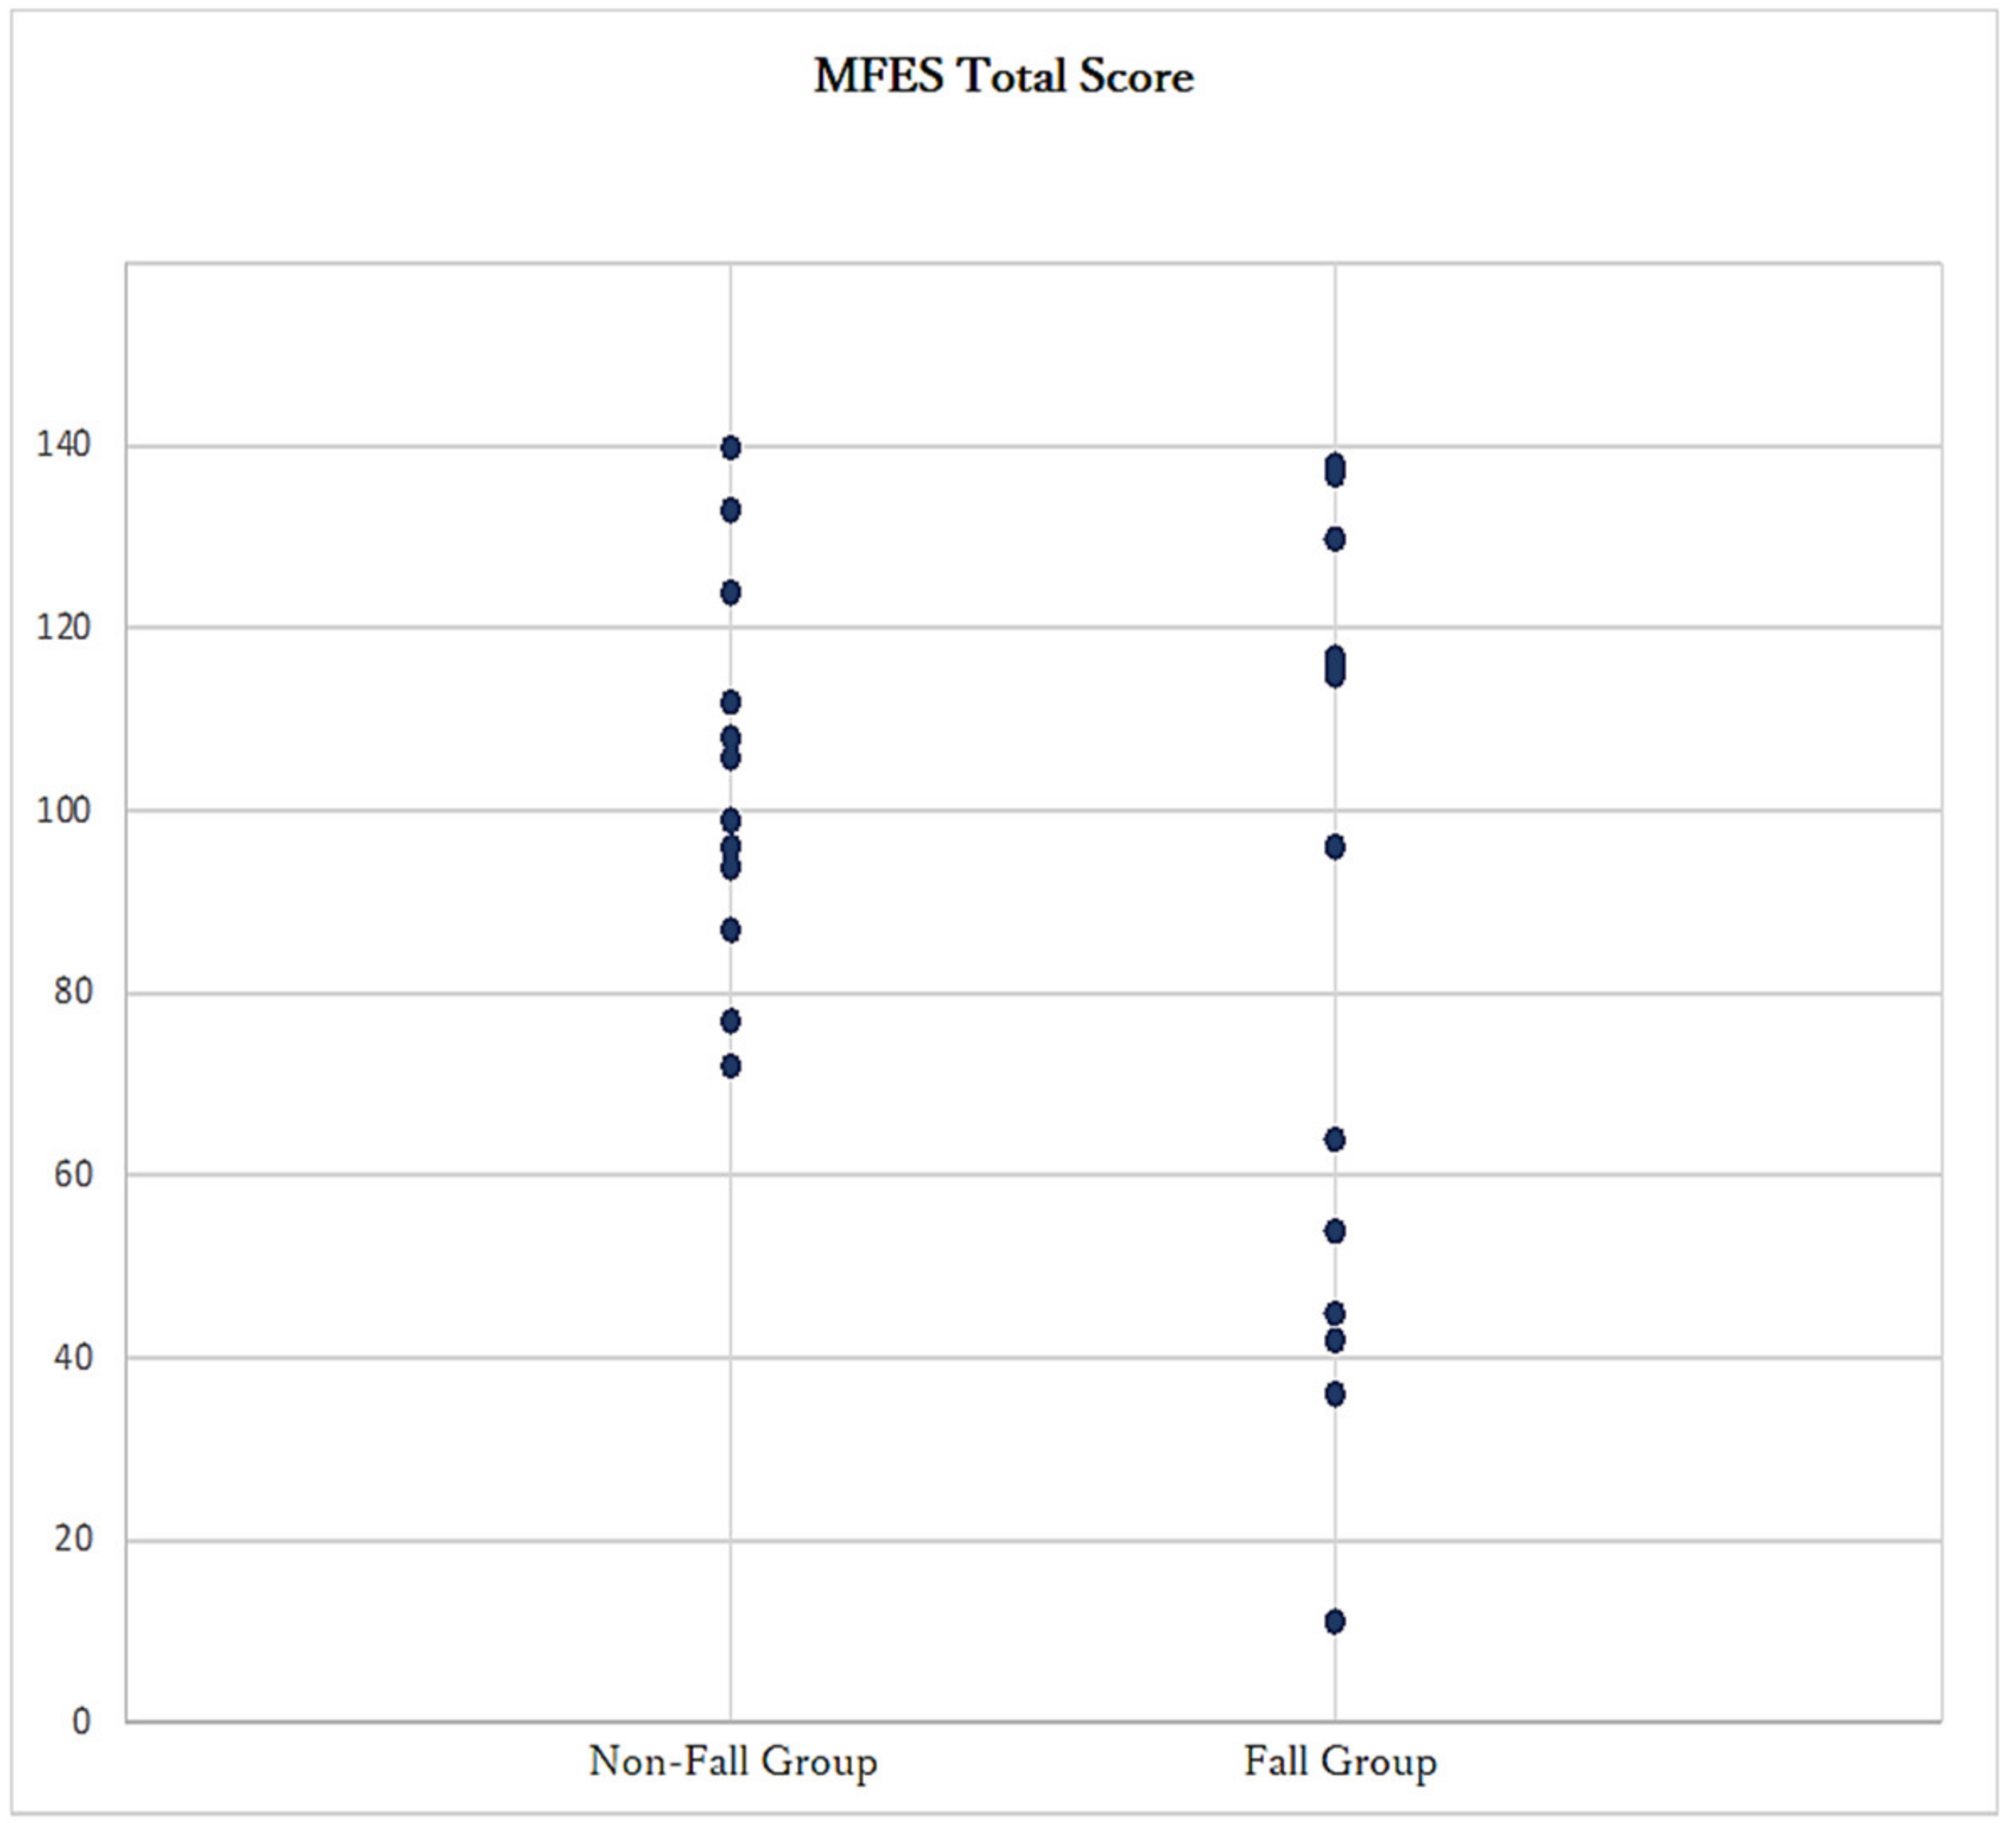
| MFES 2 | 83.2 | 42.67 | 103.2 | 20.3 |
| LSA 3 | 40.1 | 21.3 | 53.2 | 16.5 |
| Grip (kg) | 20.8 | 7.26 | 17.4 | 4.6 |
| Estimated FRT 4 (cm) | 23.11 | 8.83 | 27.15 | 10.46 |
| Actual FRT (cm) | 22.12 | 10.09 | 22.42 | 8.37 |
| FRT cognition error * | 1.42 | 1.25 | 1.26 | 0.5 |
| Estimated stepping over test (cm) | 32.61 | 9.15 | 31.26 | 8.77 |
| Actual stepping over test (cm) | 37.43 | 15.76 | 32.7 | 12.55 |
| Stepping over test cognition error ** | 1.38 | 1.75 | 1.03 | 0.35 |
| Estimated TUG 5 (normal) (s) | 11.09 | 7.8 | 7.84 | 3.1 |
| Actual TUG (normal) (s) | 19.3 | 12.25 | 15.82 | 4.42 |
| TUG (normal) cognition error *** | 0.6 | 0.21 | 0.52 | 0.2 |
| Estimated TUG (rapid) (s) | 8.86 | 6.72 | 5.42 | 1.92 |
| Actual TUG (rapid) (s) | 15.81 | 9.18 | 12.64 | 4.44 |
| TUG (rapid) cognition error **** | 0.55 | 0.27 | 0.45 | 0.14 |
| Correlation Coefficient with Fall History, r | p-Value | |
|---|---|---|
| Sex † | 0.648 | |
| Learning Experience † | 0.209 | |
| Care requirement level †† | 0.328 | 0.069 |
| Age ††† | −0.246 | <0.001 |
| MFES 1 ††† | −0.294 | <0.001 |
| LSA 2 ††† | −0.335 | <0.001 |
| Grip ††† | 0.276 | <0.001 |
| FRT 3 cognition error ††† | 0.088 | <0.001 |
| Stepping over test cognition error ††† | 0.141 | <0.001 |
| TUG 4 (normal) cognition error ††† | 0.199 | <0.001 |
| TUG 4 (rapid) cognition error ††† | 0.232 | <0.001 |
| (a) FRT | ||||||
| Estimate | Estimate Error | CI Lower 95% | CI Upper 95% | Rhat | Odds Ratio | |
| Age | −0.23 | 0.12 | −0.49 | −0.02 | 1 | 0.79 |
| MFES 1 | −0.01 | 0.02 | −0.05 | 0.03 | 1 | 0.99 |
| LSA 2 | −0.11 | 0.05 | −0.23 | −0.02 | 1 | 0.9 |
| Grip | 0.32 | 0.14 | 0.09 | 0.62 | 1 | 1.38 |
| FRT 3 cognition error | 1.13 | 0.86 | −0.35 | 3.05 | 1 | 3.1 |
| (b) Stepping over test | ||||||
| Estimate | Estimate Error | CI Lower 95% | CI Upper 95% | Rhat | Odds Ratio | |
| Age | −0.26 | 0.13 | −0.55 | −0.04 | 1 | 0.77 |
| MFES 1 | 0 | 0.03 | −0.04 | 0.06 | 1 | 1 |
| LSA 2 | −0.14 | 0.06 | −0.28 | −0.03 | 1 | 0.87 |
| Grip | 0.33 | 0.13 | 0.1 | 0.62 | 1 | 1.39 |
| Stepping over test cognition error | 2.25 | 1.45 | −0.01 | 5.63 | 1 | 9.49 |
| (c) TUG (normal speed) | ||||||
| Estimate | Estimate Error | CI Lower 95% | CI Upper 95% | Rhat | Odds Ratio | |
| Age | −0.18 | 0.12 | −0.44 | 0.03 | 1 | 0.83 |
| MFES 1 | −0.03 | 0.02 | −0.08 | 0.02 | 1 | 0.97 |
| LSA 2 | −0.11 | 0.05 | −0.23 | −0.02 | 1 | 0.9 |
| Grip | 0.23 | 0.12 | 0.02 | 0.51 | 1 | 1.26 |
| TUG 4 (normal) cognition error | 5.14 | 3.62 | −1.23 | 13.07 | 1 | 170.72 |
| (d) TUG (maximum rapid speed) | ||||||
| Estimate | Estimate Error | CI Lower 95% | CI Upper 95% | Rhat | Odds Ratio | |
| Age | −0.2 | 0.12 | −0.47 | 0.02 | 1 | 0.82 |
| MFES 1 | −0.02 | 0.02 | −0.07 | 0.02 | 1 | 0.98 |
| LSA 2 | −0.12 | 0.06 | −0.25 | −0.02 | 1 | 0.89 |
| Grip | 0.22 | 0.12 | 0.01 | 0.49 | 1 | 1.25 |
| TUG 4 (rapid) cognition error | 5.13 | 3.58 | −1.23 | 12.62 | 1 | 169.02 |
Disclaimer/Publisher’s Note: The statements, opinions and data contained in all publications are solely those of the individual author(s) and contributor(s) and not of MDPI and/or the editor(s). MDPI and/or the editor(s) disclaim responsibility for any injury to people or property resulting from any ideas, methods, instructions or products referred to in the content. |
© 2023 by the authors. Licensee MDPI, Basel, Switzerland. This article is an open access article distributed under the terms and conditions of the Creative Commons Attribution (CC BY) license (https://creativecommons.org/licenses/by/4.0/).
Share and Cite
Hayashi, S.; Misu, Y.; Sakamoto, T.; Yamamoto, T. Cross-Sectional Analysis of Fall-Related Factors with a Focus on Fall Prevention Self-Efficacy and Self-Cognition of Physical Performance among Community-Dwelling Older Adults. Geriatrics 2023, 8, 13. https://doi.org/10.3390/geriatrics8010013
Hayashi S, Misu Y, Sakamoto T, Yamamoto T. Cross-Sectional Analysis of Fall-Related Factors with a Focus on Fall Prevention Self-Efficacy and Self-Cognition of Physical Performance among Community-Dwelling Older Adults. Geriatrics. 2023; 8(1):13. https://doi.org/10.3390/geriatrics8010013
Chicago/Turabian StyleHayashi, Shintaro, Yuka Misu, Toshimasa Sakamoto, and Taisei Yamamoto. 2023. "Cross-Sectional Analysis of Fall-Related Factors with a Focus on Fall Prevention Self-Efficacy and Self-Cognition of Physical Performance among Community-Dwelling Older Adults" Geriatrics 8, no. 1: 13. https://doi.org/10.3390/geriatrics8010013