
Persistence of a Wild-Type Virulent Aeromonas hydrophila Isolate in Pond Sediments from Commercial Catfish Ponds: A Laboratory Study

 , ,
, ,  ,
,
Abstract
:Simple Summary
Abstract
1. Introduction
2. Materials and Methods
2.1. Pilot Trial
2.2. Experimental Design and System Preparation
2.3. Bacterial Culture and Trial Preparation
2.4. Sampling and Bacterial Enumeration
2.5. Pilot and FPT Differences
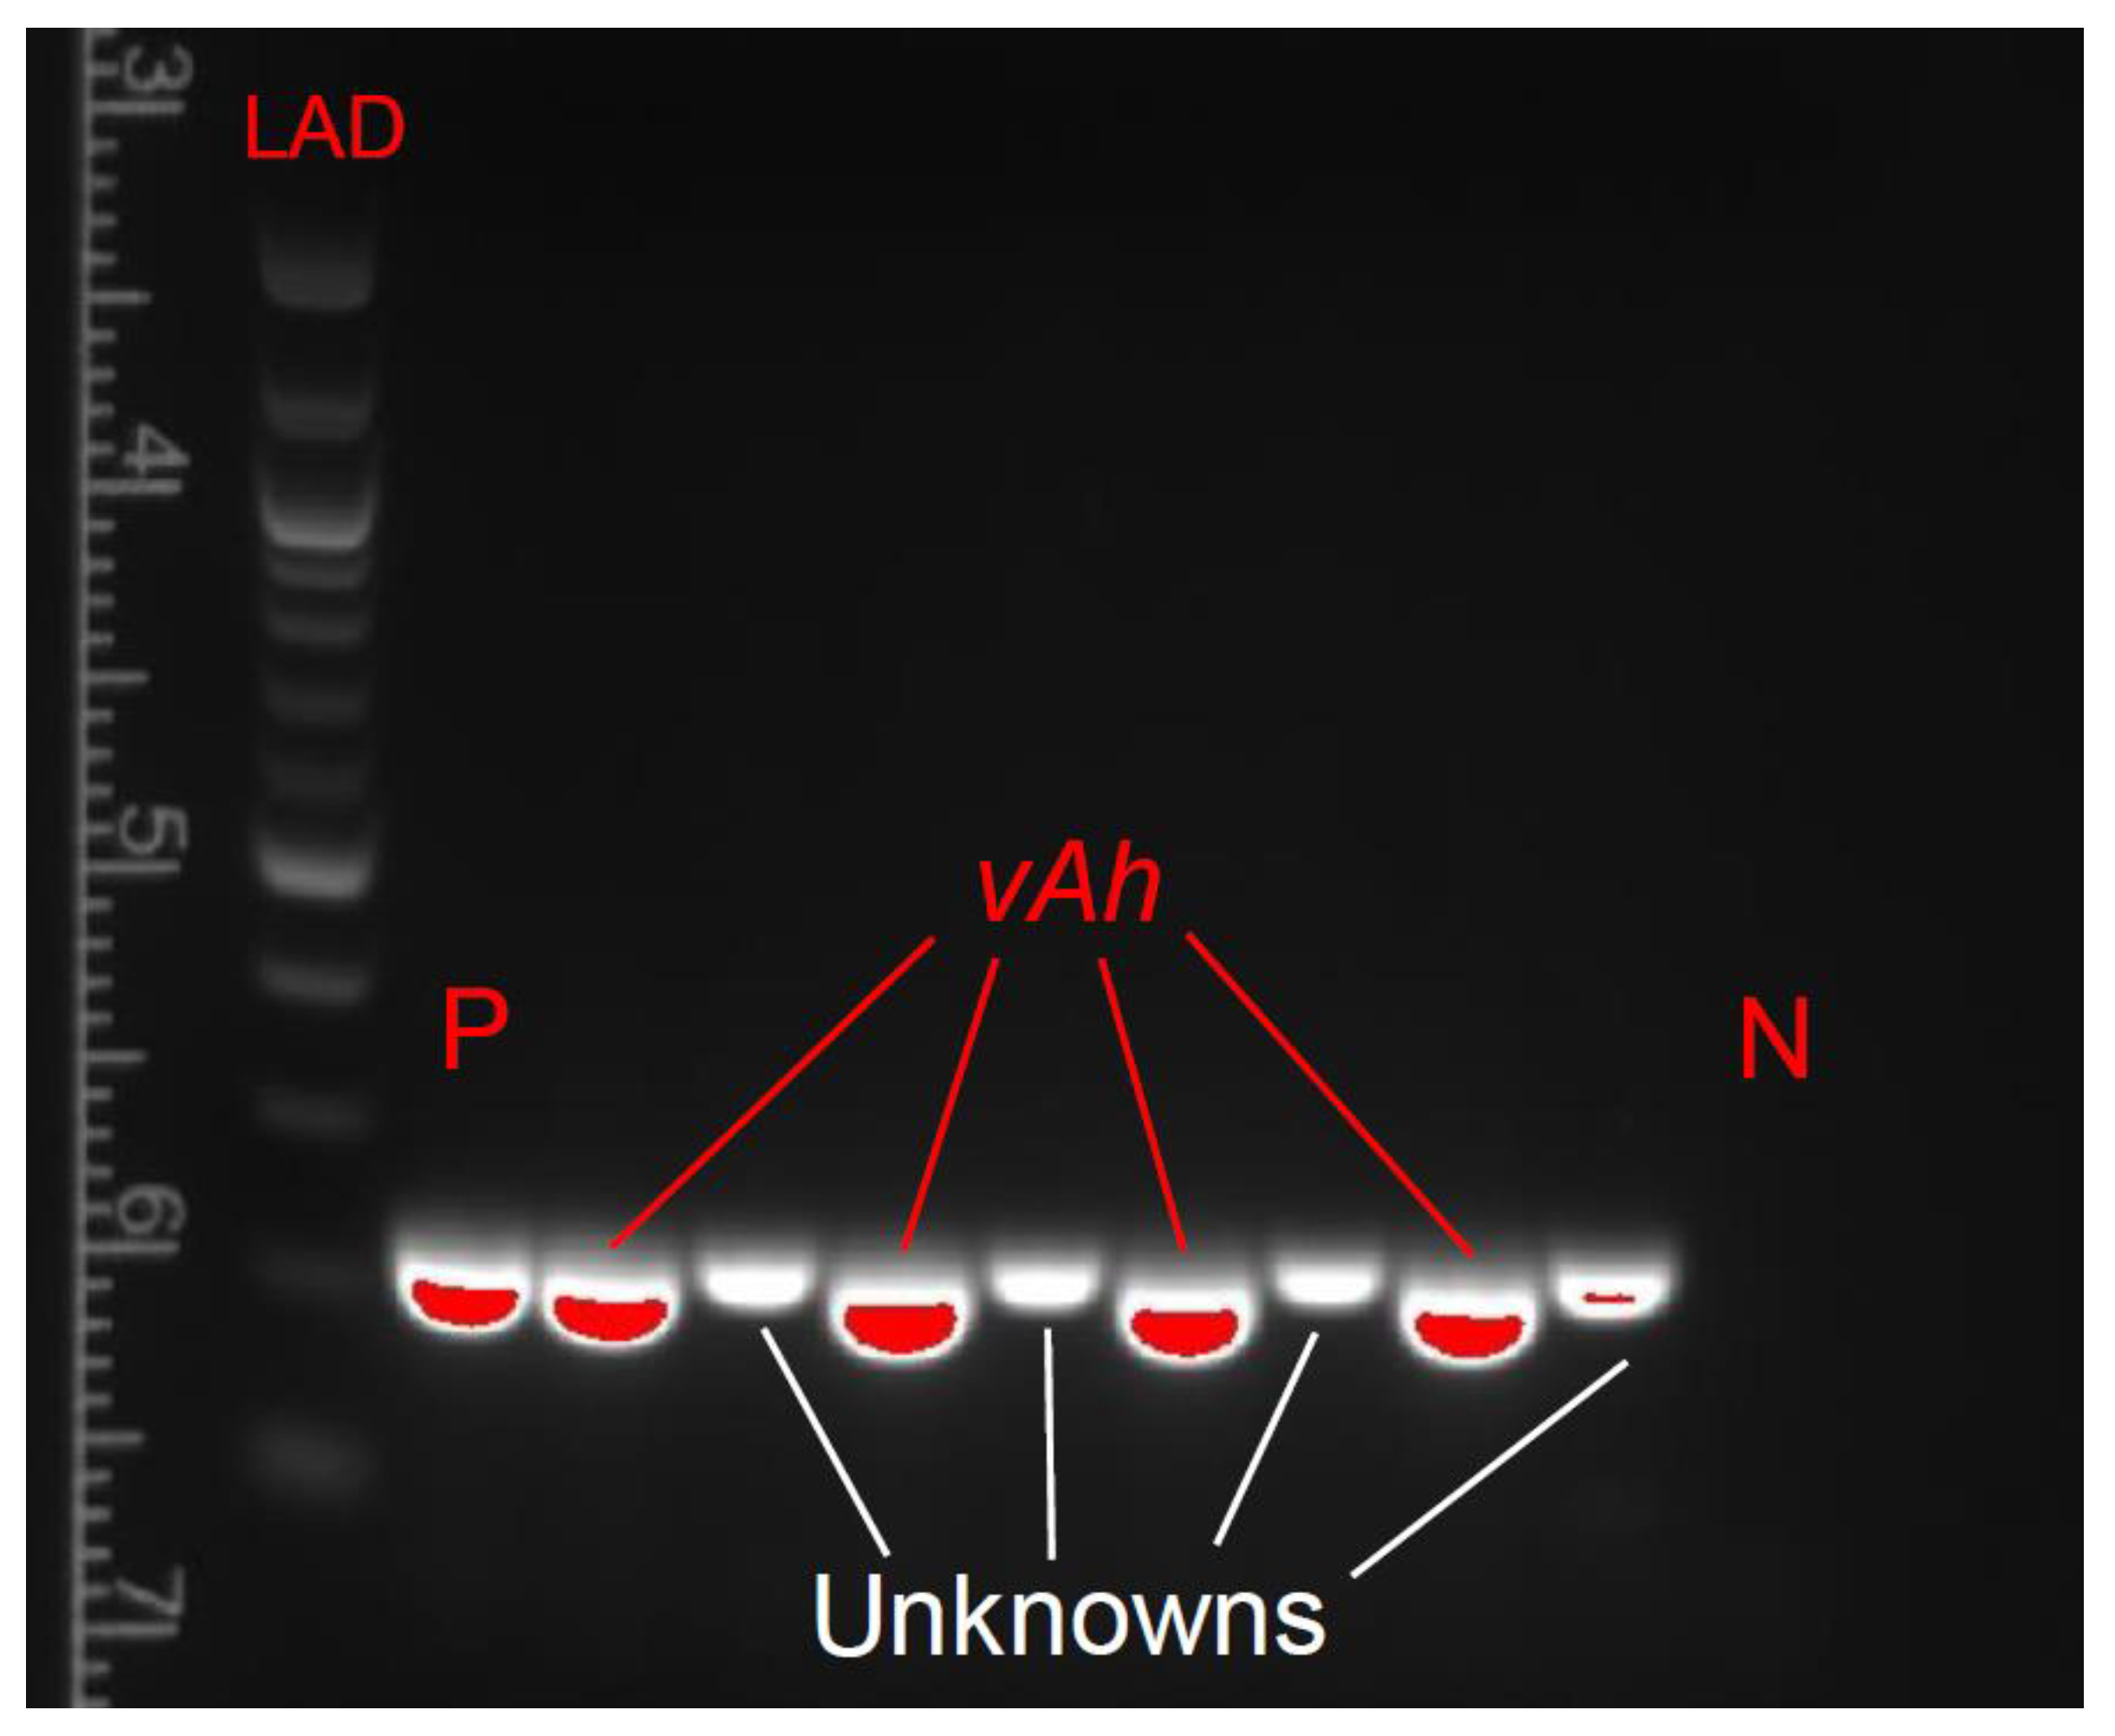
2.6. DNA Extraction and PCR Confirmation
2.7. Sediment and Water Chemical Analysis
2.8. Statistical Analyses
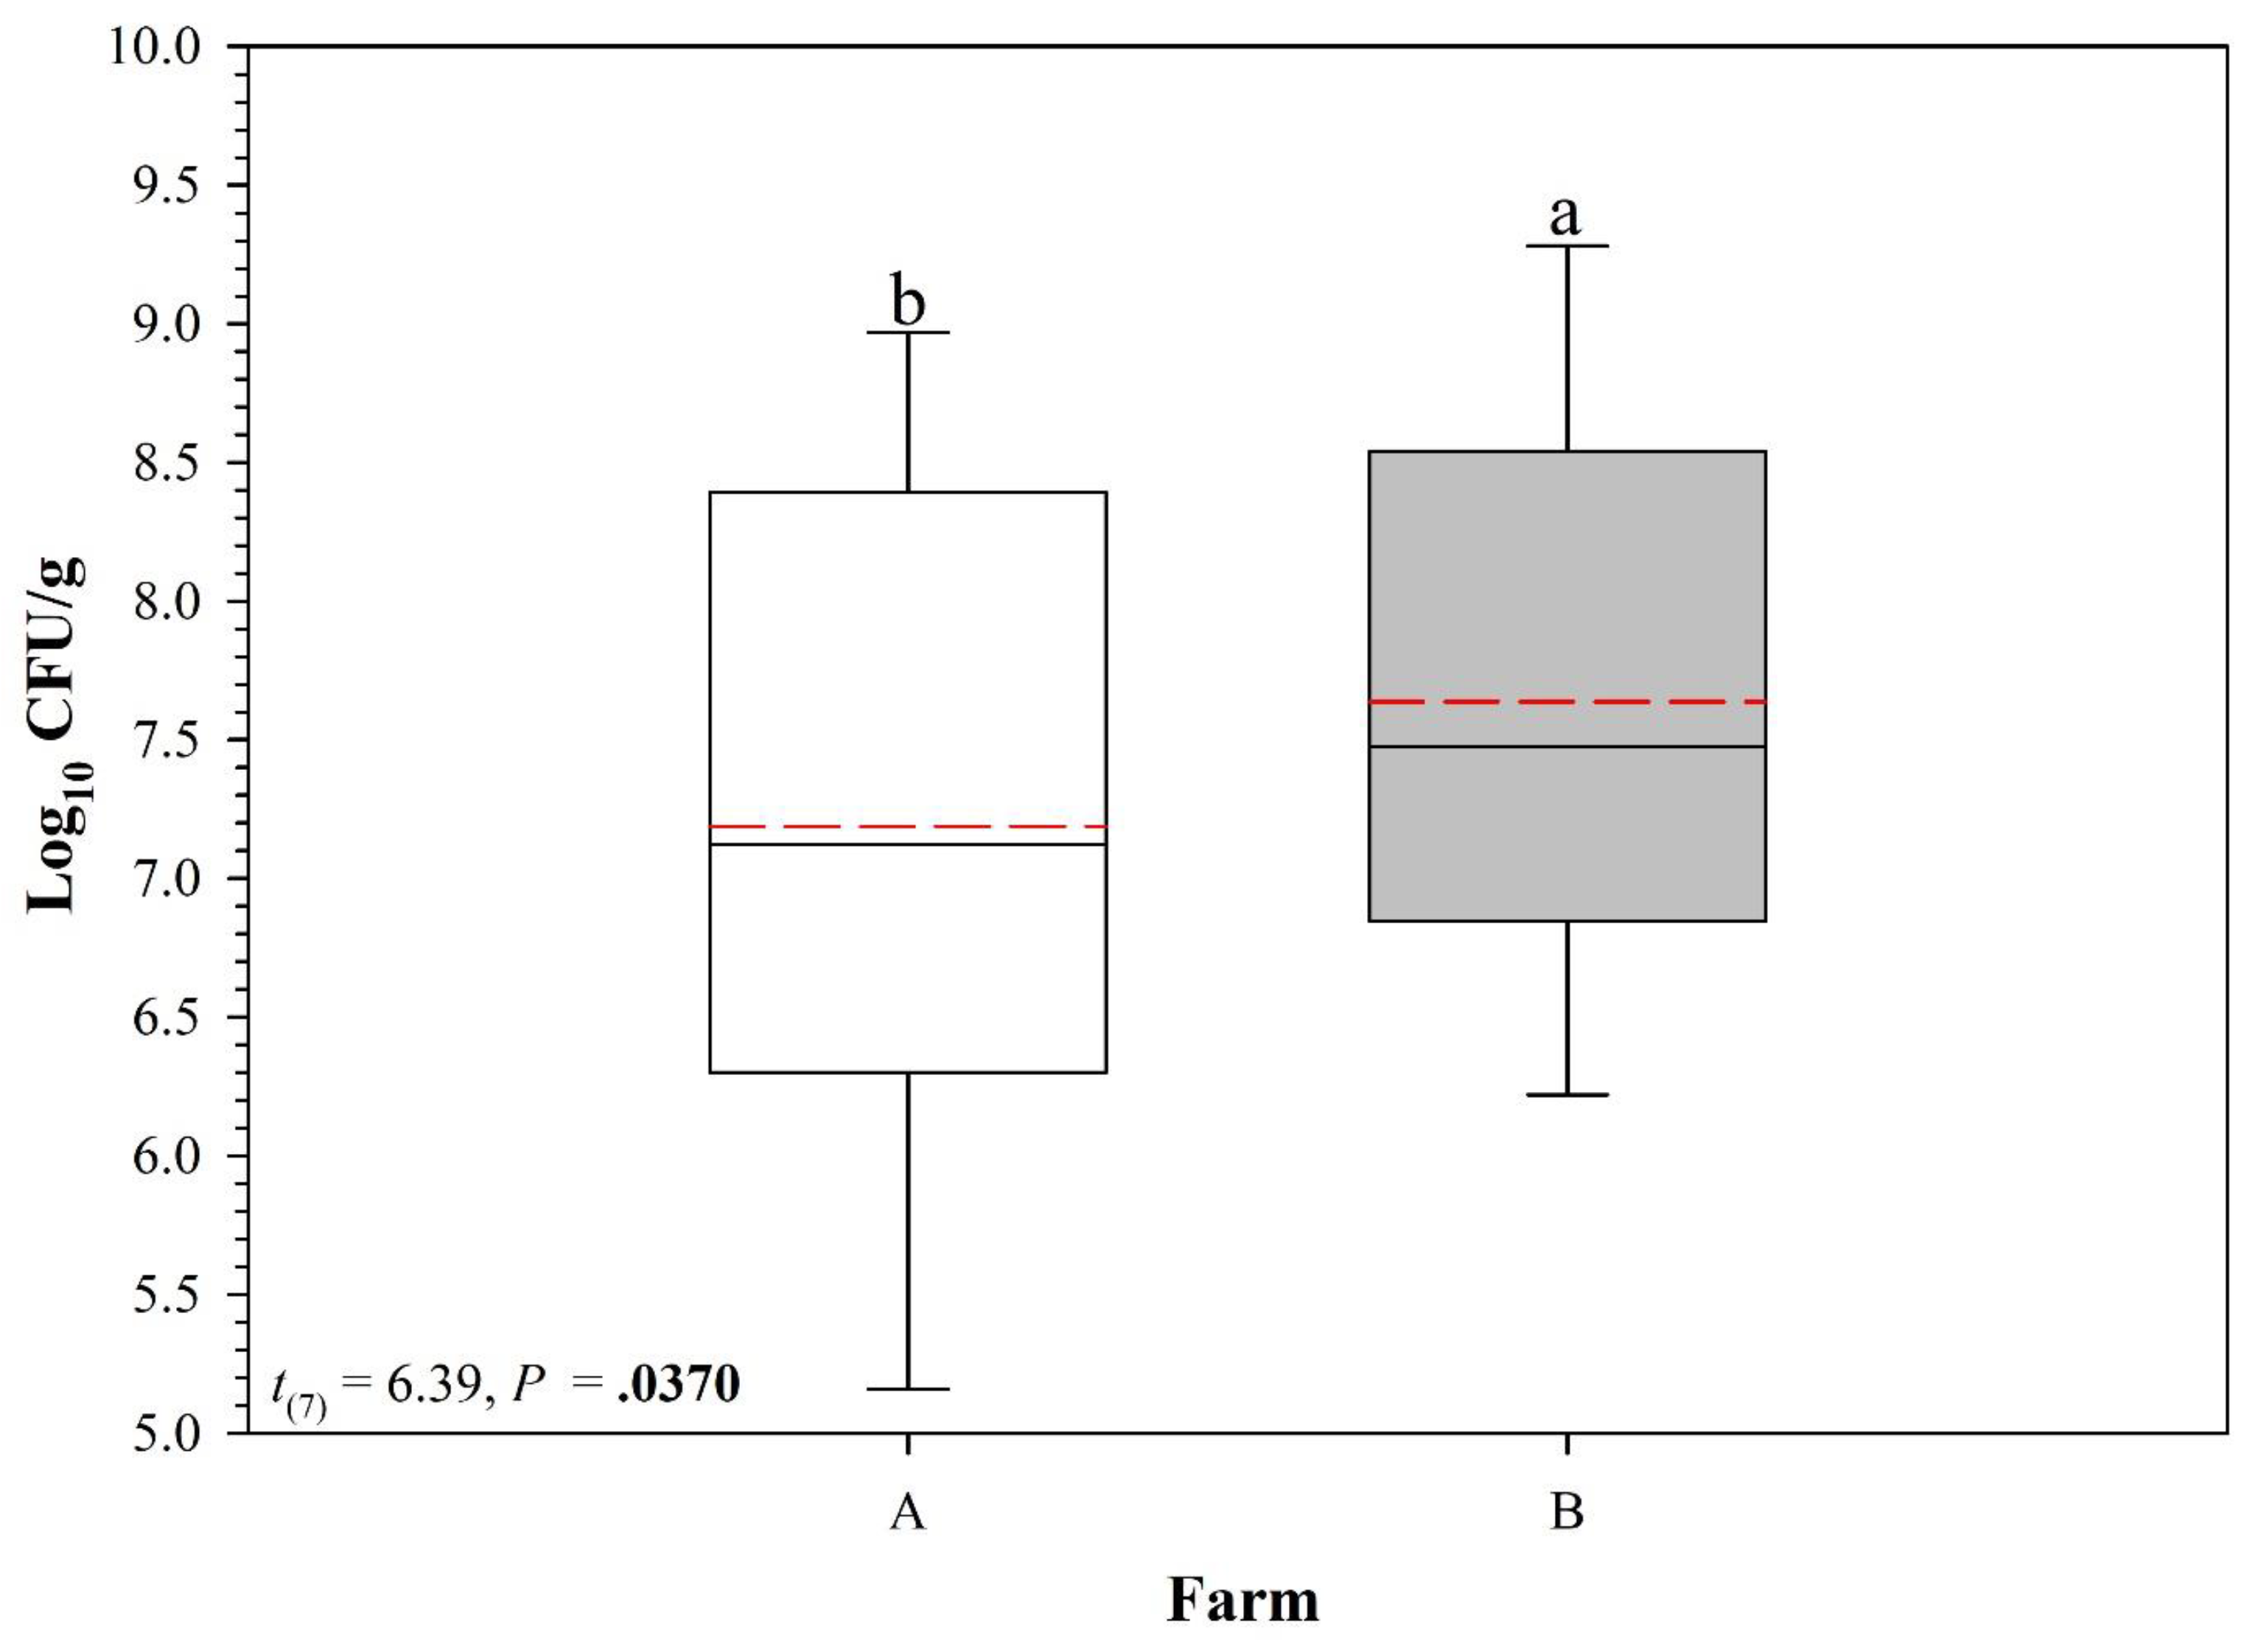
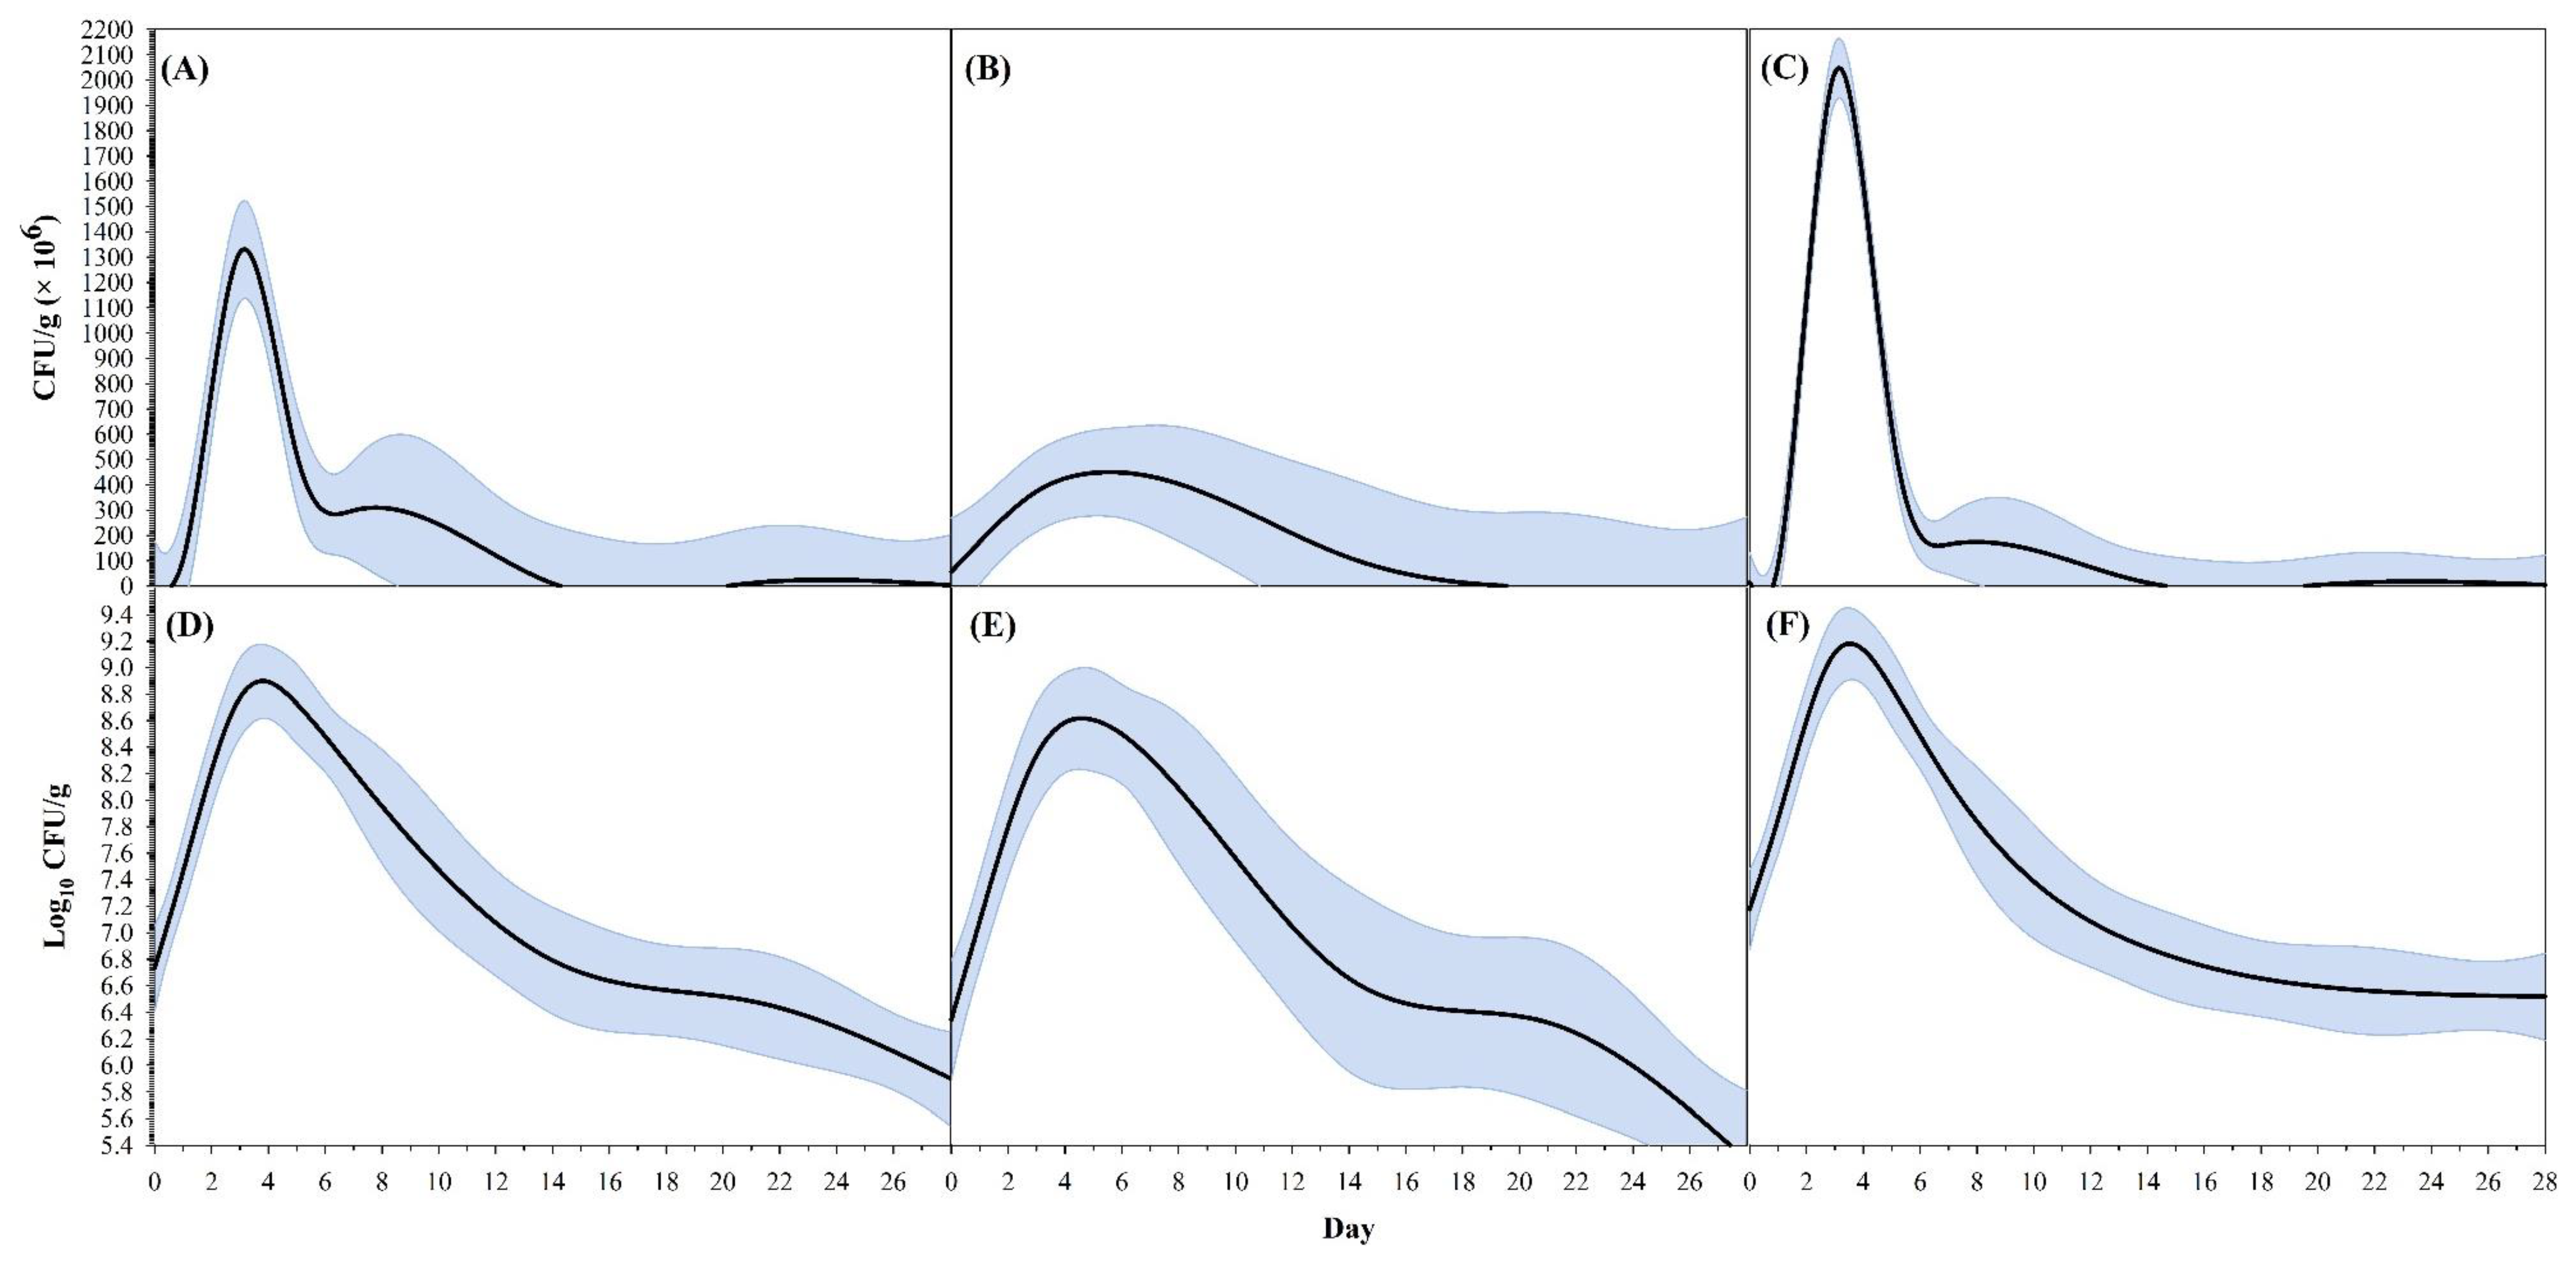
3. Results
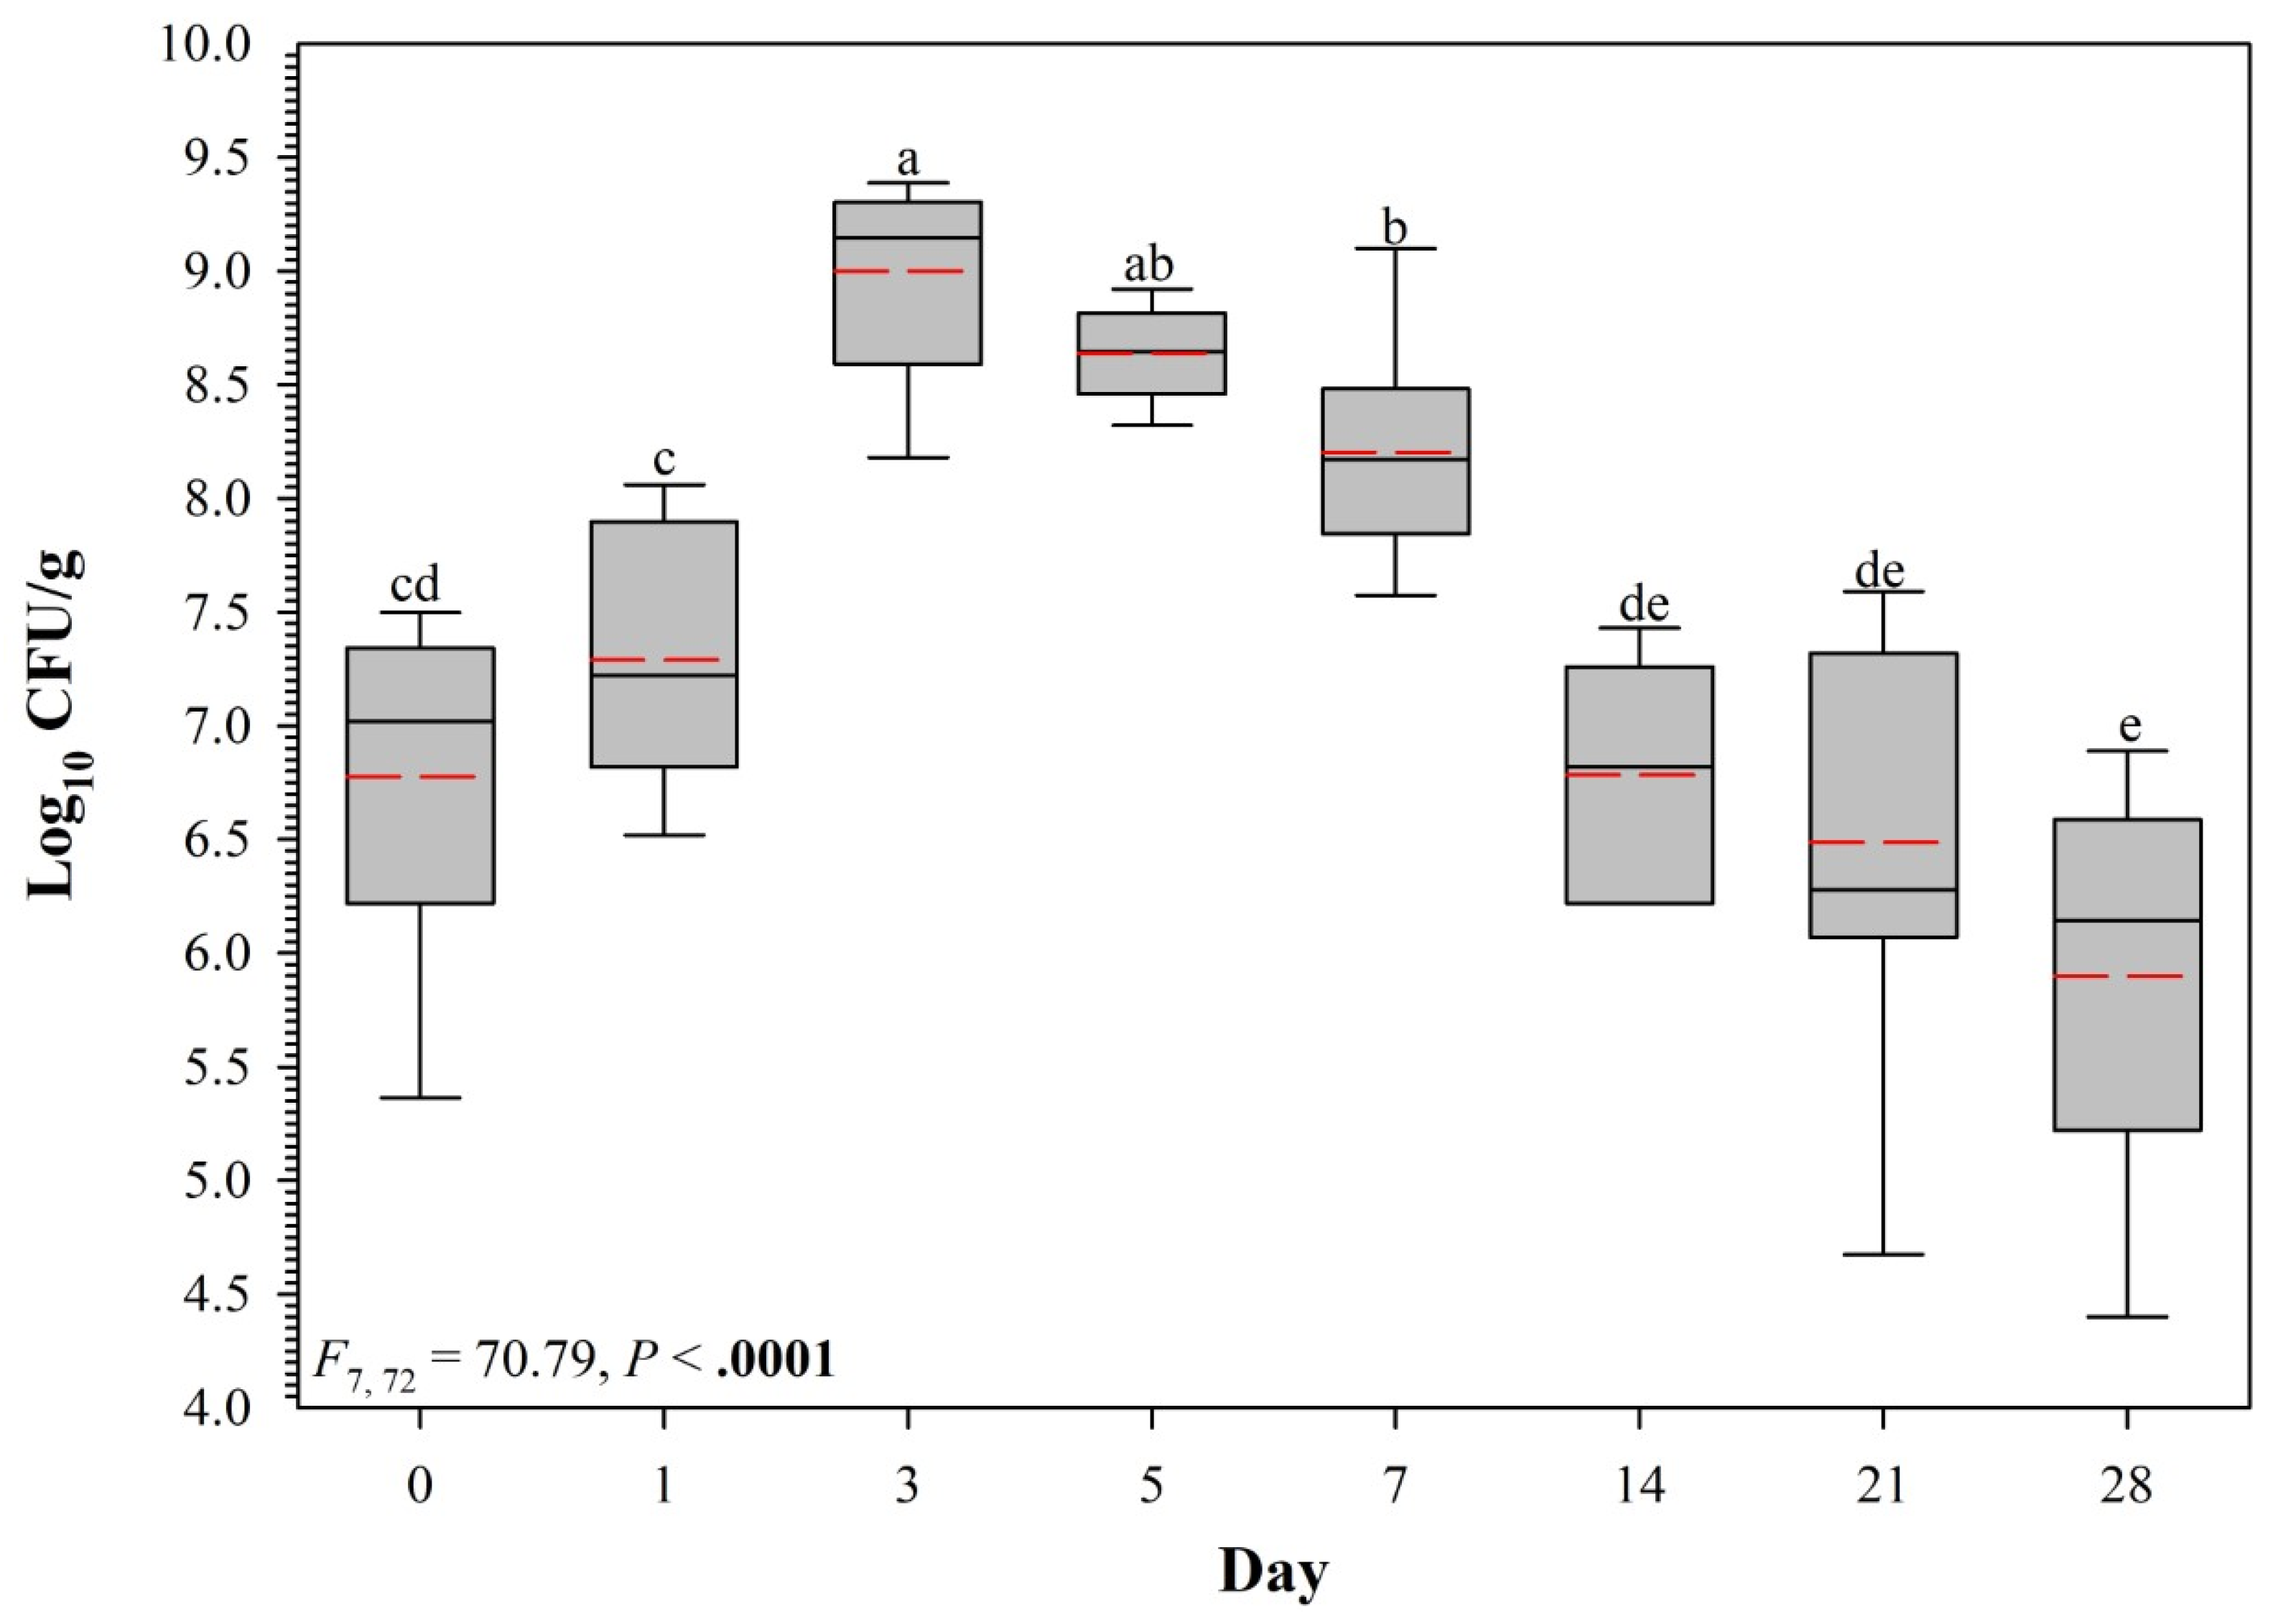
3.1. Pilot Trial
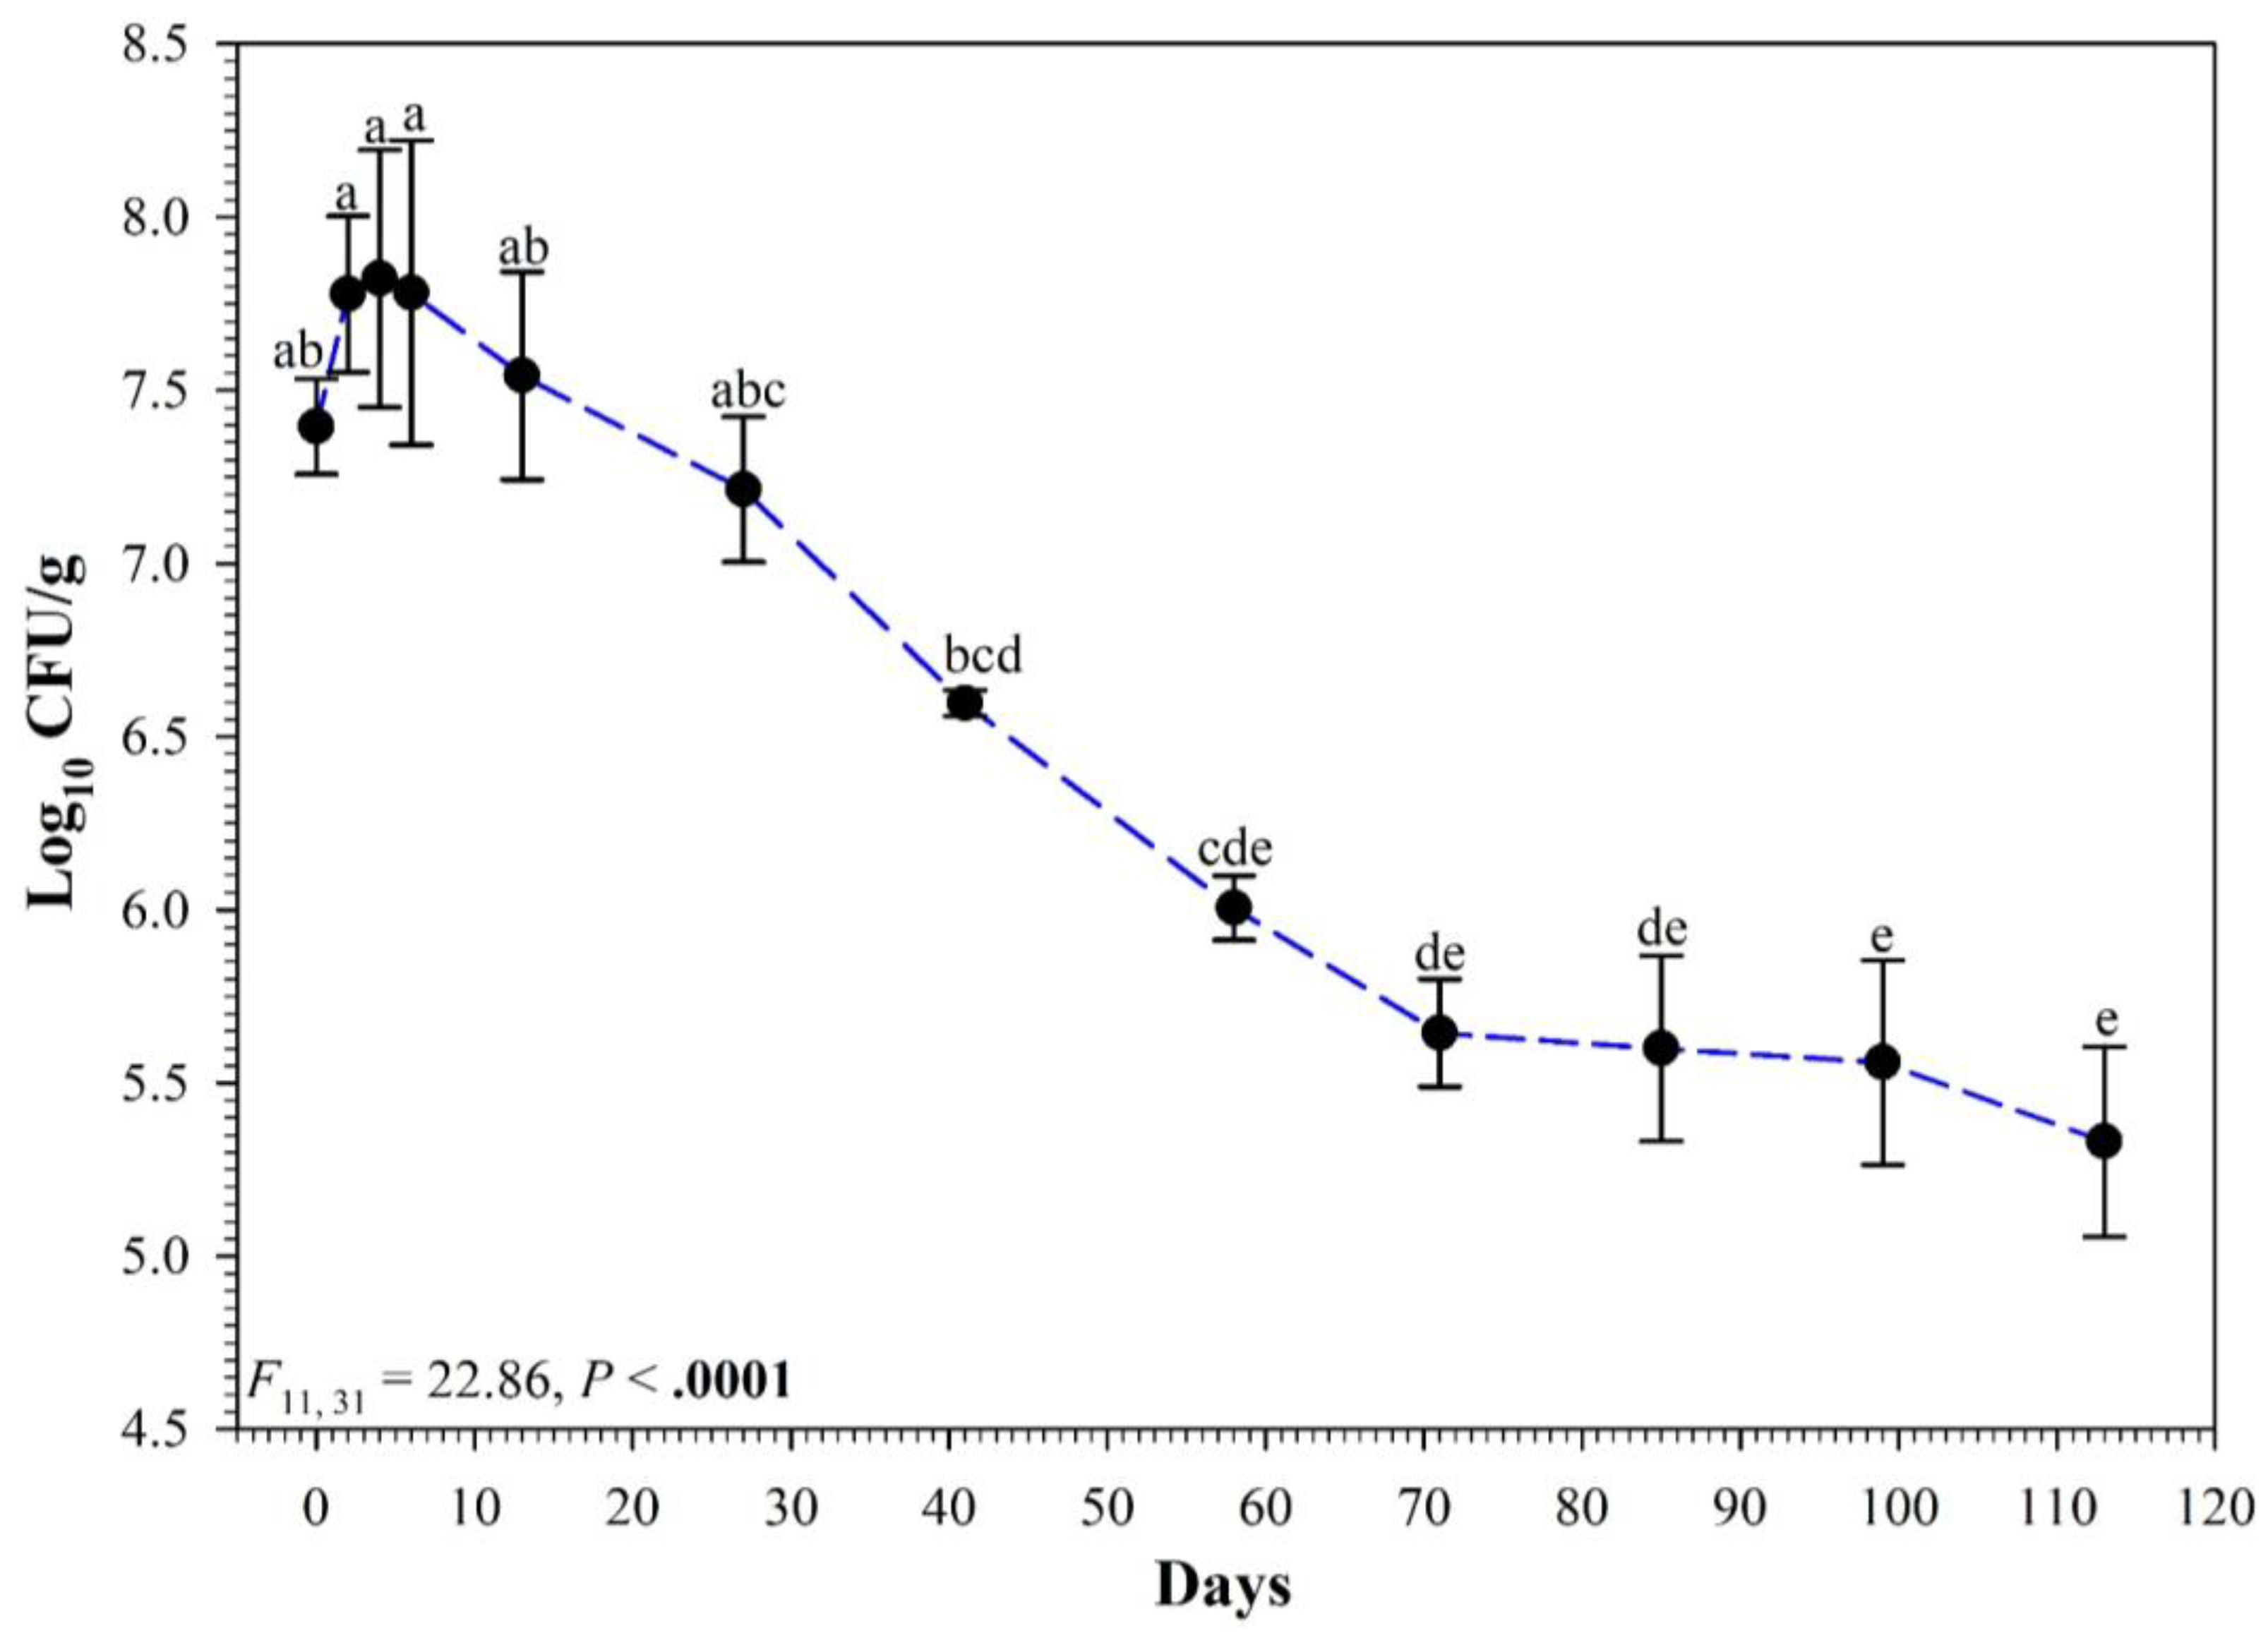
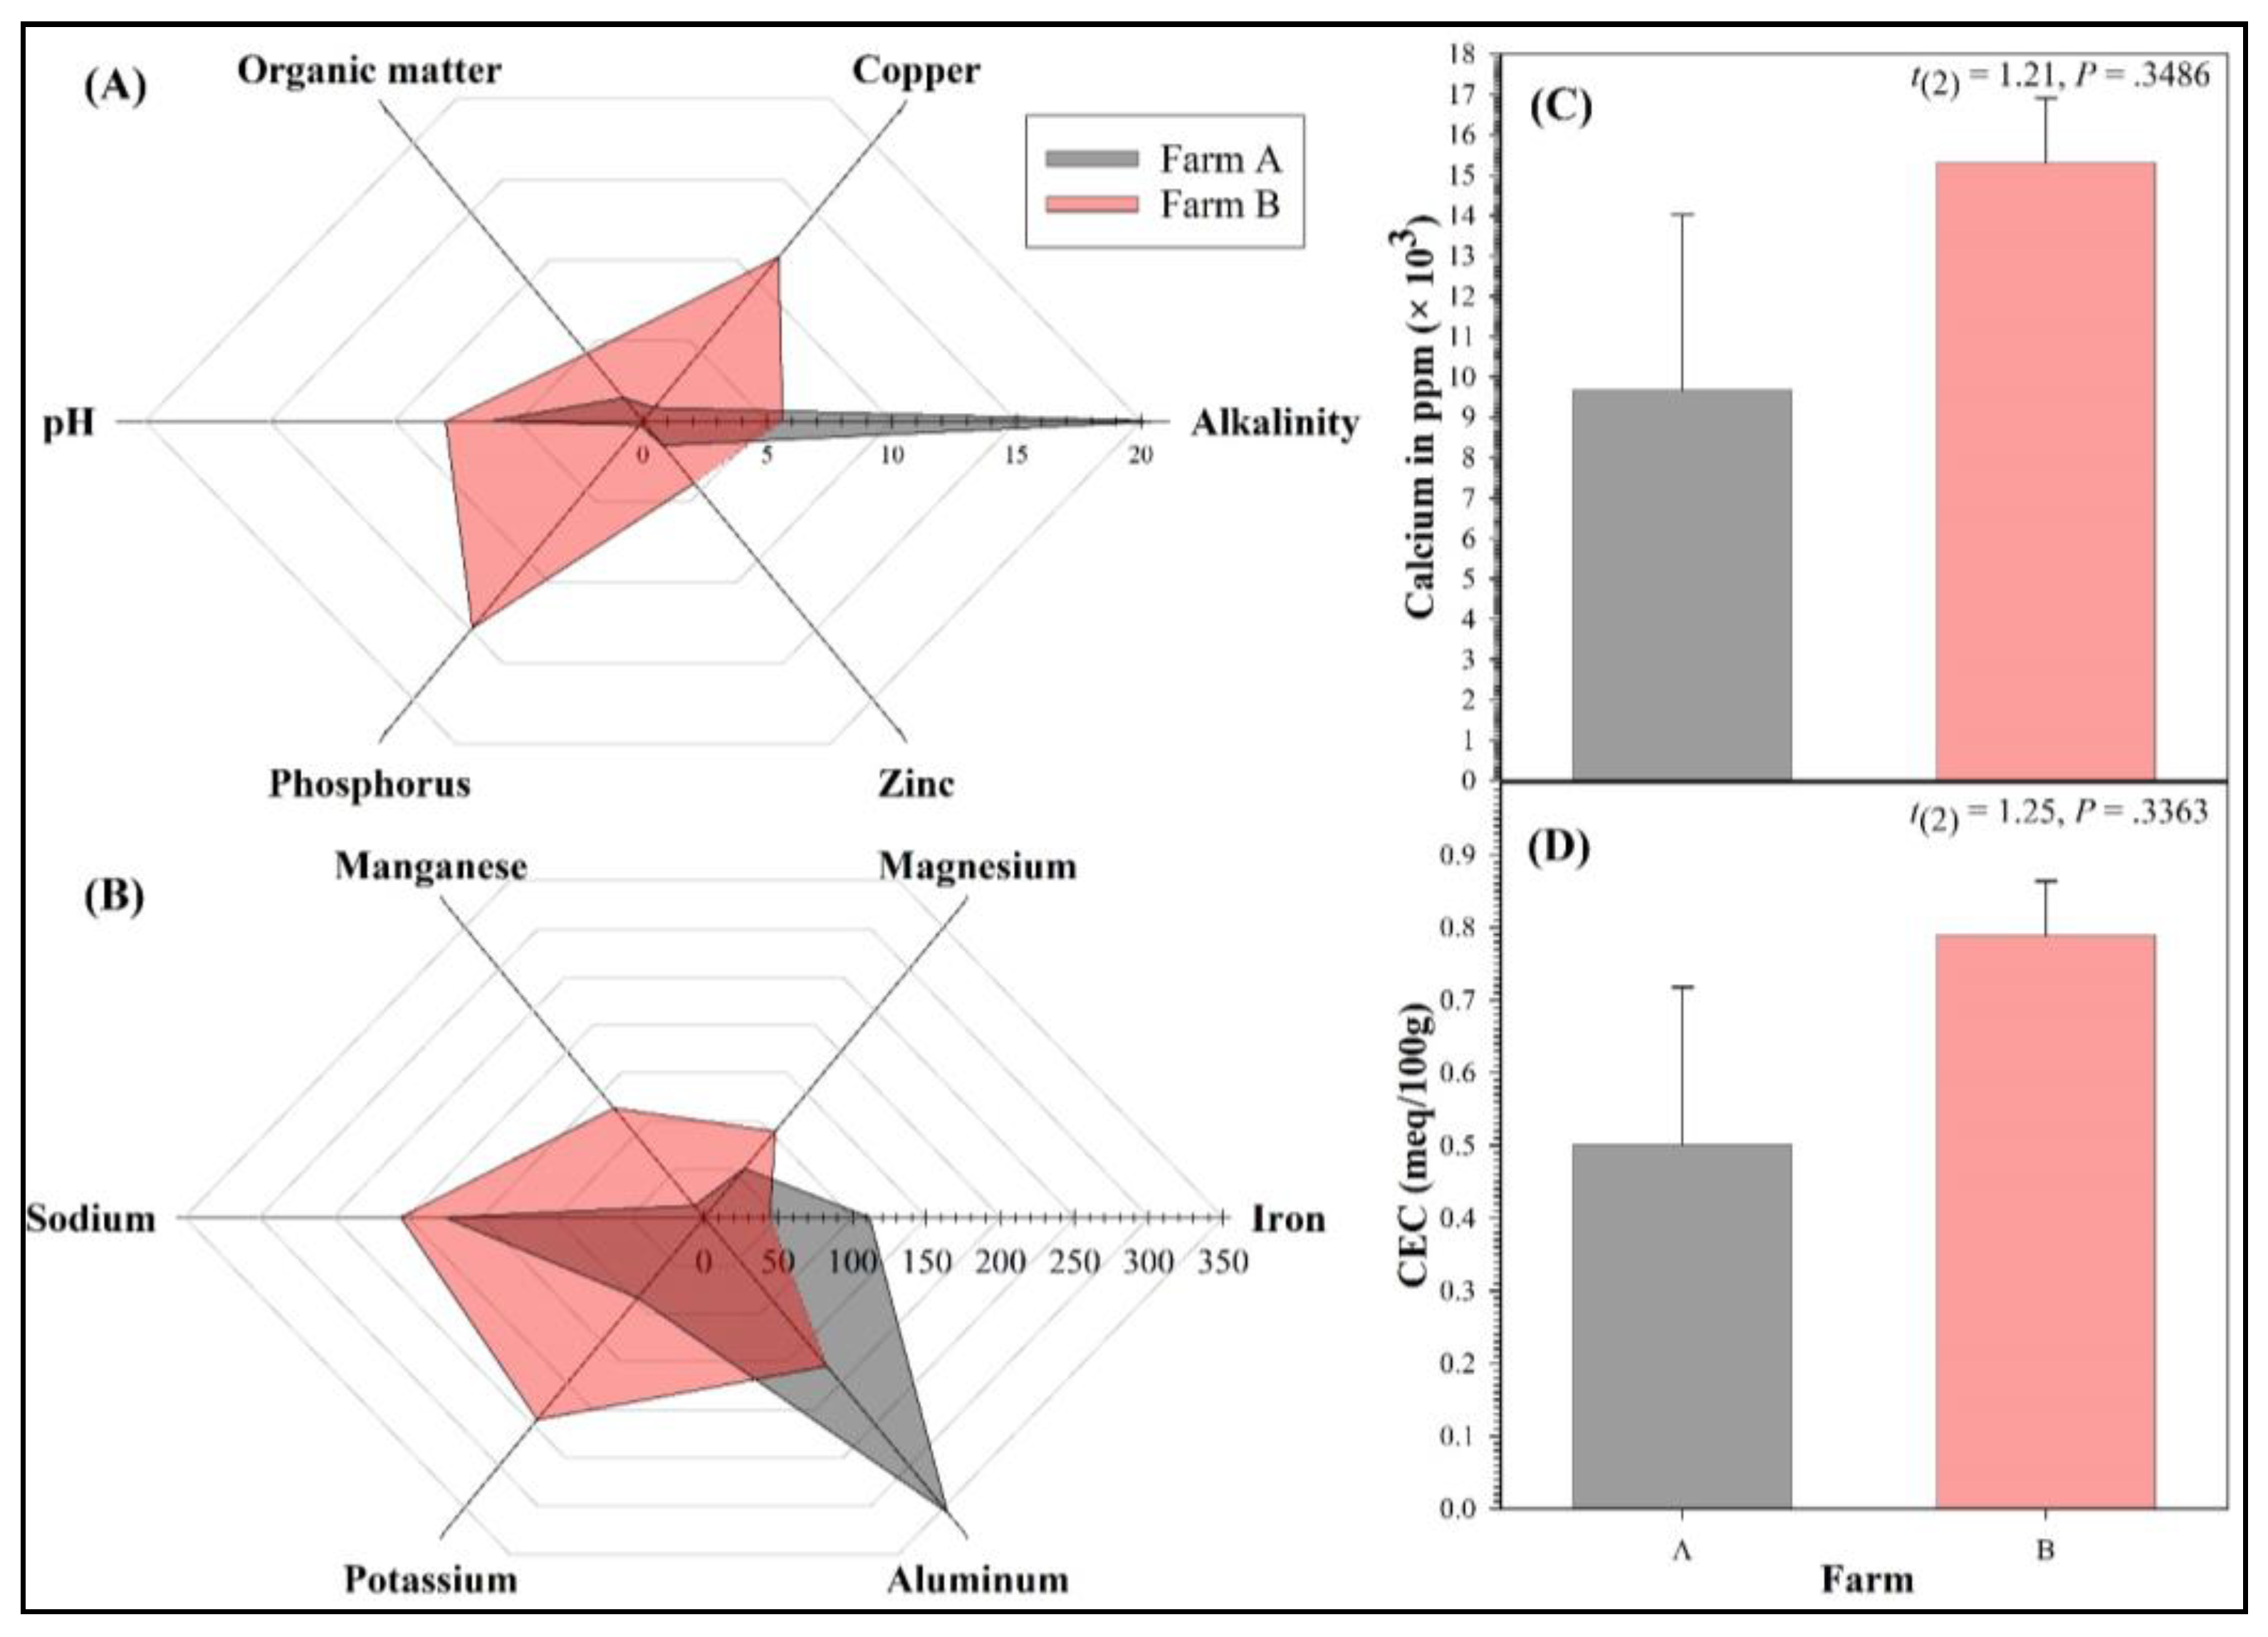
3.2. Full Persistence Trial
4. Discussion
5. Conclusionss
Author Contributions
Funding
Institutional Review Board Statement
Informed Consent Statement
Data Availability Statement
Acknowledgments
Conflicts of Interest
References
- USDA, NASS (U.S. Department of Agriculture, National Agricultural Statistics Service). Catfish Production Report; USDA, NASS: Washington, DC, USA, 2022.
- Hemstreet, B. An update on Aeromonas hydrophila from a fish health specialist for summer 2010. Cat. J. 2010, 24, 4. [Google Scholar]
- Pridgeon, J.W.; Klesius, P.H. Molecular identification and virulence of three Aeromonas hydrophila isolates cultured from infected channel catfish during a disease outbreak in west Alabama (USA) in 2009. Dis. Aqua. Orgm. 2011, 94, 249–253. [Google Scholar] [CrossRef] [Green Version]
- Pridgeon, J.W.; Klesius, P.H. Virulence of Aeromonas hydrophila to channel catfish Ictaluras punctatus fingerlings in the presence and absence of bacterial extracellular products. Dis. Aqua. Orgm. 2011, 95, 209–215. [Google Scholar] [CrossRef] [PubMed] [Green Version]
- Griffin, M.J.; Goodwin, A.E.; Merry, G.E.; Liles, M.R.; Williams, M.A.; Ware, C.; Waldbieser, G.C. Rapid quantitative detection of Aeromonas hydrophila strains associated with disease outbreaks in catfish aquaculture. J. Vet. Diag. Inv. 2011, 25, 473–481. [Google Scholar] [CrossRef] [Green Version]
- Hossain, M.J.; Sun, D.; McGarey, D.J.; Wrenn, S.; Alexander, L.M.; Martino, M.E.; Xing, Y.; Terhune, J.S.; Liles, M.R. An asian origin of virulent Aeromonas hydrophila responsible for disease epidemics in United States-farmed catfish. mBio 2014, 5, e00848-14. [Google Scholar] [CrossRef] [PubMed] [Green Version]
- Baumgartner, W.A.; Ford, L.; Hanson, L. Lesions caused by virulent Aeromonas hydrophila in farmed catfish (Ictalurus punctatus and I. punctatus × I. furcatus) in Mississippi. J. Vet. Diag. Inv. 2017, 29, 747–751. [Google Scholar] [CrossRef] [Green Version]
- Nielsen, M.E.; Høi, L.; Schmidt, A.S.; Qian, D.; Shimada, T.; Shen, J.Y.; Larsen, J.L. Is Aeromonas hydrophila the dominant motile Aeromonas species that causes disease outbreaks in aquaculture production in the Zhejiang Province of China? Dis. Aqua. Orgm. 2001, 46, 23–29. [Google Scholar] [CrossRef] [PubMed] [Green Version]
- Janda, J.M.; Abbott, S.L. The genus Aeromonas: Taxonomy, pathogenicity, and infection. Clin. Microb. Rev. 2010, 23, 35–73. [Google Scholar] [CrossRef] [Green Version]
- Rasmussen-Ivey, C.R.; Hossain, M.J.; Odom, S.E.; Terhune, J.S.; Hemstreet, W.G.; Shoemaker, C.A.; Zhang, D.; Xu, D.-H.; Griffin, M.J.; Liu, Y.; et al. Classification of a hypervirulent Aeromonas hydrophila pathotype responsible for epidemic outbreaks in warm-water fishes. Front. Microb. 2016, 7, 1615. [Google Scholar] [CrossRef] [Green Version]
- Zhang, D.; Xu, D.-H.; Shoemaker, C.A.; Beck, B.H. The severity of motile Aeromonas septicemia caused by virulent Aeromonas hydrophila in channel catfish is influenced by nutrients and microbes in water. Aquaculture 2020, 519, 734898. [Google Scholar] [CrossRef]
- Kelly, A.M.; Auburn University, Greensboro, AL, USA. Personal Communication, 2022.
- Abdelrahman, H.A.; Hemstreet, W.G.; Roy, L.A.; Hanson, T.R.; Beck, B.H.; Kelly, A.M. Epidemiology and economic impact of disease-related losses on commercial catfish farms: A seven-year case study from Alabama, USA. Aquaculture 2022, 566, 739206. [Google Scholar] [CrossRef]
- Zhang, D.; Moreira, G.S.A.; Shoemaker, C.; Newton, J.C.; Xu, D.-H. Detection and quantification of virulent Aeromonas hydrophila in channel catfish tissues following waterborne challenge. FEMS Microb. Lett. 2016, 363, fnw080. [Google Scholar] [CrossRef] [Green Version]
- Zhang, D.; Xu, D.-H.; Shoemaker, C. Experimental induction of motile Aeromonas septicemia in channel catfish (Ictalurus punctatus) by waterborne challenge with virulent Aeromonas hydrophila. Aquac. Rep. 2016, 3, 18–23. [Google Scholar] [CrossRef] [Green Version]
- Peatman, E.; Mohammed, H.; Kirby, A.; Shoemaker, C.A.; Yildirim-Aksoy, M.; Beck, B.H. Mechanisms of pathogen virulence and host susceptibility in virulent Aeromonas hydrophila infections of channel catfish (Ictalurus punctatus). Aquaculture 2018, 482, 1–8. [Google Scholar] [CrossRef]
- Thurlow, C.M.; Hossain, M.J.; Sun, D.; Barger, P.C.; Foshee, L.; Beck, B.H.; Newton, J.C.; Terhune, J.S.; Saper, M.A.; Liles, M.R. The gfc operon is involved in the formation of the O antigen capsule in Aeromonas hydrophila and contributes to virulence in channel catfish. Aquaculture 2019, 512, 734334. [Google Scholar] [CrossRef]
- Barger, P.C.; Liles, M.R.; Beck, B.H.; Newton, J.C. Differential production and secretion of potentially toxigenic extracellular proteins from hypervirulent Aeromonas hydrophila under biofilm and planktonic culture. BMC Microb. 2021, 21, 8. [Google Scholar] [CrossRef]
- Glahn, J.F.; King, D.T. Bird Depredation. In Biology and Culture of Channel Catfish, 1st ed.; Tucker, C.S., Hagreaves, J.A., Eds.; Elsevier: San Diego, CA, USA, 2004; Volume 34, pp. 503–529. ISBN 9780080472201. [Google Scholar]
- Cunningham, F.L.; Jubirt, M.M.; Hanson-Dorr, K.C.; Ford, L.; Fioranelli, P.; Hanson, L.A. Potential of double-crested cormorants (Phalacrocorax auritus), american white pelicans (Pelecanus erythrorhynchos), and wood storks (Mycteria americana) to transmit a hypervirulent strain of Aeromonas hydrophila between channel catfish culture ponds. J. Wildl. Dis. 2018, 54, 548–552. [Google Scholar] [CrossRef] [Green Version]
- Jubirt, M.M.; Hanson, L.A.; Hanson-Dorr, K.C.; Ford, L.; Lemmons, S.; Fioranelli, P.; Cunningham, F.L. Potential for great egrets (Ardea alba) to transmit a virulent strain of Aeromonas hydrophila among channel catfish (Ictalurus punctatus) culture ponds. J. Wildl. Dis. 2015, 51, 634–639. [Google Scholar] [CrossRef] [PubMed] [Green Version]
- Cunningham, F.L.; Hanson-Dorr, K.C.; Ford, L.; Middleton, D.R.; Crain, A.; Durst, L.; Ware, C.; Griffin, M.J.; Mische, C.C.; Wan, X.-F.; et al. Environmental factor(s) and animal vector(s) associated with atypical Aeromonas hydrophila abundance and dissemination among channel catfish ponds. J. World Aquac. Soc. 2020, 51, 750–762. [Google Scholar] [CrossRef]
- Bebak, J.; Wagner, B.; Burnes, B.; Hanson, T. Farm size, seining practices, and salt use: Risk factors for Aeromonas hydrophila outbreaks in farm-raised catfish, Alabama, USA. Prev. Vet. Medi. 2015, 118, 161–168. [Google Scholar] [CrossRef]
- USDA (U.S. Department of Agriculture); NAHMS (National Animal Health Monitoring Sercive). Catfish 2010, Part II: Health and Production Practices for Foodsize Catfish in the United States, 2009; USDA, Animal and Plant Health Inspection Service, Veterinary Services, Center for Epidemiology and Animal Health: Fort Collins, CO, USA, 2010.
- Boyd, C.E.; Tucker, C.S. Handbook for Aquaculture Water Quality; C.E. Boyd & Assoc. Incorporated: Auburn, AL, USA, 2014; ISBN 978-0-692-22187-7. [Google Scholar]
- Cai, W.; Willmon, E.; Burgos, F.A.; Ray, C.L.; Hanson, T.; Arias, C.R. Biofilm and sediment are major reservoirs of virulent Aeromonas hydrophila (vAh) in catfish production ponds. J. Aqua. Ani. Health. 2019, 31, 112–120. [Google Scholar] [CrossRef] [PubMed]
- Barria, C.; Malecki, M.; Arraiano, C.M. Bacterial adaptation to cold. Microbiology 2013, 159, 2437–2443. [Google Scholar] [CrossRef] [PubMed] [Green Version]
- Awan, F.; Dong, Y.; Wang, N.; Liu, J.; Ma, K.; Liu, Y. The fight for invincibility: Environmental stress response mechanisms and Aeromonas hydrophila. Microb. Patho. 2018, 116, 135–145. [Google Scholar] [CrossRef]
- Bruslind, L. Microbial Growth. In General Microbiology, 1st ed.; Oregon State University: Corvallis, OR, USA, 2020; pp. 52–55. ISBN 978-1-955101-17-2. [Google Scholar]
- Francis-Floyd, R. Aeromonas Infections; University of Florida Cooperative Extension Service, Institute of Food and Agriculture Sciences, EDIS: Gainesville, FL, USA, 1991. [Google Scholar]
- Ramachandra, T.V.; Sincy, V.; Ashulabha, K.S.; Bhat, S.P.; Rahaman, M.F. Recurring Fish Mortality Episodes in Bangalore Lakes: Signs of Irresponsible and Fragmented Governance; ENVIS Technical Report 105; Energy & Wetlands Research Group, CES, IISc: Bangalore, India, 2016. [Google Scholar]
- Chenia, H.Y.; Duma, S. Characterization of virulence, cell surface characteristics and biofilm-forming ability of Aeromonas spp. isolates from fish and sea water. J. Fish Dis. 2017, 40, 339–350. [Google Scholar] [CrossRef] [PubMed]
- Stratev, D.; Odeyemi, O.A. An overview of motile Aeromonas septicaemia management. Aquac. Intl. 2017, 25, 1095–1105. [Google Scholar] [CrossRef]
- Mohammed, H.H.; Peatman, E. Winter kill in intensively stocked channel catfish (Ictalurus punctatus): Coinfection with Aeromonas veronii, Streptococcus parauberis and Shewanella putrefaciens. J. Fish Dis. 2018, 41, 1339–1347. [Google Scholar] [CrossRef]
- Zhao, X.L.; Jin, Z.H.; Di, G.L.; Li, L.I.; Kong, X.H. Molecular characteristics, pathogenicity and medication regimen of Aeromonas hydrophila isolated from common carp (Cyprinus carpio L.). J. Vet. Med. Sci. 2019, 81, 1769–1775. [Google Scholar] [CrossRef] [Green Version]
- Munsiri, P.; Boyd, C.E.; Hajek, B.F. Physical and chemical characteristics of bottom soil profiles in ponds at Auburn, Alabama, USA and a proposed system for describing pond soil horizons. J. World Aqua. Soc. 1995, 26, 346–377. [Google Scholar] [CrossRef]
- Brandi, G.; Sisti, M.; Schiavano, G.F.; Salvaggio, L.; Albano, A. Survival of Aeromonas hydrophila, Aeromonas caviae and Aeromonas sobria in soil. J. App. Bact. 1996, 81, 439–444. [Google Scholar] [CrossRef]
- Wolf, D.C.; Skipper, H.D. Soil Sterilization. In Methods of Soil Analysis Part 2 Microbiological and Biochemical Properties; Weaver, R.W., Angle, S., Bottomley, P., Bezdicek, D., Smith, S., Tabatabai, A., Wollum, A., Eds.; John Wiley & Sons, Ltd.: New York, NY, USA, 1994; pp. 41–51. ISBN 9780891188100. [Google Scholar]
- Rutala, W.A.; Weber, D.J. Disinfection and sterilization: An overview. Am. J. Infec. Cntl. 2013, 41, S2–S5. [Google Scholar] [CrossRef]
- Liles, M.; Hemstreet, W.; Waldbieser, G.; Griffin, M.; Khoo, L.; Bebak, J.; Garcia, J.; Goodwin, A.E.; Capps, N.; Hayden, K.; et al. Comparative genomics of Aeromonas hydrophila isolates from an epidemic in channel catfish. In American Society for Microbiology Meeting; 2011. Available online: https://www.ars.usda.gov/research/publications/publication/?seqNo115=268999 (accessed on 12 September 2022).
- Chen, C.Y.; Nace, G.W.; Irwin, P.L. A 6 × 6 drop plate method for simultaneous colony counting and MPN enumeration of Campylobacter jejuni, Listeria monocytogenes, and Escherichia coli. J. Microbiol. Mth. 2003, 55, 475–479. [Google Scholar] [CrossRef] [PubMed]
- Havelaar, A.H.; During, M.; Versteegh, J.F.M. Ampicillin-dextrin agar medium for the enumeration of Aeromonas species in water by membrane filtration. J. App. Bact. 1987, 62, 279–287. [Google Scholar] [CrossRef]
- Buck, J.D.; Cleverdon, R.C. The spread plate as a method for the enumeration of marine bacteria 1, 2. Limn. Oceano. 1960, 5, 78–80. [Google Scholar] [CrossRef]
- Marchesi, J.R.; Sato, T.; Weightman, A.J.; Martin, T.A.; Fry, J.C.; Hiom, S.J.; Wade, W.G. Design and evaluation of useful bacterium-specific PCR primers that amplify genes coding for bacterial 16S rRNA. App. Environ. Microb. 1998, 64, 795–799. [Google Scholar] [CrossRef] [PubMed] [Green Version]
- Tamura, K.; Stecher, G.; Kumar, S. MEGA11: Molecular evolutionary genetics analysis version 11. Mol. Biol. Evol. 2021, 38, 3022–3027. [Google Scholar] [CrossRef]
- Altschul, S.F.; Gish, W.; Miller, W.; Myers, E.W.; Lipman, D.J. Basic local alignment search tool. J. Mol. Biol. 1990, 215, 403–410. [Google Scholar] [CrossRef]
- Gustafsson, J.P. Visual MINTEQ 3.1 User Guide. Available online: https://vminteq.lwr.kth.se/ (accessed on 28 October 2022).
- Sparks, D.L. Chemistry of Soil organic Matter. In Environmental Soil Chemistry, 2nd ed.; Sparks, D.L., Ed.; Academic Press: Cambridge, MA, USA, 2003; pp. 75–113. ISBN 978-0-12-656446-4. [Google Scholar]
- Benjamini, Y.; Hochberg, Y. Controlling the false discovery rate: A practical and powerful approach to multiple testing. J. R. Stat. Soc. Ser. B 1995, 57, 289–300. [Google Scholar] [CrossRef]
- Hussain, A.S.; Fogelman, K.; Abdelrahman, H.A.; Roy, L.A.; Stoeckel, J. Relationship between aerobic scope and upper thermal limits of pacific white shrimp (Litopenaeus vannamei) in low-salinity culture systems. Aquaculture 2023, 569, 739402. [Google Scholar] [CrossRef]
- Berry, L.N.; Helwig, N.E. Cross-validation, information theory, or maximum likelihood? A comparison of tuning methods for penalized splines. Stats 2021, 4, 701–724. [Google Scholar] [CrossRef]
- Efron, B.; Tibshirani, R. An Introduction to the Bootstrap, Monographs on Statistics and Applied Probability, 1st ed.; Chapman & Hall; CRC: New York, NY, USA, 1993; ISBN 9780412042317. [Google Scholar]
- Canty, A.; Ripley, B. Boot: Bootstrap R (S-Plus) Functions, R package, version 1.3–28; R Core Team: Vienna, Austria, 2021. [Google Scholar]
- Faul, F.; Erdfelder, E.; Lang, A.-G.; Buchner, A. G* Power 3: A flexible statistical power analysis program for the social, behavioral, and biomedical sciences. Behav. Res. Methods 2007, 39, 175–191. [Google Scholar] [CrossRef]
- R Core Team. R: A Language and Environment for Statistical Computing. Available online: https://www.R-project.org/ (accessed on 12 September 2022).
- SAS. The SAS System for Windows; Release 9.4; SAS Institute Inc.: Cary, NC, USA, 2013. [Google Scholar]
- Rouf, M.A.; Rigney, M.M. Growth temperatures and temperature characteristics of Aeromonas. App. Microb. 1971, 22, 503–506. [Google Scholar] [CrossRef] [PubMed]
- Park, S.Y.; Ha, S.D. Effect of temperature on the growth kinetics and predictive growth model of Aeromonas hydrophila on squid (Sepioteuthis sepioidea). Food Sci. Biotechnol. 2014, 23, 307–312. [Google Scholar] [CrossRef]
- Kim, J.Y.; Jeon, E.B.; Song, M.G.; Park, S.H.; Park, S.Y. Development of predictive growth models of Aeromonas hydrophila on raw tuna Thunnus orientalis as a function of storage temperatures. LWT 2022, 156, 113052. [Google Scholar] [CrossRef]
- Chen, H.Q.; Lu, C.P. Study on the pathogen of epidemic septicemia occurred in cyprinoid fishes in Beijing, China. Biodiv. Sci. 1991, 6, 31–36. [Google Scholar] [CrossRef]
- Gao, X.; Jian, J.; Li, W.-J.; Yang, Y.-C.; Shen, X.-W.; Sun, Z.-R.; Wu, Q.; Chen, G.-Q. Genomic study of polyhydroxyalkanoates producing Aeromonas hydrophila 4AK4. App. Micro. Biotech. 2013, 97, 9099–9109. [Google Scholar] [CrossRef]
- Pang, M.; Jiang, J.; Xie, X.; Wu, Y.; Dong, Y.; Kwok, A.H.Y.; Zhang, W.; Yao, H.; Lu, C.; Leung, F.C.; et al. Novel insights into the pathogenicity of epidemic Aeromonas hydrophila ST251 clones from comparative genomics. Sci. Rep. 2015, 5, 9833. [Google Scholar] [CrossRef] [Green Version]
- Lee, S.W.; Wendy, W. Antibiotic and heavy metal resistance of Aeromonas hydrophila and Edwardsiella tarda isolated from red hybrid tilapia (Oreochromis spp.) coinfected with motile Aeromonas septicemia and edwardsiellosis. Vet. World 2017, 10, 803–807. [Google Scholar] [CrossRef] [Green Version]
- Beier, S.; Bertilsson, S. Bacterial chitin degradation—Mechanisms and ecophysiological strategies. Front. Microb. 2013, 4, 149. [Google Scholar] [CrossRef] [Green Version]
- Zhang, D.; Bland, J.M.; Xu, D.-H.; Chung, S. Degradation of chitin and chitosan by a recombinant chitinase derived from a virulent Aeromonas hydrophila isolated from diseased channel catfish. Adv. Microb. 2015, 5, 611. [Google Scholar] [CrossRef] [Green Version]
- Zhang, D.; Xu, D.-H.; Qiu, J.; Rasmussen-Ivey, C.R.; Liles, M.R.; Beck, B.H. Chitin degradation and utilization by virulent Aeromonas hydrophila strain ML10-51K. Arc. Microb. 2017, 199, 573–579. [Google Scholar] [CrossRef]
- Vacher, C.; Tamaddoni-Nezhad, A.; Kamenova, S.; Peyrard, N.; Moalic, Y.; Sabbadin, R.; Schwaller, L.; Chiquet, J.; Smith, M.A.; Vallance, J.; et al. Learning Ecological Networks from Next-Generation Sequencing Data. In Advances in Ecological Research; Wodward, G., Bohan, D.A., Eds.; Academic Press: Cambridge, MA, USA, 2016; Volume 54, pp. 1–39. ISBN 978-0-08-100978-9. [Google Scholar]
- Jangid, K.; Whitman, W.B.; Condron, L.M.; Turner, B.L.; Williams, M.A. Soil bacterial community succession during long-term ecosystem development. Mol. Ecol. 2013, 22, 3415–3424. [Google Scholar] [CrossRef] [PubMed] [Green Version]
- Ortiz-Álvarez, R.; Fierer, N.; de Los Ríos, A.; Casamayor, E.O.; Barberán, A. Consistent changes in the taxonomic structure and functional attributes of bacterial communities during primary succession. ISME J. 2018, 12, 1658–1667. [Google Scholar] [CrossRef] [PubMed] [Green Version]
- Islam, W.; Noman, A.; Naveed, H.; Huang, Z.; Chen, H.Y. Role of environmental factors in shaping the soil microbiome. Environ. Sci. Poll. Res. 2020, 27, 41225–41247. [Google Scholar] [CrossRef]
- Rael, R.M.; Frankenberger, W.T., Jr. Influence of pH, salinity, and selenium on the growth of Aeromonas veronii in evaporation agricultural drainage water. Water Res. 1996, 30, 422–430. [Google Scholar] [CrossRef]
- Ibrahim, U.B.; Kawo, A.H.; Yusuf, I.; Yahaya, S. Physicochemical and molecular characterization of heavy metal–tolerant bacteria isolated from soil of mining sites in Nigeria. J. Gen. Eng. Biotech. 2021, 19, 152. [Google Scholar] [CrossRef]
- Hossain, M.J.; Waldbieser, G.C.; Sun, D.; Capps, N.K.; Hemstreet, W.B.; Carlisle, K.; Griffin, M.J.; Khoo, L.; Goodwin, A.E.; Sonstegard, T.S.; et al. Implication of lateral genetic transfer in the emergence of Aeromonas hydrophila isolates of epidemic outbreaks in channel catfish. PLoS ONE 2013, 8, e80943. [Google Scholar] [CrossRef] [Green Version]
- Preena, P.G.; Swaminathan, T.R.; Kumar, V.J.R.; Singh, I.S.B. Antimicrobial resistance in aquaculture: A crisis for concern. Biologia 2020, 75, 1497–1517. [Google Scholar] [CrossRef]


| Curve Descriptor | Overall | Farm A | Farm B | ||||
|---|---|---|---|---|---|---|---|
| Mean ± SE | 95% C.I. | Mean ± SE | 95% C.I. | Mean ± SE | 95% C.I. | ||
| CFU g−1 | Peak CFU g−1 (×106) | 1329.8 ± 260.9 | 818.4–1841.1 | 449.6 ± 222.0 | 14.5–884.7 | 2046.6 ± 1266.6 | −435.9–4529.1 |
| Time (day) at peak CFU g−1 | 3.16 ± 0.19 | 2.78–3.53 | 5.58 ± 1.92 | 1.82–9.34 | 3.15 ± 0.79 | 1.61–4.69 | |
| Time (day) at 90% of peak CFU g−1—lower | 2.64 ± 0.12 | 2.41–2.88 | 3.52 ± 1.43 | 0.72–6.32 | 2.66 ± 0.79 | 1.10–4.21 | |
| Time (day) at 90% of Peak CFU g−1—upper | 3.73 ± 0.32 | 3.11–4.35 | 7.97 ± 2.45 | 3.16–12.77 | 3.69 ± 0.77 | 2.18–5.20 | |
| Breadth at 90% of peak CFU g−1 * | 1.09 ± 0.24 | 0.61–1.56 | 4.45 ± 1.47 | 1.55–7.34 | 1.03 ± 0.04 | 0.95–1.11 | |
| Time (day) at 80% of peak CFU g−1—lower | 2.41 ± 0.10 | 2.21–2.60 | 2.82 ± 1.25 | 0.37–5.27 | 2.43 ± 0.79 | 0.88–3.99 | |
| Time (day) at 80% of peak CFU g−1—upper | 4.00 ± 0.47 | 3.09–4.92 | 9.07 ± 2.70 | 3.77–14.36 | 3.94 ± 0.76 | 2.45–5.44 | |
| Breadth at 80% of peak CFU g−1 * | 1.60 ± 0.44 | 0.74–2.45 | 6.25 ± 2.06 | 2.22–10.28 | 1.51 ± 0.06 | 1.40–1.62 | |
| Time (day) at 5% of peak CFU g−1—min | 0.90 ± 0.19 | 0.52–1.27 | 0.00 ± 0.32 | −0.62–0.62 | 1.04 ± 0.71 | −0.36–2.43 | |
| Time (day) at 5% of peak CFU g−1—max | 12.89 ± 1.89 | 9.17–16.60 | 17.32 ± 4.46 | 8.57–26.07 | 11.22 ± 1.95 | 7.39–15.05 | |
| Range at 5% of peak CFU g−1 | 11.99 ± 1.89 | 8.28–15.70 | 17.32 ± 4.59 | 8.31–26.32 | 10.18 ± 1.88 | 6.50–13.86 | |
| Log10 CFU g−1 | Peak log10 CFU g−1 | 8.90 ± 0.12 | 8.67–9.13 | 8.62 ± 0.12 | 8.38–8.85 | 9.18 ± 0.38 | 8.43–9.93 |
| Time (day) at peak log10 CFU g−1 | 3.80 ± 0.23 | 3.35–4.25 | 4.59 ± 0.69 | 3.24–5.95 | 3.53 ± 0.79 | 1.98–5.07 | |
| Time (day) at 90% of peak log10 CFU g−1—lower | 1.71 ± 0.16 | 1.40–2.01 | 1.94 ± 0.17 | 1.61–2.26 | 1.54 ± 0.84 | −0.11–3.19 | |
| Time (day) at 90% of peak log10 CFU g−1—upper | 7.79 ± 0.78 | 6.26–9.31 | 9.28 ± 1.30 | 6.73–11.83 | 6.63 ± 0.84 | 4.98–8.28 | |
| Breadth at 90% of peak log10 CFU g−1 | 6.08 ± 0.84 | 4.42–7.73 | 7.34 ± 1.27 | 4.85–9.84 | 5.09 ± 0.61 | 3.88–6.29 | |
| Time (day) at 80% of peak log10 CFU g−1—lower | 0.54 ± 0.26 | 0.03–1.04 | 0.74 ± 0.26 | 0.23–1.26 | 0.26 ± 0.88 | −1.47–1.98 | |
| Time (day) at 80% of peak log10 CFU g−1—upper | 11.75 ± 1.61 | 8.59–14.91 | 12.68 ± 4.09 | 4.66–20.70 | 10.23 ± 1.85 | 6.61–13.85 | |
| Breadth at 80% of peak log10 CFU g−1 | 11.22 ± 1.71 | 7.87–14.56 | 11.94 ± 4.10 | 3.89–19.98 | 9.97 ± 1.83 | 6.38–13.57 | |
| Water Quality Parameter | Overall | Farm A | Farm B | |||
|---|---|---|---|---|---|---|
| Mean ± SE | Min–Max | Mean ± SE | Min–Max | Mean ± SE | Min–Max | |
| Total alkalinity (ppm) | 120.27 ± 3.53 | 87–206 | 111.97 ± 3.65 | 87–167 | 128.57 ± 5.71 | 90–206 |
| Total hardness (ppm) | 118.93 ± 4.26 | 67–199 | 115.60 ± 5.25 | 67–190 | 122.27 ± 6.75 | 73–199 |
| pH | 7.59 ± 0.02 | 7.3–7.9 | 7.59 ± 0.03 | 7.4–7.9 | 7.59 ± 0.03 | 7.3–7.9 |
| Phosphate (ppm) | 1.18 ± 0.15 | 0.0–4.0 | 1.50 ± 0.25 | 0.0–4.0 | 0.85 ± 0.15 | 0.0–2.8 |
| Total ammonia nitrogen (ppm) | 0.60 ± 0.10 | 0.0–3.7 | 0.33 ± 0.05 | 0.0–1.3 | 0.88 ± 0.19 | 0.0–3.7 |
| Nitrite (ppm) | 0.07 ± 0.02 | 0.0–1.0 | 0.04 ± 0.02 | 0.0–0.5 | 0.11 ± 0.04 | 0.0–1.0 |
| Nitrate (ppm) | 0.25 ± 0.06 | 0.0–1.0 | 0.20 ± 0.07 | 0.0–1.0 | 0.30 ± 0.09 | 0.0–1.0 |
| Soil Parameter | Overall | Farm A | Farm B | Farm A versus Farm B | |||||
|---|---|---|---|---|---|---|---|---|---|
| Mean ± SE | Min–Max | Mean ± SE | Min–Max | Mean ± SE | Min–Max | t(2) | p-Value | n/Farm | |
| Alkalinity (% CaCO3 Equivalence) | 13.23 ± 9.36 | 0.70–41.00 | 20.85 ± 20.15 | 0.70–41.00 | 5.60 ± 1.70 | 3.90–7.30 | 0.75 | 0.5295 | 29 |
| Aluminum (ppm) | 246.80 ± 141.25 | 8.20–648.00 | 328.10 ± 319.90 | 8.20–648.00 | 165.50 ± 64.50 | 101.00–230.00 | 0.50 | 0.6677 | 65 |
| Calcium (×1000 ppm) | 12.49 ± 2.50 | 5.32–16.91 | 9.67 ± 4.36 | 5.32–14.03 | 15.31 ± 1.60 | 13.71–16.91 | 1.21 | 0.3486 | 12 |
| CEC (meq/100 g) | 0.65 ± 0.13 | 0.29–0.86 | 0.50 ± 0.22 | 0.29–0.72 | 0.79 ± 0.08 | 0.71–0.86 | 1.25 | 0.3363 | 12 |
| Copper (ppm) | 5.90 ± 4.71 | 0.60–20.00 | 0.90 ± 0.30 | 0.60–1.20 | 10.90 ± 9.10 | 1.80–20.00 | 1.10 | 0.4699 | 15 |
| Iron (ppm) | 78.00 ± 36.40 | 32.00–186.00 | 111.50 ± 74.50 | 37.00–186.00 | 44.50 ± 12.50 | 32.00–57.00 | 0.89 | 0.4687 | 21 |
| Magnesium (ppm) | 75.00 ± 24.82 | 30.00–143.00 | 54.50 ± 24.50 | 30.00–79.00 | 95.50 ± 47.50 | 48.00–143.00 | 0.77 | 0.5232 | 28 |
| Manganese (ppm) | 67.25 ± 33.30 | 10.00–149.00 | 13.00 ± 3.00 | 10.00–16.00 | 121.50 ± 27.50 | 94.00–149.00 | 3.92 | 0.0593 | 3 |
| Organic Matter (%) | 3.03 ± 0.99 | 1.20–5.70 | 1.55 ± 0.35 | 1.20–1.90 | 4.50 ± 1.20 | 3.30–5.70 | 2.36 | 0.1422 | 5 |
| pH | 7.03 ± 0.69 | 5.03–7.94 | 6.13 ± 1.10 | 5.03–7.23 | 7.93 ± 0.01 | 7.92–7.94 | 1.64 | 0.3492 | 7 |
| Phosphorus (ppm) | 6.98 ± 5.72 | 0.10–24.00 | 0.25 ± 0.15 | 0.10–0.40 | 13.70 ± 10.30 | 3.40–24.00 | 1.31 | 0.4160 | 11 |
| Potassium (ppm) | 157.25 ± 64.12 | 50.00–343.00 | 89.50 ± 39.50 | 50.00–129.00 | 225.00 ± 118.00 | 107.00–343.00 | 1.09 | 0.3899 | 15 |
| Sodium (ppm) | 189.50 ± 22.63 | 151.00–250.00 | 174.50 ± 23.50 | 151.00–198.00 | 204.50 ± 45.50 | 159.00–250.00 | 0.59 | 0.6173 | 47 |
| Zinc (ppm) | 2.85 ± 1.61 | 0.70–7.50 | 1.60 ± 0.90 | 0.70–2.50 | 4.10 ± 3.40 | 0.70–7.50 | 0.71 | 0.5509 | 33 |
| Variable | ρ | p-Value | n/Farm | |
|---|---|---|---|---|
| Raw | FDR | |||
| Alkalinity (% CaCO3 equivalence) | 0.13 | 0.2318 | 0.3327 | 487 |
| Aluminum (ppm) | −0.13 | 0.2318 | 0.3327 | 487 |
| Calcium (ppm) | 0.12 | 0.2570 | 0.3327 | 542 |
| CEC (meq 100 g−1) | 0.12 | 0.2570 | 0.3327 | 542 |
| Copper (ppm) | 0.19 | 0.0740 | 0.3327 | 219 |
| Iron (ppm) | −0.12 | 0.2570 | 0.3327 | 542 |
| Magnesium (ppm) | 0.17 | 0.1075 | 0.3327 | 269 |
| Manganese (ppm) | 0.11 | 0.3089 | 0.3327 | 672 |
| Organic matter (%) | 0.11 | 0.3089 | 0.3327 | 672 |
| pH | 0.16 | 0.1219 | 0.3327 | 291 |
| Phosphorus (ppm) | 0.11 | 0.3089 | 0.3327 | 672 |
| Potassium (ppm) | 0.17 | 0.1075 | 0.3327 | 269 |
| Sodium (ppm) | −0.03 | 0.7657 | 0.7657 | 7823 |
| Zinc (ppm) | 0.13 | 0.2272 | 0.3327 | 478 |
Disclaimer/Publisher’s Note: The statements, opinions and data contained in all publications are solely those of the individual author(s) and contributor(s) and not of MDPI and/or the editor(s). MDPI and/or the editor(s) disclaim responsibility for any injury to people or property resulting from any ideas, methods, instructions or products referred to in the content. |
© 2023 by the authors. Licensee MDPI, Basel, Switzerland. This article is an open access article distributed under the terms and conditions of the Creative Commons Attribution (CC BY) license (https://creativecommons.org/licenses/by/4.0/).
Share and Cite
Tuttle, J.T.; Bruce, T.J.; Abdelrahman, H.A.; Roy, L.A.; Butts, I.A.E.; Beck, B.H.; Kelly, A.M. Persistence of a Wild-Type Virulent Aeromonas hydrophila Isolate in Pond Sediments from Commercial Catfish Ponds: A Laboratory Study. Vet. Sci. 2023, 10, 236. https://doi.org/10.3390/vetsci10030236
Tuttle JT, Bruce TJ, Abdelrahman HA, Roy LA, Butts IAE, Beck BH, Kelly AM. Persistence of a Wild-Type Virulent Aeromonas hydrophila Isolate in Pond Sediments from Commercial Catfish Ponds: A Laboratory Study. Veterinary Sciences. 2023; 10(3):236. https://doi.org/10.3390/vetsci10030236
Chicago/Turabian StyleTuttle, James T., Timothy J. Bruce, Hisham A. Abdelrahman, Luke A. Roy, Ian A. E. Butts, Benjamin H. Beck, and Anita M. Kelly. 2023. "Persistence of a Wild-Type Virulent Aeromonas hydrophila Isolate in Pond Sediments from Commercial Catfish Ponds: A Laboratory Study" Veterinary Sciences 10, no. 3: 236. https://doi.org/10.3390/vetsci10030236