
Unmanned Aerial Vehicle (UAV) and Spectral Datasets in South Africa for Precision Agriculture

 , , , and
Abstract
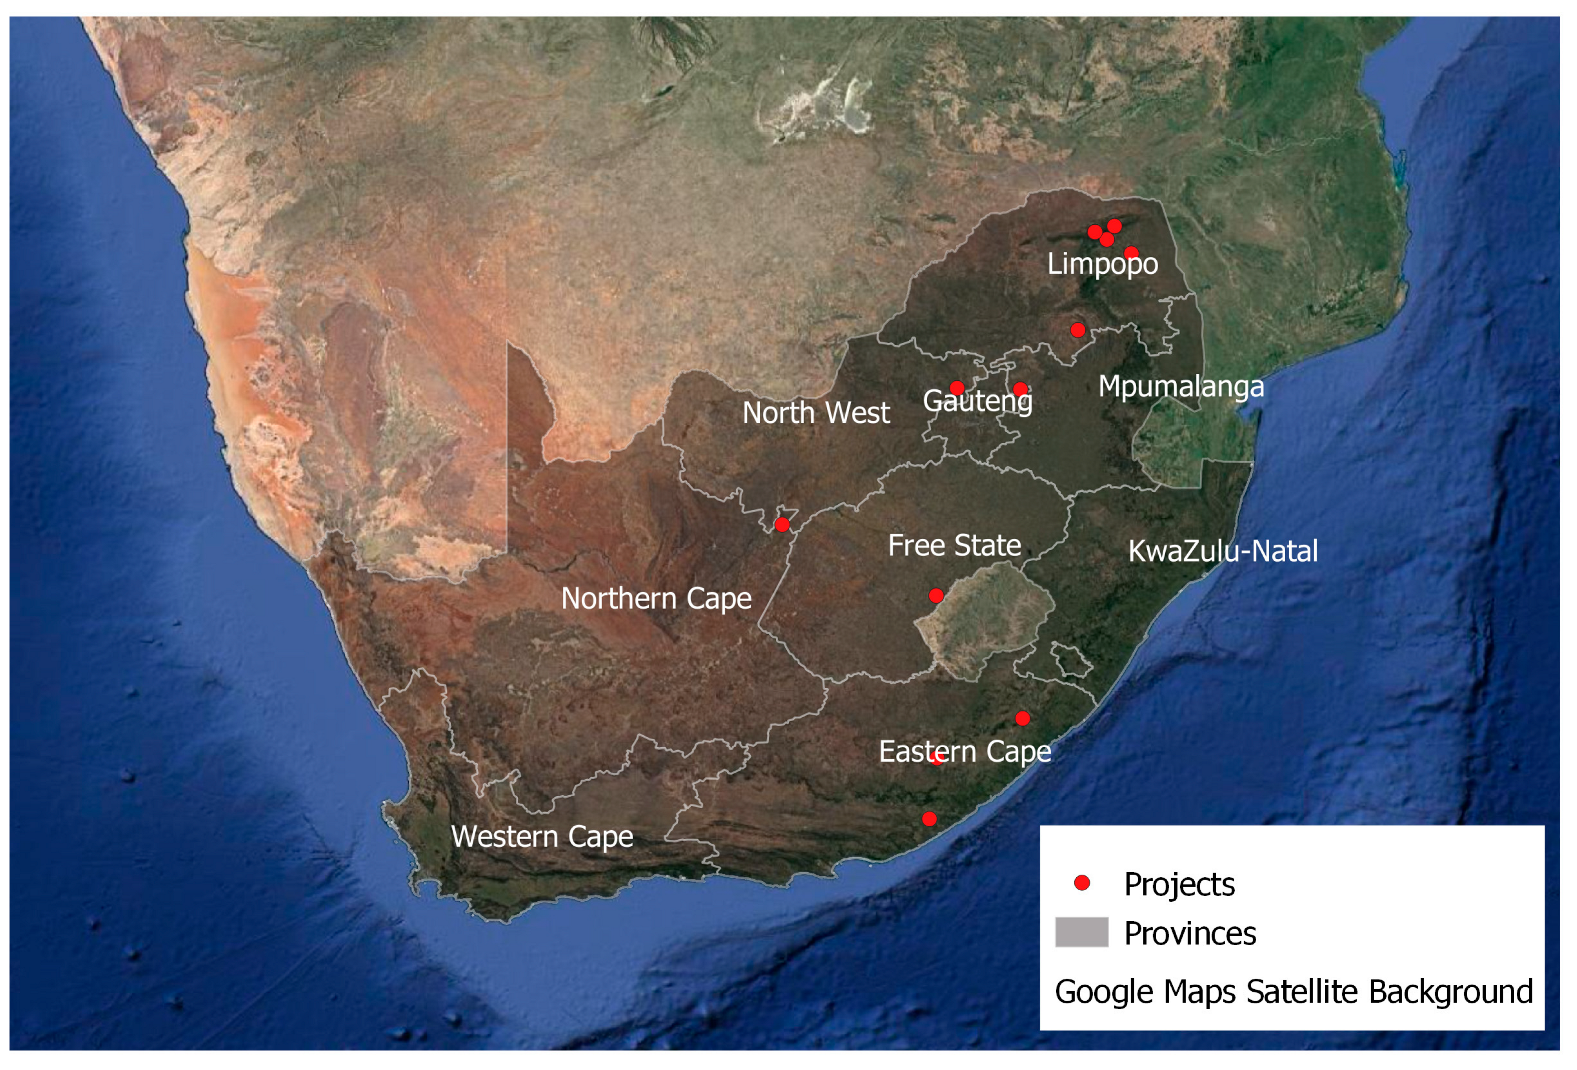
:1. Summary
2. Data Description
3. Methods
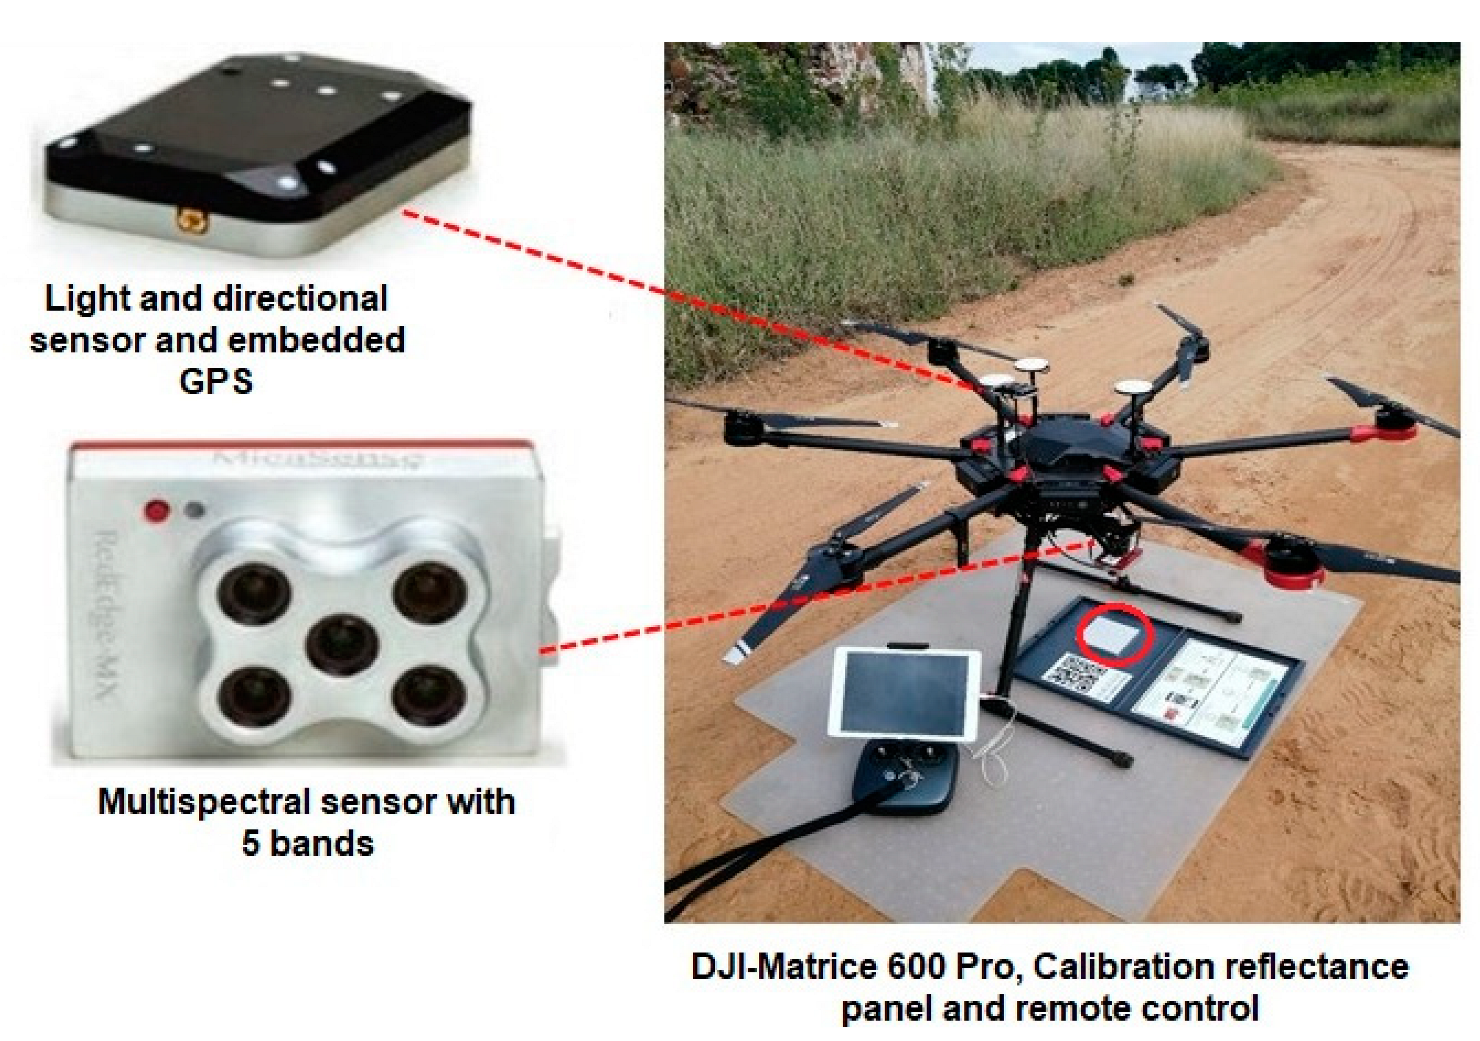
3.1. Unmanned Aerial Vehicle (UAV)
3.1.1. Data Collection
3.1.2. Pre-Processing
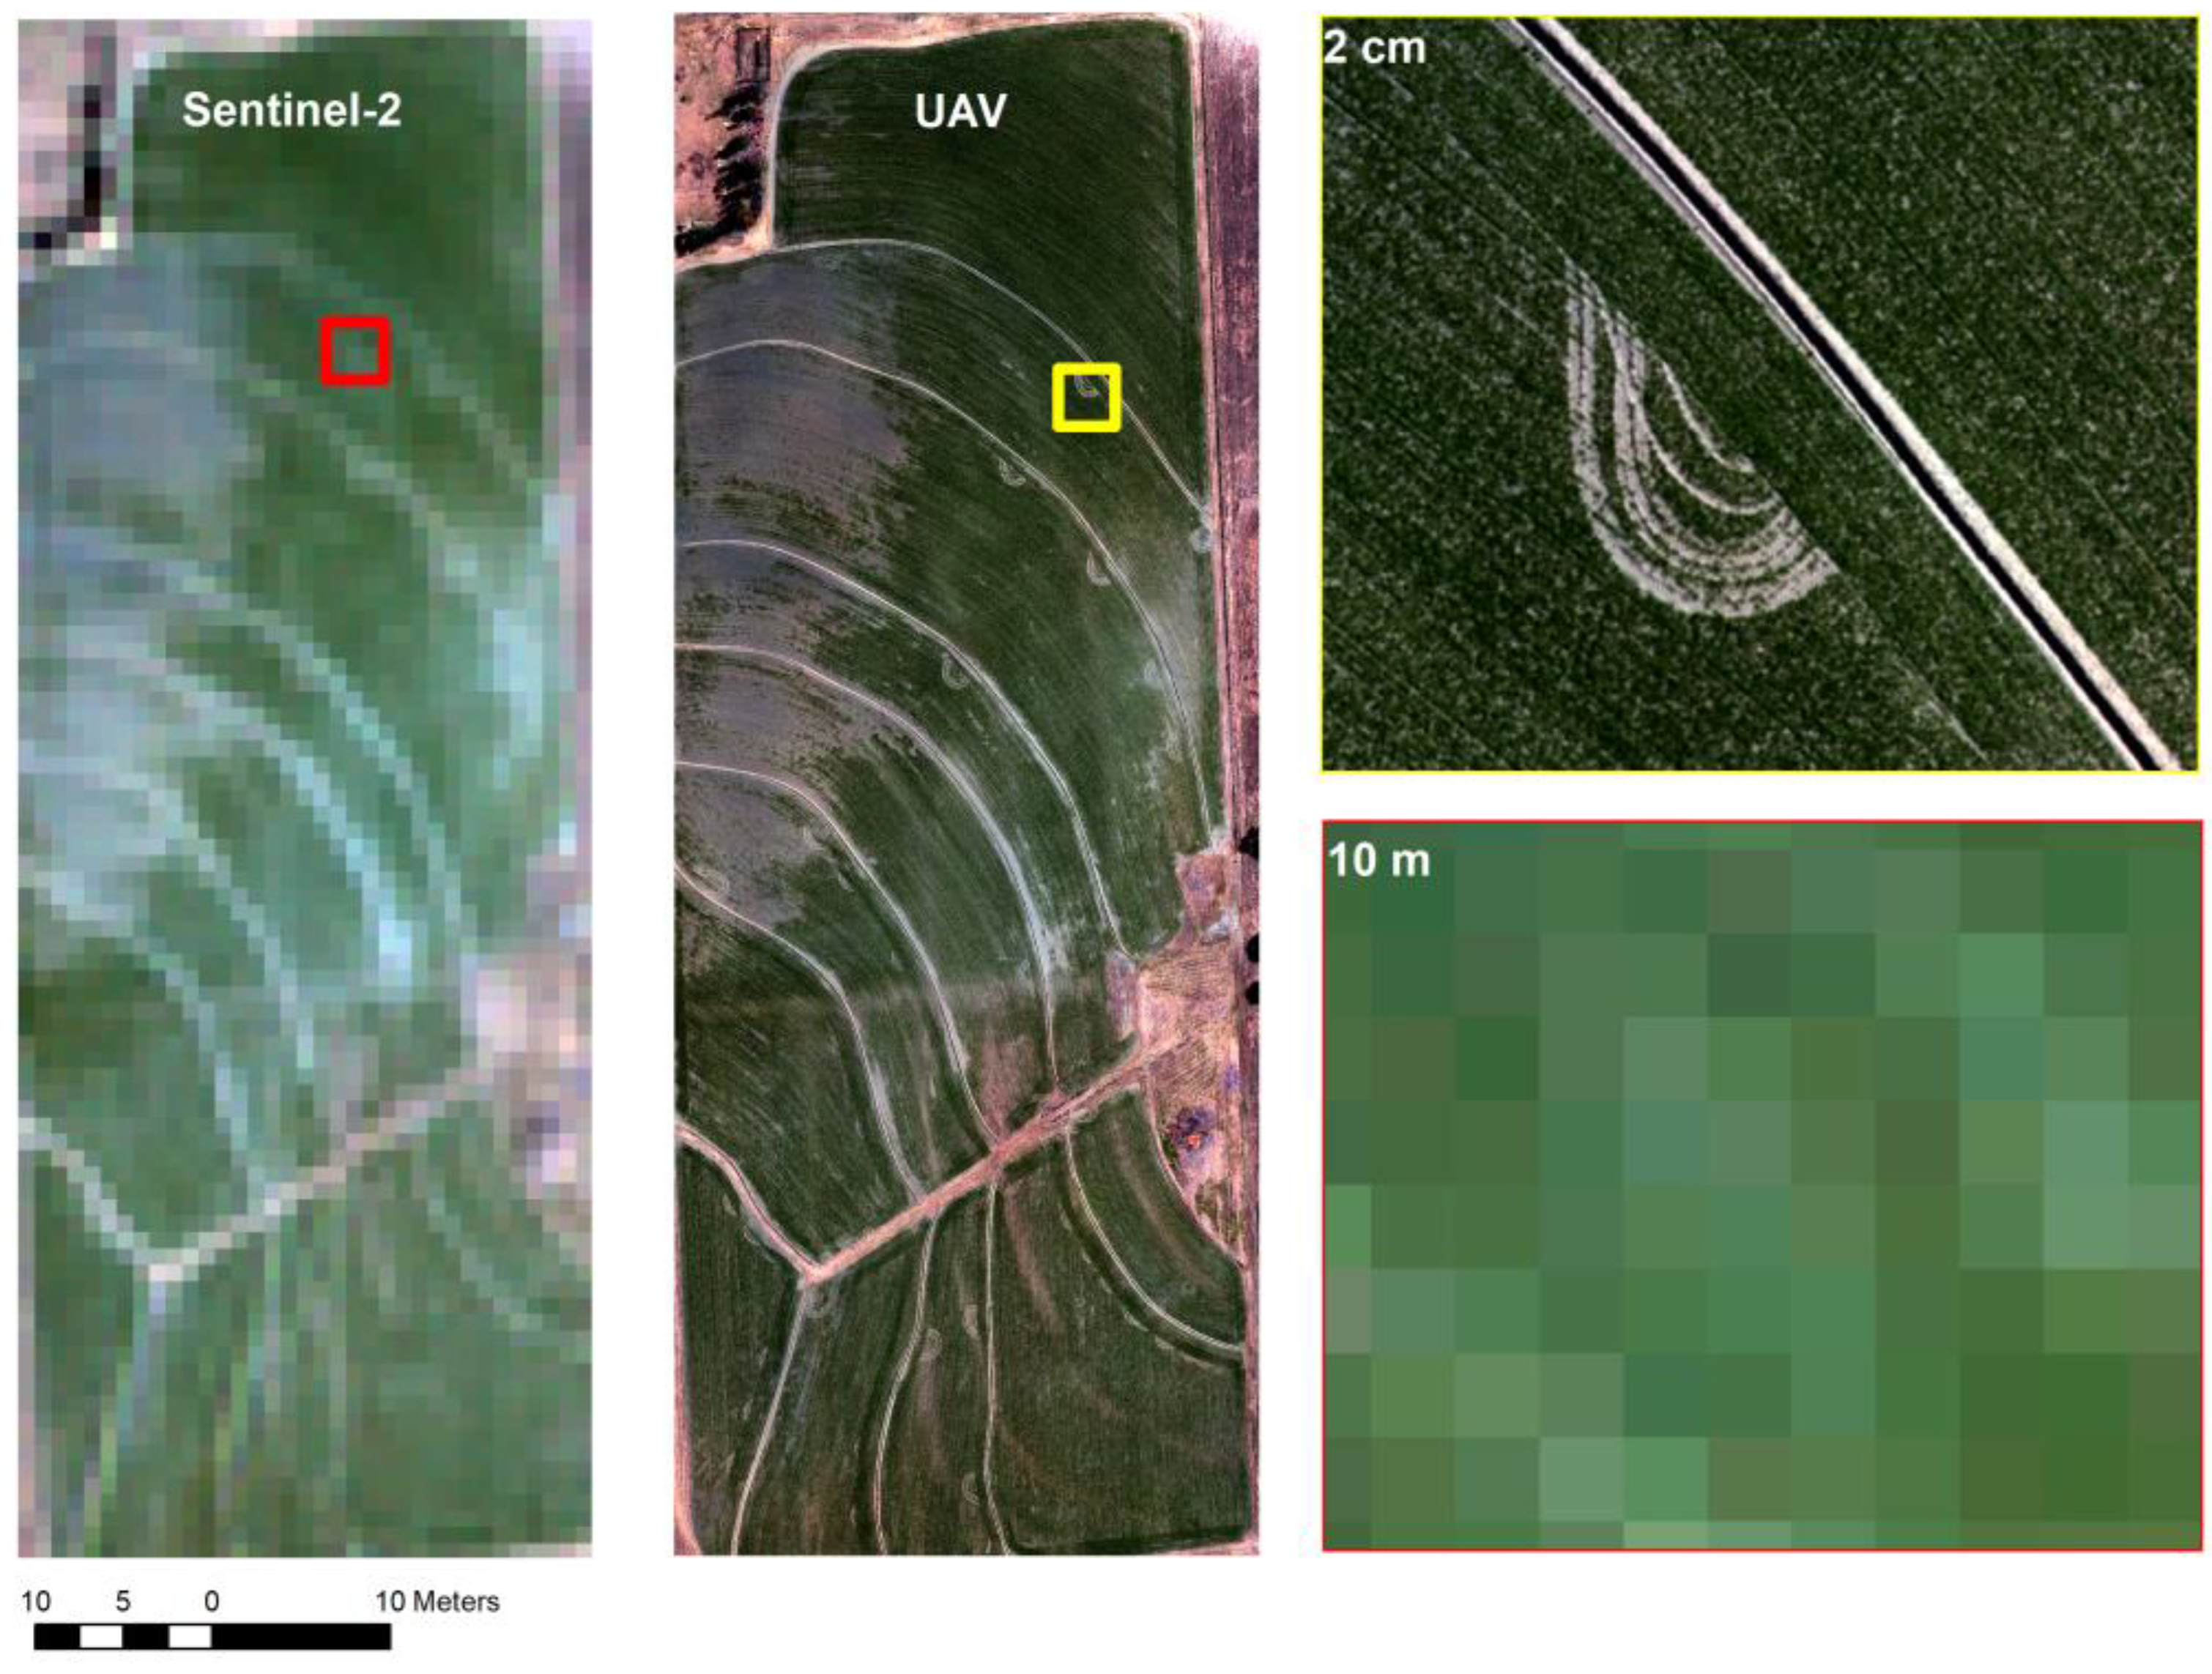
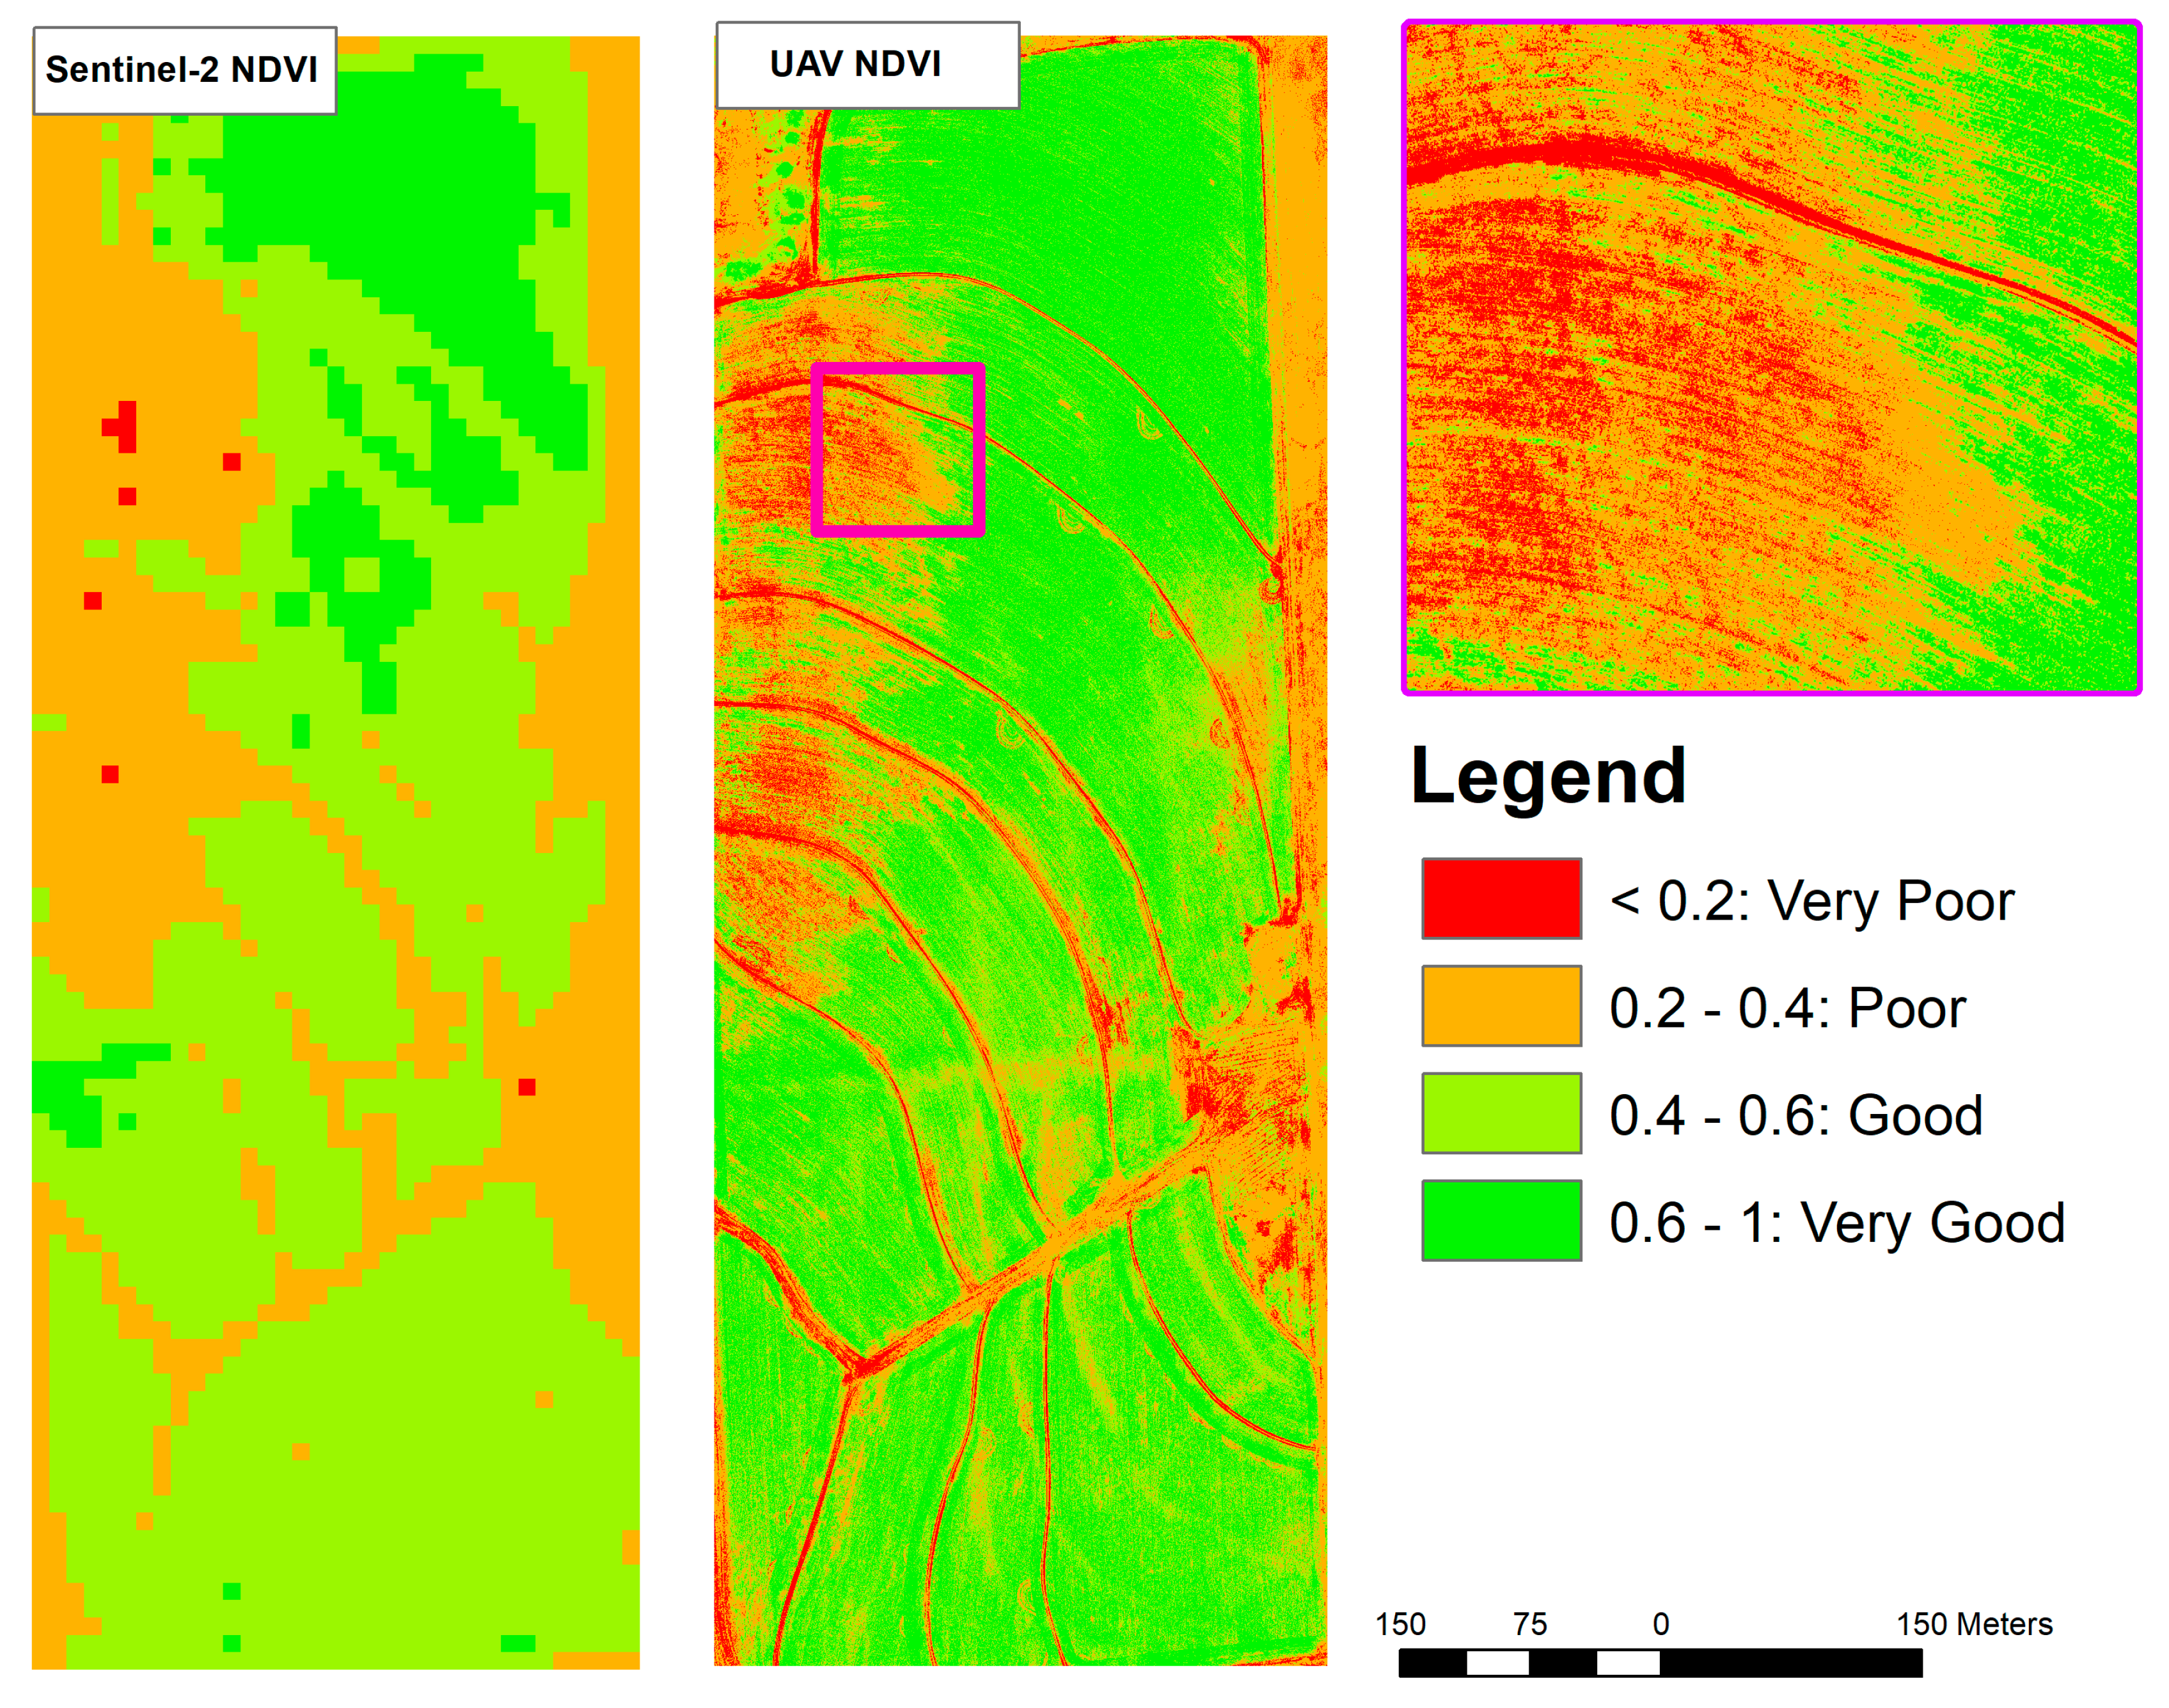
3.1.3. Example of Results
3.2. Spectroradiometer Data
3.2.1. Data Collection
3.2.2. Pre-Processing
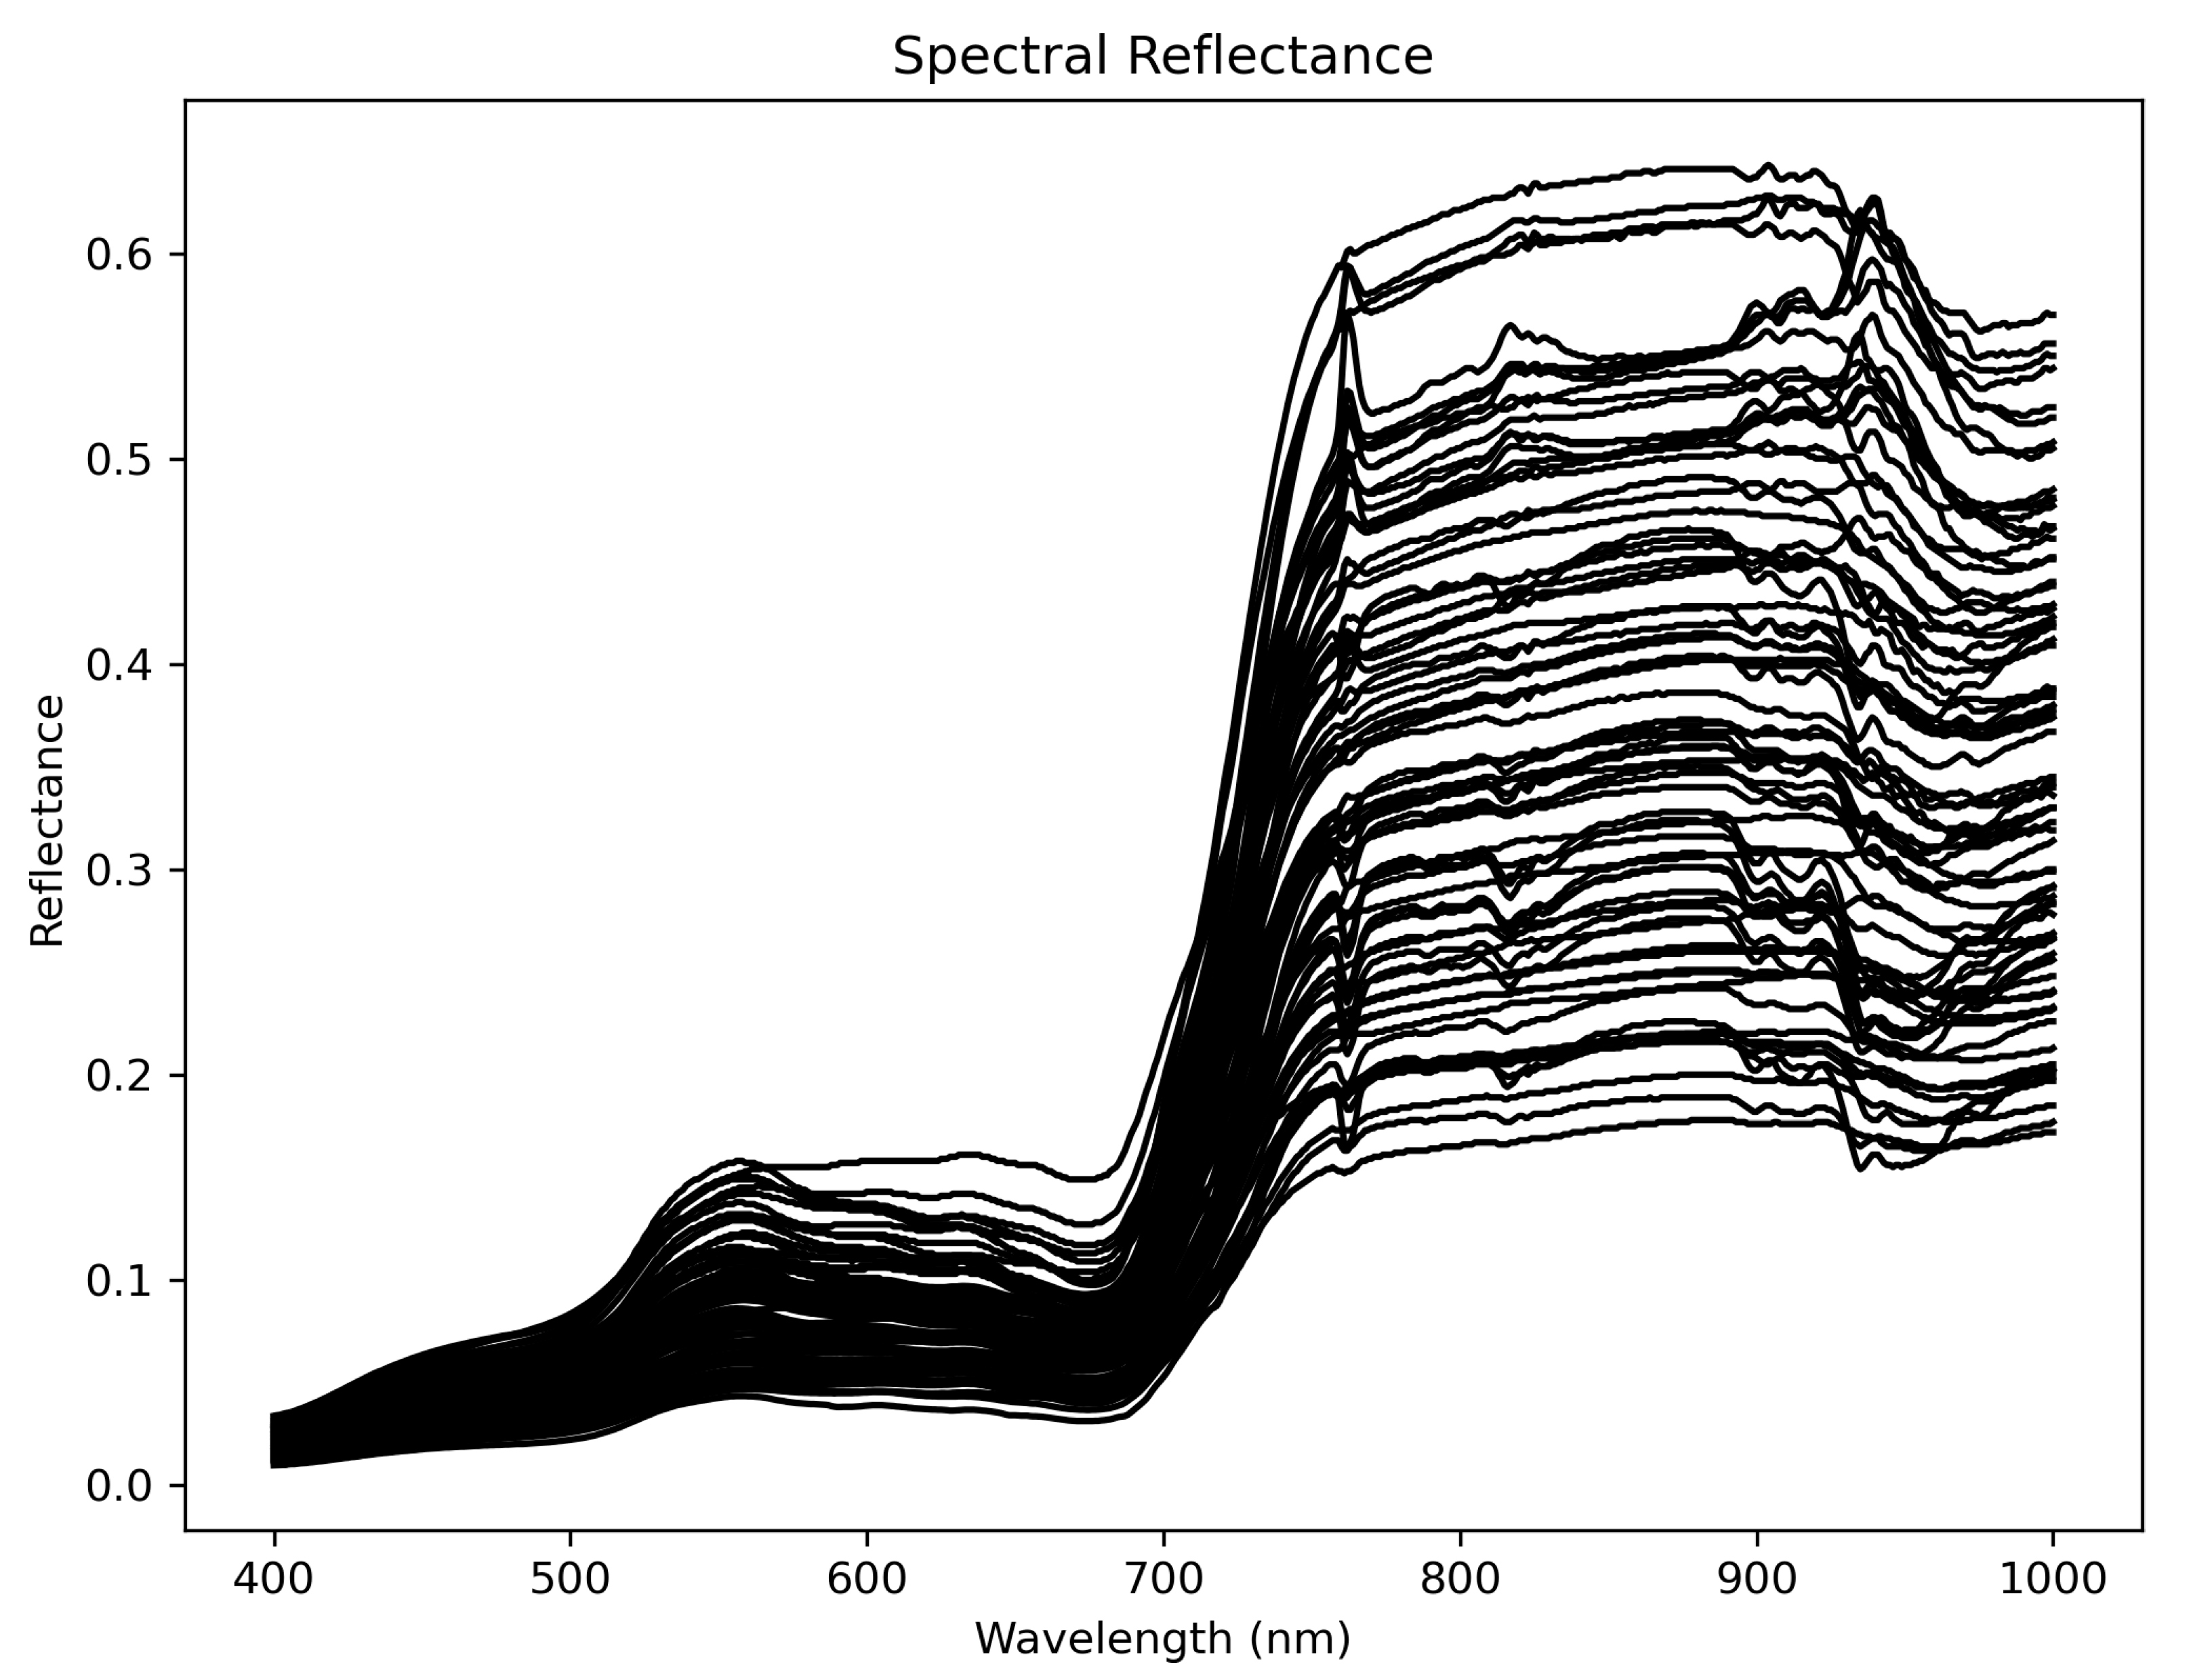
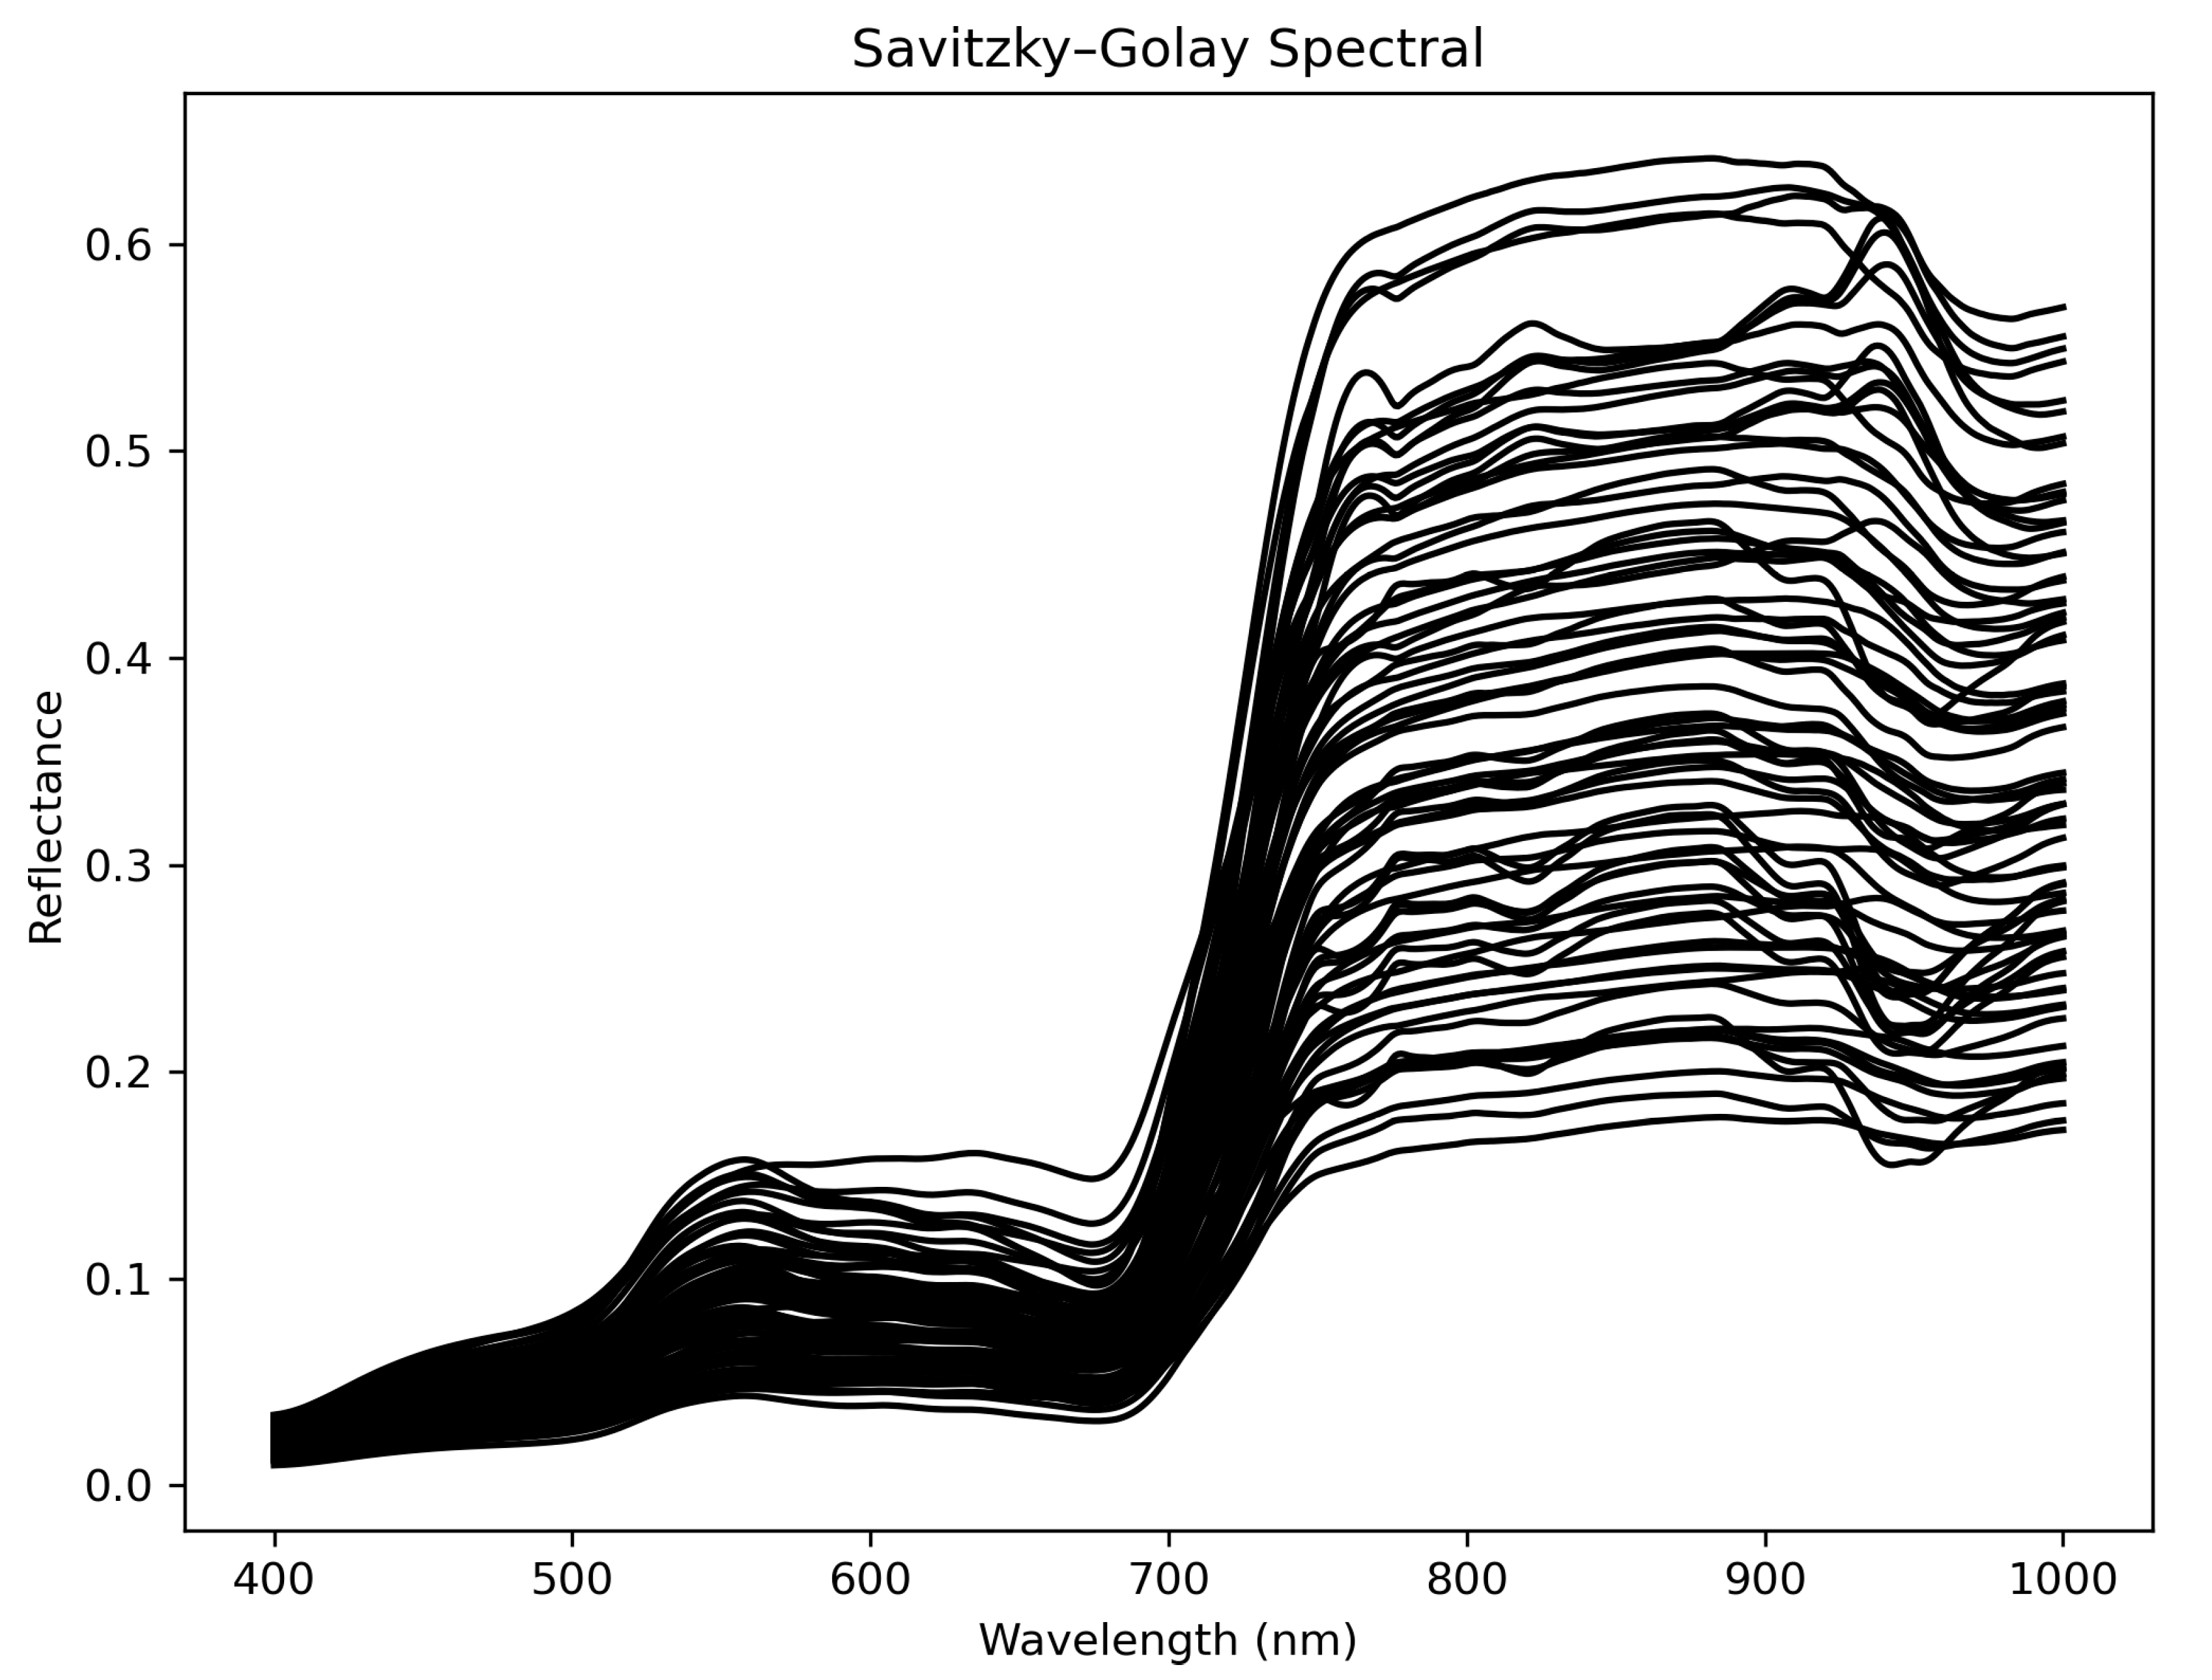
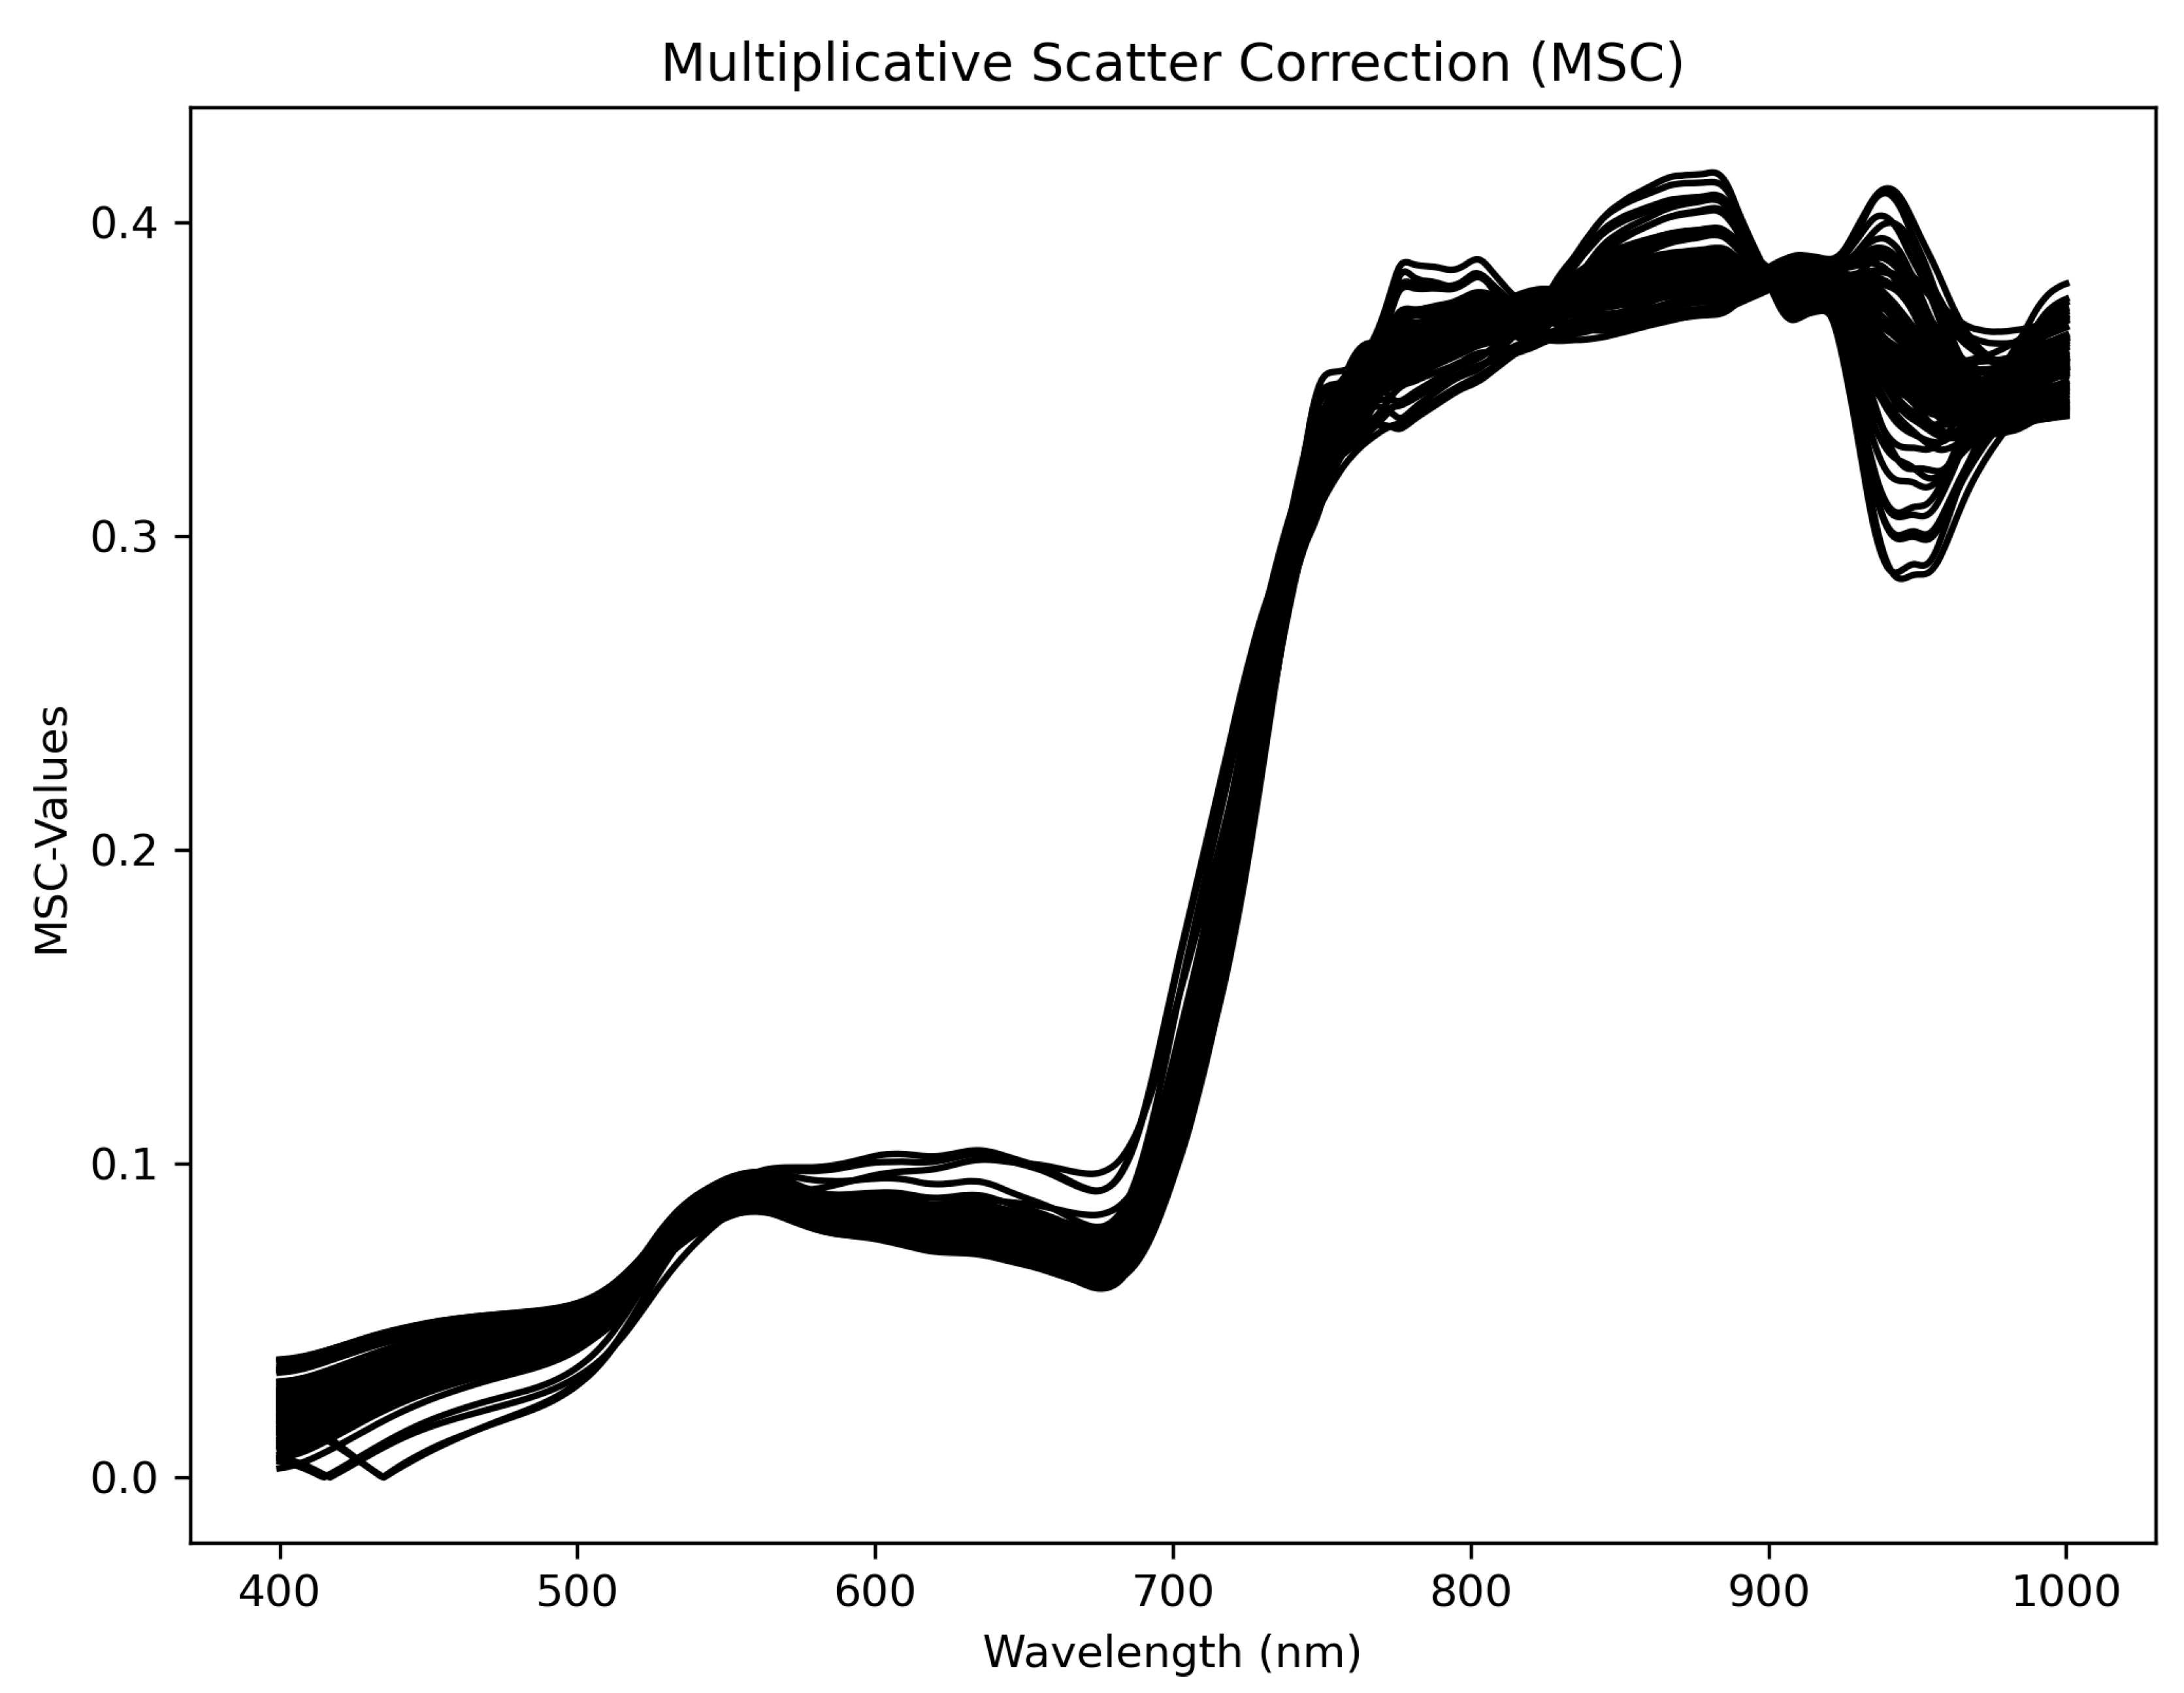
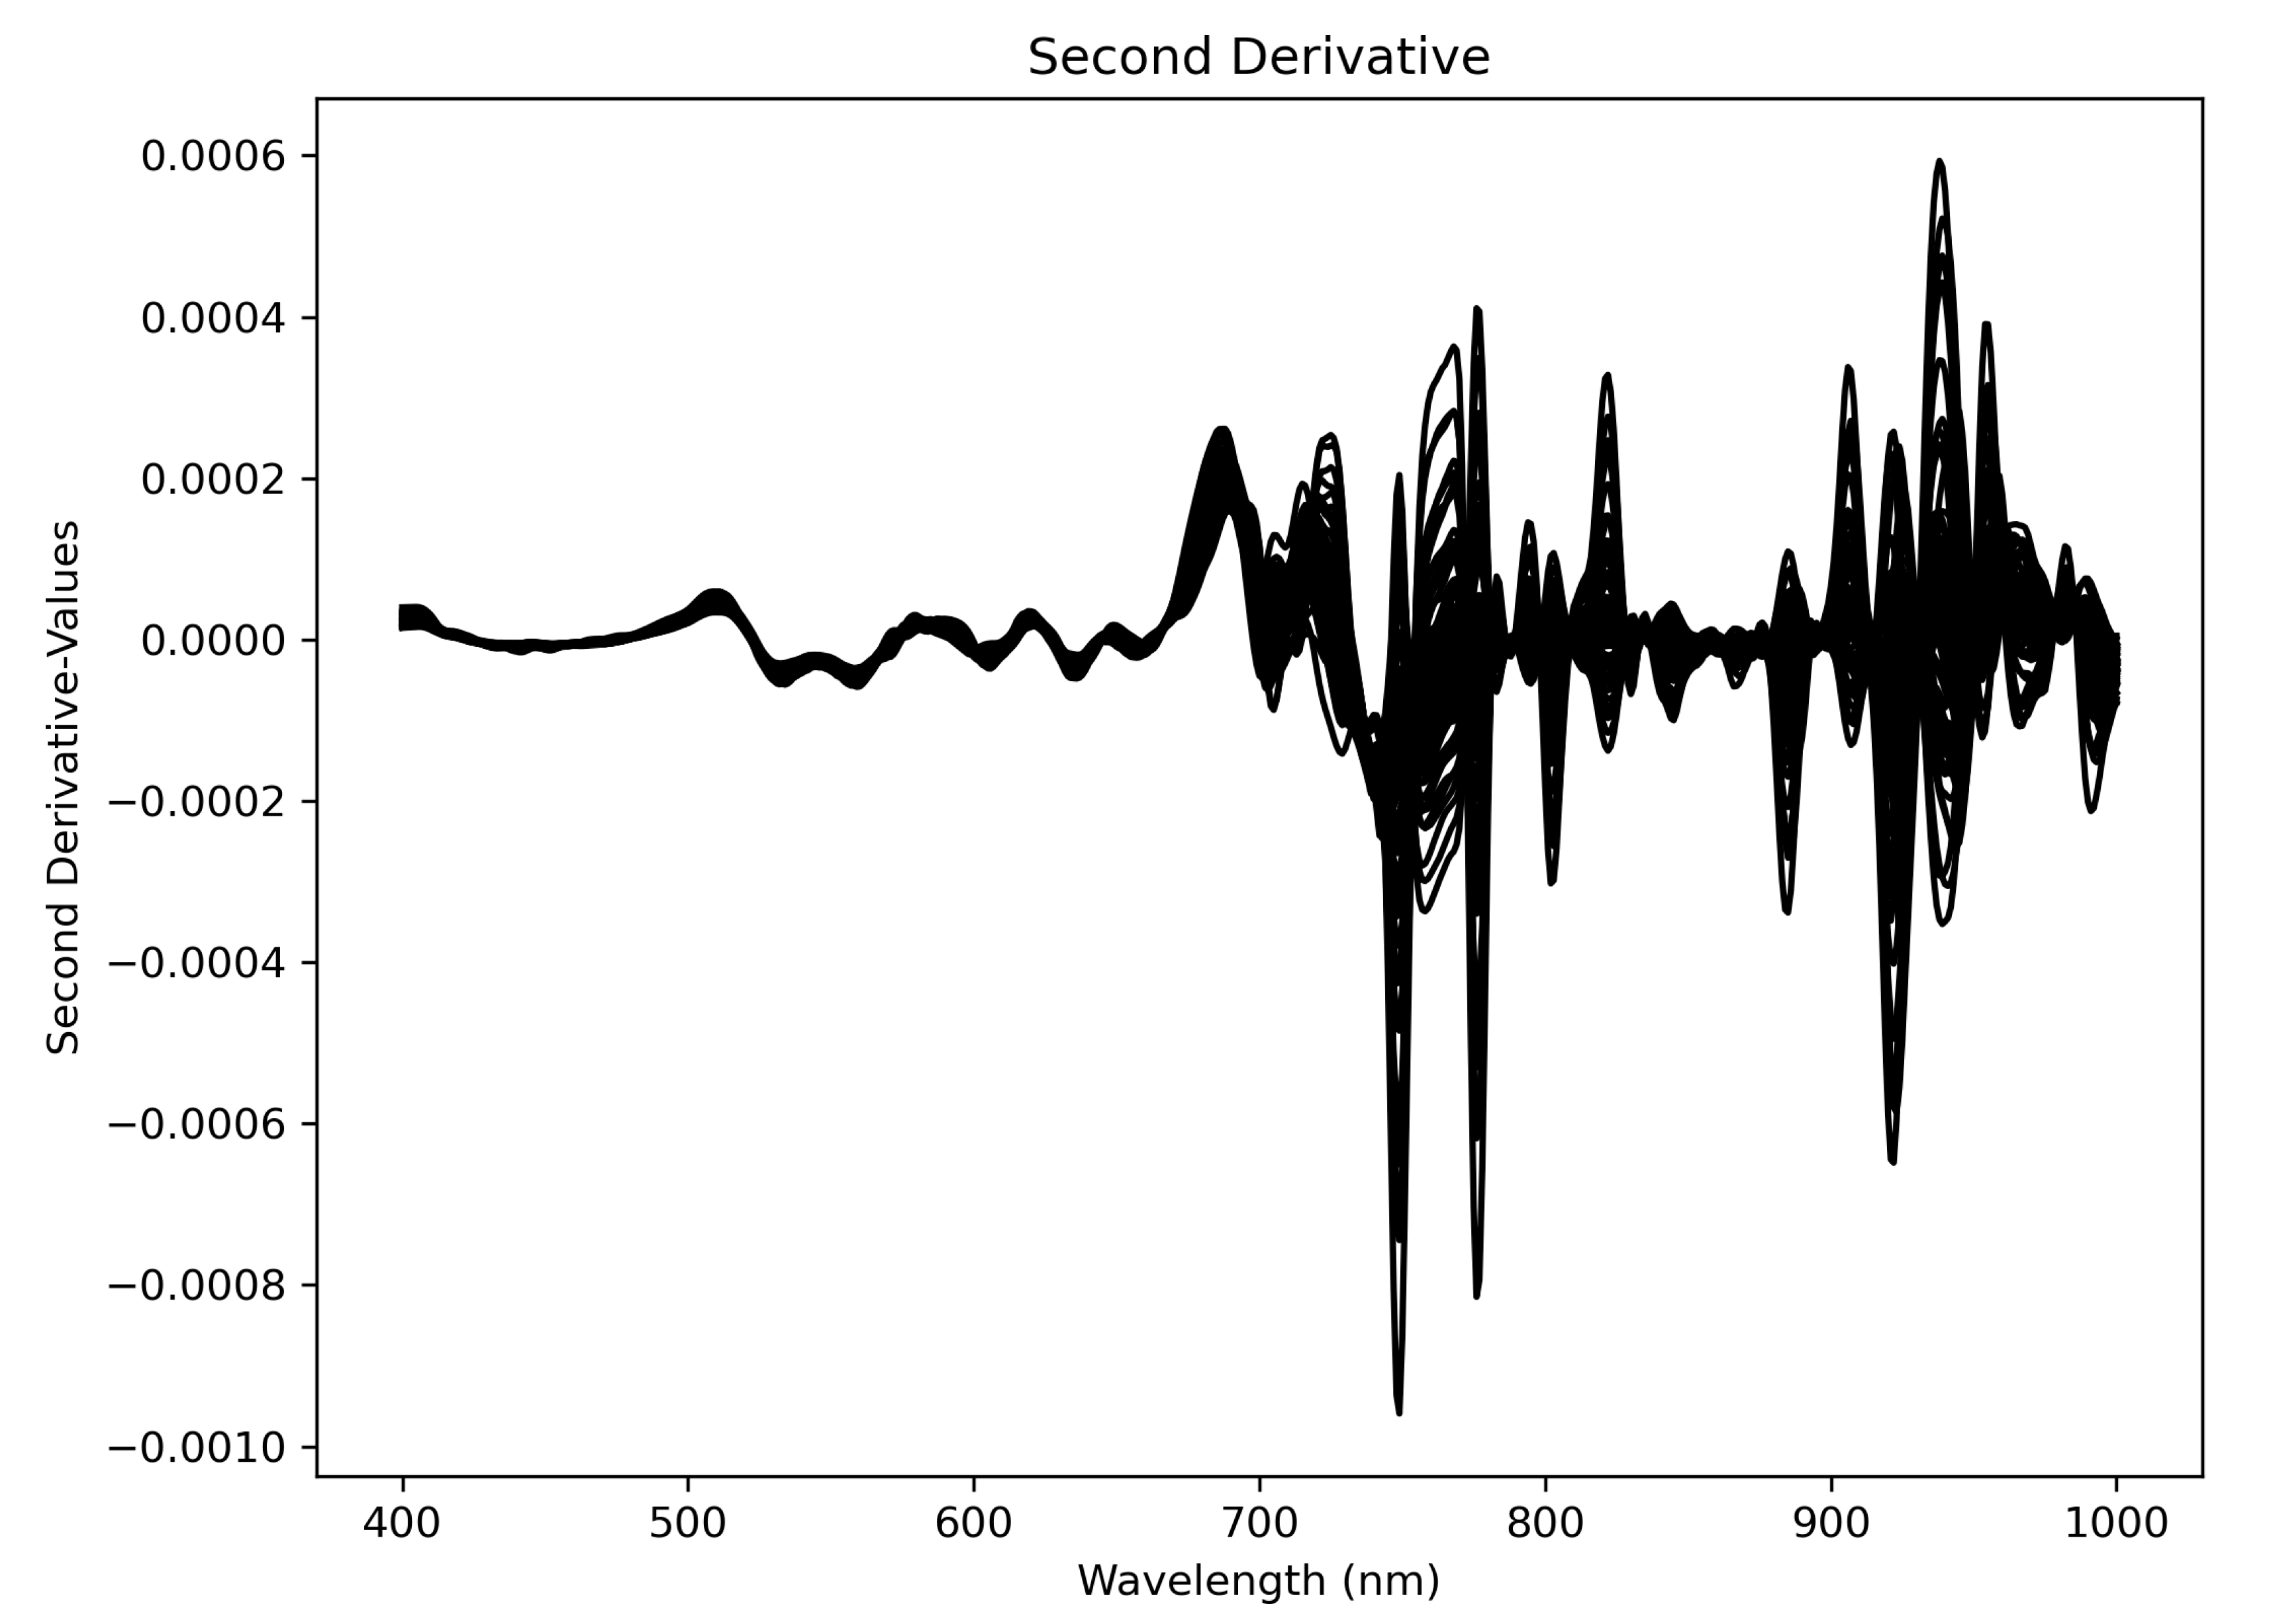
3.2.3. Example of Results
3.2.4. Scientific Importance and Use of UAVs for Precision Agriculture and Natural Resources
3.2.5. Challenges in Developing UAV and Spectral Databases in South Africa
3.2.6. Data Availability
- ARC-Natural Resources and Engineering
- Tel.: +27-(0)12-310-2500
- Fax: +27-(0)12-323-1157
- E-mail: munghemezuluc@arc.agric.za
- Physical address: 600 Belvedere Street, Arcadia, Pretoria, South Africa
- Postal address: Private Bag X79, Pretoria, 0001
- GPS coordinates: 25°44′19.4″ S, 28°12′26.4″ E
4. Conclusions and Recommendations
Author Contributions
Funding
Institutional Review Board Statement
Informed Consent Statement
Data Availability Statement
Acknowledgments
Conflicts of Interest
References
- Brisco, B.; Brown, R.J.; Hirose, T.; McNairn, H.; Staenz, K. Precision Agriculture and the Role of Remote Sensing: A Review. Can. J. Remote Sens. 1998, 24, 315–327. [Google Scholar] [CrossRef]
- Maes, W.H.; Steppe, K. Perspectives for Remote Sensing with Unmanned Aerial Vehicles in Precision Agriculture. Trends Plant Sci. 2019, 24, 152–164. [Google Scholar] [CrossRef] [PubMed]
- Sishodia, R.P.; Ray, R.L.; Singh, S.K. Applications of Remote Sensing in Precision Agriculture: A Review. Remote Sens. 2020, 12, 3136. [Google Scholar] [CrossRef]
- Wang, G.; Weng, Q. (Eds.) Remote Sensing of Natural Resources; CRC Press: Boca Raton, FL, USA, 2014. [Google Scholar]
- Landsat 9|U.S. Geological Survey. Available online: https://www.usgs.gov/landsat-missions/landsat-9 (accessed on 20 March 2023).
- Open Access Hub. Available online: https://scihub.copernicus.eu/ (accessed on 20 March 2023).
- Ramoelo, A.; Majozi, N.; Mathieu, R.; Jovanovic, N.; Nickless, A.; Dzikiti, S. Validation of Global Evapotranspiration Product (MOD16) Using Flux Tower Data in the African Savanna, South Africa. Remote Sens. 2014, 6, 7406–7423. [Google Scholar] [CrossRef]
- Li, R. Potential of high-resolution satellite imagery for national mapping products. Photogramm. Eng. Remote Sens. 1998, 64, 1165–1170. [Google Scholar]
- Nduku, L.; Munghemezulu, C.; Mashaba-Munghemezulu, Z.; Kalumba, A.M.; Chirima, G.J.; Masiza, W.; De Villiers, C. Global Research Trends for Unmanned Aerial Vehicle Remote Sensing Application in Wheat Crop Monitoring. Geomatics 2023, 3, 115–136. [Google Scholar] [CrossRef]
- Gonzalez, L.; Montes, G.; Puig, E.; Johnson, S.; Mengersen, K.; Gaston, K. Unmanned Aerial Vehicles (UAVs) and Artificial Intelligence Revolutionizing Wildlife Monitoring and Conservation. Sensors 2016, 16, 97. [Google Scholar] [CrossRef]
- Dronova, I.; Kislik, C.; Dinh, Z.; Kelly, M. A Review of Unoccupied Aerial Vehicle Use in Wetland Applications: Emerging Opportunities in Approach, Technology, and Data. Drones 2021, 5, 45. [Google Scholar] [CrossRef]
- Feng, Q.; Liu, J.; Gong, J. UAV Remote Sensing for Urban Vegetation Mapping Using Random Forest and Texture Analysis. Remote Sens. 2015, 7, 1074–1094. [Google Scholar] [CrossRef]
- Akar, Ö. Mapping Land Use with Using Rotation Forest Algorithm from UAV Images. Eur. J. Remote Sens. 2017, 50, 269–279. [Google Scholar] [CrossRef]
- Tian, Z.; Haas, Z.J.; Shinde, S. Routing in Solar-Powered UAV Delivery System. Drones 2022, 6, 282. [Google Scholar] [CrossRef]
- Nex, F.; Remondino, F. UAV for 3D Mapping Applications: A Review. Appl. Geomat. 2014, 6, 1–15. [Google Scholar] [CrossRef]
- PIX4Dmapper: Professional Photogrammetry Software for Drone Mapping. Available online: https://www.pix4d.com/product/pix4dmapper-photogrammetry-software (accessed on 20 March 2023).
- Su, J.; Yi, D.; Coombes, M.; Liu, C.; Zhai, X.; McDonald-Maier, K.; Chen, W.-H. Spectral Analysis and Mapping of Blackgrass Weed by Leveraging Machine Learning and UAV Multispectral Imagery. Comput. Electron. Agric. 2022, 192, 106621. [Google Scholar] [CrossRef]
- Dimyati, M.; Supriatna, S.; Nagasawa, R.; Pamungkas, F.D.; Pramayuda, R. A Comparison of Several UAV-Based Multispectral Imageries in Monitoring Rice Paddy (A Case Study in Paddy Fields in Tottori Prefecture, Japan). IJGI 2023, 12, 36. [Google Scholar] [CrossRef]
- Song, Y.; Lee, H.; Kang, D.; Kim, B.; Park, M. A Study on the Determination Methods of Monitoring Point for Inundation Damage in Urban Area Using UAV and Hydrological Modeling. Water 2022, 14, 1117. [Google Scholar] [CrossRef]
- Chaudhry, M.H.; Ahmad, A.; Gulzar, Q.; Farid, M.S.; Shahabi, H.; Al-Ansari, N. Assessment of DSM Based on Radiometric Transformation of UAV Data. Sensors 2021, 21, 1649. [Google Scholar] [CrossRef]
- Clevers, J.G.P.W.; Kooistra, L.; Schaepman, M.E. Estimating Canopy Water Content Using Hyperspectral Remote Sensing Data. Int. J. Appl. Earth Obs. Geoinf. 2010, 12, 119–125. [Google Scholar] [CrossRef]
- Torres-Madronero, M.C.; Goez, M.; Guzman, M.A.; Rondon, T.; Carmona, P.; Acevedo-Correa, C.; Gomez-Ortega, S.; Durango-Flórez, M.; López, S.V.; Galeano, J.; et al. Spectral Library of Maize Leaves under Nitrogen Deficiency Stress. Data 2022, 8, 2. [Google Scholar] [CrossRef]
- Elmer, K.; Soffer, R.J.; Arroyo-Mora, J.P.; Kalacska, M. ASDToolkit: A Novel MATLAB Processing Toolbox for ASD Field Spectroscopy Data. Data 2020, 5, 96. [Google Scholar] [CrossRef]
- Milton, E.J. Review Article Principles of Field Spectroscopy. Int. J. Remote Sens. 1987, 8, 1807–1827. [Google Scholar] [CrossRef]
- Candiago, S.; Remondino, F.; De Giglio, M.; Dubbini, M.; Gattelli, M. Evaluating Multispectral Images and Vegetation Indices for Precision Farming Applications from UAV Images. Remote Sens. 2015, 7, 4026–4047. [Google Scholar] [CrossRef]
- Houborg, R.; McCabe, M. High-Resolution NDVI from Planet’s Constellation of Earth Observing Nano-Satellites: A New Data Source for Precision Agriculture. Remote Sens. 2016, 8, 768. [Google Scholar] [CrossRef]
- Rouse, J.W.; Haas, R.H.; Schell, J.A.; Deering, D.W. Monitoring vegetation systems in the Great Plains with ERTS. In Proceedings of the Third ERTS Symposium, Washington, DC, USA, 10–14 December 1973. [Google Scholar]
- Mangewa, L.J.; Ndakidemi, P.A.; Alward, R.D.; Kija, H.K.; Bukombe, J.K.; Nasolwa, E.R.; Munishi, L.K. Comparative Assessment of UAV and Sentinel-2 NDVI and GNDVI for Preliminary Diagnosis of Habitat Conditions in Burunge Wildlife Management Area, Tanzania. Earth 2022, 3, 769–787. [Google Scholar] [CrossRef]
- Main-Knorn, M.; Pflug, B.; Louis, J.; Debaecker, V.; Müller-Wilm, U.; Gascon, F. Sen2Cor for Sentinel-2. In Image and Signal Processing for Remote Sensing XXIII; SPIE: Bellingham, DC, USA, 2017. [Google Scholar]
- Specifications Concerning Names, Designations, and Nomenclature for Astronomical Radiation Sources Outside the Solar System. Space Sci. Rev. 1992, 61, 437–440. [CrossRef]
- Pleijel, H.; Danielsson, H.; Emberson, L.; Ashmore, M.R.; Mills, G. Ozone risk assessment for agricultural crops in Europe: Further development of stomatal flux and flux–response relationships for European wheat and potato. Atmos. Environ. 2007, 41, 3022–3040. [Google Scholar] [CrossRef]
- Savitzky, A.; Golay, M.J. Smoothing and differentiation of data by simplified least squares procedures. Anal. Chem. 1964, 36, 1627–1639. [Google Scholar] [CrossRef]
- Chen, J.; Jönsson, P.; Tamura, M.; Gu, Z.; Matsushita, B.; Eklundh, L. A Simple Method for Reconstructing a High-Quality NDVI Time-Series Data Set Based on the Savitzky–Golay Filter. Remote Sens. Environ. 2004, 91, 332–344. [Google Scholar] [CrossRef]
- Martens, H.; Jensen, S.A.; Geladi, P. Multivariate linearity transformation for near-infrared reflectance spectrometry. In Proceedings of the Nordic Symposium on Applied Statistics, Stokkand Forlag Publ., Stavanger, Norway, 17–19 June 1983. [Google Scholar]
- Isaksson, T.; Næs, T. The Effect of Multiplicative Scatter Correction (MSC) and Linearity Improvement in NIR Spectroscopy. Appl. Spectrosc. 1988, 42, 1273–1284. [Google Scholar] [CrossRef]
- Geladi, P.; MacDougall, D.; Martens, H. Linearization and Scatter-Correction for Near-Infrared Reflectance Spectra of Meat. Appl. Spectrosc. 1985, 39, 491–500. [Google Scholar] [CrossRef]
- Maleki, M.R.; Mouazen, A.M.; Ramon, H.; De Baerdemaeker, J. Multiplicative Scatter Correction during On-Line Measurement with Near Infrared Spectroscopy. Biosyst. Eng. 2007, 96, 427–433. [Google Scholar] [CrossRef]
- Dhanoa, M.S.; Lister, S.J.; Sanderson, R.; Barnes, R.J. The link between multiplicative scatter correction (MSC) and standard normal variate (SNV) transformations of NIR spectra. J. Near Infrared Spectrosc. 1994, 2, 43–47. [Google Scholar] [CrossRef]
- Huang, J.F.; Blackburn, G.A. Optimizing predictive models for leaf chlorophyll concentration based on continuous wavelet analysis of hyperspectral data. Int. J. Remote Sens. 2011, 32, 9375–9396. [Google Scholar] [CrossRef]
- Shi, Y.; Huang, W.; González-Moreno, P.; Luke, B.; Dong, Y.; Zheng, Q.; Ma, H.; Liu, L. Wavelet-based rust spectral feature set (WRSFs): A novel spectral feature set based on continuous wavelet transformation for tracking progressive host–pathogen interaction of yellow rust on wheat. Remote Sens. 2018, 10, 525. [Google Scholar] [CrossRef]
- Xu, Y.; Wang, J.; Xia, A.; Zhang, K.; Dong, X.; Wu, K.; Wu, G. Continuous Wavelet Analysis of Leaf Reflectance Improves Classification Accuracy of Mangrove Species. Remote Sens. 2019, 11, 254. [Google Scholar] [CrossRef]
- Thenkabail, P.S.; Lyon, J.G.; Huete, A. (Eds.) Advanced Applications in Remote Sensing of Agricultural Crops and Natural Vegetation, 2nd ed.; Hyperspectral Remote Sensing of Vegetation; CRC Press: Boca Raton, FL, USA; London, UK; New York, NY, USA, 2019; ISBN 9781138364769. [Google Scholar]
- Amarasingam, N.; Ashan Salgadoe, A.S.; Powell, K.; Gonzalez, L.F.; Natarajan, S. A Review of UAV Platforms, Sensors, and Applications for Monitoring of Sugarcane Crops. Remote Sens. Appl. Soc. Environ. 2022, 26, 100712. [Google Scholar] [CrossRef]
- Tsouros, D.C.; Bibi, S.; Sarigiannidis, P.G. A Review on UAV-Based Applications for Precision Agriculture. Information 2019, 10, 349. [Google Scholar] [CrossRef]
- Radoglou-Grammatikis, P.; Sarigiannidis, P.; Lagkas, T.; Moscholios, I. A Compilation of UAV Applications for Precision Agriculture. Comput. Netw. 2020, 172, 107148. [Google Scholar] [CrossRef]
- Velusamy, P.; Rajendran, S.; Mahendran, R.K.; Naseer, S.; Shafiq, M.; Choi, J.-G. Unmanned Aerial Vehicles (UAV) in Precision Agriculture: Applications and Challenges. Energies 2021, 15, 217. [Google Scholar] [CrossRef]
- Bellinaso, H.; Demattê, J.A.M.; Romeiro, S.A. Soil Spectral Library and Its Use in Soil Classification. Rev. Bras. Ciênc. Solo 2010, 34, 861–870. [Google Scholar] [CrossRef]
- Xie, B.; Wu, L.; Mao, W.; Zhou, S.; Liu, S. An Open Integrated Rock Spectral Library (RockSL) for a Global Sharing and Matching Service. Minerals 2022, 12, 118. [Google Scholar] [CrossRef]
- Schmid, T.; Koch, M.; Gumuzzio, J.; Mather, P.M. A Spectral Library for a Semi-Arid Wetland and Its Application to Studies of Wetland Degradation Using Hyperspectral and Multispectral Data. Int. J. Remote Sens. 2004, 25, 2485–2496. [Google Scholar] [CrossRef]
- Zomer, R.J.; Trabucco, A.; Ustin, S.L. Building Spectral Libraries for Wetlands Land Cover Classification and Hyperspectral Remote Sensing. J. Environ. Manag. 2009, 90, 2170–2177. [Google Scholar] [CrossRef] [PubMed]
- Meerdink, S.K.; Hook, S.J.; Roberts, D.A.; Abbott, E.A. The ECOSTRESS Spectral Library Version 1.0. Remote Sens. Environ. 2019, 230, 111196. [Google Scholar] [CrossRef]
- Knipling, E.B. Physical and Physiological Basis for the Reflectance of Visible and Near-Infrared Radiation from Vegetation. Remote Sens. Environ. 1970, 1, 155–159. [Google Scholar] [CrossRef]
- Shengyan, D.; Jidong, G.; Lexiang, Q. Assessment of Biochemical Concentrations of Vegetation Using Remote Sensing Technology. J. Geogr. Sci. 2002, 12, 321–330. [Google Scholar] [CrossRef]
- Deepak, M.; Keski-Saari, S.; Fauch, L.; Granlund, L.; Oksanen, E.; Keinänen, M. Leaf Canopy Layers Affect Spectral Reflectance in Silver Birch. Remote Sens. 2019, 11, 2884. [Google Scholar] [CrossRef]


| Province | Municipality | Project | Temporal Resolution | Spatial Resolution | Spectral Data |
|---|---|---|---|---|---|
| Northern Cape | Frances Baard | Barley evapotranspiration | Monthly, August–October 2020 | 2–8 cm | Yes |
| Free State | Thabo Mofutsanyana | Erosion modelling | Yearly, August 2021 & August 2022 | 2 cm | Yes |
| Limpopo | Vhembe/Mopani | Crop disease | Monthly, 2021–2022 | 2–8 cm | Yes |
| Limpopo | Vhembe | Crop disease | Monthly, January–March 2021 & January–February 2023 | 2–8 cm | Yes |
| Limpopo | Vhembe | Soil Moisture | Monthly, January–March 2022 | 2–8 cm | Yes |
| Limpopo | Vhembe | Crop estimate | Daily, March-2020 | 2–8 cm | No |
| Limpopo | Vhembe | 4IR in farming | Monthly, August–November 2022 | 2–8 cm | Yes |
| Eastern Cape | Chris-Hani | Crop estimate | Daily, February 2022 | 2–8 cm | No |
| Eastern cape | OR-Thambo | Bush Encroachment | Monthly, October–December 2022 & March 2023 | 2–8 cm | Yes |
| Eastern cape | Amathole | Bush Encroachment | Monthly, October–December 2022 & March 2023 | 2–8 cm | Yes |
| Free State | Thabo Mofutsanyana | 4IR in farming | Monthly, July–October 2021 | 2–8 cm | Yes |
| Gauteng | Tshwane Municipality | 4IR in farming | Monthly, February–May 2022 | 2–8 cm | Yes |
| RedEdge-MX Sensor | Sentinel-2 | |||
|---|---|---|---|---|
| Band Name | Center Wavelength (nm) | Bandwidth (nm) | Center Wavelength (nm) | Bandwidth (nm) |
| Blue | 475 | 20 | 490 | 10 |
| Green | 560 | 20 | 560 | 10 |
| Red | 668 | 10 | 665 | 10 |
| Near Infrared | 840 | 40 | 842 | 10 |
| Red-Edge | 717 | 10 | 705 | 20 |
Disclaimer/Publisher’s Note: The statements, opinions and data contained in all publications are solely those of the individual author(s) and contributor(s) and not of MDPI and/or the editor(s). MDPI and/or the editor(s) disclaim responsibility for any injury to people or property resulting from any ideas, methods, instructions or products referred to in the content. |
© 2023 by the authors. Licensee MDPI, Basel, Switzerland. This article is an open access article distributed under the terms and conditions of the Creative Commons Attribution (CC BY) license (https://creativecommons.org/licenses/by/4.0/).
Share and Cite
Munghemezulu, C.; Mashaba-Munghemezulu, Z.; Ratshiedana, P.E.; Economon, E.; Chirima, G.; Sibanda, S. Unmanned Aerial Vehicle (UAV) and Spectral Datasets in South Africa for Precision Agriculture. Data 2023, 8, 98. https://doi.org/10.3390/data8060098
Munghemezulu C, Mashaba-Munghemezulu Z, Ratshiedana PE, Economon E, Chirima G, Sibanda S. Unmanned Aerial Vehicle (UAV) and Spectral Datasets in South Africa for Precision Agriculture. Data. 2023; 8(6):98. https://doi.org/10.3390/data8060098
Chicago/Turabian StyleMunghemezulu, Cilence, Zinhle Mashaba-Munghemezulu, Phathutshedzo Eugene Ratshiedana, Eric Economon, George Chirima, and Sipho Sibanda. 2023. "Unmanned Aerial Vehicle (UAV) and Spectral Datasets in South Africa for Precision Agriculture" Data 8, no. 6: 98. https://doi.org/10.3390/data8060098