
Labelled Indoor Point Cloud Dataset for BIM Related Applications


Abstract
:1. Summary
- Validating Scan-to-BIM and Scan-vs-BIM algorithms:
- 2.
- Tackling one of the main challenges in indoor reconstruction—clutter and occlusions:
- 3.
- Development of BIM-based path planning and localization algorithms, as well as perception systems for mobile robots:
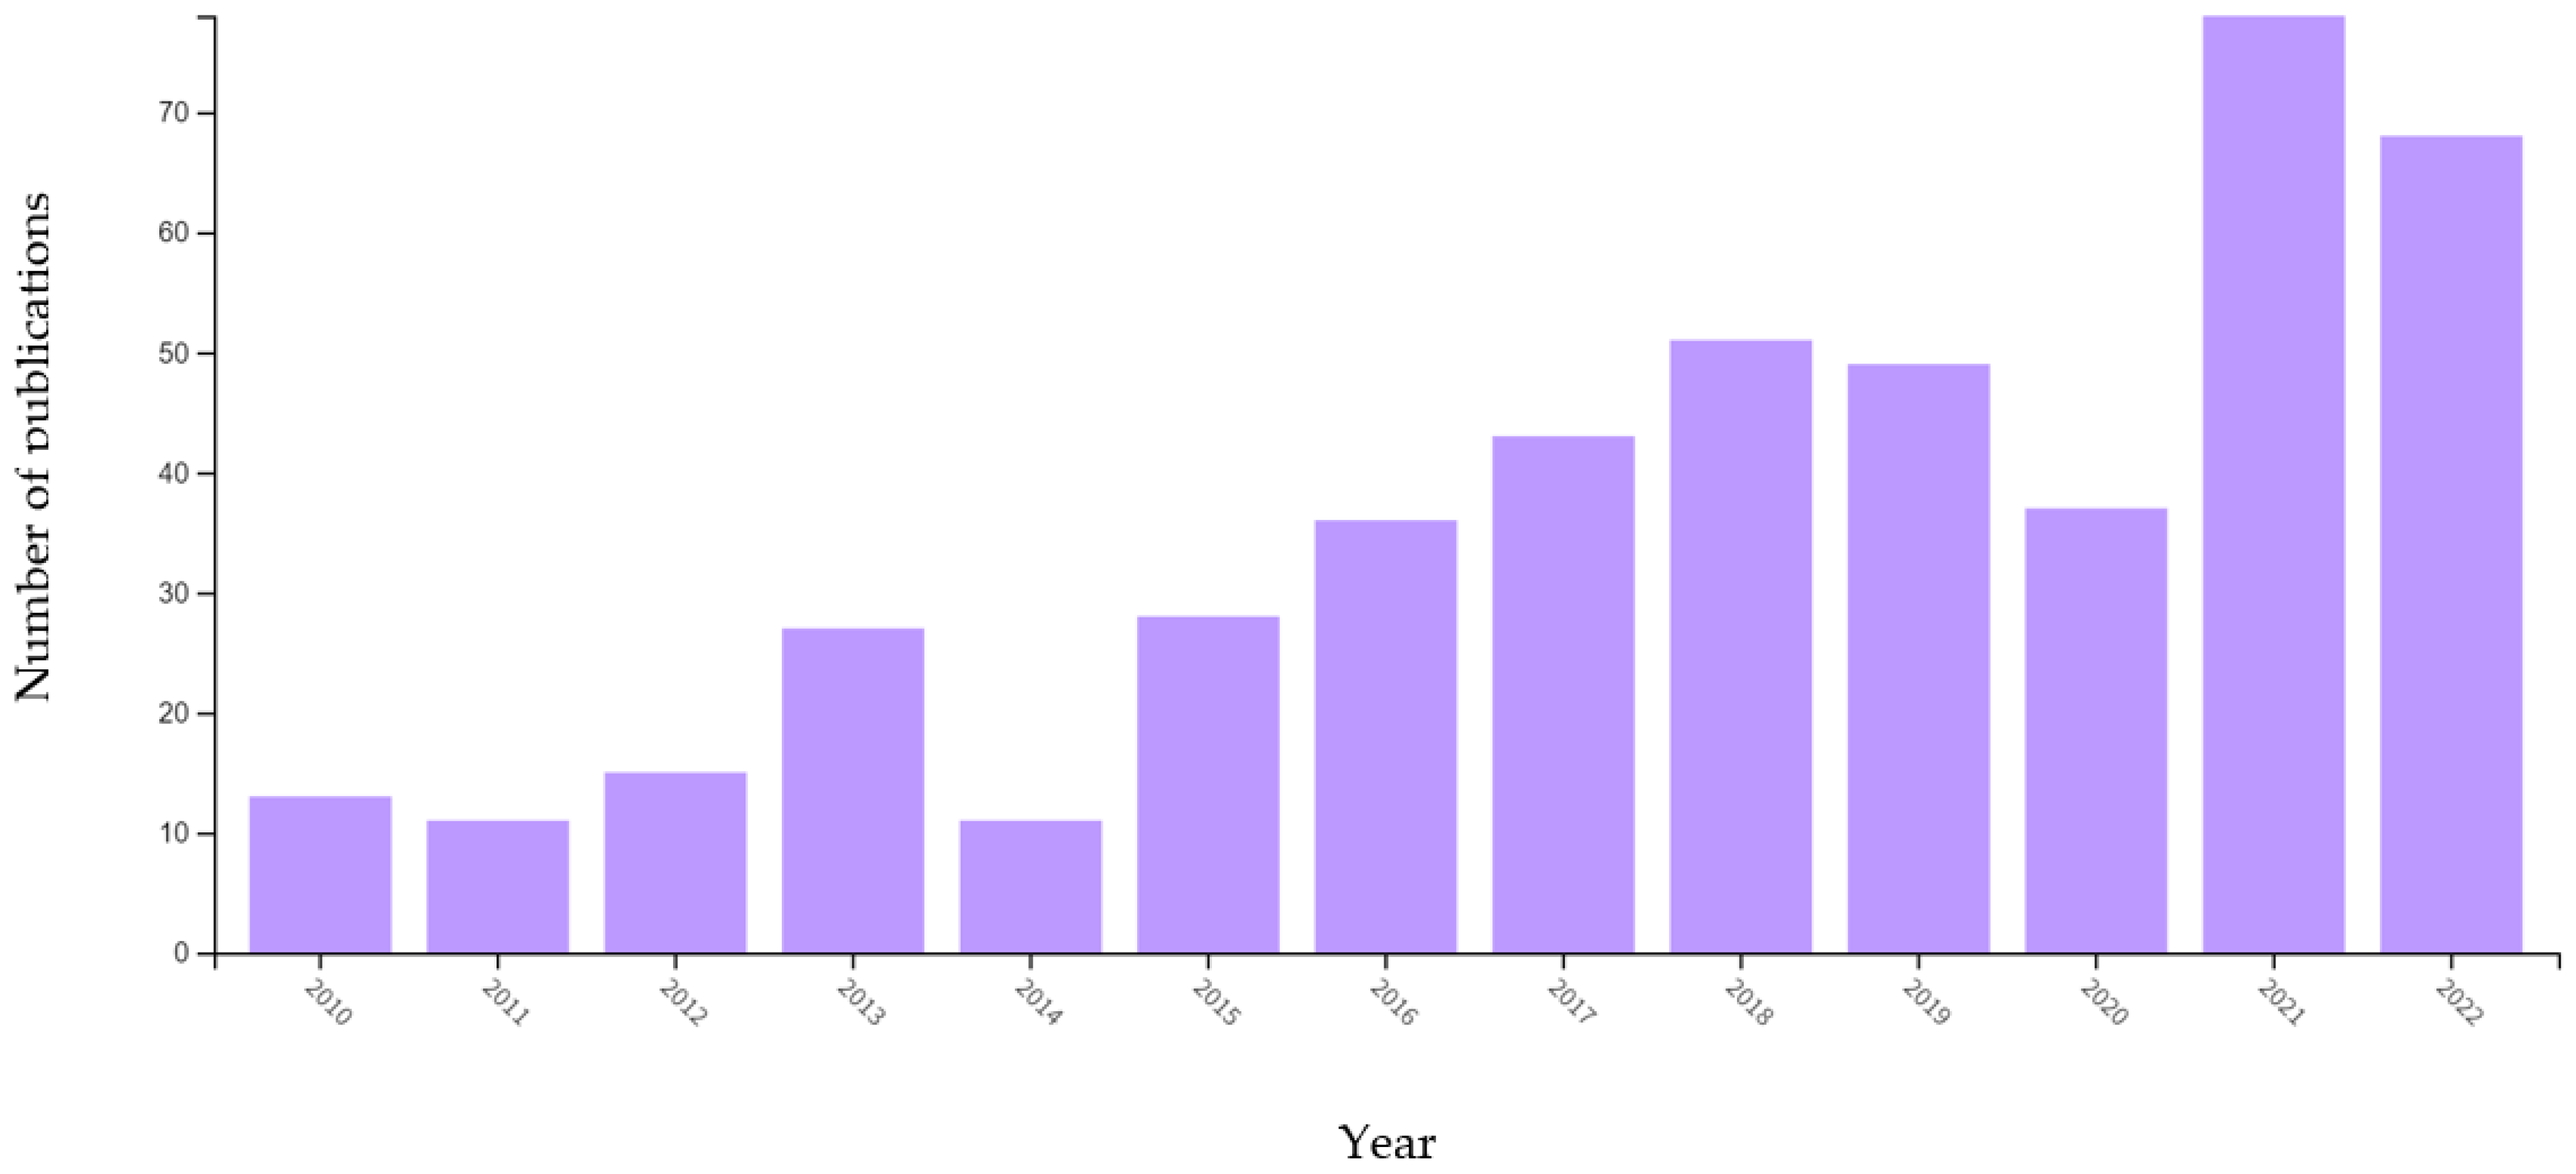
2. Background
- Scan-to-BIM: the process of transforming point cloud data into actual BIM models;
- Scan-vs.-BIM: the process of comparing point cloud data representing an as-built building to its as-designed BIM model in order to identify differences.
3. Data Description
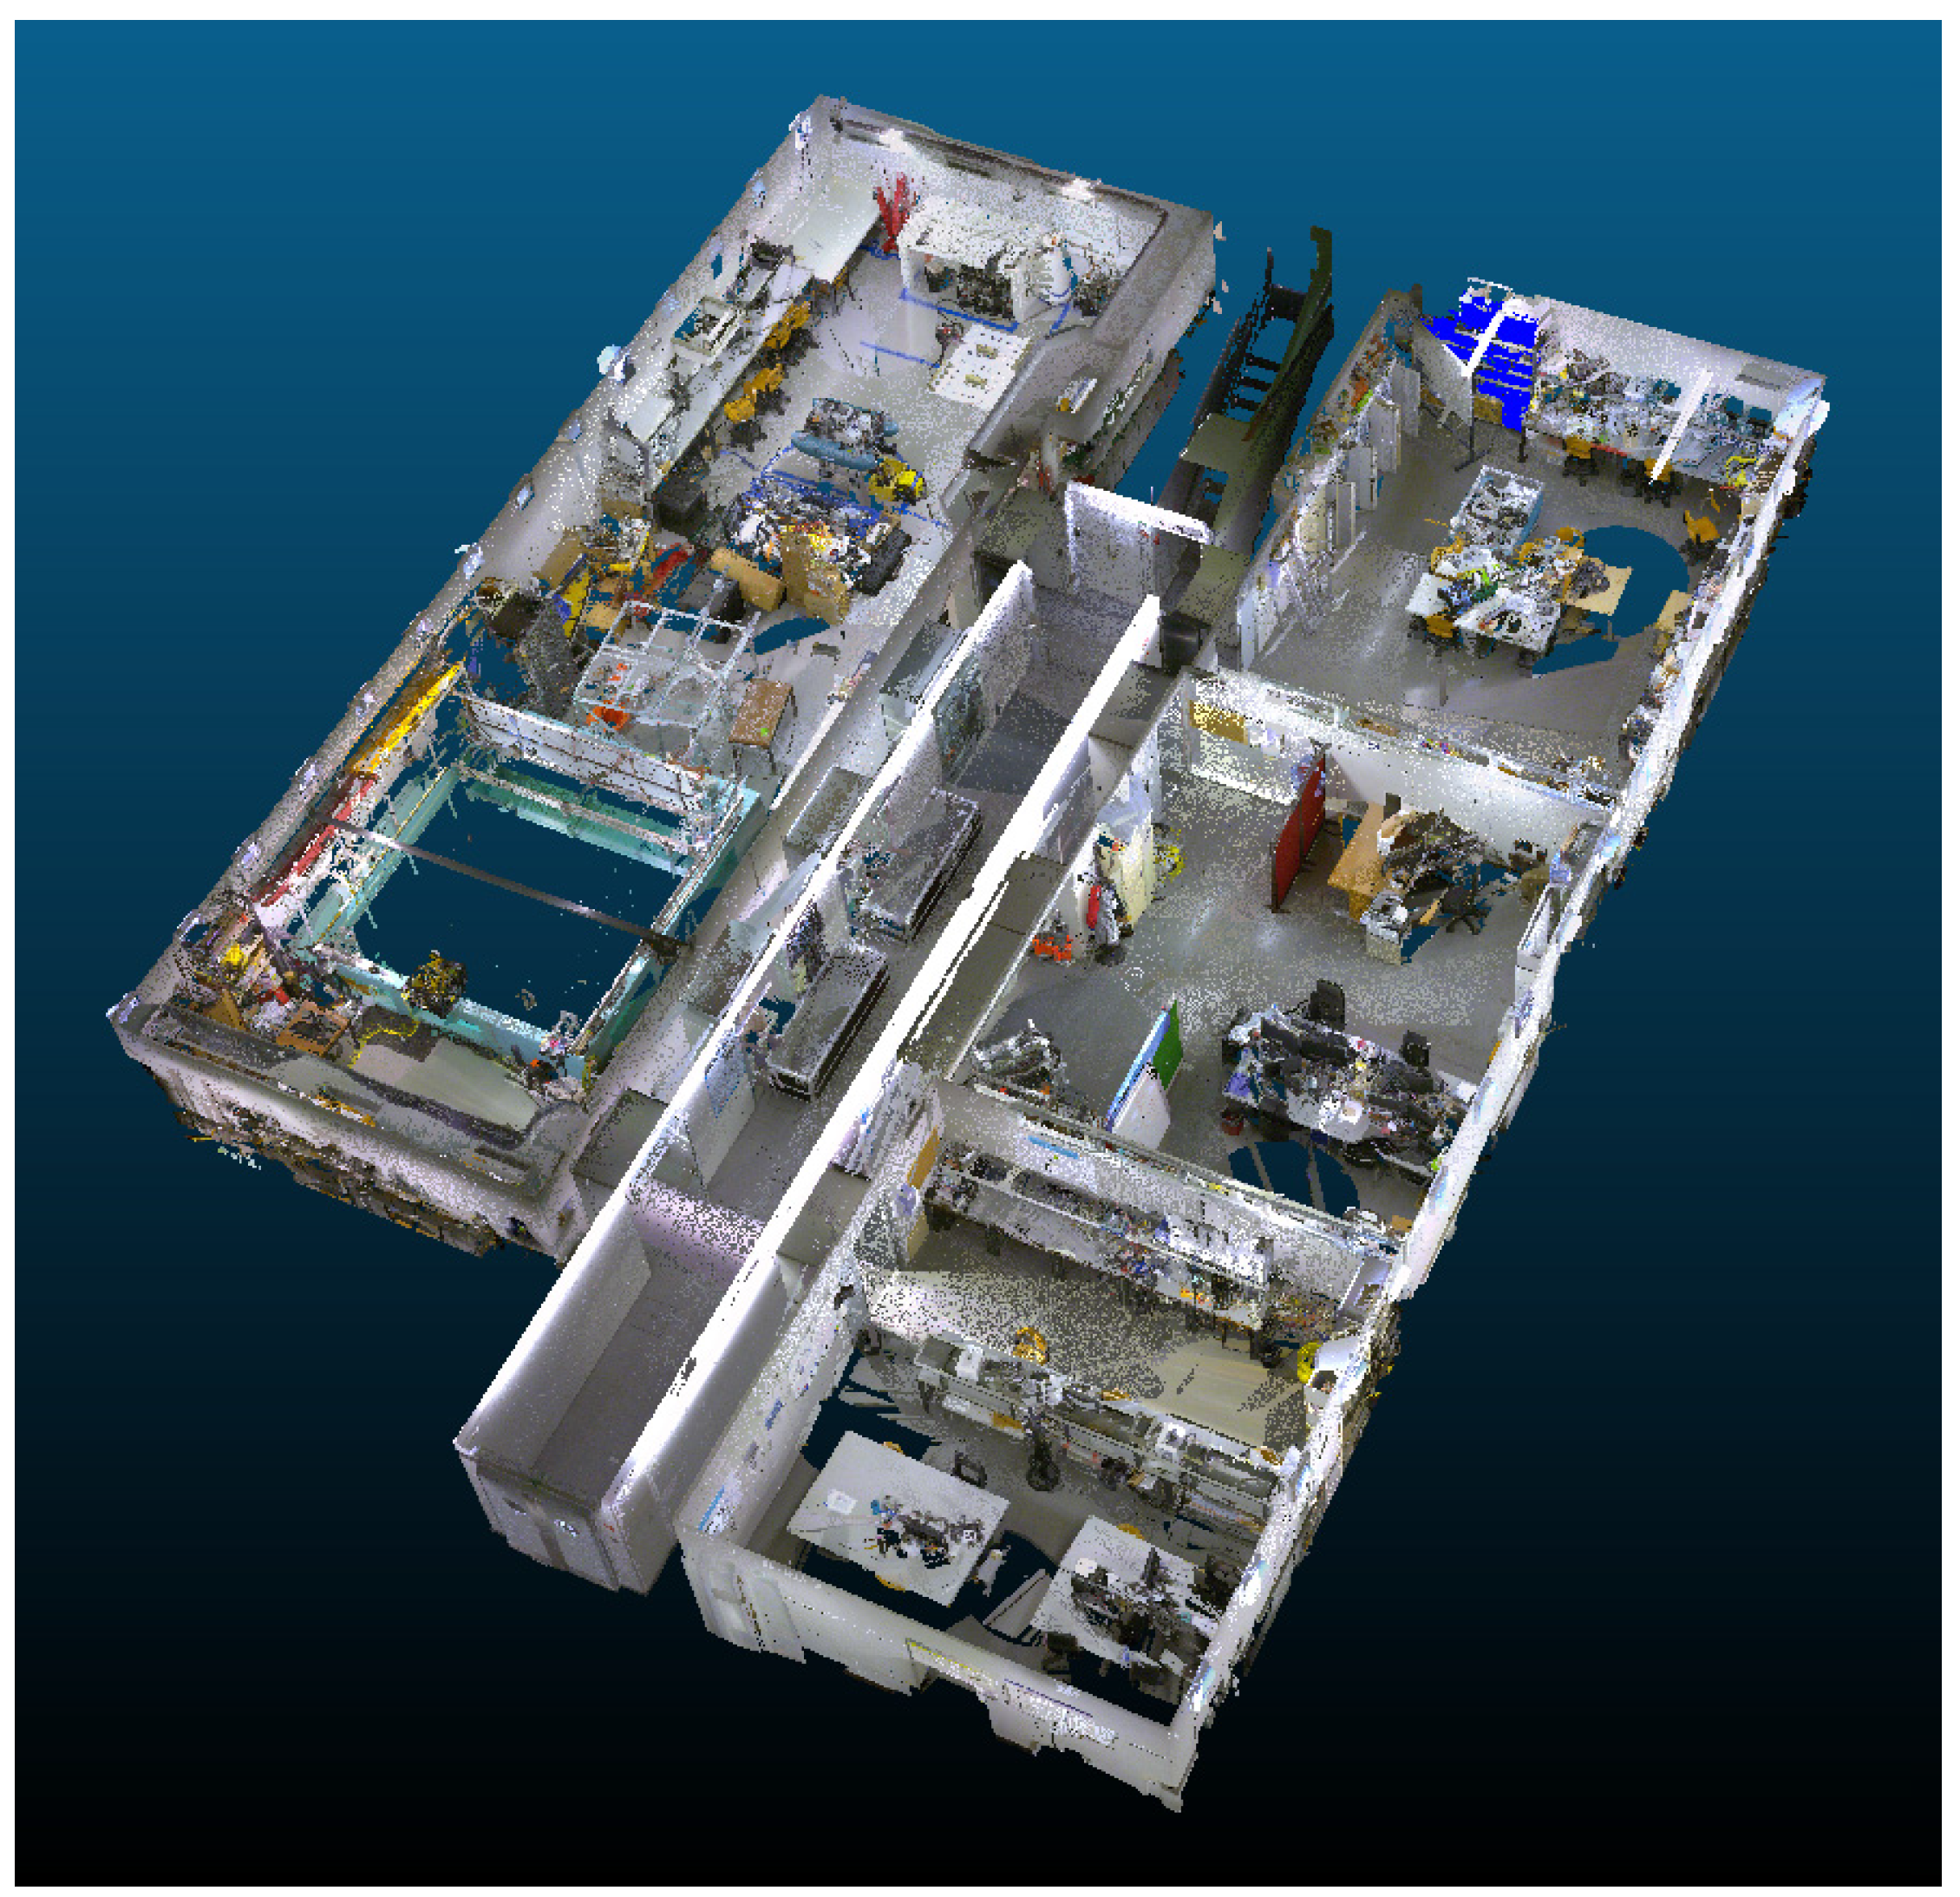
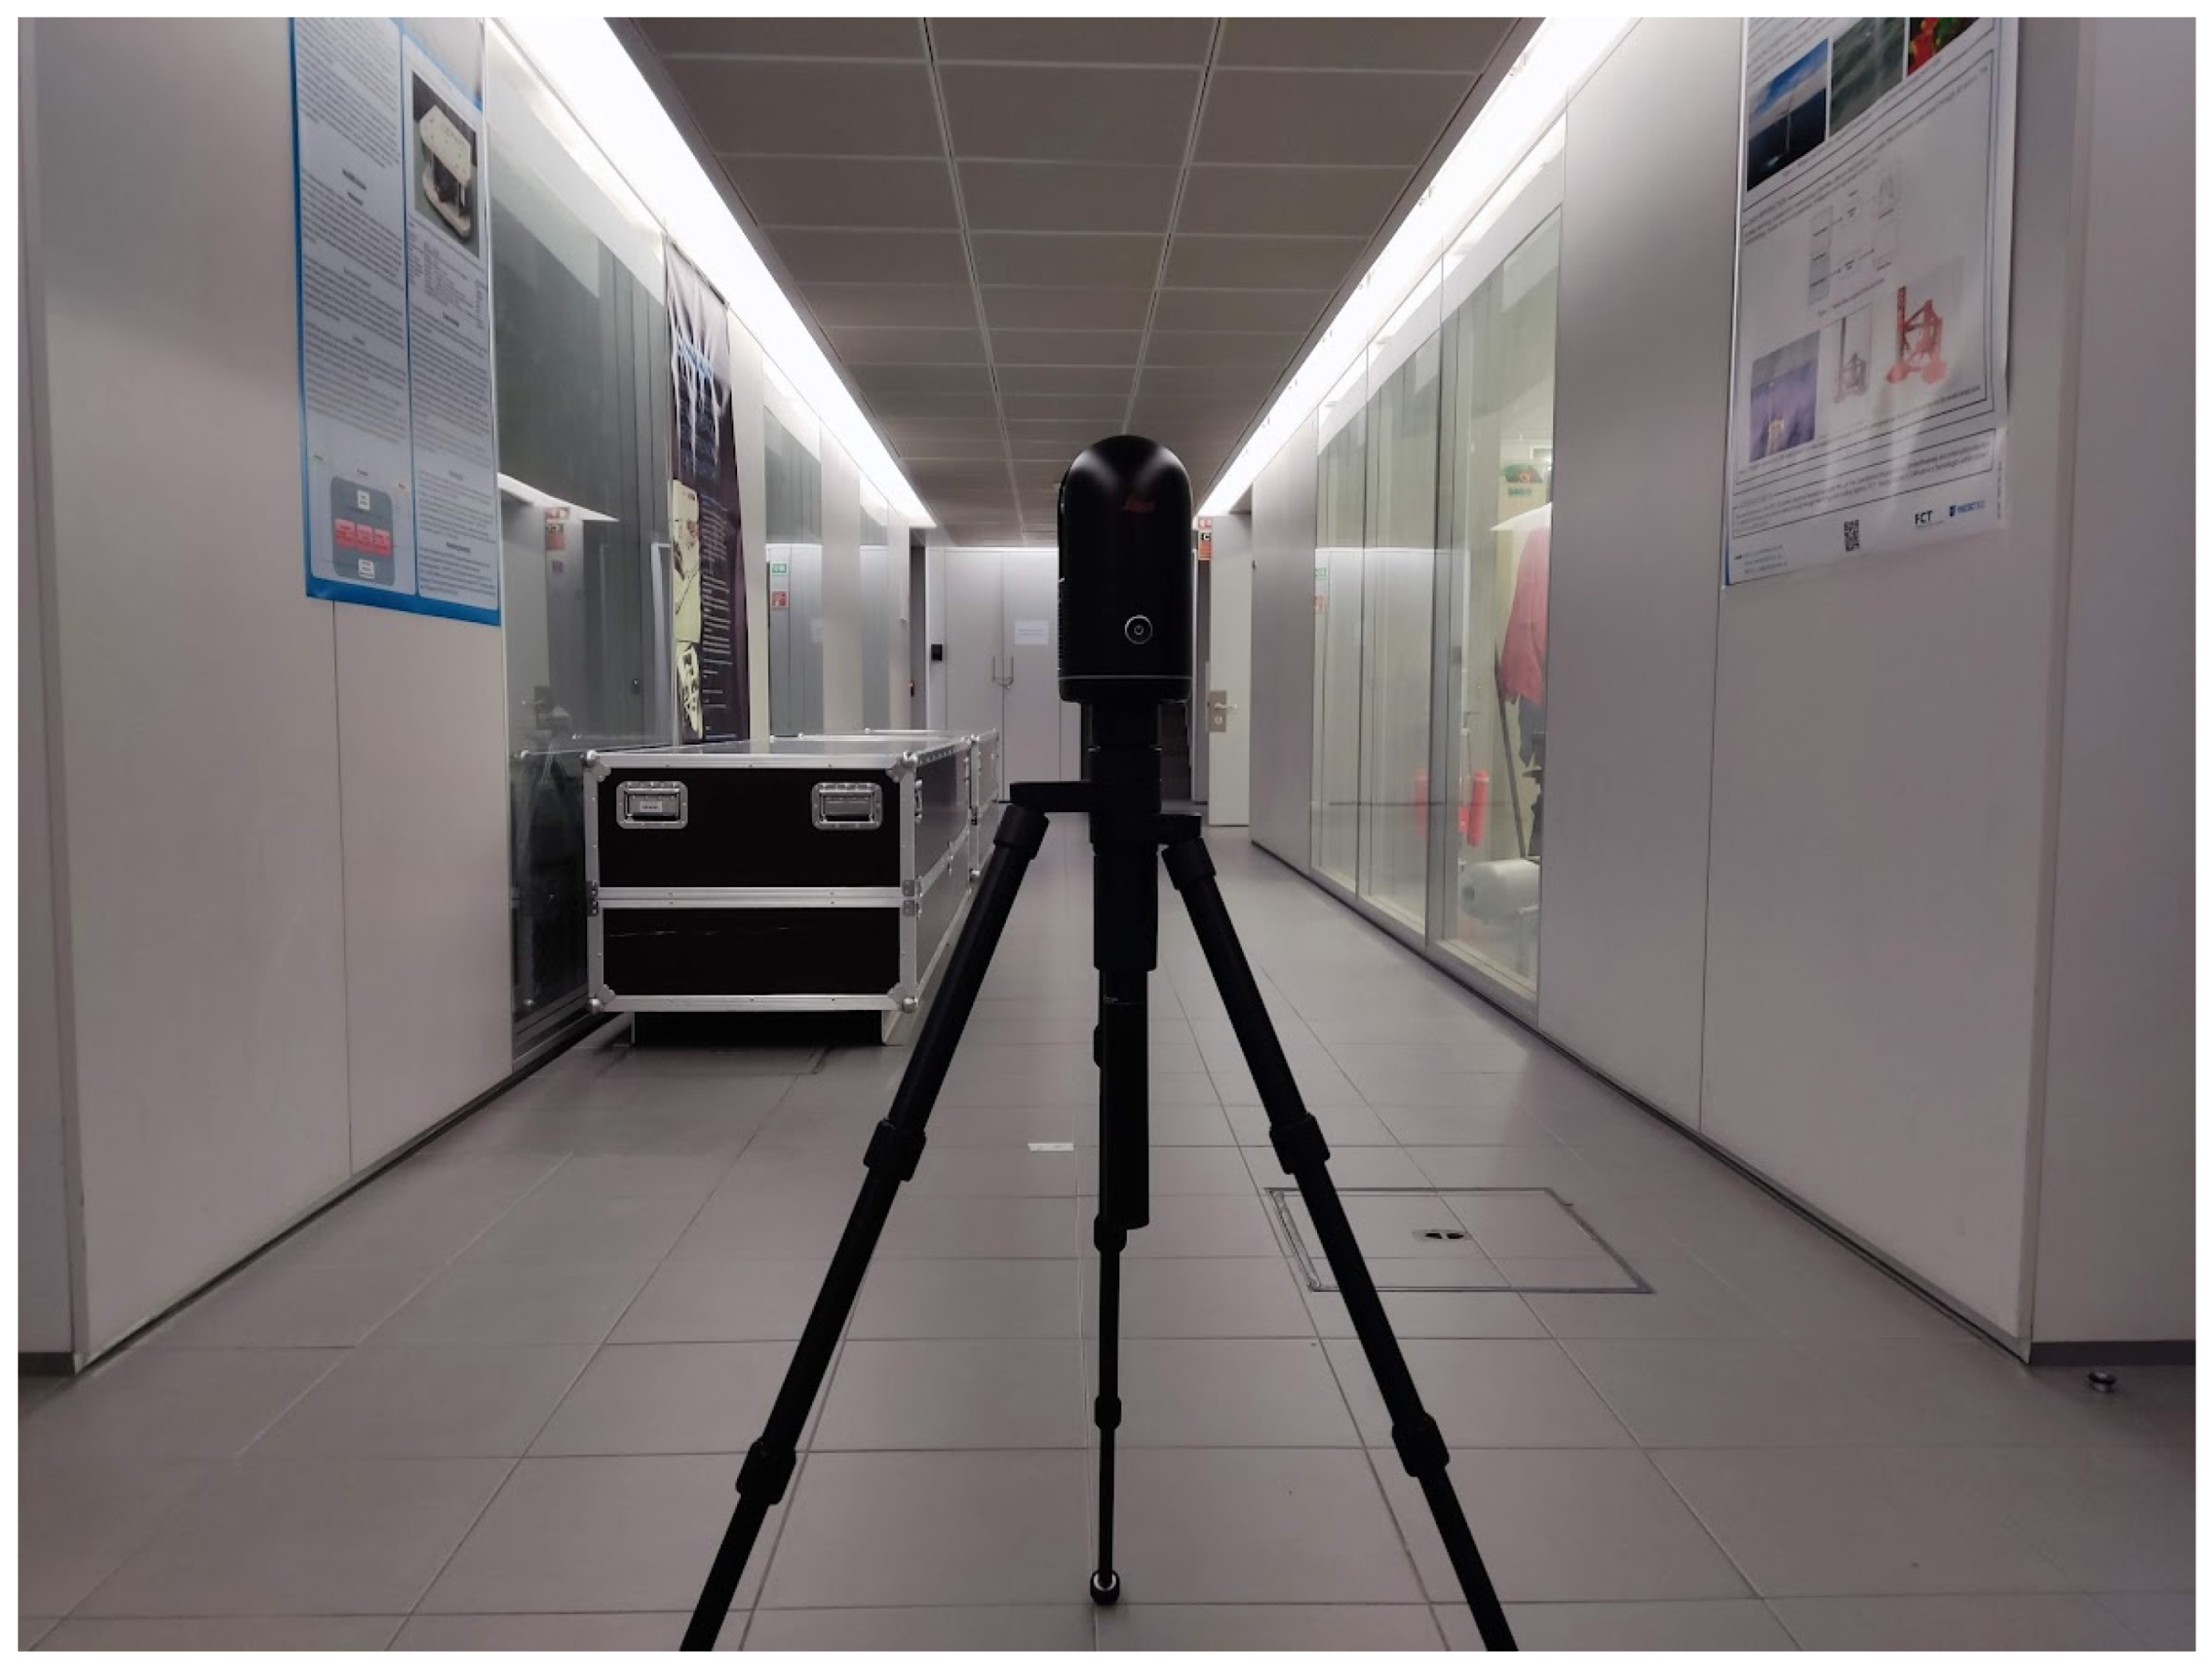
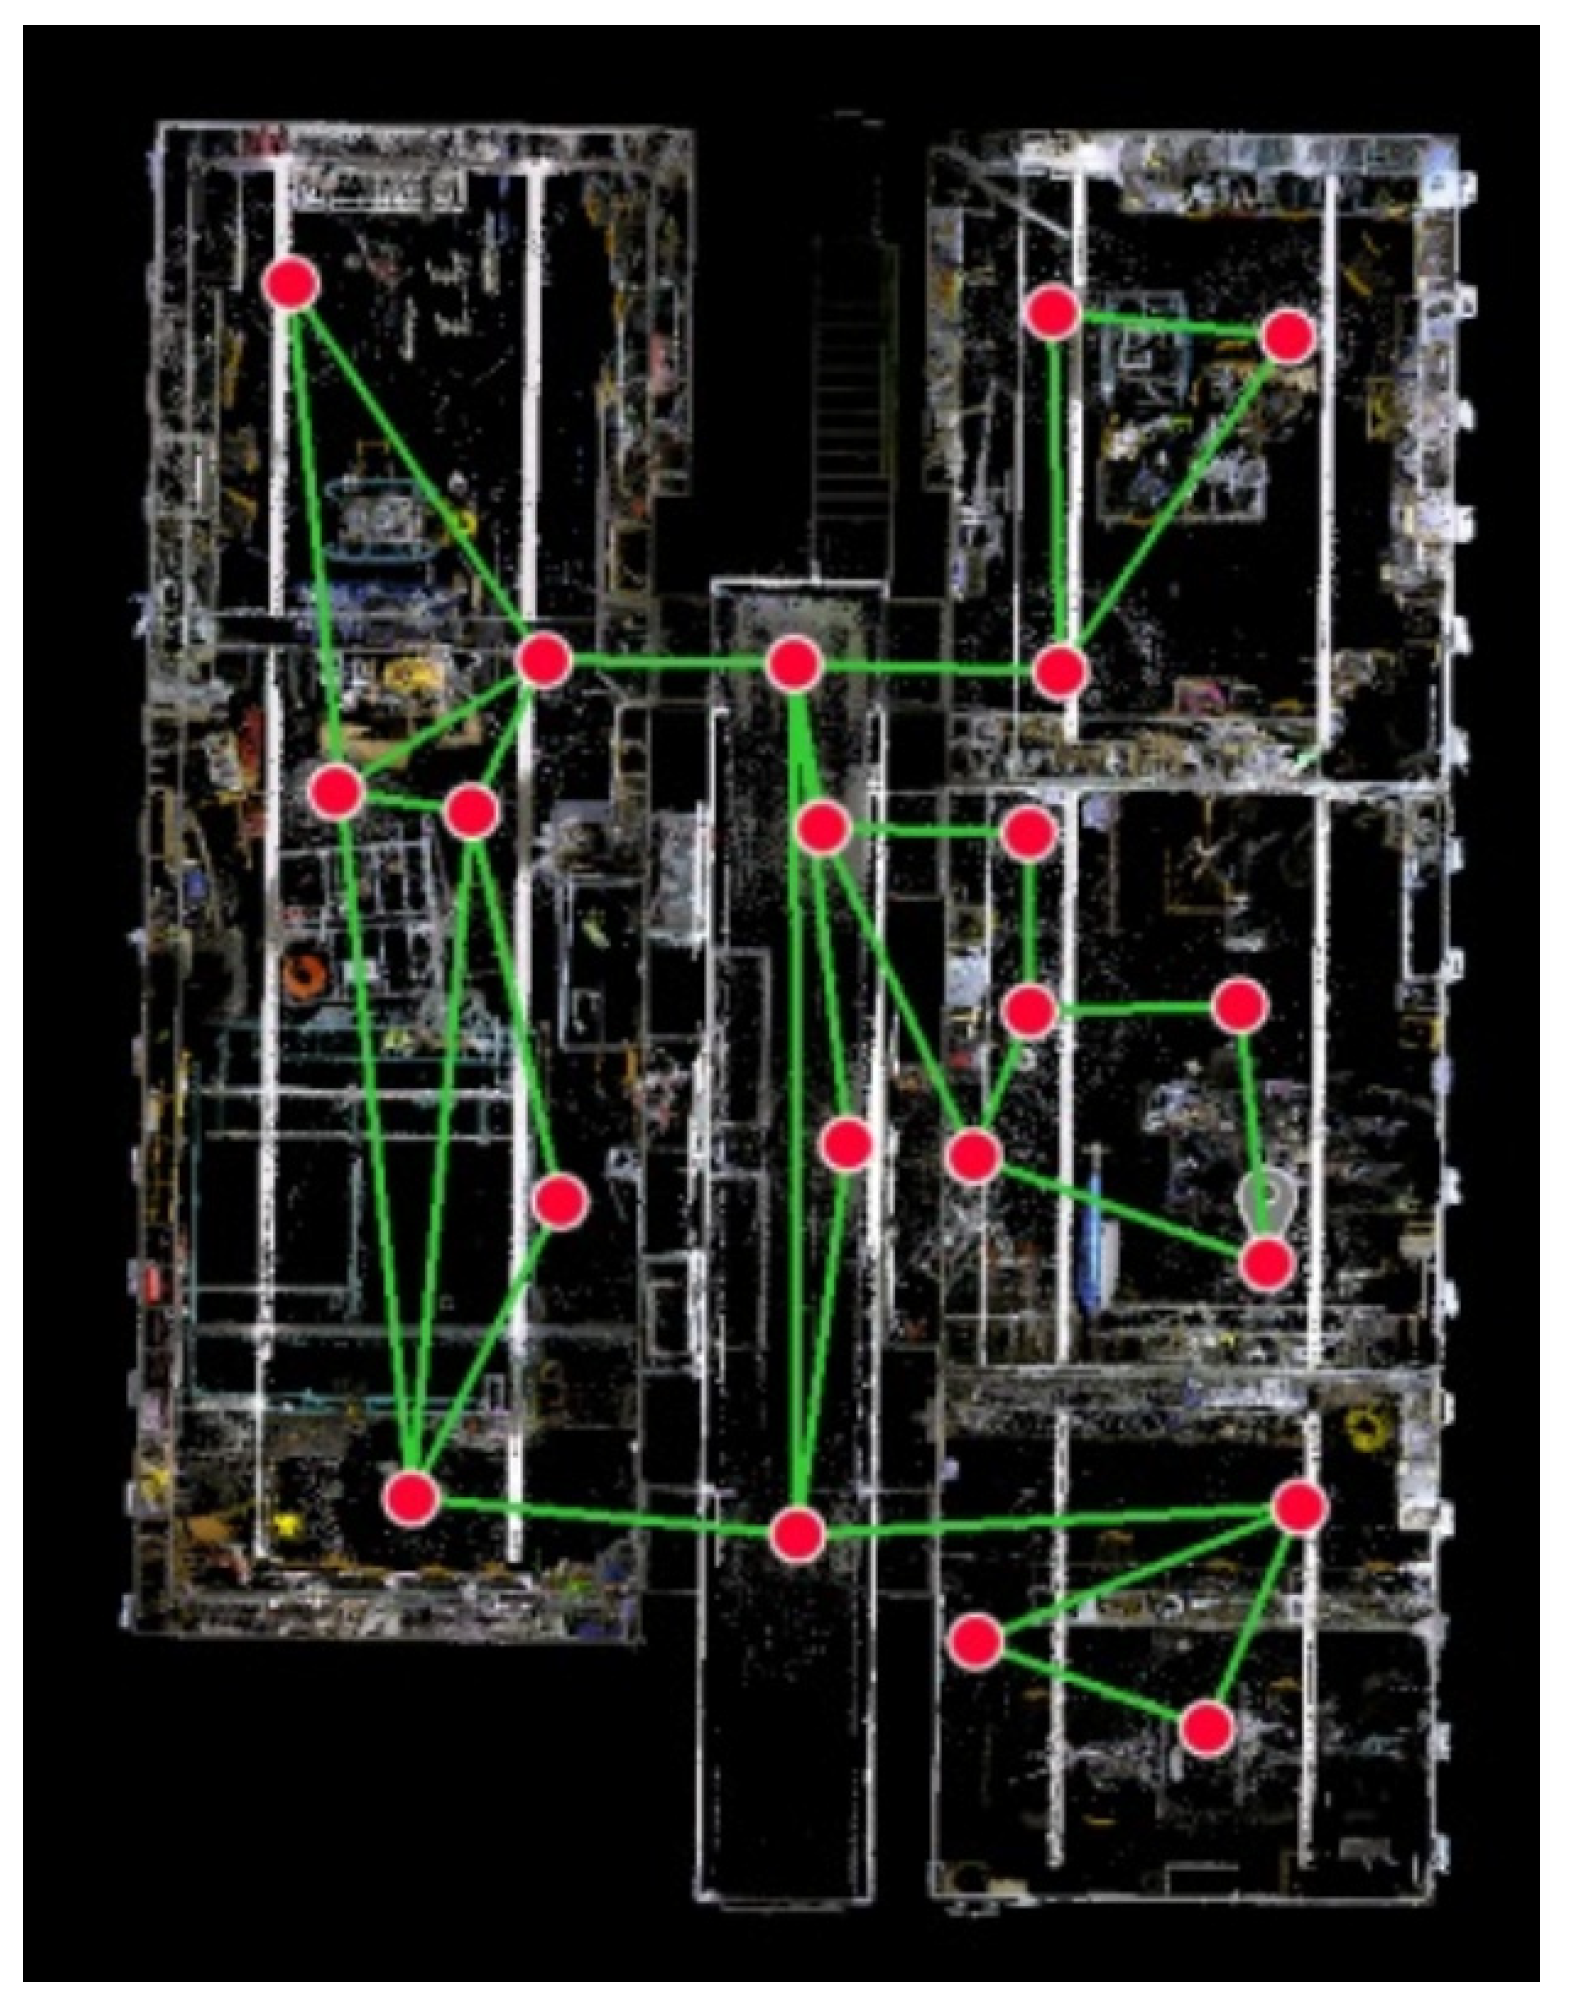
3.1. Point Cloud
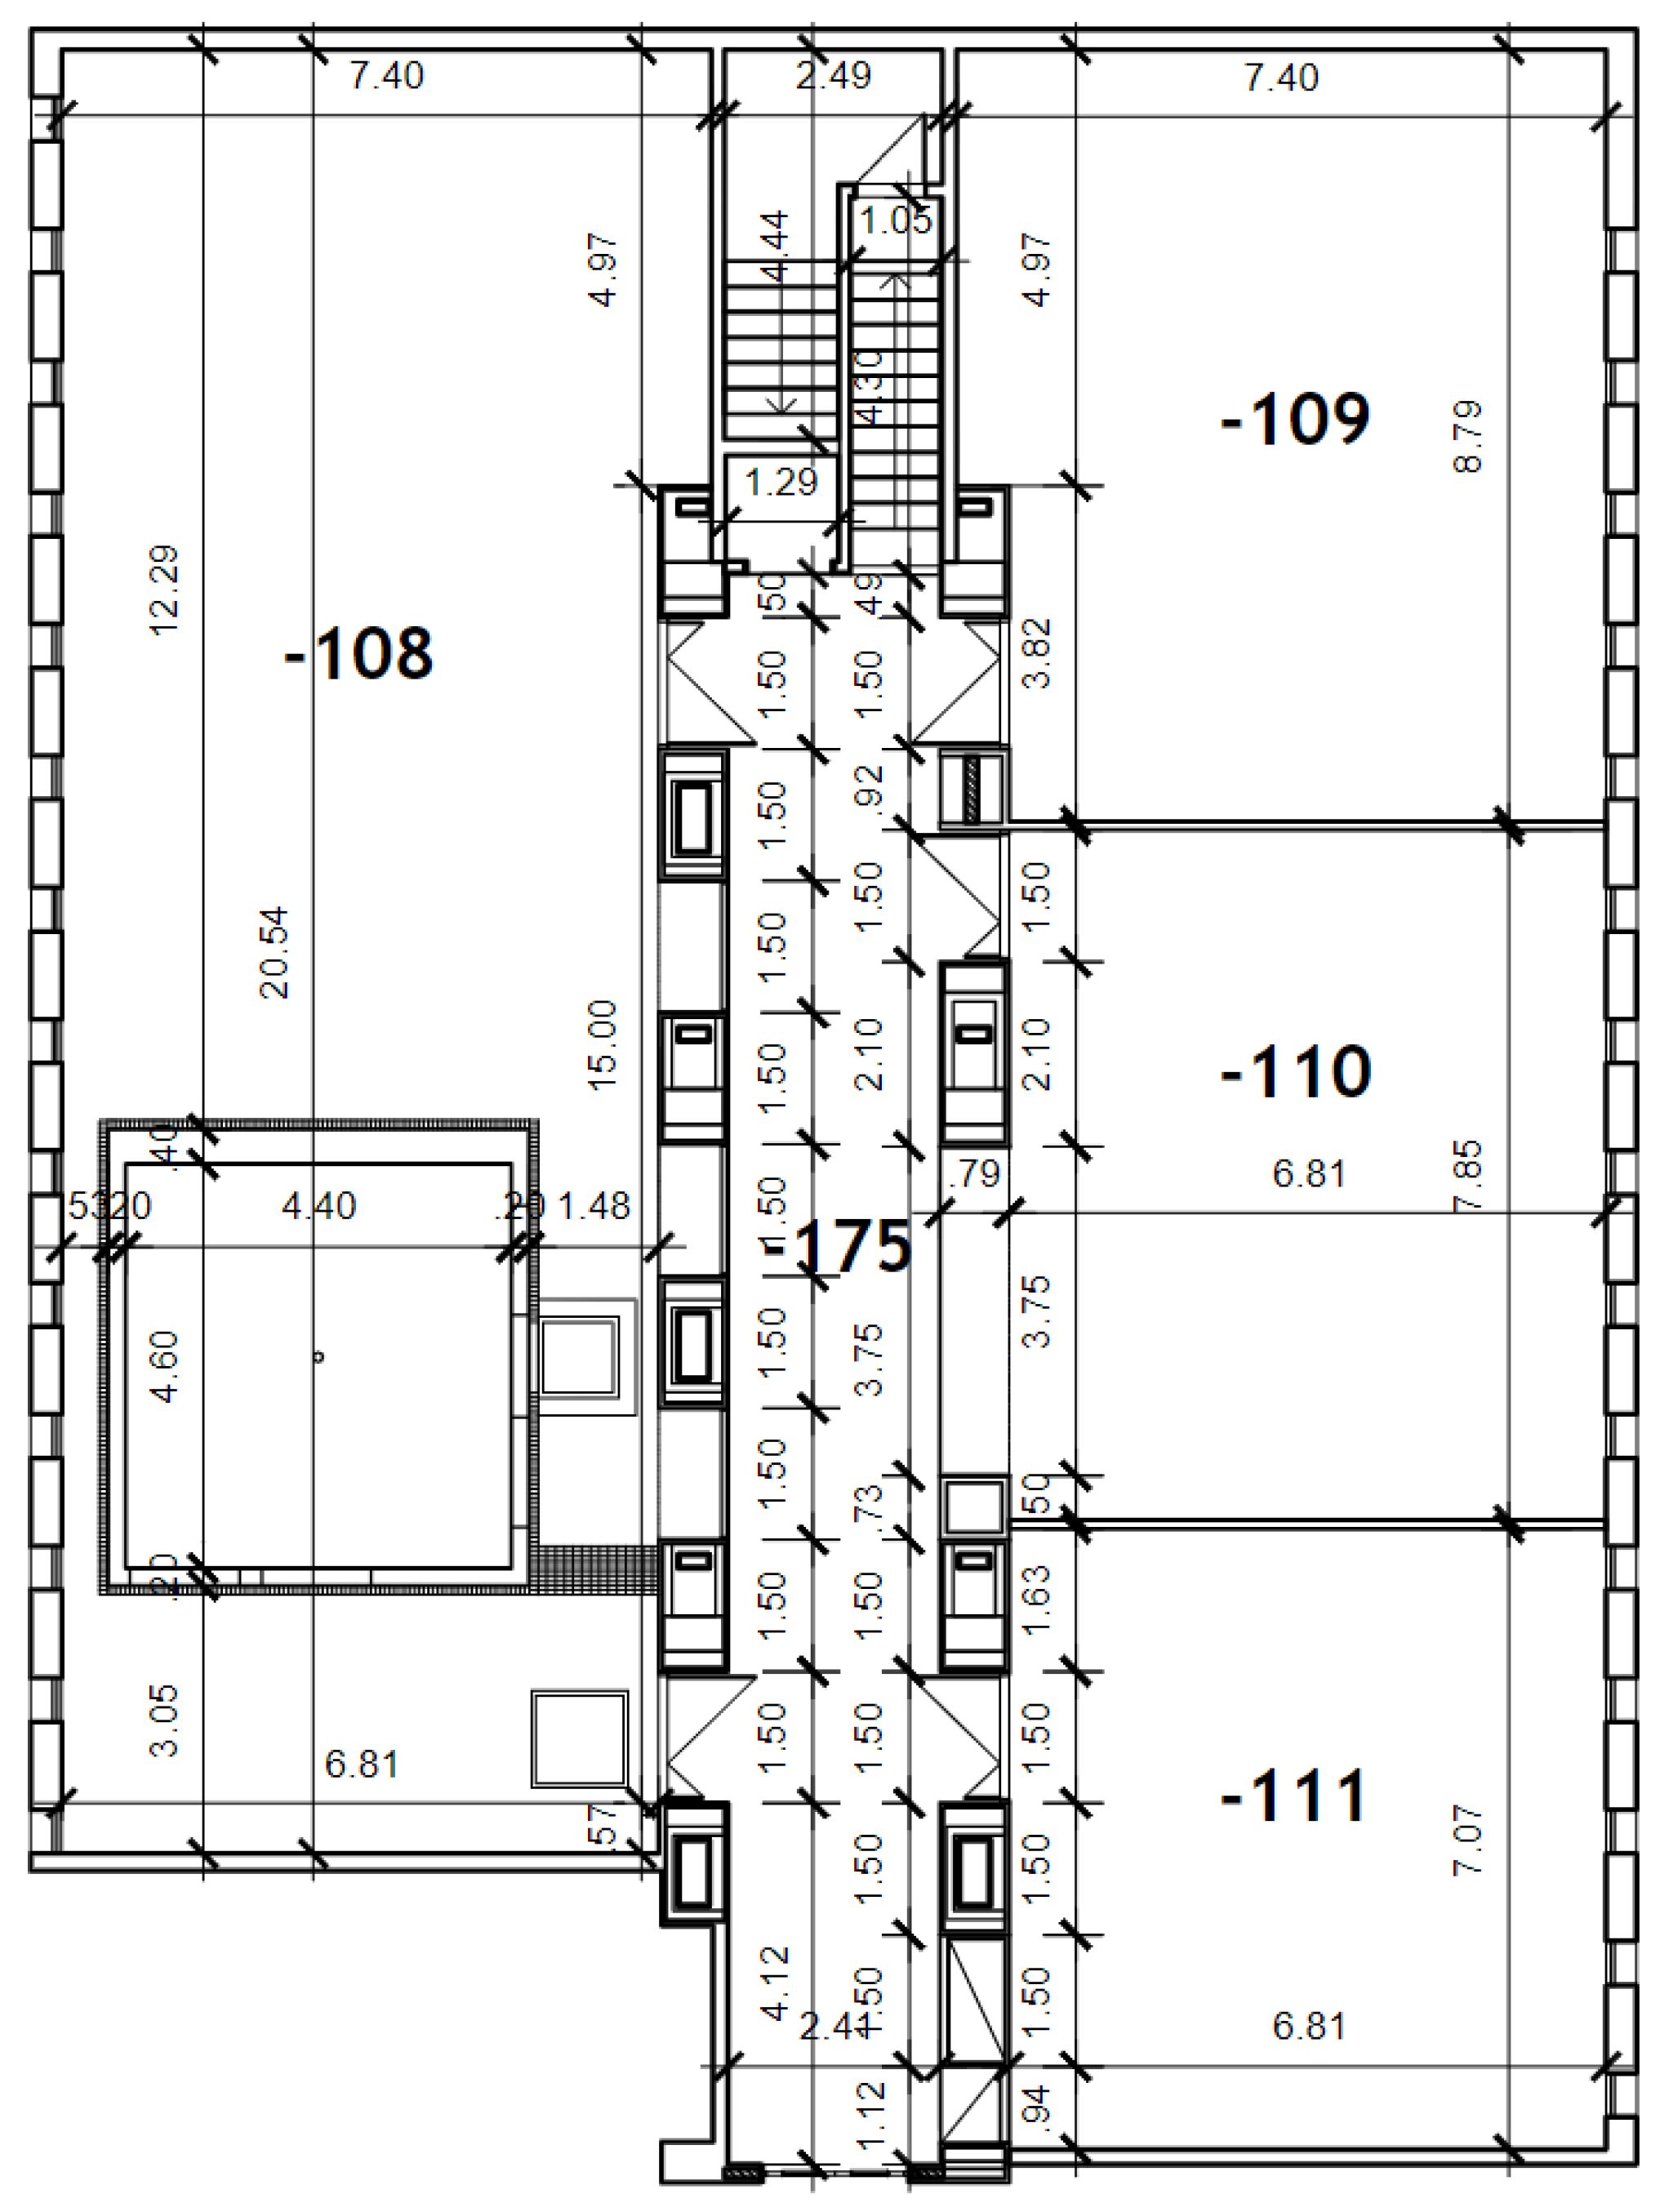
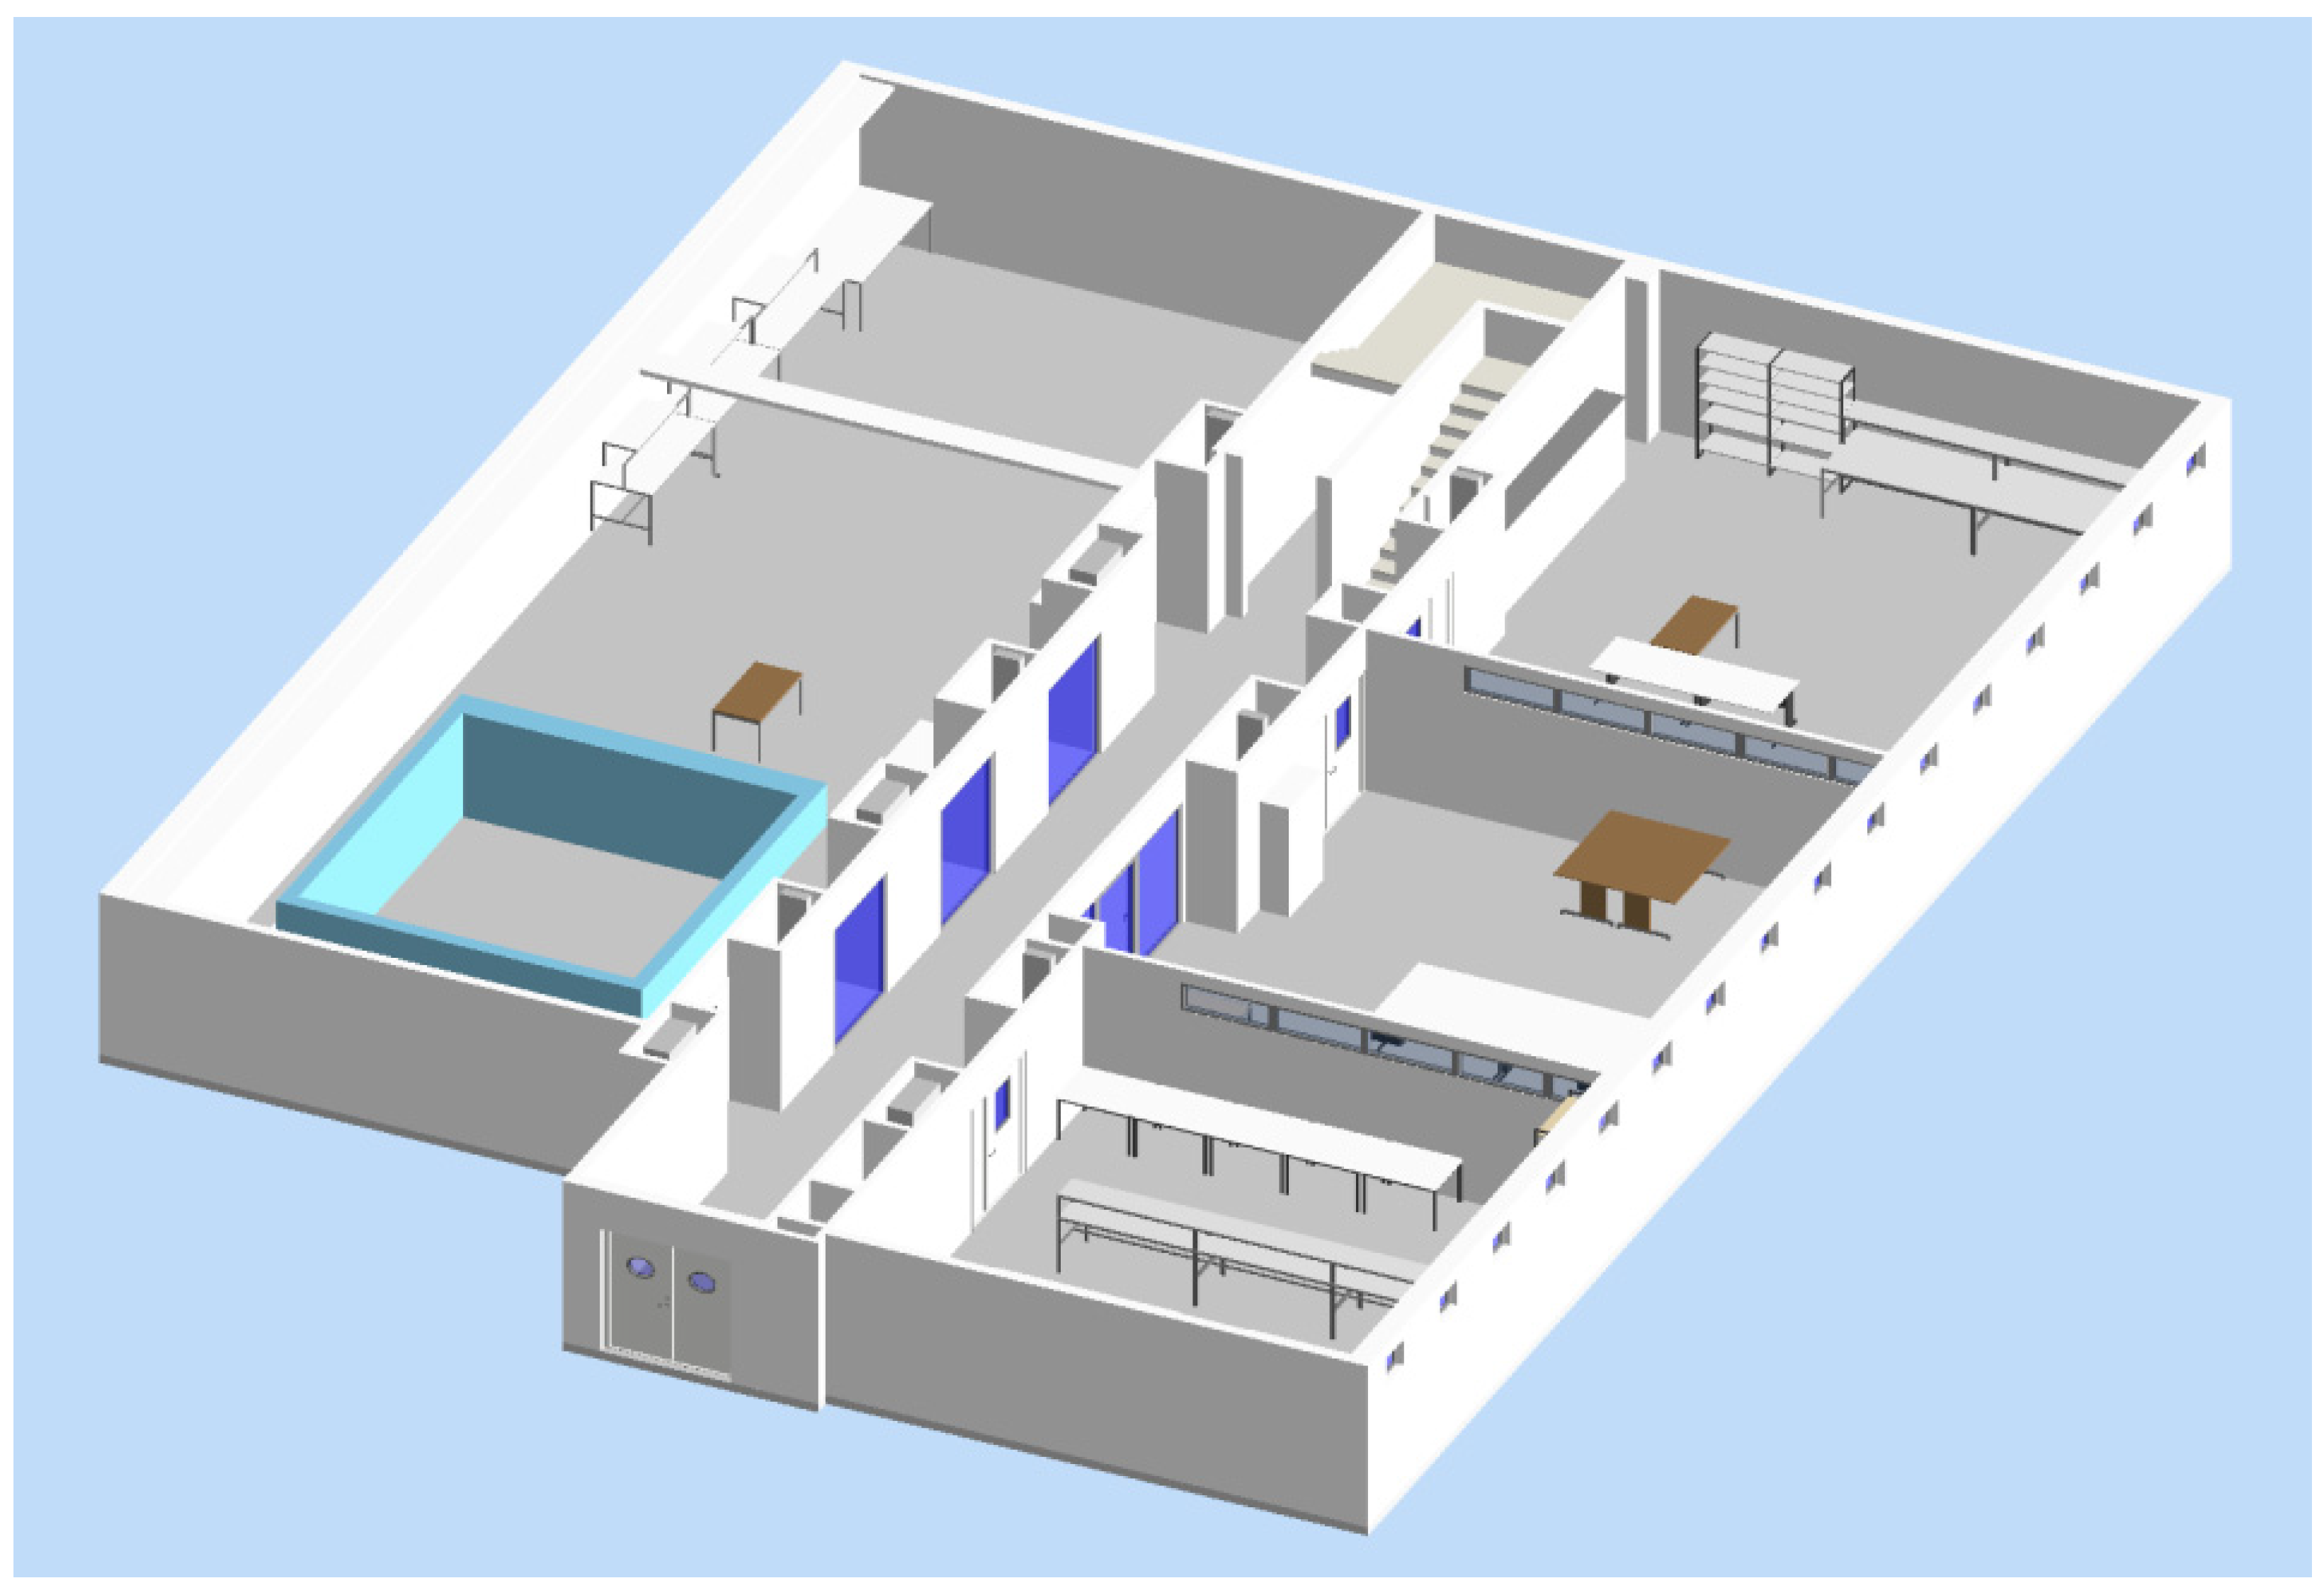
3.2. BIM Model
4. Methods
5. Discussion
- Model-based approaches take advantage of a pre-existing model of the structures to be sampled, with some level of fidelity, to plan the views (also known as off-line approaches).
- Non-model-based algorithms select views in real time (also known as online approaches) while 3D information is being acquired, since no a priori information is given about the structures.
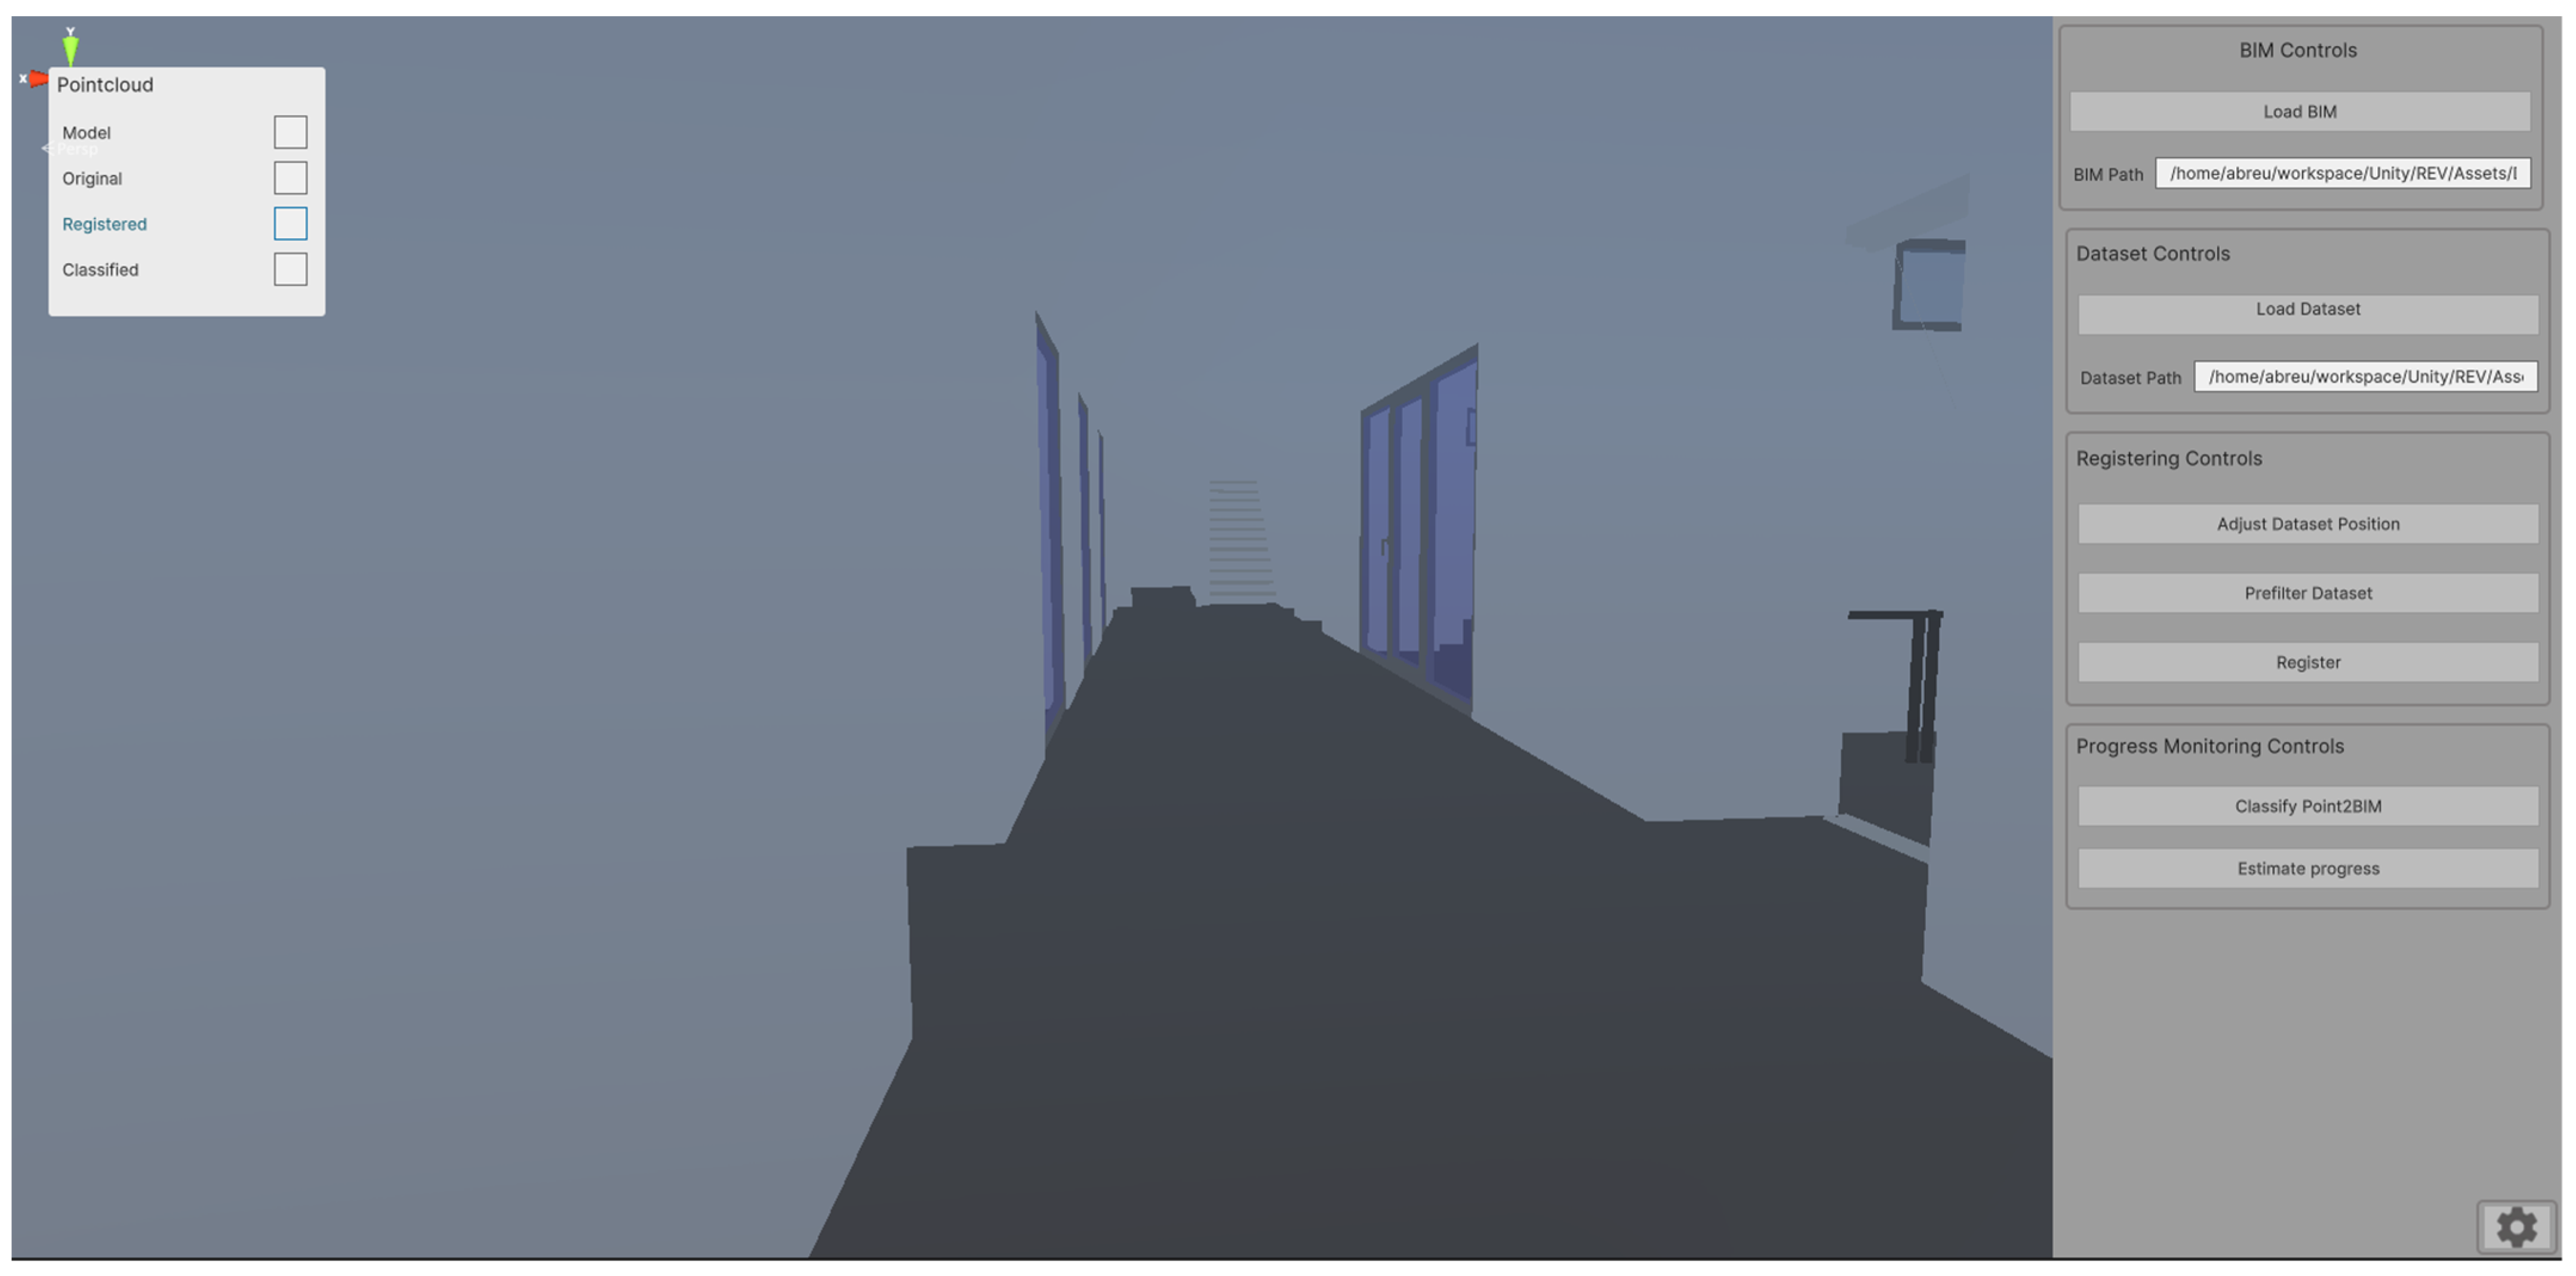
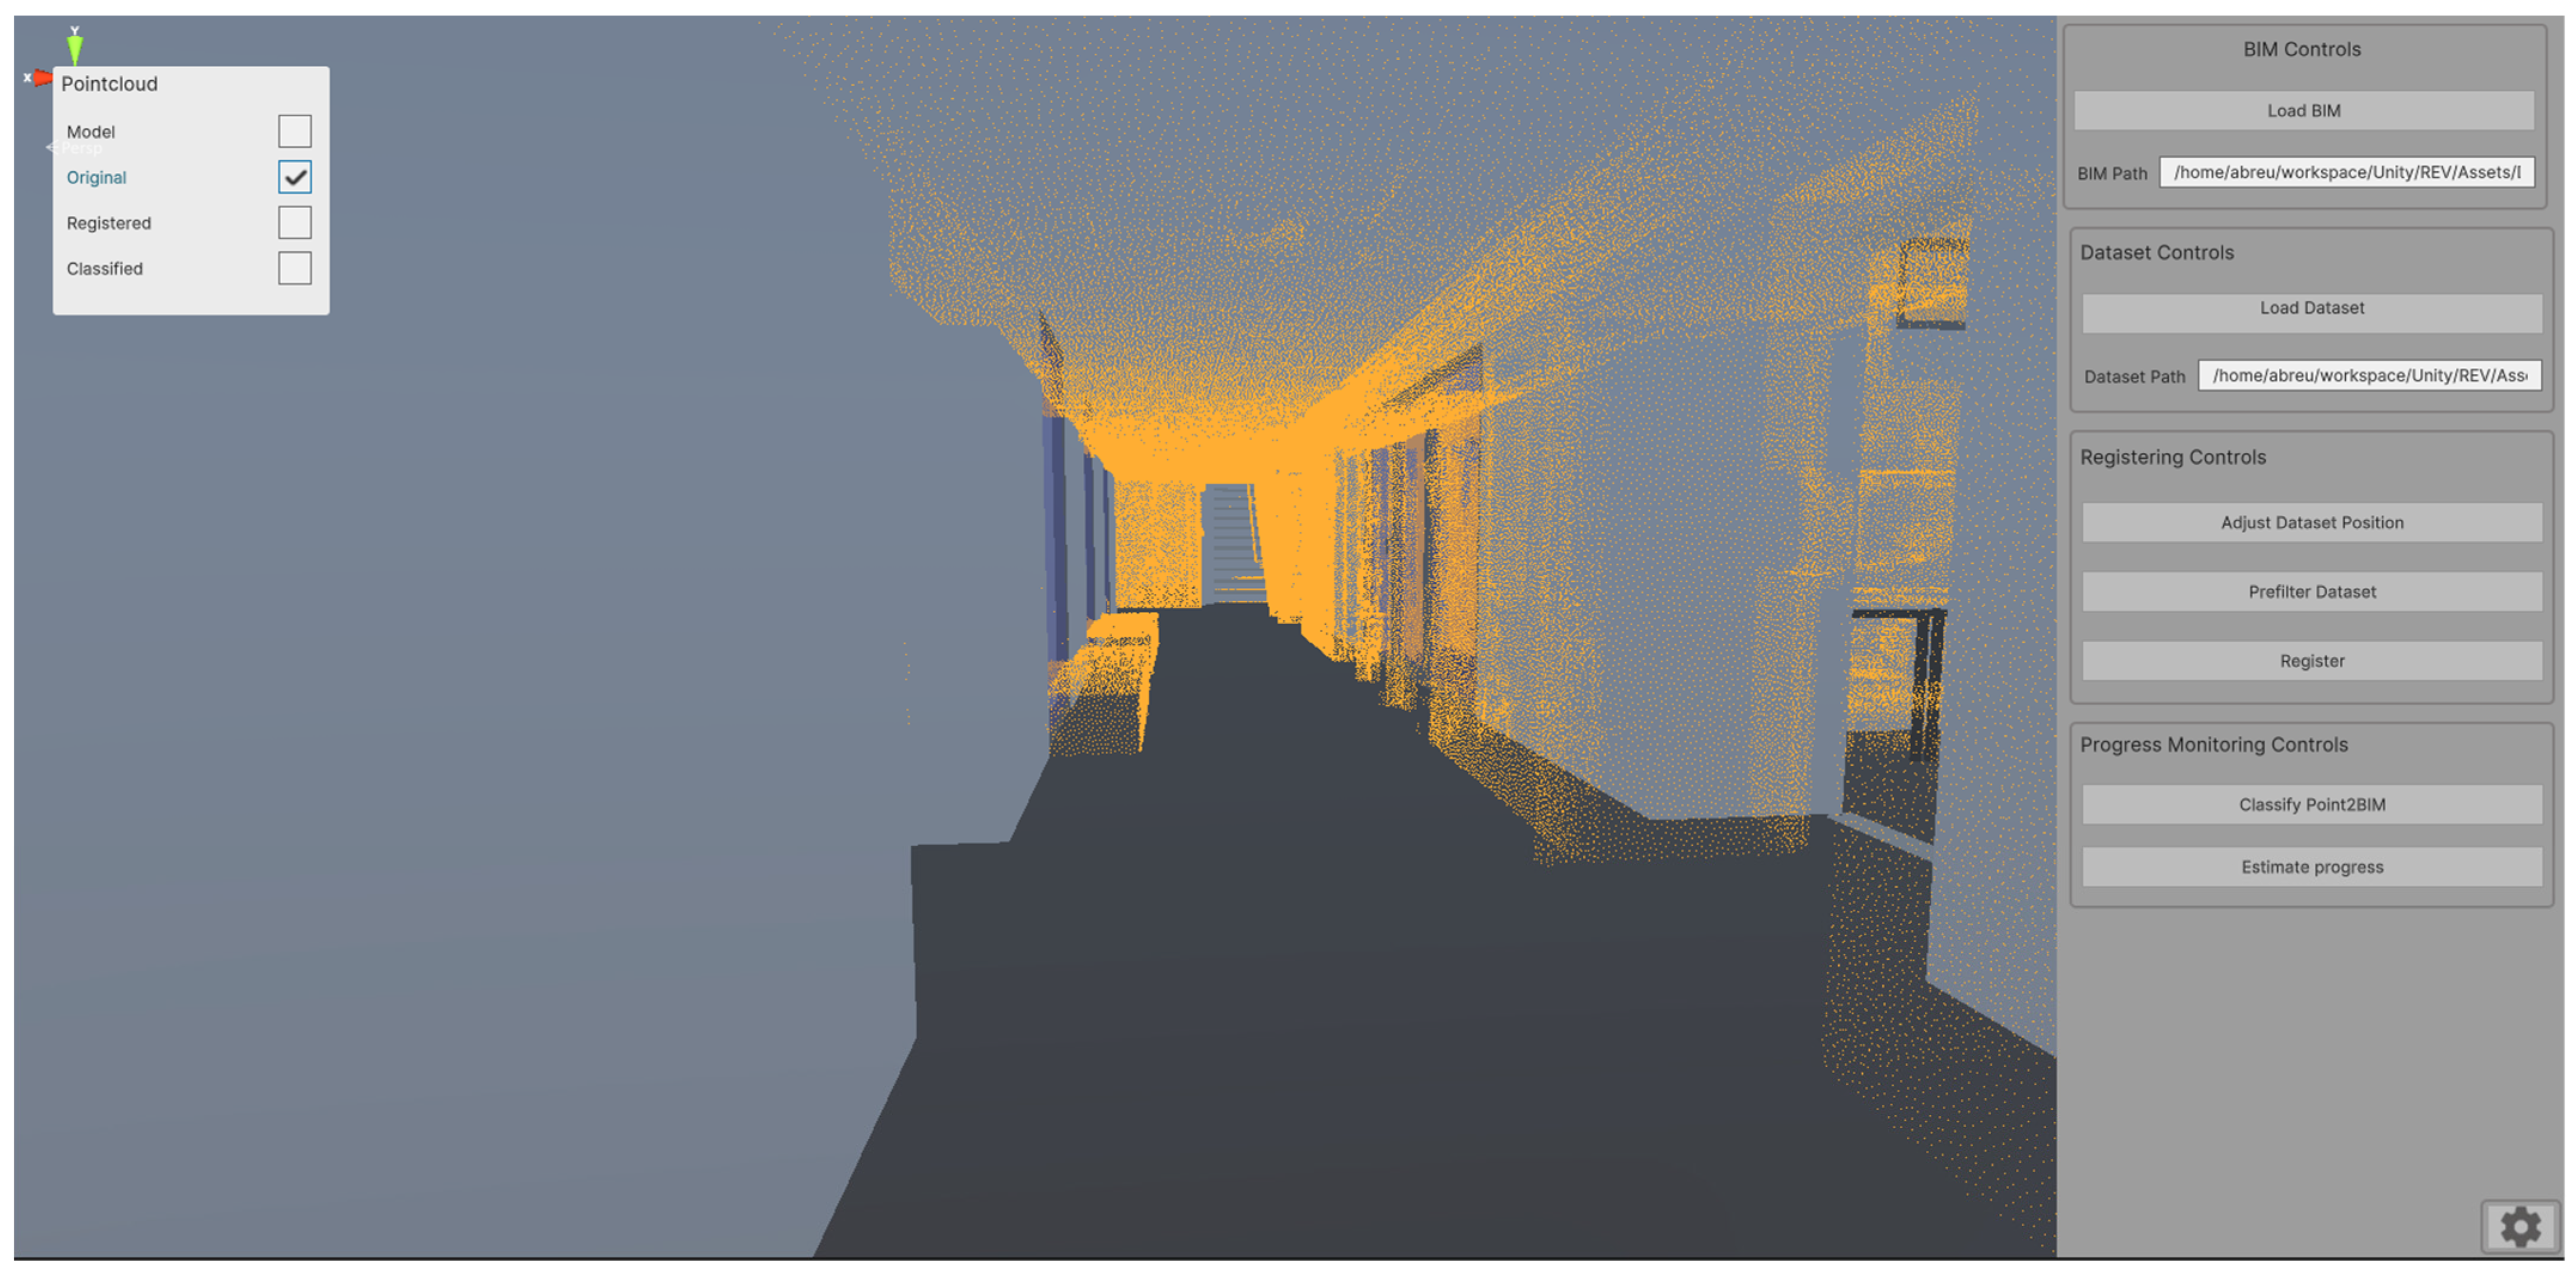
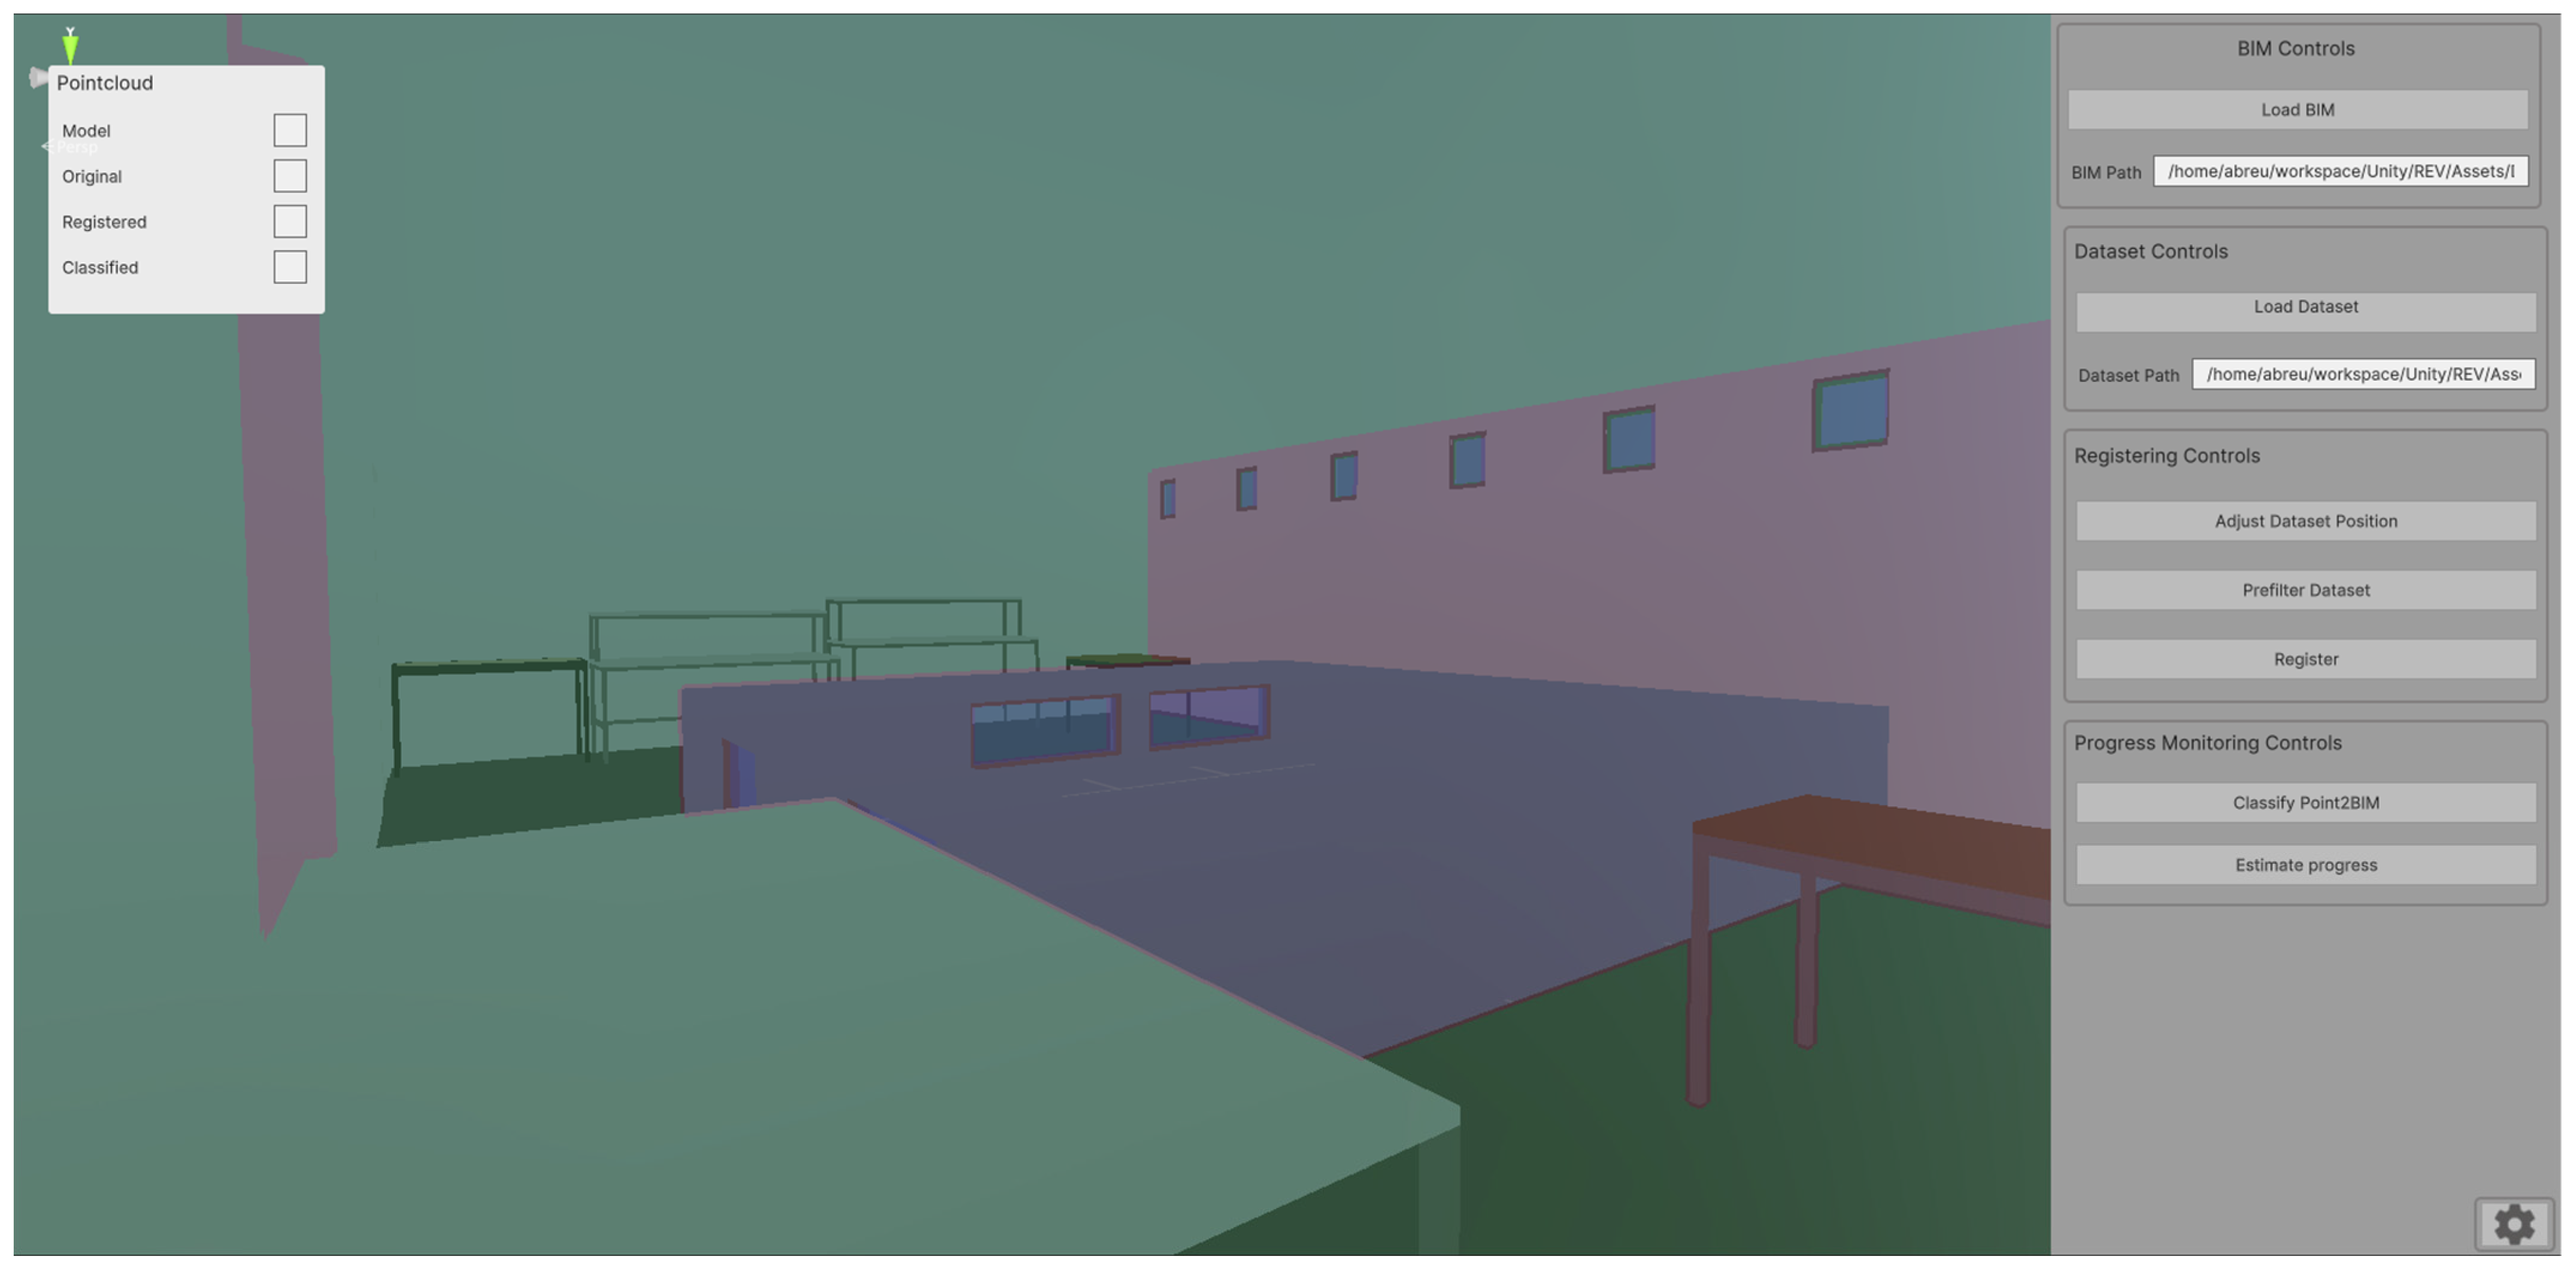
6. Use Case: Scan-vs-BIM Application for Change Detection
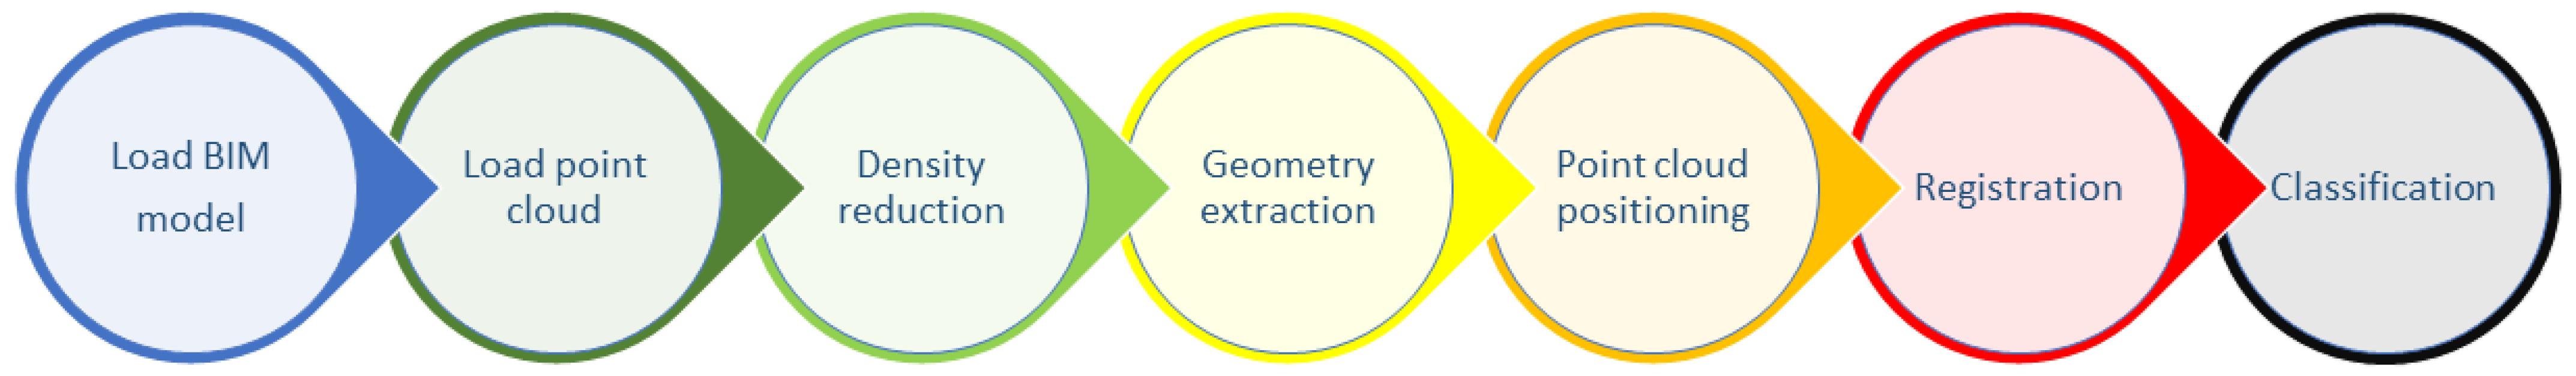
6.1. Data Pre-Processing
- point density, which defines the number of points within a unit area;
- measurement uncertainty, which refers to the standard deviation of the shortest distance between points and the target surfaces; and
- occlusions, which are the unsampled regions of the target surface.
6.1.1. Density Reduction
- Voxelization: divides the point cloud into small cubes (known as voxels), each containing a subset of the points. Density reduction is achieved by keeping only one point per voxel. This point can be chosen according to different principles, such as the centroid of the voxel or the proximity to the centre of the voxel.
- Minimum distance between points: removes points that are below a given minimum distance from each other. This value can be chosen based on the desired point density and level of detail. It can also be used with voxelization to further reduce density.
6.1.2. Geometry Extraction
- The direct method actually detects and identifies the clutter in the scene, segmenting it from the data.
- The indirect method detects and segments the structural elements in the scene, removing everything else which does not fit in that category.
6.2. Point Cloud Registration
6.3. Classification
6.4. Change Detection
7. Potential Research Applications
- Developing and training object recognition and tracking systems [43]. For example, it can be used to train machine learning algorithms to recognize and track furniture, appliances, and other objects.
- Developing automatic 3D reconstruction methodologies for creating 3D models of indoor spaces, which can be used for architectural design for example [46].
- Developing new construction progress monitoring techniques, matching the acquired point cloud to the BIM model, and estimating the degree of completeness of the construction [47].
- Developing change detection algorithms [48], which can be used for construction quality assessment. It can be used to track the evolution of a construction through time, or to detect differences between as-planned design and the actual as-built design.
8. Conclusions
Author Contributions
Funding
Institutional Review Board Statement
Informed Consent Statement
Data Availability Statement
Acknowledgments
Conflicts of Interest
References
- Omar, T.; Nehdi, M. Data acquisition technologies for construction progress tracking. Autom. Constr. 2016, 70, 143–155. [Google Scholar] [CrossRef]
- European Commission. Directive (EU) 2018/844 of the European Parliament and of the Civil Council; 30 May 2018. Available online: https://eur-lex.europa.eu/legal-content/en/TXT/?uri=CELEX%3A32018L0844 (accessed on 31 March 2023).
- Bosché, F.; Guillemet, A.; Turkan, Y.; Haas, C.T. Tracking the built status of MEP works: Assessing the value of a Scan-vs-BIM system. J. Comput. Civ. Eng. 2014, 28, 05014004. [Google Scholar] [CrossRef]
- Isikdag, U.; Zlatanova, S.; Underwood, J. A BIM-Oriented Model for supporting indoor navigation requirements. Comput. Environ. Urban Syst. 2013, 41, 112–123. [Google Scholar] [CrossRef]
- Nikoohemat, S.; Diakité, A.; Zlatanova, S.; Vosselman, G. Indoor 3D reconstruction from point clouds for optimal routing in complex buildings to support disaster management. Autom. Constr. 2020, 113, 103109. [Google Scholar] [CrossRef]
- Chen, W.; Chen, K.; Cheng, J.C.; Wang, Q.; Gan, V.J. BIM-based framework for automatic scheduling of facility maintenance work orders. Autom. Constr. 2018, 91, 15–30. [Google Scholar] [CrossRef]
- Naseer, M.; Khan, S.; Porikli, F. Indoor scene understanding in 2.5/3d for autonomous agents: A survey. IEEE Access 2018, 7, 1859–1887. [Google Scholar] [CrossRef]
- Moura, M.S.; Rizzo, C.; Serrano, D. Bim-based localization and mapping for mobile robots in construction. In Proceedings of the 2021 IEEE International Conference on Autonomous Robot Systems and Competitions (ICARSC), Santa Maria da Feira, Portugal, 28–29 April 2021. [Google Scholar]
- DuraARK EU Project Results. 2016. Available online: https://cordis.europa.eu/project/id/600908/results (accessed on 14 May 2023).
- DURAARK Datasets. Available online: http://data.duraark.eu/ (accessed on 31 March 2023).
- Khoshelham, K.; Tran, H.; Acharya, D.; Vilariño, L.; Kang, Z.; Dalyot, S. Results of the ISPRS benchmark on indoor modelling. ISPRS Open J. Photogramm. Remote Sens. 2021, 2, 100008. [Google Scholar] [CrossRef]
- Khoshelham, L.; Vilariño, L.D.; Peter, M.; Kang, Z. The Isprs Benchmark on Indoor Modelling. 2017. Available online: https://www2.isprs.org/commissions/comm4/wg5/benchmark-on-indoor-modelling/ (accessed on 14 May 2023).
- Thomson, C.; Boehm, J. Indoor Modelling Benchmark for 3D Geometry Extraction. In ISPRS Technical Commission V Symposium; International Society for Photogrammetry and Remote Sensing (ISPRS): Riva del Garda, Italy, 2014; Volume XL-5, pp. 581–587. [Google Scholar]
- Nan, L.; Xie, K.; Sharf, A. A search-classify approach for cluttered indoor scene understanding. ACM Trans. Graph. (TOG) 2012, 31, 137. [Google Scholar] [CrossRef]
- Previtali, M.; Barazzetti, L.; Brumana, R.; Scaioni, M. Towards automatic indoor reconstruction of cluttered building rooms from point clouds. In Proceedings of the ISPRS Annals of the Photogrammetry, Remote Sensing and Spatial Information Sciences, Riva del Garda, Italy, 23–25 June 2014; Volume II-5. [Google Scholar]
- Czerniawski, T.; Nahangi, M.; Haas, C.; Walbridge, S. Pipe spool recognition in cluttered point clouds using a curvature-based shape descriptor. Autom. Constr. 2016, 71, 346–358. [Google Scholar] [CrossRef]
- Huang, B.; Liao, H.; Ge, Y.; Zhang, W.; Kang, H.; Wang, Z.; Wu, J. Development of BIM Semantic Robot Autonomous Inspection and Simulation System. In Proceedings of the 2023 9th International Conference on Mechatronics and Robotics Engineering (ICMRE), Shenzhen, China, 10–12 February 2023. [Google Scholar]
- Kong, F.; Liu, X.; Tang, B.; Lin, J.; Ren, Y.; Cai, Y.; Zhu, F.; Chen, N.; Zhang, F. MARSIM: A light-weight point-realistic simulator for LiDAR-based UAVs. IEEE Robot. Autom. Lett. 2023, 8, 2954–2961. [Google Scholar] [CrossRef]
- Manivasagam, S.; Wang, S.; Wong, K.; Zeng, W.; Sazanovich, M.; Tan, S.; Urtasun, R. Lidarsim: Realistic lidar simulation by leveraging the real world. In Proceedings of the IEEE/CVF Conference on Computer Vision and Pattern Recognition, Seattle, WA, USA, 13–19 June 2020. [Google Scholar]
- Valero, E.; Bosché, F.; Bueno, M. Laser scanning for BIM. J. Inf. Technol. Constr. (ITcon) 2022, 27, 486–495. [Google Scholar] [CrossRef]
- Tang, P.; Huber, D.; Akinci, B.; Lipman, R.; Lytle, A. Automatic reconstruction of as-built building information models from laser-scanned point clouds: A review of related techniques. Autom. Constr. 2010, 19, 829–843. [Google Scholar] [CrossRef]
- Pătrăucean, V.; Armeni, I.; Nahangi, M.; Yeung, J.; Brilakis, I.; Haas, C. State of research in automatic as-built modelling. Adv. Eng. Inform. 2015, 29, 162–171. [Google Scholar] [CrossRef]
- Braun, A.; Tuttas, S.; Borrmann, A.; Stilla, U. Improving progress monitoring by fusing point clouds, semantic data and computer vision. Autom. Constr. 2020, 116, 103210. [Google Scholar] [CrossRef]
- Tsige, G.Z. Scan-vs-BIM Automated Registration Using Columns Segmented by Deep Learning for Construction Progress Monitoring. Master’s Thesis, University of Twente, Enschede, The Netherlands, 2022. [Google Scholar]
- Chuang, T.Y.; Yang, M.J. Change component identification of BIM models for facility management based on time-variant BIMs or point clouds. Autom. Constr. 2023, 147, 104731. [Google Scholar] [CrossRef]
- Stilla, U.; Yusheng, X. Change detection of urban objects using 3D point clouds: A review. ISPRS J. Photogramm. Remote Sens. 2023, 197, 228–255. [Google Scholar] [CrossRef]
- Girardeau-Montaut, D.C. Cloud compare—3D Point Cloud and Mesh Processing Software. Available online: https://www.danielgm.net/cc/ (accessed on 31 May 2023).
- Scott, W.R.; Roth, G.; Rivest, J.F. View planning for automated three-dimensional object reconstruction and inspection. ACM Comput. Surv. (CSUR) 2003, 35, 64–96. [Google Scholar] [CrossRef]
- Massios, N.A.; Fisher, R.B. A best next view selection algorithm incorporating a quality criterion. In Proceedings of the British Machine Vision Conference, Southampton, UK, 14–17 September 1998; Volume 2. [Google Scholar]
- JVásquez-Gómez, I.; Löpez-Damian, E.; Sucar, L. View planning for 3D object reconstruction. In Proceedings of the 2009 IEEE/RSJ International Conference on Intelligent Robots and Systems, St. Louis, MO, USA, 10–15 October 2009. [Google Scholar]
- Quintana, B.; Prieto, S.A.; Adán, A.; Vázquez, A.S. Semantic scan planning for indoor structural elements of buildings. Adv. Eng. Inform. 2016, 30, 643–659. [Google Scholar] [CrossRef]
- England, H. 3D Laser Scanning for Heritage: Advice and Guidance on the Use; Historic England: Swindon, UK, 2018. [Google Scholar]
- Vilariño, L.D.; Frías, N.L.; Previtali, M.; Scaioni, M.; Frías, J.B. Scan planning optimization for outdoor archaeological sites. ISPRS Int. Arch. Photogramm. Remote Sens. Spat. Inf. Sci. 2019, XLII-2/W11, 489–494. [Google Scholar] [CrossRef]
- Elberink, S.O.; Vosselman, G. Quality analysis on 3D building models reconstructed from airborne laser scanning data. ISPRS J. Photogramm. Remote Sens. 2011, 66, 157–165. [Google Scholar] [CrossRef]
- Muralikrishnan, B. Performance evaluation of terrestrial laser scanners—A review. Meas. Sci. Technol. 2021, 32, 072001. [Google Scholar] [CrossRef] [PubMed]
- Xu, Y.; Tong, X.; Stilla, U. Voxel-based representation of 3D point clouds: Methods, applications, and its potential use in the construction industry. Autom. Constr. 2021, 126, 103675. [Google Scholar] [CrossRef]
- Sharif, M.M.; Nahangi, M.; Haas, C.; West, J. Automated Model-Based Finding of 3D Objects in Cluttered Construction Point Cloud Models. Comput.-Aided Civ. Infrastruct. Eng. 2017, 32, 893–908. [Google Scholar] [CrossRef]
- Chen, J.; Kira, Z.; Cho, Y.K. Deep learning approach to point cloud scene understanding for automated scan to 3D reconstruction. J. Comput. Civ. Eng. 2019, 33, 04019027. [Google Scholar] [CrossRef]
- Guo, Y.; Bennamoun, M.; Sohel, F.; Lu, M.; Wan, J. 3D object recognition in cluttered scenes with local surface features: A survey. IEEE Trans. Pattern Anal. Mach. Intell. 2014, 36, 2270–2287. [Google Scholar] [CrossRef]
- Fischler, M.A.; Bolles, R.C. Random Sample Consensus: A Paradigm for Model Fitting with Applications to Image Analysis and Automated Cartography. Commun. ACM 1981, 24, 381–395. [Google Scholar] [CrossRef]
- Besl, P.J.; McKay, N.D. Method for registration of 3-D shapes. Sens. Fusion IV Control Paradig. Data Struct. 1992, 1611, 586–606. [Google Scholar] [CrossRef]
- Bentley, J.L.; Friedman, J.H.; Finkel, R.A. An algorithm for finding best matches in logarithmic expected time. ACM Trans. Math. Softw. 1977, 3, 209–226. [Google Scholar]
- Hagelskjaer, F.; Buch, A.G. Pointvotenet: Accurate Object Detection and 6 DOF Pose Estimation in Point Clouds. In Proceedings of the 2020 IEEE International Conference on Image Processing (ICIP), Abu Dhabi, United Arab Emirates, 25–28 October 2020. [Google Scholar]
- Nüchter, A.; Hertzberg, J. Towards semantic maps for mobile robots. Robot. Auton. Syst. 2008, 56, 915–926. [Google Scholar] [CrossRef]
- Pfreundschuh, P.; Hendrikx, H.F.; Reijgwart, V.; Siegwart, R.; Cramariuc, A. Dynamic object aware lidar slam based on automatic generation of training data. In Proceedings of the 2021 IEEE International Conference on Robotics and Automation (ICRA), Xi’an, China, 30 May–5 June 2021. [Google Scholar]
- Liu, G.; Wei, S.; Zhong, S.; Huang, S.; Zhong, R. Reconstruction of Indoor Navigation Elements for Point Cloud of Buildings with Occlusions and Openings by Wall Segment Restoration from Indoor Context Labeling. Remote Sens. 2022, 14, 4275. [Google Scholar] [CrossRef]
- Han, K.; Degol, J.; Golparvar-Fard, M. Geometry- and appearance-based reasoning of construction progress monitoring. J. Constr. Eng. Manag. 2018, 144, 04017110. [Google Scholar] [CrossRef]
- Park, S.; Ju, S.; Yoon, S.; Nguyen, M.H.; Heo, J. An efficient data structure approach for BIM-to-point-cloud change detection using modifiable nested octree. Autom. Constr. 2021, 132, 103922. [Google Scholar] [CrossRef]


| File Name | Format | Files | Size | Description |
|---|---|---|---|---|
| CRASLAB_annotated.zip | ASCII | 1 | 4.3 GB | Registered point cloud |
| CRASLAB_BIM.zip | IFC | 1 | 10.0 MB | BIM model |
| Variable | Description |
|---|---|
| Point X coordinate (m) | Coordinate of a point in the X axis |
| Point Y coordinate (m) | Coordinate of a point in the Y axis |
| Point Z coordinate (m) | Coordinate of a point in the Z axis |
| Point colour (R) | Red colour intensity (0–255) |
| Point colour (G) | Green colour intensity (0–255) |
| Point colour (B) | Blue colour intensity (0–255) |
| Intensity | Return strength of the laser beam (0–1) |
| Label | Point label |
| Space | Number of Scans | Number of Points |
|---|---|---|
| −108 | 6 | 183,787,505 |
| −109 | 3 | 89,906,532 |
| −110 | 5 | 132,629,460 |
| −111 | 3 | 89,001,431 |
| −175 | 4 | 89,377,049 |
| Total | 21 | 584,701,977 |
| Number | Object | Number of Points |
|---|---|---|
| 0 | unassigned | 62,412,722 |
| 1 | ceiling | 288,024,661 |
| 2 | floor | 73,215,411 |
| 3 | wall | 89,783,056 |
| 4 | door | 16,114,181 |
| 5 | window | 12,037,086 |
| 6 | desk | 20,302,532 |
| 7 | chair | 6,960,430 |
| 8 | cabinet | 20,399,593 |
| 9 | mobile cabinet | 453,602 |
| 10 | shelf | 2,834,452 |
| 11 | vents | 4,663,309 |
| 12 | water tank | 4,858,587 |
| 13 | bin | 869,702 |
| 14 | box | 18,243,987 |
| 15 | board | 5,266,606 |
| 16 | computer | 341,661 |
| 17 | screen | 1,864,965 |
| 18 | printer | 1,180,765 |
| 19 | vest | 67,128 |
| 20 | switch | 45,149 |
| 21 | paper dispenser | 397,825 |
| 22 | alcohol dispenser | 192,923 |
| 23 | cable | 281,862 |
| 24 | phone | 17,305 |
| 25 | robot | 1,617,877 |
| 26 | water kettle | 17,205 |
| 27 | stairs | 653,957 |
| 28 | ladder | 156,425 |
| 29 | oil heater | 45,711 |
| 30 | divider | 8,779,277 |
| 31 | hanger | 1,792,555 |
| 32 | fan | 100,189 |
| 33 | water dispenser | 709,281 |
Disclaimer/Publisher’s Note: The statements, opinions and data contained in all publications are solely those of the individual author(s) and contributor(s) and not of MDPI and/or the editor(s). MDPI and/or the editor(s) disclaim responsibility for any injury to people or property resulting from any ideas, methods, instructions or products referred to in the content. |
© 2023 by the authors. Licensee MDPI, Basel, Switzerland. This article is an open access article distributed under the terms and conditions of the Creative Commons Attribution (CC BY) license (https://creativecommons.org/licenses/by/4.0/).
Share and Cite
Abreu, N.; Souza, R.; Pinto, A.; Matos, A.; Pires, M. Labelled Indoor Point Cloud Dataset for BIM Related Applications. Data 2023, 8, 101. https://doi.org/10.3390/data8060101
Abreu N, Souza R, Pinto A, Matos A, Pires M. Labelled Indoor Point Cloud Dataset for BIM Related Applications. Data. 2023; 8(6):101. https://doi.org/10.3390/data8060101
Chicago/Turabian StyleAbreu, Nuno, Rayssa Souza, Andry Pinto, Anibal Matos, and Miguel Pires. 2023. "Labelled Indoor Point Cloud Dataset for BIM Related Applications" Data 8, no. 6: 101. https://doi.org/10.3390/data8060101