1. Summary
Buildings are at the core of the European strategy towards a zero-emission and fully decarbonized stock by 2050 [
1]. A key priority at the European level is to make the energy performance of buildings more efficient in the Member States [
2,
3]. Important policy provisions for a long-term improvement of the EU building stock are contained in the Energy Performance of Buildings Directive recast (2010/31/EU—EPBD [
4]) and its recent revision [
5]. As assessed in [
6], The implementation of the cost-optimal methodology marked a novel approach to the establishment of the minimum energy performance requirements for new and existing buildings. Member States have to calculate and establish cost-optimal levels of minimum energy performance requirements for new and existing buildings following the established comparative methodology framework [
7] and related guidelines [
8].
As regards the application, the cost-optimal methodology is an efficient and complete decision-making tool for building designs that considers both energy and economic evaluations. Its introduction signaled an important milestone towards the renovation of the existing building stock and a substantial transformation towards a zero-carbon society.
Starting from the definition of the reference buildings, the methodology comprises the establishment of technical variants and measures or packages of measures to be compared in terms of costs and energy performance in the global cost curve. In 2012, the Commission provided the Delegated Regulation 244/2012 (European Commission, 2012a), related to the comparative methodology framework of cost-optimal levels, to be used by Member States to benchmark their building standards.
The calculation approach can be summarized in six steps:
Establishment of reference buildings by selecting real or virtual buildings representing the building stock. Member States shall define them for at least three building categories, both for new and existing buildings (residential single-family, residential multi-family, and offices). According to Regulation 244, Annex I, Member States must also define reference buildings for other building categories for which specific energy performance requirements exist. For new buildings, the energy performance standard in force can be assumed as the base case. For the existing stock at least two reference buildings have to be considered, which can be established on the basis of size, age, cost, structure, construction material, use pattern, or climatic zone;
Identification of the energy efficiency and renewable measures to be implemented in new or existing buildings, including different packages of measures or measures of different levels (e.g., different insulation levels), which must respect the EU and national legislation on construction products, comfort criteria indoors and indoor environmental quality;
Calculation of the (net) primary energy consumption based on the current national or CEN standards methodologies for each selected building variant;
Calculation of the global cost at each step using the Net Present Value based on 30 years for residential and 20 years for non-residential buildings. The included cost categories are initial investment costs, running costs (i.e., energy, operational, maintenance, and replacement costs), disposal costs, final value, and the cost associated with CO2 emissions (only for the macroeconomic perspective);
Identification of cost-optimal levels for each reference building expressed in primary energy consumption (kWh/m2y or in the relevant unit). Cost-optimal levels can be calculated for both macroeconomic and financial perspectives, but they are normally derived from the second one;
Evaluation of the gap with current minimum energy performance requirements. If the difference is more than 15%, Member States are asked to justify the gap or define a plan to reduce the gap.
The calculation of the (net) primary energy consumption should be based on the current National or CEN standards, while the cost-optimal levels can be calculated from both macroeconomic and financial perspectives.
Energy efficiency is associated with increased costs and, generally, the more efficient the measures are, the higher the expense. This is because the only benefit, normally monetized, is the energy cost savings from a financial perspective.
The financial calculation of the global costs assumes that all costs are paid by the customer (i.e., including all applicable taxes, VAT, and charges). In addition, the calculation includes the subsidies for different measures or measure packages. The following equation is applied:
where
is the calculation period;
is the global cost (referring to starting year
) over the calculation period;
is the initial investment cost for a measure or a set of measures
j;
is the annual cost in the year
i for a measure or a set of measures
j;
is the residual value of the measure or set of measures
j at the end of the calculation period (discounted to the starting year
);
is the discount factor for year
i, based on the discount rate r.
The included cost categories are initial investment costs, running costs (i.e., energy, operational, maintenance, and replacement costs), disposal costs, final value, and the cost associated with CO2 emissions (only for the macroeconomic perspective). The gap is between the NZEBs levels and the current minimum energy performance requirements. If the difference is more than 15%, Member States are asked to justify the gap or define a plan to reduce it. Key calculation parameters in the cost-optimal calculation are the discount/interest rate, and the annual increase of energy prices, as well as primary energy factors associated to different fuels.
The cost-optimal methodology appears very effective both to upgrade the energy performance requirements in force at the national level and to assess the effects of policy measures to achieve the mandatory target of near-zero energy buildings (NZEBs) [
9,
10,
11,
12]. A recent study [
13] showed that the majority of Member States seems to adopt the cost-optimal approach in an appropriate way and use it to define NZEBs requirements.
From an early assessment of the cost-optimal methodology, a heterogeneous situation characterized European countries as each building type and climate presented varying cost-optimal levels [
14]. Moreover, since its release, the methodology spread mainly theoretically at government and scientific levels, but not yet sufficiently among professionals.
Regardless of comparison issues among cost-optimal levels and a non-uniform application across Europe [
15], it is generally agreed that it represents an efficient and complete decision-making tool for building design that considers both energy and economic evaluations. The importance of this assessment is highlighted by the efforts in the literature to develop the methodology. However, studies mainly focus on a specific climate or building type, but a comprehensive methodology implementation is still missing and undoubtedly necessary to assess its progress with strengths and weaknesses and possible future developments. Moreover, this assessment can guide the revision of the cost-optimal methodology that is foreseen in 2026 according to the revision of the EPBD [
5].
The first cost-optimal reports were released and analyzed in 2013. A joint, consistent and comparable level of ambition was desirable after the first assessment [
16]. A heterogeneous situation is characterized by European countries as each building type and climate presented varying cost-optimal levels [
17]. Furthermore, comparison issues emerged among cost-optimal levels, adopting a non-uniform application across Europe.
The comparison between the cost-optimal levels obtained with the two calculation rounds shows that, for almost all building types, lower values were obtained in 2018 with respect to the 2013 values. The comparison between the cost-optimal levels (consolidated version) and the latest NZEB levels reveals that many countries are introducing NZEB energy requirements which are lower (about −50%) than cost-optimal. In fact, the NZEB levels for new buildings result in substantially higher cost-optimal levels only for four countries.
The revised reports were submitted by Member States in 2018–2021 but have not been assessed yet [
18]. This data paper provides the first datasets related to the assessment of these reports. Data on energy price, discount rate, and primary energy factors are provided for each Member State for different residential and non-residential buildings. Data on cost-optimal levels for building types are also included in the datasets as well as the gaps with the previous reports both at building and element levels. Considered reference buildings and energy efficiency measures are also extracted from the reports and available. The conformity and plausibility of the Member States’ reports are assessed in the linked datasets.
In addition to summarizing the progress of the cost-optimal methodology implementation in European Member States, the data are useful to compare the latest reports submitted with the previous ones, as well as for further analysis. Within this perspective, the outcomes of this cost-optimal review assume a strategic value, since they allow a comprehensive comparison among Member States assessing the progress and related strengths and weaknesses. Its future development and implementation will be crucial for the renovation of existing buildings and a zero-carbon society in 2050.
2. Data Description
Data were collected from the latest cost-optimal reports that Member States submitted to the European Commission to comply with the Energy Performance of Building Directive.
The methodology is based on the principle of the cost-benefit analysis, and it shall be calculated from two economic perspectives: the financial and the macroeconomic, which refer to different discount rates (lower in the macroeconomic one) and cost items. While the financial perspective includes taxes, macroeconomics considers greenhouse gas emission costs.
The first step of the current assessment has been the reports’ collection, and their official translation [
6]. To harmonise the data collection, an assessment template has been developed to summarise the different steps of the cost-optimal methodology. The data collection can be summarised in the following sections that reflect the developed template:
establishment of reference buildings,
identification of energy efficiency measures,
measures based on renewable energy sources and/or packages and variants of such measures for each reference building,
calculation of the primary energy demand,
calculation of the global cost in terms of net present value for each reference building,
sensitivity analysis,
derivation of a cost-optimal level of energy performance for each reference building.
In relation to the analyzed reports, the magnitude of this study can be also perceived by the total reports’ pages to be analyzed (5238) and related annexes (3971). Although Member States were contacted to provide additional information when possible, frequently information was missing or not extractable due to non-clear translations, provided units, tables, figures, or explained methodology.
Data on cost-optimal reports are attached to this paper in the form of an excel spreadsheet (named “Cost-optimal datasets”). It is composed of different sheets:
In Sheet 1 (named “report overview”), the information in
Table 1 is available for each Member States.
In Sheet 2 (named “PEF, discount rate, energy price”), the information in
Table 2 is available for each Member States.
In Sheet 3 (named “Cost-optimal levels, gaps”), the information in
Table 3 is available for each Member States:
In Sheet 4 (named “conformity-plausibility”), the information in
Table 4 are available and summarized:
In Sheet 5 (named “Gap”), the information in
Table 5 is available for each Member States:
Finally, in Sheet 6 (named “Best practices”), best practices are identified for Member States in relation to the different aspects of the assessment (Establishment of reference buildings, Identification of energy efficiency measures, Calculation of the primary energy demand, Calculation of the global cost in terms of net present value, Sensitivity analysis, Derivation of a cost-optimal level of energy performance, and Plan to reduce the gap).
3. Methods
All Member States submitted to the Commission their report on the implementation of the cost-optimal methodology between 2018 and 2021.
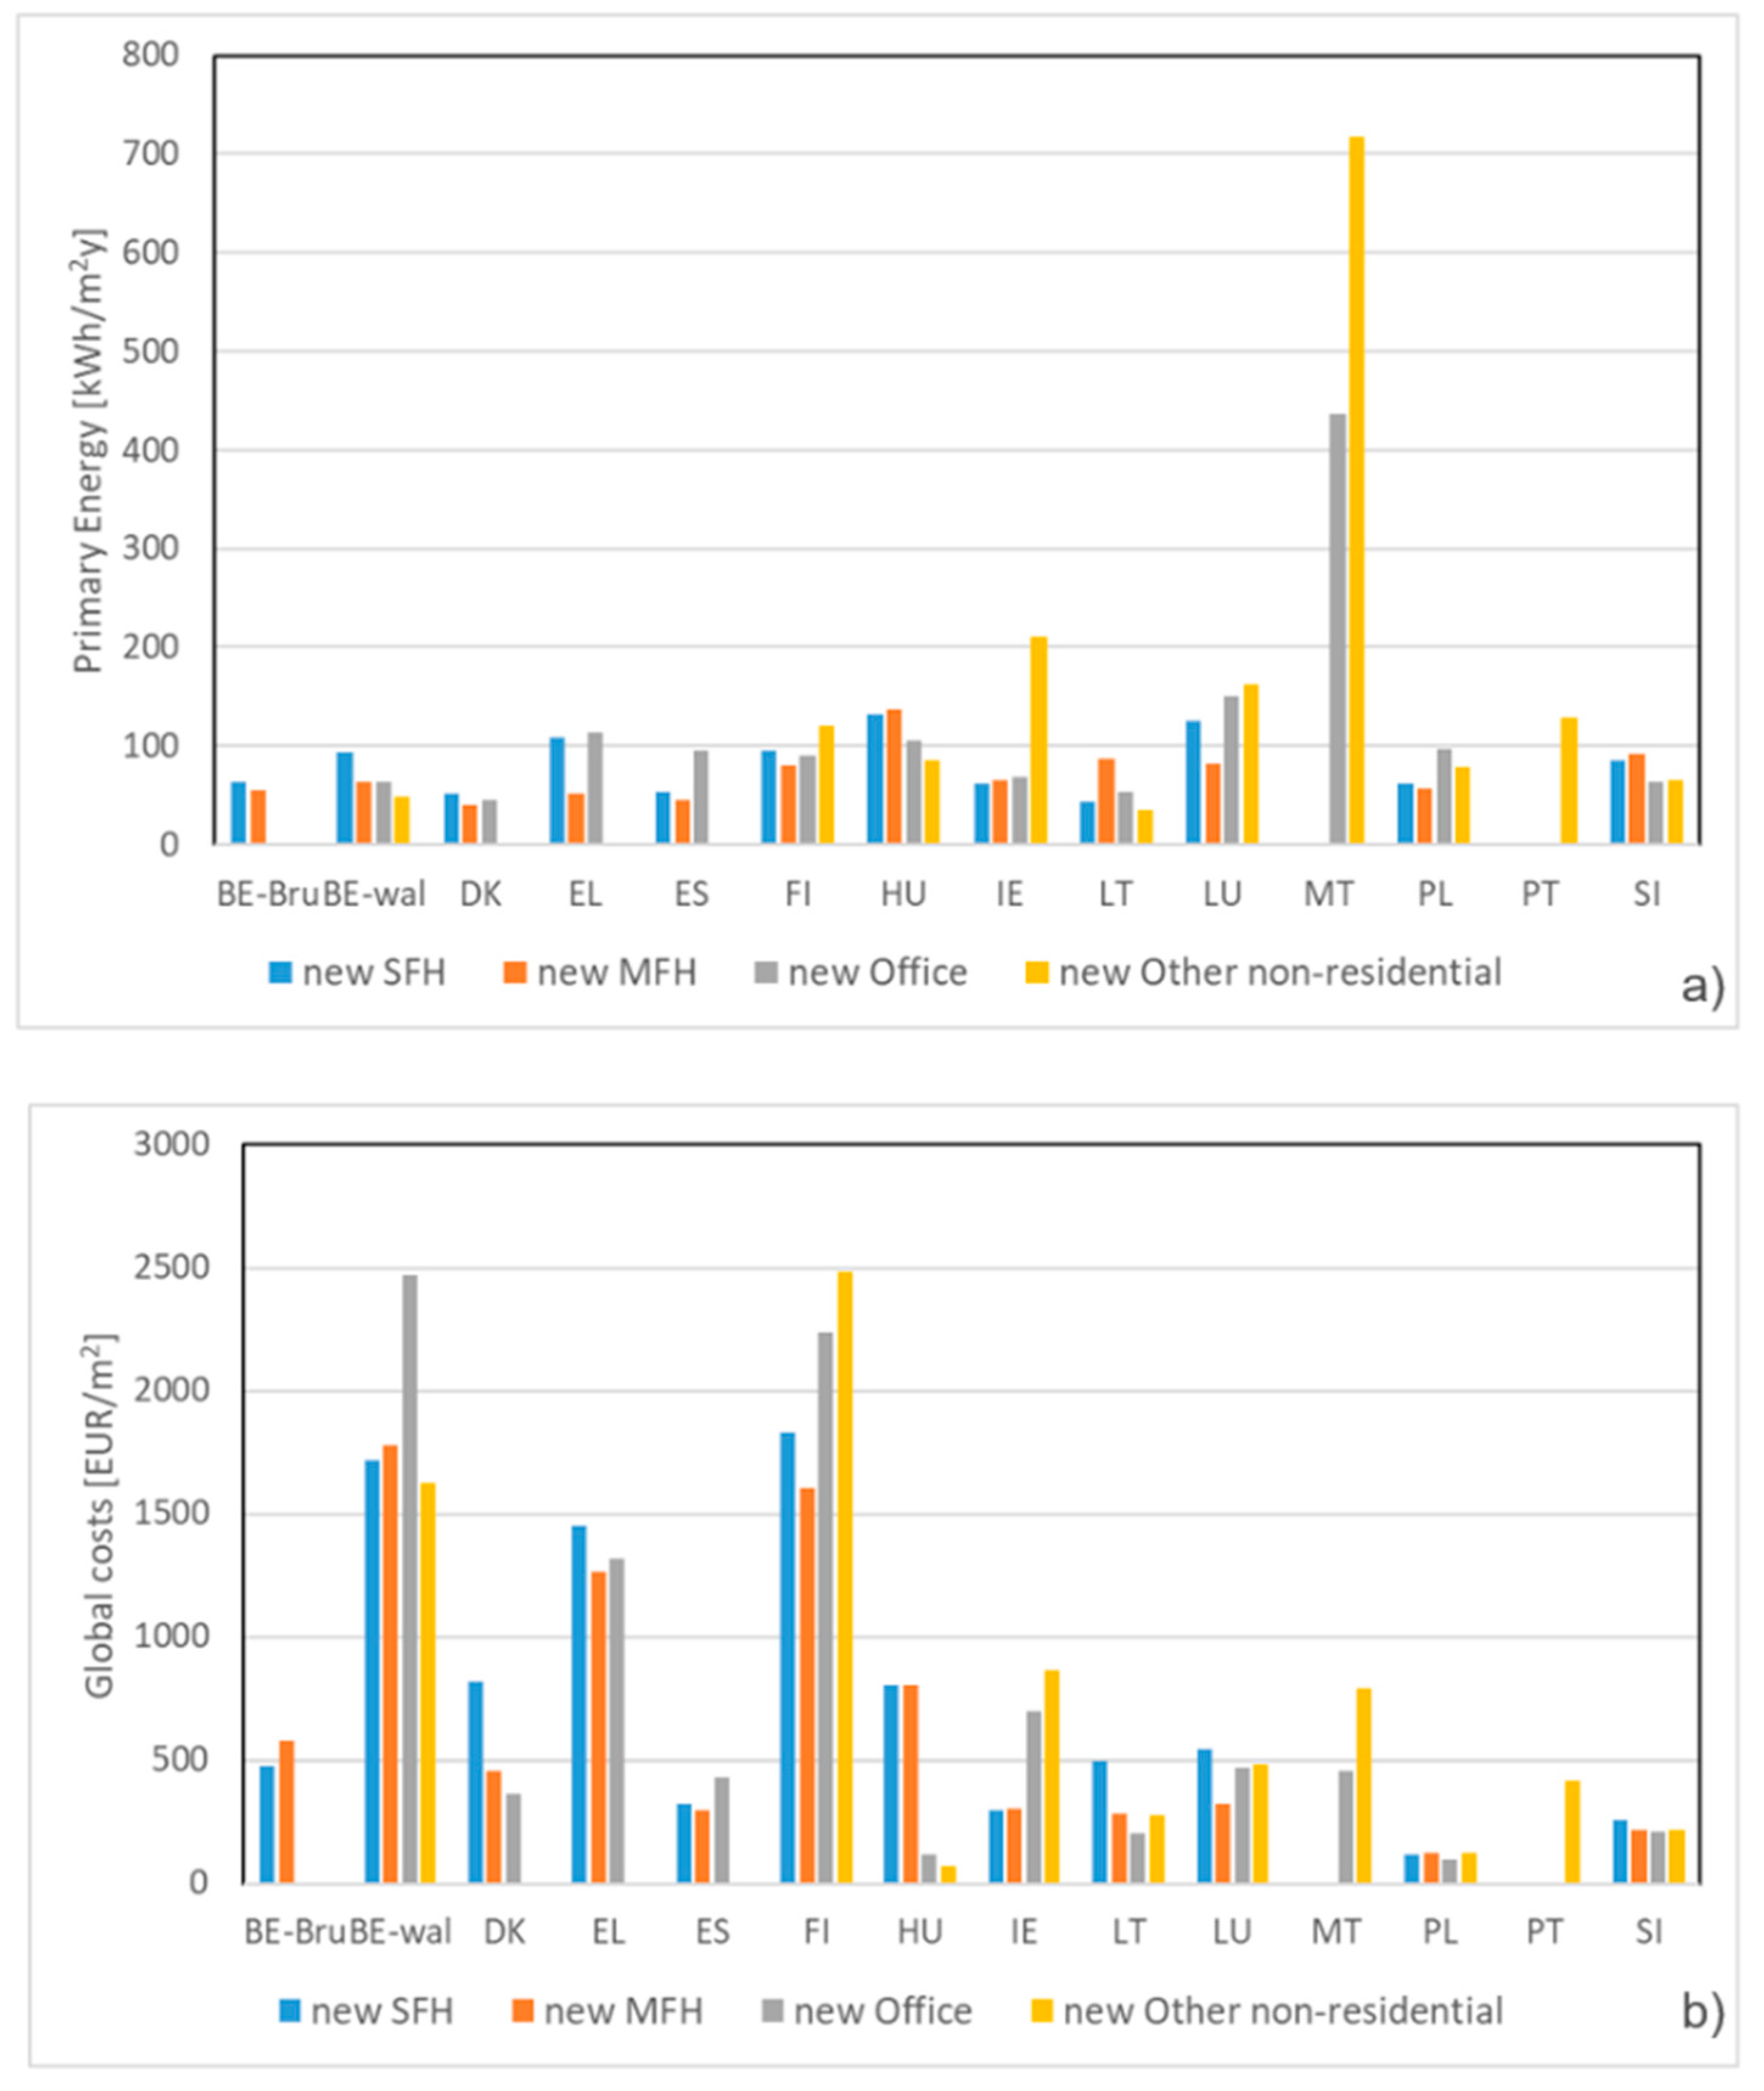
Data linked to this paper allow for visualizing the cost-optimal levels for new and existing buildings (
Figure 1 and
Figure 2). This data paper also provides comprehensive review progress of the implementation of the cost-optimal methodology in Member States to assess strengths and weaknesses, and future possible developments in the light of the recent policy developments. The assessed values were related to new and existing Single-Family Houses (SFH), Multi-Family Houses (MFH), Offices and other non-residential (N-R) buildings. The last one is the least covered category, for which Member States are free to select the reference type. In some cases, these results refer to a particular type (often an educational building), in others to an average among different building types (e.g., school, commercial and hospital).
For new buildings, the majority of cost-optimal points fell between 50 and 100 kWh/m2y, with an average of 80 kWh/m2y for the residential sector and 140 kWh/m2y for the non-residential sector. Associated global costs are often lower than 1500 EUR/m2, with an average of 925 EUR/m2 for the residential and 800 EUR/m2 for the non-residential sector. For existing buildings, the majority of cost-optimal levels fell between 75 and 175 kWh/m2y, with an average of 130 kWh/m2y for the residential and 180 kWh/m2y for the non-residential sector. For existing buildings, the global costs are generally lower than 600 EUR/m2, with an average of 500 EUR/m2 for the residential and 385 EUR/m2 for the non-residential sector. However, from the reports analyzed it has been not possible to extract all the cost-optimal levels for all Member States, as half of them did not derive them in a clear and complete way. It is interesting to observe that in almost all cases the primary energy consumptions associated to cost-optimal levels are lower in the cold zones. Global costs are lower in the Continental zone, which includes the States of Eastern Europe.
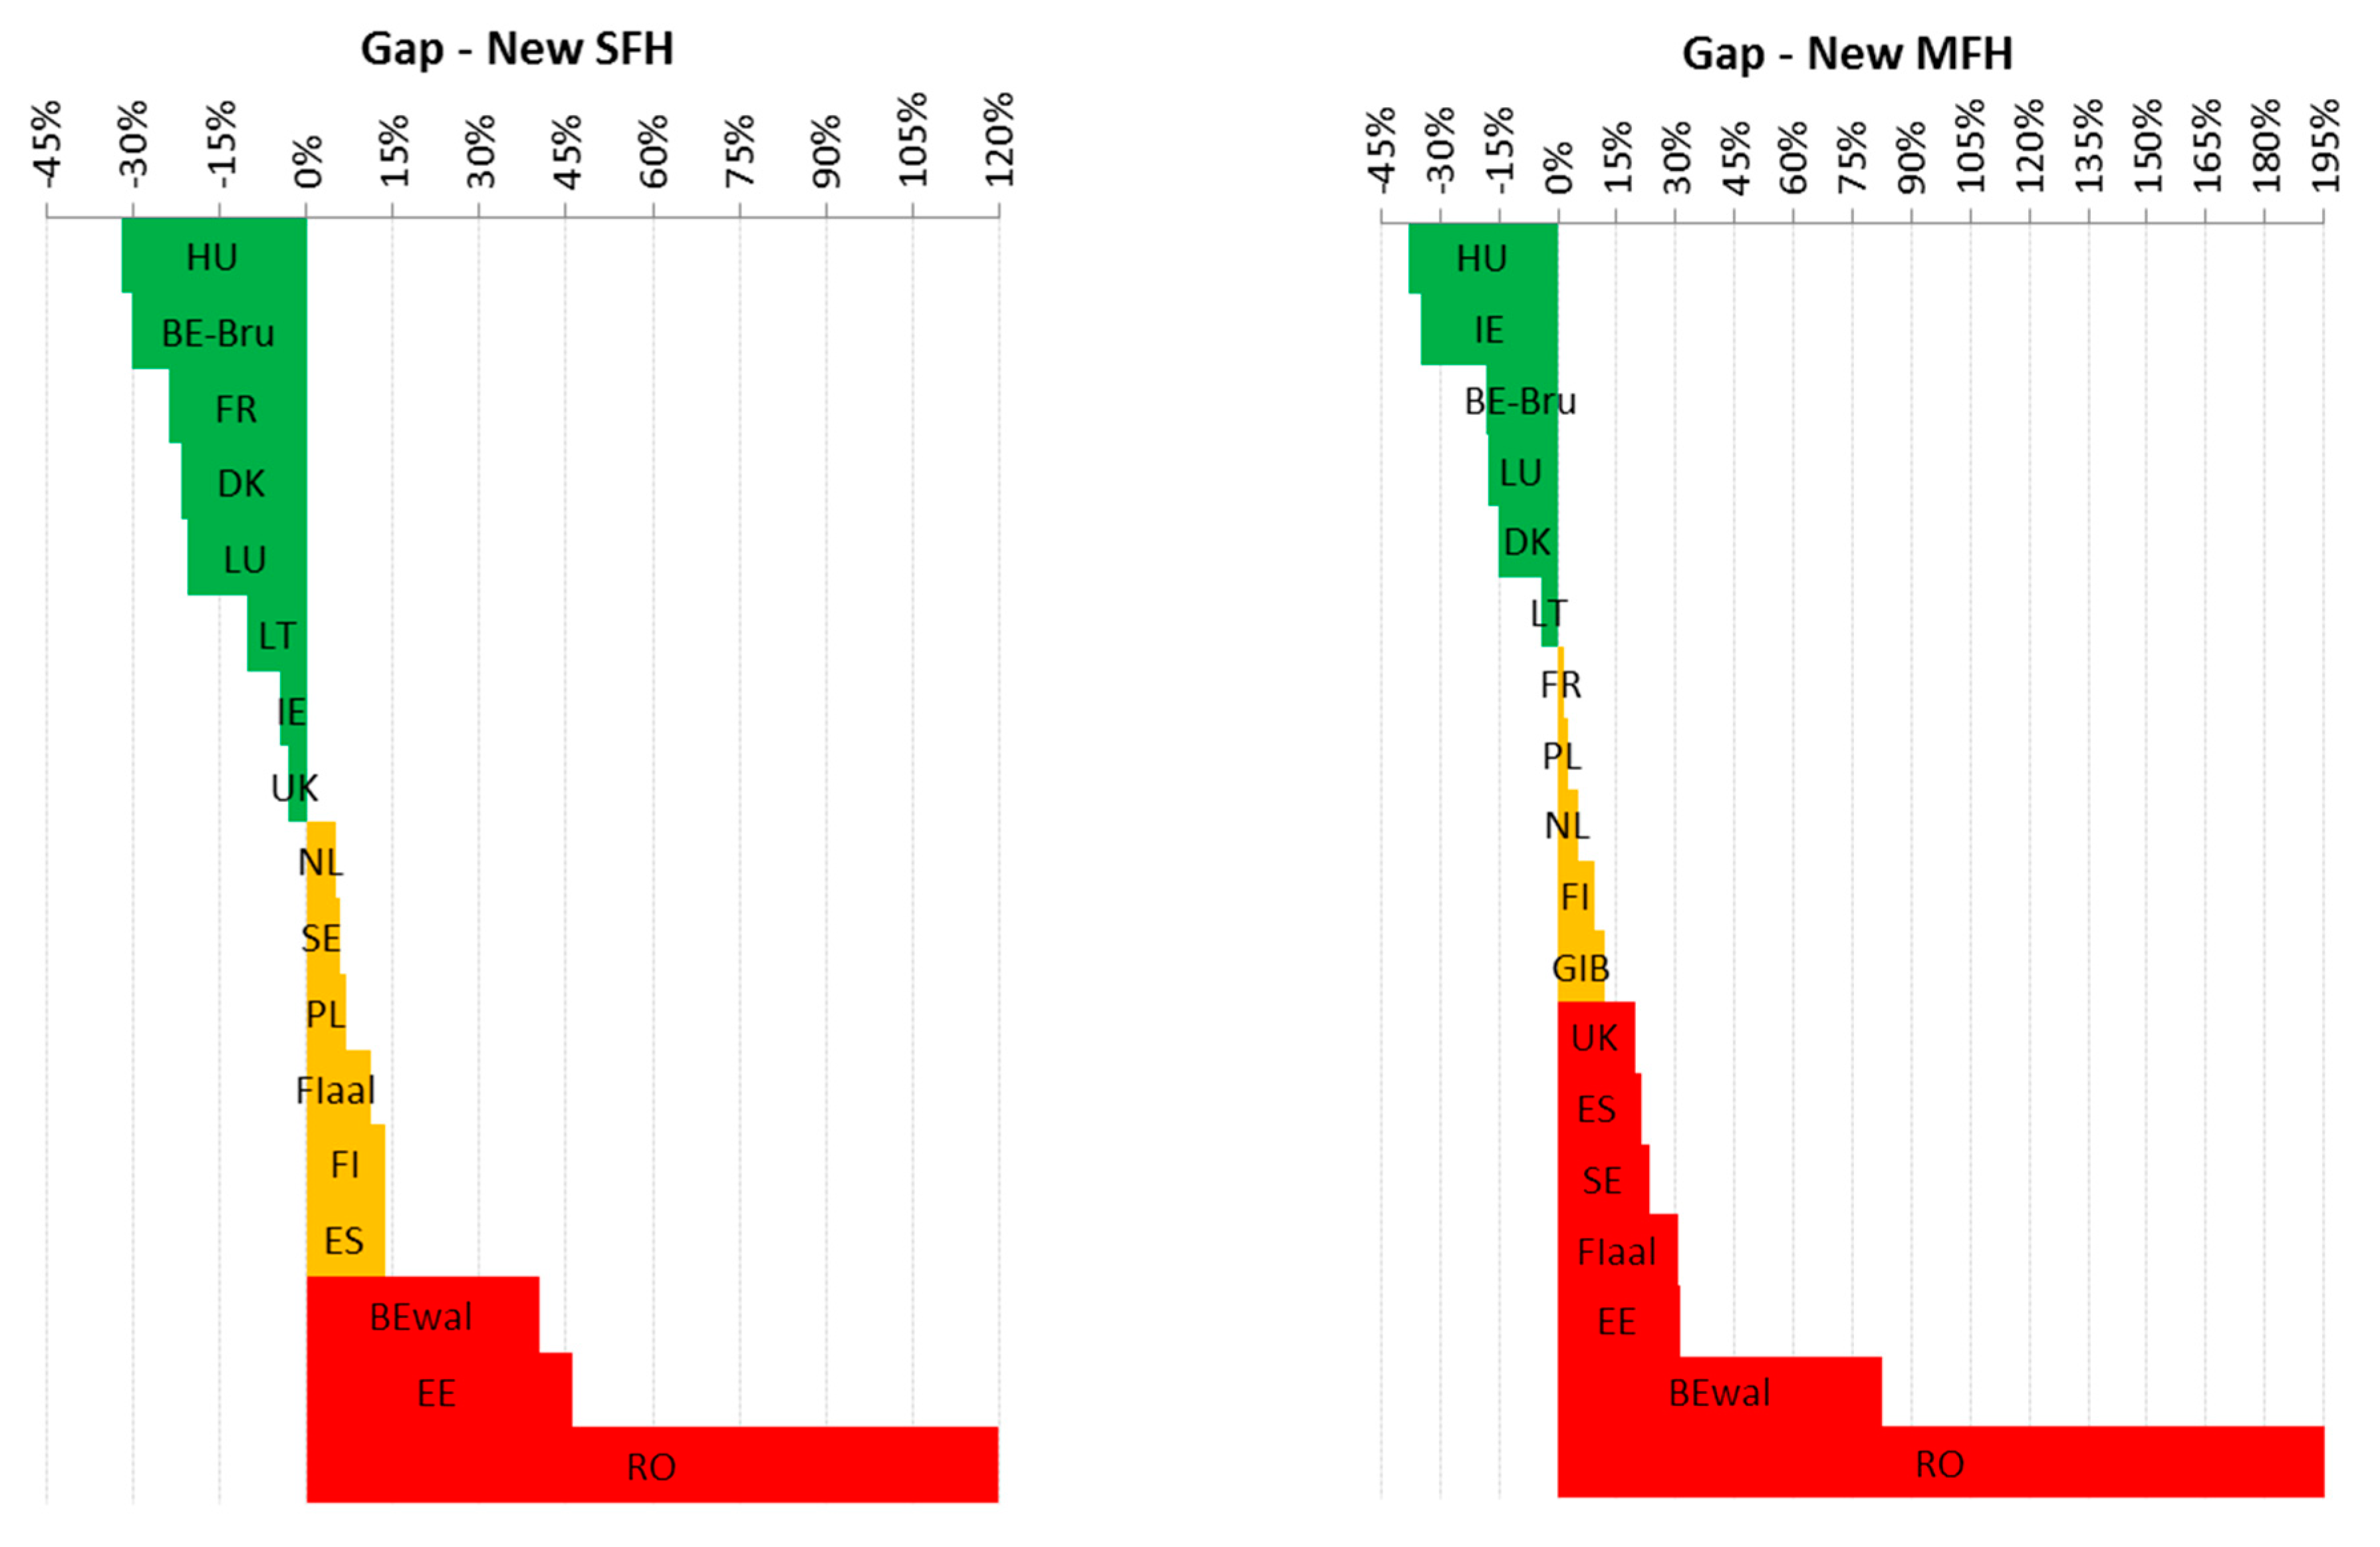
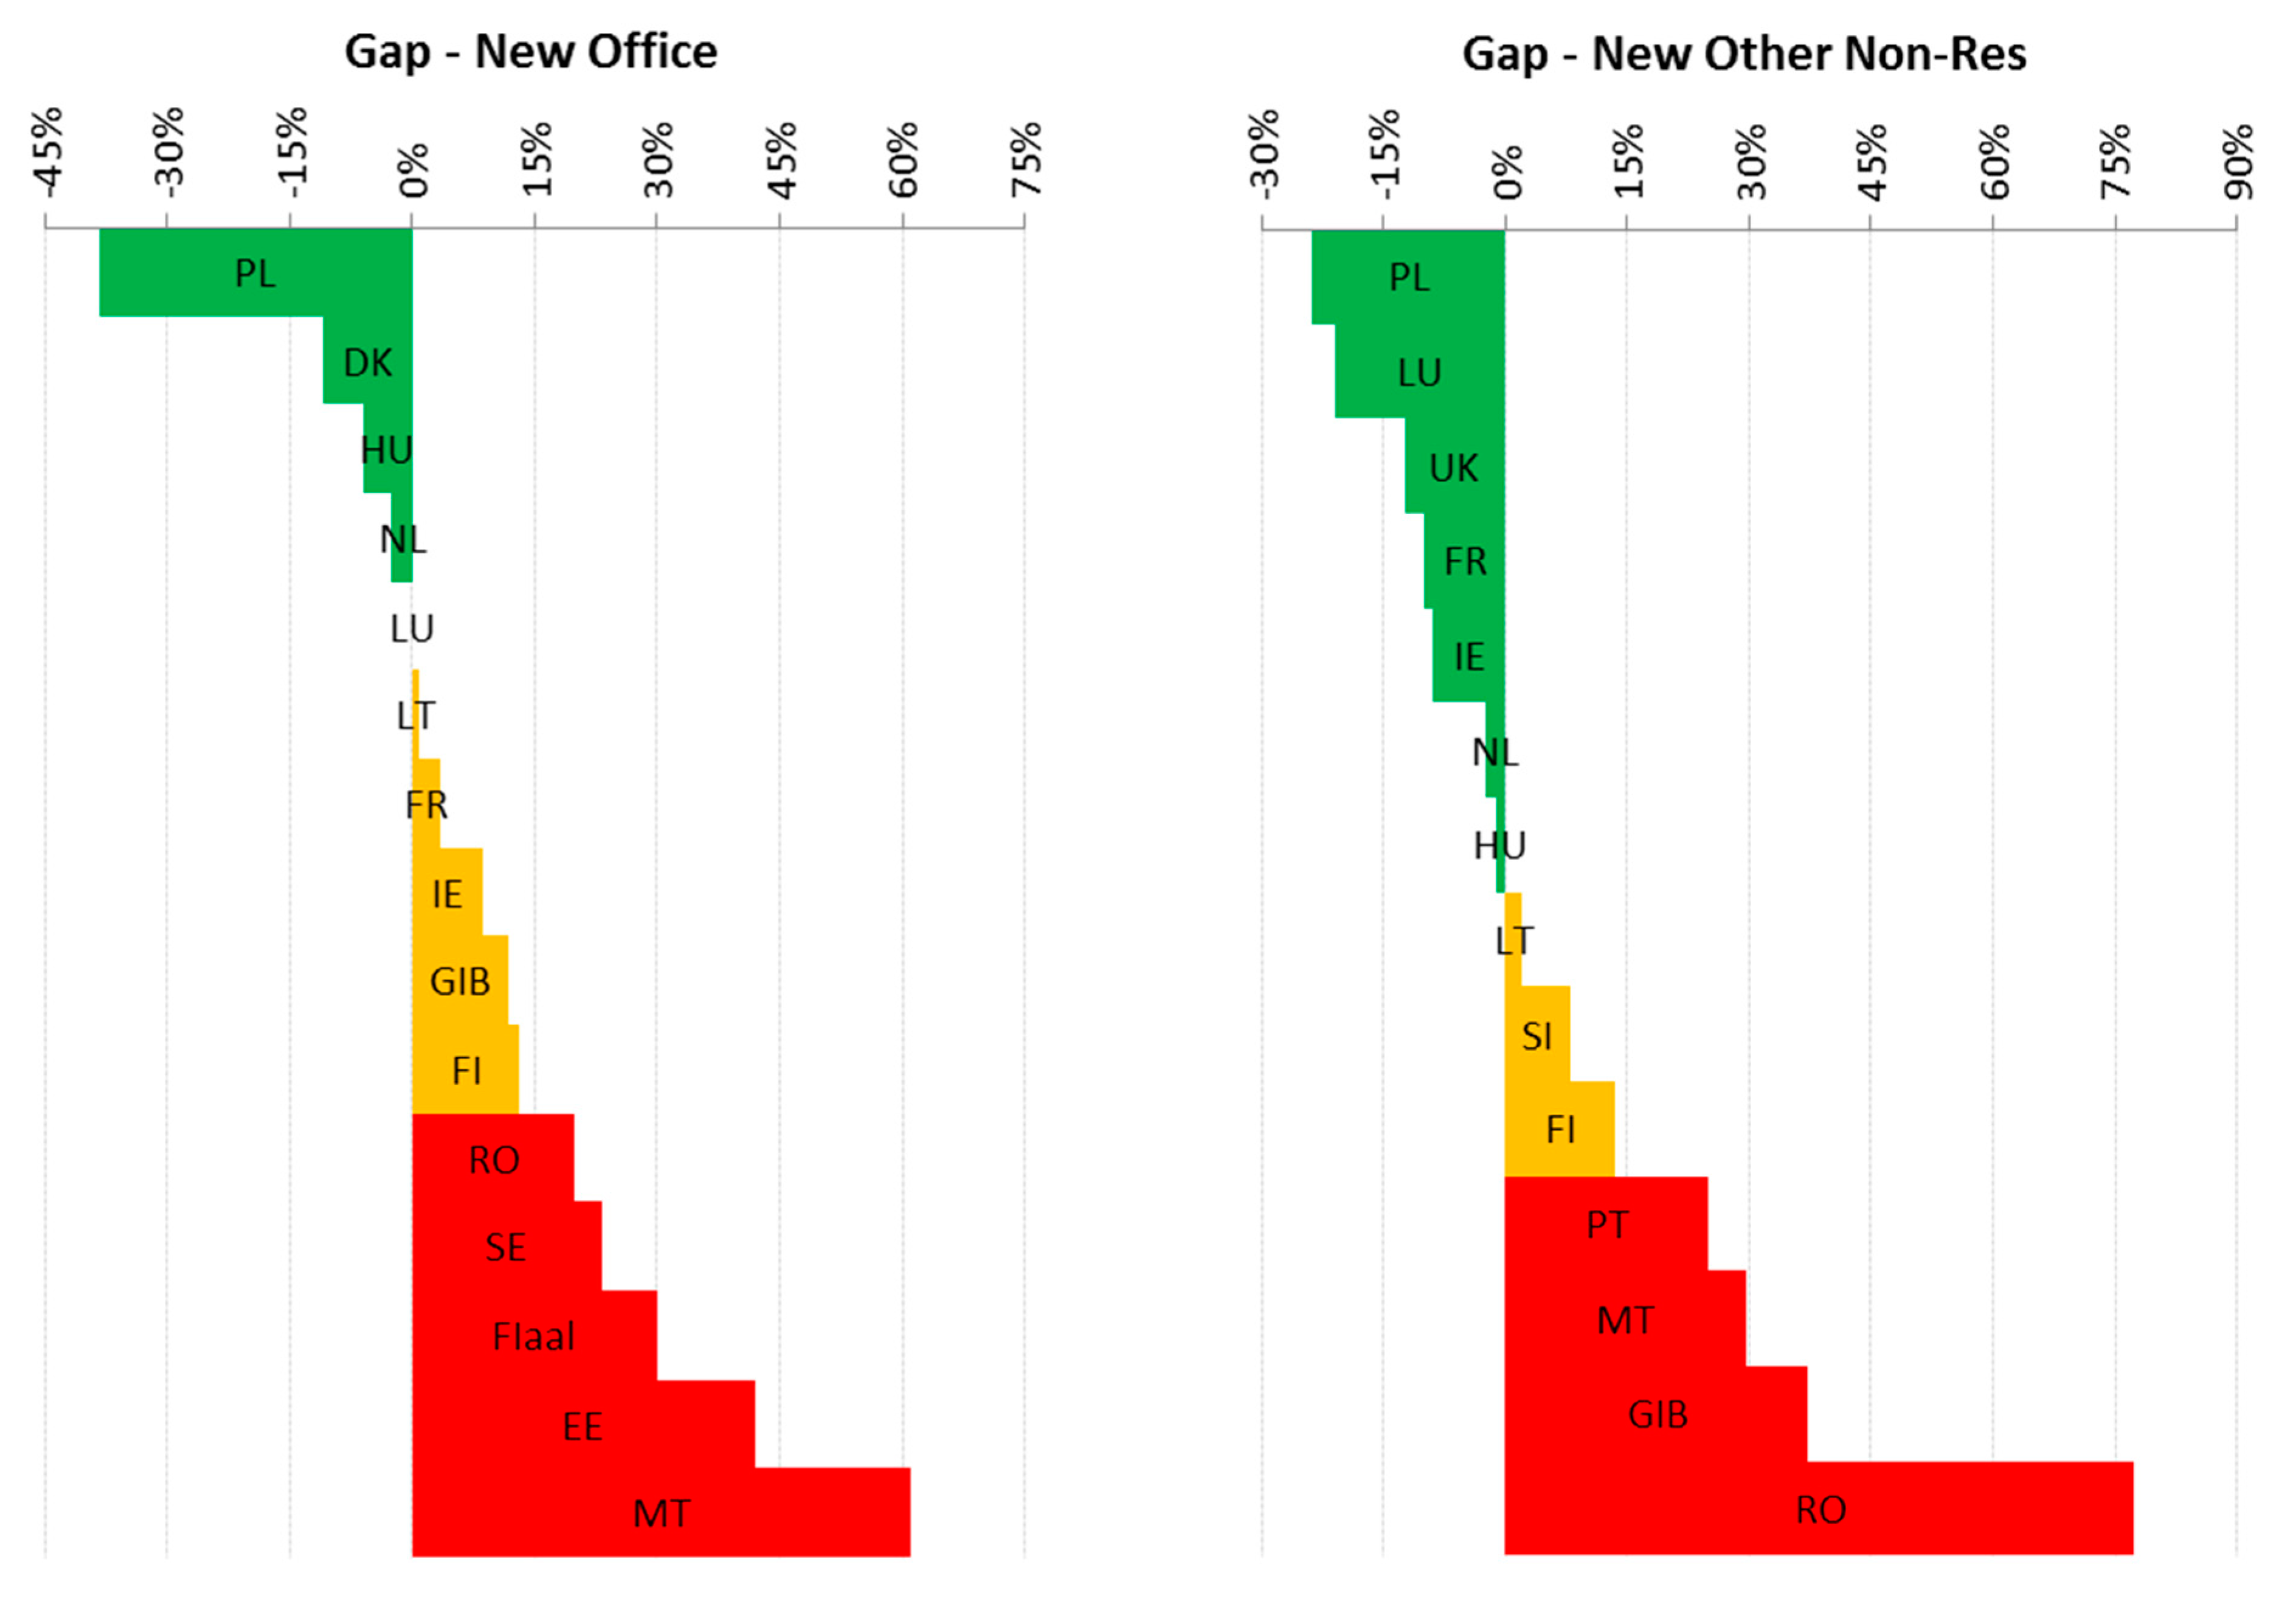
The evaluation of the gaps between cost-optimal levels and current requirements represents a relevant step of the calculation since it should provide useful indications for the update of existing energy performance regulations. National minimum energy performance requirements should not be higher than 15% compared to the outcome of the cost-optimal levels. A plan should be defined to reduce the gaps that cannot be strongly justified. Datasets linked to this paper provide a clear indication of the gap with current requirements for about half of the cost-optimal reports. The most covered building categories are those of new residential buildings (17 gaps for Single-Family Houses and 18 gaps for Multi-Family Houses were extracted), while only few data were available for the existing non-residential (11 gaps for office and -11 gaps for other types were extracted). An example of the visualisation of the gaps is provided in the graphs of
Figure 3 and
Figure 4. Green histograms represent the cases for which the gaps are negative (current requirements are more stringent than cost-optimal levels), the orange ones indicate the cases where the gaps are between 0% and 15%, and the red ones indicate gaps higher than 15%.
Figure 3 and
Figure 4 show that 3–6 Member States provided gaps higher than 15% (red histograms) for each building type. The picture is more critical for new multi-family buildings. Romania is the country with higher gaps for almost all building typologies.
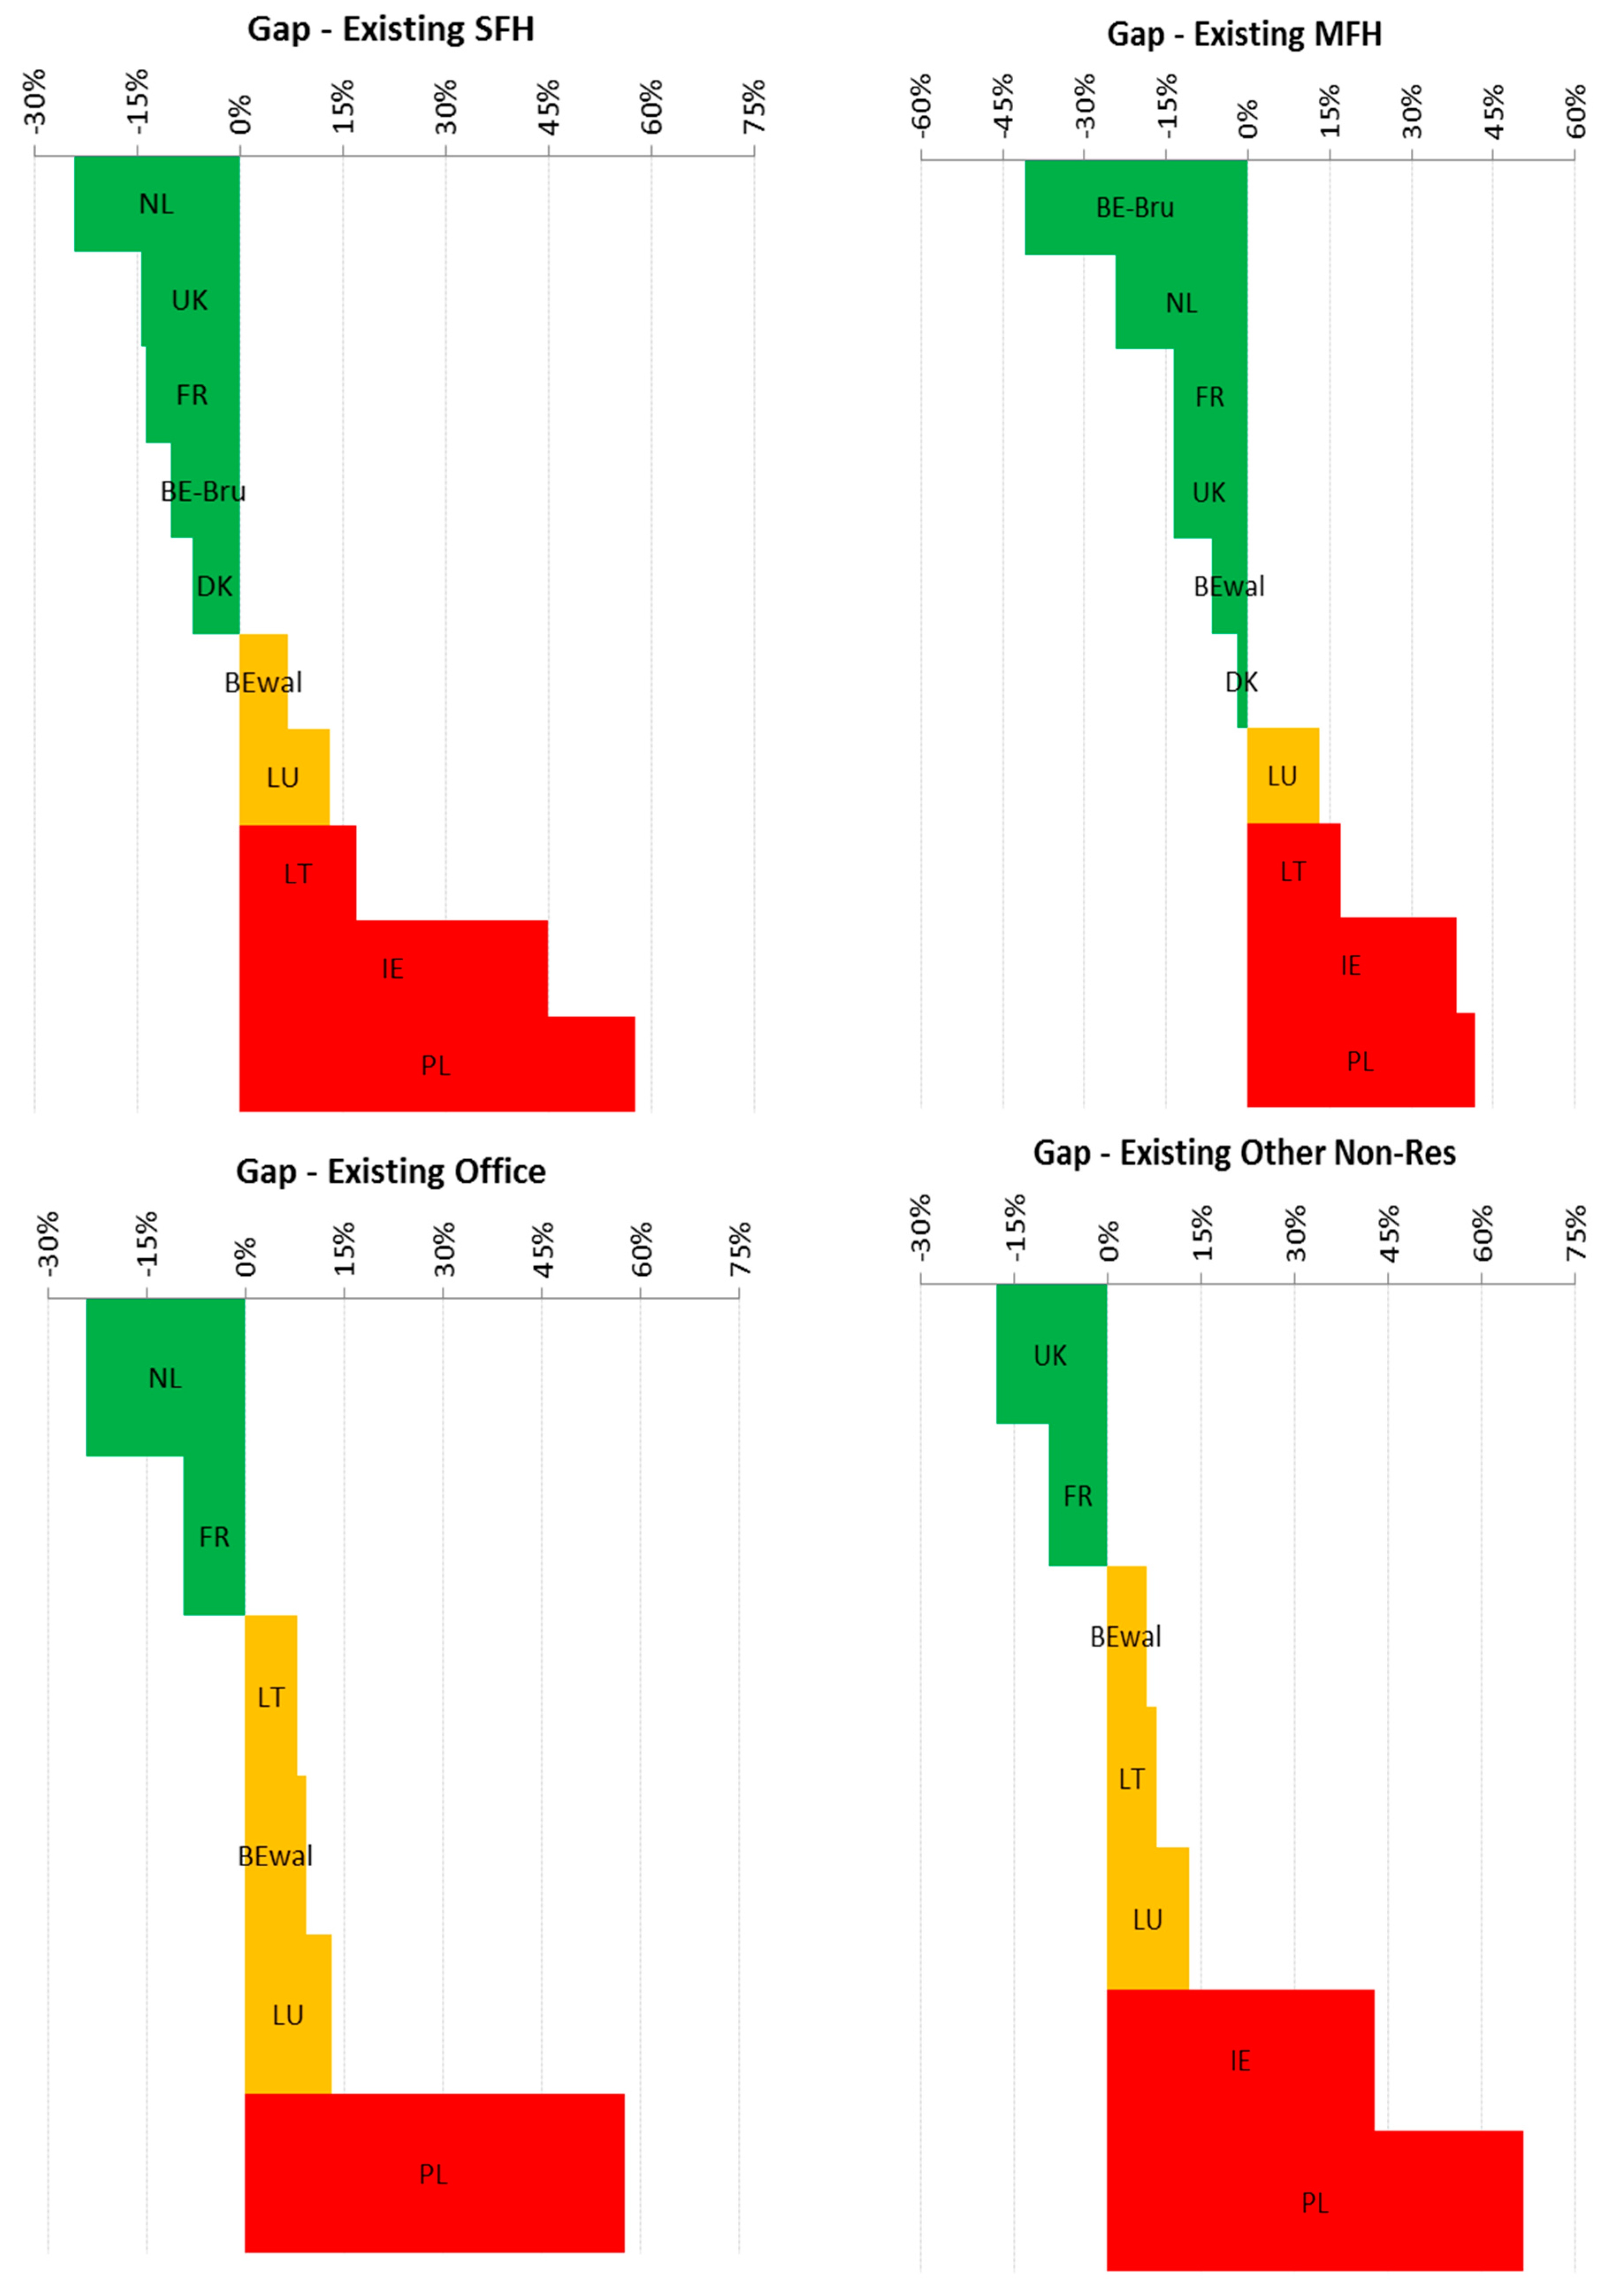
The gap quantification allows comparing results among countries, reference building types, and requirements for renovation of buildings or components. Therefore, it is important to note that the results are not fully comparable among Member States since they were free to choose the macroeconomic or financial perspective for deriving the cost-optimal levels and apply different national standards to calculate the energy performance of buildings. Other differences (e.g., related to investment costs) should reflect national market conditions and are thus not a limit to, but an integral part of the comparison. Scarce information was obtained for the gaps with current requirements for building elements under renovation (
Figure 5). Only one third of Member States clearly provided this analysis. Among them, Poland, Ireland, and Lithuania reported gaps higher than 15%.
With the introduction of NZEB requirements for all new buildings from January 2021, the main ambit of application of cost-optimal references becomes the existing building stock. On this field, a very challenging match will be played in the coming years, since the EU zero-carbon target by 2050 cannot be achieved without a deep renovation of the majority of existing buildings [
19,
20,
21,
22,
23].
A key implication of this aspect for a future revision of the methodology is accounting for the developments of the construction market as well as the technological innovation of building products, considering the evolution of energy prices, primary energy factors and materials. Another important implication is the identification of the most suitable renovation packages that Member States should consider achieving ZEBs [
24,
25,
26,
27].
As another example of data visualization,
Table 6 shows the reference buildings that each Member State established in their cost-optimal report.
Regarding the establishment of reference buildings, 15 reports covered all four building categories required by the official methodology (
Table 6), while most of the remaining reports (10) have not covered the non-residential buildings.
Strengths: Most Member States covered all building categories required by the official methodology. Moreover, two countries explicitly provided a wide range of non-residential buildings subcategories while another two countries provided a detailed description of building types.
Weaknesses: The main weakness is that the analysis of non-residential buildings is incomplete in many national reports. In most of these cases, a second non-residential reference building is not considered. In addition, in some cases, the reference building for existing buildings is missing. In some cases, the methodology is applied for individual apartments, not for the entire apartment block or multi-family building.
Table 7 provides a summary of the number of solutions taken into account and the level of competition achieved by the calculation method adopted by each Member State.
The ranges used in
Table 7 were clarified according to the number of solutions chosen: higher than 100: very high; between 10 and 50: medium; between 50 and 100: high; and less than 10: low. More in detail, according to the Guidelines implementing the Directive, the measures to be implemented need to be at least 10. It was decided to judge the number low when less than 10. The other criteria were progressively established considering the overall number of implemented measures in all countries.
Strengths: Most countries provided a wide number of energy efficiency measures in their assessments. Among these, four reports include a comprehensive selection of energy efficiency measures for the building envelope.
Weaknesses: The main weaknesses were identified in relation to RES technologies since, in some reports, the identification is not addressed adequately and, in many cases, there is poor competition between system technologies. In addition, in some cases, the number of identified energy efficiency measures is quite low for some building types.
Table 8 shows an overview of choices made by Member States for the calculation of the primary energy level, associated with the building variants. The CEN standards were used in 10 cases, while dynamic simulation was documented in the other 7 reports. However, a significant number of countries do not consider all energy uses required by the European regulation, particularly in the case of residential buildings [
28,
29,
30].
Strengths: Many Member States performed dynamic energy simulations. In addition, one report includes a detailed study on lighting consumption reduction while in another report, the method, model and primary energy factors are presented with a degree of details.
Weaknesses: The weaknesses identified regard the details scarcity on the calculation methods (i.e., the starting year, specific method of ISO used, absence of cooling systems, and not clear method for primary energy levels).
Table 9 provides a summary on the choices made by Member States about the calculation of global costs associated with each building variant. In eight cases, not all cost categories were taken into account, while almost in all analyses both perspectives were evaluated.
Strengths: The strengths regard mainly the robustness and level of detail of the analysis of costs and energy prices for different technologies.
Weaknesses: Many reports do not clearly specify which category of costs is included in the calculation. In addition, it is not always clear whether the full cost approach is employed. In some cases, the units of measure are not clear. Finally, some calculation approaches do not define the final values of the building variants.
Table 10 provides indications on the availability of sensitivity analyses and the number of calculation parameters as varied by Member States. The overall picture is quite positive, since only five cost-optimal calculations overlooked the sensitivity analysis.
Strengths: The inclusion of a deep sensitivity analysis or the coverage of all perspectives and input parameters is considered as a strength. Particularly, one Member State defines and applies six scenarios and discusses the impact of subsides.
Weaknesses: In many reports, the results of the sensitivity analysis are not discussed.
Table 11 shows a summary of the Member States’ choices regarding the derivation of cost-optimal levels associated with each building type. Here, the general judgement has not been positive, since only in a few cases (five) the cost-optimal range has been applied, and almost two-thirds of the reports provided none or just a few results. Currently, fewer than half of the Member States select as reference perspective the macroeconomic one, despite the fact that it is the most relevant for the optimisation at a societal level.
Strengths: Among the strengths, the pareto front optimization approach is identified. In addition, two Member States have covered all the reference buildings and all the categories in the definition of the cost-optimal level of energy performance.
Weaknesses: A common weakness is the absence of a cost-optimal range. In some cases, the economic perspective used is not clear or one of the perspectives is not considered. In some other cases, only the methodology was described, but no results or very few results are presented. On the contrary, sometimes the method used to derive the results was not clear. Finally, in some reports, the current requirements are not clear.
Table 12 provides an overview of the comparison between the cost-optimal levels and the current or future requirements in each country, as well as the recognition of gaps and the definition of plans to reduce the gaps.
Strengths: Five Member States included in their analysis a plan to reduce the gaps between the cost-optimal level and current requirements.
Weaknesses: In most reports, the plan to reduce the gap is missing or not detailed. In addition, the comparison of cost-optimal levels with future (NZEB) requirements is not addressed in most calculations. In addition, in most reports, the calculation of the gaps is not clearly described.
Data linked to this paper allow for showing the conformity of the Member States’ calculations with the EPBD Regulation. The same criteria used for the first cost-optimal calculations were considered for the conformity assessment, with additional criteria for situations of insufficient information.
The following definitions were applied to assess each reference category in
Figure 1 [
6]:
Conform: all the aspects considered by the guiding questions were assessed as conform.
Not fully conform: one or more criteria of the corresponding category were assessed, not conform.
Not conform: major deviation from regulatory requirements (e.g., a missing item, such as a missing reference building or missing plan to reduce the gap, or a wrong implementation, such as a calculation not performed according to the global cost methodology).
Further information needed: not sufficient information about the method and/or data used for a specific step of the calculation.
As shown in
Figure 6, the overall status about the conformity with requirements can be assessed as rather positive, although the following gaps were registered:
The calculation scope (zero): almost two-thirds of Member States failed to cover one or more objectives, such as a required building type or the cost-optimal levels for building elements installed in existing buildings.
The derivation of cost-optimal levels (five): almost half of Member States applied derivation methodologies judged not fully conform or did not provide sufficient information to assess this calculation step.
The definition of a plan to reduce the gap (six): many Member States did not provide convincing explanations about the existing gaps, did not provide clear plans to reduce them, or did not even discuss the gaps with current requirements. Only in a few cases a comparison with NZEB requirements was available.
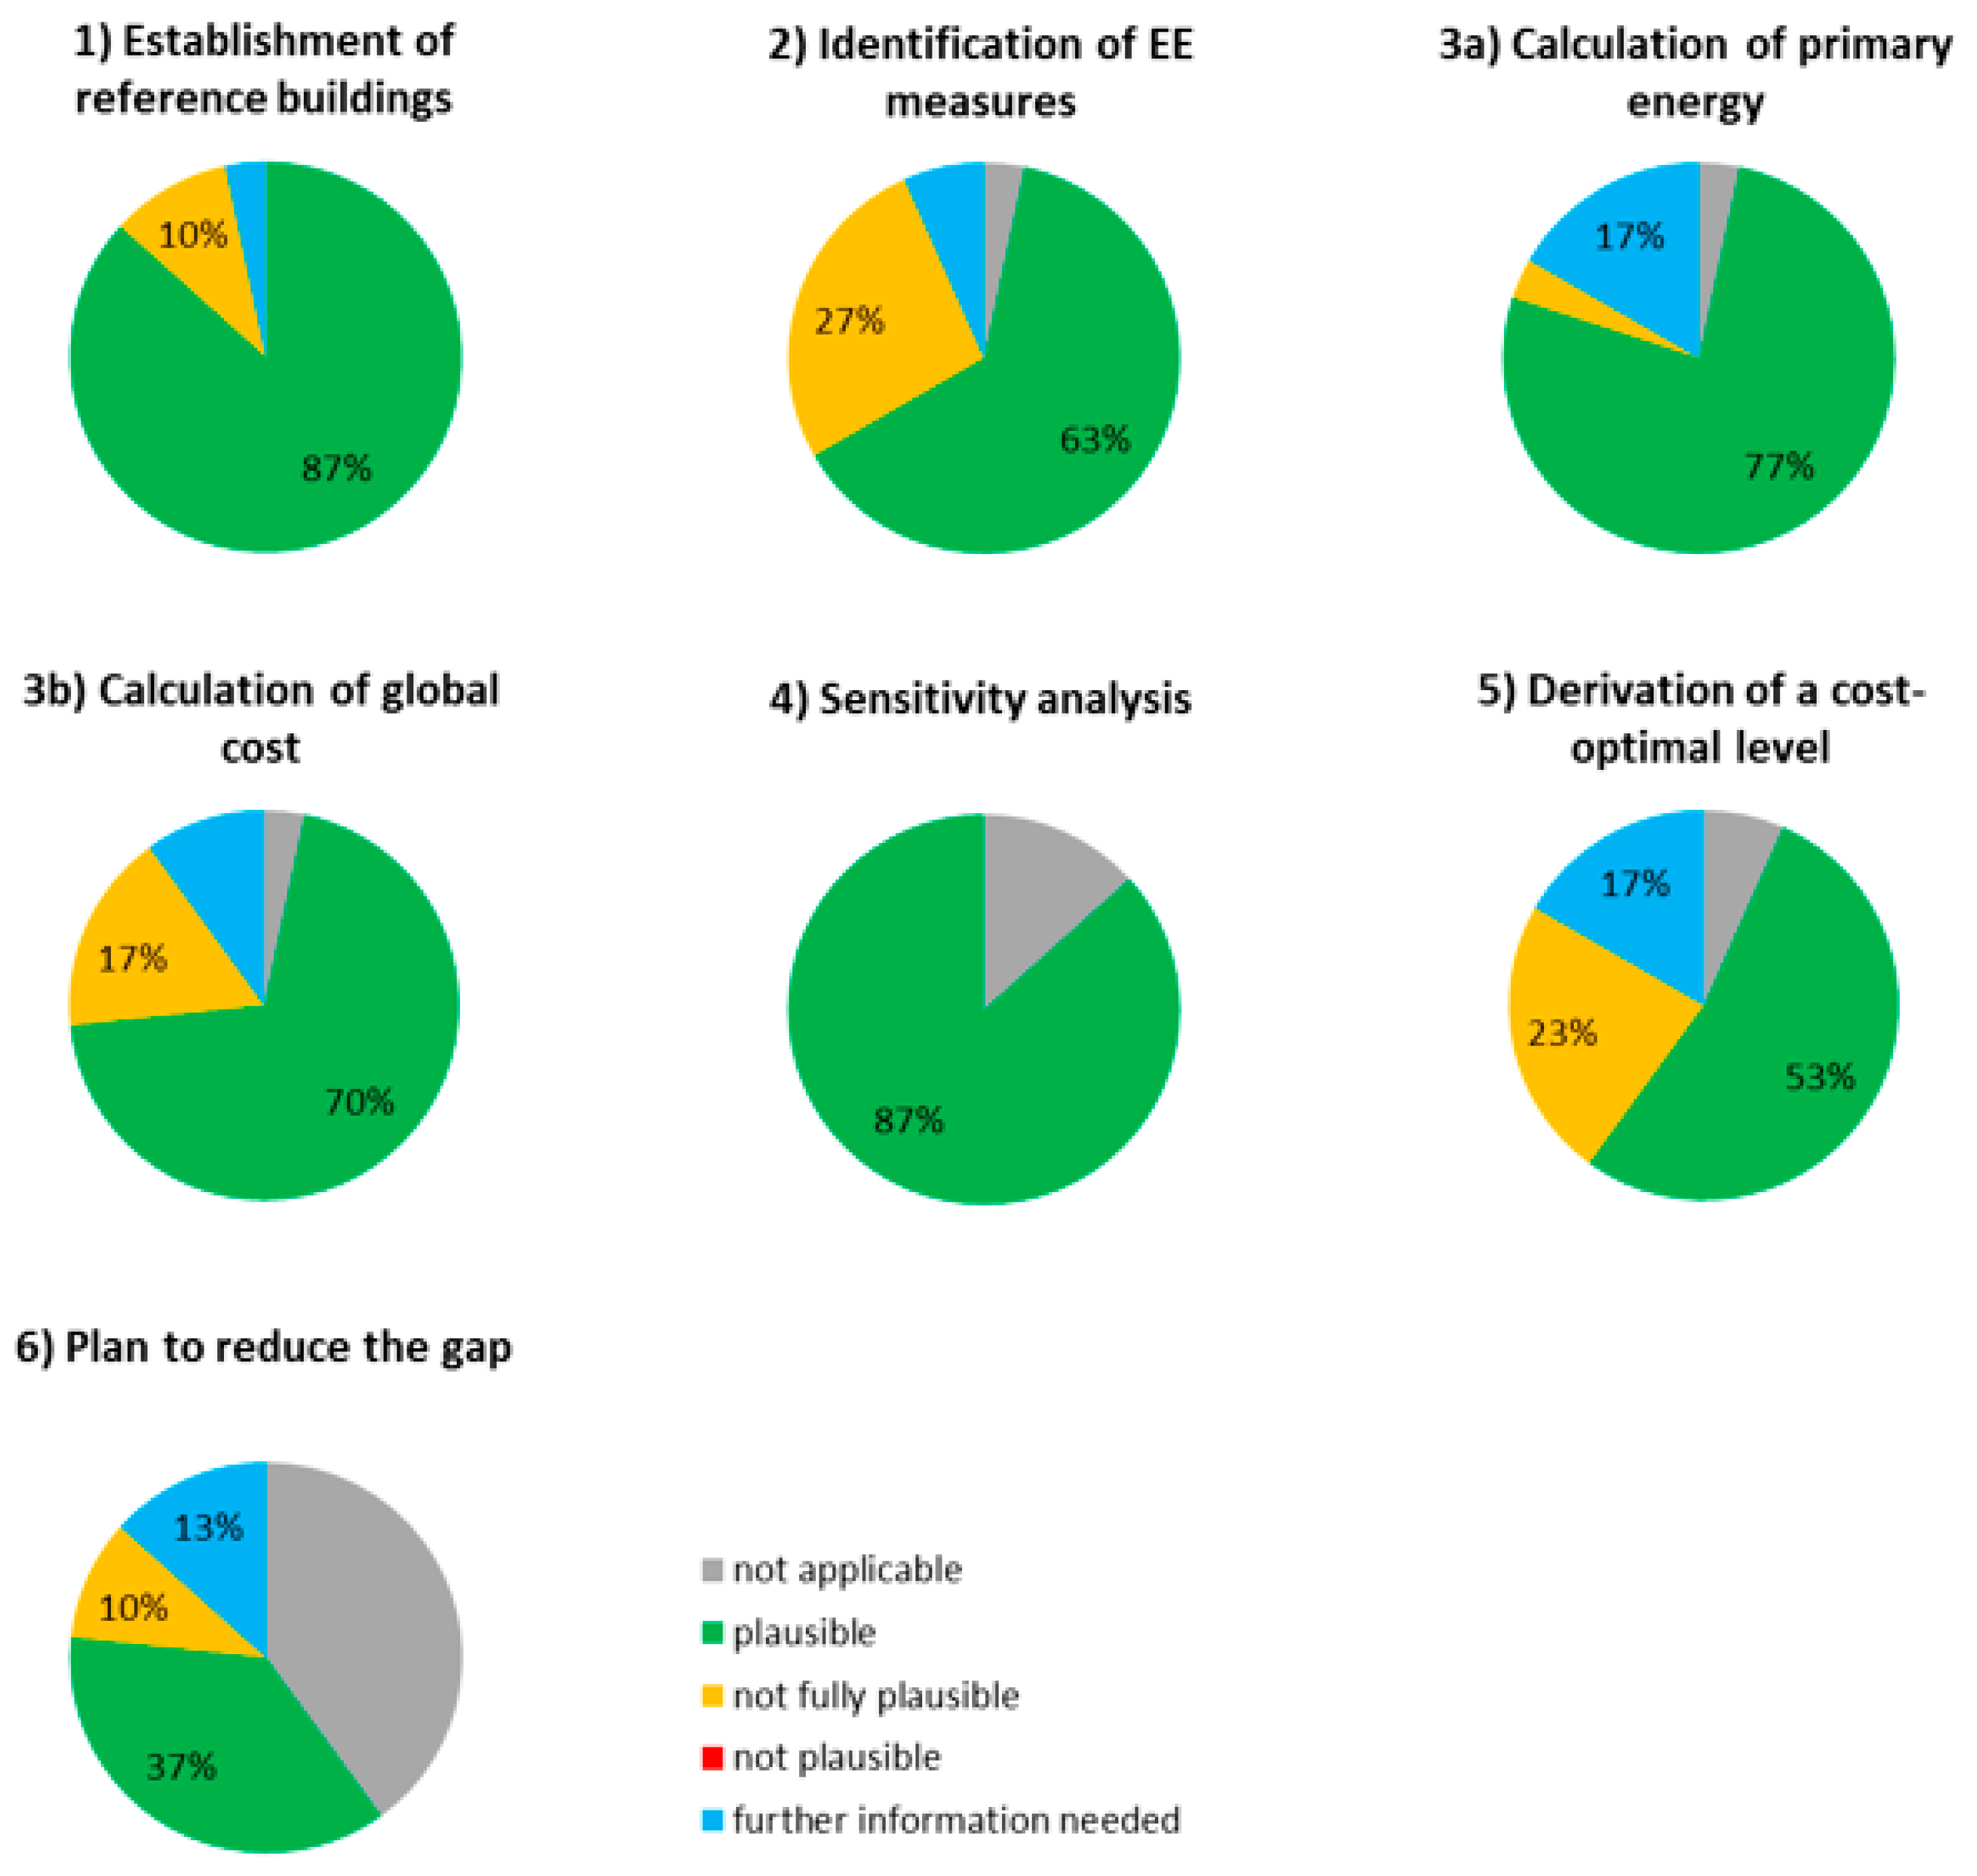
Data also relate to the plausibility of input parameters and cost-optimal levels, following the same reasoning of the conformity assessment, The plausibility refers to key numeric input data (e.g., building geometries, primary energy factor, energy prices, investment costs) and outputs (e.g., calculated cost-optimal levels, global costs), also taking into account methodological choices which can affect the comprehensiveness of achieved results (e.g., multi-stage optimisation approach and use of a cost-optimal range). Data are shown in
Figure 7.
In relation to the plausibility of input parameters and results, the assessment is rather positive, since no report has been assessed as not plausible, as shown in
Figure 7. Additionally, in this case the most critical reference categories are the last ones (derivation of cost-optimal levels and plan to reduce the gap). However, some Member States missed covering all significant technological options and also in the selection of energy efficiency measures [
31,
32,
33].
4. Conclusions
Reducing the energy demand in buildings is a requisite to meet Europe’s energy efficiency and GHG emissions reduction targets. This data article gave a comprehensive assessment of the cost-optimal methodology in Member States based on the latest submitted reports. The reported data are useful to assess the implementation progress of the cost-optimal methodology, as foreseen in the Energy Performance of Buildings Directive (EPBD).
In summary, the average cost-optimal level is assessed at 80 kWh/m2y for the new residential and 140 kWh/m2y for the new non-residential sector, while it is 130 kWh/m2y for the existing residential and 180 kWh/m2y for the existing non-residential sector. Energy efficiency measures bring not only energy and cost savings but contribute to climate change mitigation by reducing greenhouse gas emissions. In addition, energy efficiency positively affects the comfort, well-being, and productivity of residents and users as well as the aesthetics of the building. Such benefits can be grouped into social, environmental, and financial benefits. However, the current methodology overlooks these benefits except for the environmental impact of CO2 emissions due to operational energy use.
Furthermore, for almost all building types, the primary energy consumptions associated with cost-optimal levels are lower in the cold regions, while global costs are normally lower in countries with warm and mild climates. As the cost-optimal methodology will be revised in 2026, it is important to suggest future developments based on the assessment of the latest reports. The assessment outlines weak and strong points, as well as future developments based on the overall policy framework. The introduction of the methodology at the district level is also crucial as in the revision of the Energy Performance of Buildings Directive much emphasis is given on a larger scale of buildings, such as district, regional, and communities. Furthermore, the introduction of externalities also will be considered as topics, such as health and indoor environmental quality are of growing importance in the field. Research is ongoing on the inclusion of wider benefits in the global cost formula, the introduction of cost-optimality at district level, and historical buildings, comfort, and indoor air quality, the inclusion of wider energy efficiency benefits, such as reduced import dependency and a positive impact on economy. Monetization is identified as the biggest challenge since it is context-dependent and usually, there is no straightforward approach for determining single monetised values. In addition, the quantification of the various co-benefits requires great efforts in data collection and homogenization from various sectors.
The provided data offers inputs for the methodology update foreseen in 2026. Currently, the energy efficiency measures mainly target the reduction of operational energy use and operational GHG emissions, while the incorporated energy and GHG emissions are overlooked. Highly energy-efficient buildings (such as NZEBs) imply the use of a higher amount of materials (notably insulation materials) compared to conventional ones, the installation of more complex technical systems and, in case of renovation, the removal and treatment of old materials, leading to higher embodied impacts of buildings. In addition, as operational emissions are being reduced, the importance of embodied emissions rises, dominating the life-cycle emissions of a building. It is estimated that the upfront carbon emissions (i.e., emissions released before the use of the building) will represent about 50% in the life-cycle emissions of new buildings in the next decades.
Updating the calculations of the cost-optimal levels will have to be monitored, considering the update of the NZEB definitions for new and renovated buildings, the introduction of energy requirements and incentive mechanisms for existing buildings in line with the Renovation Wave Strategy, and the environmental targets to 2030 and the carbon neutrality to 2050 for the building sector. A limitation of the analysis is linked to the evolving nature of specific fields, such as energy prices and measures, so that cost-optimal levels may be subject to quick variations. It is expected that the research area and related data will continue evolving. Future research may account for more condensed data as the available information and related policies are continuously updated. As current methodological status, an overall positive development can be derived from the assessment. The outcomes of the analysis assume a crucial relevance towards the ambitious energy efficiency targets established by Europe.


