1. Summary
Some of the major environmental policy concerns are related to energy production and consumption, which is often linked to the emission of polluting gases that contribute to increasing the greenhouse effect [
1]. An estimated 40% of global energy consumption is related to buildings, three-quarters of which are residential. One of the largest responsible actors of domestic energy consumption is climate control, which is a factor that most house occupants do not want to abdicate, despite the increase in environmental awareness. To tackle this problem, a few solutions to reduce energy consumption in home heating scenarios are being explored [
2]. A general solution for this problem has not yet been widely deployed since there are a high number of different scenarios and variables: buildings have different dynamics, the occupants have different routines and the climate varies across the world [
3].
This problem was the motivation for the Smart Green Homes (SGH) project [
4]. The project’s main focus was to develop integrated products and technological solutions for households. These solutions would raise standards of comfort and user satisfaction to a new level through the use of several technical advancements. At the same time, it would respond to the planet’s sustainability problems, by increasing energy efficiency and reducing the emission of gaseous pollutants and the consumption of water. This study did not aim to reduce energy consumption directly but instead focused on creating an efficient and correct method to collect data about a family house’s thermal comfort. This dataset can then be used to develop new strategies to solve the mentioned environmental problems. It is important to mention that the anonymity and confidentiality of each of the participant’s data were major concerns, since this study involves sensitive data.
The dataset presented in this document has been used within the project SGH and also within a different study focused on developing methods to address the issue of missing data [
5]. Given the nature of the scenario where this dataset was gathered, there are some missing values, which mainly occurred when the battery or WiFi connection failed. It was for this reason that this dataset was selected for the missing value evaluation.
To the best of our knowledge, there are not many home comfort datasets that could be used for our specific task. Nevertheless, there are some studies related to ours. For example, the following datasets [
6,
7] capture the effect of thermal comfort for the elderly. Our dataset is not limited to the elderly, with the volunteers being mainly young adults. Another dataset [
8] correlates the effects of home occupancy with the usage of air conditioning in Italy. Our dataset was gathered in Portugal and is not limited to air conditioning appliances, since the volunteers could use whichever appliance they wished to control the temperature. Another important difference is that we also captured the outside temperature and humidity because the thermal sensation of comfort is rather hard to classify.
Furthermore, there are several works [
9,
10,
11] that explore the usage of thermal comfort to optimise the usage of heating appliances. Most of these studies rely on empirical models designed to model a person’s comfort level. The objective of our study was to acquire these data and use them to train models that could be adjusted for each person.
The remaining document is organised as follows. In
Section 2, we summarise the procedure to acquire the dataset.
Section 3 presents the description of the dataset fields and their respective meaning. In
Section 4, we present a statistical validation that is useful to validate the quality of the presented dataset. The example code, which can be used to generate the plots presented in the previously mentioned section, is described in
Section 5. Finally,
Section 6 provides concluding remarks.
2. Methods
The goal of this work was to conduct an indoor thermal comfort study based on Portuguese families’ lifestyles and the Mediterranean climate. The main factors influencing thermal comfort are metabolic rate, clothing insulation, air temperature, mean radiant temperature, airspeed and relative humidity [
12]. Due to the fact that this study consists of a thermal comfort study, the collected data focus on measuring these parameters. Other features were also collected: outdoor measurements and information about the presence of people in the house. We would have liked to measure the energy consumption of the heating appliances; however, all the methods to measure this are either expensive, intrusive or may even present some harm to the volunteers.
The acquisition solution was based on an Internet of Things (IoT) platform [
13,
14] and several environmental sensors. IoT platforms allow for the monitoring of the devices that collect data, and the data collection process itself so that faults can be detected whenever a component is not functioning correctly.
With regard to sensing devices, technological advances in recent decades have made sensors small, inexpensive and easy to install, promoting their integration into non-industrial environments. Furthermore, they measure the environment with precision and provide reliable data readings, which makes them a good approach for monitoring domestic buildings.
Taking into account the project scenario, the data acquisition task had a well-defined set of requirements:
Scalability: the platform should be able to support the increase in the number of connected devices, the increase in the associated data flow, and the increase in the amount of data to store.
Interoperability: the platform should be able to support multiple communication standards between the platform and the sensors. If this is not possible, it should at least allow for the implementation of new communication protocols without the need to restructure the entire architecture.
Flexibility: the flexibility of the platform is also related to the easiness of implementing different technologies and modules in the platform to perform certain tasks.
Security and Privacy: since the platform works with sensitive data, it must ensure the integrity and confidentiality of the information. The platform must prevent any kind of unauthorised disclosure of the user data, as well as protect them from being lost, destroyed, corrupted, modified or stolen.
Availability: it is important to ensure that the platform works properly most of the time because failures decrease the quality of the collected data.
Robustness: the system should automatically recover from failures when possible because it is faster than handling the problem manually, which would increase the downtime of the platform.
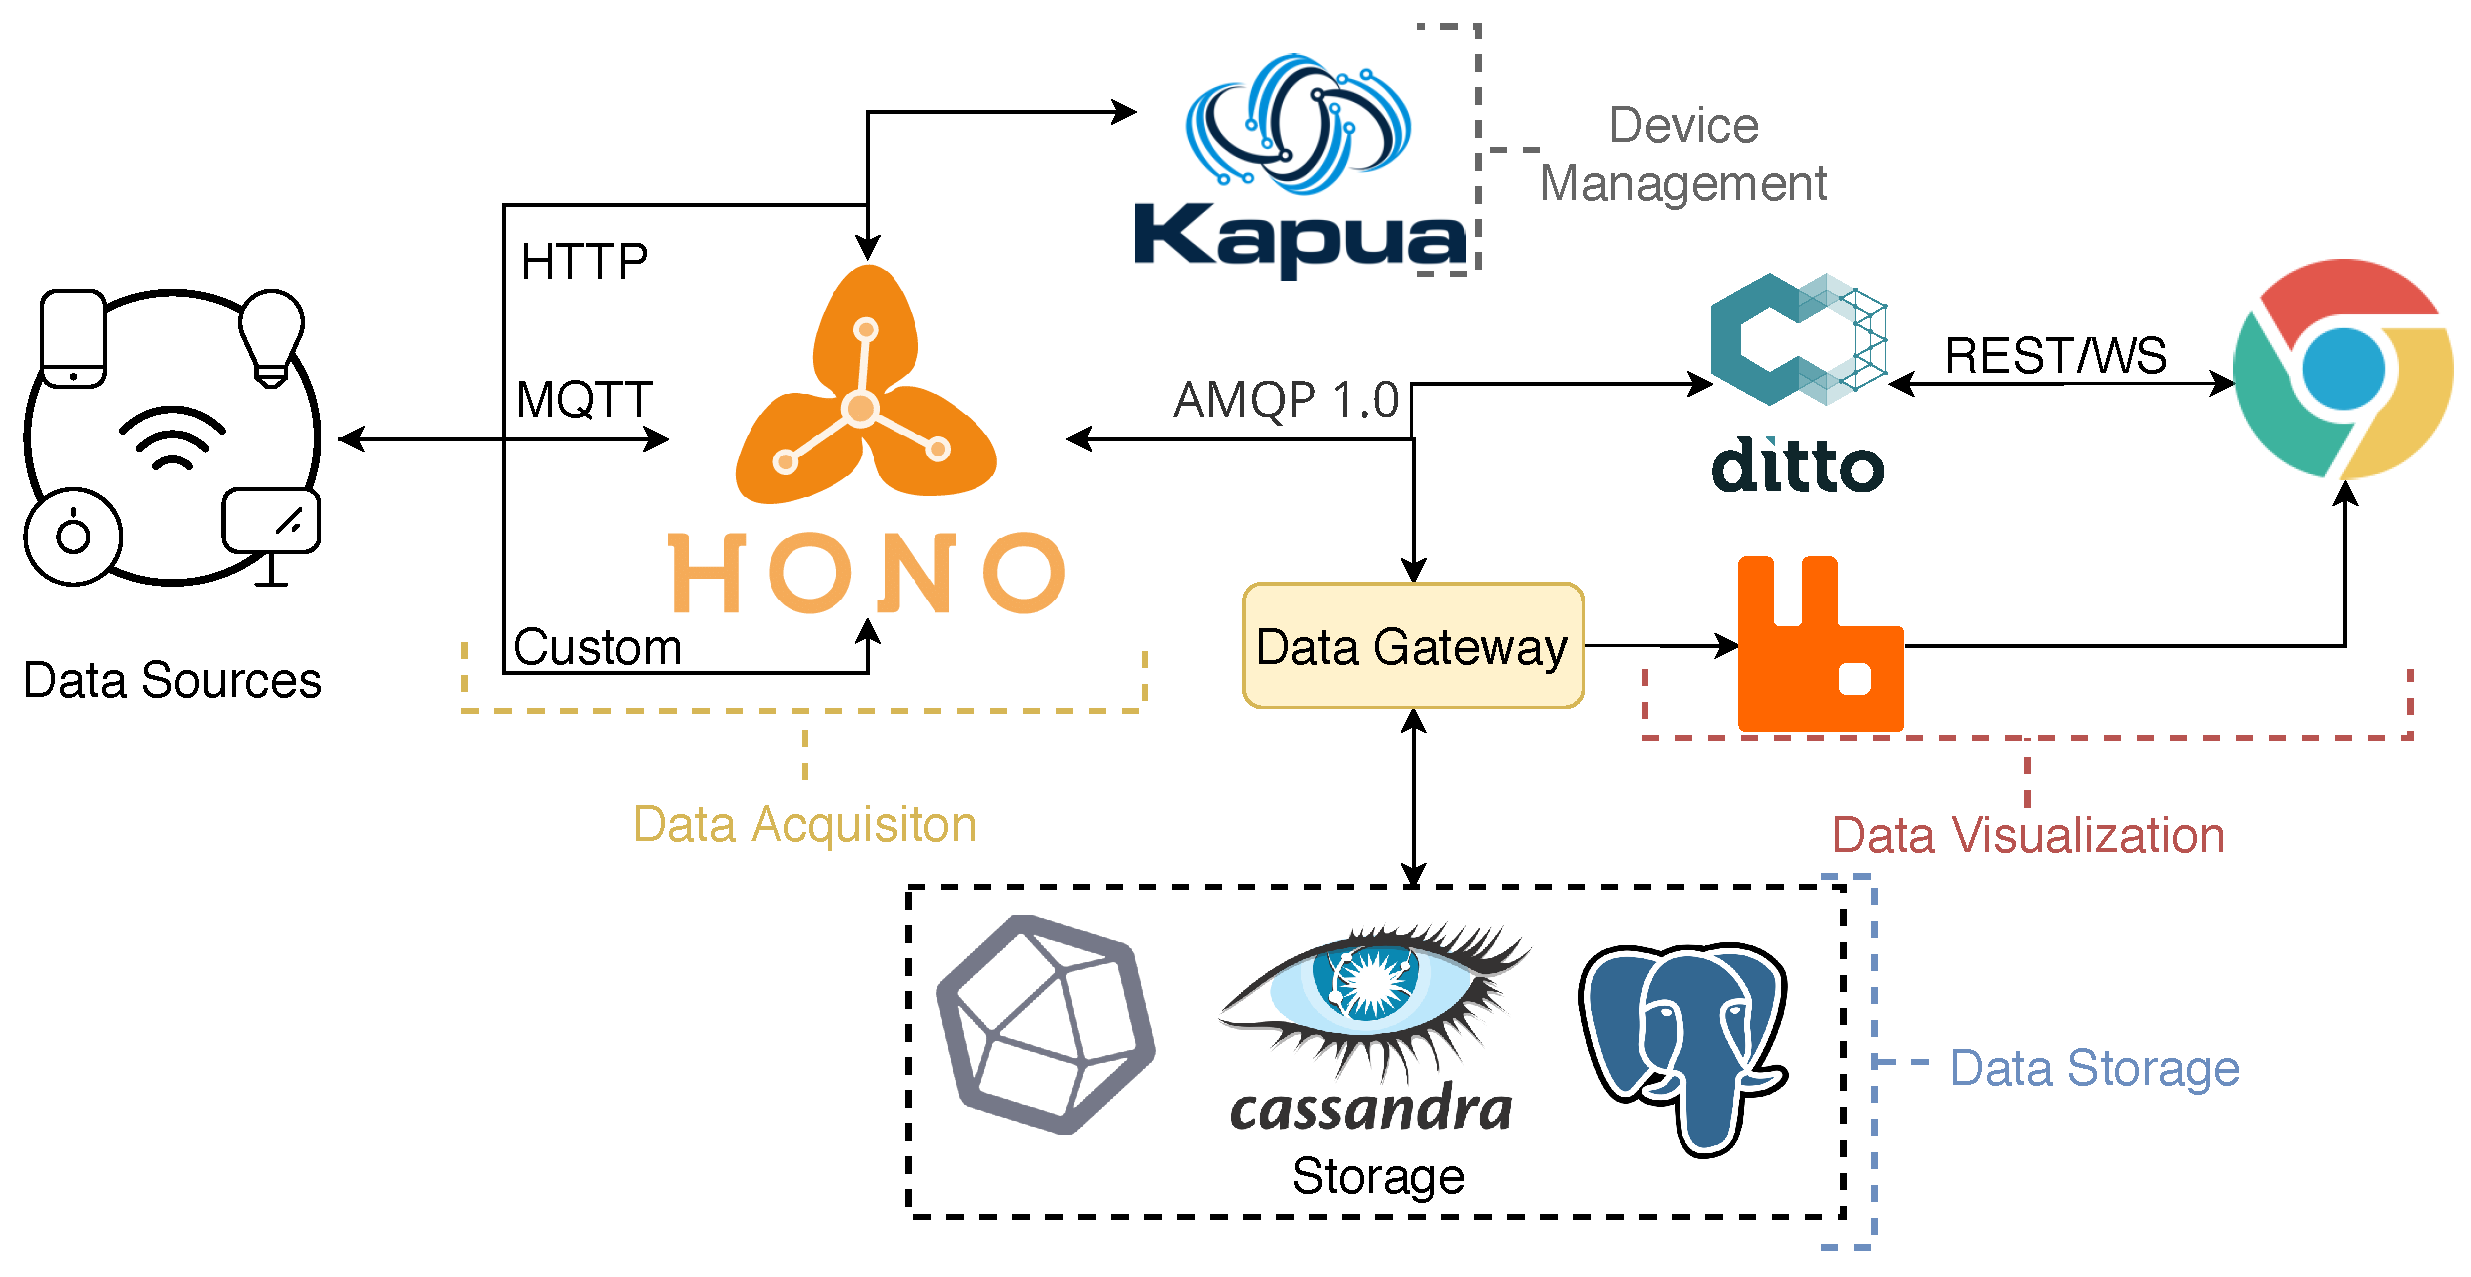
Having the requirements clearly defined, a data acquisition platform was developed within the SGH project. The main component of the acquisition mechanism was the IoT platform, named Smart Cloud of Things (SCoT) (see
Figure 1), developed specifically for the scenarios explored within the SGH project. It was able to not only receive data from several sensors or gateways and store all the information in the appropriate databases, but also to offer visualisation and pre-processing services to guarantee the quality of the acquired data. Given the focus of this document, we will not cover all the details of the acquisition platform. For more information, please check [
13,
14].
The following paragraphs describe the main features of this platform, which was designed to meet the presented requirements.
The platform is based on three key services from the Eclipse Stack: Hono, Ditto and Kapua. It was further extended with custom services. These components were chosen because they cover most of the initial requirements while providing a high level of integration between them. Moreover, they are part of the Eclipse IoT (
https://iot.eclipse.org/, accessed on 24 February 2023) initiative, which is well known and heavily used in this area. This approach makes updating the system an easier task, while maintaining essential performance functions under the control of the platform owners.
It is also important to mention that both the broker (Hono) and the digital twin service (Ditto) have user credentials and access policies. Each sensor/gateway has its own access credentials. It is also possible to control which users have access to them through the use of different policies. There are two types of connections that must be developed to the physical device: an incoming connection, to have access to the data; and an outgoing connection, to be able to send commands. For more detail on the automatic mapping used on our deployment, please consult [
14].
Finally, IoT scenarios are inherently complex due to the data heterogeneity [
15]. It becomes rather difficult to have a single database model to store the data and provide a meaningful structure. This was the reason why we developed a
Data Gateway component. It uses a smart parser to transform the collected information and save it correctly in three different databases, replicating it: Apache Cassandra, a NoSQL database; PostgreSQL, a relational database; and InfluxDB, a time-series database. For more details on this component, please consult [
14].
The IoT platform communicated to several gateways with the use of the MQTT protocol. Each gateway communicated to several sensors through ZigBee.
The gateway acts as an intermediary between the sensors and the platform. Most sensors do not have enough computational power to directly communicate with the data acquisition platform, due to the communication protocol or the required security mechanism. In these cases, a gateway can translate all the messages from the sensors and forward them to the platform, or vice versa. This improves the security of the communications and the stability of the acquisition platform. It also promotes the heterogeneity of the system, as it allows for the usage of a higher variety of sensors. Finally, the gateway can be custom-configured to meet the requirements of the sensors in use, as long as it respects the connectivity and security policies established by the platform.
The gateway was implemented on top of the Yocto project [
16] and deployed on a NanoPi NEO2 [
17]. The Yocto Project is an open-source collaboration project that helps developers create custom embedded Linux distributions. It is built around the concept of layers, recipes and a reference-embedded OS named Poky. A recipe is a list of instructions for building packages that are then used to build the binary image. It describes where to get the source code, dependencies for libraries or other recipes, as well as configuration and compilation options. They are stored in layers. Layers are repositories containing related sets of settings and instructions which tell the build system what to do. An image can and should be created with the use of multiple layers. Putting an entire build into one layer limits and complicates future customisation and reuse. However, distributing information into different layers simplifies future customisations and allows for the reuse of work. In addition, users can collaborate, share and reuse layers.
NanoPi-NEO2 is an ARM board released by FriendlyElec that is widely used in IoT projects. It uses an Allwinner’s 64-bit H5 quad-core SoC (ARM Cortex-A53) and 512 MB of DDR3 Random Access Memory (RAM). It has a 10/100/1000 M Ethernet jack, a USB type A host, a MicroSD Slot for system boot and storage up to 128 GB and MicroUSB entry for power input(5V/2A).
The gateway was connected to a ZigBee USB stick designated CC2531. It allowed for the gateway to connect to each sensor. Through the Zigbee2mqtt bridge, the gateway forwarded all the sensors’ communication through MQTT to the platform.
Three different sensors were selected for the data acquisition process: Xiaomi Aqara sensor, Xiaomi Aqara door sensor and Xiaomi Aqara temperature and humidity sensor. As seen in
Figure 2. All of the sensors communicate with the gateway through ZigBee.
The Aqara Motion Sensor (RTCGQ11LM) can detect motion at a angle and a maximum of 7 m. It consists of an infrared sensor used to detect human motion through the moving heat source, being able to detect once every minute by default and going to sleep mode after it is triggered to save battery.
The Aqara Door and Window Sensor (MCCGQ11LM) detects the current status of doors or windows through the distance between the sensor unit and a magnet.
The temperature and humidity sensor (WSDCGQ11LM) monitors temperature, humidity and atmospheric pressure in real time. It adopts a Sensirion industrial-grade sensor which has the humidity detection accuracy of and temperature detection accuracy of C. If the temperature variation exceeds C, the humidity variation exceeds or the atmospheric pressure is no less than 25 Pa, data will be reported instantly. Otherwise, data will only be reported once per hour, approximately.
Finally, the outdoor conditions were acquired through a virtual sensor that gathered the data from the Portuguese weather service [
18] based on the location of the gateway. None of the available sensors were capable of operating outdoors, and there were no guarantees that the WiFi signal was going to be available.
The described framework was installed in 13 houses, with varying types of heating and cooling systems, and across two cities (distanced by around 65 km). The data collection occurred from the 1st of March 2019 to the 23rd of November 2020 (corresponding to a period of 21 months). However, the study start and end dates varied between tenants. Each of the 13 houses represents one volunteer that was contacted through the SGH project. Each one of them needed to sign a consent form as required by the General Data Protection Regulation (RGPD in Portugal [
19]). As already mentioned, the anonymity and confidentiality of the volunteers were a requirement from the start. The acquisition platform used an anonymised UUID to identify each gateway, ensuring that it would not have access to any personal information regarding the volunteers. The only information it received was the environmental data described in this document. Such details are depicted in
Table 1.
4. Technical Validation
The sensors were selected for the data acquisition based on their accuracy and quality (as described in
Section 2). Each one of them exceeded the required sensitivity level for the proposed scenario. Furthermore, each kit was manually calibrated in the laboratory before being delivered to a volunteer.
The volunteers followed a setup guide that guaranteed the correct installation and communication with the acquisition platform. This platform kept track of the communication flow with each kit, allowing us to discover any issues with the acquisition process. There were no major issues encountered, with the most common one being the low battery on the sensors.
The dataset has some missing values, justified by the low battery and the occasional WiFi connection issues. It was used within the work presented in [
5] to evaluate matrix factorisation methods as a technique to predict these gaps in the data with high accuracy. The selection of this dataset comes from the fact that, even though some data are missing, it still provided enough information to accomplish the task.
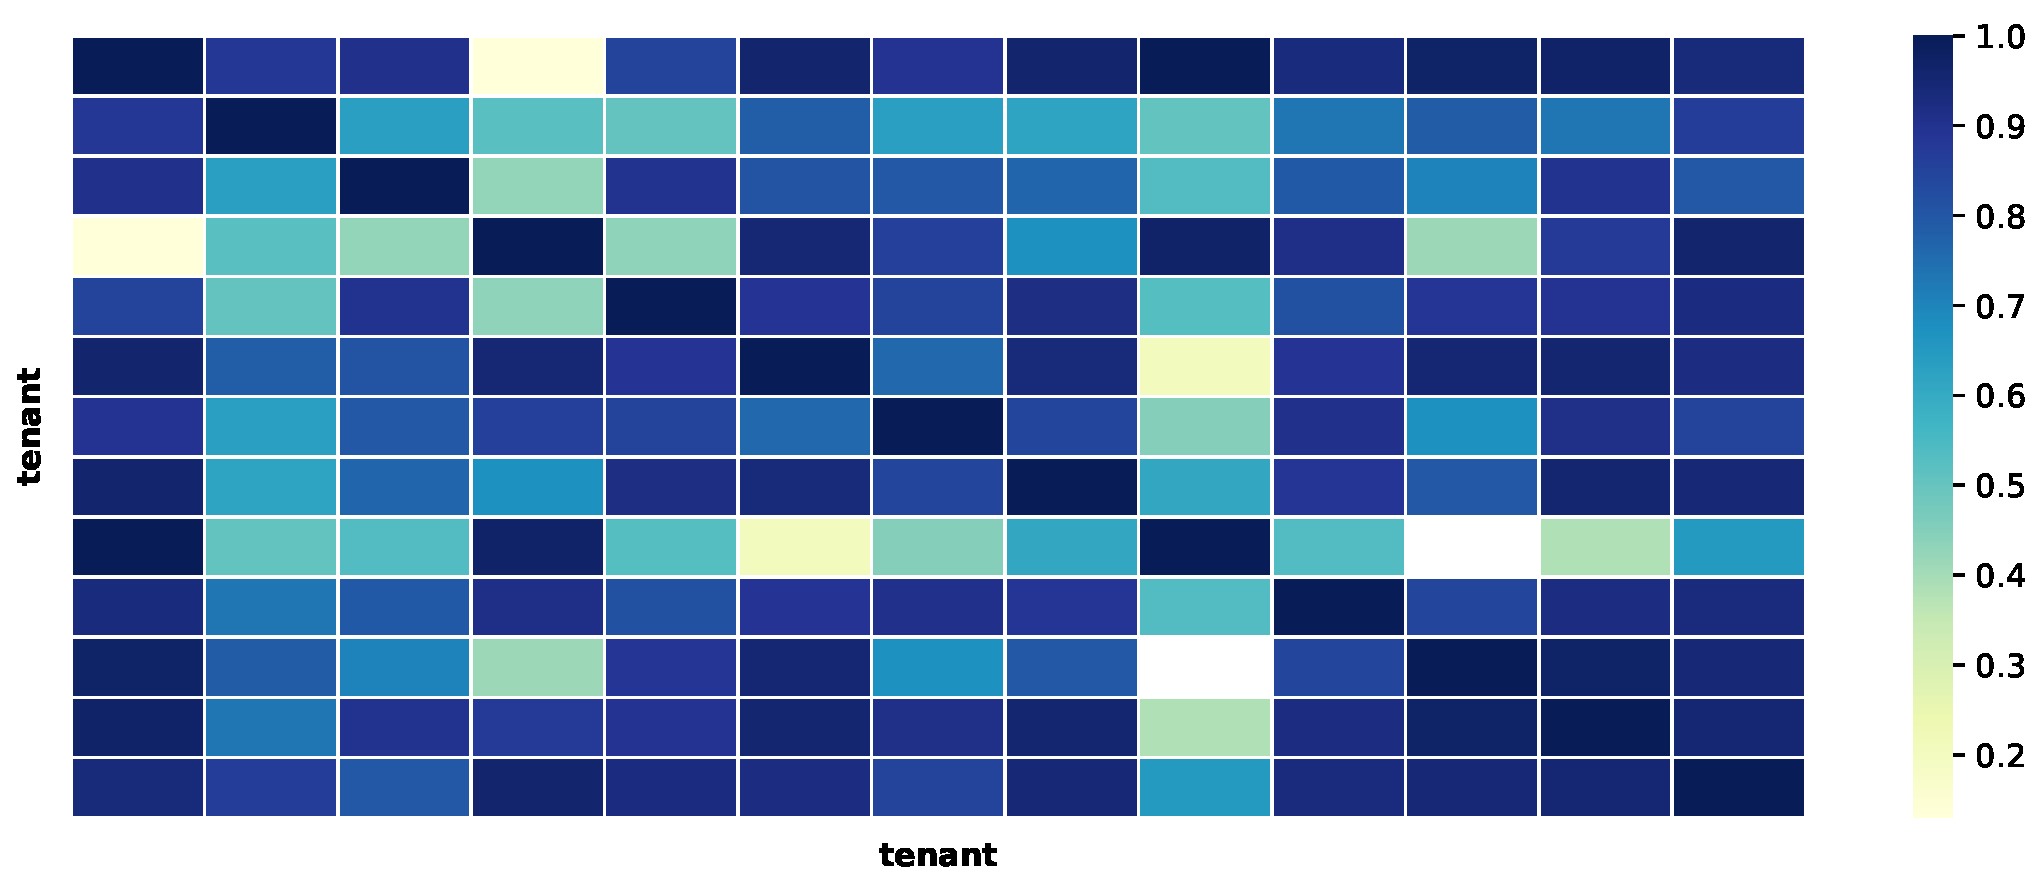
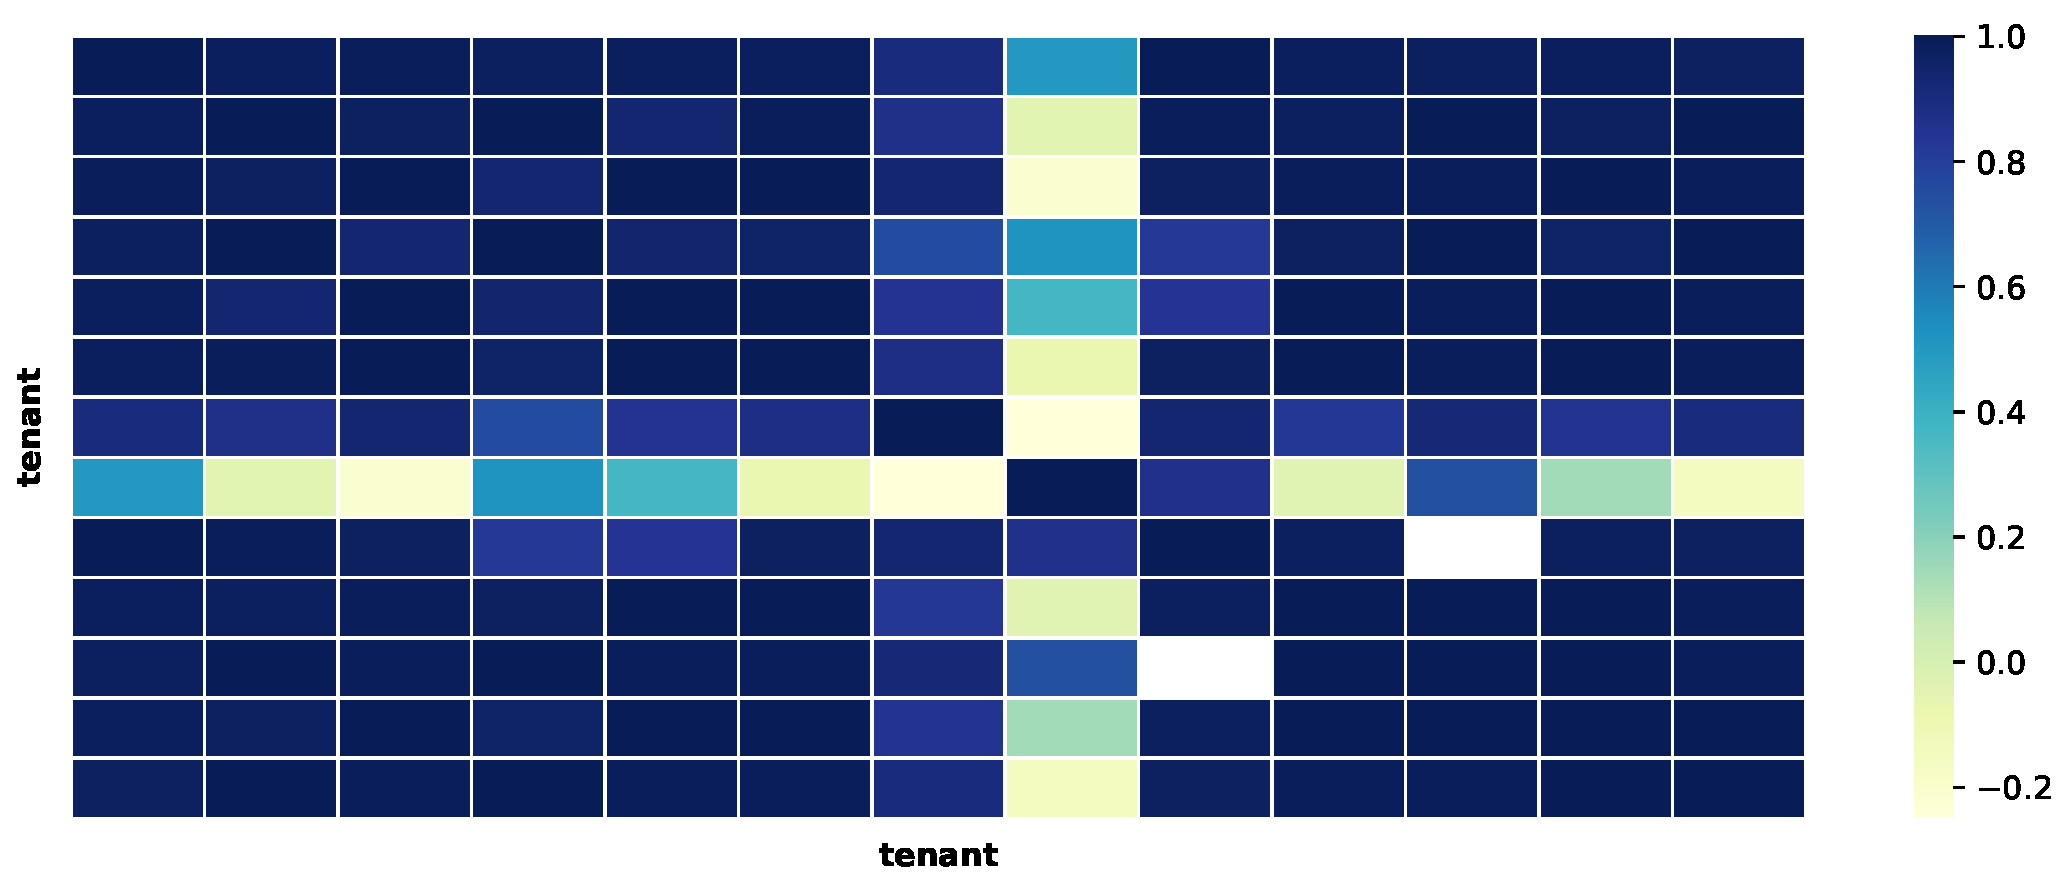
We performed a simple statistical validation on the dataset. This was achieved by measuring the correlation between the values, averaged by day, gathered from all the tenants. In particular, the temperature, the relative humidity and the atmospheric pressure were the analysed fields. The results of this analysis can be found in
Figure 3,
Figure 4 and
Figure 5. The charts show that the correlation between the data of the multiple tenants are high, which is expected since the data represent environmental information. Therefore, even though the absolute values are different, the underlying pattern should be similar to a certain degree.
Moreover, we also analysed the dataset values to assess the quality of the data. In
Section 4.1, we discuss the dataset distribution throughout the duration of the project. We analyse the distribution and variation of indoor temperature and humidity in
Section 4.2. The occupancy analysis is given in
Section 4.3. Finally, a combined evaluation of temperature and occupancy is presented in
Section 4.4.
4.1. Data Distribution
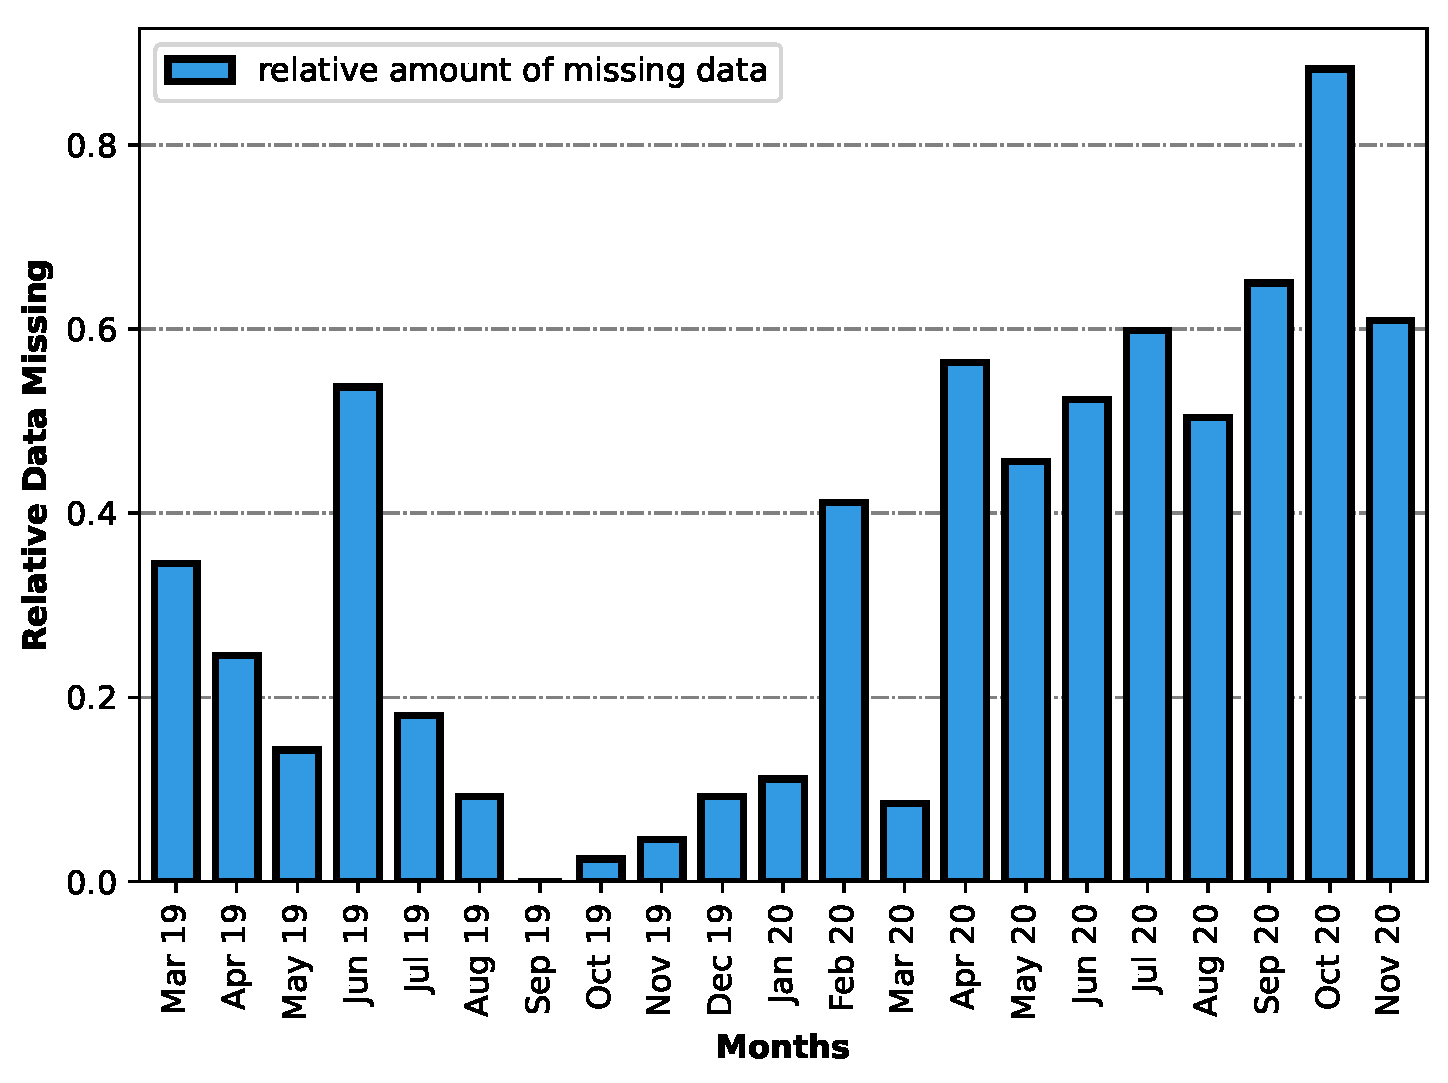
When assessing the quality of the collected data, one important aspect to consider is how the data are distributed throughout the collection time span. The chart on
Figure 6 was created with this goal in mind; it depicts the relative amount of missing data per month in the dataset. To create this chart, the number of entries per day for each month was averaged, and then divided by the maximum value obtained. Then, these results were subtracted from the value 1 so that they represent the relative amount of missing data.
The chart shows a non-uniform distribution of entries throughout the months. Its analysis shows that October 2020 was the month with the least amount of data, while September 2019 was the month during which the most data was collected.
4.2. Temperature and Humidity Analysis
With the aim to analyse temperature and humidity data in the dataset, a few plots were designed. These are explored in the following subsections.
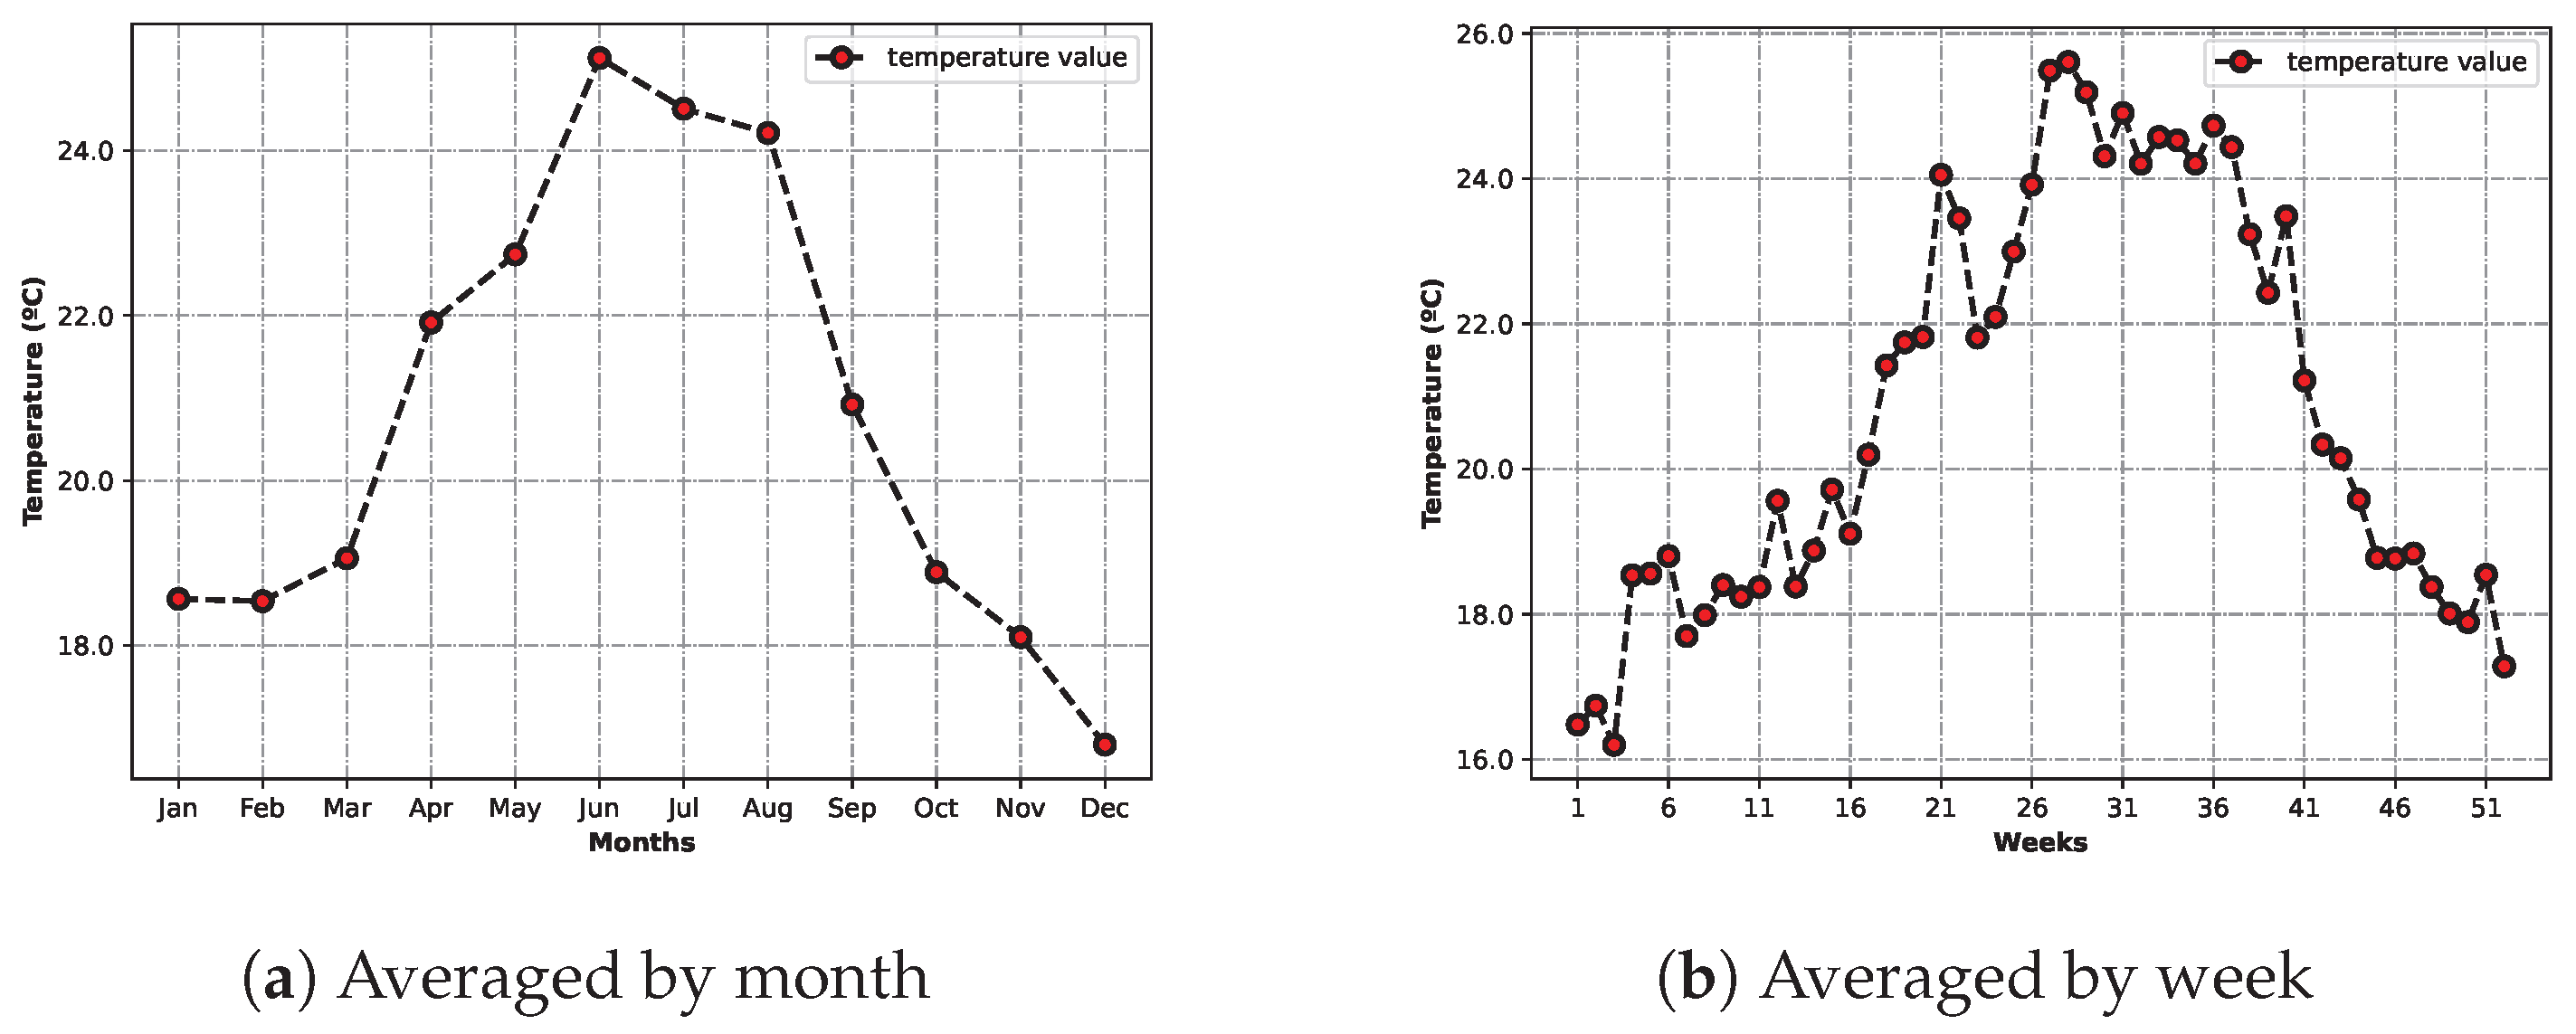
4.2.1. Average Temperature by Month and Week
Figure 7a shows the average temperature for each month of the year. As expected, the months with higher average temperatures were those in the Summer, with June being the warmest of all. The represented colder months also reflect reality, with December having the lower average of the collected temperature data.
The other figure,
Figure 7b, displays similar information, having the temperature averaged for each week in a year. The conclusions drawn from analysing the previous chart are also applicable to this one. The general outline of the curve is similar, but it is possible to see some differences due to the increase in detail. In fact, the week that registered the lowest temperatures was January, instead of December.
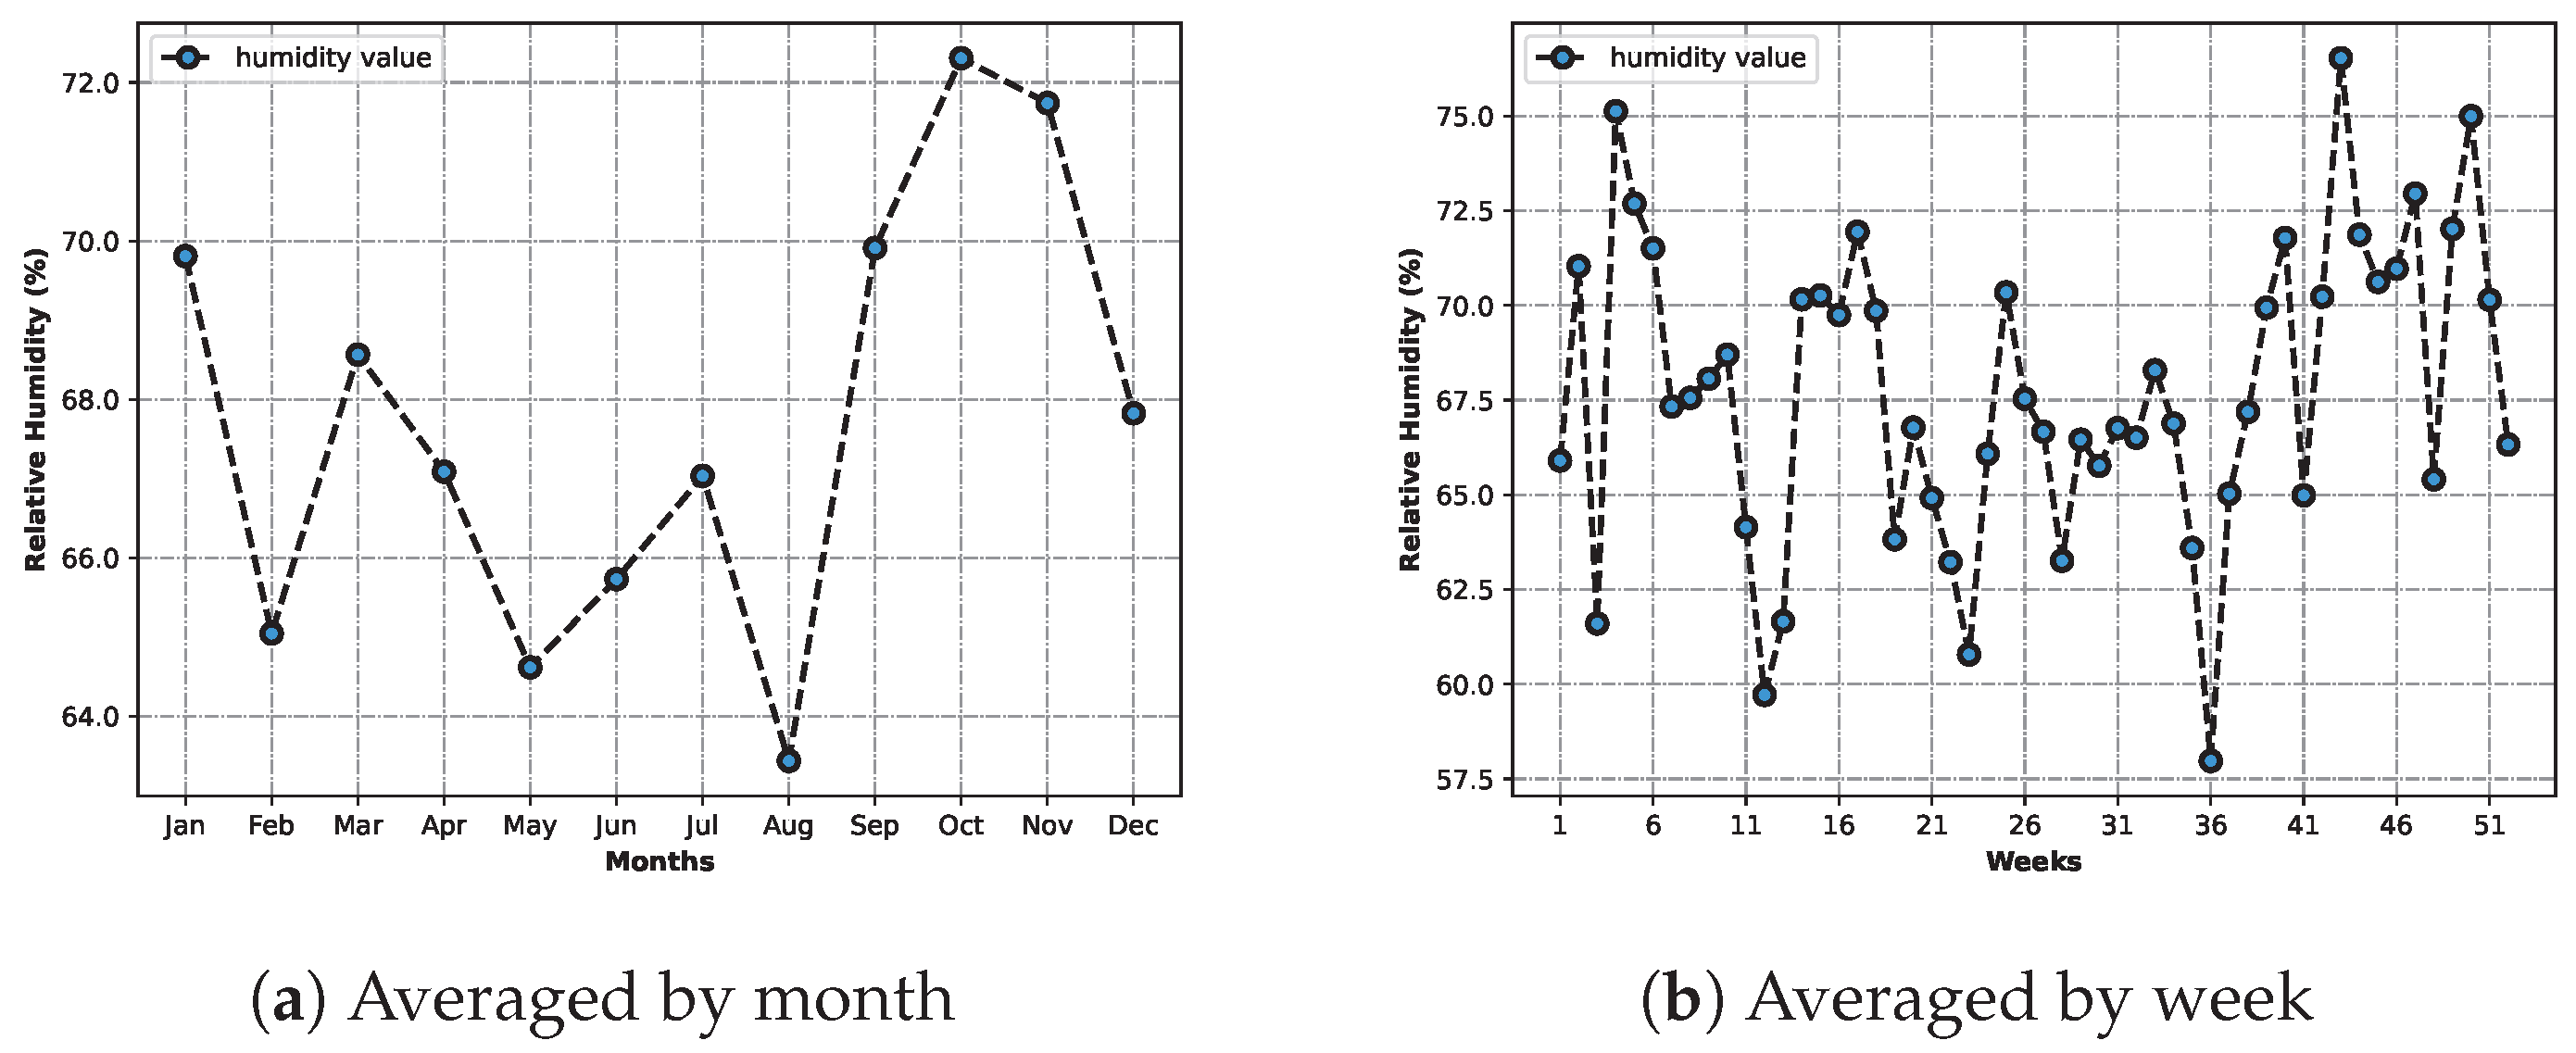
4.2.2. Average Humidity by Month and Week
In a similar fashion to the previous charts,
Figure 8 presents the humidity data averaged by months and also by weeks.
However, the results are not so typical. The chart in
Figure 8a, depicting the average relative humidity by month, shows a tendency for lower relative humidity in the warmer months, but there are also outliers. One example is February, which is marked as having a lower relative humidity than both June and July, which is different from what was expected.
The curve in
Figure 8b, describing the average humidity by week, portrays the same tendency. Even though the Summer weeks show an overall lower relative humidity, this value varies greatly from week to week, and from month to month.
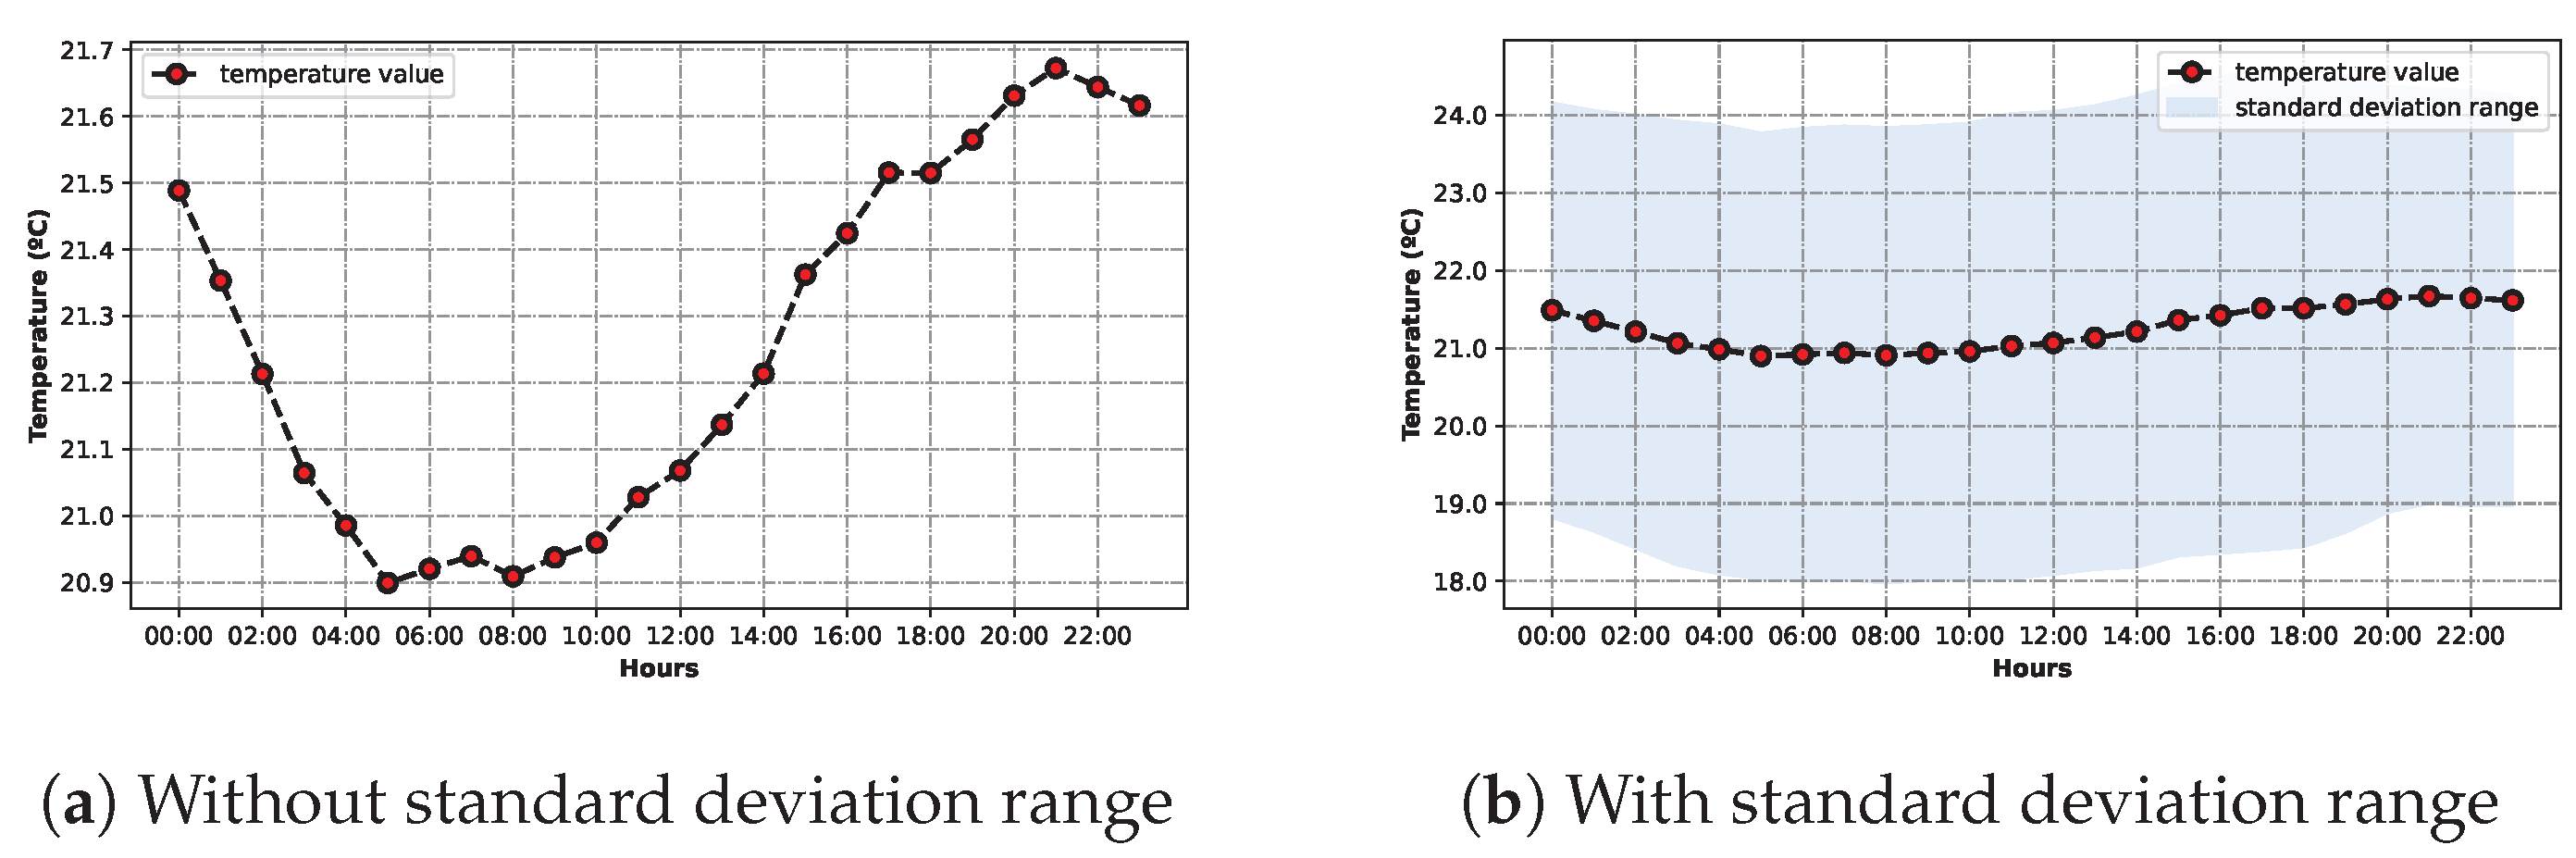
4.2.3. Average Temperature by Hour
To further explore the temperature data, the two charts on
Figure 9 were created.
The curves on both of the charts are exactly the same. They represent the average temperature for each hour of the day. On
Figure 9a, the value variation throughout the day is more clear. Through its analysis, it is possible to determine that the lowest temperature is usually around 05:00 and 08:00, while the highest is around 21:00, which reflects normal values.
Figure 9b shows the same data as the previous plot, as well as a blue area which represents the standard deviation range for each value. Indeed, the standard deviation range is significant. Due to the fact that it represents an average of all the temperature data on the dataset, it contains many different ranges of values.
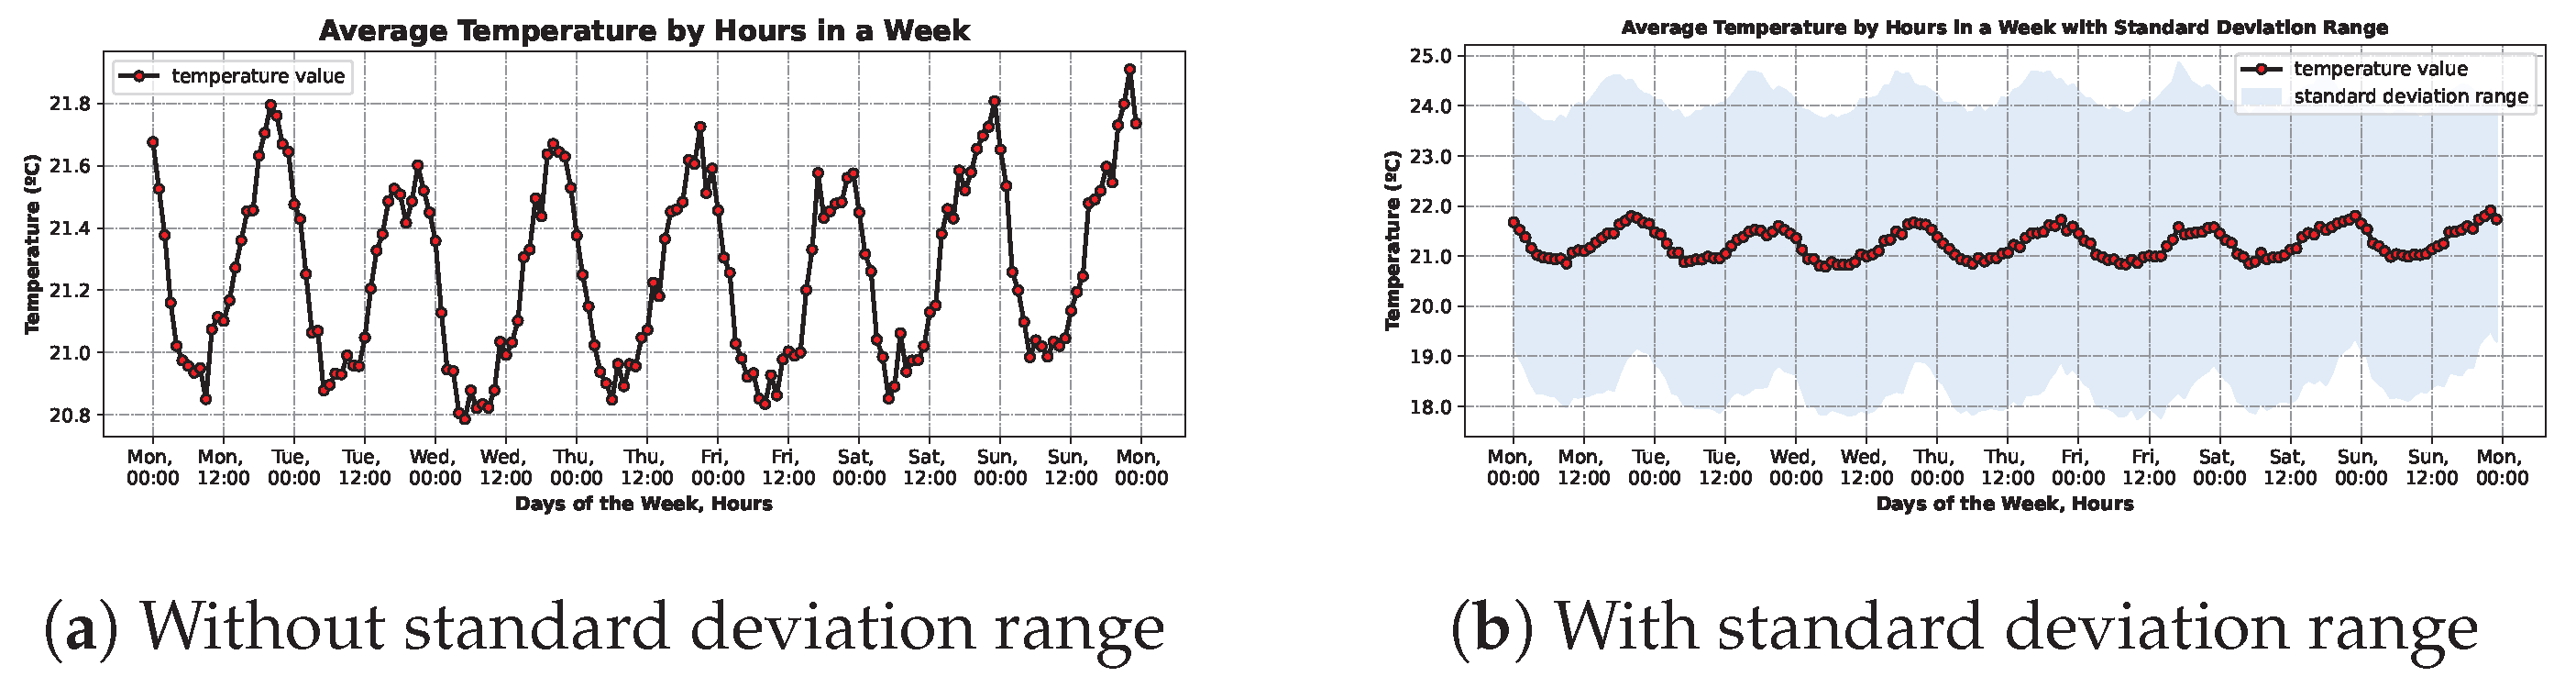
4.2.4. Average Temperature by Hours in a Week
Aiming to analyse how the different weekdays impact temperature, the following two charts were drawn. Similar to the pair of images above (
Figure 9), the curves on both of the charts on
Figure 10 are exactly the same. For each hour on each day of the week, the values were averaged and put together in this chart.
In the first figure,
Figure 10a, the repetition of the pattern on
Figure 9a for each day of the week is clearly depicted. Upon further inspection, some differences can be seen. For example, it is possible to see that, on average, Sundays are the days with higher temperatures, when compared to the other days of the week. This is expected and reflects reality.
The other one,
Figure 10b, comprises the same curve as the previous chart, and also a blue area covering the standard deviation range, using the same concept as in
Figure 9b.
4.3. Occupancy Analysis
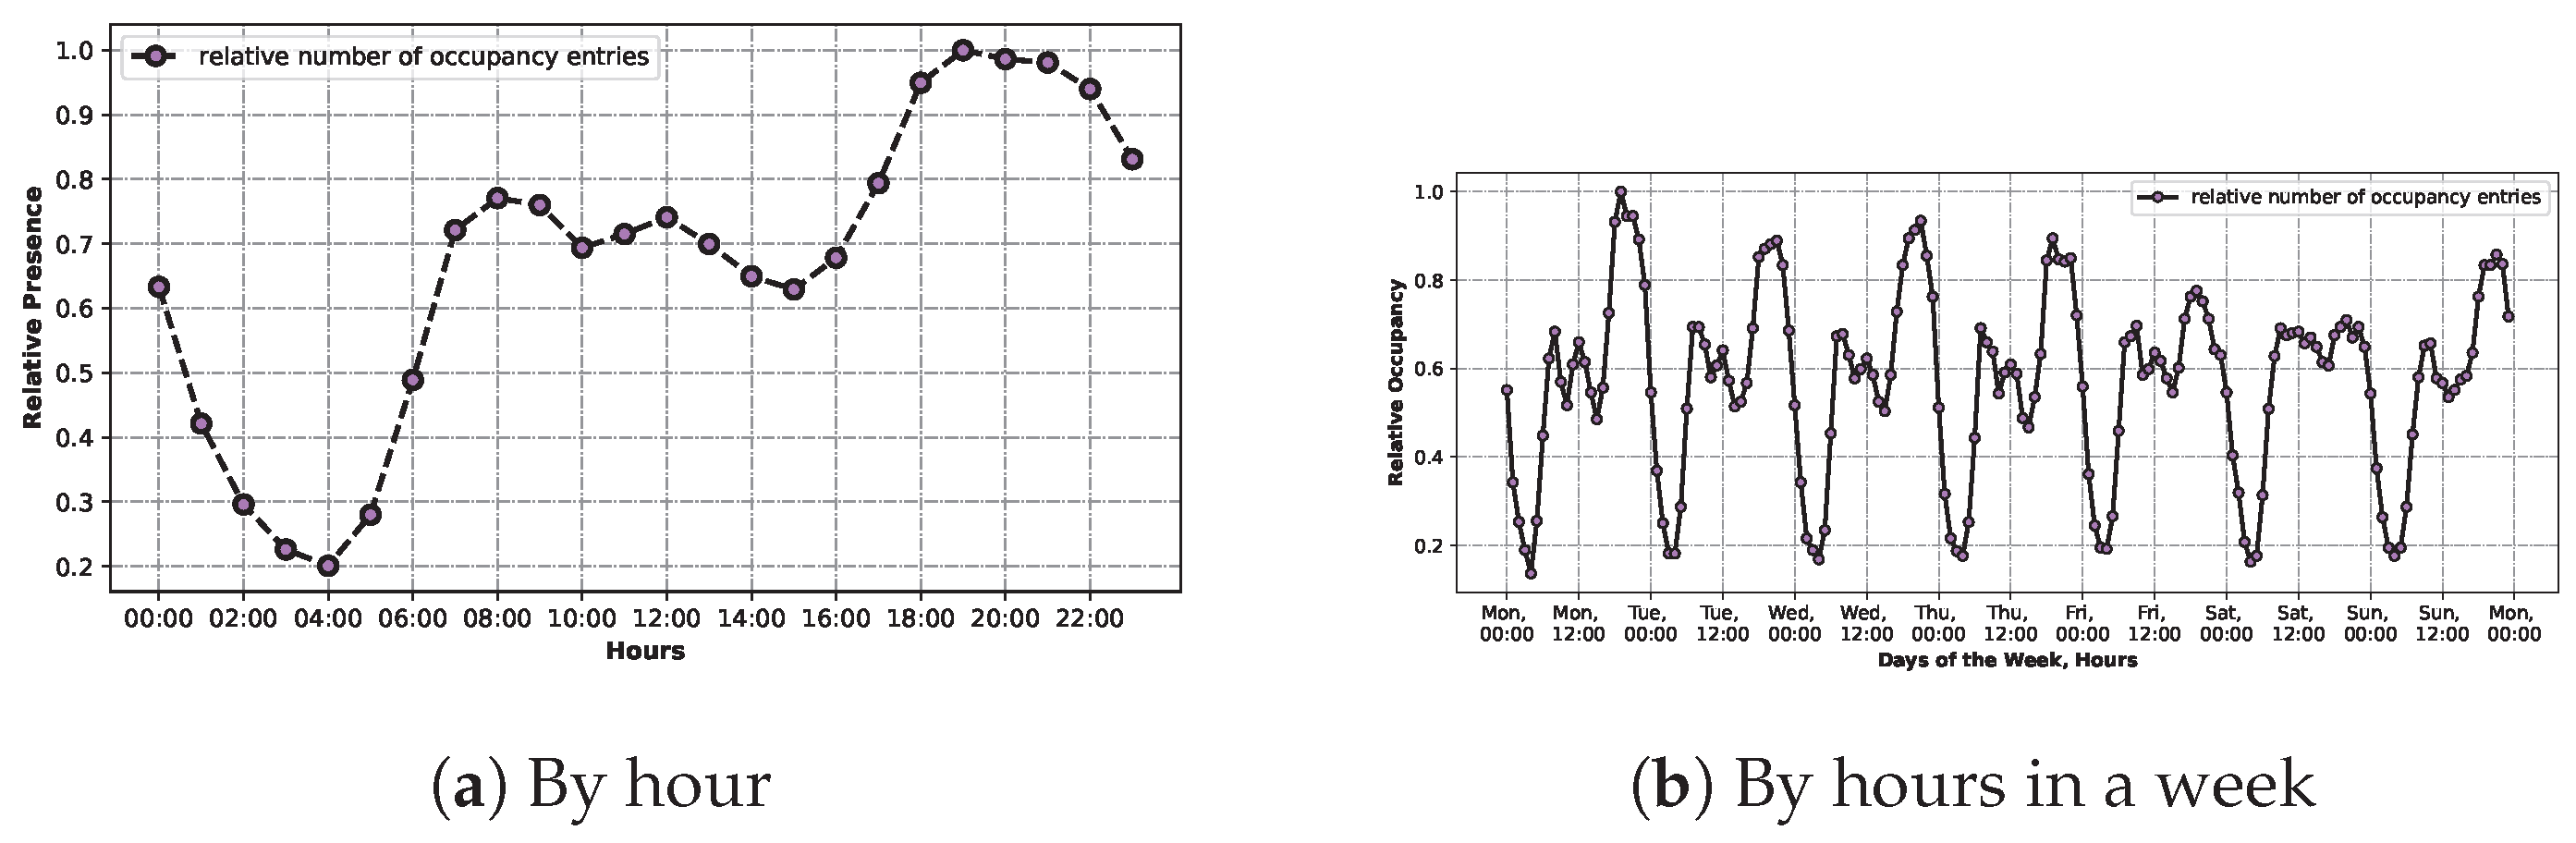
The following charts on
Figure 11 delve into the occupancy data, which are present in the dataset in the form of multiple entries stating that movement was detected.
The first one,
Figure 11a, came to be by counting all the hours when movement was detected per tenant. These values were summed by the hour and then divided by the maximum resulting value. Analysing the graph indicates that 19:00 was the hour when most tenants indicated movement, whereas 04:00 was the lowest. These values are expected.
The other one,
Figure 11b, was created using the same principle, but the data were aggregated by hours in a week, instead of by hours in a day, similar to the graphs in
Figure 10. By analysing the chart, it is possible to see that on Saturday there was not much movement data when compared to the other weekdays.
4.4. Temperature with Occupancy Analysis
The following subsections delve into the possible relationship between occupancy and temperature.
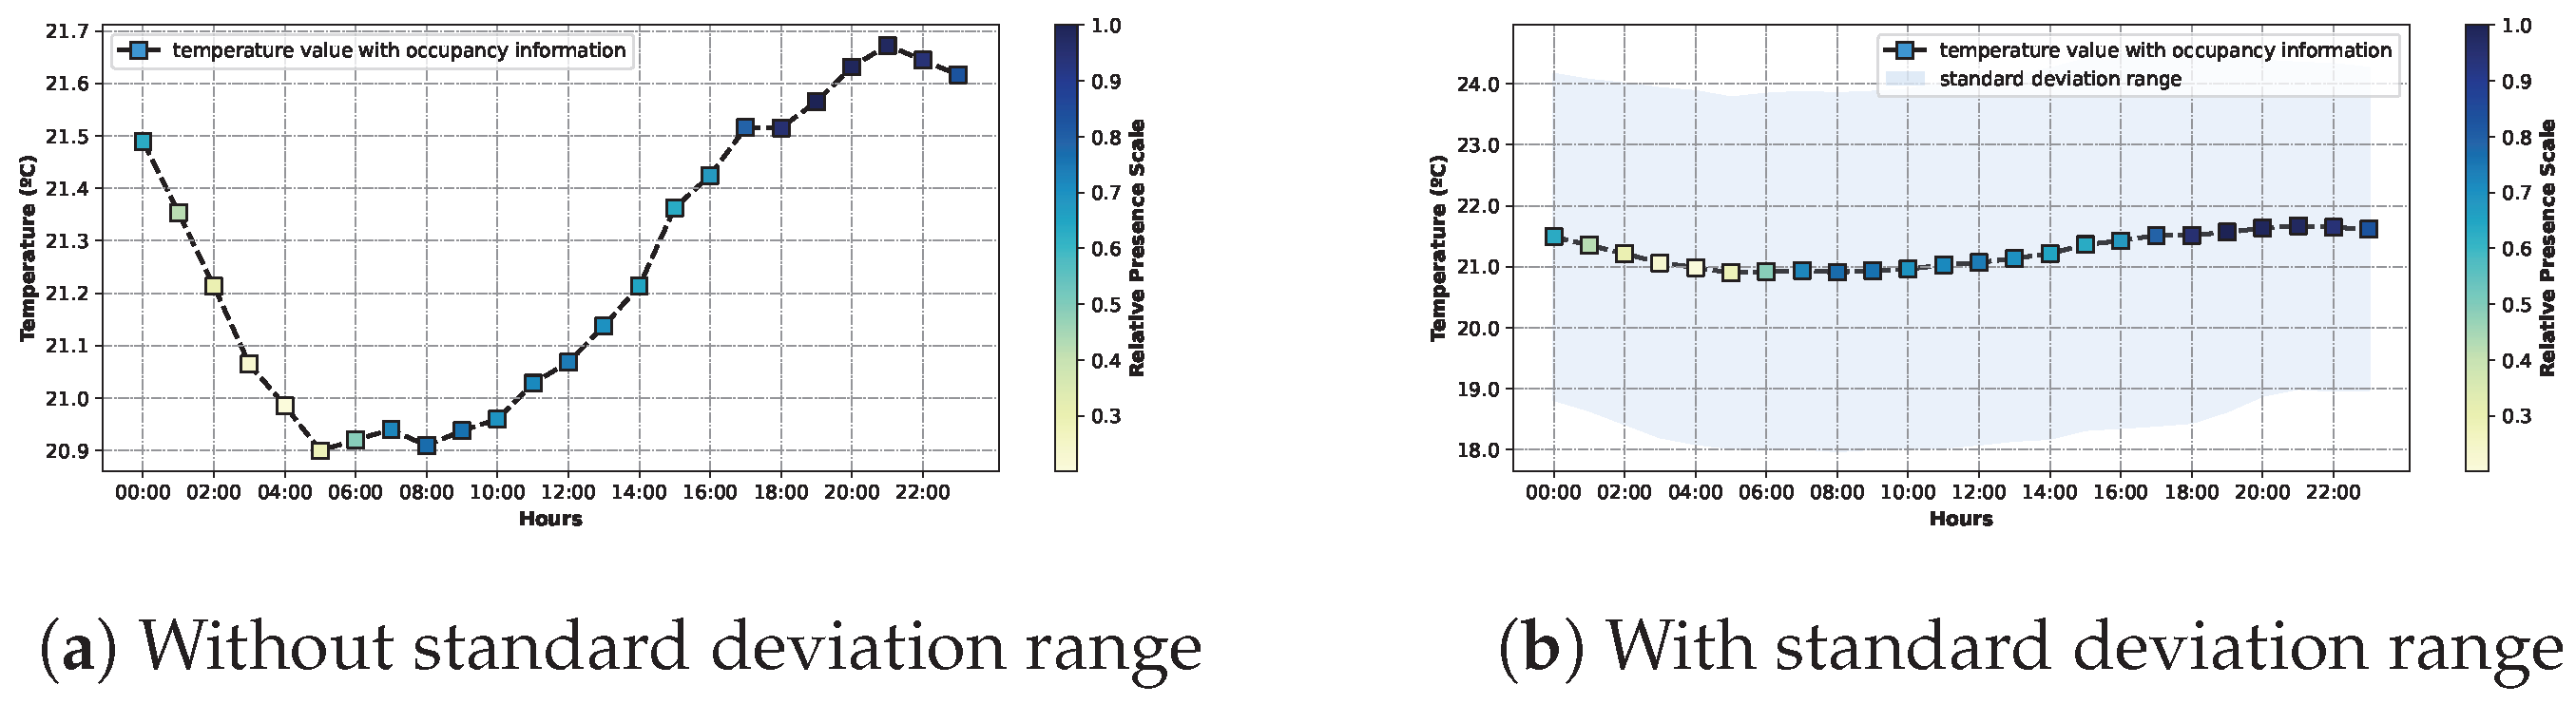
4.4.1. Average Temperature by Hour with Occupancy Information
The curves on the graphs on
Figure 12 are in every way equal to those on
Figure 9. The difference between the charts lies in the markers: the colour of these conveys information on the level of relative occupancy, taking advantage of the information described in
Section 4.3. The darker the colour is, the higher the value of the relative occupancy, indicating a higher number of times the place was occupied.
As expected, when the occupancy had a higher value, the temperature also seemed to be higher. In fact, the maximum temperature value, 21:00, also corresponds to one of the maximum values of relative occupancy.
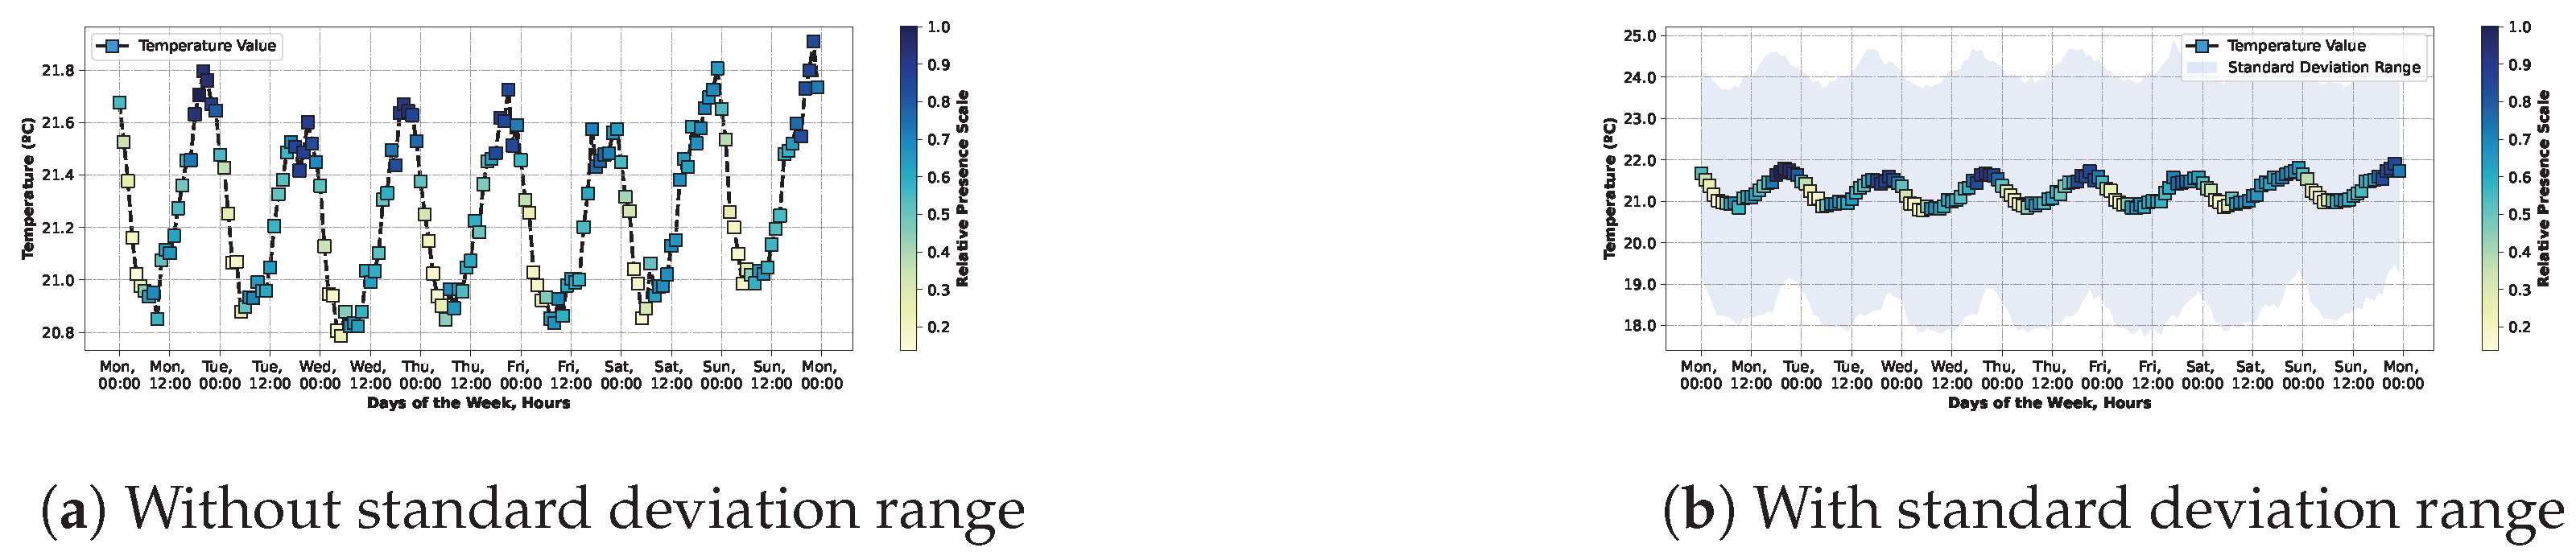
4.4.2. Average Temperature by Hours in a Week with Occupancy Information
Similarly to the previous pair of diagrams, on
Figure 12, these next ones on
Figure 13 also follow the same colour code. Furthermore, the curve depicted is the exact same as the one in
Figure 10.
Analysing the data, it is possible to see the trends that have also been demonstrated by other charts; for example, the fact that Saturday afternoon has a lower occupancy when compared to the other afternoons.


