Data Descriptor

Dataset for Spectroscopic, Structural and Dynamic Analysis of Human Fe(II)/2OG-Dependent Dioxygenase ALKBH3

by
Lyubov Yu. Kanazhevskaya
1,*,
Alexey A. Gorbunov
2,
Polina V. Zhdanova
1 and
Vladimir V. Koval
1,2,*
1
Institute of Chemical Biology and Fundamental Medicine (ICBFM), 8 Lavrentiev Ave., 630090 Novosibirsk, Russia
2
Department of Natural Sciences, Novosibirsk State University, 1 Pirogova St., 630090 Novosibirsk, Russia
*
Authors to whom correspondence should be addressed.
Submission received: 7 December 2022 / Revised: 26 February 2023 / Accepted: 1 March 2023 / Published: 3 March 2023

Abstract

:
Fe(II)/2OG-dependent dioxygenases of the AlkB family catalyze a direct removal of alkylated damages in the course of DNA and RNA repair. A human homolog of the E. coli AlkB ALKBH3 protein is able to hydroxylate N1-methyladenine, N3-methylcytosine, and N1-methylguanine in single-stranded DNA and RNA. Due to its contribution to an antitumor drug resistance, this enzyme is considered a promising therapeutic target. The elucidation of ALKBH3’s structural peculiarities is important to establish a detailed mechanism of damaged DNA recognition and processing, as well as to the development of specific inhibitors. This work presents new data on the wild type ALKBH3 protein and its four mutant forms (Y143F, Y143A, L177A, and H191A) obtained by circular dichroism (CD) spectroscopy. The dataset includes the CD spectra of proteins measured at different temperatures and a 3D visualization of the ALKBH3–DNA complex where the mutated amino acid residues are marked. These results show how substitution of the key amino acids influences a secondary structure content of the protein.
Dataset License: CC BY 4.0

1. Summary

The ALKBH3 protein belongs to a large family of non-heme dioxygenases involved in the dealkylation of nucleic and amino acids [1]. This enzyme has a broad substrate specificity to methyl, ethyl, and etheno modifications of single-stranded DNA and RNA [2]. Increased level of expression of ALKBH3 in some human carcinomas stimulated attempts to control its expression by creating effective inhibitors [3,4,5]. This requires a clear understanding of the mechanism of a lesion coordination within the enzyme’s active site. To date, there is a single crystal structure of wild type (WT) ALKBH3 bound to the Fe(II) ion and 2-oxoglutarate co-substrate but lack of DNA substrate [6]. Therefore, further research involving not only X-ray crystallography, but also various spectroscopic techniques is required to clarify the ALKBH3 active site structure and selectivity. Here, we present a comprehensive set of spectroscopic data which evaluate the secondary structure content and a thermal denaturation profile for WT and mutant variants of ALKBH3 dioxygenase. A 3D-structure of the catalytic complex of ALKBH3 with Fe(II), 2OG, and methylated DNA was visualized using the UCSF Chimera software (University of California, San Francisco, USA) [7]. Based on the structure, the mutant forms Y143F, Y143A, L177A, and H191A ALKBH3 have been selected for analysis by circular dichroism (CD) spectroscopy. The optimal conditions for the ALKBH3 samples and the buffer preparation as well as the settings of spectra collecting (e.g., cuvette pathlengths, wavelengths range, temperature, and speed) were determined during this work. Based on the findings, the CD spectra of the WT and mutant ALKBH3 protein were recorded at different temperatures. Deconvolution of the spectra was carried out using two non-linear regression algorithms (CDSSTR and DSSP) of the Dichroweb [8] and BeStSel software [9], respectively. It was found that the DSSP method produces a better fitting result, providing detailed information about the secondary structure content for each of the proteins. In agreement with the CD spectra of E. coli AlkB [10], our data indicate the presence of a high level of the β-strand component in the WT ALKBH3 structure, which decreases when key amino acids of the protein are substituted for Ala. In addition, a melting profile of the proteins has been studied by measuring the CD spectra over a wide temperature range. We observed that the thermal denaturation of WT ALKBH3 and its mutants is followed by a single cooperative transition between 43 and 45 °C. The CD dataset collected as a function of temperature will be used to determine the thermodynamic parameters (e.g., melting temperature, enthalpy, and entropy) and presented in our next paper. The CD spectroscopy can provide new information about the structure and dynamics of ALKBH3 and similar dioxygenases due to its ability to operate under physiological conditions in aqueous buffers at micromolar concentrations of the protein. The information herein will be helpful for researchers attempting to study the spatial structure of proteins by CD spectroscopy, in particular when selecting optimal buffers, protein concentrations, and spectrum acquisition parameters.

2. Data Description

2.1. Visualization of the ALKBH3–DNA Complex

The spatial structure of the WT ALKBH3 bound to Fe(II), 2OG, and methylated DNA was created by overlaying the ALKBH3 crystal structure 2IUW [6] and 15nt DNA substrate (5′-d(ACAGGATC(m3C)GGCATA); m3C–N3-methylcytosine) using the UCSF Chimera software (University of California, San Francisco, CA, USA). One can find the completed structure in the Mendeley Data repository http://dx.doi.org/10.17632/7bfsjtkgtb.1 (accessed on 7 December 2022) in three different file formats: PY, CXS, and PDB for user convenience. The key amino acid residues to be substituted are highlighted in dark cyan color.

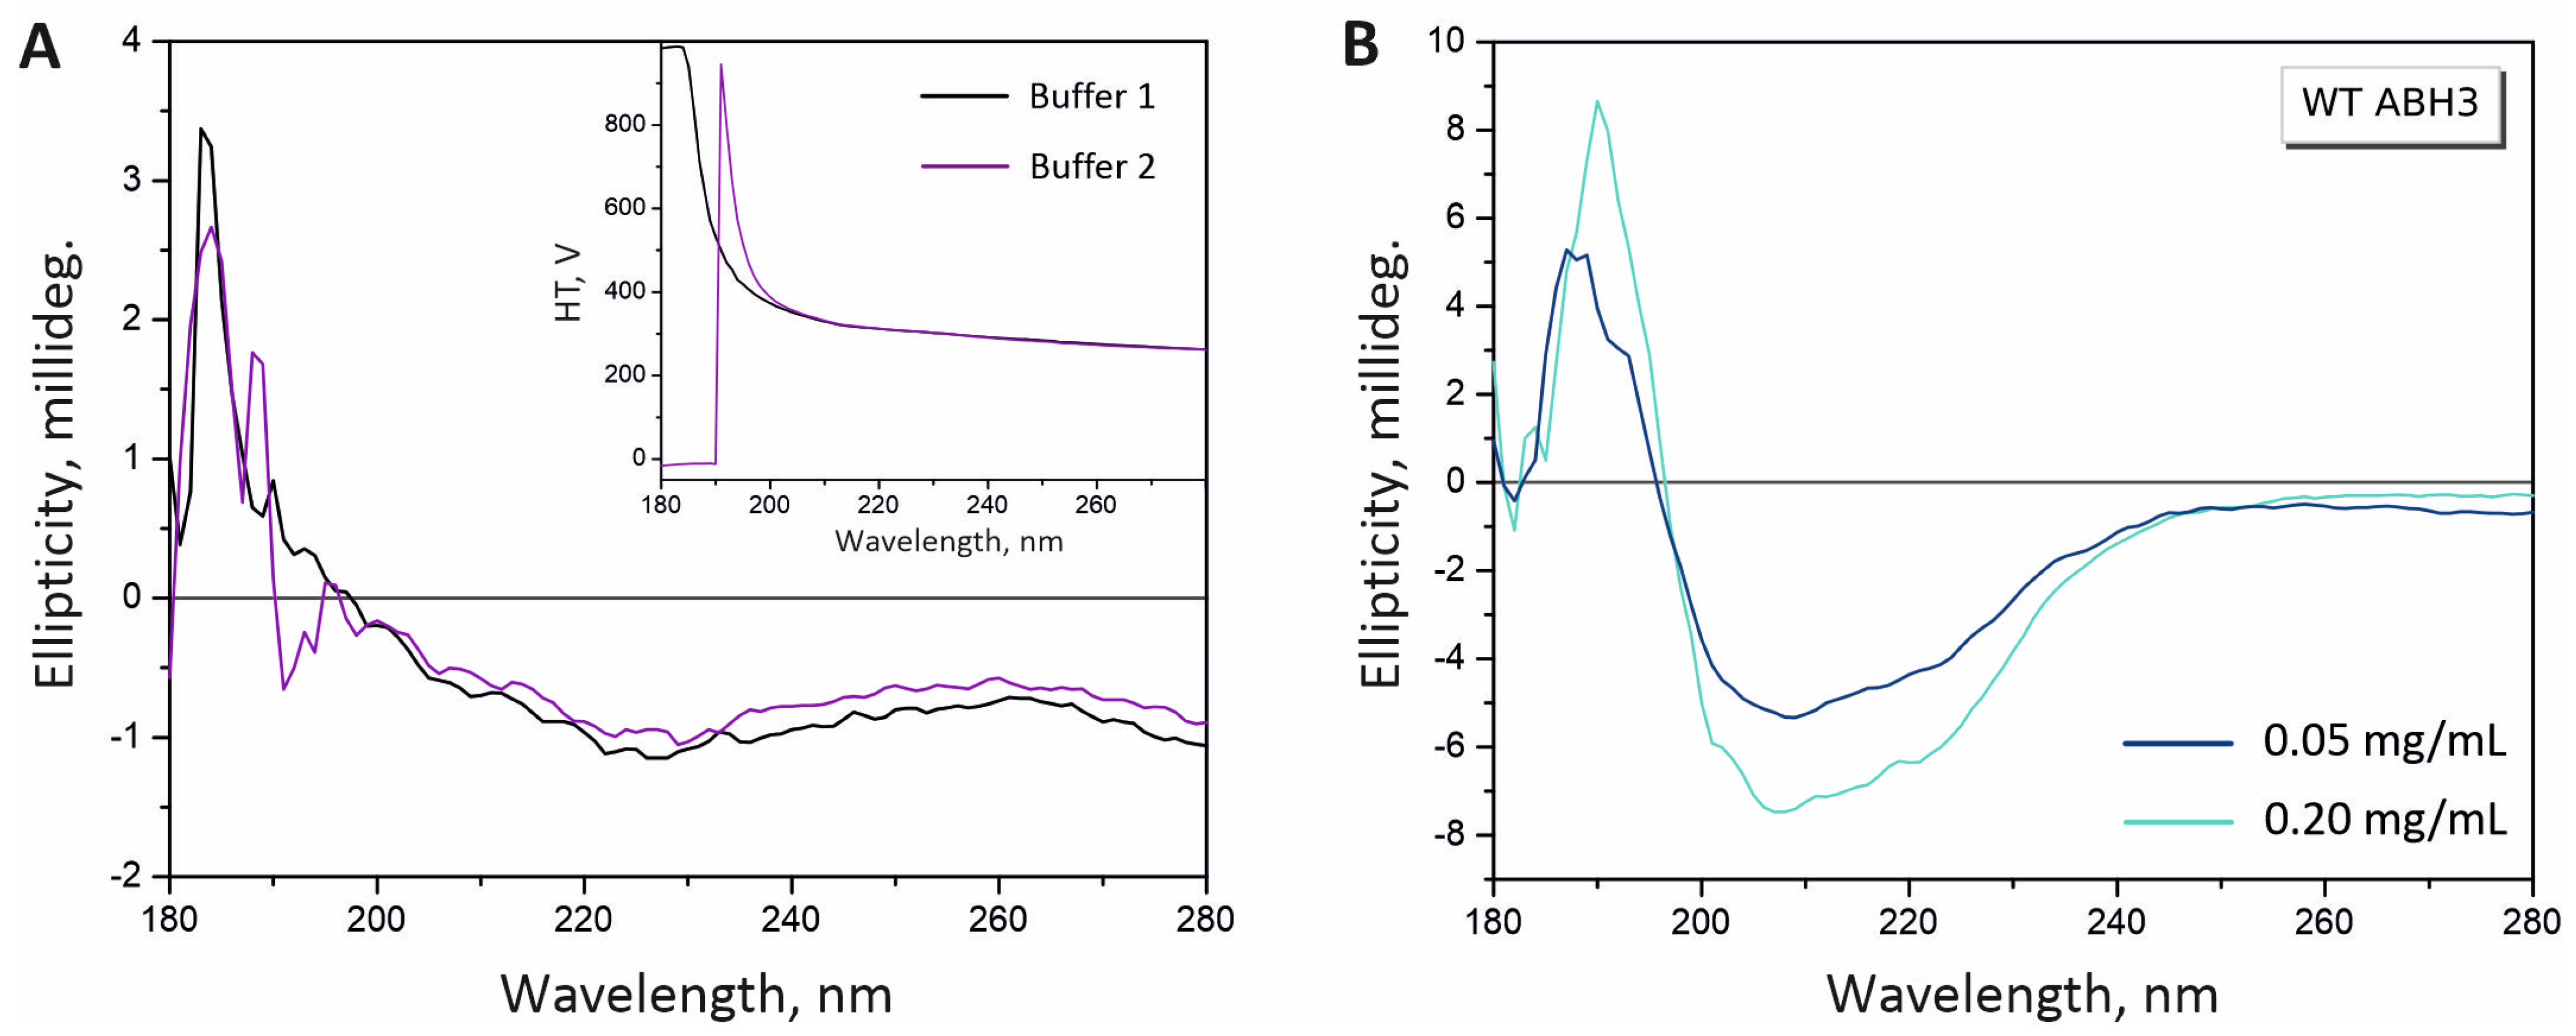
2.2. Optimization of Experimental Conditions for CD Measurements

The quality of CD spectra depends, among other factors, on the level of absorption of the buffer solution. To find a buffer for ALKBH3 with the highest transparency in the far-UV region, we compared CD spectra of the Buffer 1 (10 mM potassium phosphate (pH 7.8), 50 mM (NH4)2SO4) and Buffer 2 (10 mM potassium phosphate (pH 7.8), 50 mM KCl) (Figure 1A). The spectra of baselines show that a signal-to-noise ratio greatly diminished below 190 nm for Buffer 1 and below 200 nm for Buffer 2. Thus, we considered Buffer 1, containing (NH4)2SO4, to be more eligible for further experiments than Buffer 2, containing KCl. The protein concentration is another important criterion for obtaining a high-quality CD spectrum. We compared the spectrum of WT ALKBH3 recorded at two protein concentrations: 0.05 mg/mL and 0.2 mg/mL (Figure 1B). The results indicated that spectra collected at higher concentrations have larger absolute values of ellipticity. In the case of ALKBH3 the protein concentration above 0.2 mg/mL was difficult to achieve due to its susceptibility to aggregation and adhesion to the dialysis membrane. These optimized conditions were applied for collecting CD spectra of WT and mutant forms of ALKBH3. The resulted spectra had a positive band at 193 nm and a negative band at 205 nm. This spectroscopic behavior is typical for enzymes rich in β-strands, which are presented in DNA dioxygenases as a “jelly-roll” motif [11]. A previously published CD spectrum of the bacterial ALKBH3 homolog AlkB demonstrated the same overall shape with the bands shifted by 2–3 nm [10].

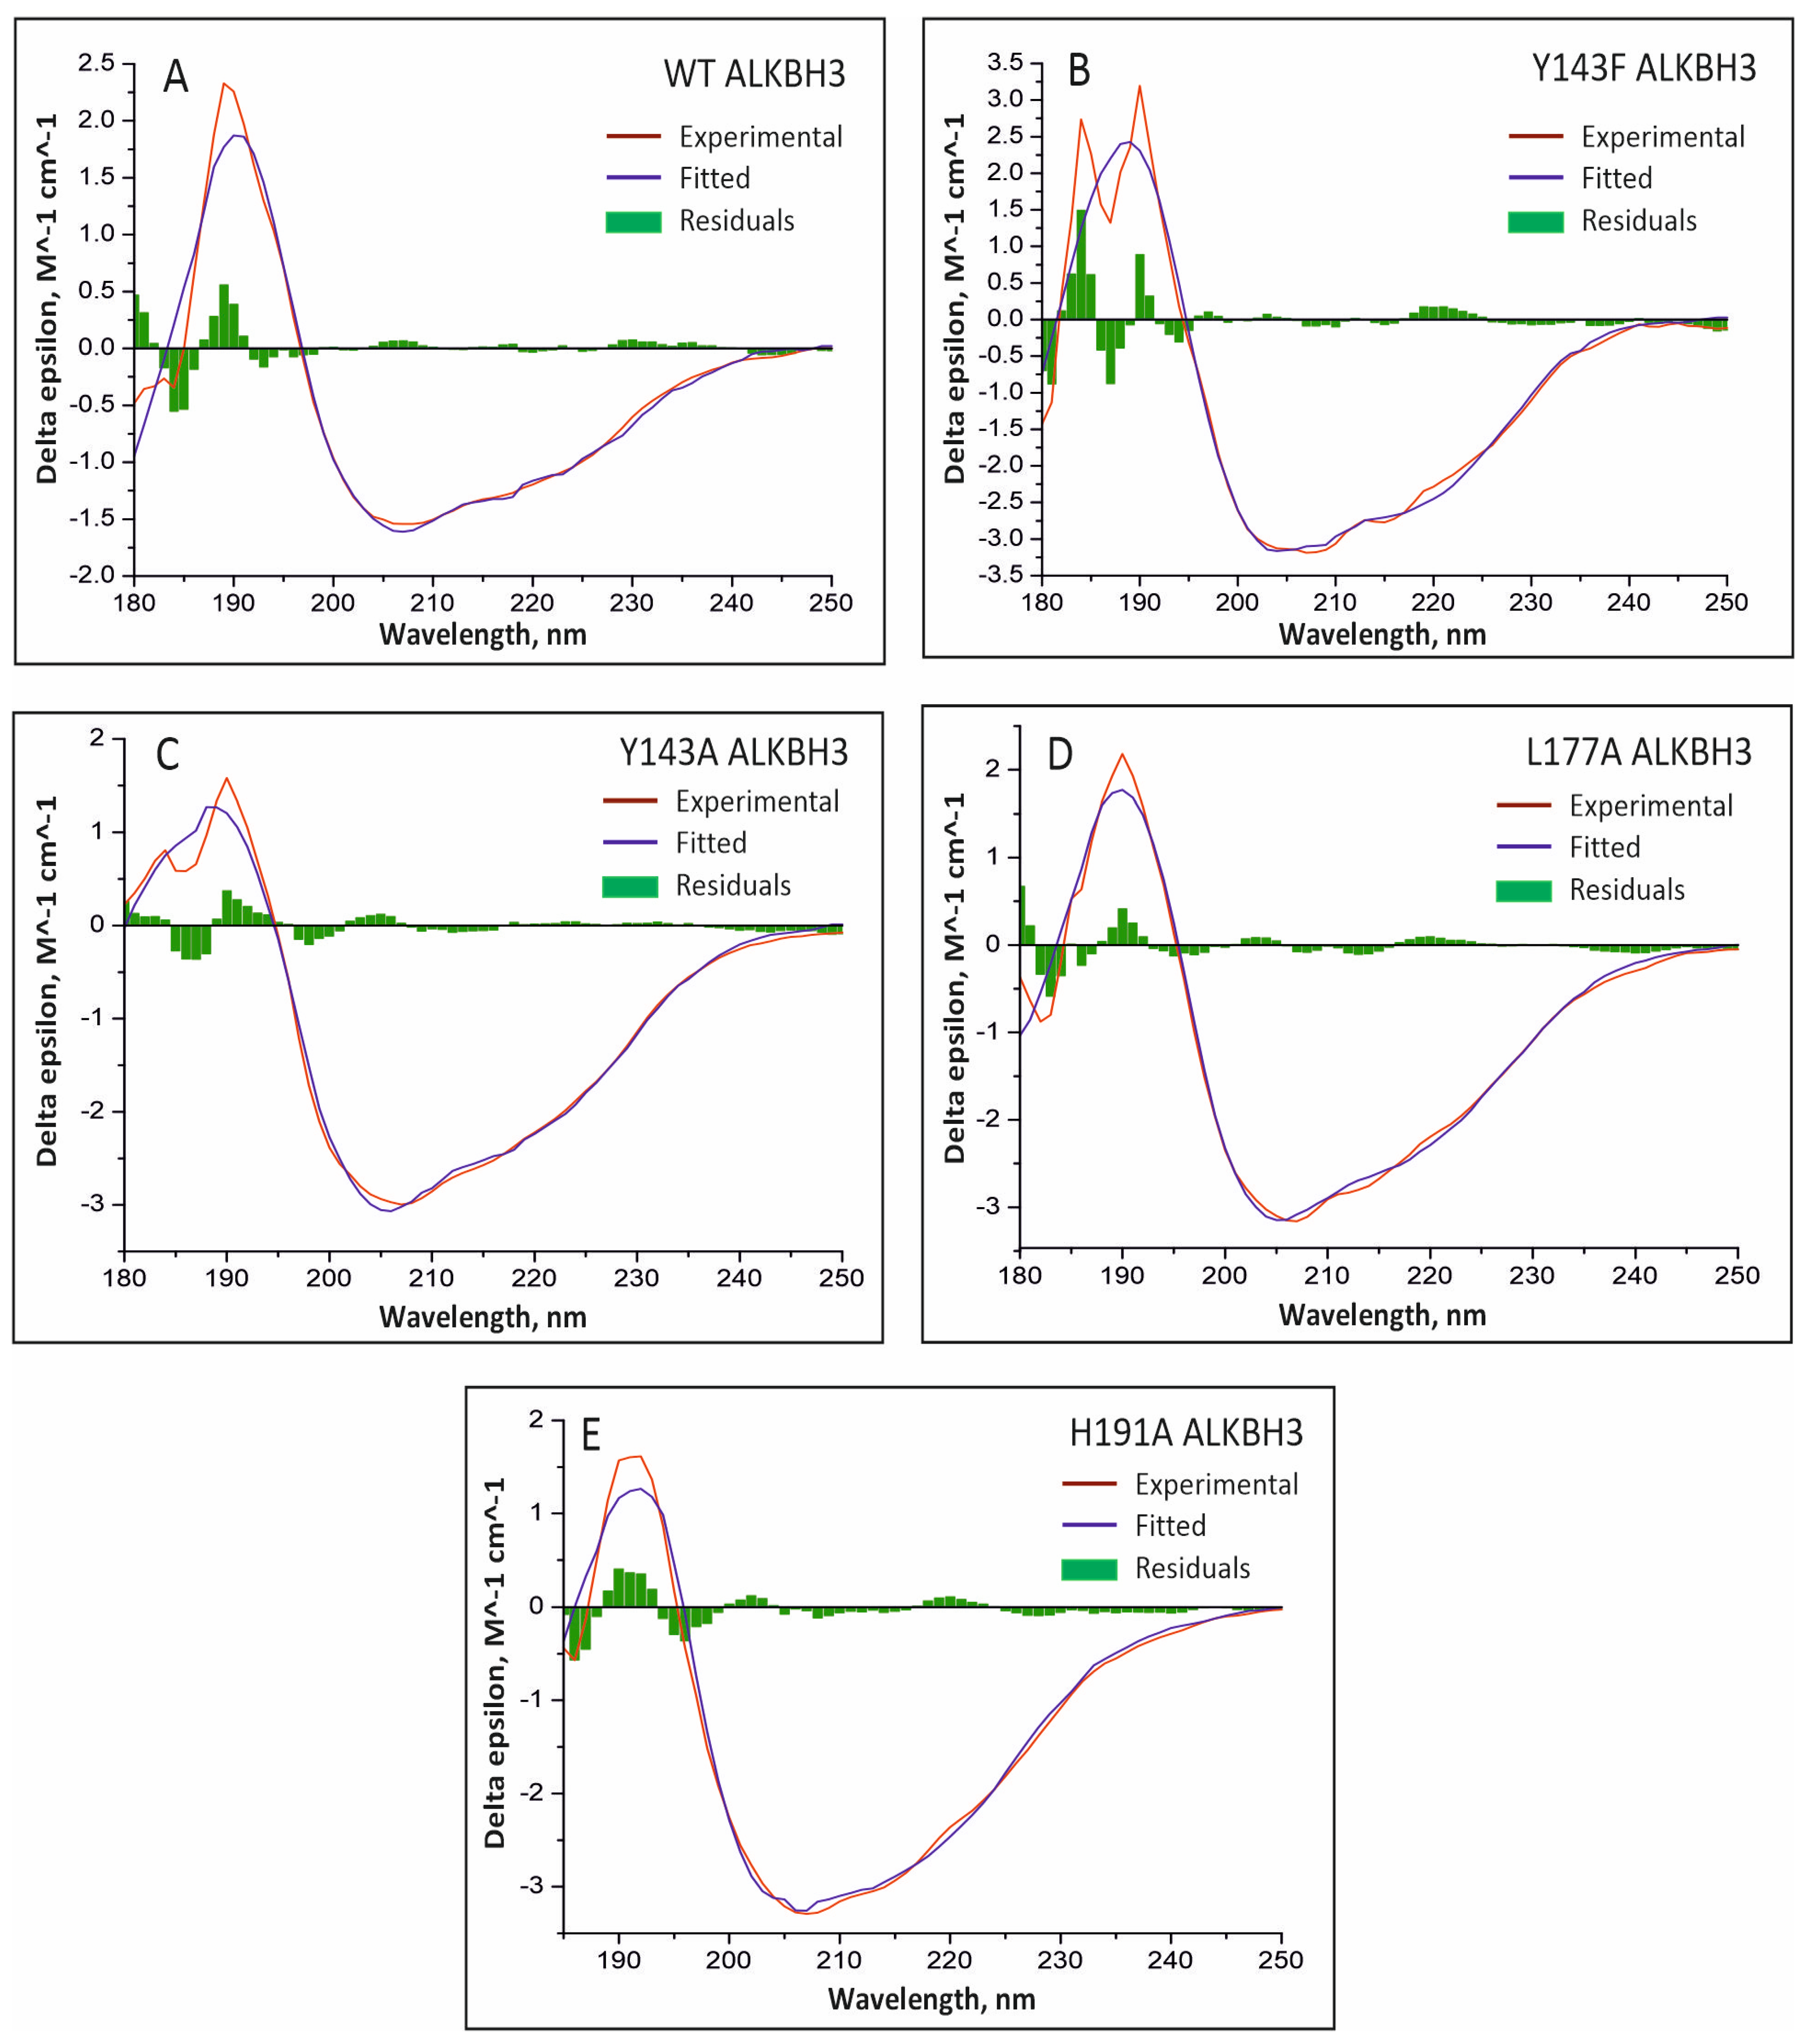
2.3. Deconvolution of the Individual CD Spectrum

CD spectra obtained for WT, Y143F, Y143A, L177A, and H191A ALKBH3 were subjected to quantitative analysis (Figure 2). The ellipticity was normalized to the protein concentration by conversion into Δθ (M−1·cm−1) units. Two types of online analysis programs were applied to evaluate the secondary structure content from the spectra: DichroWeb [8] combined to CDSSTR algorithm, and BeStSel [9] which uses structure basis components derived from DSSP. Table 1 summarizes the ratio of secondary structure components (α-helices, β-sheets, turns, etc.) for WT and mutant proteins determined by the BeStSel program. Due to the higher contribution of a machine noise below 190 nm, the quality of fitting over a wavelength range of 185 to 250 nm in most cases exceeded that of the 180–250 nm range. The results of data fitting by the CDSSTR method (DichroWeb) are presented in Table 2. It can be seen that NRMSD values for both methods are in general correlation. At the same time, the helical content determined by different methods does not fully coincide. CDSSTR reveals more α-helices within ALKBH3 globule than BeStSel. Our data show the prevalence of β-sheets in the secondary structure of the WT protein. However, mutation of the key amino acids leads to a decrease in the β-strand component and to the increase in the fraction of α-helices and turns.

2.4. Measuring the Melting of the ALKBH3 Protein Globule by CD Spectroscopy

Figure 3 presents data on thermal denaturation of WT and mutant ALKBH3 proteins detected by CD spectroscopy. Experiments were conducted under conditions described in Section 2.2. Changes in the CD bands at characteristic wavelengths were detected as a function of temperature between 25 and 70 °C with a step of 2–5 °C. As expected, the spectra obtained at physiological temperatures had common features with the spectra recorded at 11 °C. A characteristic peak at 208 nm was applied for analysis of the spectra because it shifts markedly as the temperature rises. It was found that the secondary structure of WT ALKBH3 and all mutant forms, except for Y143A, is stable before 38 °C and after 55 °C. A sudden transition between the native and denatured forms of Y143F and H191A ALKBH3 may point to the presence of numerous cooperative units. In all cases, the CD spectrum retains in part its characteristic shape even after the maximum degree of denaturation is reached. This may indicate that the denaturated form of ALKBH3 is described by the “molten globule state” [12]. Based on a qualitative analysis of the melting profiles, we anticipate the midpoint of the unfolding transition to lie in the range of 43–45 °C.

3. Methods

Far-UV CD spectra from 185 to 280 nm were recorded using a J600 spectrometer (Jasco, Tokyo, Japan) in a 0.1 cm path length quartz cuvette (Starna Cells, CA, USA). In all cases, the protein sample (~50 nmol) was dialyzed two times against the CD buffer containing 10 mM potassium phosphate (pH 7.8) and 50 mM (NH4)2SO4. The concentration of recombinant ALKBH3 proteins was verified by absorption at 280 nm and adjusted to 0.2 mg/mL. The CD spectra for the determination of the secondary structure were collected three times (each spectrum was an average of 10 repeats) at the speed of 50 nm/min and 1 nm step size (spectral bandwidth 2 nm). To increase stability, the protein samples were cooled to 11°C during recording. Data were corrected for a baseline by subtraction of the buffer spectrum and expressed as mean residue ellipticity [θ] (deg.·cm2·dmol−1).
Spectra for the melting profile were collected under conditions similar to those of far-UV CD spectra from 25 to 70 °C with the samples incubated at each temperature for 3–5 min before measuring. Melting curves were corrected for background, transformed to the mean residue ellipticity units, and smoothed using the Savitzky–Golay method with a polynomial order of 3.

Author Contributions

Conceptualization, L.Y.K.; methodology, L.Y.K. and V.V.K.; software, P.V.Z.; investigation, A.A.G.; validation, L.Y.K.; formal analysis, A.A.G. and L.Y.K.; writing—original draft preparation, L.Y.K.; writing—review and editing, L.Y.K. and V.V.K.; supervision, V.V.K. All authors have read and agreed to the published version of the manuscript.

Funding

This work was funded by Russian Science Foundation, grant No. 22-24-00699.

Institutional Review Board Statement

Not applicable.

Informed Consent Statement

Not applicable.

Data Availability Statement

The data presented in this study are openly available in Mendeley Data repository at https://doi.org/10.17632/7bfsjtkgtb.1.

Conflicts of Interest

The authors declare no conflict of interest.

References

  1. Fedeles, B.I.; Singh, V.; Delaney, J.C.; Li, D.; Essigmann, J.M. The AlkB Family of Fe(II)/alpha-Ketoglutarate-dependent Dioxygenases: Repairing Nucleic Acid Alkylation Damage and Beyond. J. Biol. Chem. 2015, 290, 20734–20742. [Google Scholar] [CrossRef] [PubMed] [Green Version]
  2. Aas, P.A.; Otterlei, M.; Falnes, P.O.; Vagbo, C.B.; Skorpen, F.; Akbari, M.; Sundheim, O.; Bjoras, M.; Slupphaug, G.; Seeberg, E.; et al. Human and bacterial oxidative demethylases repair alkylation damage in both RNA and DNA. Nature 2003, 421, 859–863. [Google Scholar] [CrossRef] [PubMed]
  3. Tasaki, M.; Shimada, K.; Kimura, H.; Tsujikawa, K.; Konishi, N. ALKBH3, a human AlkB homologue, contributes to cell survival in human non-small-cell lung cancer. Br. J. Cancer 2011, 104, 700–706. [Google Scholar] [CrossRef] [PubMed] [Green Version]
  4. Shimada, K.; Fujii, T.; Tsujikawa, K.; Anai, S.; Fujimoto, K.; Konishi, N. ALKBH3 contributes to survival and angiogenesis of human urothelial carcinoma cells through NADPH oxidase and tweak/Fn14/VEGF signals. Clin. Cancer Res. 2012, 18, 5247–5255. [Google Scholar] [CrossRef] [PubMed] [Green Version]
  5. Rose, N.R.; McDonough, M.A.; King, O.N.; Kawamura, A.; Schofield, C.J. Inhibition of 2-oxoglutarate dependent oxygenases. Chem. Soc. Rev. 2011, 40, 4364–4397. [Google Scholar] [CrossRef] [PubMed]
  6. Sundheim, O.; Vagbo, C.B.; Bjoras, M.; Sousa, M.M.; Talstad, V.; Aas, P.A.; Drablos, F.; Krokan, H.E.; Tainer, J.A.; Slupphaug, G. Human ABH3 structure and key residues for oxidative demethylation to reverse DNA/RNA damage. EMBO J. 2006, 25, 3389–3397. [Google Scholar] [CrossRef] [PubMed] [Green Version]
  7. Pettersen, E.F.; Goddard, T.D.; Huang, C.C.; Couch, G.S.; Greenblatt, D.M.; Meng, E.C.; Ferrin, T.E. UCSF chimera—A visualization system for exploratory research and analysis. J. Comput. Chem. 2004, 25, 1605–1612. [Google Scholar] [CrossRef] [PubMed] [Green Version]
  8. Sreerama, N.; Woody, R.W. Estimation of protein secondary structure from circular dichroism spectra: Comparison of CONTIN, SELCON, and CDSSTR methods with an expanded reference set. Anal. Biochem. 2000, 287, 252–260. [Google Scholar] [CrossRef] [PubMed]
  9. Micsonai, A.; Wien, F.; Kernya, L.; Lee, Y.H.; Goto, Y.; Refregiers, M.; Kardos, J. Accurate secondary structure prediction and fold recognition for circular dichroism spectroscopy. Proc. Natl. Acad. Sci. USA 2015, 112, E3095–E3103. [Google Scholar] [CrossRef] [PubMed] [Green Version]
  10. Bleijlevens, B.; Shivarattan, T.; van den Boom, K.S.; de Haan, A.; van der Zwan, G.; Simpson, P.J.; Matthews, S.J. Changes in protein dynamics of the DNA repair dioxygenase AlkB upon binding of Fe(2+) and 2-oxoglutarate. Biochemistry 2012, 51, 3334–3341. [Google Scholar] [CrossRef] [PubMed]
  11. Dunwell, J.M.; Purvis, A.; Khuri, S. Cupins: The most functionally diverse protein superfamily? Phytochemistry 2004, 65, 7–17. [Google Scholar] [CrossRef] [PubMed]
  12. Kuwajima, K. The molten globule state as a clue for understanding the folding and cooperativity of globular-protein structure. Proteins 1989, 6, 87–103. [Google Scholar] [CrossRef] [PubMed]
Figure 1. Representative CD spectra of buffers and ALKBH3 protein at 11 °C. (A) Spectra of a baseline recorded with solutions of Buffer 1 (black) and Buffer 2 (purple) between 180 and 280 nm. The change in the photomultiplier dynode voltage (HT voltage) as a function of wavelength is shown as an inset. (B) The spectrum of 0.05 mg/mL (blue) and 0.2 mg/mL (light blue) WT ALKBH3 in a 0.1 cm cell between 180 and 280 nm expressed in ellipticity (millidegrees) units. Spectra were corrected for baseline and smoothed.
Data 08 00057 g001
Figure 2. The single spectrum analysis results for WT (A), Y143F (B), Y143A (C), L177A (D), and H191A ALKBH3 (E) implemented using the BeStSel online resource [9]. Spectra were collected for ~0.2 mg/mL of the protein in the presence of 10 mM potassium phosphate (pH 7.8) and 50 mM (NH4)2SO4 in a 0.1 cm cell at 11 °C. Each graph represents the results of fitting in the wavelength range of 180–250 nm. Experimental and fitted curves are depicted in red and blue colors, respectively. Green bars correspond to RMSD values along the spectrum.
Data 08 00057 g002
Figure 3. Melting profiles of WT (A), Y143F (B), Y143A (C), L177A (D), and H191A (E) ALKBH3 proteins obtained as a function of temperature and expressed in the mean residue ellipticity (θ) units. Spectra were collected in a 0.1 cm cell with 0.16–0.20 mg/mL proteins from 25 to 70 °C over a wavelength range of 185 to 270 nm.
Data 08 00057 g003
Table 1. The ratio of protein secondary structure components derived from the single spectrum analysis using the BeStSel resource at wavelength ranges of 180–250 nm and 185–250 nm. Values of normalized root-mean-square deviation (NRMSD) reflect the quality of the fitting.
ProteinWavelength Range, nmRegular α-HelixDistorted α-HelixAntiparallel β-StrandParallel β-StrandTurnsOtherNRMSD
WT ALKBH3180–2500.050.010.3300.140.470.049
185–2500.0400.4100.120.430.031
Y143F ALKBH3180–2500.080.030.3100.120.460.048
185–2500.120.040.270.110.140.420.029
Y143A ALKBH3180–2500.090.060.1700.190.490.027
185–2500.120.070.160.060.140.460.017
L177A ALKBH3180–2500.080.060.2100.170.480.055
185–2500.090.060.200.060.120.470.022
H191A ALKBH3180–2500.080.080.160.110.170.500.061
185–2500.080.060.160.080.120.490.030
Table 2. The ratio of protein secondary structure components obtained using the DichroWeb resource. A CDSSTR analysis program supplemented by the Reference Set3 (185–240 nm) was applied for calculations. Values of normalized root-mean-square deviation (NRMSD) reflect the quality of the fitting.
ProteinRegular α-HelixDistorted α-HelixRegular β-StrandDistorted β-StrandTurnsUnorderedNRMSD
WT ALKBH30.100.40.220.140.240.350.065
Y143F ALKBH30.40.40.190.150.210.380.027
Y143A ALKBH30.90.100.140.110.240.330.052
L177A ALKBH30.90.100.140.110.240.320.057
H191A ALKBH30.110.110.110.100.260.320.038
Disclaimer/Publisher’s Note: The statements, opinions and data contained in all publications are solely those of the individual author(s) and contributor(s) and not of MDPI and/or the editor(s). MDPI and/or the editor(s) disclaim responsibility for any injury to people or property resulting from any ideas, methods, instructions or products referred to in the content.

