
Dataset AqADAPT: Physicochemical Parameters, Vibrio Abundance, and Species Determination in Water Columns of Two Adriatic Sea Aquaculture Sites

 ,
,  , , , , ,
Abstract
:1. Introduction
2. Materials and Methods
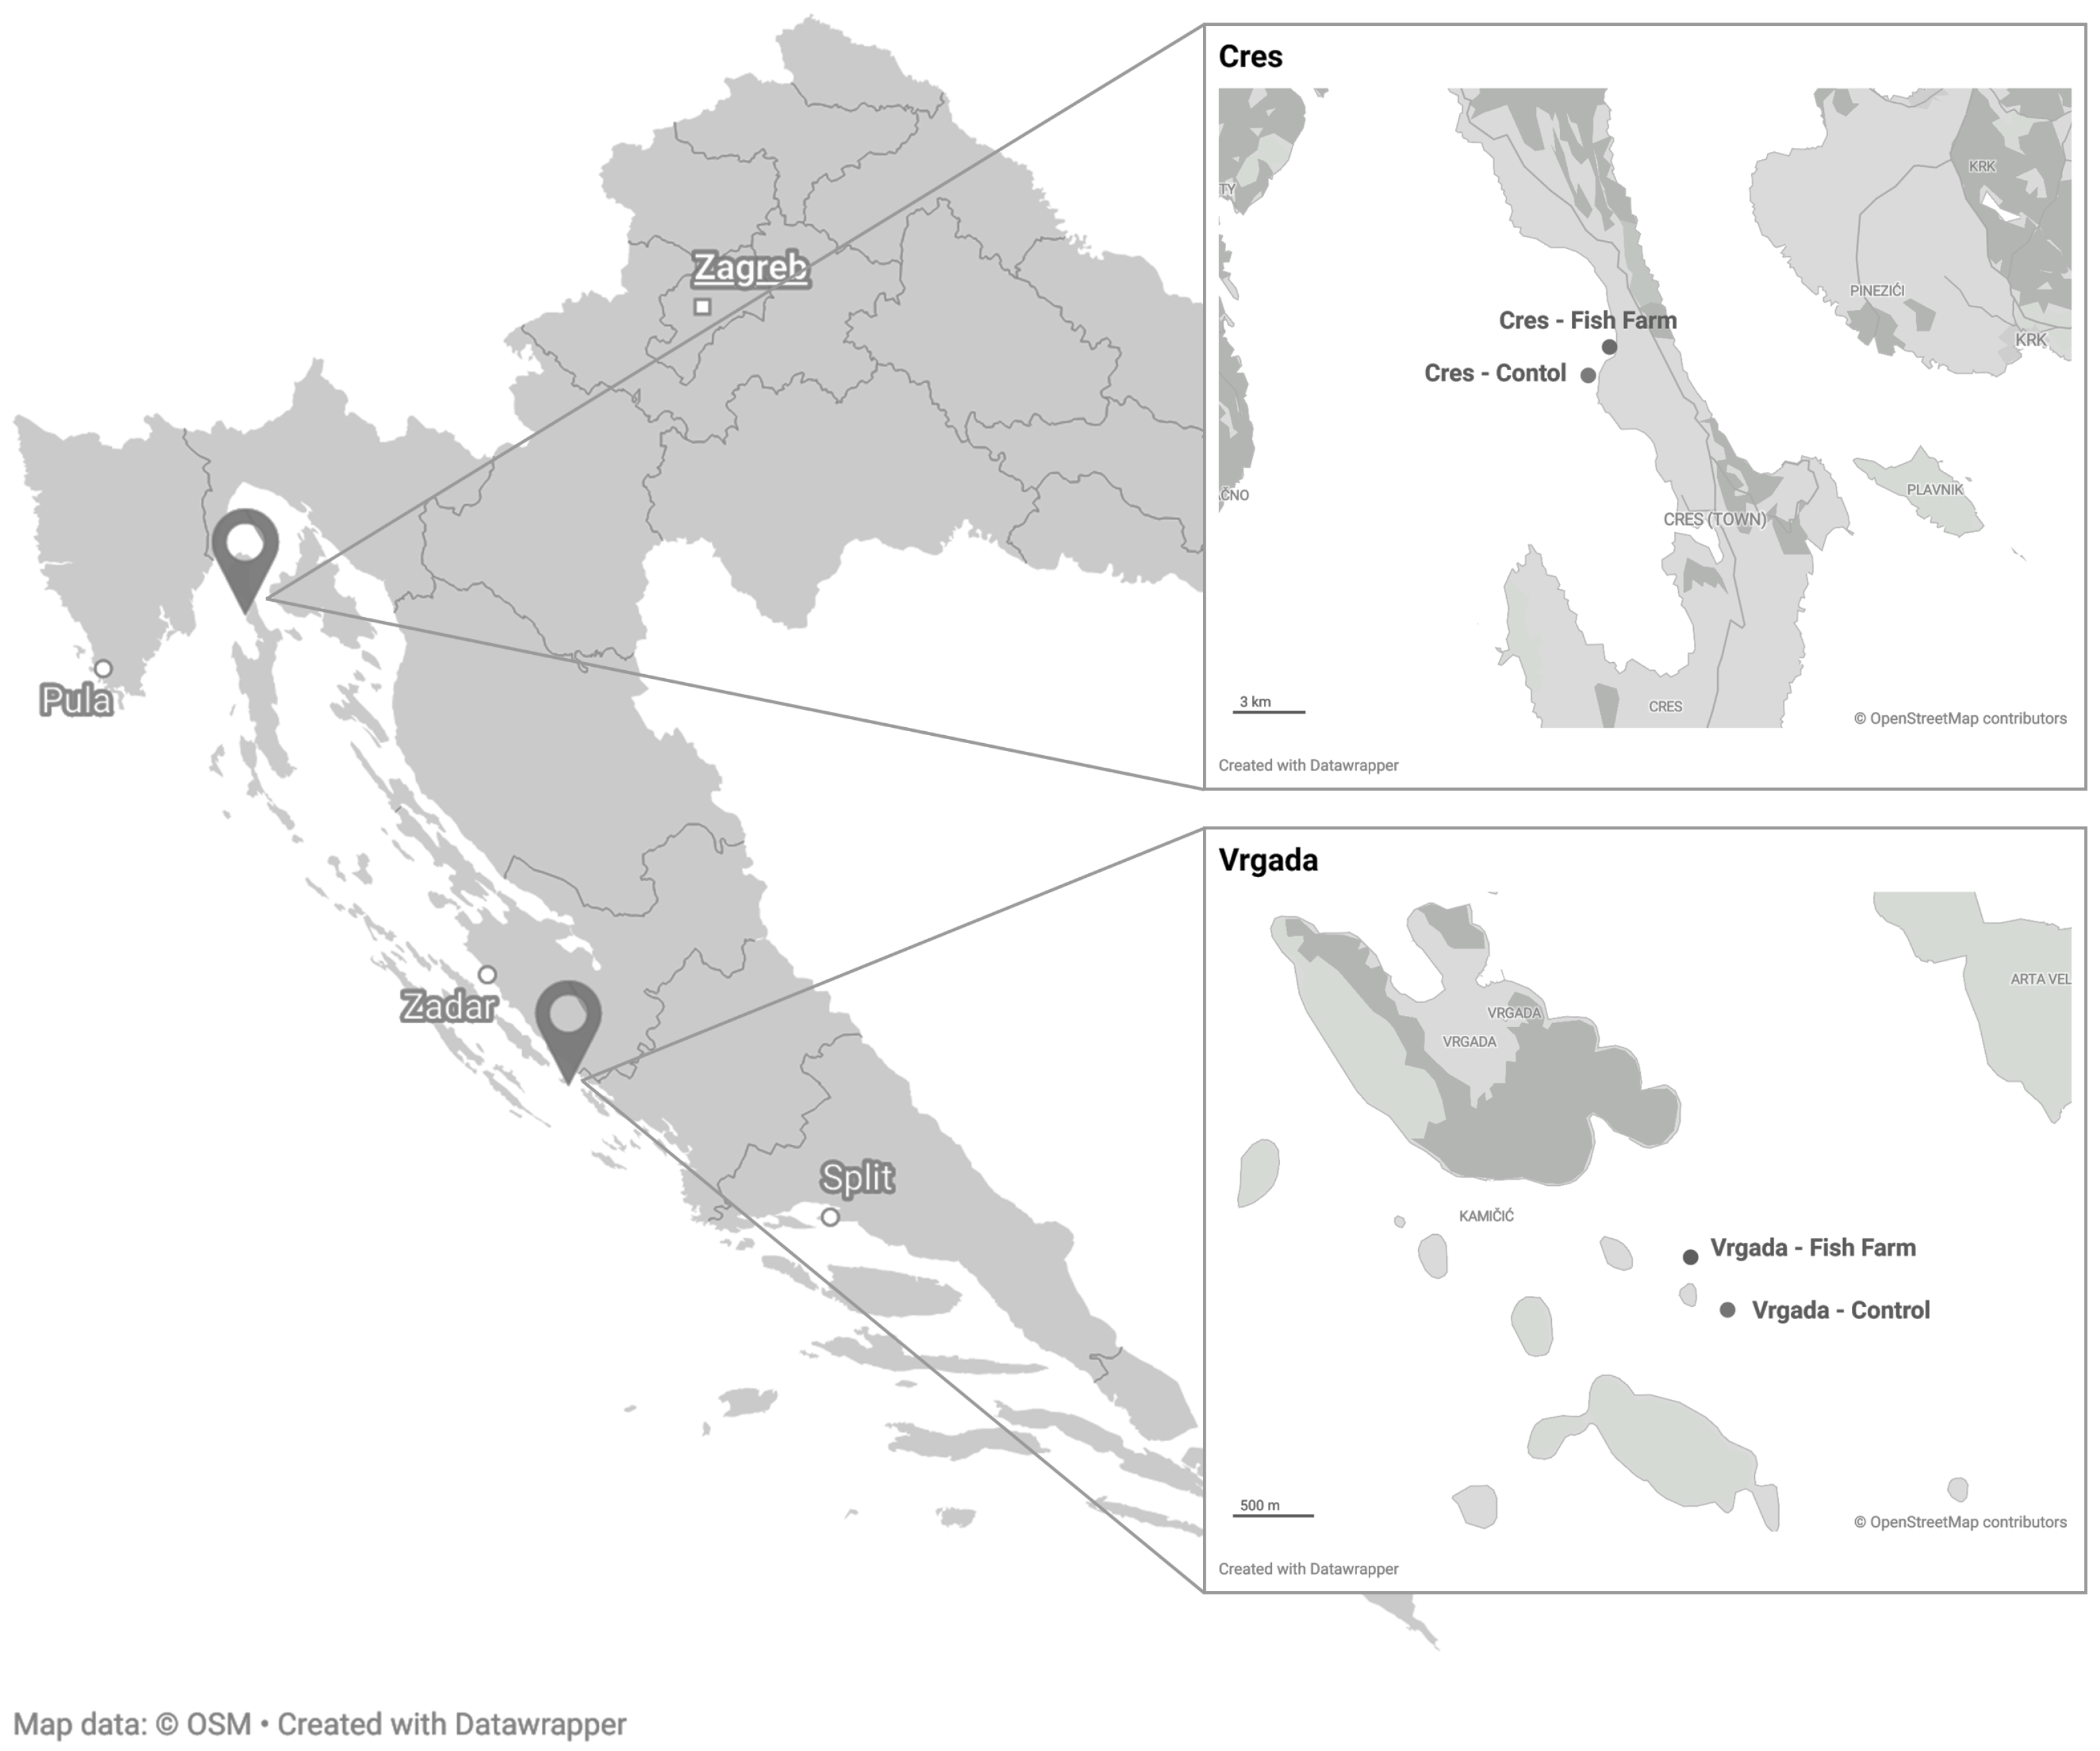
2.1. Study Area
- It spans two climate areas, Mediterranean and Submediterranean, due to strong continental influence;
- The tidal range is relatively small;
- Karstic hydrogeology results in many freshwater sources underneath the surface;
- It has specific circular currents of four water masses (Northern Adriatic water of high density, Middle Adriatic water, Southern Adriatic deep water, and Levantine intermediate water);
- The river Po is a concentrated nutrient source responsible for 1/3 (>1500 m3/s) of freshwater input [16];
- It has a heterogeneous distribution of physical, chemical, and biological factors.
2.2. Sampling Locations

2.3. Sampling Methods
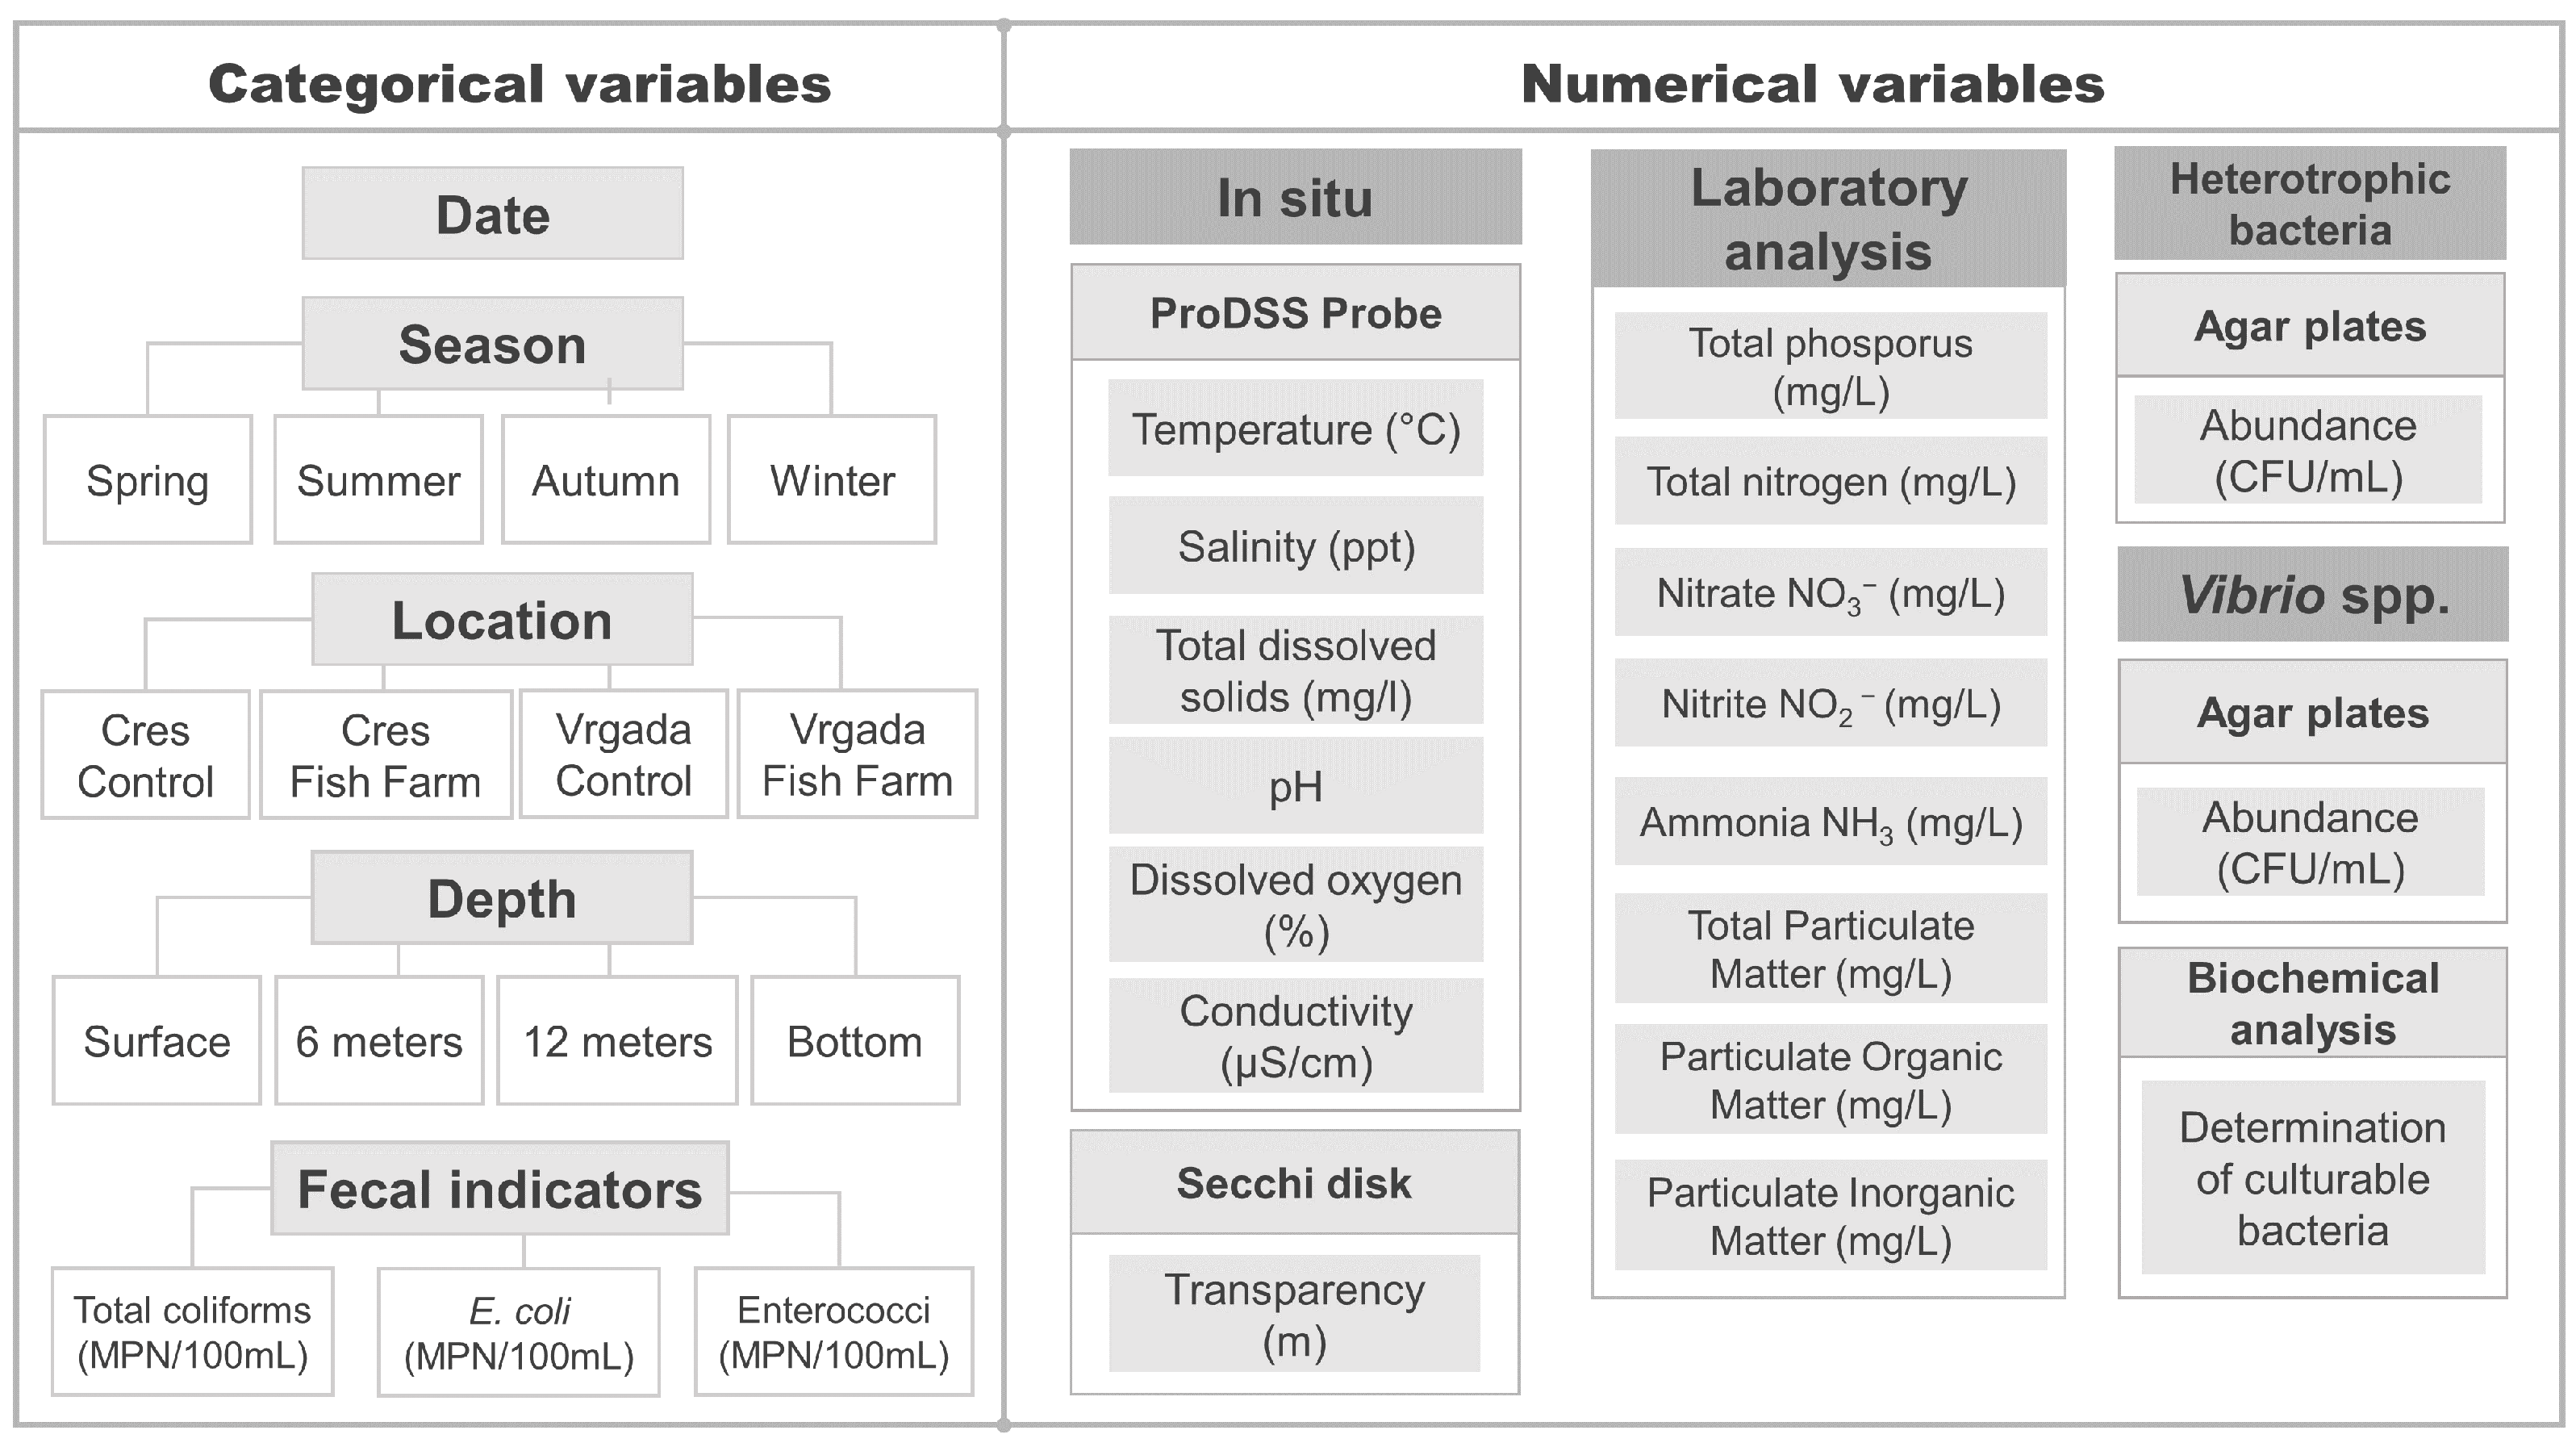
2.4. Physicochemical Analysis of Water Samples
- Nitrates ()—Hach method 8192;
- Nitrites ()—Hach method 8507;
- Ammonia ()—Hach method 10023;
- Total phosphorus (P)—Hach method LCK348.
2.5. Microbiological Analysis of Water Samples
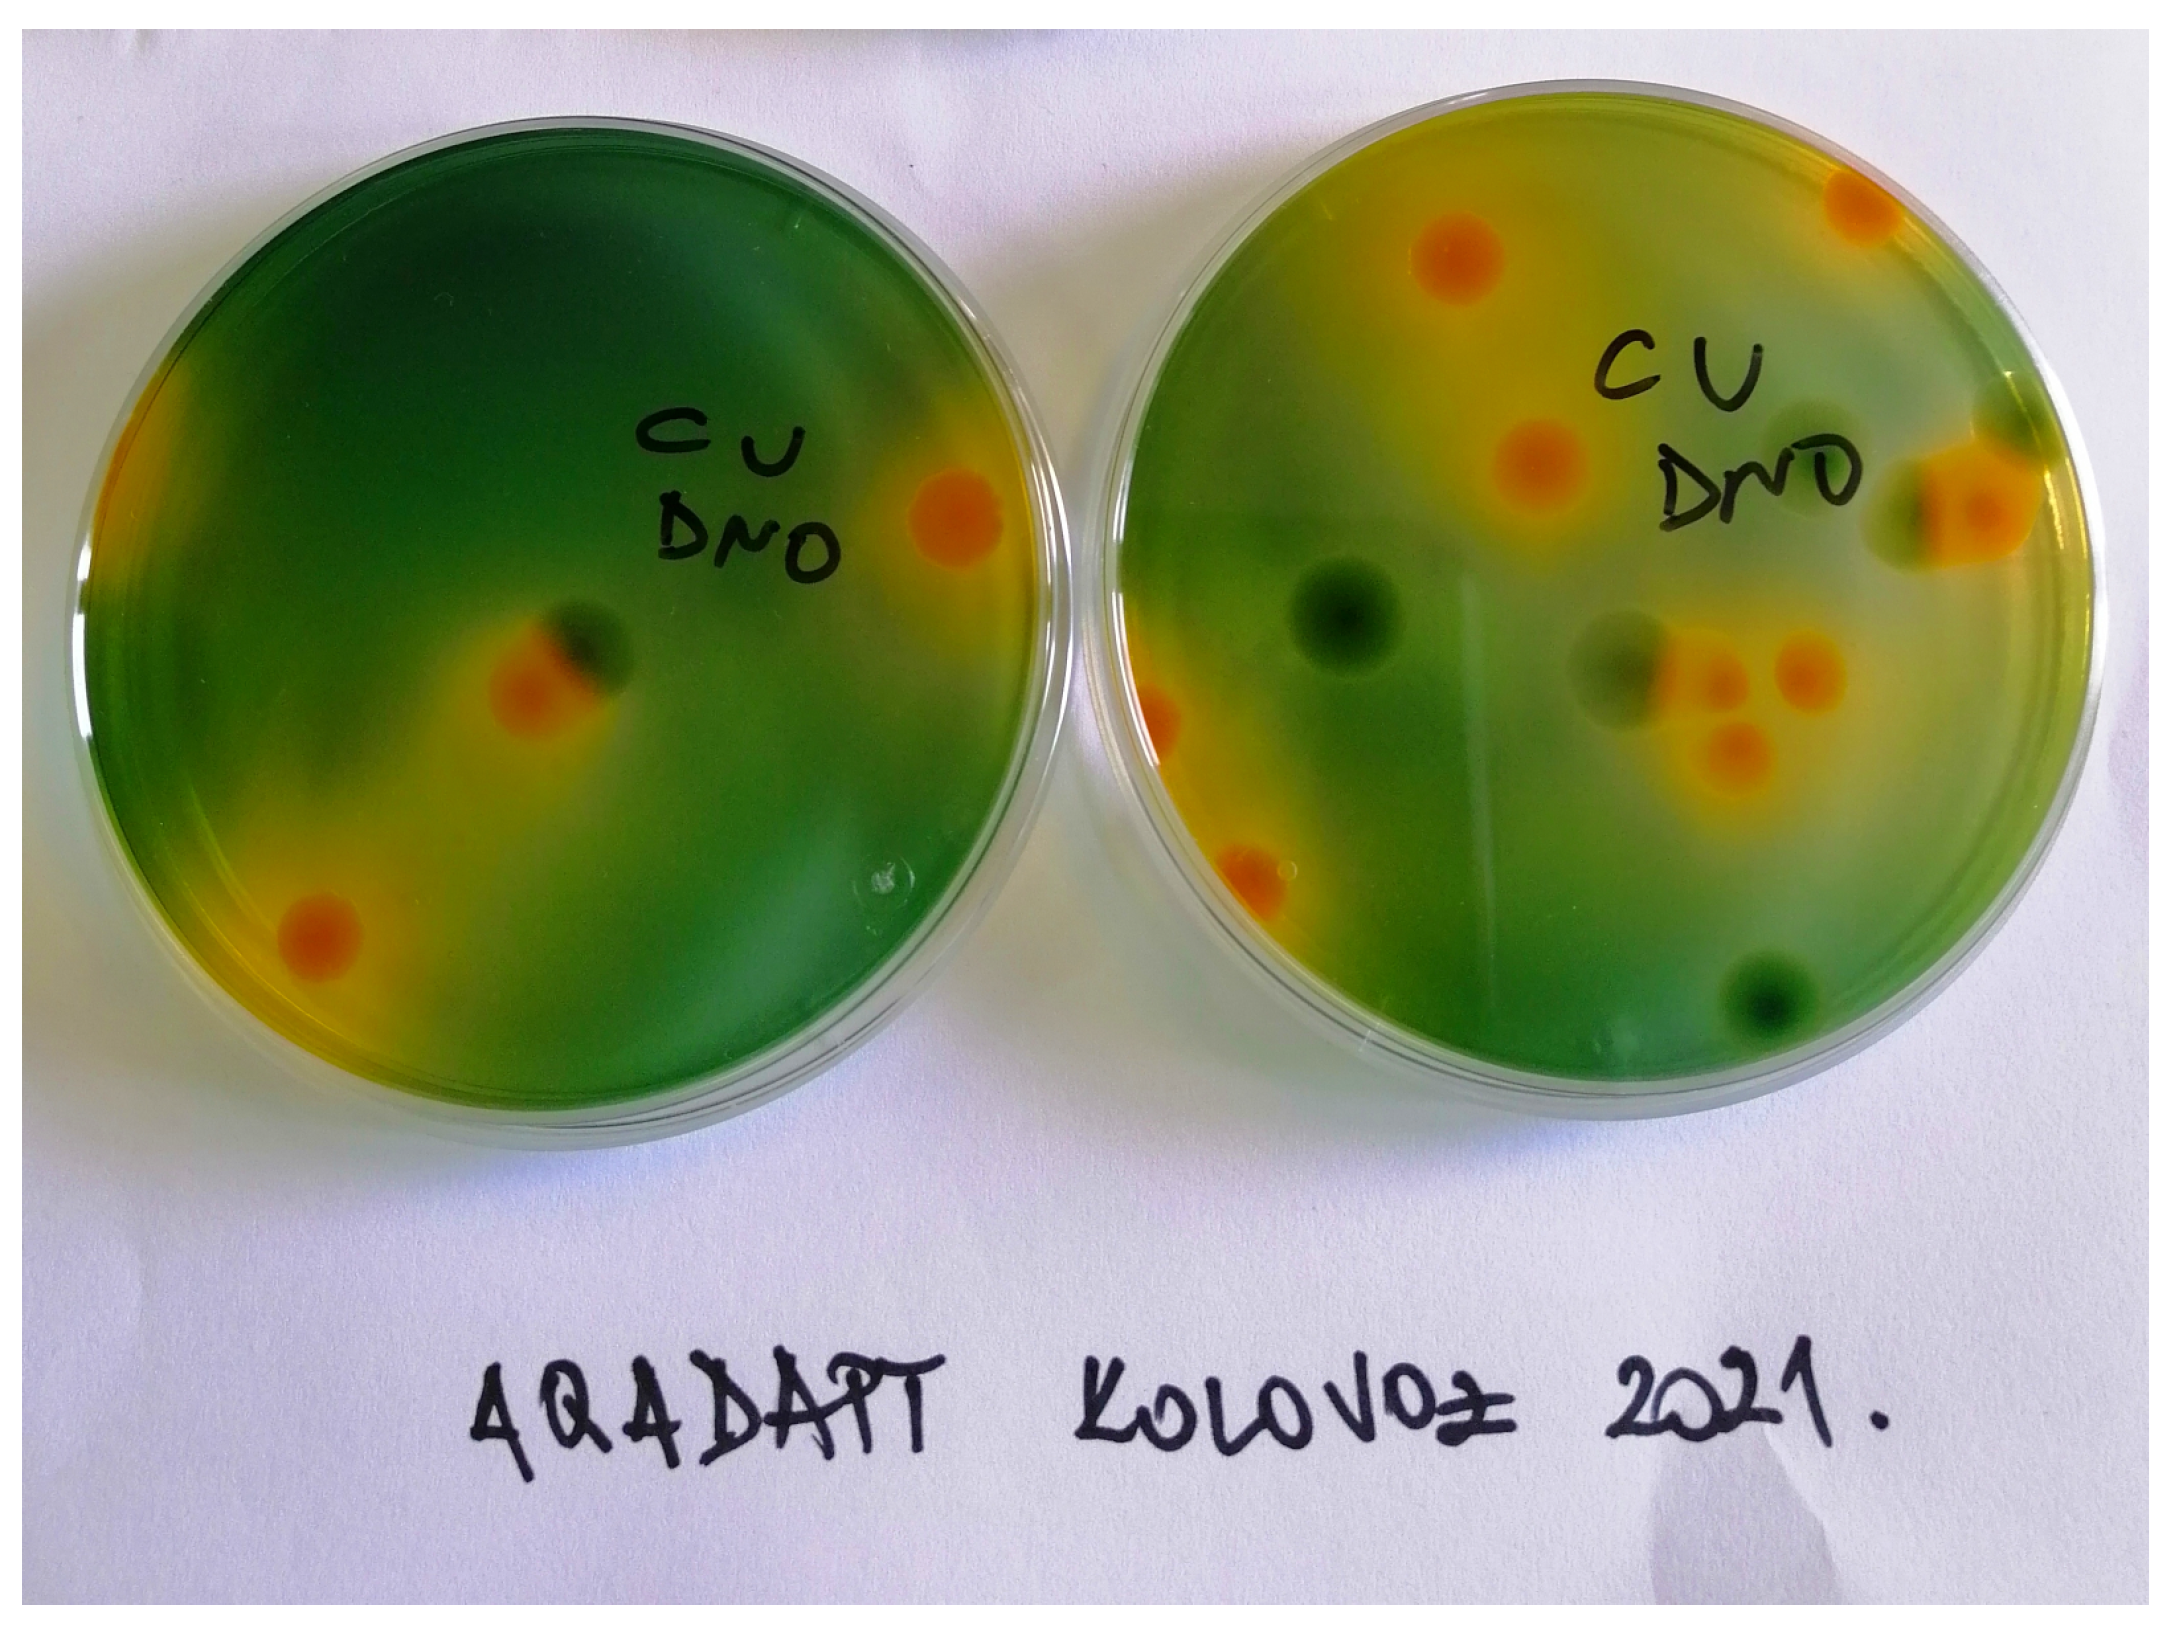
2.6. Vibrio spp. and Biochemical Analysis
3. Data Description
- Thirty-three bacterial species were identified among the isolates from the Cres—Fish Farm;
- Twenty-two bacterial species were identified among the isolates from all the sample types in the Vrgada—Fish Farm.
4. User Notes
Supplementary Materials
Author Contributions
Funding
Data Availability Statement
Acknowledgments
Conflicts of Interest
References
- FAO. The State of World Fisheries and Aquaculture 2020. Sustainability in Action; Food and Agriculture Organization of the United Nations: Rome, Italy, 2020. [Google Scholar] [CrossRef]
- Poloczanska, E.S.; Brown, C.J.; Sydeman, W.J.; Kiessling, W.; Schoeman, D.S.; Moore, P.J.; Brander, K.; Bruno, J.F.; Buckley, L.B.; Burrows, M.T.; et al. Global imprint of climate change on marine life. Nat. Clim. Change 2013, 3, 919–925. [Google Scholar] [CrossRef]
- Dore, M.H. Climate change and changes in global precipitation patterns: What do we know? Environ. Int. 2005, 31, 1167–1181. [Google Scholar] [CrossRef] [PubMed]
- Bijma, J.; Pörtner, H.O.; Yesson, C.; Rogers, A.D. Climate change and the oceans–What does the future hold? Mar. Pollut. Bull. 2013, 74, 495–505. [Google Scholar] [CrossRef]
- Meyer, F.P. Aquaculture disease and health management. J. Anim. Sci. 1991, 69, 4201–4208. [Google Scholar] [CrossRef]
- Marcogliese, D. The impact of climate change on the parasites and infectious diseases of aquatic animals. Rev. Sci. Tech. 2008, 27, 467–484. [Google Scholar] [CrossRef]
- Purgar, M.; Kapetanović, D.; Geček, S.; Marn, N.; Haberle, I.; Hackenberger, B.K.; Gavrilović, A.; Pečar Ilić, J.; Hackenberger, D.K.; Djerdj, T.; et al. Investigating the Ability of Growth Models to Predict In Situ Vibrio spp. Abundances. Microorganisms 2022, 10, 1765. [Google Scholar] [CrossRef]
- Olafsen, J.A. Interactions between fish larvae and bacteria in marine aquaculture. Aquaculture 2001, 200, 223–247. [Google Scholar] [CrossRef]
- Sampaio, A.; Silva, V.; Poeta, P.; Aonofriesei, F. Vibrio spp.: Life strategies, ecology, and risks in a changing environment. Diversity 2022, 14, 97. [Google Scholar] [CrossRef]
- Kirchman, D.L. Growth rates of microbes in the oceans. Annu. Rev. Mar. Sci. 2016, 8, 285–309. [Google Scholar] [CrossRef]
- Zhang, X.; Lin, H.; Wang, X.; Austin, B. Significance of Vibrio species in the marine organic carbon cycle—A review. Sci. China Earth Sci. 2018, 61, 1357–1368. [Google Scholar] [CrossRef]
- Kapetanović, D.; Gavrilović, A.; Purgar, M.; Hackenberger, B.K.; Kurtović, B.; Haberle, I.; Pečar Ilić, J.; Geček, S.; Hackenberger, D.K.; Djerdj, T.; et al. Physicochemical parameters and Vibrio spp. abundance in water samples gathered in the Adriatic Sea [dataset]. PANGAEA, 2022; epub ahead of print. [Google Scholar] [CrossRef]
- Ramljak, A.; Vardić Smrzlić, I.; Kapetanović, D.; Barac, F.; Kolda, A.; Perić, L.; Balenović, I.; Klanjšček, T.; Gavrilović, A. Skin Culturable Microbiota in Farmed European Seabass (Dicentrarchus labrax) in Two Aquacultures with and without Antibiotic Use. J. Mar. Sci. Eng. 2022, 10, 303. [Google Scholar] [CrossRef]
- Viličić, D. Specific oceanological characteristics of the Croatian part of the Adriatic Sea. Hrvat. Vode Časopis Vodn. Gospod. 2014, 90, 297–314. [Google Scholar]
- Russo, A.; Artegiani, A. Adriatic sea hydrography. Sci. Mar. 1996, 60, 33–43. [Google Scholar]
- Barale, V.; McClain, C.R.; Malanotte-Rizzoli, P. Space and time variability of the surface color field in the northern Adriatic Sea. J. Geophys. Res. Ocean. 1986, 91, 12957–12974. [Google Scholar] [CrossRef]
- Gačić, M.; Marullo, S.; Santoleri, R.; Bergamasco, A. Analysis of the seasonal and interannual variability of the sea surface temperature field in the Adriatic Sea from AVHRR data (1984–1992). J. Geophys. Res. Ocean. 1997, 102, 22937–22946. [Google Scholar] [CrossRef]
- Dulčić, J.; Grbec, B.; Lipej, L.; Paklar, G.B.; Supić, N.; Smirčić, A. The effect of the hemispheric climatic oscillations on the Adriatic ichthyofauna. Fresenius Environ. Bull. 2004, 13, 293–298. [Google Scholar]
- Dulčić, J.; Paklar, G.B.; Grbec, B.; Morović, M.; Matić, F.; Lipej, L. On the occurrence of ocean sunfish Mola mola and slender sunfish Ranzania laevis in the Adriatic Sea. J. Mar. Biol. Assoc. 2007, 87, 789–796. [Google Scholar] [CrossRef] [Green Version]
- Grbec, B.; Morović, M.; Paklar, G.B.; Kušpilić, G.; Matijević, S.; Matić, F.; Gladan, Ž.N. The relationship between the atmospheric variability and productivity in the Adriatic Sea area. J. Mar. Biol. Assoc. 2009, 89, 1549–1558. [Google Scholar] [CrossRef]
- Ninčević Gladan, Ž.; Marasović, I.; Grbec, B.; Skejić, S.; Bužančić, M.; Kušpilić, G.; Matijević, S.; Matić, F. Inter-decadal variability in phytoplankton community in the Middle Adriatic (Kaštela Bay) in relation to the North Atlantic Oscillation. Estuaries Coasts 2010, 33, 376–383. [Google Scholar] [CrossRef]
- Cukrov, N.; Bulat, T.; Lovrić, M.; Omanović, D. Monitoring of the Environment of the Fish Farm Orada Adriatic; Ruđer Bošković Institute: Zagreb, Croatia, 2019. [Google Scholar]
- The Decision of The Ministry of Environment and Energy of the Republic of Croatia. 2015. Available online: https://mingor.gov.hr/UserDocsImages/ARHIVA%20DOKUMENATA/ARHIVA%20—%20OPUO/2015/30042015_-_rjesenje_ministarstva_od_29_travnja_2015_godine.pdf (accessed on 14 September 2022).
- Orada Adriatic Granted ANTIBIOTIC FREE Certificate for All of Its Farms! Available online: https://royal-adriatic.com/news/orada-adriatic-granted-antibiotic-free-certificate-for-all-of-its-farms (accessed on 14 September 2022).
- The Decision of The Ministry of Construction, Spatial Planning and State Property of the Republic of Croatia. 2016. Available online: https://mmpi.gov.hr/UserDocsImages/arhiva/Prilog2-I-IzmjeneIDopuneLokacijskeDozvole.pdf (accessed on 14 September 2022).
- The Decision of Zadar County of the Republic of Croatia. 2015. Available online: https://zadarska-zupanija.hr/kolegij2015/36/13.1.pdf (accessed on 14 September 2022).
- Datawrapper. Available online: https://app.datawrapper.de/ (accessed on 16 September 2022).
- ProDSS Multiparameter Digital Water Quality Meter. Available online: https://www.ysi.com/prodss (accessed on 14 September 2022).
- Water Analysis Handbook. Available online: https://www.hach.com/wah (accessed on 19 September 2022).
- Paterson, K.J.; Schreider, M.J.; Zimmerman, K.D. Anthropogenic effects on seston quality and quantity and the growth and survival of Sydney rock oyster (Saccostrea glomerata) in two estuaries in NSW, Australia. Aquaculture 2003, 221, 407–426. [Google Scholar] [CrossRef]
- RStudio Team. RStudio: Integrated Development Environment for R; RStudio, PBC.: Boston, MA, USA, 2020. [Google Scholar]
- Wickham, H.; Averick, M.; Bryan, J.; Chang, W.; McGowan, L.D.; François, R.; Grolemund, G.; Hayes, A.; Henry, L.; Hester, J.; et al. Welcome to the tidyverse. J. Open Source Softw. 2019, 4, 1686. [Google Scholar] [CrossRef] [Green Version]
- Wickham, H. ggplot2: Elegant Graphics for Data Analysis; Springer: New York, NY, USA, 2016. [Google Scholar]
- Tenopir, C.; Allard, S.; Douglass, K.; Aydinoglu, A.U.; Wu, L.; Read, E.; Manoff, M.; Frame, M. Data sharing by scientists: Practices and perceptions. PLoS ONE 2011, 6, e21101. [Google Scholar] [CrossRef] [PubMed] [Green Version]
- Trinanes, J.; Martinez-Urtaza, J. Future scenarios of risk of Vibrio infections in a warming planet: A global mapping study. Lancet Planet. Health 2021, 5, e426–e435. [Google Scholar] [CrossRef] [PubMed]


| Sampling Site | Coordinates |
|---|---|
| Cres—Control | 45.013389 N 14.346833 E |
| Cres—Fish Farm | 45.024167 N 14.357972 E |
| Vrgada—Control | 43.838741 N 15.521110 E |
| Vrgada—Fish Farm | 43.842757 N 15.517415 E |
| Numerical Variable | Min | 1st Qu. | Median | Mean | 3rd Qu. | Max | N | NA’s |
|---|---|---|---|---|---|---|---|---|
| Temperature (°C) | 11.10 | 14.03 | 20.10 | 18.71 | 22.62 | 27.50 | 108 | 4 |
| Salinity (ppt) | 33.50 | 38.12 | 38.48 | 38.26 | 38.89 | 39.34 | 108 | 4 |
| TDS (mg/L) | 21,610.00 | 37,249.00 | 37,589.00 | 36,115.00 | 37,904.00 | 38,368.00 | 108 | 4 |
| pH | 8.100 | 8.265 | 8.370 | 8.372 | 8.492 | 8.610 | 108 | 4 |
| (%) | 63.40 | 95.67 | 99.70 | 98.49 | 102.17 | 115.40 | 108 | 4 |
| Conductivity (μS/cm) | 51,162.00 | 57,097.00 | 57,771.00 | 57,335.00 | 58,201.00 | 58,795.00 | 108 | 4 |
| Transparency (m) | 7.00 | 10.00 | 16.00 | 15.54 | 20.00 | 28.00 | 108 | 8 |
| N (mg/L) | 0.00 | 0.20 | 0.70 | 0.77 | 1.10 | 4.30 | 108 | 8 |
| (mg/L) | 0.00 | 0.01 | 0.03 | 0.04 | 0.04 | 0.60 | 108 | 12 |
| (mg/L) | 0.00 | 0.01 | 0.02 | 0.02 | 0.03 | 0.08 | 108 | 28 |
| (mg/L) | 0.001 | 0.002 | 0.003 | 0.004 | 0.005 | 0.012 | 108 | 28 |
| P (mg/L) | 0.002 | 0.013 | 0.038 | 0.037 | 0.061 | 0.073 | 108 | 8 |
| TPM (mg/L) | 1.20 | 2.40 | 4.10 | 4.82 | 6.65 | 15.90 | 108 | 24 |
| POM (mg/L) | 0.20 | 1.00 | 1.75 | 2.59 | 3.92 | 9.00 | 108 | 24 |
| PIM (mg/L) | 0.20 | 1.10 | 1.65 | 2.23 | 2.22 | 13.10 | 108 | 24 |
| Heterotrophic bacteria (CFU/mL) | 50.00 | 772.50 | 2600.0 | 7415.30 | 10,200.00 | 39,800.00 | 108 | 0 |
| Vibrio abundance (CFU/mL) | 0.00 | 14.00 | 30.00 | 101.50 | 104.20 | 1190.00 | 108 | 0 |
| Numerical variable | Min | 1st Qu. | Median | Mean | 3rd Qu. | Max | N | NA’s |
|---|---|---|---|---|---|---|---|---|
| Cres—Control | ||||||||
| Temperature (°C) | 11.10 | 12.40 | 17.70 | 17.35 | 20.58 | 25.80 | 24 | 0 |
| Salinity (ppt) | 37.70 | 38.39 | 38.59 | 38.55 | 38.83 | 39.02 | 24 | 0 |
| TDS (mg/L) | 36,963.00 | 37,432.00 | 37,595.00 | 37,599.00 | 37,819.00 | 37,993.00 | 24 | 0 |
| pH | 8.100 | 8.338 | 8.415 | 8.399 | 8.513 | 8.580 | 24 | 0 |
| (%) | 82.00 | 100.03 | 101.25 | 101.98 | 105.48 | 111.70 | 24 | 0 |
| Conductivity (μS/cm) | 55,740.00 | 57,676.00 | 58,091.00 | 57,838.00 | 58,192.00 | 58,462.00 | 24 | 0 |
| Transparency (m) | 8.50 | 12.00 | 17.50 | 17.75 | 23.00 | 28.00 | 24 | 0 |
| N (mg/L) | 0.000 | 0.100 | 0.200 | 0.263 | 0.300 | 1.000 | 24 | 0 |
| (mg/L) | 0.000 | 0.010 | 0.020 | 0.037 | 0.040 | 0.230 | 24 | 0 |
| (mg/L) | 0.000 | 0.010 | 0.010 | 0.010 | 0.010 | 0.020 | 24 | 4 |
| (mg/L) | 0.001 | 0.001 | 0.003 | 0.003 | 0.004 | 0.011 | 24 | 4 |
| P (mg/L) | 0.003 | 0.009 | 0.031 | 0.032 | 0.059 | 0.066 | 24 | 0 |
| TPM (mg/L) | 1.20 | 3.03 | 4.55 | 4.86 | 6.70 | 11.40 | 24 | 4 |
| POM (mg/L) | 0.20 | 1.08 | 1.85 | 2.83 | 4.97 | 6.80 | 24 | 4 |
| PIM (mg/L) | 0.50 | 0.98 | 1.20 | 2.03 | 2.13 | 9.10 | 24 | 4 |
| Heterotrophic bacteria (CFU/mL) | 300.00 | 1525.00 | 4750.00 | 9735.42 | 11,862.50 | 39,200.00 | 24 | 0 |
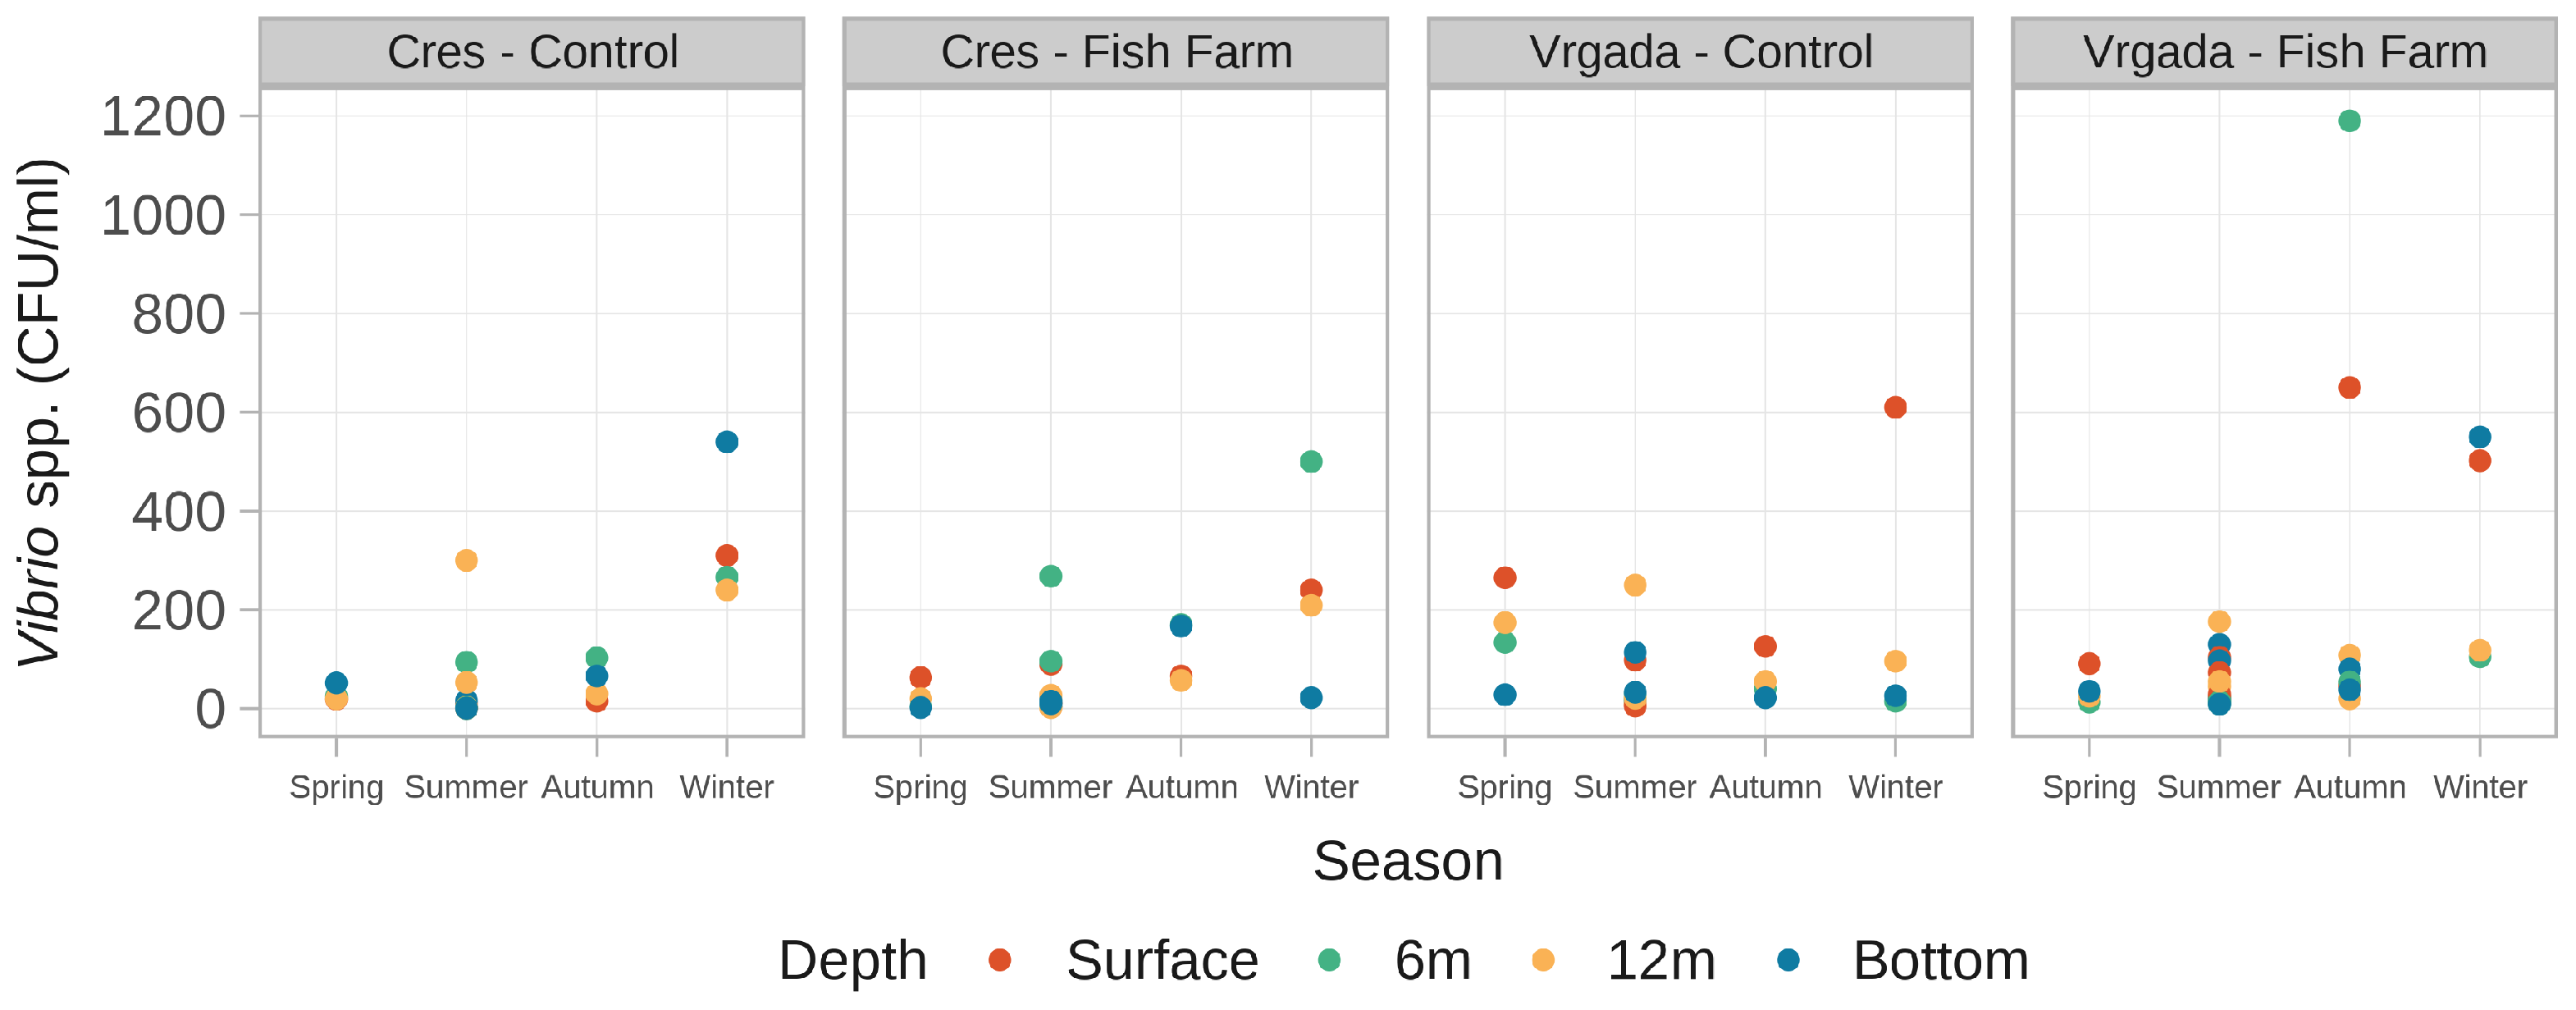
| Vibrio abundance (CFU/mL) | 0.00 | 2.75 | 22.50 | 90.33 | 96.25 | 540.00 | 24 | 0 |
| Cres–Fish Farm | ||||||||
| Temperature (°C) | 11.20 | 12.20 | 17.75 | 17.37 | 21.25 | 27.50 | 28 | 4 |
| Salinity (ppt) | 37.84 | 38.36 | 38.49 | 38.53 | 38.81 | 39.07 | 28 | 4 |
| TDS (mg/L) | 37,097.00 | 37,367.00 | 37,711.00 | 37,634.00 | 37,859.00 | 38,035.00 | 28 | 4 |
| pH | 8.100 | 8.365 | 8.400 | 8.398 | 8.510 | 8.610 | 28 | 4 |
| (%) | 74.60 | 100.18 | 101.05 | 101.08 | 103.48 | 111.10 | 28 | 4 |
| Conductivity (μS/cm) | 57,090.00 | 57,763.00 | 58,087.00 | 58,002.00 | 58,344.00 | 58,510.00 | 28 | 4 |
| Transparency (m) | 8.50 | 10.00 | 17.50 | 17.92 | 26.00 | 28.00 | 28 | 4 |
| N (mg/L) | 0.300 | 0.600 | 1.100 | 1.342 | 1.450 | 4.300 | 28 | 4 |
| (mg/L) | 0.000 | 0.010 | 0.030 | 0.065 | 0.040 | 0.600 | 28 | 4 |
| (mg/L) | 0.010 | 0.020 | 0.030 | 0.031 | 0.040 | 0.080 | 28 | 8 |
| (mg/L) | 0.001 | 0.003 | 0.004 | 0.004 | 0.006 | 0.009 | 28 | 8 |
| P (mg/L) | 0.002 | 0.013 | 0.039 | 0.037 | 0.058 | 0.068 | 28 | 4 |
| TPM (mg/L) | 1.70 | 3.08 | 5.80 | 5.78 | 7.03 | 15.90 | 28 | 8 |
| POM (mg/L) | 0.60 | 1.40 | 2.90 | 3.31 | 4.95 | 9.00 | 28 | 8 |
| PIM (mg/L) | 0.20 | 1.18 | 1.70 | 2.47 | 2.05 | 13.10 | 28 | 8 |
| Heterotrophic bacteria (CFU/mL) | 50.00 | 521.25 | 3375.00 | 7909.46 | 11,425.00 | 29,000.00 | 28 | 0 |
| Vibrio abundance (CFU/mL) | 2.00 | 10.00 | 18.50 | 75.68 | 91.50 | 500.00 | 28 | 0 |
| Numerical variable | Min | 1st Qu. | Median | Mean | 3rd Qu. | Max | N | NA’s |
|---|---|---|---|---|---|---|---|---|
| Vrgada—Control | ||||||||
| Temperature (°C) | 12.10 | 14.50 | 20.85 | 19.29 | 23.13 | 25.30 | 24 | 0 |
| Salinity (ppt) | 37.20 | 38.11 | 38.54 | 38.44 | 39.06 | 39.34 | 24 | 0 |
| TDS (mg/L) | 28,000.00 | 37,298.00 | 37,673.00 | 36,145.00 | 38,004.00 | 38,368.00 | 24 | 0 |
| pH | 8.120 | 8.315 | 8.370 | 8.395 | 8.495 | 8.610 | 24 | 0 |
| (%) | 84.00 | 95.38 | 99.00 | 97.44 | 99.98 | 109.40 | 24 | 0 |
| Conductivity (μS/cm) | 56,113.00 | 57,074.00 | 57,478.00 | 57,484.00 | 58,059.00 | 58,795.00 | 24 | 0 |
| Transparency (m) | 7.00 | 8.00 | 12.00 | 12.92 | 18.50 | 20.00 | 24 | 0 |
| N (mg/L) | 0.000 | 0.000 | 0.250 | 0.329 | 0.525 | 0.900 | 24 | 0 |
| (mg/L) | 0.000 | 0.010 | 0.020 | 0.029 | 0.040 | 0.100 | 24 | 0 |
| (mg/L) | 0.000 | 0.007 | 0.010 | 0.012 | 0.020 | 0.030 | 24 | 4 |
| (mg/L) | 0.001 | 0.002 | 0.003 | 0.003 | 0.004 | 0.007 | 24 | 4 |
| P (mg/L) | 0.006 | 0.012 | 0.041 | 0.039 | 0.062 | 0.073 | 24 | 0 |
| TPM (mg/L) | 1.60 | 2.60 | 5.65 | 5.04 | 6.90 | 9.40 | 24 | 4 |
| POM (mg/L) | 0.40 | 0.88 | 1.80 | 2.62 | 3.93 | 7.10 | 24 | 4 |
| PIM (mg/L) | 0.80 | 1.18 | 1.70 | 2.42 | 2.45 | 7.3 | 24 | 4 |
| Heterotrophic bacteria (CFU/mL) | 250.00 | 1537.50 | 2600.0 | 5302.08 | 6550.00 | 28,900.00 | 24 | 0 |
| Vibrio abundance (CFU/mL) | 5.00 | 20.00 | 31.50 | 92.21 | 117.00 | 610.00 | 24 | 0 |
| Vrgada—Fish Farm | ||||||||
| Temperature (°C) | 12.30 | 16.85 | 21.40 | 20.29 | 23.50 | 25.70 | 32 | 0 |
| Salinity (ppt) | 33.50 | 37.20 | 38.20 | 37.71 | 39.01 | 39.17 | 32 | 0 |
| TDS (mg/L) | 21,610.00 | 28,100.00 | 37,313.00 | 33,841.00 | 37,951.00 | 38,070.00 | 32 | 0 |
| pH | 8.120 | 8.160 | 8.315 | 8.315 | 8.425 | 8.600 | 32 | 0 |
| (%) | 63.40 | 92.68 | 96.15 | 94.71 | 99.20 | 115.40 | 32 | 0 |
| Conductivity (μS/cm) | 51,162.00 | 56,200.00 | 56,911.00 | 56,346.00 | 57,833.00 | 58,569.00 | 32 | 0 |
| Transparency (m) | 7.00 | 8.00 | 14.00 | 13.86 | 20.00 | 20.00 | 32 | 0 |
| N (mg/L) | 0.300 | 0.800 | 1.000 | 1.095 | 1.250 | 2.400 | 32 | 4 |
| (mg/L) | 0.000 | 0.020 | 0.035 | 0.033 | 0.050 | 0.060 | 32 | 8 |
| (mg/L) | 0.020 | 0.030 | 0.035 | 0.037 | 0.040 | 0.060 | 32 | 12 |
| (mg/L) | 0.001 | 0.003 | 0.004 | 0.005 | 0.006 | 0.012 | 32 | 12 |
| P (mg/L) | 0.007 | 0.014 | 0.037 | 0.039 | 0.065 | 0.070 | 32 | 4 |
| TPM (mg/L) | 1.20 | 2.40 | 4.10 | 4.82 | 6.65 | 15.90 | 32 | 8 |
| POM (mg/L) | 0.20 | 1.00 | 1.75 | 2.59 | 3.92 | 9.00 | 32 | 8 |
| PIM (mg/L) | 0.20 | 1.10 | 1.65 | 2.23 | 2.22 | 13.10 | 32 | 8 |
| Heterotrophic bacteria (CFU/mL) | 200.00 | 575.00 | 1200.00 | 6827.81 | 6200.00 | 39,800.00 | 32 | 0 |
| Vibrio abundance (CFU/mL) | 9.00 | 21.50 | 50.00 | 139.38 | 105.75 | 1190.00 | 32 | 0 |
Disclaimer/Publisher’s Note: The statements, opinions and data contained in all publications are solely those of the individual author(s) and contributor(s) and not of MDPI and/or the editor(s). MDPI and/or the editor(s) disclaim responsibility for any injury to people or property resulting from any ideas, methods, instructions or products referred to in the content. |
© 2023 by the authors. Licensee MDPI, Basel, Switzerland. This article is an open access article distributed under the terms and conditions of the Creative Commons Attribution (CC BY) license (https://creativecommons.org/licenses/by/4.0/).
Share and Cite
Purgar, M.; Kapetanović, D.; Gavrilović, A.; Hackenberger, B.K.; Kurtović, B.; Haberle, I.; Pečar Ilić, J.; Geček, S.; Hackenberger, D.K.; Djerdj, T.; et al. Dataset AqADAPT: Physicochemical Parameters, Vibrio Abundance, and Species Determination in Water Columns of Two Adriatic Sea Aquaculture Sites. Data 2023, 8, 55. https://doi.org/10.3390/data8030055
Purgar M, Kapetanović D, Gavrilović A, Hackenberger BK, Kurtović B, Haberle I, Pečar Ilić J, Geček S, Hackenberger DK, Djerdj T, et al. Dataset AqADAPT: Physicochemical Parameters, Vibrio Abundance, and Species Determination in Water Columns of Two Adriatic Sea Aquaculture Sites. Data. 2023; 8(3):55. https://doi.org/10.3390/data8030055
Chicago/Turabian StylePurgar, Marija, Damir Kapetanović, Ana Gavrilović, Branimir K. Hackenberger, Božidar Kurtović, Ines Haberle, Jadranka Pečar Ilić, Sunčana Geček, Domagoj K. Hackenberger, Tamara Djerdj, and et al. 2023. "Dataset AqADAPT: Physicochemical Parameters, Vibrio Abundance, and Species Determination in Water Columns of Two Adriatic Sea Aquaculture Sites" Data 8, no. 3: 55. https://doi.org/10.3390/data8030055