Article

Large-Scale and Online Retailer Assortment: The Case of Plant-Based Beverages as Alternatives to Cow’s Milk

by
Giulia Mastromonaco
1,
Valentina Maria Merlino
2,*,
Stefano Massaglia
2,
Cristiana Peano
2,
Antonina Sparacino
2,
Chiara Caltagirone
2,
Danielle Borra
2 and
Francesco Sottile
1
1
Department of Architecture, University of Palermo, Viale delle Scienze, Ed. 14, 90128 Palermo, Italy
2
Department of Agricultural, Forestry and Food Sciences, School of Agriculture and Veterinary Medicine, University of Turin, 10095 Grugliasco, Italy
*
Author to whom correspondence should be addressed.
Beverages 2023, 9(2), 40; https://doi.org/10.3390/beverages9020040
Submission received: 13 February 2023 / Revised: 6 April 2023 / Accepted: 11 April 2023 / Published: 1 May 2023

Abstract

:
This research analysed the size and depth of assortment and the marketing strategies of communications around plant-based beverages (PBBs) on the Italian market. Sales of PBBs have increased over the last year due to their use as a substitute for cow’s milk and also thanks to their popularity in online distribution. This study compares the characteristics of the PBB assortment sold across 65 large-scale retail stores and on 74 websites. The comparison was made considering 15 product categories defined by main ingredient, packaging type, specialty, and claims found on labels. An ordered logit regression analysis was performed to understand how key product features positively or negatively influence the selling price. The results showed that online sales focus on describing plant-based beverages with characteristics that are closer to new consumer preferences (with labels such as “free from” products, “naturalness” of the product, and “health” characteristics). In both distribution channels, there were few products with packaging information related to nutritional characteristics, health benefits, and environmental sustainability, in contrast to the needs expressed by baby food purchasers. Additionally, the price analysis showed unexpected results: in fact, some products for which, according to the literature, consumers would be willing to pay a premium price, instead showed a lower retail price than the average price. These results could represent a concrete tool to improve the efficiency of promotional campaigns and communication strategies for baby food, optimising communication according to consumer needs.

1. Introduction

The increased consumption of plant-based beverages (PBBs) as alternatives to cow’s milk has been a trend in all international markets over the last decade.
The consumption of cow’s milk has ancient origins: it has long been considered a staple due to its nutritional characteristics, its impact on child and adolescent growth, and its role as a comfort beverage for the adult population.
However, in recent years, there has been a decline in the global consumption of cow’s milk. The rise of lactose allergies and intolerances, more attentive focus on calorie consumption, a desire to reduce saturated fats in diets, and a greater regard for environmental and animal welfare issues have driven consumers toward plant-based substitutes [1,2]. According to Markets and Markets, in 2022, the global market for dairy alternatives recorded USD 23.7 million in sales, which is estimated to reach USD 44.8 million by 2027 [3]. As for the PBB segment, its size on the global market recorded USD 24.4 billion in sales in 2021, with a projected compound annual growth rate (CAGR) of 12.7% between 2022 and 2030 [4,5]. The highest relative growth has been recorded in western countries, while southeast Asia (APAC) suffered a significant decrease in sales of dairy alternative beverages during 2020 and has not returned to pre-pandemic levels [4]. Italy follows the global positive trend in this product category: in 2020, the Italian consumption of plant-based beverages accounted for over 150 million litres per year, with an increase of 8.2% in volume and 7.5% in value, reaching 280 million in 2020 [6].
In recent years, food sources of plant origin (cereals and legumes) have been defined as foods with functional and nutraceutical properties, due to the presence (either added or naturally occurring) of minerals, vitamins, and antioxidants with beneficial health effects [7,8]. The success of functional foods has been positively influenced by increasing globalization and urbanization, which has pushed consumers towards new food trends characterized by the search for products with healthy characteristics and functionalities which align with modern lifestyles [1]. In recent years, consumer needs towards food have changed as people seek higher health benefits. Therefore, food becomes not only necessary to satisfy hunger and provide essential nutrients, but also to improve physical and mental well-being and to provide benefits to the body [9]. In order to meet consumer needs and to be successful in an increasingly competitive market, PBB producers use consumer communication marketing strategies which rely on information provided on product packaging, and which describe the characteristics of alternative beverages in relation to cow’s milk. In the last five years, the number of claims adopted on the labels of this category of products has increased by 50% [2]. According to recent studies, the most popular claims for plant-based beverages are ‘vegan’ and ‘lactose-free’, followed by ‘no added sugar’ and ‘source of calcium.’ Another category of information often used on these product labels is related to health benefit claims. In particular, the most frequent claims for this category concern the health effects of calcium and vitamin D for bones and that of vitamins B2 and B3 for reducing fatigue and tiredness [10,11]. Communication through label information is key to attracting consumers’ attention during their in-store purchases. The increase in demand for PBBs has led to an expansion of the market within large retail distribution with an increase in product types compared to traditional soy-based beverages. In Italy, soy-based products alone account for 40% of the market volume; however, there is a major increase in sales for rice-, almond-, coconut-, and oat-based beverages. According to data from IRI Italy referring to 2020, more than 124 million litres of plant-based beverages were sold in large retail chains; 55% of this was sold at supermarkets, 26% at discount stores, and 18% at hypermarkets. In 2021, compared with the previous year, the volume of sales in discount stores increased by 31%, while that at hypermarkets, supermarkets, and convenience stores increased by 12% [12,13]. Similarly, in Italy, sales of PBBs have increased by 33% in all global retail in the past three years. Specifically in 2021, these sales increased by 4%, while those of animal milk decreased by 2% [14,15]. In addition to these conventional retail channels, PBBs have also grown in specialty stores, such as organic stores, in recent years [15]. With increasing consumer demand and limited space within physical stores, online sales channels represent an important opportunity for plant-based beverage marketing [16]. The growth of e-commerce is one of the most significant phenomena in the international economy in recent years. Digitization and the spread of increasingly advanced digital tools have allowed consumers to be able to purchase what they need without going to physical stores and to choose from wide ranges of items [17,18]. In this context, the COVID-19 pandemic and prolonged lockdowns have brought many consumers closer to online shopping, with changes in their consumption habits [19]. As a result, e-commerce today continues to grow, even if at a slower pace than predicted. In particular, according to the Coop 2020 Report, 67% of digital spending in Italy was occupied by food and beverages. In 2020, in order to avoid assemblages and to make purchasing choices with more time at their disposal, consumers used large-scale retailers’ sites in 73% of the cases, those of major manufacturers in 32%, and food and beverage-specific platforms or apps in 13% [20]. The factors influencing the “new” users of online channels for purchasing food products are the nutritional characteristics indicated on the label, the naturalness of the product, and environmental sustainability. In addition, the quality of information, the system, and e-commerce platform have also had a significant impact on purchasing choices [21].

Definition of Research Aims

Changes in consumer lifestyles and purchasing choices influence the marketing strategies adopted by different stakeholders of the plant-based beverage supply chain in order to be more competitive in an increasingly fragmented market, both in product types and number of brands and distributors. Product positioning in stores and on e-commerce sites, along with product portfolio characteristics, is essential for efficient marketing strategies to meet the demands and needs of target consumers. Retailers need to adapt the planning and characteristics of their product portfolio to the preferences of local consumers and to find the right compromise between the size/variety, depth, and service [22]. In addition, the claims for communication policy depends on the type of product, the distribution channel, and the consumer target. In particular, in the case of plant-based beverages, the claims adopted widely refer to the nutritional characteristics of the product and the origin of the raw material, in terms of certification of production and place of cultivation [23]. This paper proposes an empirical research to compare the assortment size (Asize) and depth (Adepth) [22,24,25] of different PBB categories, considering different formats and chains of the LRd and e-commerce sites of the main national manufacturers of this product category, considering leading brands, private labels, and smaller manufacturers. The analysis was performed comparing the assortment composition of PBBs in the selected stores of two metropolitan cities in the north and south of Italy (Turin and Palermo). To achieve the research objectives, different product categories were defined according to the following product variables: raw materials characterizing the product, origin, brand, label claims, and price. The frequencies of these variables were analysed and the relationships between them were visualized through the use of contingency tables [26,27]. Finally, the assortment composition of PBBs in the selected stores of the two considered areas was compared with that of the e-commerce channels of the manufacturers under consideration. The metropolitan area of Turin was chosen to conduct this analysis because it represents the Italian location where the population is most likely to purchase and consume plant-based beverages [28]; the province of Palermo was chosen because the “made in Italy” almond beverage is mainly produced in southern Italy and originates in Sicily, an area with a significant almond cultivation [29]. Large retail is confirmed as the main channel for the sale of food products, while e-commerce, with its continuous growth, represents an important opportunity for PBBs [16,30]. These different types of sales channels were considered because the plant-based beverage market is constantly evolving and consumers are increasingly expressing needs related to the types of products they find for sale. In addition, this analysis provides insight into whether the product characteristics stated on the label meet consumer preferences regarding nutritional, health, and environmental sustainability characteristics [9].
Unlike other studies in the literature that have analysed the nutritional characteristics on the PBB label and compared the energy and nutritional value of these products with those of cow’s milk [11,31], this research proposes an evaluation of the variety and depth of a plant-based beverages portfolio [25,32,33] in two different sales channels in order to explore the key factors that distinguish the modelling of assortment planning (brand, type, packaging and price) and marketing strategies (claims’ variety).

2. Materials and Methods
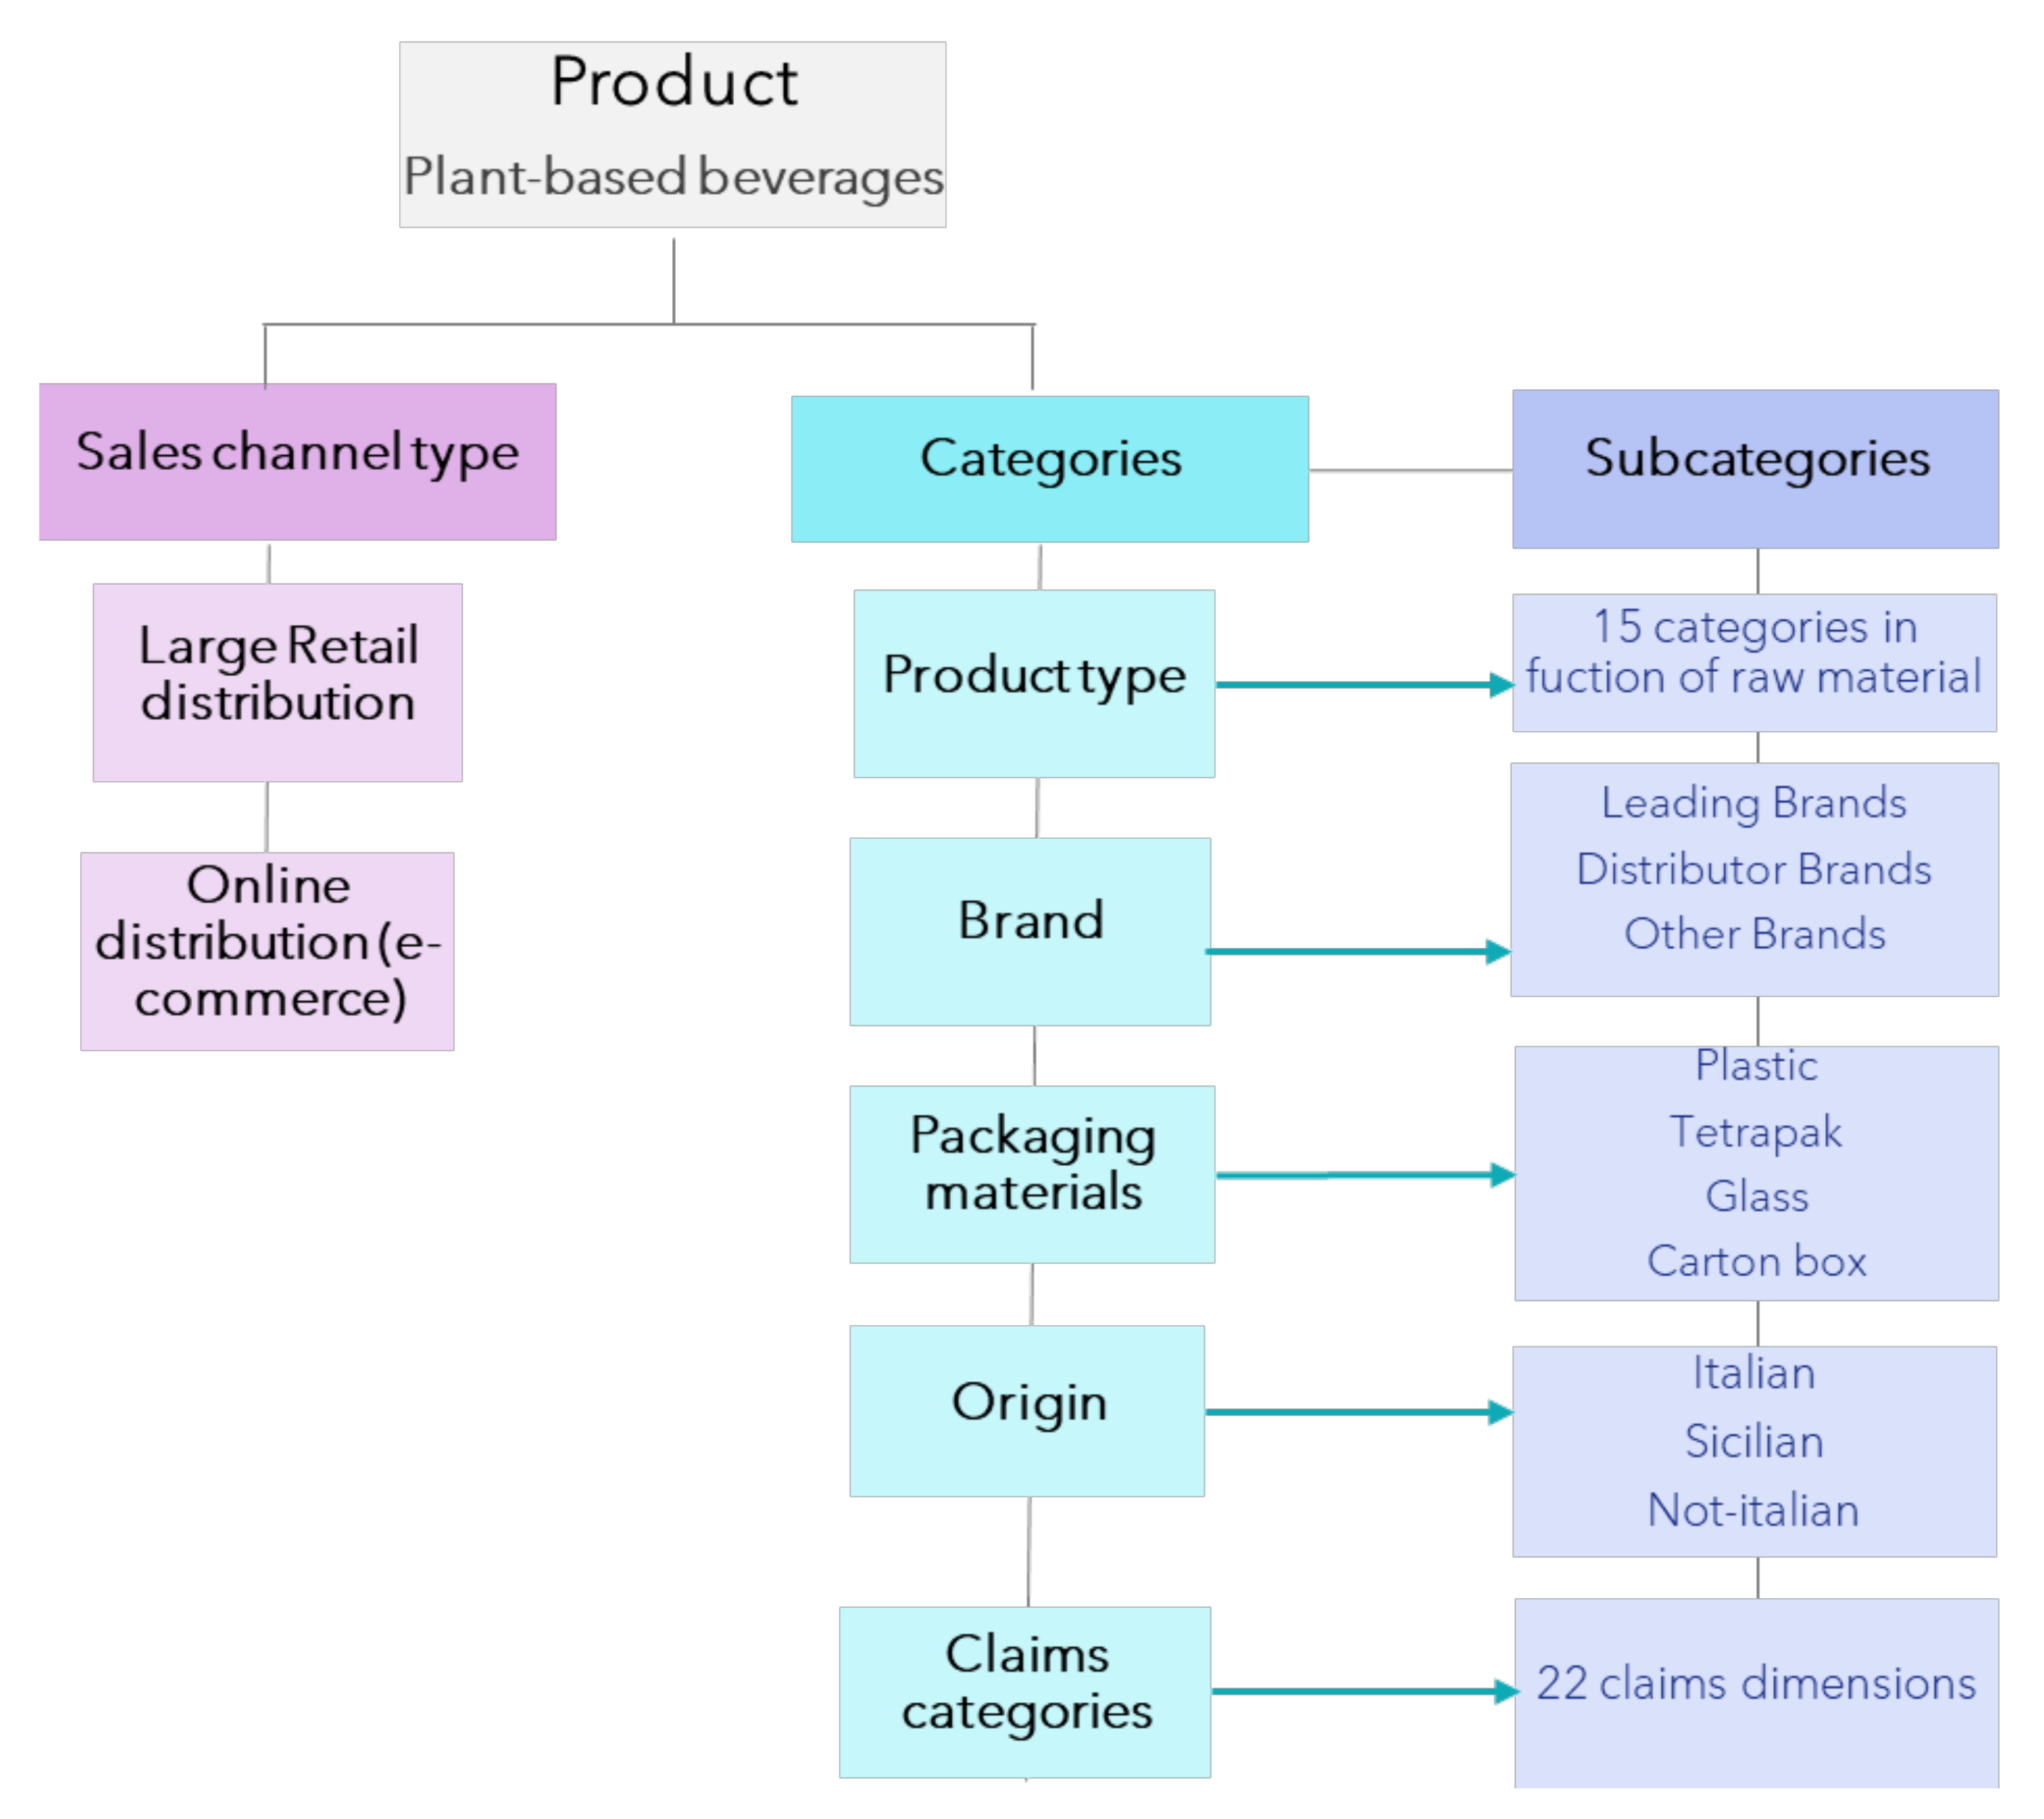
2.1. Case Study

In total, the characteristics of the 2653 references that make up the PBB portfolio were collected. Specifically, 462 references were recorded on e-commerce websites, while 2191 directly at LRd stores. The data were collected in 64 physical stores belonging to 22 different large retailers (Rs) in the two areas selected for the study: the metropolitan area of Turin (Piedmont, north-west of Italy) and the metropolitan area of Palermo (Sicily, south of Italy). Different distribution formats were considered in the analysis: hypermarkets, supermarkets, convenience stores, discount stores, organic supermarkets, and organic convenience stores. Depending on the type of distribution format considered, both the number of Rs and the number of references differed. For example, for supermarkets, 12 retailers were considered and 978 references were recorded, while for organic convenience stores, the 104 plant-based drinks analysed were from 2 retailers and recorded in 3 different stores (Table 1).
First, the online supply of 74 websites of brands producing plant-based beverages, including 14 private labels, was analysed. Both in physical stores and on the websites, the following information was collected for each plant-based beverage: type (the ‘type’ is based on the main ingredient of the PBBs), certifications (organic, vegan, lactose-free), packaging (format and material), indication of origin, label claims regarding the absence of allergy-causing/intolerant or unhealthy components (e.g., saturated fats, iodine, sugars), information referring to micro/macronutrients in the product, and information referring to “naturalness” and plant-based origin. All references recorded during data collection were categorized according to grouping criteria, such as product type, presence and type of claims, brand, packaging material, and origin (Figure 1).
The product categories defined in the function of the raw materials are described in Table 2. The different categories were then compared in terms of assortment size (Asize) (the number of product categories/lines in a portfolio) and depth (Adepth) (the number of product variants—items, references, or stocked units (SKUs)—within a product category) [30]. For the claims analysis, these were classified into different dimensions according to the type of information and the product labels provided in order to conduct a search with meaningful results (Table 3).
Finally, the price per litre of each reference was collected both online and in physical stores.

2.2. Statistical Analysis

First, significant differences were observed between PBB Adepth values, defined by product subcategories, between the two sales channels, direct and online, using the nonparametric Chi-square test [32]. Starting from the null hypothesis (H0: there is no differences between the two sales channels in terms of each defined product sub-category), this test was used to compare statistical differences between two groups (direct and online sales), with the p-value considered to quantify the significance of these differences [34,35]. The following p-value coding was used in our research: p-value < 0.001 = (***); p-value < 0.01 = (**), and p-value < 0.05 = (*). Non-significant p-values (>0.05) were indicated with n.s. [22]. The main limitation of the chi-square test is that it does not provide information on the magnitude of the association, but only on whether or not the null hypothesis of independence of the distributions can be rejected. In fact, a high chi-square value suggests that the two variables are associated with each other but does not imply that the association is strong. For a given degree of association, the value of chi square in fact increases as the sample size increases [36,37]. Then, given the large sample size of marketing claims, to establish the strength of the association between the variables, a further analysis was performed for this variable using the relationship map. To obtain the relationship maps, the different dimensions of claims were divided into groups (sub-categories) according to type in order to simplify the comparison of results. For each group, the relationships between the label claim dimension and the products in the two different sales channels were analysed. Relationship maps can be used to determine how variables relate to each other through a graphical representation of the connections of each node on the map with the others. The map consists of several nodes (circles), representing the variables under consideration, connected to each other through more or less thick lines. A larger diameter of a node indicates that that variable is present in higher numbers within the sample. In addition, the thicker the link is between two variables, the more important and significant the relationship between these variables is. In this study, the claims dimensions and distribution channel types (LRd and online shops) were used as variables in the relationship map. All the analyses were performed using the IBM SPSS Statistic 28.0 software for Windows. Although this analysis provides a clear and easy-to-understand graphical output, just interpreting the strength of relationships by the thickness of the linkages results in a loss of information; however, in the interactive version of SPSS, it is instead possible to visualize frequencies directly by selecting nodes and linkages [38]. In order to understand the changes in price as a function of the characteristics of plant-based beverages, the Ordered Logistic Econometric model was used, as this method allows a dependent variable to be compared with a sequence of latent variables [39,40]. In this case, the price, which is presented in ordered categories, as a sequence of latent variables PRICE* through ten increasing levels, starting from 0.70 EUR/l up to more than 5 EUR/l [41]:
PRICE i * = x i β + ε i
where the estimated PRICE* is continuous, ranging from −∞ to +∞;
x i , is the vector of the latent variables (sales channels, product type, packaging materials, claims);
β is the coefficient term associated with the covariates;
ε is the residual term, for all the i observations.
The latent variables used in the model are described in Table 4.
In the model, a set of cut-points, representing the threshold value from the lowest to the highest category of the observed variable PRICE distribution, was estimated as specified below:
PRICE i = j if α j 1 < PRICE i α i , j = 1 , , m
where α 0 =   and   α m = + .
The following ordered logit model structure was employed to estimate the probability (Prob) that PRICE lies in one threshold or another:
Prob ( PRICE i = j ) = Prob ( α j 1 < PRICE i * α j ) = Prob ( α j 1 < x i β + ε i α j ) = Prob ( α j 1 x i β < β i α j x i β ) = F ( α j x i β ) F ( α j 1 x i β )
where i = 1, N is the index of each observation from the sample; j = 1, 10 is the index of the values of price; xi is the vector of the exogenous variables (sales channel type; product type; packaging materials; claims); β is the coefficient vector; and αj, j = 1,10 are cut points of the distribution. F is the cumulative logistic distribution function of ε.
The results of the model were described as an odds ratio (OR) with 95% confidence intervals, p-values, and predicted probabilities [42]. The OR measures of the probability of variation of the dependent variable in the function of a change of the independent variable. OR values of less than 1 (with p-value < 0.05) point to a negative effect of the explanatory variable on the dependent variable (price); conversely, OR values greater than 1 (and statistically significant) denote a positive effect of the independent variables on the price of plant-based beverages.

3. Results

3.1. Product Variable Analysis

The total 2653 references (462 online, 2191 in physical stores) of the PBB portfolio were categorized according to the type of raw materials mainly present within the beverages. As can be seen from Table 5, the main type of PBBs present in the total portfolio analysed was one composed of soy only (25%), followed by oats only (16%), rice only (16%), and almond only (15%). The least present type, however, was beverages composed of almonds and other raw products (1%). In general, the mixed products (i.e., soy and others raw products, oats and others raw products, etc.) were less represented in the PBB portfolio.
Comparing the two different distribution channels, it was found that there were highly significant differences (p-value < 0.001) in the assortment concerning the types composed of almond only (category 7), almond plus other ingredients (category 8), and soy only (H0 for these two product categories cannot be accepted). For the other product types, the null hypothesis can be accepted at the 5% significance level.
Specifically, almond beverages were present in higher percentages in the online sales channel, and those composed of almond and other ingredients were present in insignificant numbers in physical retail. These had significantly more references for beverages composed of soy only (category 12). The almond only category (category 7) was the most prevalent on the e-commerce sites of the manufacturers analysed, while within the physical outlets, it was soy only (category 12). The types with fewer references were those consisting of oats plus other ingredients online and almond plus other ingredients in large retails chains (Table 6).

3.1.1. Brand

Table 7 shows the differences in Adepth for the two different sales channels, considering the three brand sub-categories (LB, OB, and DB). The results of this analysis showed highly significant differences for all brand sub-categories considered (H0 for the relationship between distribution channels vs. brand sub-categories cannot be accepted). Specifically, within the physical stores, most of the references (78%) belonged to leading brands, while only 7% belonged to other brands. In contrast, in the online sales channel, 25% of the references were PBB belonging to OBs. In terms of DBs, these had a greater impact on e-commerce sites (23% of references) than in physical stores (15%).

3.1.2. PBB Specialties

Almost all references considered in this research belonged to one or more product categories defined as “specialties”. In order to characterize the PBB portfolio, references with organic, vegan, lactose-free, and without nutritional components that are not benevolent to health (e.g., sodium and added sugars) or capable of causing allergies or intolerances were defined as “specialties”. The latter category of specialties was defined as “free from”. Comparing the results for the two different sales channels, significant differences emerged in the Adepth of references belonging to all specialties categories, except for the “free from” category. The percentage of references in the total, organic, and vegan certifications were more frequent on online shops than in physical stores. In contrast, PBBs with a lactose-free claim were found more frequently within large retails chains (Table 8).
In this case, the null hypothesis can be accepted at a 5% level of significance in the case of the “free from” specialty, while for the other sub-categories (organic, vegan, and lactose-free), the H0 cannot be accepted.

3.2. Packaging Analysis

All packaging materials used in the two different sales channels reported significant differences in the Adepth of PBBs (the null hypothesis can be accepted at the 5% significance level considering the relationship distribution channels vs. packaging materials). In both sales channels, the most commonly used type of packaging was Tetra Pak. Online, there were also carton boxes for the sale of plant-based beverages, while in the large-scale retail trade no references were packaged in this way. In addition, in physical stores, only 1% of plant-based drinks were in glass bottles, while in online shops only 8% (Table 9).

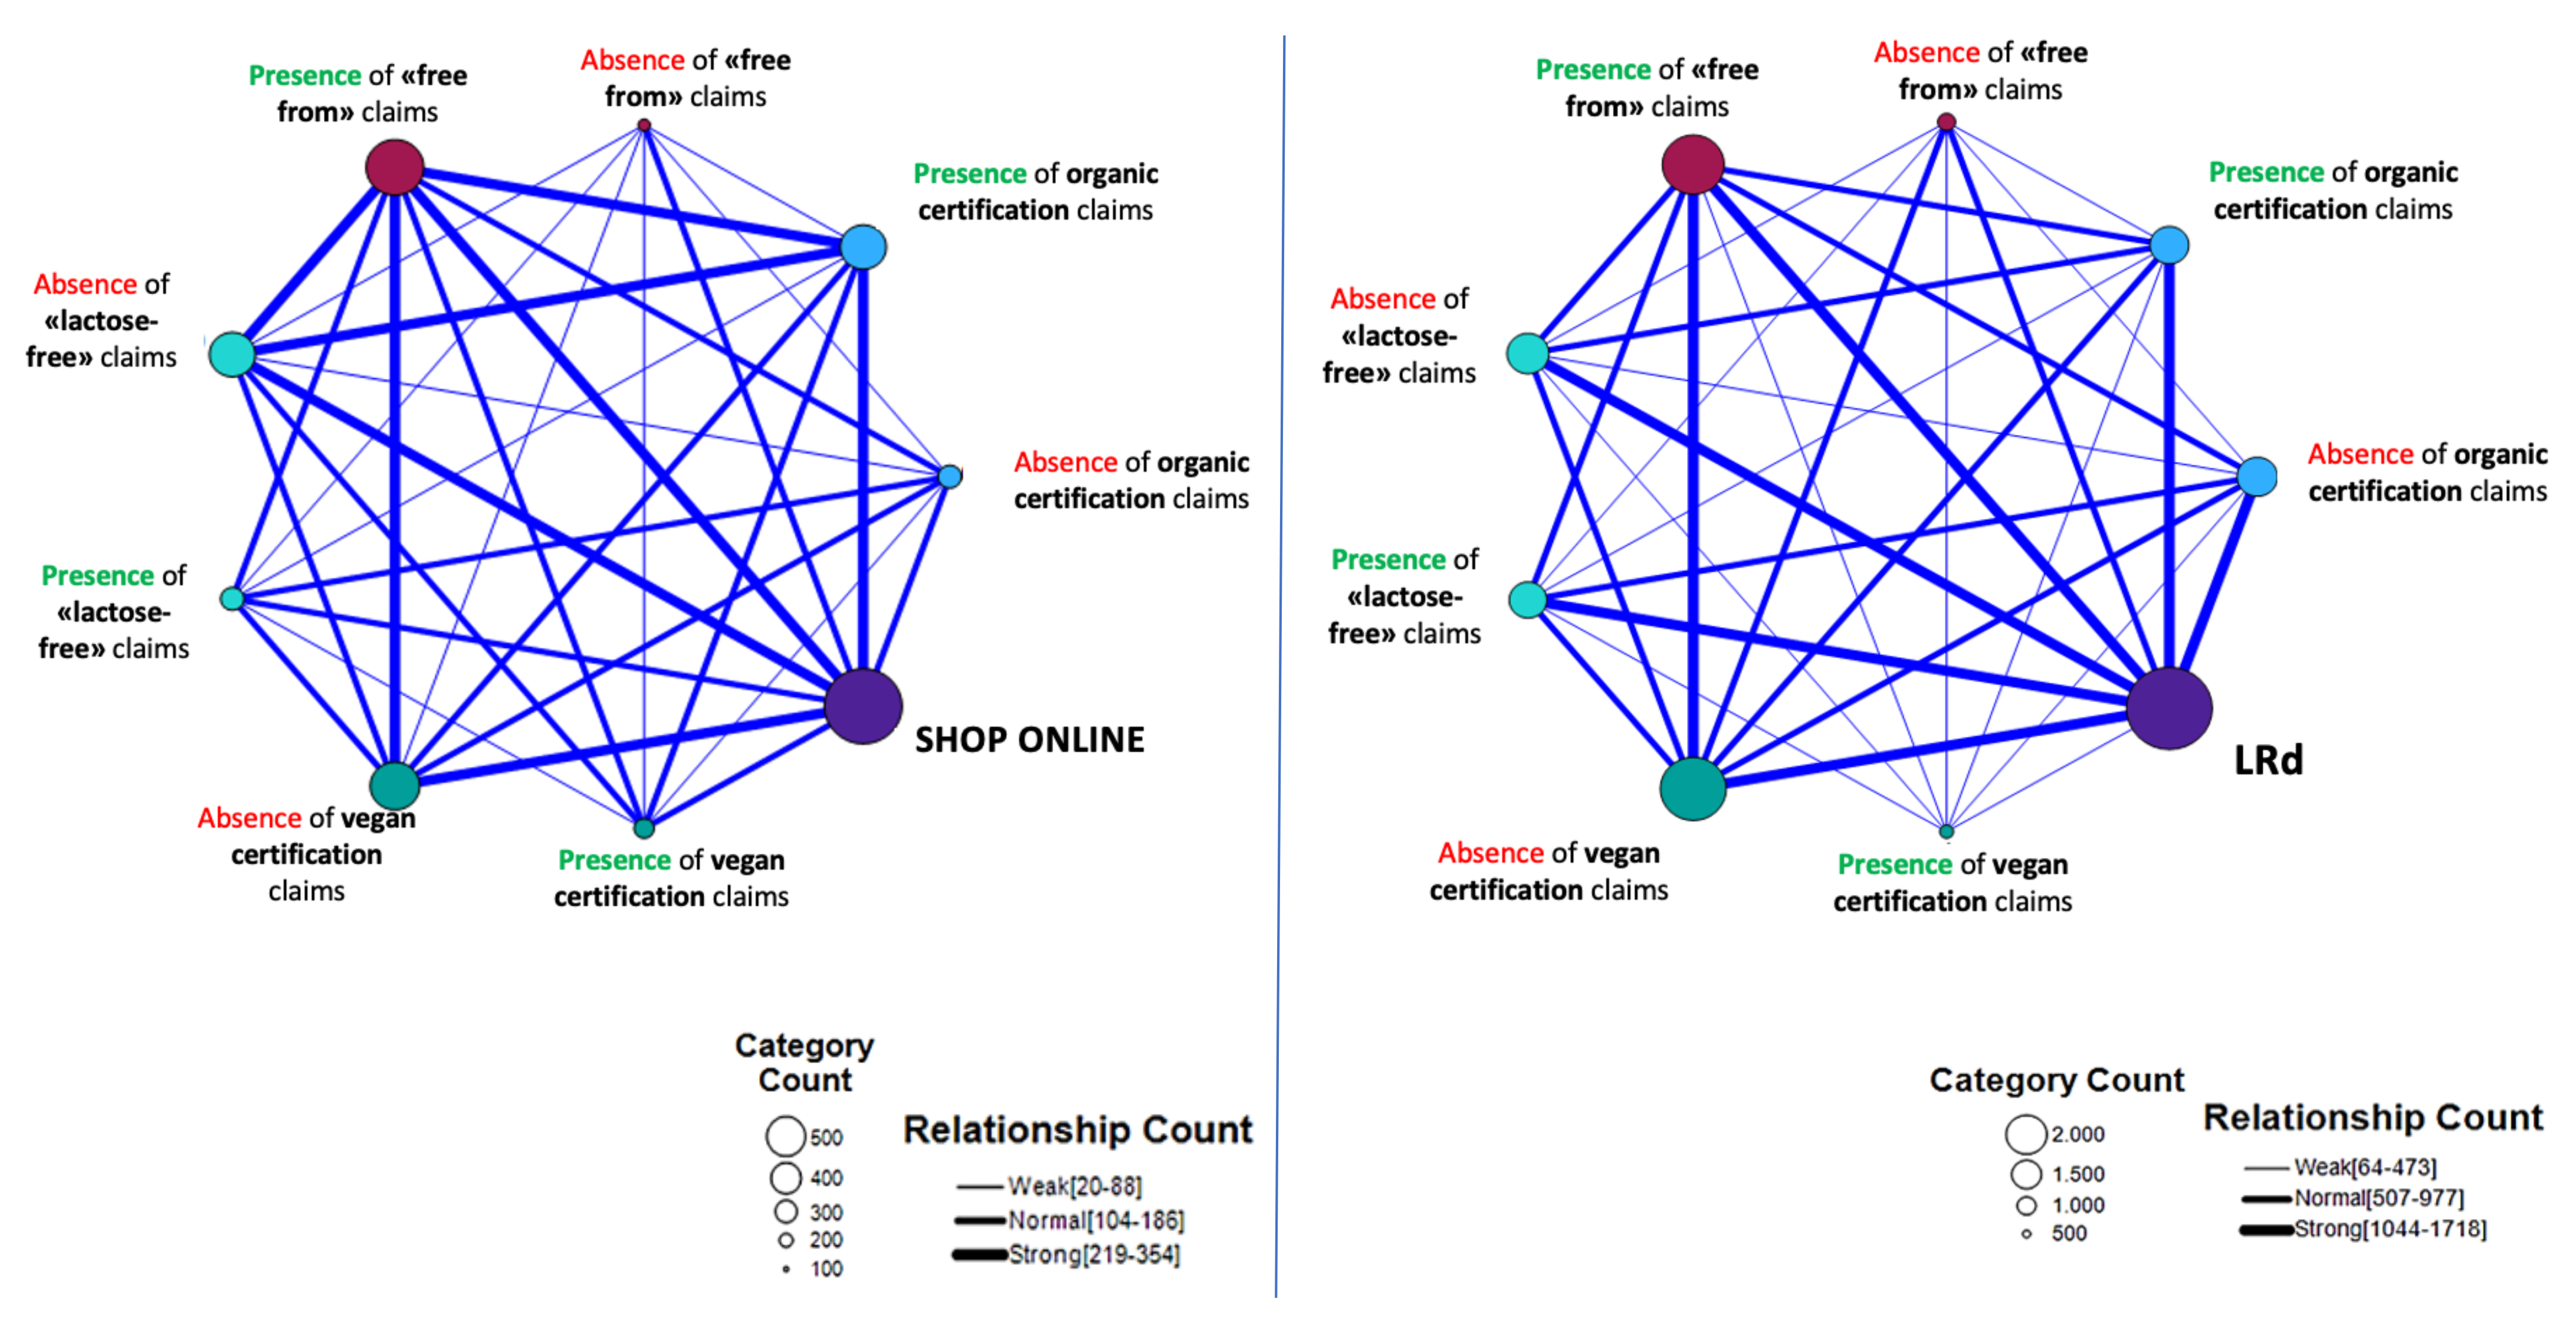
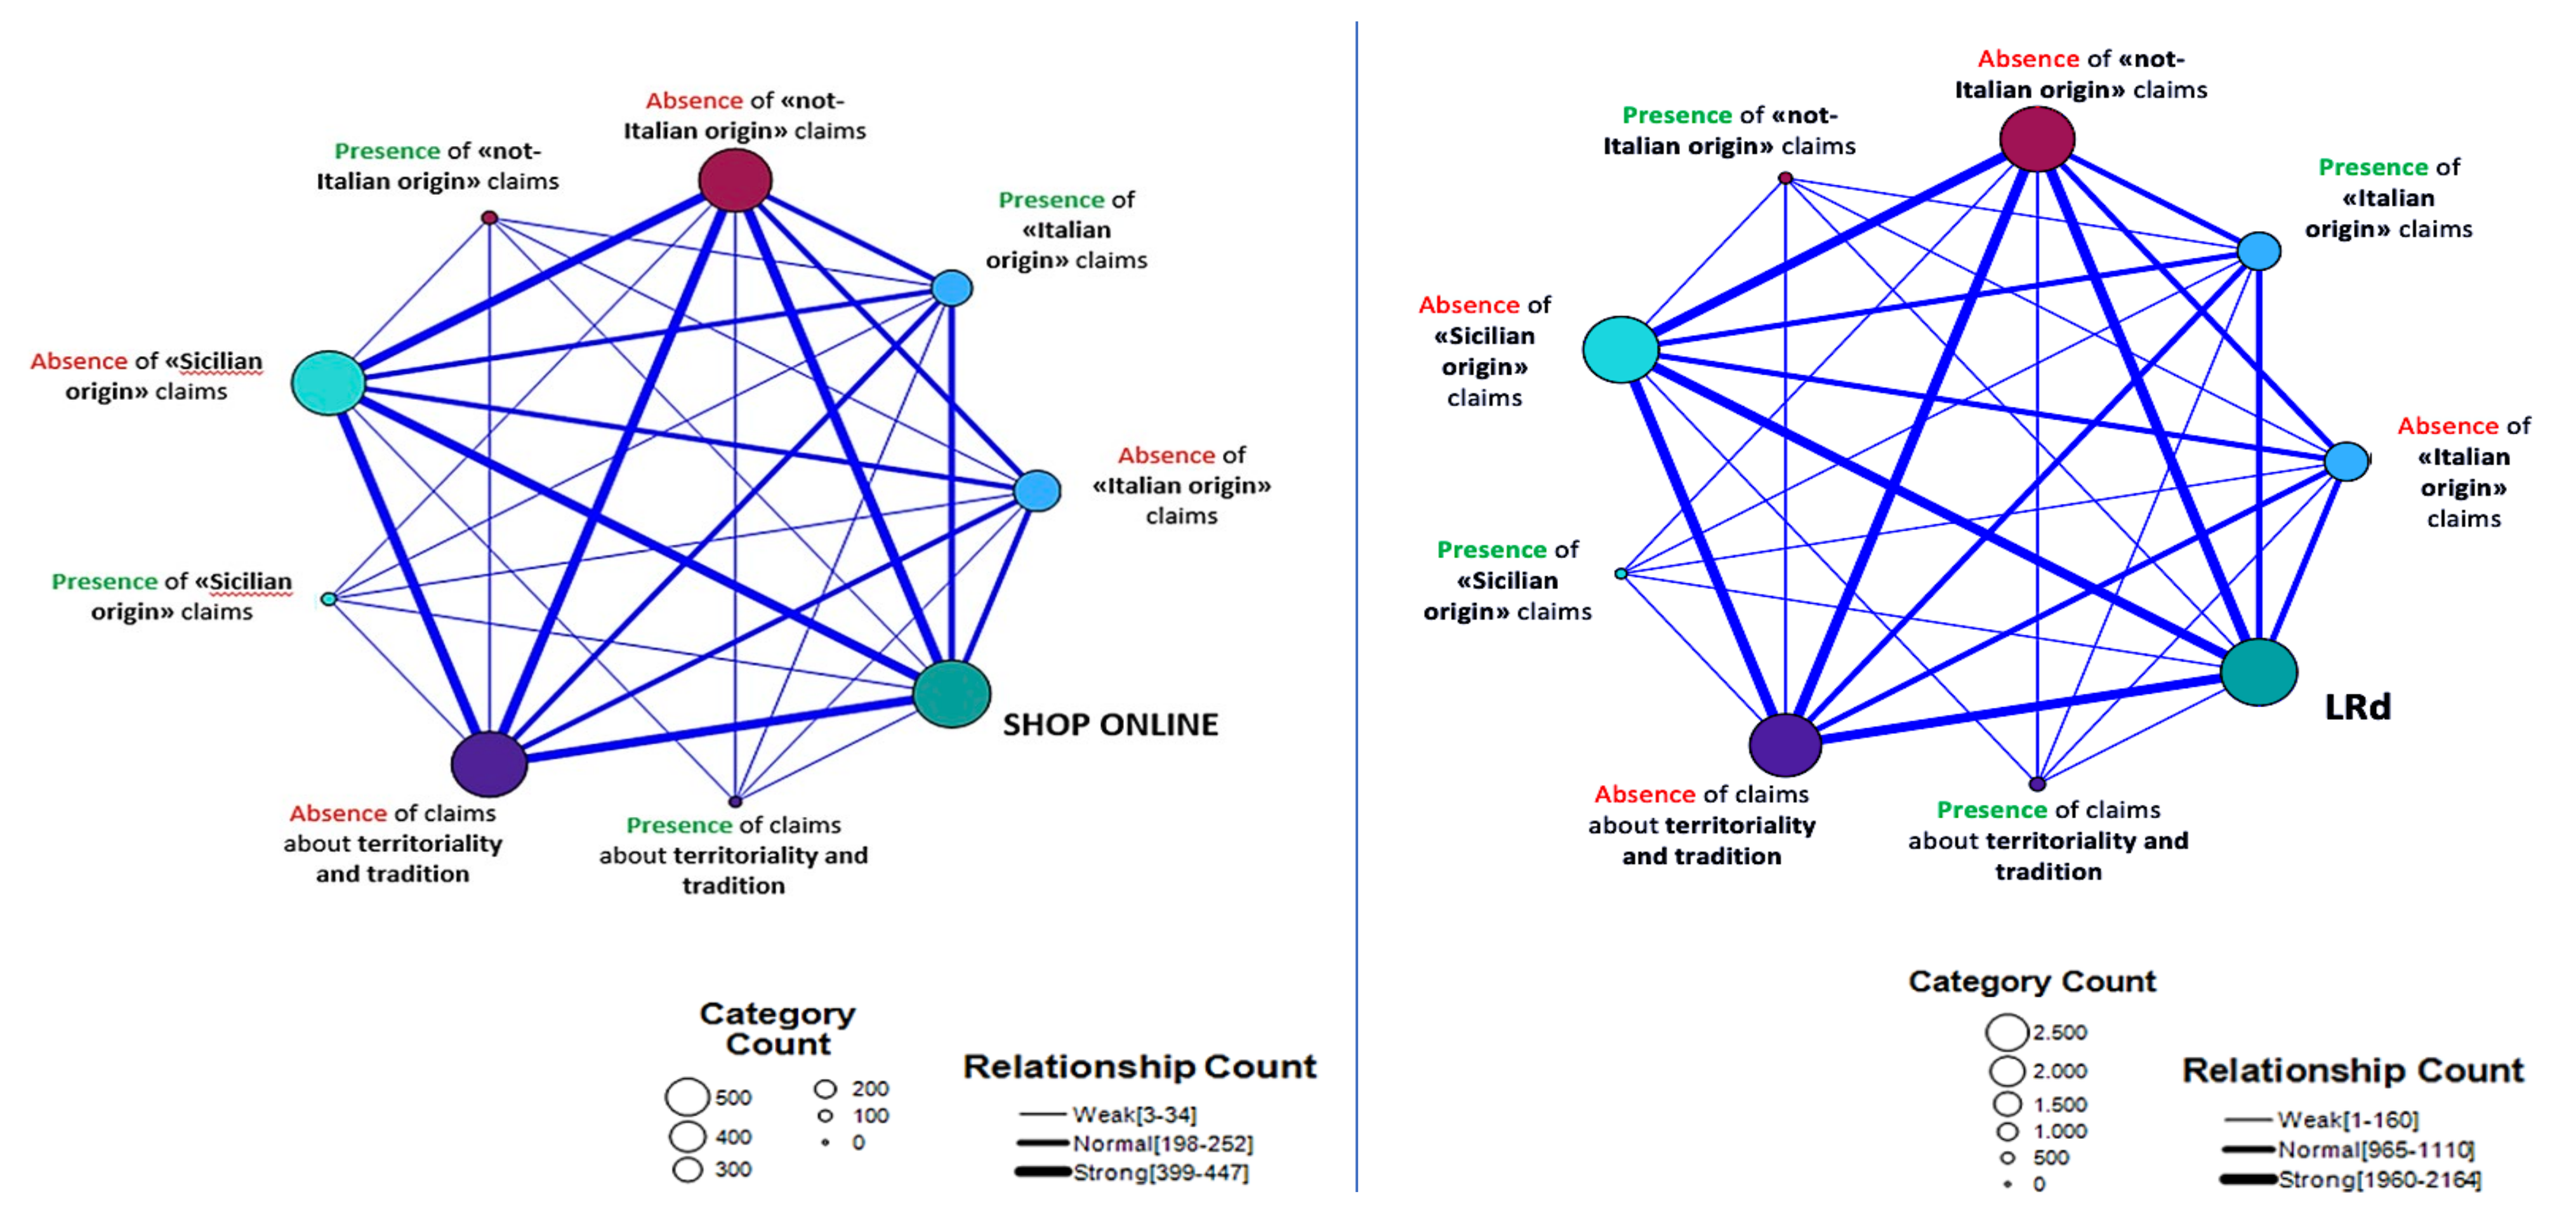
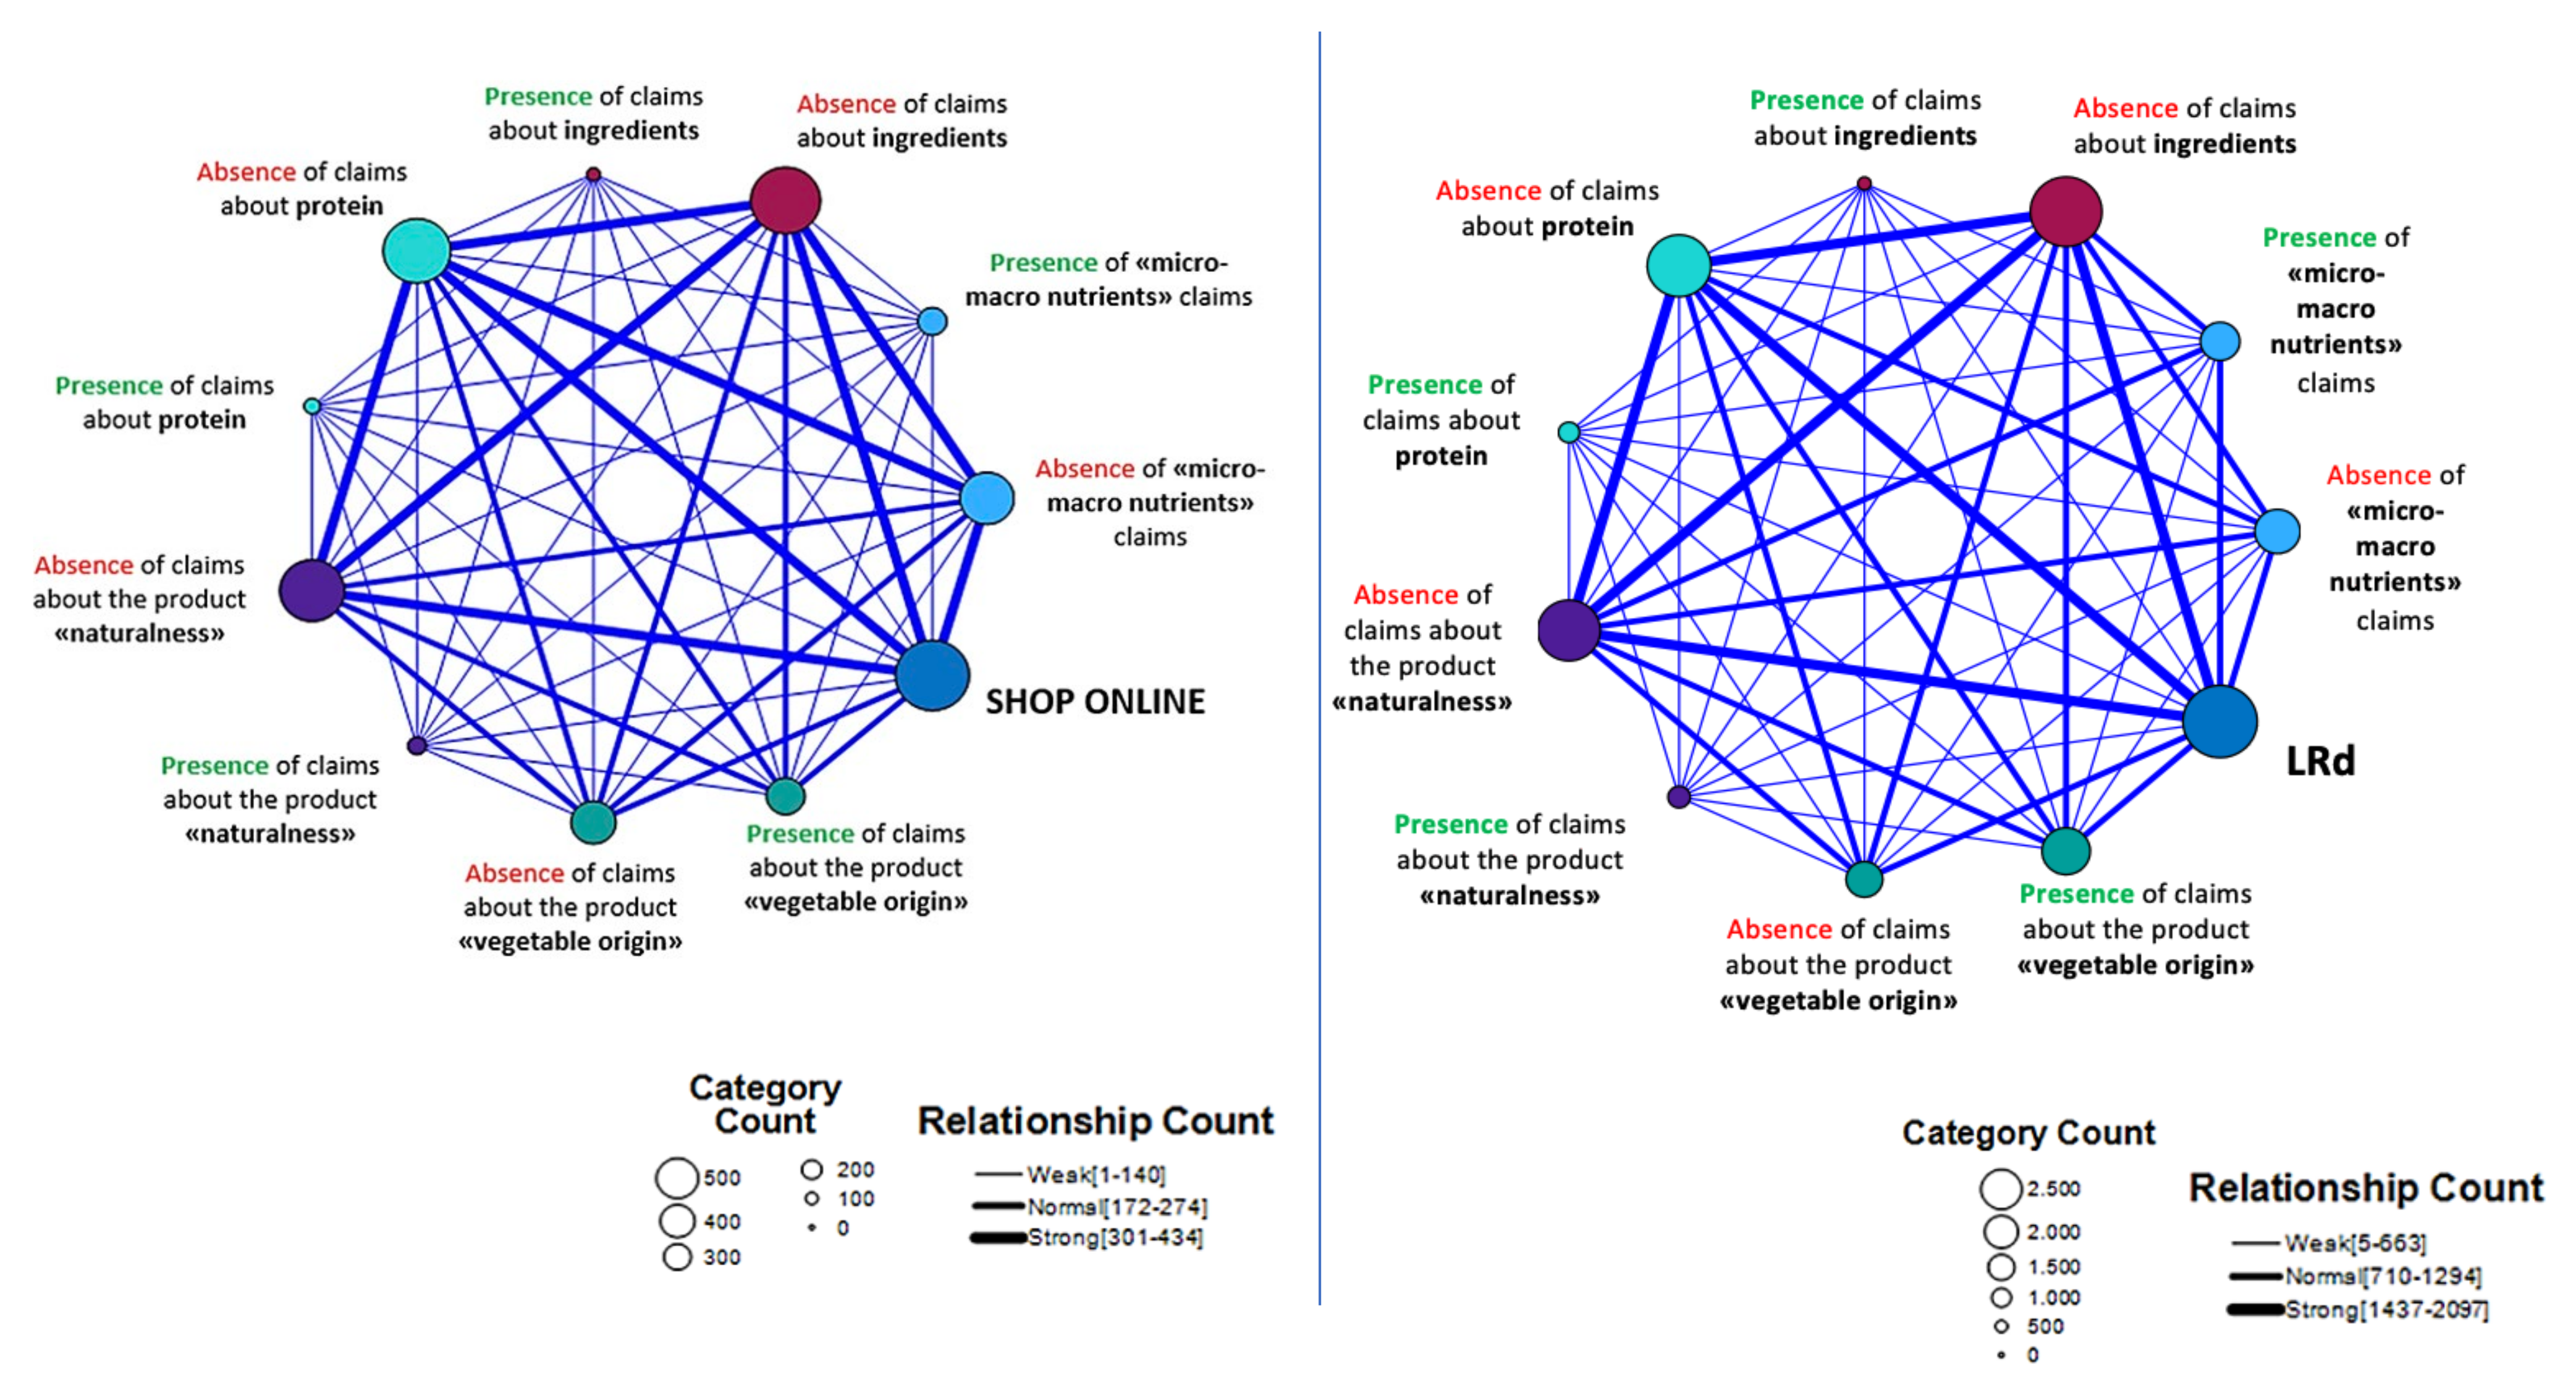
3.3. Claims Analysis

The relationship map obtained by analysing the connection between the “specialties” claims and the distribution type showed a strong relationship between the claims related to “free from” and organic certification, and online distribution. The “lactose-free” claim was mainly communicated in the LRd, while the claims related to vegan certification were mainly absent in physical stores compared to online distribution. With regard to large retail chains, there was a strong correlation with the presence of all these “specialties” claims, except for that of vegan certification. Instead, in online channels, the references were strongly related only with “free from” claims and organic certification. Among these categories of claims, “free from” referring to both nutritional and health characteristics was the most present in both sales channels (Figure 2).
Claims regarding the origin of PBBs were quite frequent (61% of products in both the physical outlets and online); the most prominent one was that of Italian origin. In fact, as can be seen from the diameter of the circles (each of which represents the presence or absence of a certain category of claims) in Figure 3, there were more references without these types of claims than those which carried them. Specifically, the references recorded in both sales channels were closely related to the absence of claims referring to non-Italian origin, Sicilian origin, and referring to territoriality and tradition (the null hypothesis cannot be accepted considering the relationship distribution channels vs. origin claims). Instead, they presented a “normal” relationship with the presence of claims referring to the beverage’s Italian origin (H0 is accepted). In fact, 50% of PBBs registered in physical outlets and 45% of those on e-commerce carried at least one claim referring to the Italian origin of the product on the label (Table 10).
As in the case of the previous dimension of claims, the LRd products analysed were weakly correlated with the presence of claims related to ingredients, protein, and the “naturalness” of the product and were “normally” correlated with the presence of “micro-macronutrients” and “plant-based origin” claims. References registered on online shops, on the other hand, had a weakly correlation with the presence of claims referring to micro-macronutrients and a “normally” correlation with the plant origin of the product. Online products have a close correlation with the absence of claims related to the protein content and ingredients. The latter was the least used label claim (Figure 4).
PBBs registered in physical stores showed a high frequency of label claims related to the “free from nutritional” category and a normal correlation with claims referring to intolerances and/or allergies, while “low in” and “health” claims were not significantly used in the label marketing of products sold in LRds. In contrast, in the online channel, there was no close correlation with any of these four types of claims (Figure 5). Analysis of the dimension of claims referring to product quality, sustainable packaging, organoleptic characteristics, certification, and methods of use showed that PBBs from the two different distribution channels had no significant correlation with these types of label information.

3.4. Ordered Logit Regression Analysis

As a result of the p-values obtained from this analysis methodology, only two variables were found to be statistically non-significant in the product price definition (sales channel type and “free-from” claims). The findings indicate that the characteristics that most influence price range are the PBB types, packaging materials, claims referring to the absence of lactose, and claims related to Sicilian origin. In particular, the types of beverages coded in this study with a higher number negatively affect the price: the price was lower for the categories in this analysis indicated with a higher number (e.g., soy-only beverages had a lower average price than almond-only beverages). “Lactose-free” claims were also negatively correlated with price trends. This result proves interesting in that, as the number of this category of claims increased, the average price of the plant-based drink decreased. The opposite result was recorded, however, for claims that indicated Sicilian origin, which, when present, increased the price of the product. With regard to packaging, plant-based drinks packaged in glass bottles showed higher prices than those in Tetra Pak containers. In addition, with lower significance values, claims related to product certifications, territoriality, tradition, and Italian origin also positively influenced the price. Meanwhile, as “health” claims and claims related to organic and vegan certifications increased, the average selling price decreased (Table 11).

4. Discussion

This research described and compared the positioning and the assortment planning decision of PBBs within two different sales channels: large-scale retail and the e-commerce sites of major players. In general, the results regarding product assortment were in line with recent market analysis data that emphasized the boom in the plant-based beverage sector with an increase in product types and sales volumes within LRd [5,6,30,43]. In fact, in the physical stores and online shops analysed, a wide choice was found on the shelves (both physical and “virtual”) for PBBs composed of different raw materials, and which differ in both organoleptic properties and nutritional components [11,31]. In line with sales data in this sector in recent years, the most common type in the sample of products analysed was soy-only, followed by oat-only, rice-only, and almond-only beverages [6,30,44]. Recent studies, however, have shown that Italian consumers prefer almond and coconut beverages, the latter of which accounted for only 3% of the references found in this analysis [28]. The type most prevalent in online channels was almond-based, while in physical outlets it was soy-based. Thus, it can be said that the online offerings followed the recent consumer tastes of PBBs more closely than the large-scale retail offerings. In addition to the many product types found by this analysis, consumers in the stores analysed could also choose from several brand categories. Specifically, in online stores all three subcategories of brands were present in a significant percentage, with LBs predominating. Twenty-five percent of the plant-based beverages sold online belonged to brands of small producers or minor brands (OBs). This result confirms those reported in the literature: e-commerce is an important tool for small companies to get in touch with a larger number of potential customers and to make their product known outside their territory [45,46,47]. In contrast, in physical stores, OBs occupied a very low percentage (7%) of the total references that belonged, in most cases, to leading brands. Market research states that top brands lead the Italian PBB market within large retailers, but it also points out that more than 25% of total sales for this sector is occupied by private labels [12,13]; the whole European food sector is characterized by the continuous growth of brands belonging to large retailers [48]. In contrast, of the LRds considered in this research, only 15% of PBBs carried a private label. By observing and analysing the labels present on the plant-based beverages under study, it was found that these products carried numerous types of claims depending on the information with which the manufacturers wanted to attract the customer’s attention, confirming the data in the literature regarding the increase in the number of claims on PBB labels [2]. The different players that characterized the analysed sales channels, however, did not use this marketing strategy efficiently. In fact, for many of these claims, the number of products carrying them was not statistically significant. For example, only about 50% of PBBs from LRds and about 40% of those online had the lactose-free label indication, despite being plant-based products. Communication of this feature should be improved by market players to be more competitive in an ever-expanding sector: one of the main reasons why consumers replace cow’s milk with plant-based alternatives is related to intolerances/allergies or poor digestibility toward lactose [1,49]. Another purchase driver for this category of products is the nutritional characteristics of the product, such as added or naturally present micro-macronutrients in the product (vitamins, minerals, fibre, protein, etc.) that may have beneficial effects on health [8,50]. The presence of claims, considered in this study, related to micro-macronutrients, presence of protein, ingredients, and health benefits of the product were found to be weakly correlated with both PBBs in large retailers and PBBs in online stores. The same results emerged when considering claims related to product organoleptic characteristics and sustainable packaging. The organoleptic aspect of PBBs represents a “barrier” for consumers, who find it unappealing and less sensorily satisfying than cow’s milk [51,52]. Ethical and environmental sustainability are other consumption drivers of plant-based beverages; therefore, communication of sustainable and recyclable packaging aspects could be a point market players improve on to meet consumer demands [23]. Organic certification emerged among the different types of claims. About 50% of PBBs in physical stores and more than 60% of those sold online possessed declared organic certification with different claims on the label, in addition to the European label. This result shows that the market players, especially those operating in the online sector, are moving towards a consumer preference for organic plant-based products [21,53,54,55]. According to several studies, in addition to this certification, consumers are willing to pay more for a product of local origin [56,57]. Often these two characteristics (organic and local) go hand in hand amongst consumers who are more concerned about health and environmental sustainability [58,59,60]. In line with this data in the literature regarding consumer analysis, about 50% of PBBs analysed in physical and online stores possessed a local (Italian) origin label declaration.
A new trend in consumer food preferences is “free from”. In particular, the focus is on the absence of components that may not be beneficial to health, such as additives, the presence of added sugar, hydrogenated fats, and nutrient components that lead to intolerances/allergies [61,62]. This study found that both within large-scale retail and in the online channel, manufacturers offered many “free from” products to consumers. In the “free from” products, the claims about the “nutritional free from” information were very frequent in the plant-based drinks of LRds, but less so in those offered online.
The selling price was influenced by most of the characteristics of the PBBs analysed. In particular, the presence of claims related to the origin and territoriality of the product had a positive influence on price, which increased as the number of these claims on the label increased. In contrast, claims about organic certification, declared lactose-free and health, decreased the sales value of PBBs. This result was unexpected because these features increase consumers’ willingness to pay.

5. Conclusions

This paper investigated how retailers are coping with the growing demand for plant-based beverages and how they are meeting new consumer needs. In addition, the assortment of the traditional large retail channel was compared with that of the emerging e-commerce channel. Retailers, through assortment strategies, decide how heterogeneous their offerings are to meet different target customers and, at the same time, how this can be profitable in an increasingly fragmented and competitive market. Our results showed that there were significant differences in terms of marketing decisions in the assortment of plant-based beverages by the two sales channels. Specifically, large-scale retail focused on an offering characterized by the historically best-selling PBB types (e.g., soy, rice) with a predominance of leading brands; meanwhile, online shops featured more emerging types (such as almond-based) and provided more space for both small companies and private labels. In addition, online offerings provided more products that meet new consumer demands regarding features such as “free from” products, “naturalness” of the product, and organic and vegan certifications. In general, however, both channels showed shortcomings toward the consumer preferences stated in the literature; in fact, there were a limited number of products for the most requested features. This work may be useful for distributors for the purpose of improving marketing strategies and developing new products to meet the demands of an ever-increasing target of consumers. Given the limited amount of data in the literature regarding the positioning of this product in the main sales channels, this research lays the foundation for future work exploring how supply meets demand for plant-based beverages in order to understand whether communication and product development strategies are moving in the direction of adapting to changes in consumption habits. However, this study has limitations related to the consideration of a limited geographic area and number of products.

Author Contributions

Conceptualization, V.M.M., S.M., F.S. and G.M.; methodology, V.M.M., G.M., S.M., D.B. and C.P.; validation, S.M., D.B., F.S. and C.P.; formal analysis, V.M.M. and S.M.; investigation, G.M., A.S. and C.C.; resources, F.S. and C.P.; data curation, V.M.M., G.M. and S.M.; writing—original draft preparation, G.M. and V.M.M.; writing—review and editing, V.M.M., A.S., C.P., D.B. and S.M.; visualization, S.M., G.M. and F.S.; supervision, V.M.M., S.M., D.B., C.P. and F.S.; project administration, S.M. and F.S.; funding acquisition, F.S. All authors have read and agreed to the published version of the manuscript.

Funding

This work was supported by the Ministero dello Sviluppo Economico (Italy)—Project title: “Innovazioni tecnologiche bio-based e potenziamento dell’economia circolare nella gestione degli scarti da lavorazione primaria di mandorle biologiche con elevate potenzialità agroindustriali”, No. F/200037/01- 03/X45.

Data Availability Statement

Data sharing is not applicable to this article due to privacy.

Conflicts of Interest

The authors declare no conflict of interest.

Abbreviations

AdepthAssortment depth, which is the number of product varieties that appeared in the offer list designation (price, items, references, or SKUs) within a product category
AsizeAssortment size, which is the number of product categories present in the portfolio offer
DBDistributor brand or private label
LBLeader brand or leading producers
OBOther brands (brands that are not market leaders, such as small producers)
RsRetailers
PBBPlant-based beverage
SKUStock Keeping Units or variants
LRdLarge retail distribution

References

  1. Sethi, S.; Tyagi, S.K.; Anurag, R.K. Plant-Based Milk Alternatives an Emerging Segment of Functional Beverages: A Review. J. Food Sci. Technol. 2016, 53, 3408–3423. [Google Scholar] [CrossRef] [PubMed]
  2. Senza Latte: La Crescita del Mercato delle Bevande Vegetali. Available online: https://www.osservatorioagr.eu/approfondimenti/senza-latte-la-crescita-del-mercato-delle-bevande-vegetali/ (accessed on 29 November 2022).
  3. Dairy Alternatives Market Size & Trends 2027. Available online: https://www.marketsandmarkets.com/Market-Reports/dairy-alternative-plant-milk-beverages-market-677.html (accessed on 28 November 2022).
  4. Trends to Watch in Plant-Based Milk. Available online: https://www.euromonitor.com/article/trends-to-watch-in-plant-based-milk (accessed on 27 January 2023).
  5. Plant-Based Beverages Market Size & Share Report, 2030. Available online: https://www.grandviewresearch.com/industry-analysis/plant-based-beverages-market (accessed on 28 November 2022).
  6. Latte Vegetale: In 3 Anni il Business Varrà 22,4 Miliardi di Dollari. ilBollettino. 2022. Available online: https://www.ilbollettino.eu/2022/01/15/latte-vegetale-in-3-anni-il-business-varra-224-miliardi-di-dollari/ (accessed on 28 November 2022).
  7. Das, A.; Raychaudhuri, U.; Chakraborty, R. Cereal Based Functional Food of Indian Subcontinent: A Review. J. Food Sci. Technol. 2012, 49, 665–672. [Google Scholar] [CrossRef] [PubMed]
  8. Copeland, A.; Dharmasena, S. Impact of Increasing Demand. for Dairy. Alternative Beverages on Dairy. Farmer. Welfare in the United States; Social Science Research Network: Rochester, NY, USA, 2016. [Google Scholar]
  9. Bigliardi, B.; Galati, F. Innovation Trends in the Food Industry: The Case of Functional Foods. Trends Food Sci. Technol. 2013, 31, 118–129. [Google Scholar] [CrossRef]
  10. Foodnavigator.com. ‘Plant-Based’ Claims Under-Exploited by Food Brands, Report Claims. Available online: https://www.foodnavigator.com/Article/2021/05/03/Plant-based-claims-under-exploited-by-food-brands-report-claims (accessed on 28 November 2022).
  11. Angelino, D.; Rosi, A.; Vici, G.; Russo, M.; Pellegrini, N.; Martini, D. Nutritional Quality of Plant-Based Drinks Sold in Italy: The Food Labelling of Italian Products (FLIP) Study. Foods 2020, 9, 682. [Google Scholar] [CrossRef] [PubMed]
  12. Beverfood.com. R. Mercato Bevande Vegetali Italia: 150 Milioni Litri e 280 Milioni € a Valore Nel 2020. Available online: https://www.beverfood.com/mercato-bevande-vegetali-italia-150-mio-litri-e-280-mio-e-a-valore-nel-2020-wd/ (accessed on 19 May 2022).
  13. Beverfood.com. R. Vola il Mercato Delle Bevande Vegetali in Italia. Available online: https://www.beverfood.com/vola-il-mercato-delle-bevande-vegetali-in-italia-wd/ (accessed on 19 May 2022).
  14. Plant-Based Food, Beverage Sales Reach New High in 2021. Available online: https://www.newhope.com/products-and-trends/plant-based-food-beverage-sales-reach-new-high-2021 (accessed on 29 November 2022).
  15. Fior Markets Research. Plant-Based Beverage Market to Record an Impressive Growth Rate USD 24.30 Billion by 2027: Fior Markets. Available online: https://www.globenewswire.com/en/news-release/2022/05/26/2450975/0/en/Plant-based-Beverage-Market-to-Record-an-Impressive-Growth-Rate-USD-24-30-billion-by-2027-Fior-Markets.html (accessed on 29 November 2022).
  16. I Trend 2021 Sulle Bevande Vegetali e le Opportunità del Mercato. Atlante. 2021. Available online: https://www.atlantesrl.it/i-trend-2021-sulle-bevande-vegetali-e-le-opportunita-del-mercato/ (accessed on 29 November 2022).
  17. Aryani, D.N.; Nair, R.K.; Hoo, D.X.Y.; Hung, D.K.M.; Lim, D.H.R.; Chandran, D.A.R.; Chew, W.P.; Desai, A. A Study on Consumer Behaviour: Transition from Traditional Shopping to Online Shopping During the COVID-19 Pandemic. Int. J. Appl. Bus. Int. Manag. (IJABIM) 2021, 6, 81–95. [Google Scholar] [CrossRef]
  18. Warrier, U.; Singh, P.; Jien, C.W.; Kee, D.M.H.; Yi, G.Z.; Jiann, T.W.; Liang, T.Y.; Sb, G.; Nair, S.; Nair, R.K.; et al. Factors That Lead Amazon.Com to A Successful Online Shopping Platform. Int. J. Tour. Hosp. Asia Pasific (IJTHAP) 2021, 4, 7–17. [Google Scholar] [CrossRef]
  19. Dionysiou, G.; Fouskas, K.; Karamitros, D. The Impact of COVID-19 in E-Commerce. Effects on Consumer Purchase Behavior. In Proceedings of the Strategic Innovative Marketing and Tourism in the COVID-19 Era; Kavoura, A., Havlovic, S.J., Totskaya, N., Eds.; Springer International Publishing: Cham, Switzerland, 2021; pp. 199–210. [Google Scholar]
  20. Fantoni, M. E-Commerce in Italia: Le Statistiche e la Crescita dopo il COVID-19. Noetica. 2021. Available online: https://www.noetica.it/e-commerce-in-italia/ (accessed on 29 November 2022).
  21. Lin, J.; Li, T.; Guo, J. Factors Influencing Consumers’ Continuous Purchase Intention on Fresh Food e-Commerce Platforms: An Organic Foods-Centric Empirical Investigation. Electron. Commer. Res. Appl. 2021, 50, 101103. [Google Scholar] [CrossRef]
  22. Merlino, V.M.; Mastromonaco, G.; Borra, D.; Blanc, S.; Brun, F.; Massaglia, S. Planning of the Cow Milk Assortment for Large Retail Chains in North Italy: A Comparison of Two Metropolitan Cities. J. Retail. Consum. Serv. 2021, 59, 102406. [Google Scholar] [CrossRef]
  23. Haas, R.; Schnepps, A.; Pichler, A.; Meixner, O. Cow Milk versus Plant-Based Milk Substitutes: A Comparison of Product Image and Motivational Structure of Consumption. Sustainability 2019, 11, 5046. [Google Scholar] [CrossRef]
  24. Morales, A.; Kahn, B.E.; McAlister, L.; Broniarczyk, S.M. Perceptions of Assortment Variety: The Effects of Congruency between Consumers’ Internal and Retailers’ External Organization. J. Retail. 2005, 81, 159–169. [Google Scholar] [CrossRef]
  25. Chernev, A. When More Is Less and Less Is More: The Role of Ideal Point Availability and Assortment in Consumer Choice. J. Consum. Res. 2003, 30, 170–183. [Google Scholar] [CrossRef]
  26. Fagerland, M.; Lydersen, S.; Laake, P. Statistical Analysis of Contingency Tables; Chapman and Hall/CRC: New York, NY, USA, 2017; ISBN 978-1-315-37411-6. [Google Scholar]
  27. Everitt, B.S. The Analysis of Contingency Tables, 2nd ed.; CRC Press: Boca Raton, FL, USA, 1992; ISBN 978-0-412-39850-6. [Google Scholar]
  28. Cintio, L.D. Latte Vegetale: Il 78% dei Consumatori l’ha Provato Almeno Una Volta. VEGANOK. 2022. Available online: https://www.veganok.com/latte-vegetale-consumi/ (accessed on 29 November 2022).
  29. Latte Di Mandorle -Bevanda Alle Mandorle|Assolatte -Assolatte. Available online: https://www.assolatte.it/it/home/salute_benessere_detail/1433415663036/1475846343563 (accessed on 23 January 2023).
  30. “Latte”: La Crescita Delle Bevande Vegetali. Available online: https://www.foodandtec.com/it-it/latte-la-crescita-delle-bevande-vegetali (accessed on 19 May 2022).
  31. Craig, W.J.; Fresán, U. International Analysis of the Nutritional Content and a Review of Health Benefits of Non-Dairy Plant-Based Beverages. Nutrients 2021, 13, 842. [Google Scholar] [CrossRef] [PubMed]
  32. Mantrala, M.K.; Levy, M.; Kahn, B.E.; Fox, E.J.; Gaidarev, P.; Dankworth, B.; Shah, D. Why Is Assortment Planning so Difficult for Retailers? A Framework and Research Agenda. J. Retail. 2009, 85, 71–83. [Google Scholar] [CrossRef]
  33. Terblanche, N.S. Revisiting the Supermarket In-Store Customer Shopping Experience. J. Retail. Consum. Serv. 2018, 40, 48–59. [Google Scholar] [CrossRef]
  34. Chi-Square Test-ProQuest. Available online: https://www.proquest.com/openview/04d2ff080887f9111b68eb7490a9630a/1?pq-origsite=gscholar&cbl=30764 (accessed on 9 November 2021).
  35. McHugh, M.L. The Chi-Square Test of Independence. Biochem. Med. 2013, 23, 143–149. [Google Scholar] [CrossRef]
  36. Curtis, K.; Youngquist, S.T. Part 21: Categoric Analysis: Pearson Chi-Square Test. Air Med. J. 2013, 32, 179–180. [Google Scholar] [CrossRef]
  37. Buckalew, L.W.; Pearson, W.H. Critical Factors in the Chi-Square Test of Independence: A Technique for Exploratory Data Analysis. Bull. Psychon. Soc. 1982, 19, 225–226. [Google Scholar] [CrossRef]
  38. IBM Relationship Map—IBM Documentation. Available online: https://www.ibm.com/docs/en/spss-statistics/28.0.0?topic=system-relationship-map (accessed on 4 April 2023).
  39. Testa, R.; Asciuto, A.; Schifani, G.; Schimmenti, E.; Migliore, G. Quality Determinants and Effect of Therapeutic Properties in Honey Consumption. An Exploratory Study on Italian Consumers. Agriculture 2019, 9, 174. [Google Scholar] [CrossRef]
  40. Merlino, V.M.; Brun, F.; Versino, A.; Blanc, S. Milk Packaging Innovation: Consumer Perception and Willingness to Pay. AIMS Agric. Food 2020, 5, 307–326. [Google Scholar] [CrossRef]
  41. Del Vecchio, A.; Massaglia, S.; Merlino, V.M.; Borra, D.; Hao, M. Italian Wines in China’s E-Commerce Market: Focus On Piedmont Region Products. Italian J. Food Sci. 2018, 30. [Google Scholar] [CrossRef]
  42. Boin, E.; Nunes, J. Mushroom Consumption Behavior and Influencing Factors in a Sample of the Portuguese Population. J. Int. Food Agribus. Mark. 2018, 30, 35–48. [Google Scholar] [CrossRef]
  43. Osservatorio Vegan ok Latte Vegetale: IL Boom—Agosto 2020; 2020. Available online: https://www.veganok.com/report/Report-latte-vegetale-agosto-2020.pdf (accessed on 28 November 2022).
  44. Serpilli, L. Boom di Bevande Vegetali: Il Latte D’avena è in Crescita Costante. VEGANOK. 2019. Available online: https://www.veganok.com/boom-di-bevande-vegetali-il-latte-davena-e-in-crescita-costante/ (accessed on 28 November 2022).
  45. Gazzetta di Milano. Nasce Campo Digitale, l’innovativo E-Commerce che Aiuta i Piccoli Produttori Agricoli Locali. Gazzetta di Milano. 2020. Available online: https://www.gazzettadimilano.it/economia/nasce-campo-digitale-linnovativo-e-commerce-che-aiuta-i-piccoli-produttori-agricoli-locali/ (accessed on 29 November 2022).
  46. Granulo, E.K. L’e-Commerce Divide le PMI del Commercio: Per il 55% è Opportunità di Crescita per Tutti, per il 30% farà Scomparire i Negozi; Confesercenti Nazionale: Roma, Italy, 2015; Available online: https://www.confesercenti.it/blog/le-commerce-divide-le-pmi-del-commercio-per-il-55-e-opportunita-di-crescita-per-tutto-il-settore-per-il-30-portera-alla-scomparsa-dei-negozi/ (accessed on 29 November 2022).
  47. Hardilawati, W.L.; Sandri, S.H.; Binangkit, I.D. The Role of Innovation and E-Commerce in Small Business; Atlantis Press: Amsterdam, The Netherlands, 2019; pp. 18–22. [Google Scholar]
  48. ITadmin Private Label in Continua Crescita in Europa. CLAL News. Available online: https://news.clal.it/it/private-label-continua-crescita-europa/ (accessed on 20 July 2018).
  49. Fructuoso, I.; Romão, B.; Han, H.; Raposo, A.; Ariza-Montes, A.; Araya-Castillo, L.; Zandonadi, R.P. An Overview on Nutritional Aspects of Plant-Based Beverages Used as Substitutes for Cow’s Milk. Nutrients 2021, 13, 2650. [Google Scholar] [CrossRef]
  50. Yang, T.; Dharmasena, S. Consumers Preferences on Nutritional Attributes of Dairy-Alternative Beverages: Hedonic Pricing Models. Food Sci. Nutr. 2020, 8, 5362–5378. [Google Scholar] [CrossRef] [PubMed]
  51. Cardello, A.V.; Llobell, F.; Giacalone, D.; Roigard, C.M.; Jaeger, S.R. Plant-Based Alternatives vs Dairy Milk: Consumer Segments and Their Sensory, Emotional, Cognitive and Situational Use Responses to Tasted Products. Food Qual. Prefer. 2022, 100, 104599. [Google Scholar] [CrossRef]
  52. Jaeger, S.R.; Giacalone, D. Barriers to Consumption of Plant-Based Beverages: A Comparison of Product Users and Non-Users on Emotional, Conceptual, Situational, Conative and Psychographic Variables. Food Res. Int. 2021, 144, 110363. [Google Scholar] [CrossRef] [PubMed]
  53. Janssen, M.; Hamm, U. Product Labelling in the Market for Organic Food: Consumer Preferences and Willingness-to-Pay for Different Organic Certification Logos. Food Qual. Prefer. 2012, 25, 9–22. [Google Scholar] [CrossRef]
  54. Peschel, A.O.; Kazemi, S.; Liebichová, M.; Sarraf, S.C.M.; Aschemann-Witzel, J. Consumers’ Associative Networks of Plant-Based Food Product Communications. Food Qual. Prefer. 2019, 75, 145–156. [Google Scholar] [CrossRef]
  55. Hemmerling, S.; Hamm, U.; Spiller, A. Consumption Behaviour Regarding Organic Food from a Marketing Perspective—A Literature Review. Org. Agric. 2015, 5, 277–313. [Google Scholar] [CrossRef]
  56. Aprile, M.C.; Caputo, V.; Nayga, R.M. Consumers’ Preferences and Attitudes Toward Local Food Products. J. Food Prod. Mark. 2016, 22, 19–42. [Google Scholar] [CrossRef]
  57. Feldmann, C.; Hamm, U. Consumers’ Perceptions and Preferences for Local Food: A Review. Food Qual. Prefer. 2015, 40, 152–164. [Google Scholar] [CrossRef]
  58. Hempel, C.; Hamm, U. How Important Is Local Food to Organic-Minded Consumers? Appetite 2016, 96, 309–318. [Google Scholar] [CrossRef] [PubMed]
  59. Annunziata, A.; Mariani, A. Consumer Perception of Sustainability Attributes in Organic and Local Food. Recent. Pat. Food Nutr. Agric. 2018, 9, 87–96. [Google Scholar] [CrossRef] [PubMed]
  60. Meas, T.; Hu, W.; Batte, M.T.; Woods, T.A.; Ernst, S. Substitutes or Complements? Consumer Preference for Local and Organic Food Attributes. Am. J. Agric. Econ. 2015, 97, 1044–1071. [Google Scholar] [CrossRef]
  61. Manuelli, M.T. Senza Grassi, Glutine o Zuccheri: Il Cibo «Free From» Vale 6,9 Miliardi. Available online: https://www.ilsole24ore.com/art/senza-grassi-glutine-o-zuccheri-il-cibo-free-from-vale-69-miliardi-ADQYhbs (accessed on 25 January 2023).
  62. Redazione Quali sono i Trend Emergenti nel “Free From”? VEGANOK. 2020. Available online: https://www.veganok.com/quali-sono-i-trend-emergenti-nel-free-from/ (accessed on 25 January 2023).
Figure 1. Product categories and sub-categories of the PB beverages considered in the research.
Beverages 09 00040 g001
Figure 2. Relationship maps for “specialty” claims in online shops and LRd.
Beverages 09 00040 g002
Figure 3. Relationship maps for claims referring to origin and tradition in online shops and LRd.
Beverages 09 00040 g003
Figure 4. Relationship maps for claims referred to ingredients, protein, “naturalness”, “micro-macronutrients” and “plant-based origin” on online shops and LRd.
Beverages 09 00040 g004
Figure 5. Relationship maps for claims referring to “free from nutritional”, “low in”, “health”, and “intolerances/allergies” in online shops and LRd.
Beverages 09 00040 g005
Table 1. Number of Rs, stores, and references for each format selected in the areas analysed for data collection.
Retail FormatFormat CharacteristicsRs/Retail Format (No.)Stores (No.)References (No.)
HypermarketsSurface: >2500 m2; wide assortment of products (food and non-food)47342
SupermarketsSurface: >400 m2; wide assortment of food (especially pre-packaged) or grocery products1225978
Convenience storesSurface: 100–400 m2; proximity service and limited assortment712269
Hard-discount storesSurface: 200–1000 m2; limited product line, usually no branded products. The selected discounters were hard discount stores that also offered branded products514130
Organic supermarketsSpecialized supermarket offering a wide variety of organic products24370
Organic convenience storesConvenience stores where the ranges of products for sale are of organic origin23104
Table 2. Product categories in function of raw materials.
Product Category Raw Materials
1Only oats
2Oat + other (coconut, cocoa, or vanilla)
3Oat + almond
4Only coconut
5Coconut + almond
6Coconut + rice
7Only almond
8Almond + other (cocoa, mint, hazelnut, pistachio, or vanilla)
9Almond + rice or rice and oats
10Only rice
11Rice + other (soy; cocoa; cocoa and hazelnut; cocoa and quinoa; chestnuts; hazelnut; hazelnut and almond and barley; barley; rice and soy; vanilla; or quinoa)
12Only soy
13Soy + other (cocoa; barley and malt; or vanilla)
14Other raw materials (e.g., only chestnuts, only chickpeas, or only walnut, etc.)
15Only hazelnut or hazelnut + other
Table 3. Claims dimensions used in this study and examples for each category.
DimensionsIncluded Claims
Organic certification claims“Organic”, “100% organic soybean”, “from organic farming”
Vegan certification claims“Vegan”
“Lactose-free” claims“naturally lactose-free”, “lactose-free”, “to lactose intolerant”
“Free-from” claims“without colorants or preservatives”, “additive-free”, “no OGM”
“Free-from nutritional” claims“cholesterol-free”, “no added sugar”, “free from hydrogenated fats”
“Italian origin” claims“made in Italy”, “100% Italian almonds”, “spelt grown in Italy”
“Sicilian origin” claims“100% Sicilian fruit”, “11% Sicilian almonds”, “organic farmers in Sicily”
“Not-Italian origin” claims“rice grown in India”, “EU agriculture”, “made in Spain”
“Territoriality and tradition” claims“from our lands in Emilia Romagna”, “Mediterranean beverage”, “Mediterranean almonds”
Claims about protein“high protein content”, “protein source”, “50g protein for 1L”
Claims about the “naturalness” of the product“100% natural ingredients”, “natural”, “100% taste of nature”
Claims about the “plant origin” of the product“100% plant-based”, “all plant”, “with calcium by plant-based origin”
“Micro-macronutrients” claims“source of fibre”, “with vitamin B12”, “source of omega-3”
Claims about ingredients“with brown rice”, “with high oleic sunflower oil”, “with mountain water”
“Low in” claims“low in sugar content”, “low in saturated fat”, “low sodium content”
“Intolerances/allergies” claims“gluten-free”, “without allergens”, “naturally nut-free”
“Health” claims“antioxidant properties”, “linoleic acid, which helps to maintain normal cholesterol levels”
“Certification” claims“Fairtrade”, “sustainable farming methods”, “carbon trust”
“Product quality” claims“pure organic quality”, “produced from selected almonds”
Claims about sustainable packaging“new packaging, 74% from renewable sources”, “new sugarcane cap”, “88% of packaging from renewable sources”
Claims about organoleptic characteristics“milk taste”, “enveloping taste”, “that doesn’t taste like plant-based beverages”
Claims about methods of use“perfect for cappuccino”, “great for breakfast”, “ready to drink”
Table 4. Variables used in the ordered logit regression analysis.
VariableScale
Sales channel type1, LRd
2, online channel
Product type1–15
Packaging materials1, Tetra Pak
2, plastic bottle
3, glass bottle
4, carton box
Organic certification claim1, presence of the claim
0, absence of the claim
Vegan certification claim1, presence of the claim
0, absence of the claim
“Lactose-free” claim1, presence of the claim
0, absence of the claim
“Free-from” claims1, presence of the claim
0, absence of the claim
“Sicilian origin” claim1, presence of the claim
0, absence of the claim
“Italian origin” claim1, presence of the claim
0, absence of the claim
“Territoriality and tradition” claims1, presence of the claim
0, absence of the claim
Claims about certifications1, presence of the claim
0, absence of the claim
“Health” claims1, presence of the claim
0, absence of the claim
Table 5. Raw materials that compose each product type and number of references per category.
Category TypeReferences (No.)Frequency out of the Total (%)
Only soy66925%
Only oats43416%
Only rice42716%
Only almond40115%
Other raw materials (e.g., only chestnuts, only chickpeas, or only walnut, etc.)1345%
Coconut + rice944%
Soy + other 2944%
Only coconut833%
Almond + rice or rice and oats883%
Rice + other 1863%
Only hazelnut or hazelnut + other632%
Oat + other (coconut, cocoa, or vanilla)221%
Oat + almond 291%
Coconut + almond141%
Almond + other 3161%
1 The other possible raw materials combined with soy could be (in different mixtures): cocoa; barley and malt; or vanilla. 2 The other possible raw materials combined with rice could be (in different mixtures): soy or cocoa; cocoa and hazelnuts; cocoa and quinoa; chestnuts; hazelnut; hazelnut and almond and barley; barley; rice and soy; vanilla; or quinoa; 3 The other possible raw materials combined with almonds could be (in different mixtures): cocoa, mint, hazelnut, pistachio, or vanilla).
Table 6. Adepth differences in PPB categories between the two distribution channels (LRd and online).
Category TypeDistribution ChannelX-Squaredp-Value
LRdShop Online
Only oats365 (17%)69 (15%)0.829n.s
Oat + other (coconut, cocoa, or vanilla)20 (1%)2 (0.4%)1.069n.s
Oat + almond22 (1%)7 (2%)0.922n.s
Only coconut71 (3%)12 (3%)0.521n.s
Coconut + almond12 (1%)2 (0.4%)0.96n.s
Coconut + rice78 (4%)16 (4%)0.010n.s
Only almond305 (14%)96 (21%)13.989***
Almond + other 18 (0.4%)8 (2%)11.885***
Almond + rice or rice and oats74 (3%)13 (3%)0.382n.s
Only rice349 (16%)78 (17%)0.257n.s
Rice + other 267 (3%)19 (4%)1.353n.s
Only soy578 (26%)91 (20%)9.038**
Soy + other 374 (3%)20 (4%)1.011n.s
Other raw materials (e.g., only chestnuts, only chickpeas, or only walnut, etc.)113 (5%)21 (5%)0.298n.s
Only hazelnut or hazelnut + other55 (3%)8 (2%)0.998n.s
The p-value refers to the statistical significance level: *** <0.001, ** <0.01, n.s. not significant. 1 The other possible raw materials combined with almonds could be (in different mixtures): cocoa or mint, hazelnut, pistachio, or vanilla. 2 The other possible raw materials combined with rice could be (in different mixtures): soy; cocoa; cocoa and hazelnuts; cocoa and quinoa; chestnuts; hazelnut; hazelnut and almond and barley; barley; rice and soy; vanilla; or quinoa); 3 The other possible raw materials combined with soy could be (in different mixtures): cocoa; barley and malt; or vanilla).
Table 7. Differences in the number of references (Adepth), between online and direct distribution channels, considering each brand sub-category.
Sub-CategoriesDistribution ChannelX-Squaredp-Value
LRdShop Online
LB1697 (78%)243 (53%)119.946***
OB161 (7%)115 (25%)125.985***
DB333 (15%)104 (23%)14.828***
The p-value refers to the statistical significance level: *** <0.001.
Table 8. Difference in the number of references (Adepth), between online and direct distribution channels, considering each specialty sub-category.
Sub-CategoriesDistribution ChannelX-Squaredp-Value
LRdShop Online
Organic1076 (49%)291 (63%)29.417***
Vegan473 (22%)152 (33%)27.112***
Lactose-free1044 (48%)171 (37%)17.389***
“Free from”1620 (74%)354 (77%)1.444n.s.
The p-value refers to the statistical significance level: *** <0.001, n.s. not significant.
Table 9. Differences in the number of references (Adepth), between online and direct distribution channels, considering each specialty sub-category in online and direct distribution channels.
Sub-CategoriesDistribution ChannelX-Squaredp-Value
LRdShop Online
Tetra Pak2062 (94%)414 (90%)12.419***
Plastic bottle117 (5%)6 (1%)14.094***
Glass bottle12 (1%)35 (8%)108.298***
Carton box0 (0%)7 (2%)33.285***
The p-value refers to the statistical significance level: *** <0.001.
Table 10. Differences in the number of references (Adepth) for each sub-category obtained by the origin claims dimension in online and direct distribution channels.
Sub-Category Distribution ChannelX-Squaredp-Value
LRdShop Online
Sicilian origin27 (1%)29 (6%)46.994***
Italian origin1081 (50%)210 (45%)2.151n.s
Non-Italian origin71 (3%)34 (7%)17.028***
Territoriality and tradition160 (7%)15 (3%)10.187**
The p-value refers to the statistical significance level: *** <0.001, ** <0.01, n.s. not significant.
Table 11. Ordered logit model results.
VariableCoefficientStd. Errorp-Value95% Confidence Interval
Product type−0.0310.008***−0.048 to −0.015
Packaging materials0.5950.148***0.305 to 0.885
Biological certification claims−0.2310.102*−0.431 to −0.032
Vegan certification claims−0.2460.093**−0.429 to −0.063
“Lactose-free” claims−0.7690.097***−0.960 to −0.579
“Sicilian origin” claims3.6260.371***2.899 to 4.352
“Italian origin” claims0.1850.086*0.016 to 0.354
“Territoriality and tradition” claims0.3110.143*0.032 to 0.591
Claims about certifications0.6360.212**0.219 to 1.052
“Health claims”−0.6590.248**−1.145 to −0.173
“Free from” claims0.0560.907n.s.−0.121 to 0.234
Sales channel type0.1850.119n.s.−0.048 to 0.417
The p-value refers to the statistical significance level: *** <0.001, ** <0.01, * <0.05, n.s. not significant.
Disclaimer/Publisher’s Note: The statements, opinions and data contained in all publications are solely those of the individual author(s) and contributor(s) and not of MDPI and/or the editor(s). MDPI and/or the editor(s) disclaim responsibility for any injury to people or property resulting from any ideas, methods, instructions or products referred to in the content.

