Article

Changes in Polyphenols and Anthocyanin Pigments during Ripening of Vitis vinifera cv Maratheftiko: A Two-Year Study

by
Kosmas Roufas
,
Theodoros Chatzimitakos
,
Vassilis Athanasiadis
,
Stavros I. Lalas
and
Dimitris P. Makris
*
Department of Food Science & Nutrition, School of Agricultural Sciences, University of Thessaly, N. Temponera Street, 43100 Karditsa, Greece
*
Author to whom correspondence should be addressed.
Beverages 2023, 9(2), 39; https://doi.org/10.3390/beverages9020039
Submission received: 16 February 2023 / Revised: 11 April 2023 / Accepted: 18 April 2023 / Published: 1 May 2023
(This article belongs to the Section Quality, Nutrition, and Chemistry of Beverages)

Abstract

:
The vineyard of Cyprus is comprised largely of native Vitis vinifera varieties, which are rather underexploited with regard to wine production to date. Although empirical observations concur that several of these varieties may possess a high potential for the production of quality wines, analytical data pertaining to their polyphenolic composition are scarce. This study was undertaken with the aim of providing a detailed picture of the evolution patterns of several important polyphenolic constituents during the last stages of ripening of Maratheftiko, which is one of the major native grape varieties. This study included monitoring of representative simple phenolics, flavonoids and anthocyanin pigments for two consecutive years, 2021 and 2022, to obtain a more integrated portrayal of changes occurring during the critical period prior to harvest. It was revealed that there was a very high difference in the content of almost all polyphenols considered for the harvests in 2021 and 2022. The grapes harvested in 2022 had a much higher content in catechin, but most importantly, the content in total anthocyanins was 3.91-fold higher in 2022 compared to 2021. On the other hand, trans-resveratrol was the only polyphenolic metabolite whose difference was rather marginal. In seeds, the predominant substance was catechin, which displayed pronounced fluctuations during the period examined. It was concluded that the contents of major polyphenolic metabolites in Maratheftiko grapes might exhibit large variations during the period prior to harvest, most possibly reflecting differences in the average temperature and rainfall. Thus, tight monitoring of technologically important constituents, e.g., anthocyanins, is recommended to ensure the harvest of grapes with optimal maturity.

1. Introduction

Winemaking is a neuralgic sector of the agri-food economy for many countries around the globe, and a large number of Vitis vinifera varieties are currently used to produce a wide range of wines. Although the characteristics of wines may be fundamentally affected by the vinification technology implemented, the selection of grape variety is also of utmost importance in winemaking since it largely defines the style of the wine(s) produced, and the overall quality of the final product. Polyphenols are a prominent family of non-volatile compounds in grapes, exhibiting a high heterogeneity with regard to composition, which may include simple phenolics (mostly phenolic acids), flavonoids, tannins, anthocyanin pigments and stilbenes. Phenolic compounds play key roles in the sensorial properties of wines, affecting their flavor, color, astringency and bitterness [1,2]. Furthermore, polyphenols are the major bioactive substances of wines, to which a large spectrum of activities have been attributed, including antioxidant, anti-inflammatory, cardioprotective and chemopreventive properties [3,4].
From a technological point of view, knowledge on the polyphenolic composition is of paramount significance because the quality of wines is tightly correlated with the polyphenolic profile of the grapes used. Wine quality is profoundly influenced by the harvest time, which is dictated by the technological maturity of the grapes being harvested. Characterization of technological maturity is mainly based on the sugar content and the titratable acidity, but it also includes polyphenolic indices to ascertain the “phenolic maturity” of grapes. Phenolic maturity may be appraised by the total polyphenol and total anthocyanin contents, which are highly associated with the maturity stage of the grape berries and may significantly contribute to the decision regarding the harvest date [5]. The pigment (anthocyanin) profile and other major polyphenolic constituents, such as caftaric acid and catechin, may be good indicators of phenolic maturity, since their fluctuations in the skins and seeds may reflect important changes in the ripening process [6]. Furthermore, several major and minor polyphenolic phytochemicals have been used in discrimination studies, with outstanding outcomes [7,8,9].
The polyphenolic composition of grapes is not only influenced by genetic (varietal) factors but also by the location of the vineyard, environmental conditions, cultivation practices, as well as the growing season [10]. During ripening, grape berries may undergo pronounced modifications in composition, and the last stages (weeks) of maturation are particularly important because, during this period, the changes in polyphenolic pattern assume a critical role. Regarding anthocyanins, it is of undisputed importance to identify whether harvesting is to be performed at a point when the anthocyanin content has reached high levels to ensure the production of wines with intense and long-lasting color attributes, which is a key issue in barrel aging.
The Cypriot vineyard embraces several native varieties, whose enological potential is rather unknown due to a lack of analytical data pertaining to both non-volatile and volatile profiles of the grapes grown there. The variety Maratheftiko, in particular, is a variety empirically acknowledged for its quality, but, to date, no studies have been performed to examine its ripening behavior and polyphenolic composition at harvest. The current investigation’s objective was to provide information on the course of polyphenol profile development during the last days of grape ripening over a two-year period. This was accomplished by separately assaying polyphenol evolution in the skins and seeds. To the best of the authors’ knowledge, this is the first study on the Maratheftiko variety ever performed and provides unprecedented information, which could be of high value to stakeholders, particularly to grape growers and winemakers.

2. Materials and Methods

2.1. Chemicals and Reagents

Folin–Ciocalteu reagent, catechin (>98%), trans-caffeic acid (≥98%), trans-resveratrol (>99%), cyanin chloride (≥90%), quercetin 3-O-glucuronide (≥95%) and rutin (quercetin 3-O-rutinoside) (>94%) were obtained from Sigma-Aldrich (Darmstadt, Germany). Anhydrous sodium carbonate (99%) was obtained from Penta (Praha, Czechia). Formic acid (99%) was obtained from Carlo Erba (Milan, Italy). All solvents used for chromatography were HPLC grade.

2.2. Vineyard Location and Sampling

Vitis vinifera cv. Maratheftiko grapes were collected from a non-irrigated vineyard located in the Limassol District (Omodos area), Cyprus (32.80° Ε, 34.86° Ν), at an altitude of 944 m, during the period from 12 September to 30 October in 2021 and 2022. According to the Cyprus Meteorological Station, this period in 2021 was characterized by temperatures of up to 26.5 °C, whereas the average temperature in 2022 was 29–30 °C. Furthermore, in 2021, during 16–31 October, the weather was unstable with increased frequency of sporadic rainfalls and thunderstorms. The vineyard has a total surface of 0.51 hectares, and it is planted exclusively with Maratheftiko. Sampling was accomplished by randomly collecting 200 berries from 200 different plants, from various sites of the vineyard and from various clusters and positions on the clusters (sun-exposed and shaded) to ensure a homogeneous gross sample as much as possible. Upon collection, the berries were randomly divided into two lots of 100 g and immediately frozen at −18 °C, until being analyzed.

2.3. Enological Analyses

The sugar content, titratable acidity (expressed as tartaric acid equivalents), and Folin–Ciocalteu index were determined according to the OIV International Oenological Codex.

2.4. Skin Extraction

Modification of a methodology previously described in [11] was used. A lot of 10 g of deseeded fresh red grapes was homogenized with 50 mL of the solvent (1% HCl in methanol) in an Ultra-Turrax T25 High-Speed Homogenizer (IKA Labortechnik, Staufen, Germany) at 5000 rounds/min, for 3 min, and then an additional volume of 50 mL of the solvent was added. The mixture was sonicated in an Elma S 100 (H) heated ultrasonic bath (Elma Schmidbauer GmbH, Singen, Germany) at a frequency of 37 Hz for 5 min (in pulse mode), and then it was extracted for 3 h under stirring. The liquid was collected, and the solid material was re-extracted with 50 mL of the solvent for 15 min. The liquid phases were combined, centrifuged at 4000 rpm for 5 min, filtered through paper, and evaporated to dryness in a rotary evaporator. The solid residue was reconstituted in 10 mL of deionized water, transferred to 2 mL Eppendorf tubes, and centrifuged at 10,000 rpm for 5 min. The supernatant was finally combined and filtered through a 0.45 μm PVDF syringe filter. An aliquot of 2.5 mL of this aqueous solution was loaded onto a Sep-Pak C18 cartridge, which was preconditioned with 2 mL of MeOH and 5 mL of water. The cartridge was washed with 5 mL of deionized water to remove sugars, and then successively with 5 mL of MeOH containing 1% formic acid and 5 mL of ethyl acetate to remove less polar compounds. The methanolic and ethyl acetate extracts were combined, evaporated to dryness in a rotary evaporator, and dissolved in a final volume of 5 mL of MeOH containing 1% formic acid.

2.5. Seed Extraction

A protocol reported in [12] was employed, with some modifications. The grape seeds after sampling were freeze dried, grounded, and defatted using 20 mL per g of n-hexane under stirring for 30 min. The liquid was filtered through paper, and the solid material was collected and extracted with 15 mL of ethyl acetate for 90 min under stirring, at 300 rpm. The liquid was then collected, and the solid material was re-extracted with 10 mL of the solvent by handshaking. The liquid phases were combined and centrifuged at 4000 rpm for 5 min, filtrated through paper, and evaporated to dryness in a rotary evaporator. The solid residue was reconstituted in 5 mL of MeOH containing 0.5% formic acid and filtered through a 0.45 μm PVDF syringe filter.

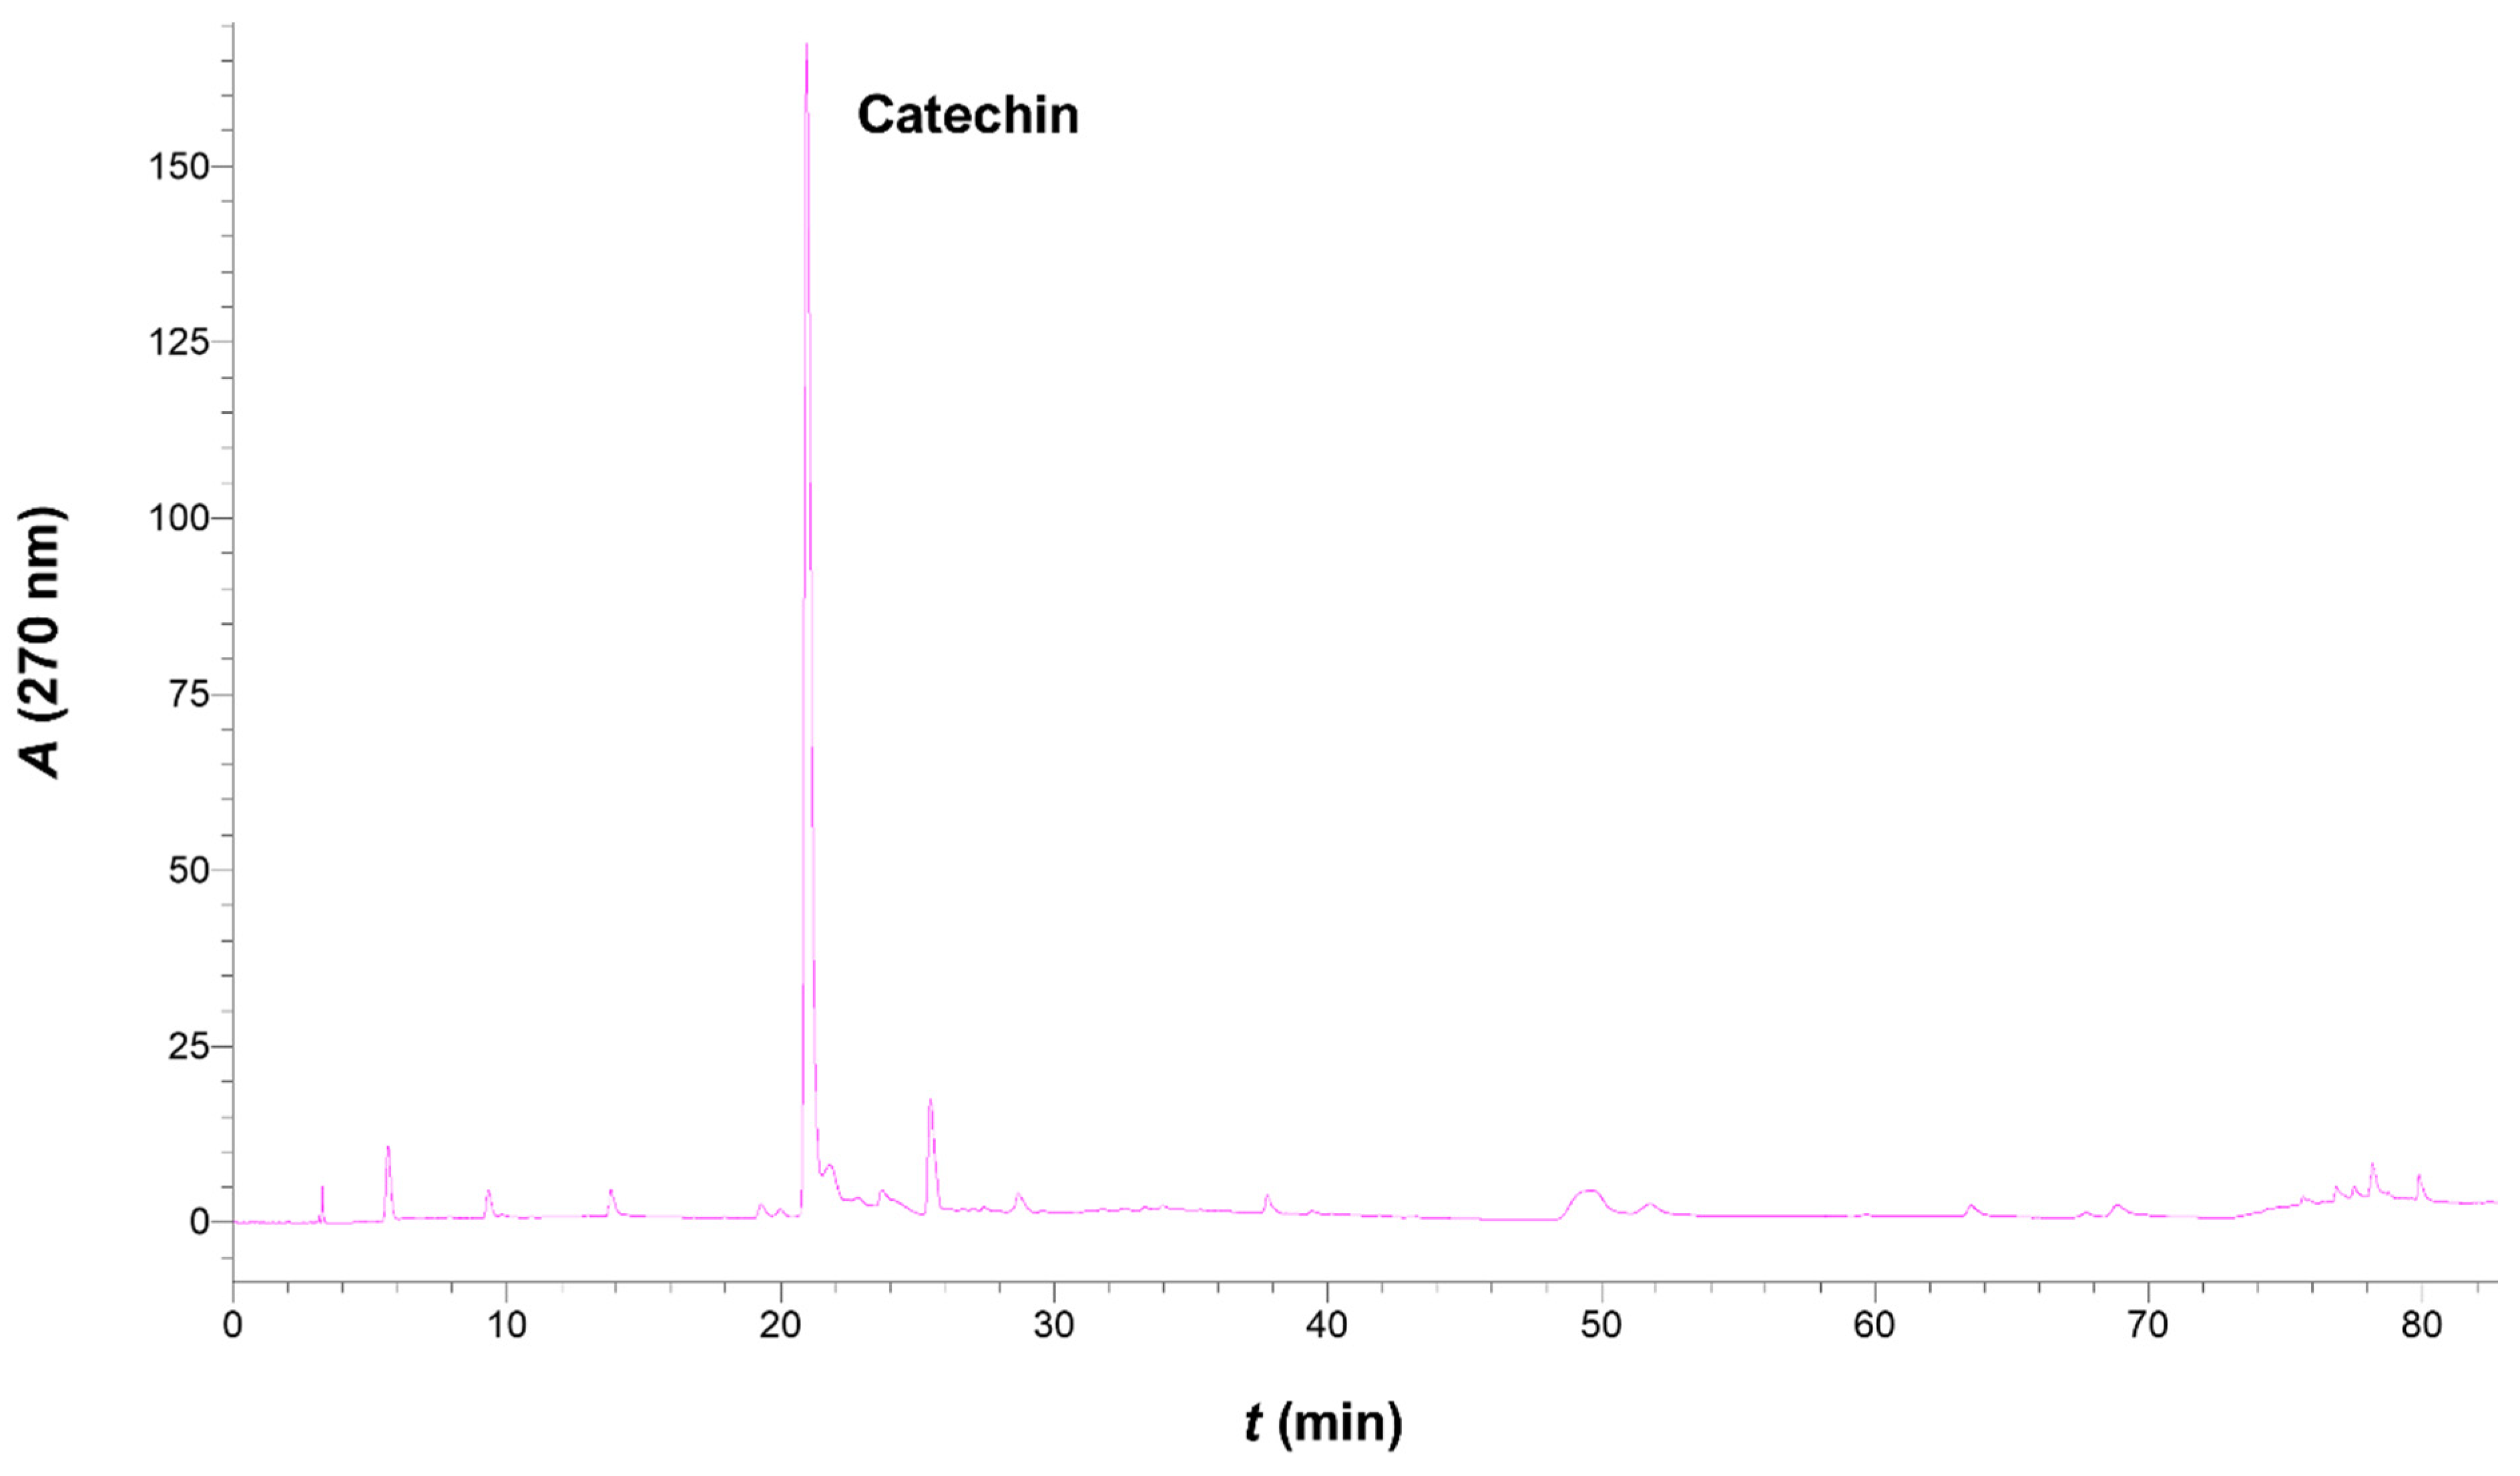
2.6. Chromatographic Analyses

Liquid chromatography–diode array–mass spectrometric (LC-DAD-MS) determinations were carried out to tentatively identify certain polyphenolic metabolites detected in the skin extracts. In particular, a previously reported methodology was implemented to identify trans-caftaric acid [13], using electrospray ionization in the negative mode. Likewise, another methodology was employed to identify major anthocyanin pigments, using electrospray ionization in the positive mode [14]. For quantitative analyses, the chromatographic equipment and settings deployed were those reported analytically in a previous study [15]. For catechin, trans-resveratrol, quercetin 3-O-glucuronide and rutin, quantification was accomplished with an external standard, using the calibrations curves established with the solutions with concentrations varying from 0 to 50 μg mL−1. trans-Caftaric acid was quantified as caffeic acid, while all anthocyanin pigments were quantified as cyanin chloride. In all cases, the calibration curves have a square correlation coefficient (R2) > 0.999. Standard solutions were prepared in HPLC-grade methanol shortly before the analyses.

2.7. Statistical Handling

For both skins and seeds, extractions were carried out on duplicate samples, and each extract was analyzed in triplicate. The values reported are the means ± standard deviations (sd) of the data sets (two lots sampled in the field) and the three repeated HPLC injections. Linear regressions (calibration curves) were established using SigmaPlot™ 12.5 (Systat Software Inc., San Jose, CA, USA). Distribution analyses, at least at a 95% significance level, were accomplished using JMP™ Pro 15 (SAS, Cary, NC, USA). All other statistical analyses were performed using Excel™ 16.0.

3. Results and Discussion

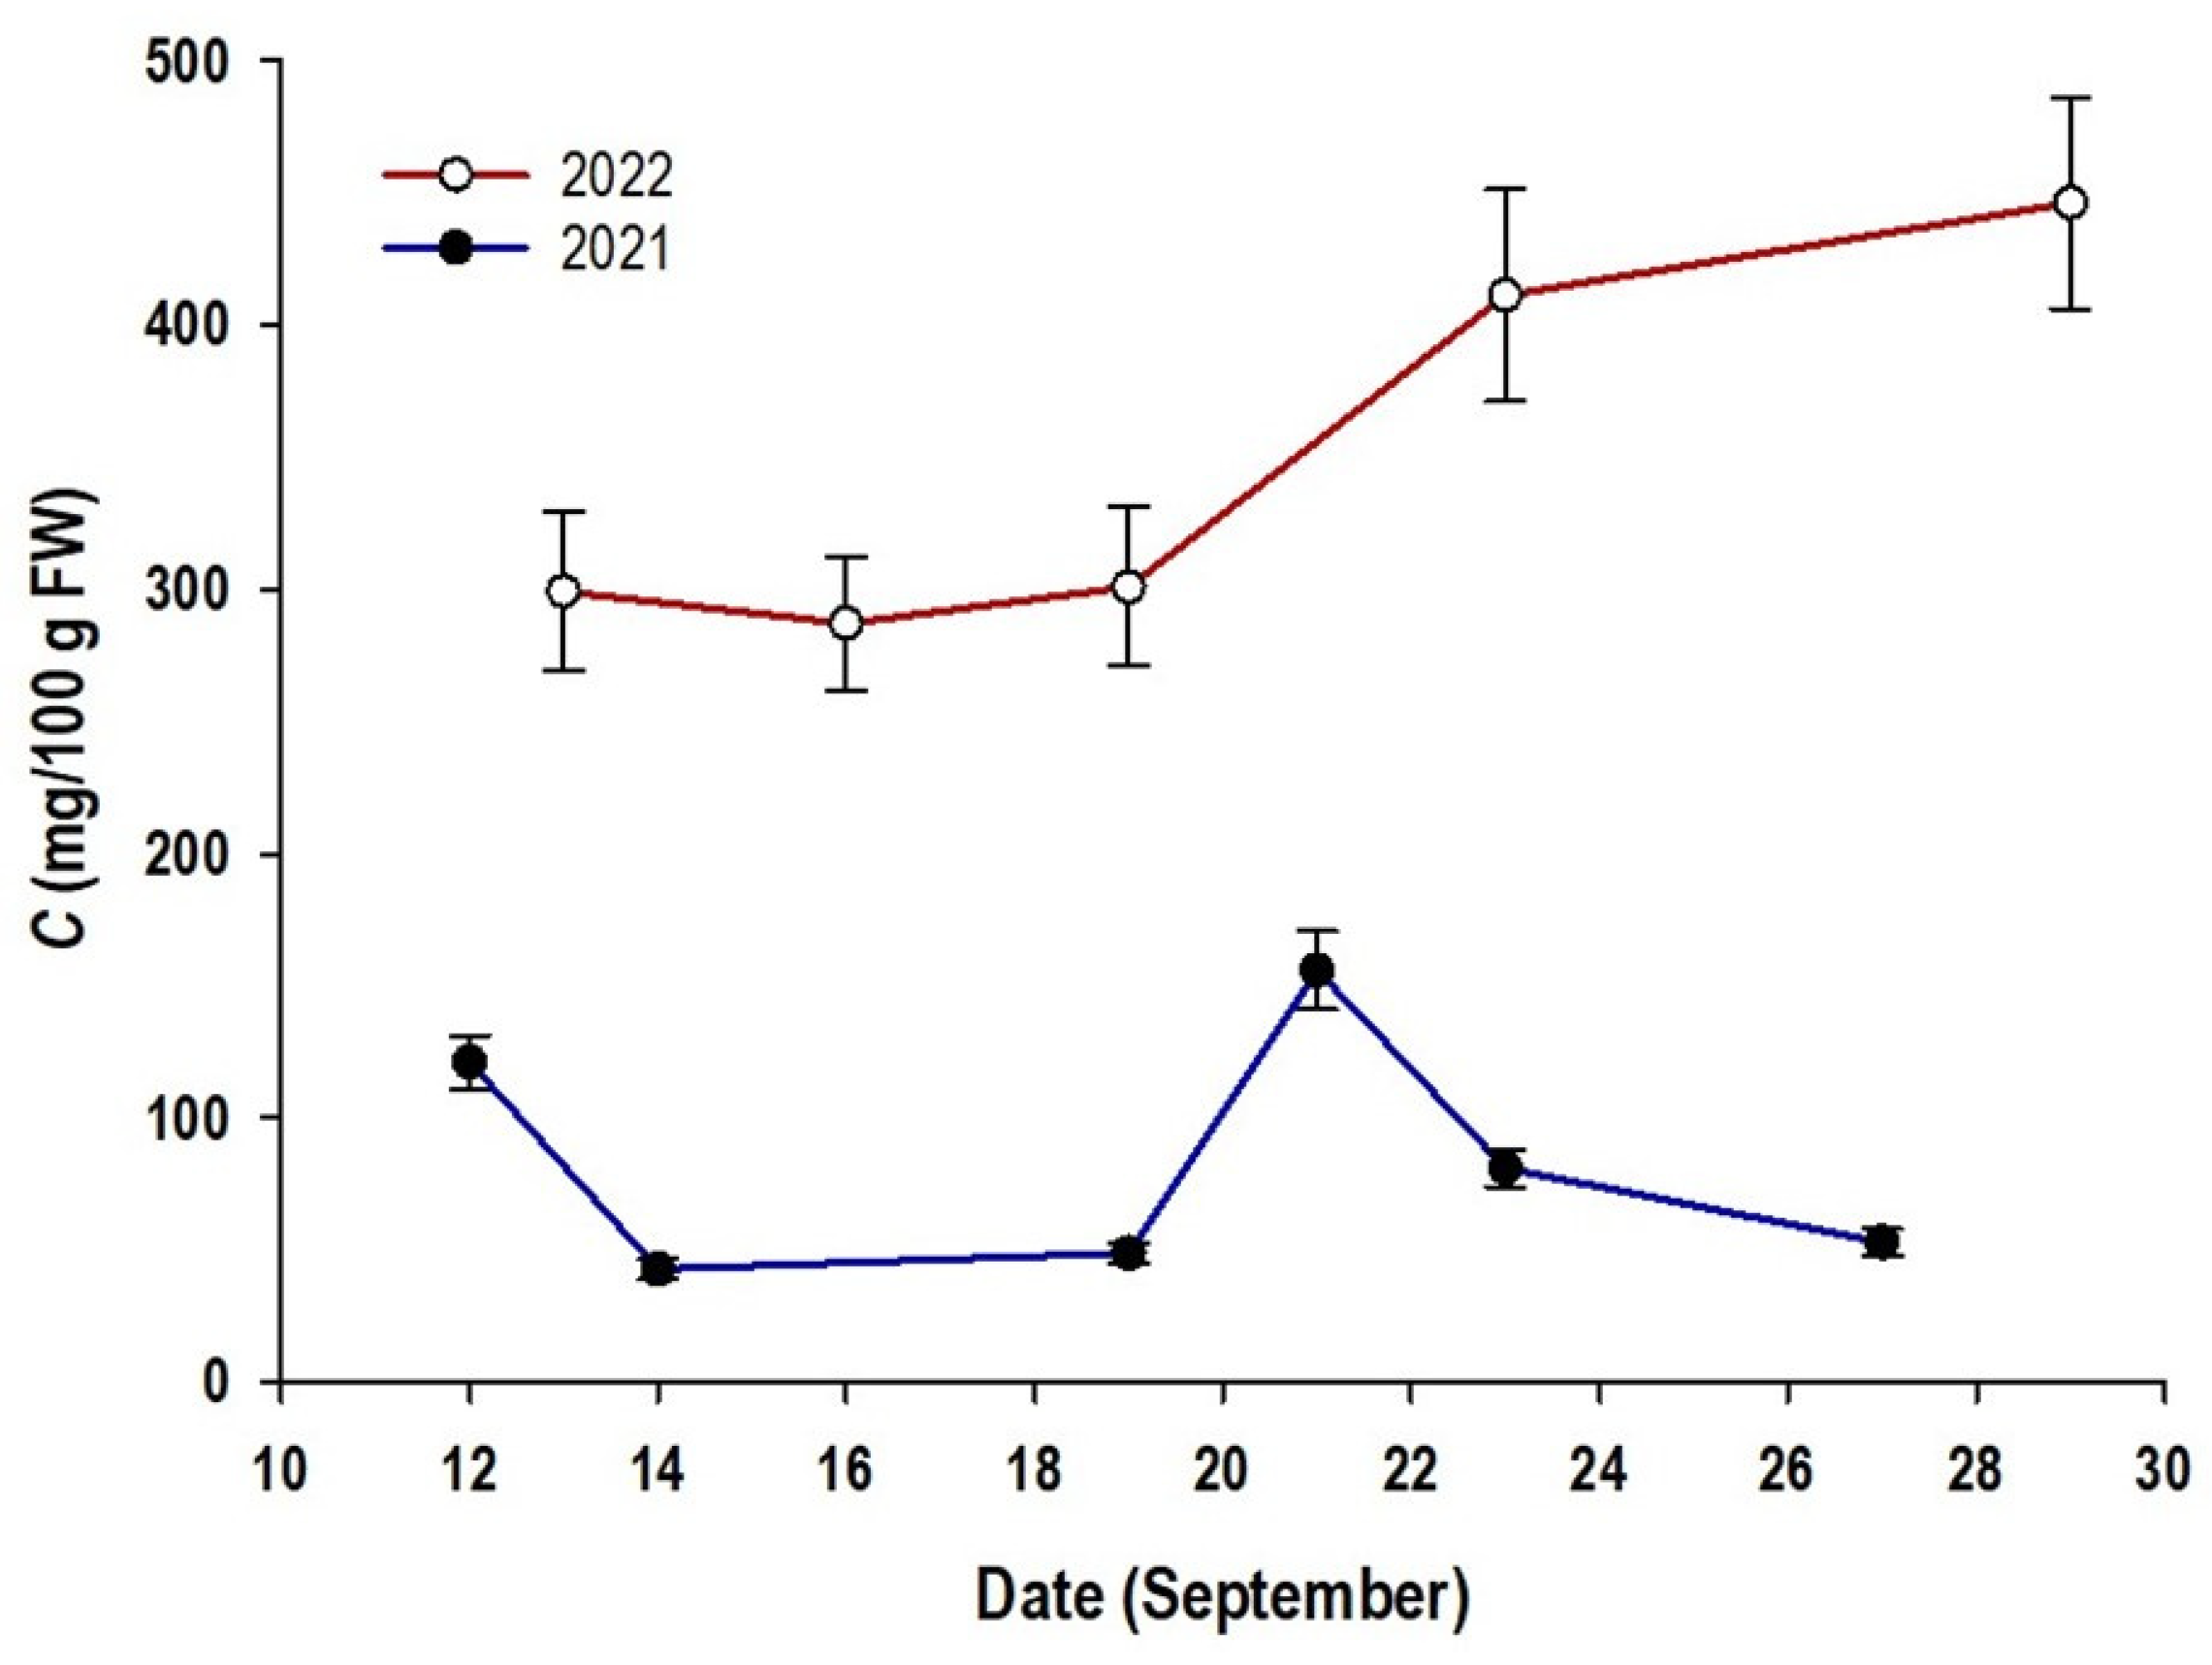
3.1. Sugar, Acidity and Total Polyphenol Indices

Figure 1A shows the evolution of sugar concentration during the last two weeks of Maratheftiko ripening over the two consecutive years of 2021 and 2022. At mid-September in 2021, where grape sampling was initiated, the sugar content did not exceed 190 g L−1. At harvesting (27/9), the sugar concentration mounted up to 226 g L−1. Likewise, in 2022, the sugar concentration was just below 190 g L−1 on the 13th of September, but at harvest (29/9), it rose up to 242 g L−1. This level increased by 6.6% compared to that attained in 2021.
With regard to acidity, there was a rather slow evolution in 2021 from the 12th to 21st of September, but a rapid decline was observed from the 21st until harvest (Figure 1B). Overall, the acidity level dropped from 8.9 to 6.0 g L−1, expressed as tartaric acid. In 2022, the changes recorded were less pronounced, and during the testing period, the acidity level dropped from 7.5 g L−1 at the beginning of sampling to 6.2 g L−1 at harvest.
Both the sugar content and acidity of grape berries undergo significant changes post-veraison, but near harvesting, a stabilizing tendency is usually observed. However, both indices may be subject to fluctuations as a response to climatic conditions and cultivation practices [16]. These fluctuations may impact wine quality to an important degree, affecting the final alcohol content and the overall sensorial properties. As shown in Figure 1A, Maratheftiko grapes displayed a rather significant difference in the sugar content between the 2021 and 2022 harvests, which highlights the influence of climatic conditions during the last stages of ripening. Considering the climatic conditions described in Section 2.2, the instability of the weather during the last 15 days of October, and possibly the lower average temperature recorded during that time, compared to 2022, might have contributed to the lower sugar and polyphenol accumulations. On the other hand, although there was also an important difference during ripening, the grapes had virtually the same acidity at harvest. This finding indicates that acidity at maturity may not be as profoundly affected as sugar content, and its fluctuations may lie within rather narrow limits.
For the year 2021, the evolution of total polyphenols during the study period varied from 29 (12/9) to up to 39 (19–21/9), but at harvest, it declined to 34 (Figure 1C). In 2022, total polyphenols reached a maximum of 51 at 16/9, and at harvest, there was a trivial decrease to 49. In a recent study on Italian and international varieties, the Folin–Ciocalteu index was found to vary from 6.8 to 16.3 [17]. Other authors reported levels up to 43.1 [18]. Based on these values, it would appear that Maratheftiko is a variety particularly rich in polyphenols; however, undisputedly, there was a very large difference in total polyphenol content at harvest between 2021 and 2022 (p < 0.05). Such a difference most likely reflected variations in climatic conditions that affected grape ripening since seasonal variations, such as drought and high temperatures, might significantly impact polyphenol accumulation at harvest [15].

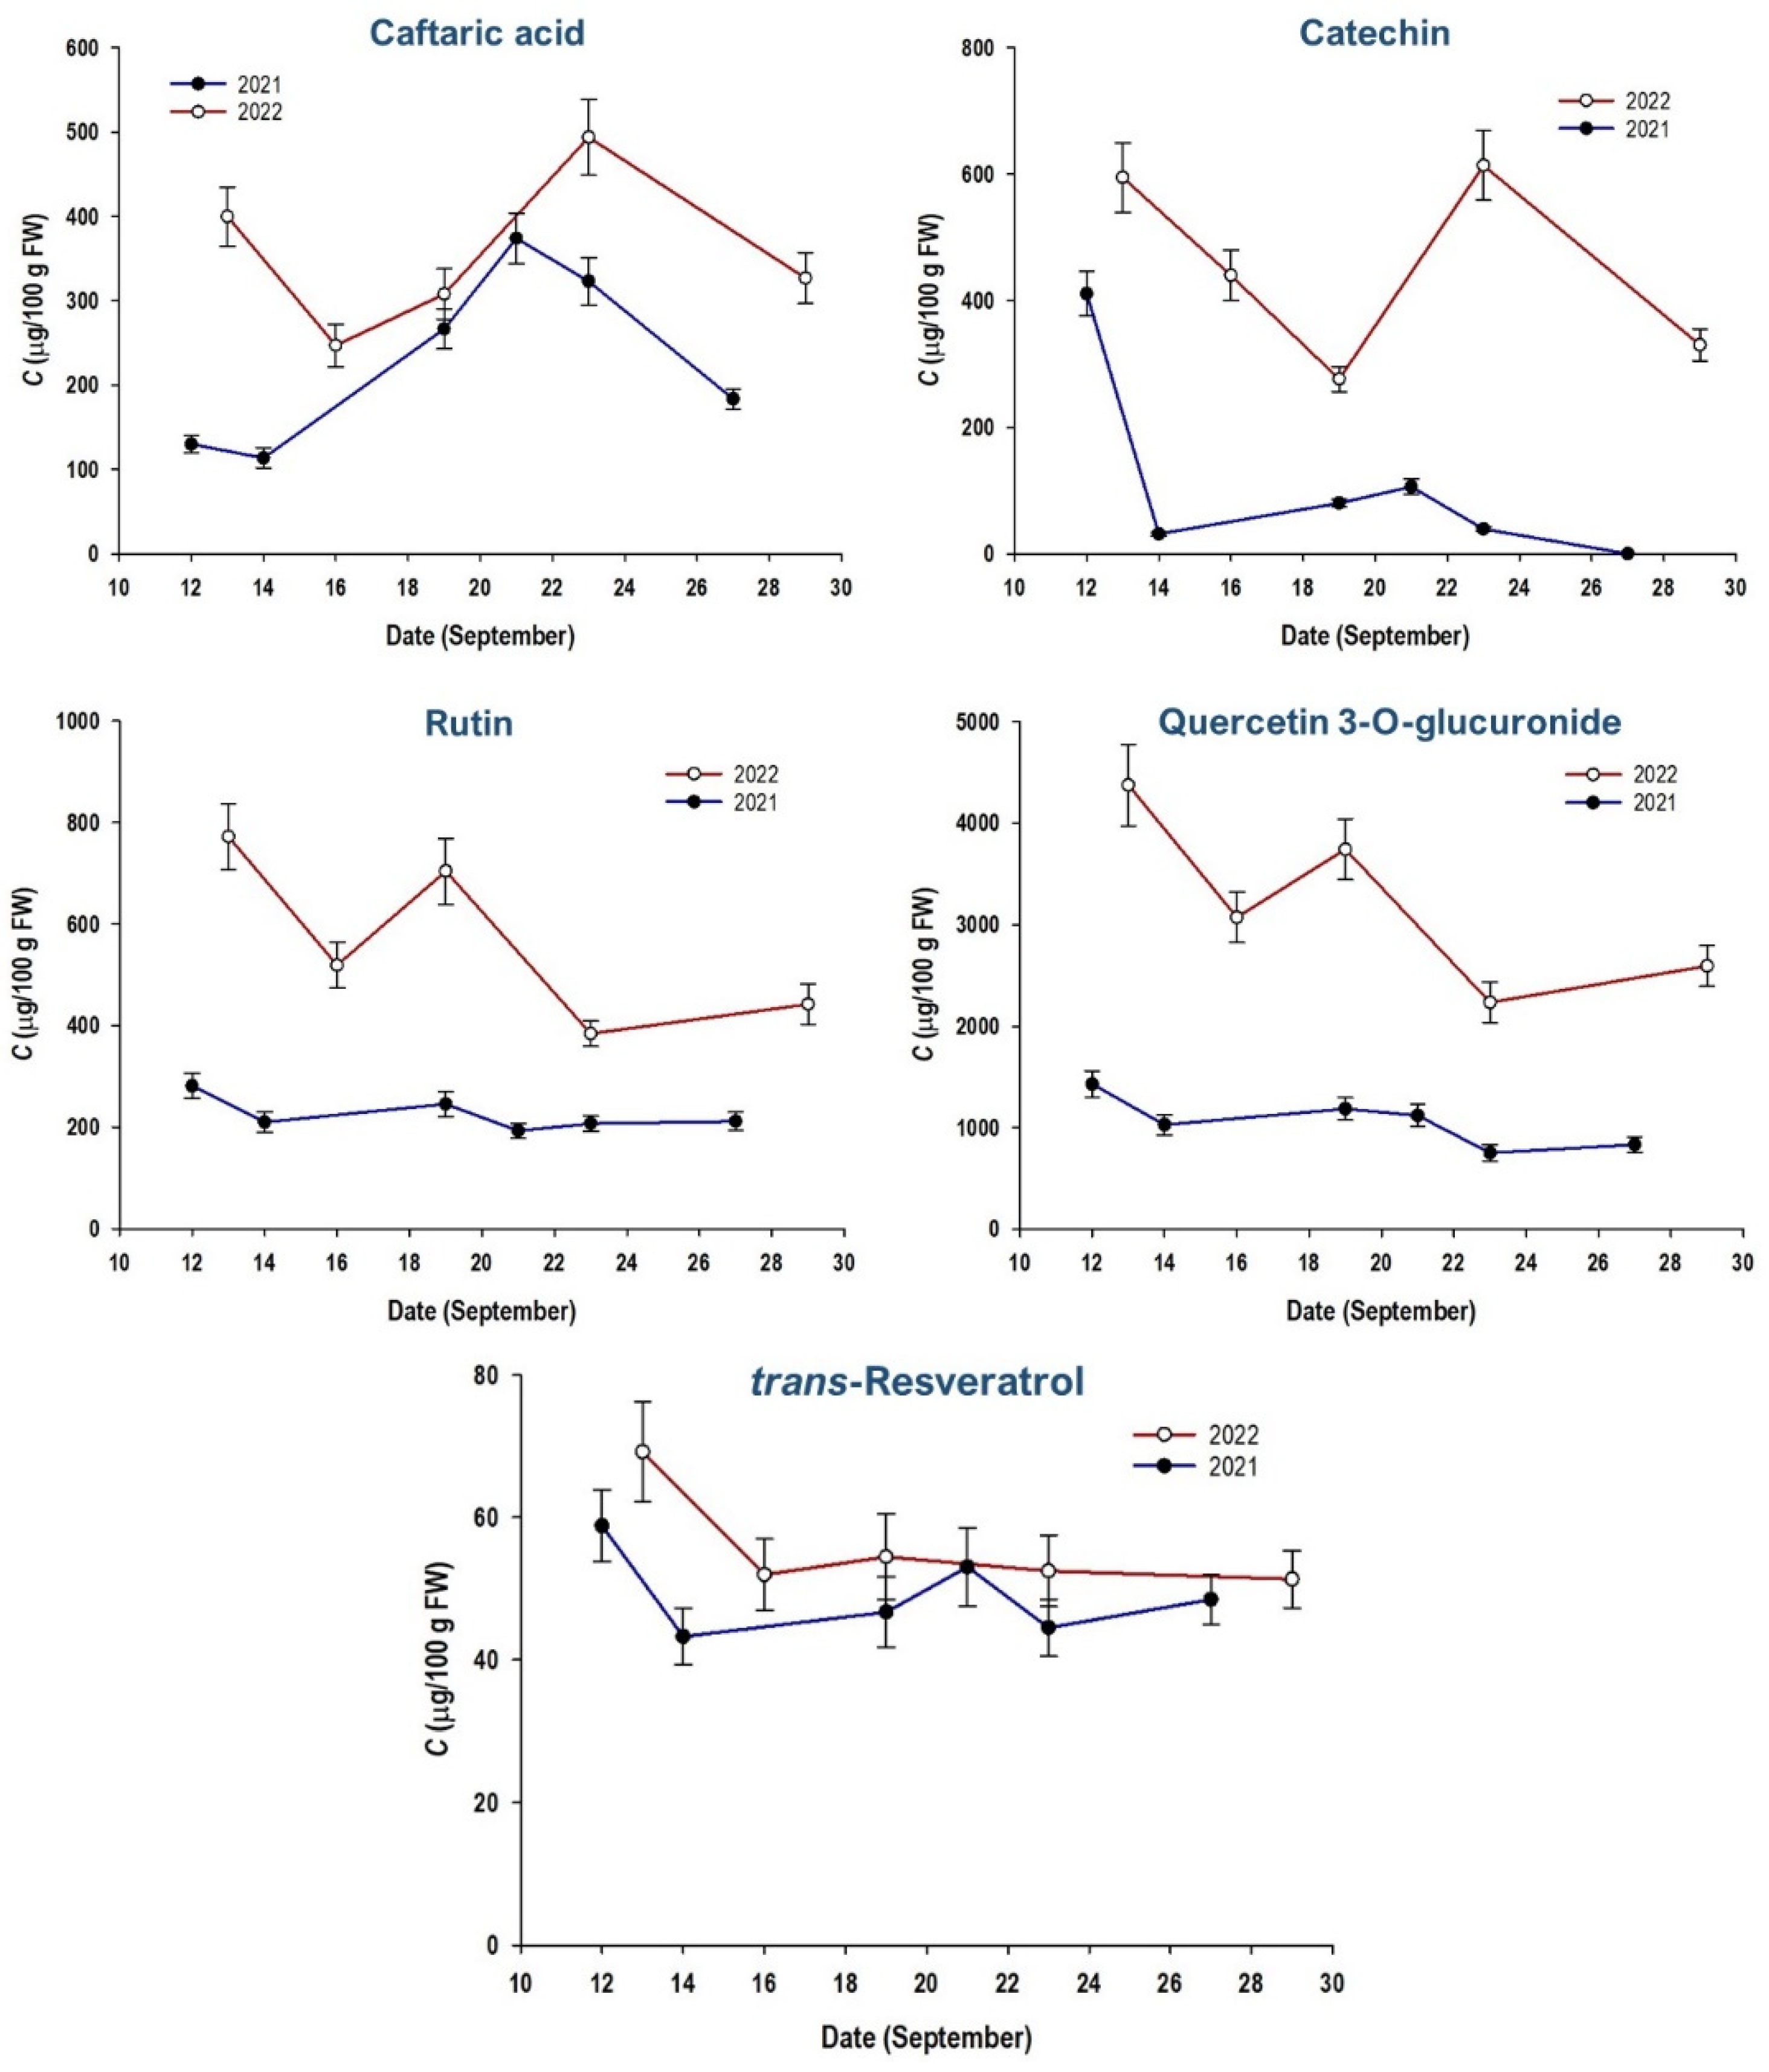
3.2. Non-Anthocyanin Polyphenols

The examination of the evolution of polyphenolic composition included selected polyphenols from the major classes occurring in grapes, such as trans-caftaric acid (a major phenolic acid), catechin (a major flavanol), rutin and quercetin 3-O-glucuronide (major flavonols), and trans-resveratrol (a major stilbene) [19]. All these compounds were considered to provide a more integrated picture regarding polyphenolic metabolism in grapes during the last stages of ripening.
trans-Caftaric acid in the extracts examined was tentatively identified by its molecular ion at m/z = 311 (negative ionization mode) [13]. Its evolution in 2021 was characterized by an increase from 129.90 μg/100 g FW (12/9) to 374.10 μg/100 g FW after almost 10 days (21/9). Thereafter, a declining course was recorded, and the content at harvest was 183.58 μg/100 g FW (Figure 2).
In a similar manner, in the following year, trans-caftaric acid content rose from 400.07 μg/100 g FW (13/9) to 494.44 μg/100 g FW within 10 days and dropped to 327.02 μg/100 g FW at harvest. This finding manifested a very similar pattern of evolution in both years, but there was a very high difference in content, which, at harvest, was almost 56% (p < 0.05).
Previous studies indicated that hydroxycinnamates exhibit a gradual decline when it is closer to harvest [20]. However, it has been demonstrated that hydroxycinnamates, such as trans-caftaric acid, usually display a peak in their content prior to veraison, whereas as the berries ripen, they exhibit a stabilizing tendency [5]. This has been shown for five different Vitis genotypes during ripening [21]. The findings of other studies are in concurrence, with one study reporting trans-caftaric acid in Tannat grapes to reach a level of 620 μg/100 g FW ten days before harvest, and 690 μg/100 g FW at harvest [22]. However, more recent studies have indicated that there may be significant variations in hydroxycinnamate content in grapes near harvest [23].
The year-to-year variations in catechin were much more pronounced; its content at harvest was practically undetectable in 2021, but in 2022, its content was 329.86 μg/100 g FW. The evolution pattern seen for catechin was similar to that observed for trans-caftaric acid, which was also consistent with previous investigations that demonstrated catechin levels to be 550 μg/100 g FW around 10 days before harvest, but they dropped to 440 μg/100 g FW at harvest [22]. Furthermore, large year-to-year variations have been seen for other flavanol monomers (epicatechin and gallate derivatives), where a decline close to harvesting has also been recorded [23]. The results on V. vinifera cv. Merlot, Tannat and Syrah [24], and Hutai No 8 [25] were in accordance with such a pattern.
With reference to the two flavonols considered, rutin and quercetin 3-O-glucuronide, the pattern of evolution was identical for both compounds and for both years of study. However, in this case as well, the grapes harvested in 2022 were far richer compared to those from the 2021 harvest. More specifically, the rutin content at harvest in 2021 was 211.38 μg/100 g FW, whereas the corresponding level in 2022 was 441.86 μg/100 g. Likewise, the content of quercetin 3-O-glucuronide at harvest in 2021 was 832.75 μg/100 g FW, and in 2022, it was 2594.42 μg/100 g FW. Based on the data available in the literature, flavonol evolution does not display any specific pattern during ripening. In an examination of five different grape genotypes, myricetin 3-O-glucoside increased more than 5-fold, but for quercetin 3-O-glucoside and quercetin 3-O-glucuronide, the results were rather contradictory, with important differences seen among the varieties tested [21]. Likewise, for grapes from various V. vinifera varieties, it was observed that although myricetin 3-O-glucuronide might exhibit a significant increase when closer to harvesting, quercetin 3-O-glucuronide might show a gradual decline [26]. The outcome from another study on V. vinifera cv. Nebbiolo also concurred with such a behavior [27]. By contrast, other investigations on V. vinifera cv. Tannat showed that there was a constant increase for several flavonols during the last stages of ripening [22,25]. On the other hand, for Merlot, Tannat and Syrah grapes, a decline was seen for flavonols from veraison to maturity [24].
As opposed to the aforementioned metabolites, trans-resveratrol displayed a diversified pattern, and its evolution during ripening in 2021 and 2022 exhibited no large differences. In 2021, the content of this stilbenic compound was 58.83 μg/100 g FW at the beginning of the study period, and at harvest, the level dropped to 48.49 μg/100 g FW. In 2022, trans-resveratrol evolution closely paralleled that of 2021, declining from 69.23 μg/100 g FW at the beginning of the study to 51.32 μg/100 g FW at harvest. It has been shown that trans-resveratrol drops significantly during ripening, but stabilizing tendencies are observed close to harvest [28]. Yet, contradictory results have also been reported, showing a significant increase in trans-resveratrol from veraison to harvest [24,29]. On the other hand, more recent studies have demonstrated that, although trans-resveratrol content may decline toward harvesting, there may be an important increase in trans-resveratrol 3-O-glucoside [25].

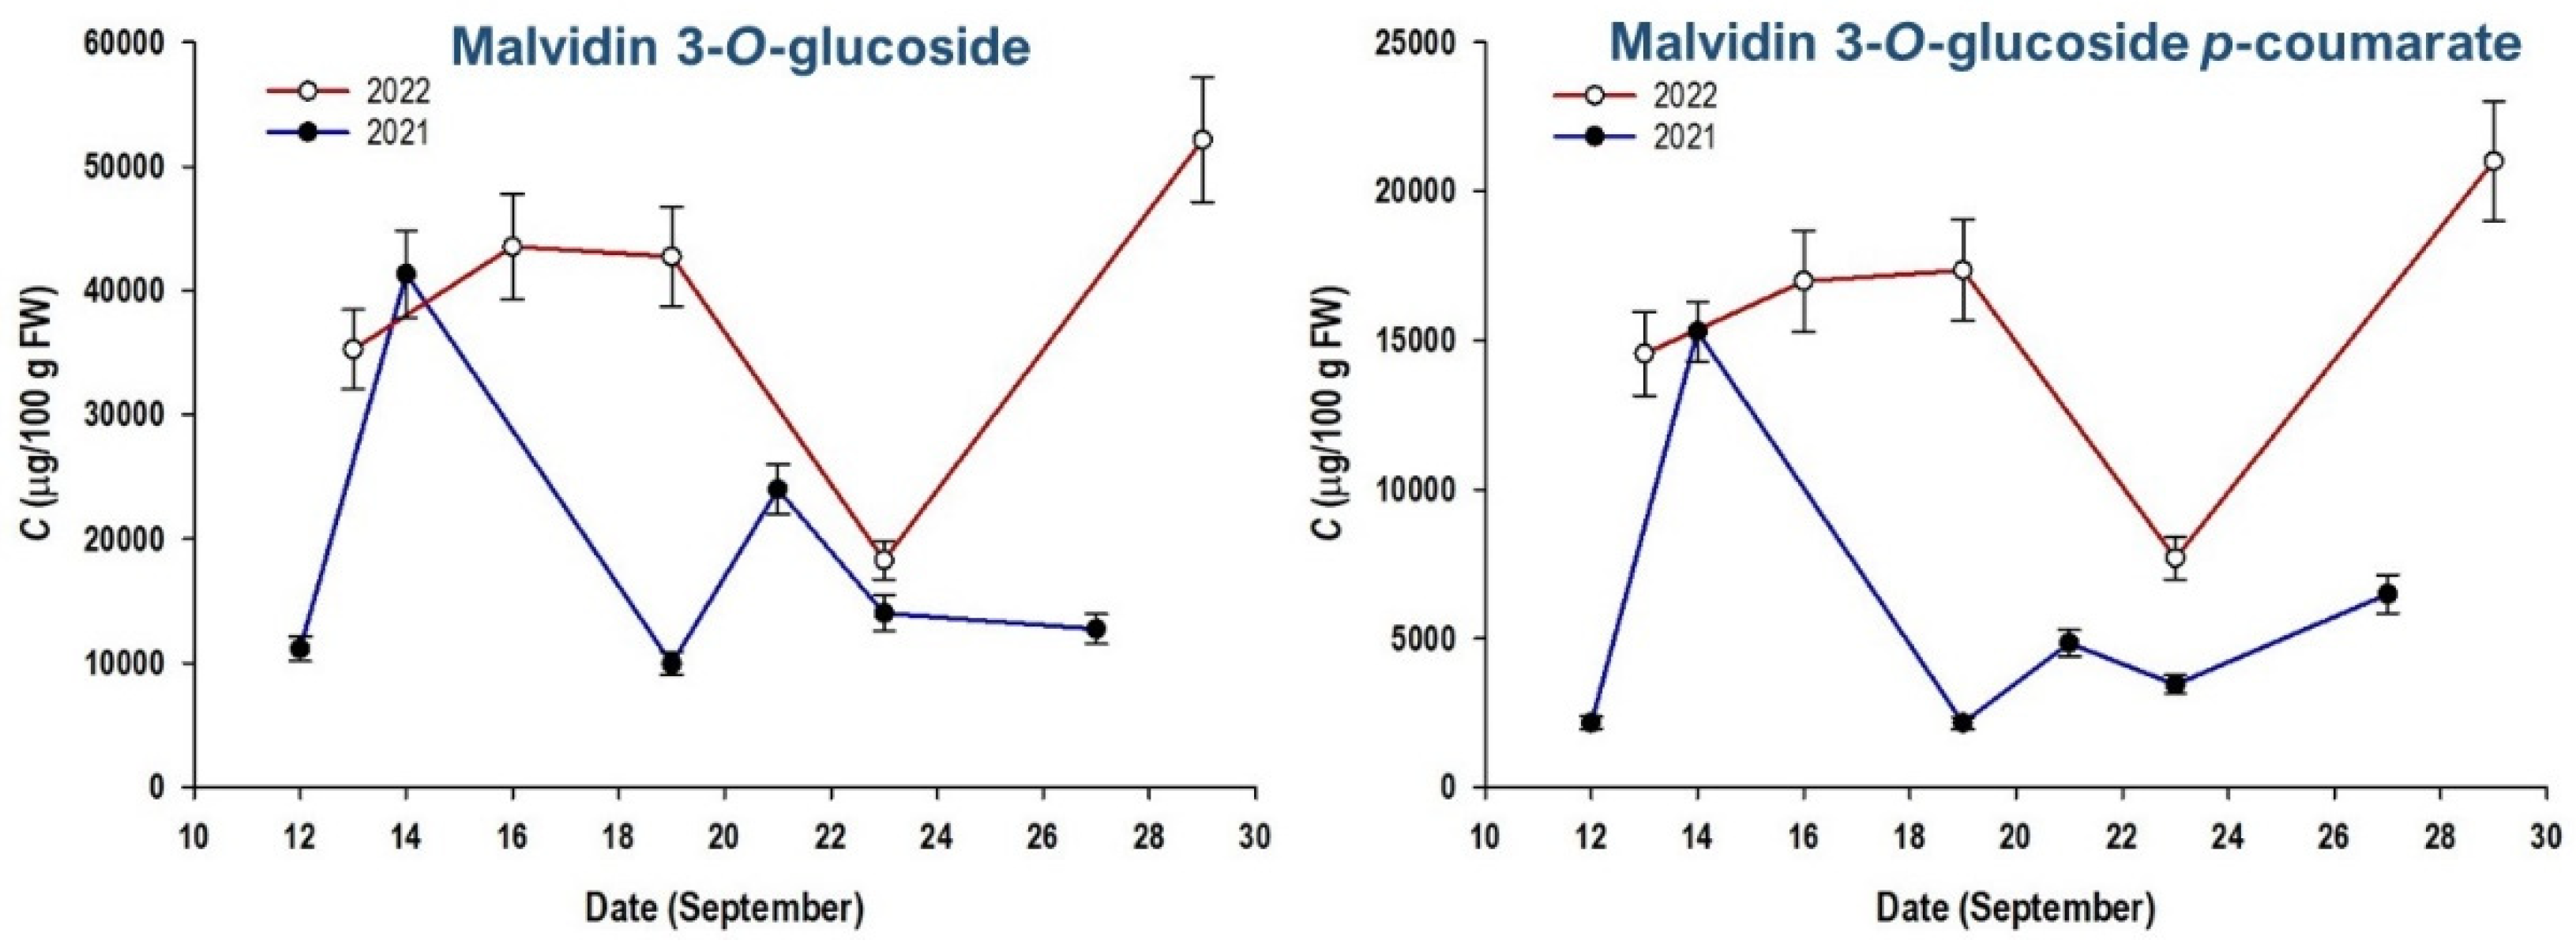
3.3. Anthocyanin Pigments

The tentative identification of the major anthocyanin pigments detected in the skin extracts was based on their mass spectra. More specifically, cyanidin 3-O-glucoside gave a molecular ion at m/z = 449, and a diagnostic fragment at m/z = 287 (aglycone). Likewise, petunidin 3-O-glucoside gave corresponding ions at m/z = 479 and 301, malvinidin 3-O-glucoside gave m/z = 493 and 315, and malvinidin 3-O-glucoside p-coumarate gave m/z = 639 and 331 [13]. Paeonidin 3-O-glucoside gave m/z = 463 and 301 [30].
The monitoring of anthocyanin evolution during ripening of Maratheftiko grapes revealed significantly diversified evolution patterns (Figure 3). In general, the pigment profile shows an image typical of those previously reported for several red V. vinifera varieties [31], but pronounced differences were found between the 2021 and 2022 harvests. Additionally, for the year 2022, higher standard deviation values were determined, a fact that might be ascribed mostly to sample variability and the characteristics of the analytical method employed. The predominant anthocyanin was malvidin 3-O-glucoside, followed by its p-coumarate derivative, paeonidin 3-O-glucoside, petunidin 3-O-glucoside, delphinidin 3-O-glucoside, and cyanidin 3-O-glucoside. Important differences were observed for all anthocyanins considered at harvest between the two years of study (Table 1).
Overall, the total anthocyanin content determined in the grapes of the 2022 harvest was 3.91 times higher than that found in the grapes of the 2021 harvest (p < 0.05). This fact pointed to very high year-to-year variation in both the profile and the total content of anthocyanins. Such a phenomenon, also manifested for the other groups of polyphenols considered in this study, was anticipated, given that anthocyanin content depends greatly on agronomical and environmental factors [32]. The two major pigments, malvidin 3-O-glucoside and its p-coumarate derivative, displayed almost identical evolution pattern (Figure 3, which might be explained by their biosynthetic relevance. On the other hand, the content of malvidin 3-O-glucoside at harvest in 2022 was 4.1-fold higher than that in 2021 (p < 0.05). Similarly, the content of its p-coumarate derivative at harvest in 2022 was 3.2-fold higher than that in 2021. For delphinidin, cyanidin and paeonidin 3-O-glucoside, the difference was even higher (4.8-, 4.7- and 4.3-fold, respectively) (p < 0.05), while the lowest difference was found for petunidin 3-O-glucoside (2.4-fold).
The content of the major anthocyanin metabolite, malvidin 3-O-glucoside, at harvest in 2022, was 52.14 mg/100 FW. This value falls within the values reported for some Greek native V. vinifera varieties, which vary from 37.90 to 89.30 mg/100 FW [32]. For those varieties, the overall anthocyanin content was reported to be from 42.30 to 155.40 mg/100 FW, while in another study, the overall anthocyanin content was found to be about 20–80 mg/100 FW, for Merlot, Tannat and Syrah grapes [24]. Thus, the overall content of 88.29 mg/100 FW found for Maratheftiko in 2022 might suggest that it is a variety with a rather high anthocyanin potential.
As stated previously, although anthocyanin profile is typical for individual V. vinifera varieties, cultivation and microclimatic conditions may profoundly affect anthocyanin content at harvest. Various factors, such as light exposure, water regime and temperature, may delay, enhance or hasten ripening, thus impacting anthocyanin biosynthesis [16]. Considering the climatic conditions described in Section 2.2, it could be argued that the variations found for anthocyanins could reflect differences in both the average temperature and rainfalls during the study period in 2021 and 2022. Thus, it could be asserted that the relatively lower temperatures and higher rainfalls in 2021 might have hindered anthocyanin biosynthesis and decreased their content in berries due to the higher water uptake. The evolution pattern of individual anthocyanins might also be notably diversified during ripening, as shown for various V. vinifera varieties [21,33,34], while intense fluctuations, such as those traced for some anthocyanins during the last stages of ripening (Figure 3), might also occur [35,36].

3.4. Seed Polyphenols

The only polyphenol that was virtually detected in seeds was catechin (Figure 4). This finding is in line with previous findings, which show that, in a number of V. vinifera varieties, catechin is by far the predominant seed polyphenol [12], although in some other varieties, relatively high content of epicatechin may also occur [37]. It should also be noted that no significant differences have been observed for the catechin content of seeds from red and white varieties [12]. Therefore, this compound was considered to trace the changes in seed composition during the study period.
In 2021, the catechin content on 12/9 was 121.09 mg/100 g FW, and at harvest, it dropped to 52.81 mg/100 g FW. On the contrary, in 2022, the catechin content on 13/9 was 299.21 mg/100 g FW, and at harvest, it reached a level of 446.18 mg/100 g FW (Figure 5). The difference in content at harvest is in line with the contents of all other polyphenols in skins (p < 0.05), highlighting once again the exceptional polyphenolic richness of the grapes harvested in 2022, compared to those harvested in 2021.
It was observed that the catechin content, but also the content of other related compounds, such as epicatechin and some catechin gallates, decreased during ripening, with a stabilizing tendency during the last days prior to harvest. This was the case for various V. vinifera varieties, including Plavac Mali and Trnjak [38], Cabernet Sauvignon [39], Graciano [40] and Vranac [41]. Considering the results presented in Figure 5 it could be argued that no large fluctuations were seen during the study period, and for both years, the catechin content lied within rather narrow limits. However, the large difference found in the catechin content at harvest between 2021 and 2022 (p < 0.05) is an issue of importance, because in red vinification, seeds there are major flavanol contributors, which may affect wine composition and organoleptic characteristics to a significant extent. The level of 446.18 mg/100 g FW is significantly higher than 164.50 mg/100 g FW found for Merlot [37] and 112 mg/100 g FW determined for Vranac [41], yet considerably lower than 1289.20 mg/100 g FW found for Plavak Mali [38] and 1200 mg/100 g FW found for Graciano [40]. Nevertheless, Maratheftiko seeds may be considered as being relatively rich in catechin, considering that the average value of catechin content determined in a large number of Greek varieties is 190.01 mg/100 g FW [12].

4. Conclusions

Maratheftiko is considered one of the most important wine grape varieties in Cyprus, yet its polyphenolic composition has never been investigated. In this study, a two-year examination was presented, pertaining to the monitoring of major polyphenolic metabolites during the period prior to harvest. Very large differences in the polyphenolic contents were found between the years 2021 and 2022, which is an indication that agronomic practices and microclimatic conditions may greatly affect grape composition. The largest differences were found for catechin, but also for the six major anthocyanin pigments, which contents were significantly higher in the grapes harvested in 2022. A similar phenomenon was also observed for the catechin content of seeds. Furthermore, it was pointed out that during a period of approximately two weeks before harvest, some major polyphenolic metabolites, e.g., anthocyanins, displayed intense fluctuations. Presumably, such variations could reflect differences in the average temperature and rainfall during berry maturation. Indeed, temperature was lower and rainfall was more frequent in 2021 during the study period, supporting the hypothesis that increased polyphenol and pigment contents in grape berries are influenced by higher temperatures and lower rainfalls. It is recommended that there must be a detailed monitoring of polyphenolic metabolites over the last few days prior to harvest to ensure the collection of grapes with optimal polyphenolic composition.

Author Contributions

Conceptualization, K.R. and D.P.M.; methodology, K.R., V.A. and T.C.; validation, V.A., T.C. and D.P.M.; formal analysis, K.R., V.A., T.C. and D.P.M.; investigation, K.R. and D.P.M.; writing—original draft preparation, D.P.M. and S.I.L.; writing—review and editing, D.P.M. and S.I.L.; visualization, D.P.M.; supervision, D.P.M. and S.I.L.; project administration, K.R., D.P.M. and S.I.L.; All authors have read and agreed to the published version of the manuscript.

Funding

This work received no external funding.

Data Availability Statement

The data presented in this study are available from the corresponding author upon request.

Conflicts of Interest

The authors declare no conflict of interest.

References

  1. Soares, S.; Brandão, E.; Mateus, N.; de Freitas, V. Sensorial Properties of Red Wine Polyphenols: Astringency and Bitterness. Crit. Rev. Food Sci. Nutr. 2017, 57, 937–948. [Google Scholar] [CrossRef]
  2. Gutiérrez-Escobar, R.; Aliaño-González, M.J.; Cantos-Villar, E. Wine Polyphenol Content and Its Influence on Wine Quality and Properties: A Review. Molecules 2021, 26, 718. [Google Scholar] [CrossRef] [PubMed]
  3. Guilford, J.M.; Pezzuto, J.M. Wine and Health: A Review. Am. J. Enol. Vitic. 2011, 62, 471–486. [Google Scholar] [CrossRef]
  4. Nemzer, B.; Kalita, D.; Yashin, A.Y.; Yashin, Y.I. Chemical Composition and Polyphenolic Compounds of Red Wines: Their Antioxidant Activities and Effects on Human Health—A Review. Beverages 2022, 8, 1. [Google Scholar] [CrossRef]
  5. Conde, C.; Silva, P.; Fontes, N.; Dias, A.C.P.; Tavares, R.M.; Sousa, M.J.; Agasse, A.; Delrot, S.; Gerós, H. Biochemical Changes throughout Grape Berry Development and Fruit and Wine Quality. Food 2007, 1, 1–22. [Google Scholar]
  6. Flamini, R.; Mattivi, F.; de Rosso, M.; Arapitsas, P.; Bavaresco, L. Advanced Knowledge of Three Important Classes of Grape Phenolics: Anthocyanins, Stilbenes and Flavonols. Int. J. Mol. Sci. 2013, 14, 19651–19669. [Google Scholar] [CrossRef]
  7. Makris, D.P.; Kallithraka, S.; Mamalos, A. Differentiation of Young Red Wines Based on Cultivar and Geographical Origin with Application of Chemometrics of Principal Polyphenolic Constituents. Talanta 2006, 70, 1143–1152. [Google Scholar] [CrossRef]
  8. Kallithraka, S.; Mamalos, A.; Makris, D.P. Differentiation of Young Red Wines Based on Chemometrics of Minor Polyphenols Constituents. J. Agric. Food Chem. 2007, 55, 3233–3239. [Google Scholar] [CrossRef]
  9. Ionete, R.E.; Stegarus, D.I.; Geana, E.I.; Botoran, O.R.; Sandru, C.; Miricioiu, M.G. Charactrization and classification of Romanian wines by origin. A chemometric approach based on some metal and phenolic composition. Rev. Chim. 2019, 70, 3761–3768. [Google Scholar] [CrossRef]
  10. Teixeira, A.; Eiras-Dias, J.; Castellarin, S.D.; Gerós, H. Berry Phenolics of Grapevine under Challenging Environments. Int. J. Mol. Sci. 2013, 14, 18711–18739. [Google Scholar] [CrossRef]
  11. Burin, V.M.; Ferreira-Lima, N.E.; Panceri, C.P.; Bordignon-Luiz, M.T. Bioactive Compounds and Antioxidant Activity of Vitis vinifera and Vitis labrusca Grapes: Evaluation of Different Extraction Methods. Microchem. J. 2014, 114, 155–163. [Google Scholar] [CrossRef]
  12. Guendez, R.; Kallithraka, S.; Makris, D.P.; Kefalas, P. An Analytical Survey of the Polyphenols of Seeds of Varieties of Grape (Vitis vinifera) Cultivated in Greece: Implications for Exploitation as a Source of Value-Added Phytochemicals. Phytochem. Anal. 2005, 16, 17–23. [Google Scholar] [CrossRef] [PubMed]
  13. Makris, D.P.; Psarra, E.; Kallithraka, S.; Kefalas, P. The Effect of Polyphenolic Composition as Related to Antioxidant Capacity in White Wines. Food Res. Int. 2003, 36, 805–814. [Google Scholar] [CrossRef]
  14. Makris, D.P.; Kefalas, P. Characterization of Polyphenolic Phytochemicals in Red Grape Pomace. Int. J. Waste Resour. 2013, 03, 1000126. [Google Scholar] [CrossRef]
  15. Lakka, A.; Grigorakis, S.; Karageorgou, I.; Batra, G.; Kaltsa, O.; Bozinou, E.; Lalas, S.; Makris, D.P. Saffron Processing Wastes as a Bioresource of High-Value Added Compounds: Development of a Green Extraction Process for Polyphenol Recovery Using a Natural Deep Eutectic Solvent. Antioxidants 2019, 8, 586. [Google Scholar] [CrossRef]
  16. Kuhn, N.; Guan, L.; Dai, Z.W.; Wu, B.H.; Lauvergeat, V.; Gomès, E.; Li, S.H.; Godoy, F.; Arce-Johnson, P.; Delrot, S. Berry Ripening: Recently Heard through the Grapevine. J. Exp. Bot. 2014, 65, 4543–4559. [Google Scholar] [CrossRef]
  17. Garcia-Cabezon, C.; Teixeira, G.G.; Dias, L.G.; Salvo-Comino, C.; García-Hernandez, C.; Rodriguez-Mendez, M.L.; Martin-Pedrosa, F. Analysis of Phenolic Content in Grape Seeds and Skins by Means of a Bio-Electronic Tongue. Sensors 2020, 20, 4176. [Google Scholar] [CrossRef]
  18. Caridi, A.; Cufari, A.; Ramondino, D. Winemaking from Gaglioppo Grapes with Hybrid Strains of Saccharomyces. Folia Microbiol. 2002, 47, 407–408. [Google Scholar] [CrossRef]
  19. Goufo, P.; Singh, R.K.; Cortez, I. A Reference List of Phenolic Compounds (Including Stilbenes) in Grapevine (Vitis vinifera L.) Roots, Woods, Canes, Stems, and Leaves. Antioxidants 2020, 9, 398. [Google Scholar] [CrossRef]
  20. Romeyer, F.M.; Macheix, J.J.; Goiffon, J.P.; Reminiac, C.C.; Sapis, J.C. The Browning Capacity of Grapes. 3. Changes and Importance of Hydroxycinnamic Acid-Tartaric Acid Esters during Development and Maturation of the Fruit. J. Agric. Food Chem. 1983, 31, 346–349. [Google Scholar] [CrossRef]
  21. Liang, Z.; Sang, M.; Fan, P.; Wu, B.; Wang, L.; Duan, W.; Li, S. Changes of Polyphenols, Sugars, and Organic Acid in 5 Vitis Genotypes during Berry Ripening. J. Food Sci. 2011, 76, C1231–C1238. [Google Scholar] [PubMed]
  22. Boido, E.; García-Marino, M.; Dellacassa, E.; Carrau, F.; Rivas-Gonzalo, J.C.; Escribano-Bailón, M.T. Characterisation and Evolution of Grape Polyphenol Profiles of Vitis vinifera L. Cv. Tannat during Ripening and Vinification. Aust. J. Grape Wine Res. 2011, 17, 383–393. [Google Scholar]
  23. Song, S.; Wei, Z.; Huang, Y.; Guo, W.; Zhang, Y.; Yin, L.; Qu, J.; Lu, J. Comparison of Non-Anthocyanin Polyphenol Accumulation in the Berry Skins of Muscadine and European Grapes during Ripening in China. J. Food Biochem. 2019, 43, e12696. [Google Scholar] [CrossRef] [PubMed]
  24. Benbouguerra, N.; Valls-Fonayet, J.; Krisa, S.; Garcia, F.; Saucier, C.; Richard, T.; Hornedo-Ortega, R. Polyphenolic Characterization of Merlot, Tannat and Syrah Skin Extracts at Different Degrees of Maturity and Anti-Inflammatory Potential in RAW 264.7 Cells. Foods 2021, 10, 541. [Google Scholar] [CrossRef] [PubMed]
  25. Du, Y.; Li, X.; Xiong, X.; Cai, X.; Ren, X.; Kong, Q. An Investigation on Polyphenol Composition and Content in Skin of Grape (Vitis vinifera L. Cv. Hutai No.8) Fruit during Ripening by UHPLC-MS2 Technology Combined with Multivariate Statistical Analysis. Food Biosci. 2021, 43, 101276. [Google Scholar] [CrossRef]
  26. Castillo-Muñoz, N.; Gómez-Alonso, S.; García-Romero, E.; Hermosín-Gutiérrez, I. Flavonol Profiles of Vitis vinifera Red Grapes and Their Single-Cultivar Wines. J. Agric. Food Chem. 2007, 55, 992–1002. [Google Scholar] [CrossRef]
  27. Locatelli, M.; Travaglia, F.; Coïsson, J.D.; Bordiga, M.; Arlorio, M. Phenolic Composition of Nebbiolo Grape (Vitis vinifera L.) from Piedmont: Characterization during Ripening of Grapes Selected in Different Geographic Areas and Comparison with Uva Rara and Vespolina Cv. Eur. Food Res. Technol. 2016, 242, 1057–1068. [Google Scholar] [CrossRef]
  28. Jeandet, P.; Bessis, R.; Gautheron, B. The Production of Resveratrol (3,5,4′-Trihydroxystilbene) by Grape Berries in Different Developmental Stages. Am. J. Enol. Vitic. 1991, 42, 41–46. [Google Scholar] [CrossRef]
  29. Perestrelo, R.; Lu, Y.; Santos, S.A.O.; Silvestre, A.J.D.; Neto, C.P.; Câmara, J.S.; Rocha, S.M. Phenolic Profile of Sercial and Tinta Negra Vitis vinifera L. Grape Skins by HPLC–DAD–ESI-MSn. Food Chem. 2012, 135, 94–104. [Google Scholar]
  30. Monrad, J.K.; Howard, L.R.; King, J.W.; Srinivas, K.; Mauromoustakos, A. Subcritical Solvent Extraction of Anthocyanins from Dried Red Grape Pomace. J. Agric. Food Chem. 2010, 58, 2862–2868. [Google Scholar] [CrossRef]
  31. Kallithraka, S.; Aliaj, L.; Makris, D.P.; Kefalas, P. Anthocyanin Profiles of Major Red Grape (Vitis vinifera L.) Varieties Cultivated in Greece and Their Relationship with in Vitro Antioxidant Characteristics. Int. J. Food Sci. Technol. 2009, 44, 2385–2393. [Google Scholar] [CrossRef]
  32. Garrido, J.; Borges, F. Wine and Grape Polyphenols—A Chemical Perspective. Food Res. Int. 2013, 54, 1844–1858. [Google Scholar] [CrossRef]
  33. Jordão, A.M.; Correia, A.C. Relationship between Antioxidant Capacity, Proanthocyanidin and Anthocyanin Content during Grape Maturation of Touriga Nacional and Tinta Roriz Grape Varieties. S. Afr. J. Enol. Vitic. 2012, 33, 214–224. [Google Scholar] [CrossRef]
  34. Biniari, K.; Gerogiannis, O.; Daskalakis, I.; Bouza, D.; Stavrakaki, M. Study of some qualitative and quantitative characters of the grapes of indigenous Greek grapevine varieties (Vitis vinifera L.) using HPLC and spectrophotometric analyses. Not. Bot. Horti Agrobot. Cluj-Napoca 2018, 46, 97–106. [Google Scholar]
  35. Mateus, N.; Machado, J.M.; de Freitas, V. Development Changes of Anthocyanins in Vitis vinifera Grapes Grown in the Douro Valley and Concentration in Respective Wines. J. Sci. Food Agric. 2002, 82, 1689–1695. [Google Scholar] [CrossRef]
  36. Rajha, H.N.; el Darra, N.; el Kantar, S.; Hobaika, Z.; Louka, N.; Maroun, R.G. A Comparative Study of the Phenolic and Technological Maturities of Red Grapes Grown in Lebanon. Antioxidants 2017, 6, 8. [Google Scholar]
  37. Obreque-Slier, E.; López-Solís, R.; Castro-Ulloa, L.; Romero-Díaz, C.; Peña-Neira, Á. Phenolic Composition and Physicochemical Parameters of Carménère, Cabernet Sauvignon, Merlot and Cabernet Franc Grape Seeds (Vitis vinifera L.) during Ripening. LWT 2012, 48, 134–141. [Google Scholar] [CrossRef]
  38. Katalinić, V.; Maleš, P. Compositional Changes in Grape Polyphenols throughout Maturation. Int. J. Phytoremediation 1997, 21, 169–177. [Google Scholar] [CrossRef]
  39. Kennedy, J.A.; Matthews, M.A.; Waterhouse, A.L. Changes in Grape Seed Polyphenols during Fruit Ripening. Phytochemistry 2000, 55, 77–85. [Google Scholar] [CrossRef]
  40. Ferrer-Gallego, R.; García-Marino, M.; Miguel Hernández-Hierro, J.; Rivas-Gonzalo, J.C.; Teresa Escribano-Bailón, M. Statistical Correlation between Flavanolic Composition, Colour and Sensorial Parameters in Grape Seed during Ripening. Anal. Chim. Acta 2010, 660, 22–28. [Google Scholar] [CrossRef]
  41. Andjelkovic, M.; Radovanovié, B.; Radovanović, A.; Andjelkovic, A.M. Changes in Polyphenolic Content and Antioxidant Activity of Grapes Cv Vranac during Ripening. S. Afr. J. Enol. Vitic. 2013, 34, 147–155. [Google Scholar] [CrossRef]
Figure 1. Evolution of sugar content (A), acidity (B) and Folin–Ciocalteu index (C) of Maratheftiko grapes during the last two weeks of ripening over two consecutive years. Acidity is expressed as tartaric acid equivalents (TAE). The error bars representing standard deviation (sd) are omitted due to the low values (sd < 1%).
Beverages 09 00039 g001
Figure 2. Evolution of major non-anthocyanin polyphenols in Maratheftiko grapes during the last two weeks of ripening over two consecutive years. The content is expressed as μg per 100 g of fresh berry weight (FW). The error bars represent standard deviation.
Beverages 09 00039 g002
Figure 3. Evolution of major anthocyanin pigments in Maratheftiko grapes during the last two weeks of ripening over two consecutive years. The content is expressed as μg per 100 g of fresh berry weight (FW). The error bars represent standard deviation.
Beverages 09 00039 g003aBeverages 09 00039 g003b
Figure 4. HPLC trace of Maratheftiko grape seed extract obtained from seeds collected at harvest in 2022. The trace was recorded at 270 nm.
Beverages 09 00039 g004
Figure 5. Evolution of catechin content in seeds of Maratheftiko grapes during the last stages of ripening in two consecutive years. The content is expressed as mg of catechin per 100 g of fresh berry weight. The error bars represent standard deviation.
Beverages 09 00039 g005
Table 1. Profile of anthocyanin pigments in the skin of Maratheftiko grapes at harvest over two consecutive years.
PigmentContent at Harvest (μg/100 g FW)
20212022
Delphinidin 3-O-glucoside440.252126.31
Cyanidin 3-O-glucoside158.23739.56
Petunidin 3-O-glucoside728.02 ± 70.203451.00 ± 300.02
Paeonidin 3-O-glucoside2046.28 ± 198.568861.09 ± 760.44
Malvidin 3-O-glucoside12,750.12 ± 1186.5052,140.11 ± 5002.62
Malvidin 3-O-glucoside p-coumarate6480.03 ± 652.4721,011.77 ± 1987.50
Sum22,602.9188,293.84
Disclaimer/Publisher’s Note: The statements, opinions and data contained in all publications are solely those of the individual author(s) and contributor(s) and not of MDPI and/or the editor(s). MDPI and/or the editor(s) disclaim responsibility for any injury to people or property resulting from any ideas, methods, instructions or products referred to in the content.

