Article

Introducing a Simple Method to Investigate Relative Volatilities of Flavour Compounds in Fruit Brandies

Yeast Genetics and Fermentation Technology, Institute of Food Science and Biotechnology, University of Hohenheim, Garbenstraße 23, 70599 Stuttgart, Germany
*
Author to whom correspondence should be addressed.
Beverages 2023, 9(2), 32; https://doi.org/10.3390/beverages9020032
Submission received: 23 February 2023 / Revised: 29 March 2023 / Accepted: 7 April 2023 / Published: 12 April 2023

Abstract

:
Determination of relative volatilities of flavour compounds in hydro-alcoholic solutions is usually performed by time-consuming and costly standard methods such as the Gillespie dynamic recirculation method. This study tested a quick and easy method with a simple distillation apparatus for measuring empirical relative volatilities. A total of 17 representative flavour compounds of apple and pear brandies were selected and investigated for their relative volatilities. This also included so far unpublished relative volatilities of one alcohol (2-butanol), one aldehyde (hexanal), one ketone (β-damascenone), and three esters (ethyl butyrate, butyl acetate, ethyl 2-methylbutyrate). Relative volatilities of three alcohols (methanol, isobutanol, and isoamyl alcohol), one ester (ethyl acetate), one aldehyde (acetaldehyde), and one acetal (1,1-diethoxyethane) were compared to reference data. All compounds, except for 1,1-diethoxyethane, showed a high correlation with the reference data. Vapour–liquid equilibrium for an ethanol–water mixture showed a high correlation with the reference data (r > 0.9). In accordance with the high correlation levels, we suggest that the simple distillation apparatus is a fast and simple alternative to the standard method.

1. Introduction

In the production of distilled beverages, the flavour compounds determine the quality of brandies, despite their extremely low concentrations ranging from a few ng/L to several mg/L [1]. The concentrations of compounds in alcoholic distilled beverages are governed by the thermodynamic processes of evaporations and condensations that occur continuously in the distillation column. Vapour–liquid equilibrium (VLE) is a fundamental thermodynamic property of flavour compounds that describes the distribution of flavour compounds between the liquid and the vapour phase. The data of VLE is essential for a better understanding of the behaviours of flavour compounds during distillation.

1.1. Thermodynamic Fundamentals

At the state of thermodynamic equilibrium, the fugacity of compound i in the vapour phase ( f Vi ) i is equal to the fugacity in the liquid ( f Li ).
f Vi = f Li
Considering the systems are under low pressure (<1000 kPa) and always below the critical pressure of the pure compounds, the gas phase approaches the ideal-gas state and the activity coefficient of the liquid phase, which accounts for deviations from ideal-liquid mixtures, is independent of the pressure; therefore, Equation (1) becomes
y i P = γ P i 0 x i
In Equation (2), y i and x i are the equilibrium mole fractions of compound i in the vapour and the liquid phase, respectively. P is the total pressure of the system, γ is the activity coefficient of compound i, and P i 0 is the total pressure of the pure compound i.
The partition coefficient ( K i ) shows the distribution of a volatile compound i between the vapour and the liquid phase, which is expressed as
K i = y i x i
From Equations (2) and (3), K i is also calculated as
y i x i = γ P i 0 P
When the distillation systems operate at atmospheric pressure, K i can be computed by calculating P i 0 and γ . Sometimes γ is calculated by an appropriate semi-empirical method, such as the NRTL model, and the calculated K i is then compared to K i from experimental data [2,3].
P i 0 is calculated with the Riedel equation, an extended version of the Antonie equation:
P i 0 = exp ( A i + B i T + C i lnT + D i T E i )
The coefficients A i to E i are specific values for compound i, which are normally available in databases. The relative volatility of compound i ( α i ) with respect to ethanol represents the ratio of the distribution of the volatile compound i ( K i ) to the distribution of ethanol ( K ethanol ), as follows:
α i = K i K ethanol
When the relative volatility is equal to 1, it means that the degree of evaporation of compound i is the same as the degree of evaporation of ethanol, and when the value for compound i is larger or smaller than 1, the compound i is more or less volatile than ethanol, respectively. Complex intermolecular interactions that could occur between different volatile compounds, such as van der Waals interactions, are normally considered negligible for the simplicity of analysis.

1.2. Previous Studies on VLEs

In the first report on VLEs of volatile compounds as a function of ethanol concentration, 29 compounds were examined using an Othmer-type still and an Altsheler-type still [4]. Various different flavour compounds were examined in studies [2,3,5,6,7,8,9]. One common feature among the different studies on VLE is that the experimental data were generated by circulating distillation units. This can be seen as the standard method to determine the relative volatilities of flavour compounds.
The Gillespie-type recirculating still (the dynamic recirculation method), which was originally proposed by Gillespie [10], is widely recommended for the measurement of precise VLE data. In this apparatus, both the vapour and the liquid phases circulate. Another type of apparatus that was often used is the Othmer-type still, in which only the vapour phase is circulated. Those apparatuses enable sampling in thermodynamic equilibrium.
Since recirculation is maintained until the temperature and the pressure in the phases are constant, the operation with a circulating distillation unit is very time-consuming. Puentes et al. [2] documented that the time needed to reach equilibrium was about 2 h after the system reached the constant temperature, which was 30 min. A quick method using a modified Othmer-type still was proposed by Martin et al. [11]; however, this method also needed 1 h until sampling. Another drawback is that both of the apparatuses are costly and must be purchased from special manufacturers.
Taking into account the cost, availability of the equipment, and the sampling time, a simple distillation apparatus could be an alternative for the fast and easy determination of relative volatilities. The benefit of the standard method for VLE determination is the precision of the obtained data. However, we assumed that a less precise, but easier system, as used in our study, would still be able to provide us with satisfactory information about the behaviour of flavour compounds in the distillation of fruit spirits. Especially considering the fact that during the distillation of fruit brandies, the equilibrium state on the trays is disturbed by the reflux from the column; the highly precise VLE data may not even reflect the true behaviour of the flavour compounds during distillation. In addition, VLE data on some compounds that are crucial for the flavour of fruit brandies cannot be found in the literature. A possible reason could be the complexity of interactions between different compounds [12].
Hence, we present new relative volatility data of representative flavour compounds in fruit brandies using a quick and simple method for the determination of relative volatilities. Our data are in excellent agreement with published data [4,5,13,14,15], which proves the usefulness of our approach.

2. Materials and Methods

2.1. Sample Preparation

The hydroalcoholic solutions were prepared by weighing double-distilled water (ddH2O), ethanol (≥99.8%, Merck Millipore, Darmstadt, Germany), and flavour substances, and mixing them to obtain the initial concentrations. The experimental setup contained ethanol concentrations in the solutions in a range of 5–85% (v/v) with a 10% (v/v) stepwise increase. A total of 17 flavour substances and their concentrations in solutions were chosen based on the aroma profiles of fruit brandies in our institute [15]. Flavour substances were grouped into three different categories and the solutions were prepared accordingly. This was to avoid the co-elution problem in GC analysis. As a control experiment, ethanol–water solutions without flavour compounds were prepared. All flavour substances used in this study were analytical grade. The functional group, name of compound, concentration in hydroalcoholic solutions, molecular weight, boiling point, supplier, purity, and flavour category are presented in Table 1.

2.2. Sample Distillation

A simple distillation apparatus was used for the distillation of hydroalcoholic solutions. The apparatus consisted of a 250 mL two-neck round-bottom flask (Lenz Laborglas, Wertheim, Germany) and a Liebig condenser (Lenz Laborglas, Wertheim, Germany) as a cooler. At the end of the cooler, a delivery adapter (Lenz Laborglas, Wertheim, Germany) was installed. A thermometer (testo 925, Testo, Lenzkirch, Germany) was equipped with a rubber stopper to measure the temperature of the vapour phase. The flask was placed on a mantle heater (LabHEAT, SAF Wärmetechnik, Mörlenbach, Germany). Next, 100 mL of solution was transferred to the distillation still and moderately heated until boiling. The first 5 mL of distillate was collected in a graduated cylinder and transferred to a glass bottle with a lid. During distillation, vapour temperature was recorded twice at the moment when the first and the last sample droplet fell into a graduated cylinder. The ethanol content of the sample was measured using a density meter (DMA 4200 M, Anton Paar, Graz, Austria) and samples were diluted down to 40% (v/v) for GC analysis. Samples were stored in a refrigerator at 3 ± 0.5 °C until GC analysis. Experiments were performed in triplicate.

2.3. Gas Chromatography Headspace Analysis

Samples were analysed by a gas chromatograph (GC-2010 Plus, Shimadzu Scientific Instruments, Kyoto, Japan) with a flame ionization detector (FID). Firstly, 3 mL of the liquid sample was introduced into the glass vials (20 mL, neolab Migge, Heidelberg, Germany) and the vials were sealed using butyl/PTFE septa in aluminum caps (neolab Migge, Heidelberg, Germany). Separations were performed using a 60 m × 0.32 mm × 1.50 μm Rtx-Volatiles capillary column coated with a DB-Wax dephenyl dimethyl polysiloxane stationary phase (Restek Corp, Bellefonte, PA, USA). After equilibration at 70 °C for 15 min, the headspace gas was automatically introduced into the column with a carrier gas (helium) column flow rate of 3.37 mL/min. Both transfer line temperature and sample line temperature of the headspace sampler were 150 °C. An initial oven temperature was set at 60 °C for 2 min, then ramp at 2 °C/min up to 70 °C, ramp at 8 °C/min up to 160 °C for 2 min, ramp at 4 °C/min up to 200 °C, and finally ramp at 15 °C/min up to 250 °C for 10 min. The total program time was 43.6 min.
The FID temperature was 250 °C, fuelled with 40 mL/min hydrogen, 400 mL/min air, and a make-up of 30 mL/min nitrogen. Split mode injections were made with a split ratio of 25:1. The data were analysed with the supplied LabSolutions software (version 5.99, Shimadzu Scientific Instruments, Kyoto, Japan). LabSolutions is Shimadzu’s software for managing and analysing data from various scientific instruments. It offers a user-friendly interface for instrument control, data acquisition, and processing, as well as advanced features such as peak integration, spectral libraries, and report generation.
Quantification of the substances was achieved by comparing the peak areas of compounds in the samples to external standards (R² ≥ 0.98) prepared in 40% (v/v) ethanol–water (ddH2O) solutions.

2.4. Statistical Analysis

Pearson’s correlation was calculated by the PROC CORR procedure between data from this study and reference data from the literature. PROC CORR is a procedure used for calculating correlation coefficients and associated statistics between variables. It helps to evaluate the strength and direction of relationships between variables in a dataset, and to identify potential collinearities. The effect of molecular weight, functional group, and the interaction were assessed by using a two-way analysis of variance by the GLM procedure. GLM procedure is used to perform linear modelling such as ANOVA, regression analysis, and analysis of covariance. It can model data with different distribution types and control for the effects of covariates. All statistical analyses were performed with the SAS program (version 9.4, SAS Institute, Cary, NC, USA).

3. Results and Discussion

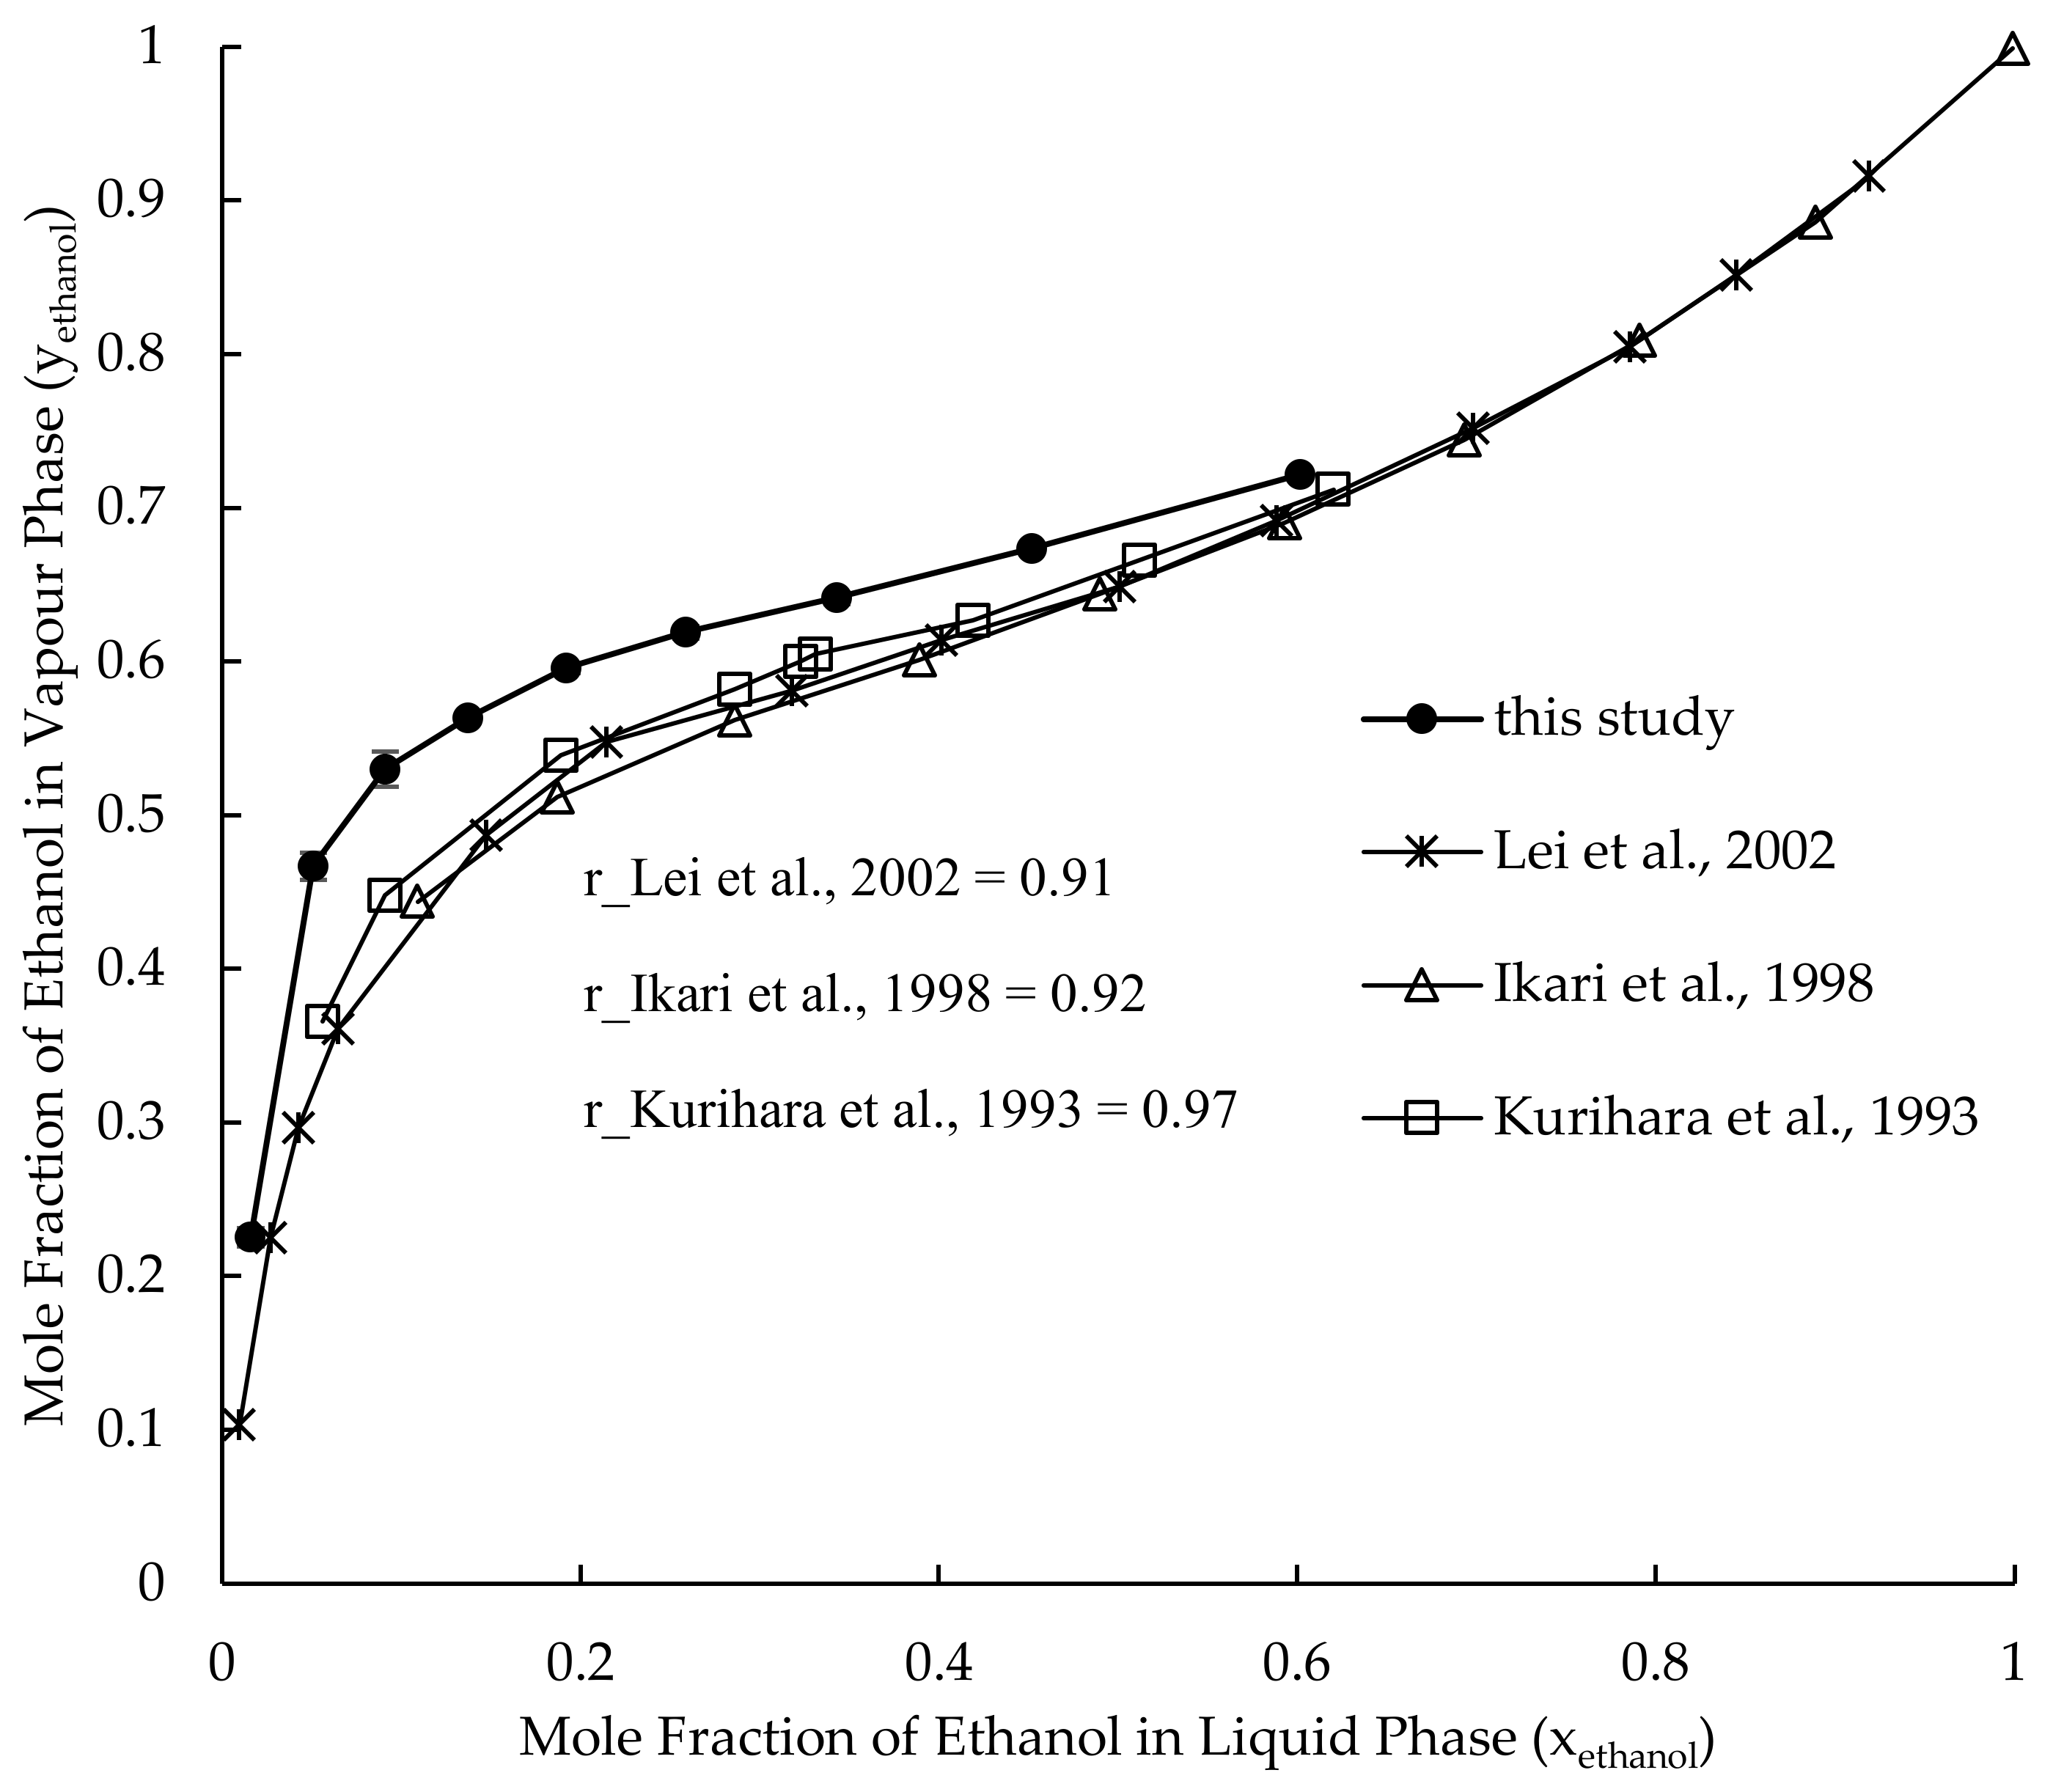
3.1. Vapour–Liquid Equilibrium of Ethanol–Water System

The equilibrium data for the ethanol–water mixtures are presented in Figure 1. Our data correlate very well with published data (Pearson’s correlation coefficient > 0.9) [5,13,15]. Thus, our system is valid for the measurement of relative volatilities of flavour compounds. However, the mole fractions of ethanol in the vapour phase in our experimental setup were slightly higher than in the reference data. This could be due to partial condensation of vapours in our apparatus prior to the collection of the distillate. Since water has a higher propensity to condense than ethanol, this could explain the slight enrichment of ethanol in the vapour phase. Duration time for sampling and vapour temperatures are shown in Table A3 and Table A4.

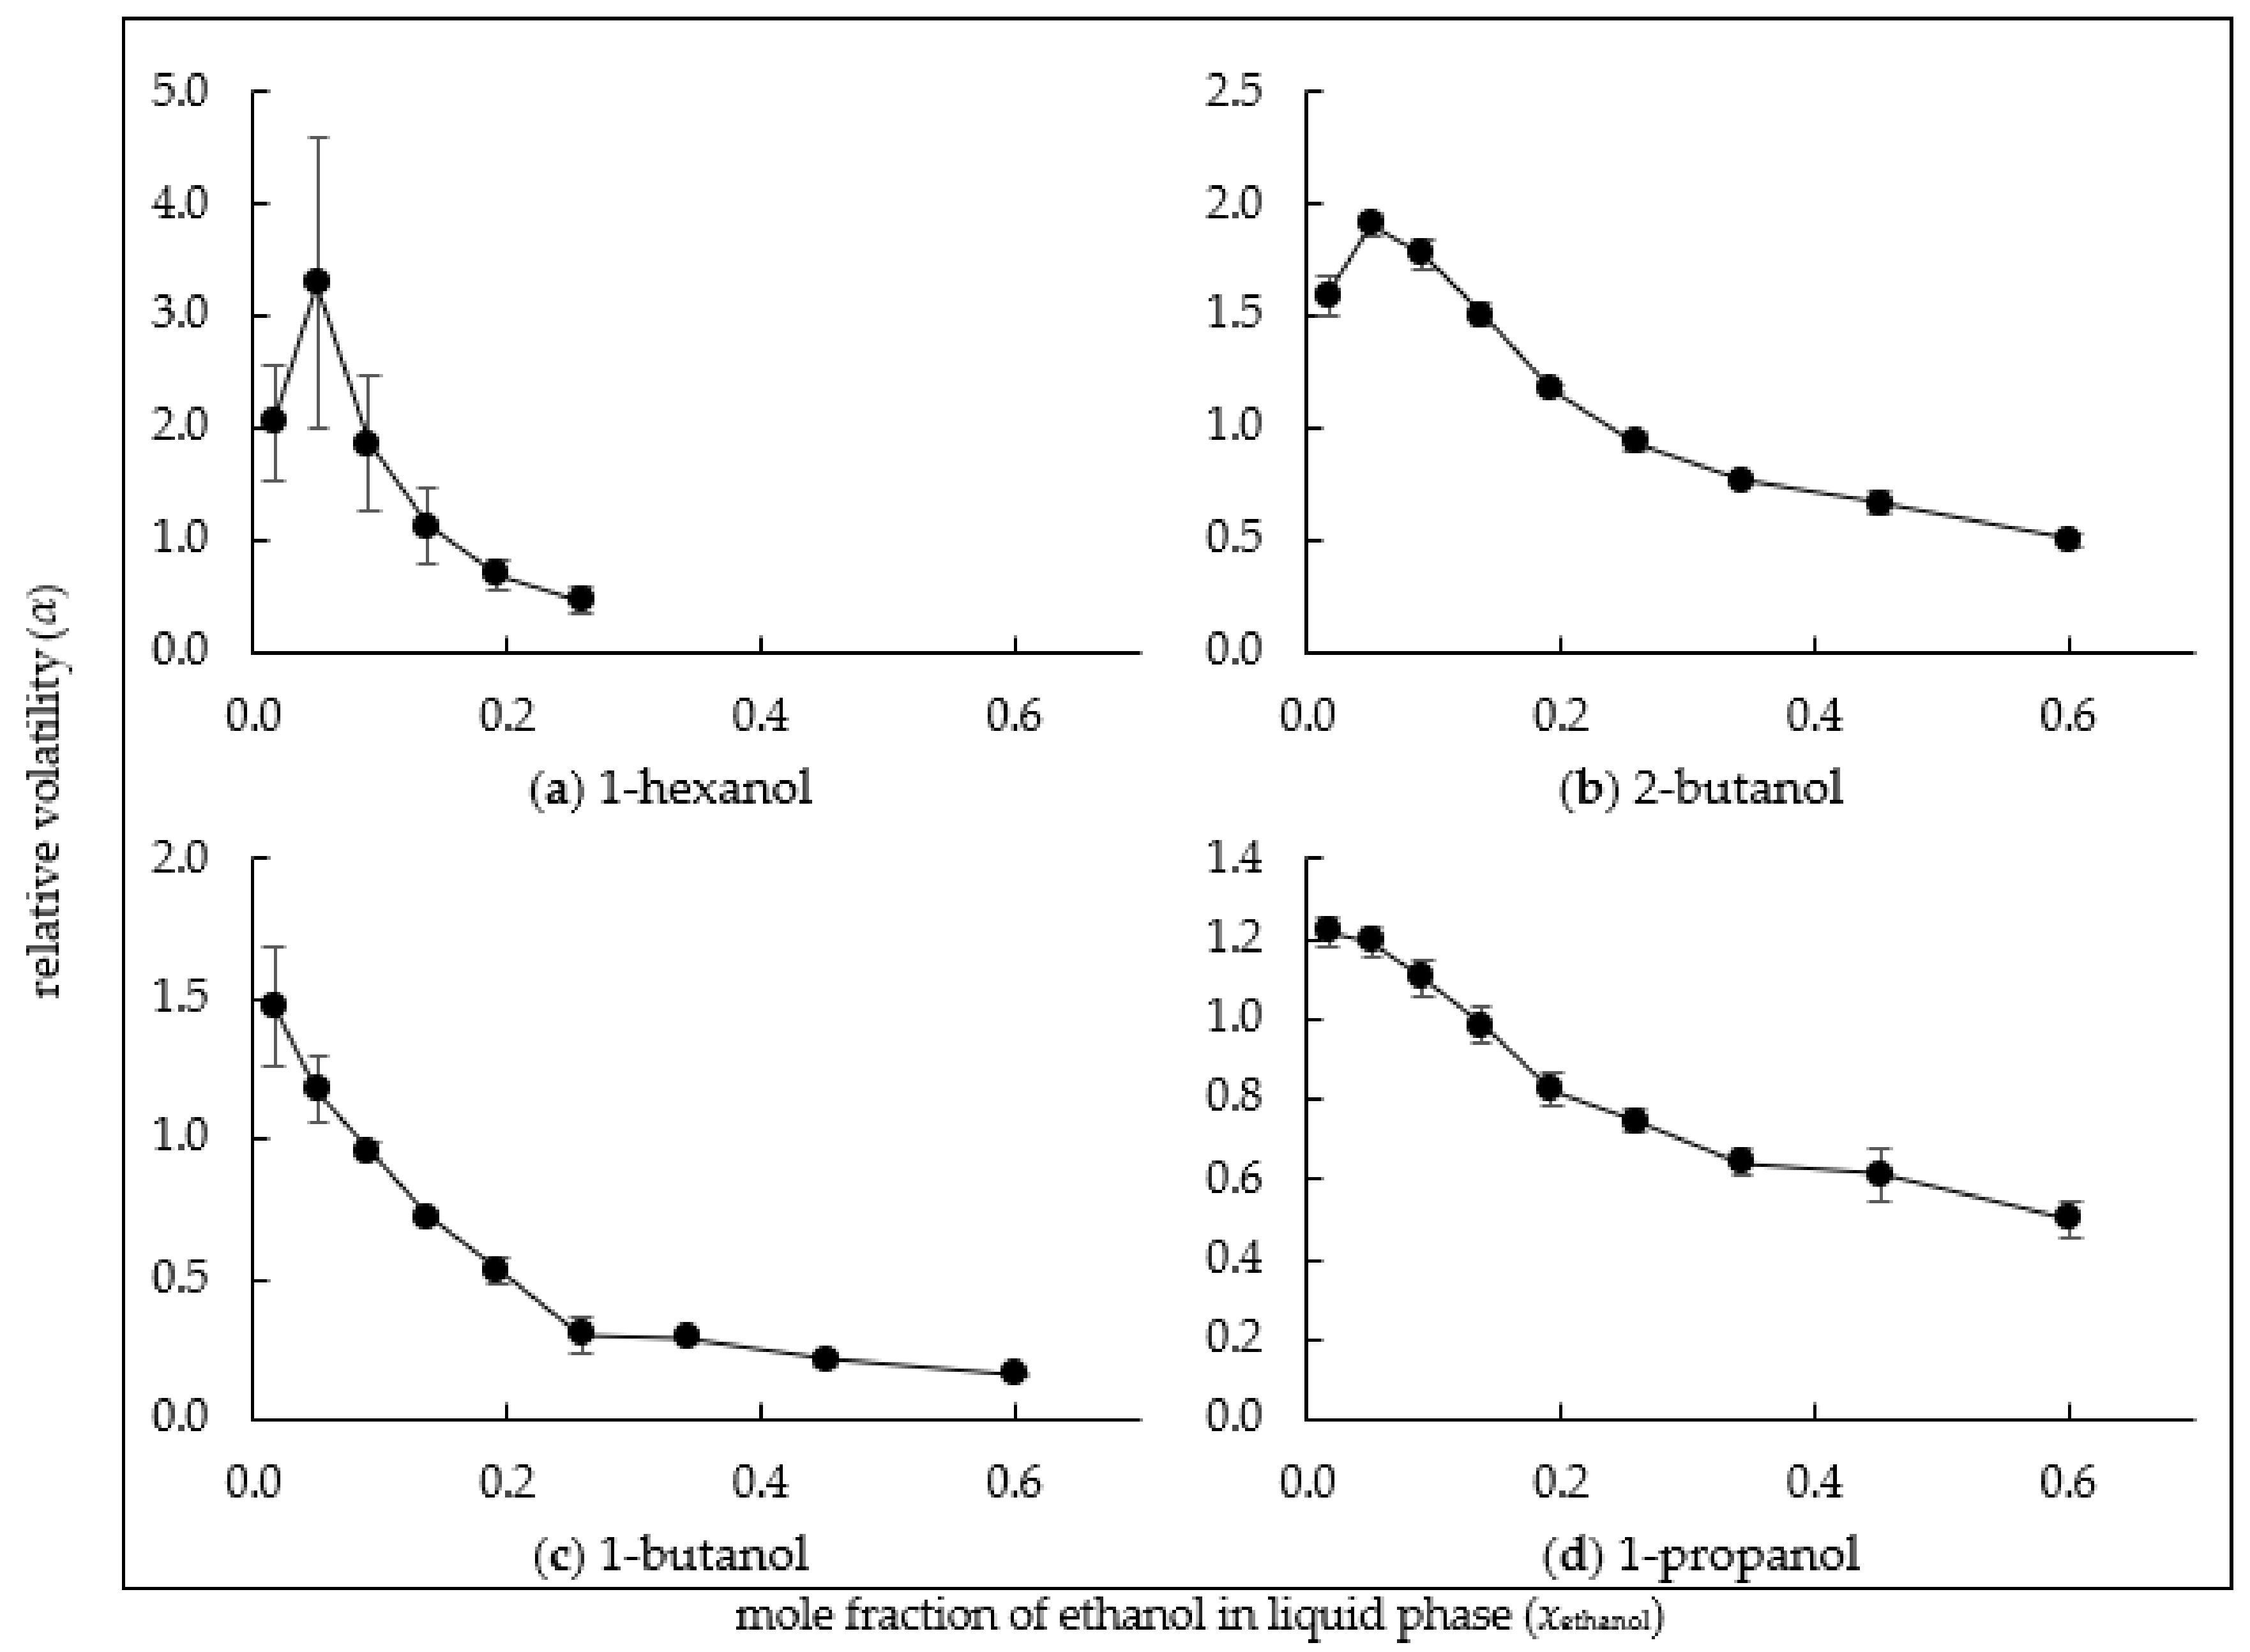
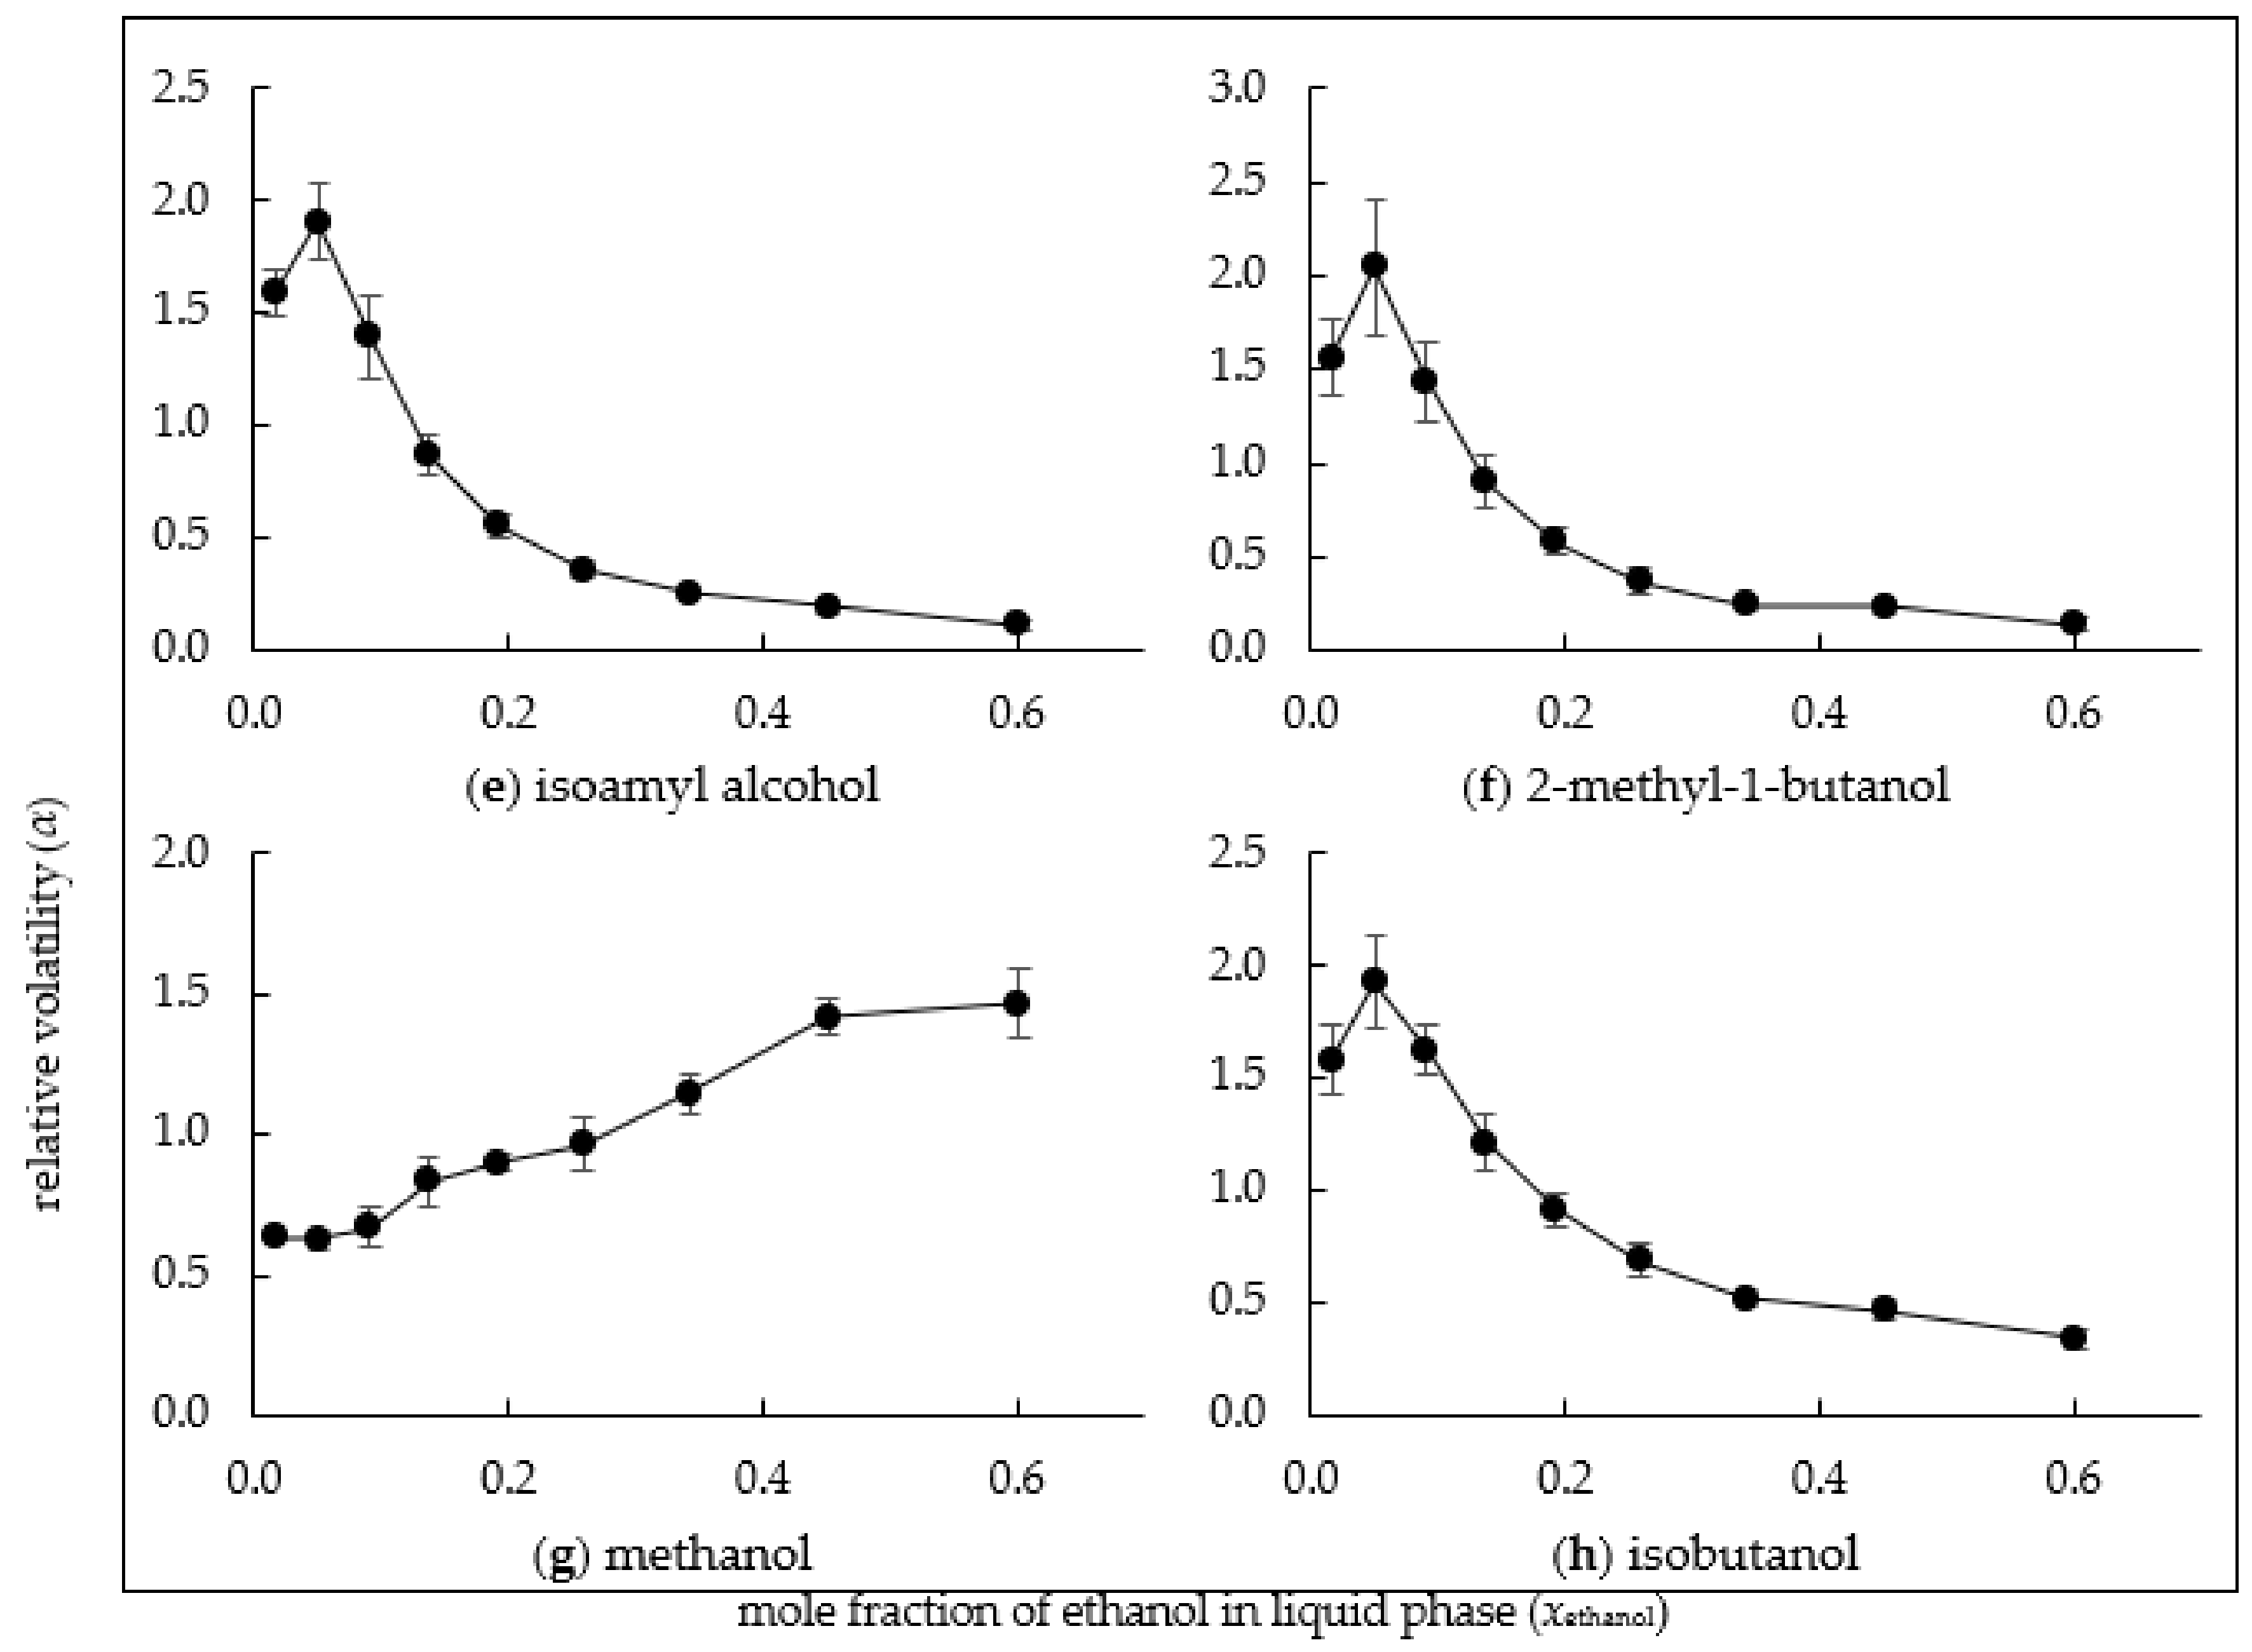
3.2. Relative Volatility of Alcohols

The relative volatilities of several alcohols as a function of the liquid ethanol molar fraction   x ethanol were determined (Figure 2). All alcohols except methanol showed a similar behaviour. At low ethanol concentrations, the relative volatility was high (>1), i.e., the alcohols were enriched in the vapour phase with respect to ethanol. In contrast, the relative volatility was low at high ethanol concentrations (<1), i.e., the alcohols were depleted in the vapour phase with respect to ethanol. This is in line with the observation in fruit brandy distillations that higher alcohols are tail components [16], i.e., are collected late in distillation, when the alcohol concentration drops in the distillation column. Higher alcohols, also known as “fusel alcohols,” are the largest group of aroma volatiles in fruit distillates [17]. However, they can also impart an unpleasant off-flavour, particularly at higher concentrations [18]. Therefore, the increment of higher alcohols in fractions at the late stage of distillation serves as a critical criterion for distinguishing the tail fraction from the heart fractions [16].
Methanol behaved differently. A steady increase in relative volatility was observed with rising ethanol concentrations. However, all in all, the depletion or enrichment with respect to ethanol was only modest. It varied between 0.7 and 1.5. In previous studies, methanol appeared in every fraction with modest changes in concentration throughout the distillation process [19,20,21,22]. These findings are consistent with the data obtained in our study. Phenethyl alcohol could not been measured, since its concentrations in the samples were below the detection limit of GC-FID.

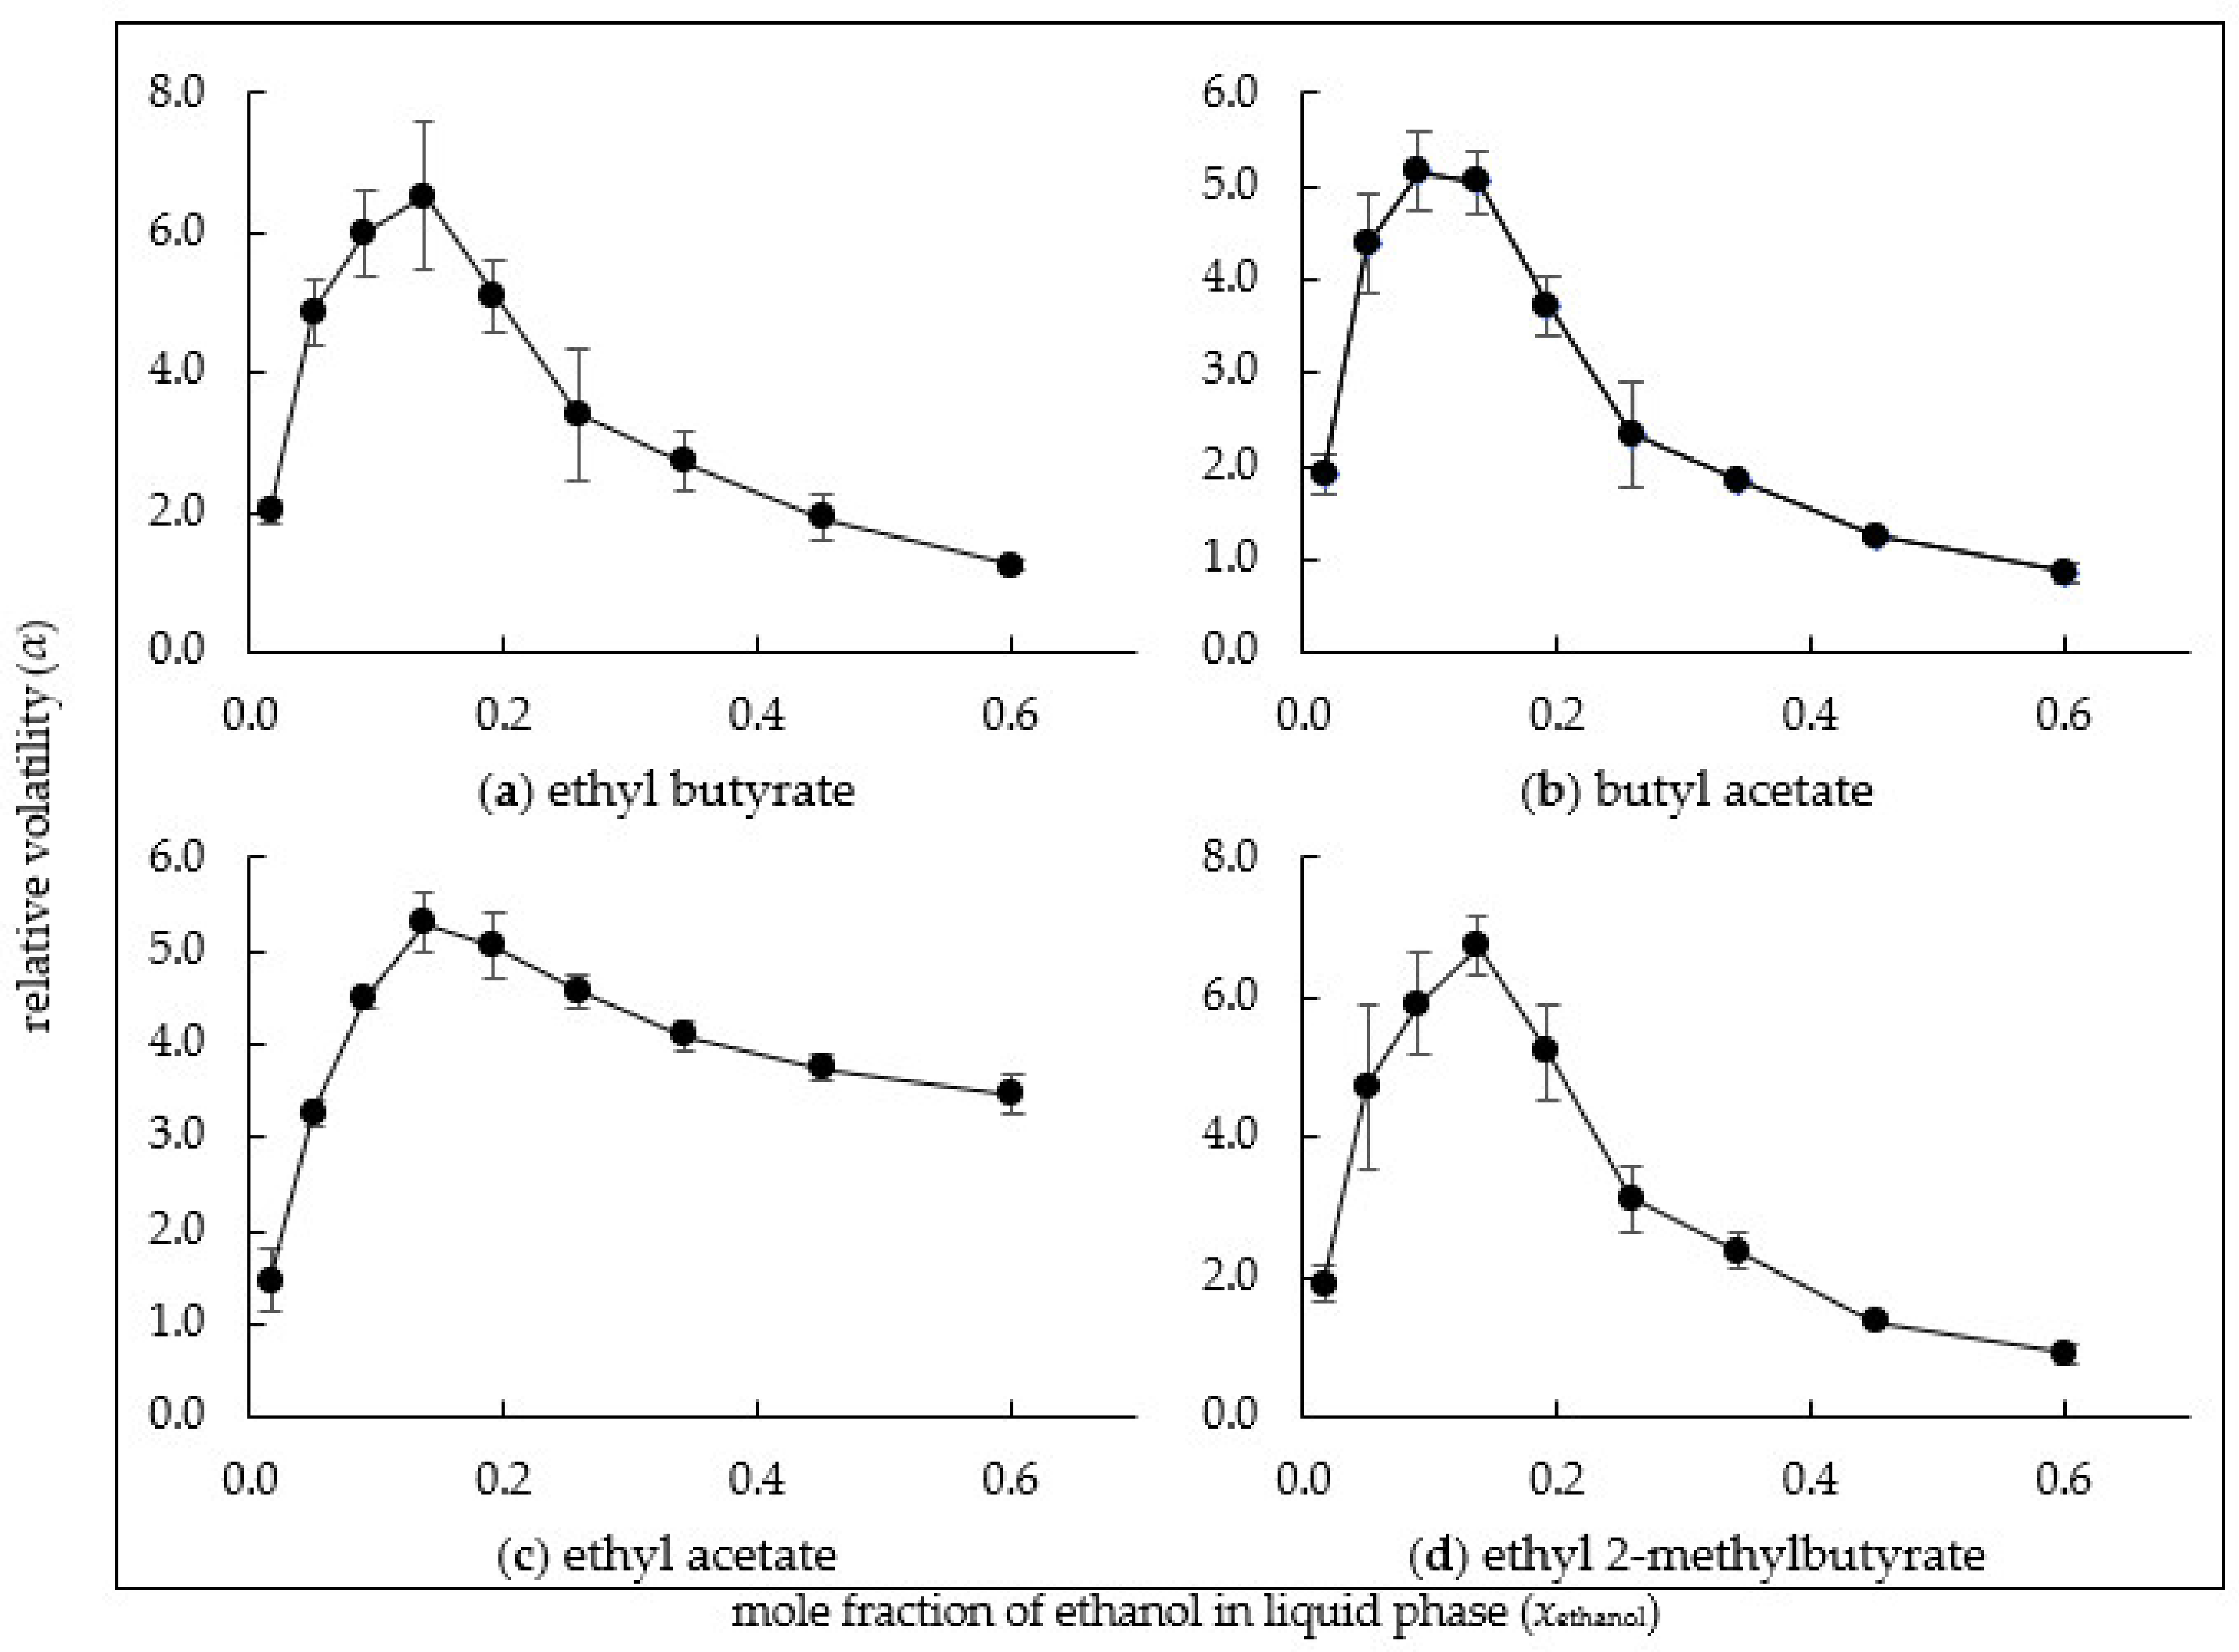
3.3. Relative Volatility of Esters

As a next group of compounds important for the flavour of distilled spirits, the relative volatilities of esters were determined (Figure 3). Basically, the esters behaved similar to the alcohols with respect to their ethanol dependence. At low ethanol concentrations, the relative volatilities were high and at high ethanol concentrations, they were low. The main difference was that the relative volatilities were higher than one at almost all ethanol concentrations. The compounds are thus very volatile and were enriched in the vapour phase with respect to ethanol at all ethanol concentrations. Unlike alcohols, esters do not have a hydrogen to form hydrogen bonds with ethanol and water molecules, which may be the reason for the higher relative volatilities compared to alcohols. Ethyl acetate is usually considered a head component in fruit brandy distillations. However, its relative volatility was higher at low ethanol concentrations than at higher concentrations, typical of a tail component. Presumably, these differences in relative volatility are not relevant in practical distillations, because due to its high volatility, ethyl acetate is quickly depleted from the mash and is thus not found in later fractions of the distillate. Spaho conducted a study on the distillation of three types of plums using three cutting techniques and found that ethyl acetate concentrations in head fractions were 4–6 times higher than in heart fractions in all distillations, consistent with our study’s findings [23]. The same observations were reported in other studies as well [21,22,24].

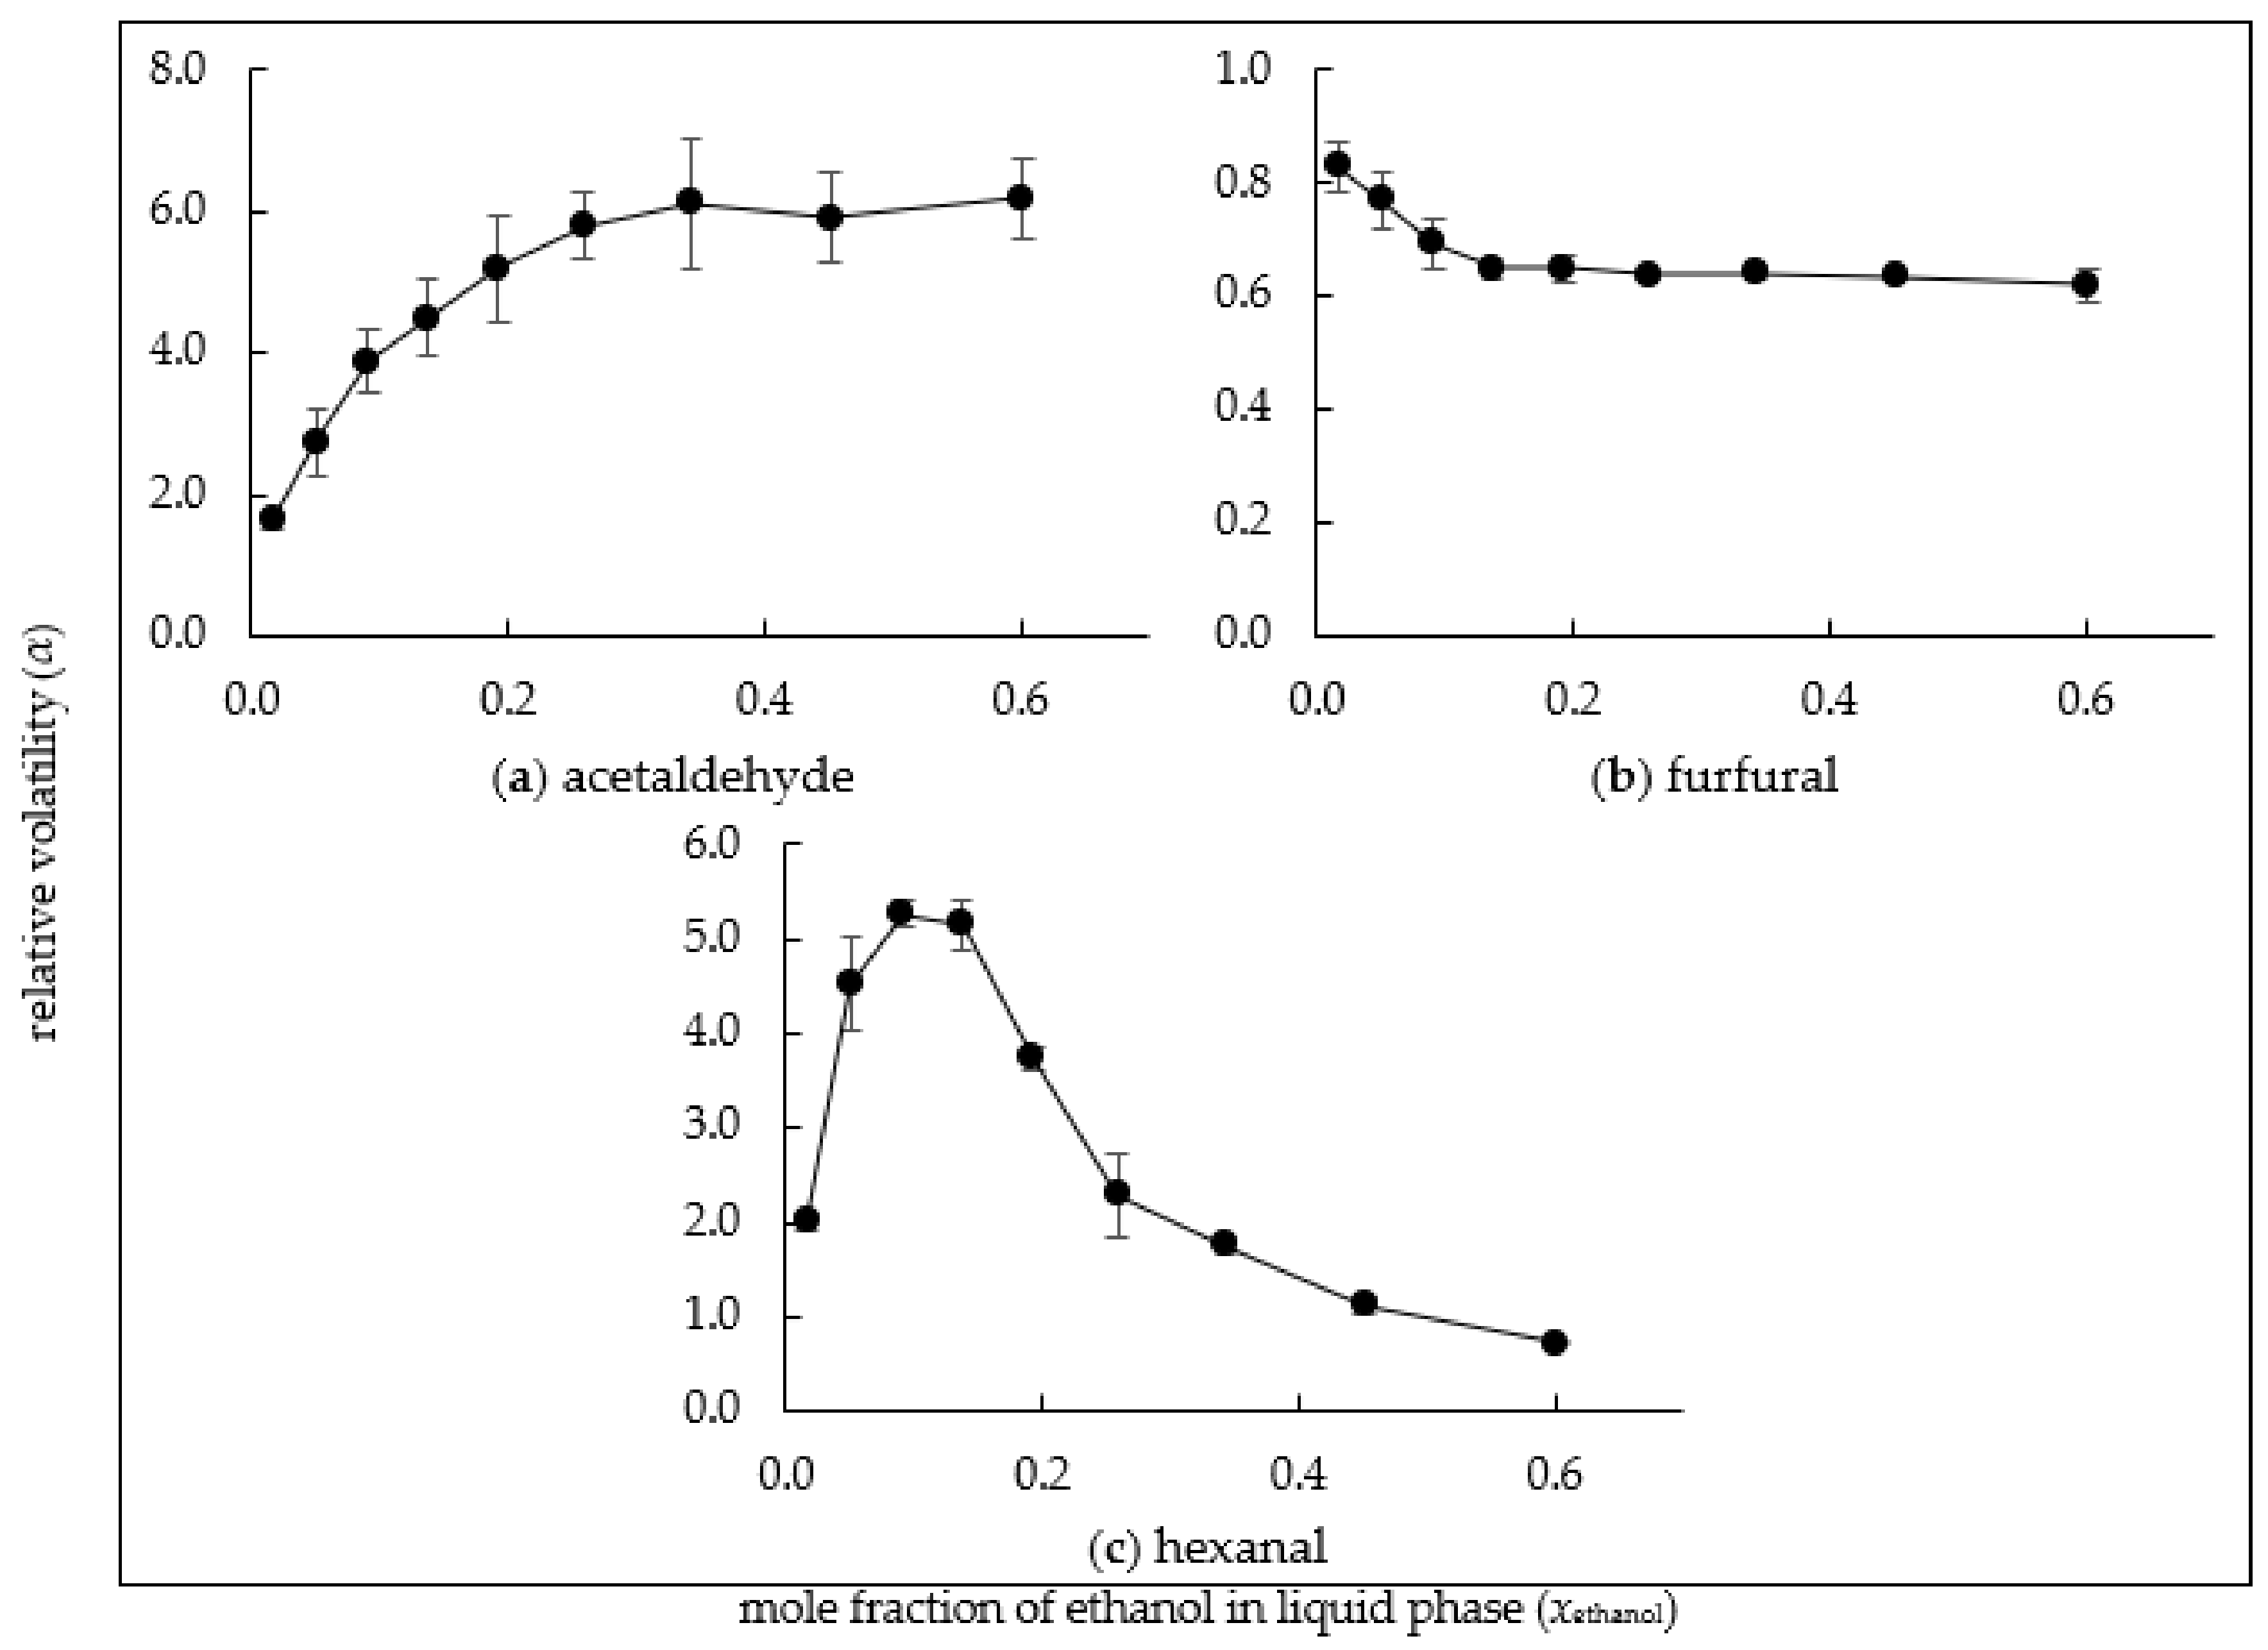
3.4. Relative Volatility of Aldehydes

Three aldehydes were measured (Figure 4). Their ethanol dependence of the relative volatilities proved to be different. The volatility of acetaldehyde was low at low ethanol concentrations and high at high ethanol concentrations. Acetaldehyde is a classical head component in fruit brandy distillations, and several studies have documented high concentrations of acetaldehyde in the head fractions compared to the heart and the tail fractions [20,21,22]. The observed ethanol dependence of its relative volatility is in line with this finding. Thus, due to its high volatility at high ethanol concentrations, it is collected early in distillation. Hexanal resembled the esters in its relative volatility profile. At low ethanol concentrations, the relative volatility was high and at high ethanol concentrations, it was low. The relative volatility of furfural did not depend much on the ethanol concentration (α = 0.6–0.8). It was thus slightly depleted with respect to ethanol over the whole concentration range.

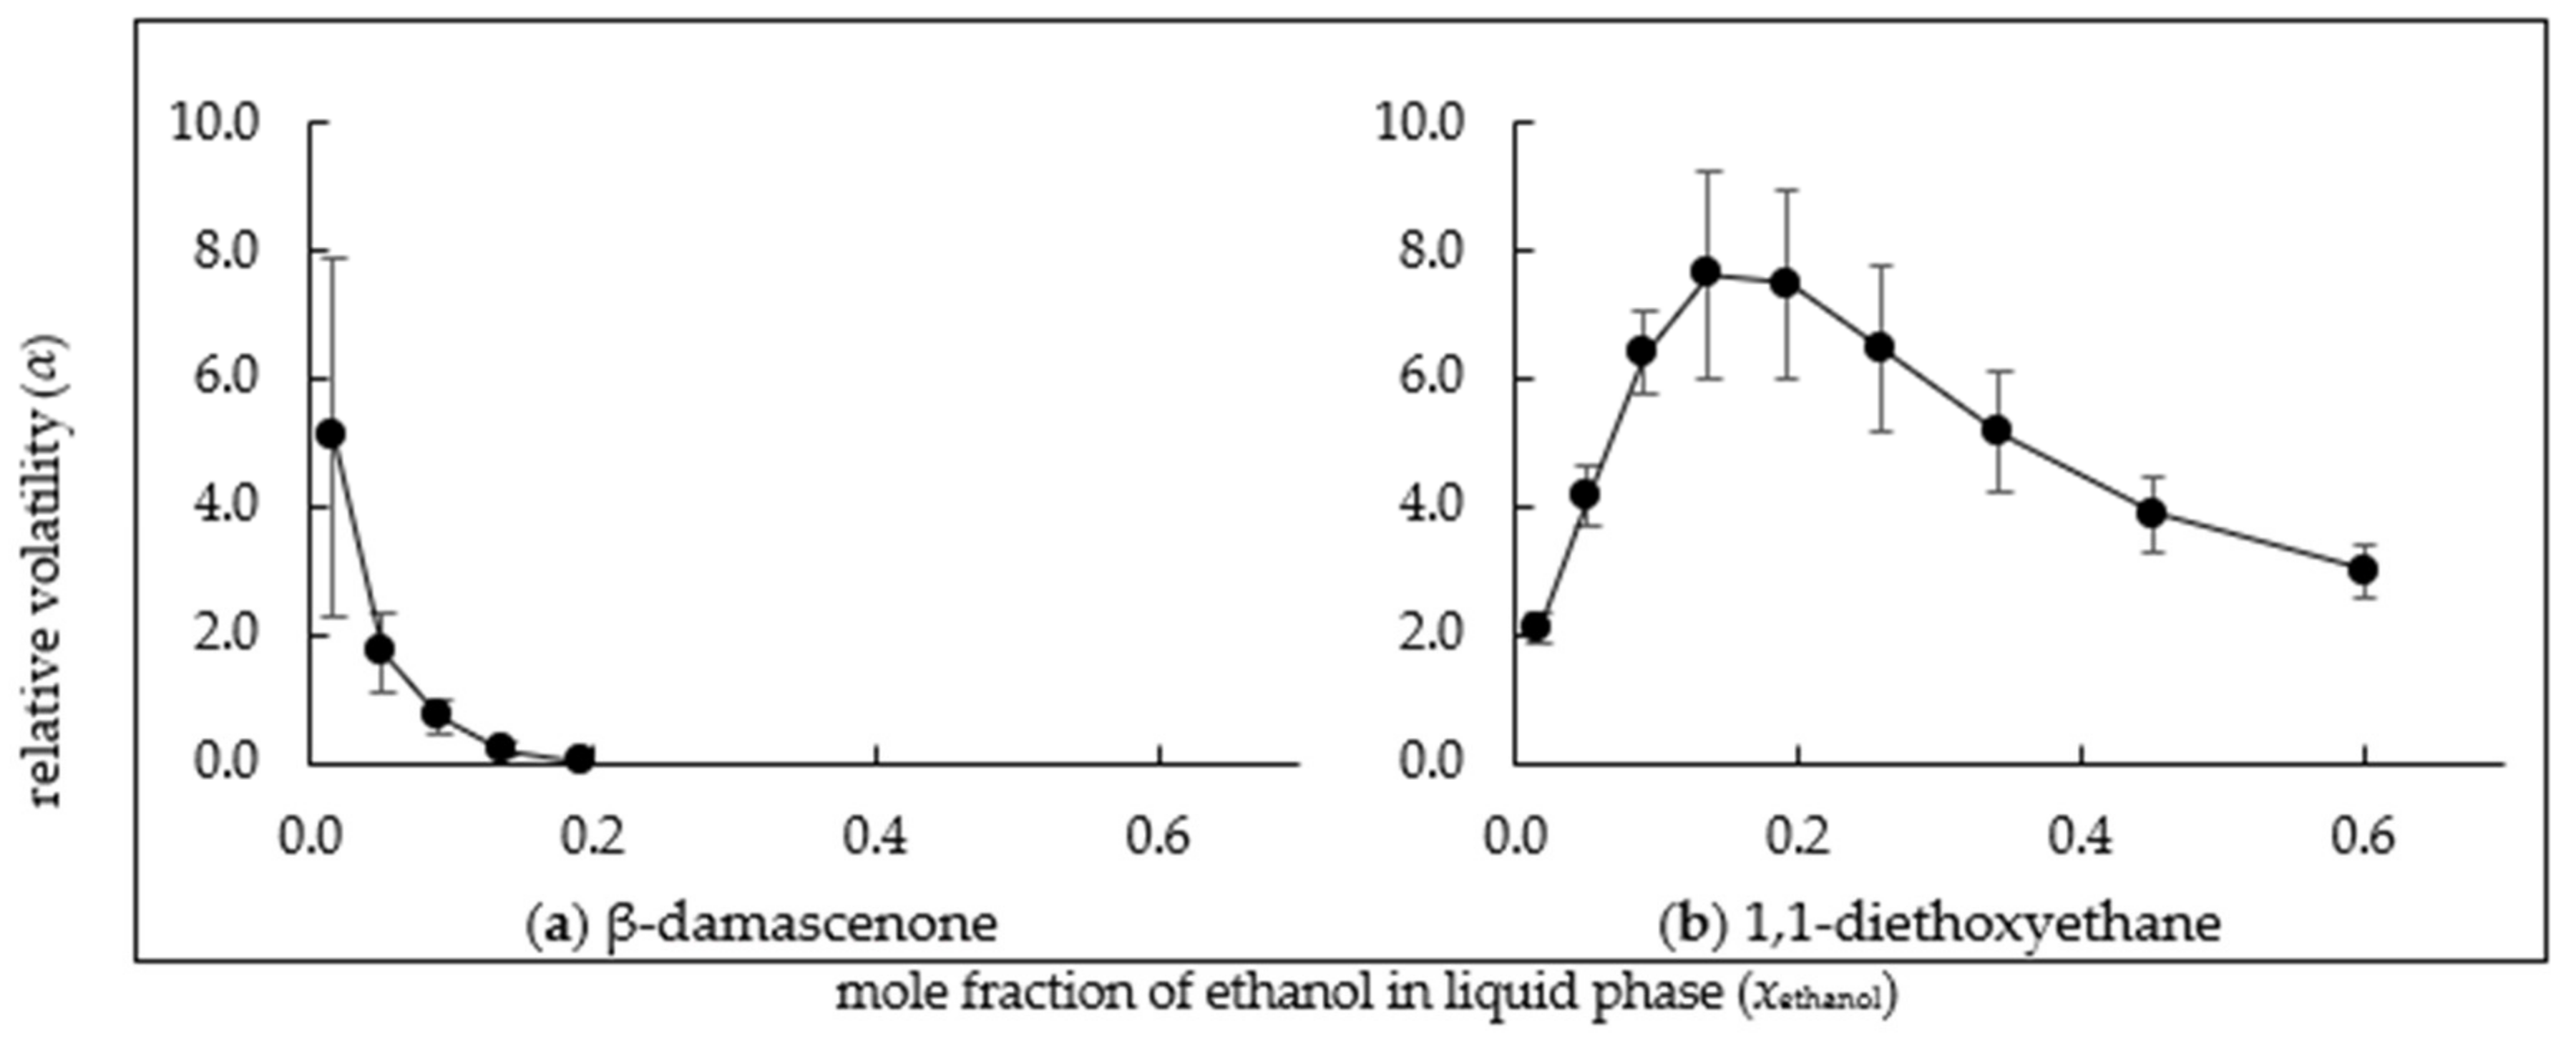
3.5. Relative Volatility of β-Damascenone and 1,1-Diethoxyethane

Two compounds crucial for fruity aroma were tested [11,12]. The relative volatilities of this acetal and ketone, respectively, are shown in Figure 5. β-damascenone had a high relative volatility at very low ethanol concentrations, but an extremely low relative volatility at high ethanol concentrations. It is thus a classical tail component. It can be expected that a large fraction of this aroma compound is lost in the tail fraction during fruit brandy distillations. This finding is in line with the literature that compared the concentrations of beta damascenone in different fractions from grape brandies [22,24]. For 1,1-diethoxyethane, the relative volatility was also higher at low ethanol concentrations, but due to its generally higher volatility across the whole ethanol concentration range, it can be expected that a large portion of it will be retained in the final spirit distillate, especially from the early stages of distillation, as already observed in a previous study [20].

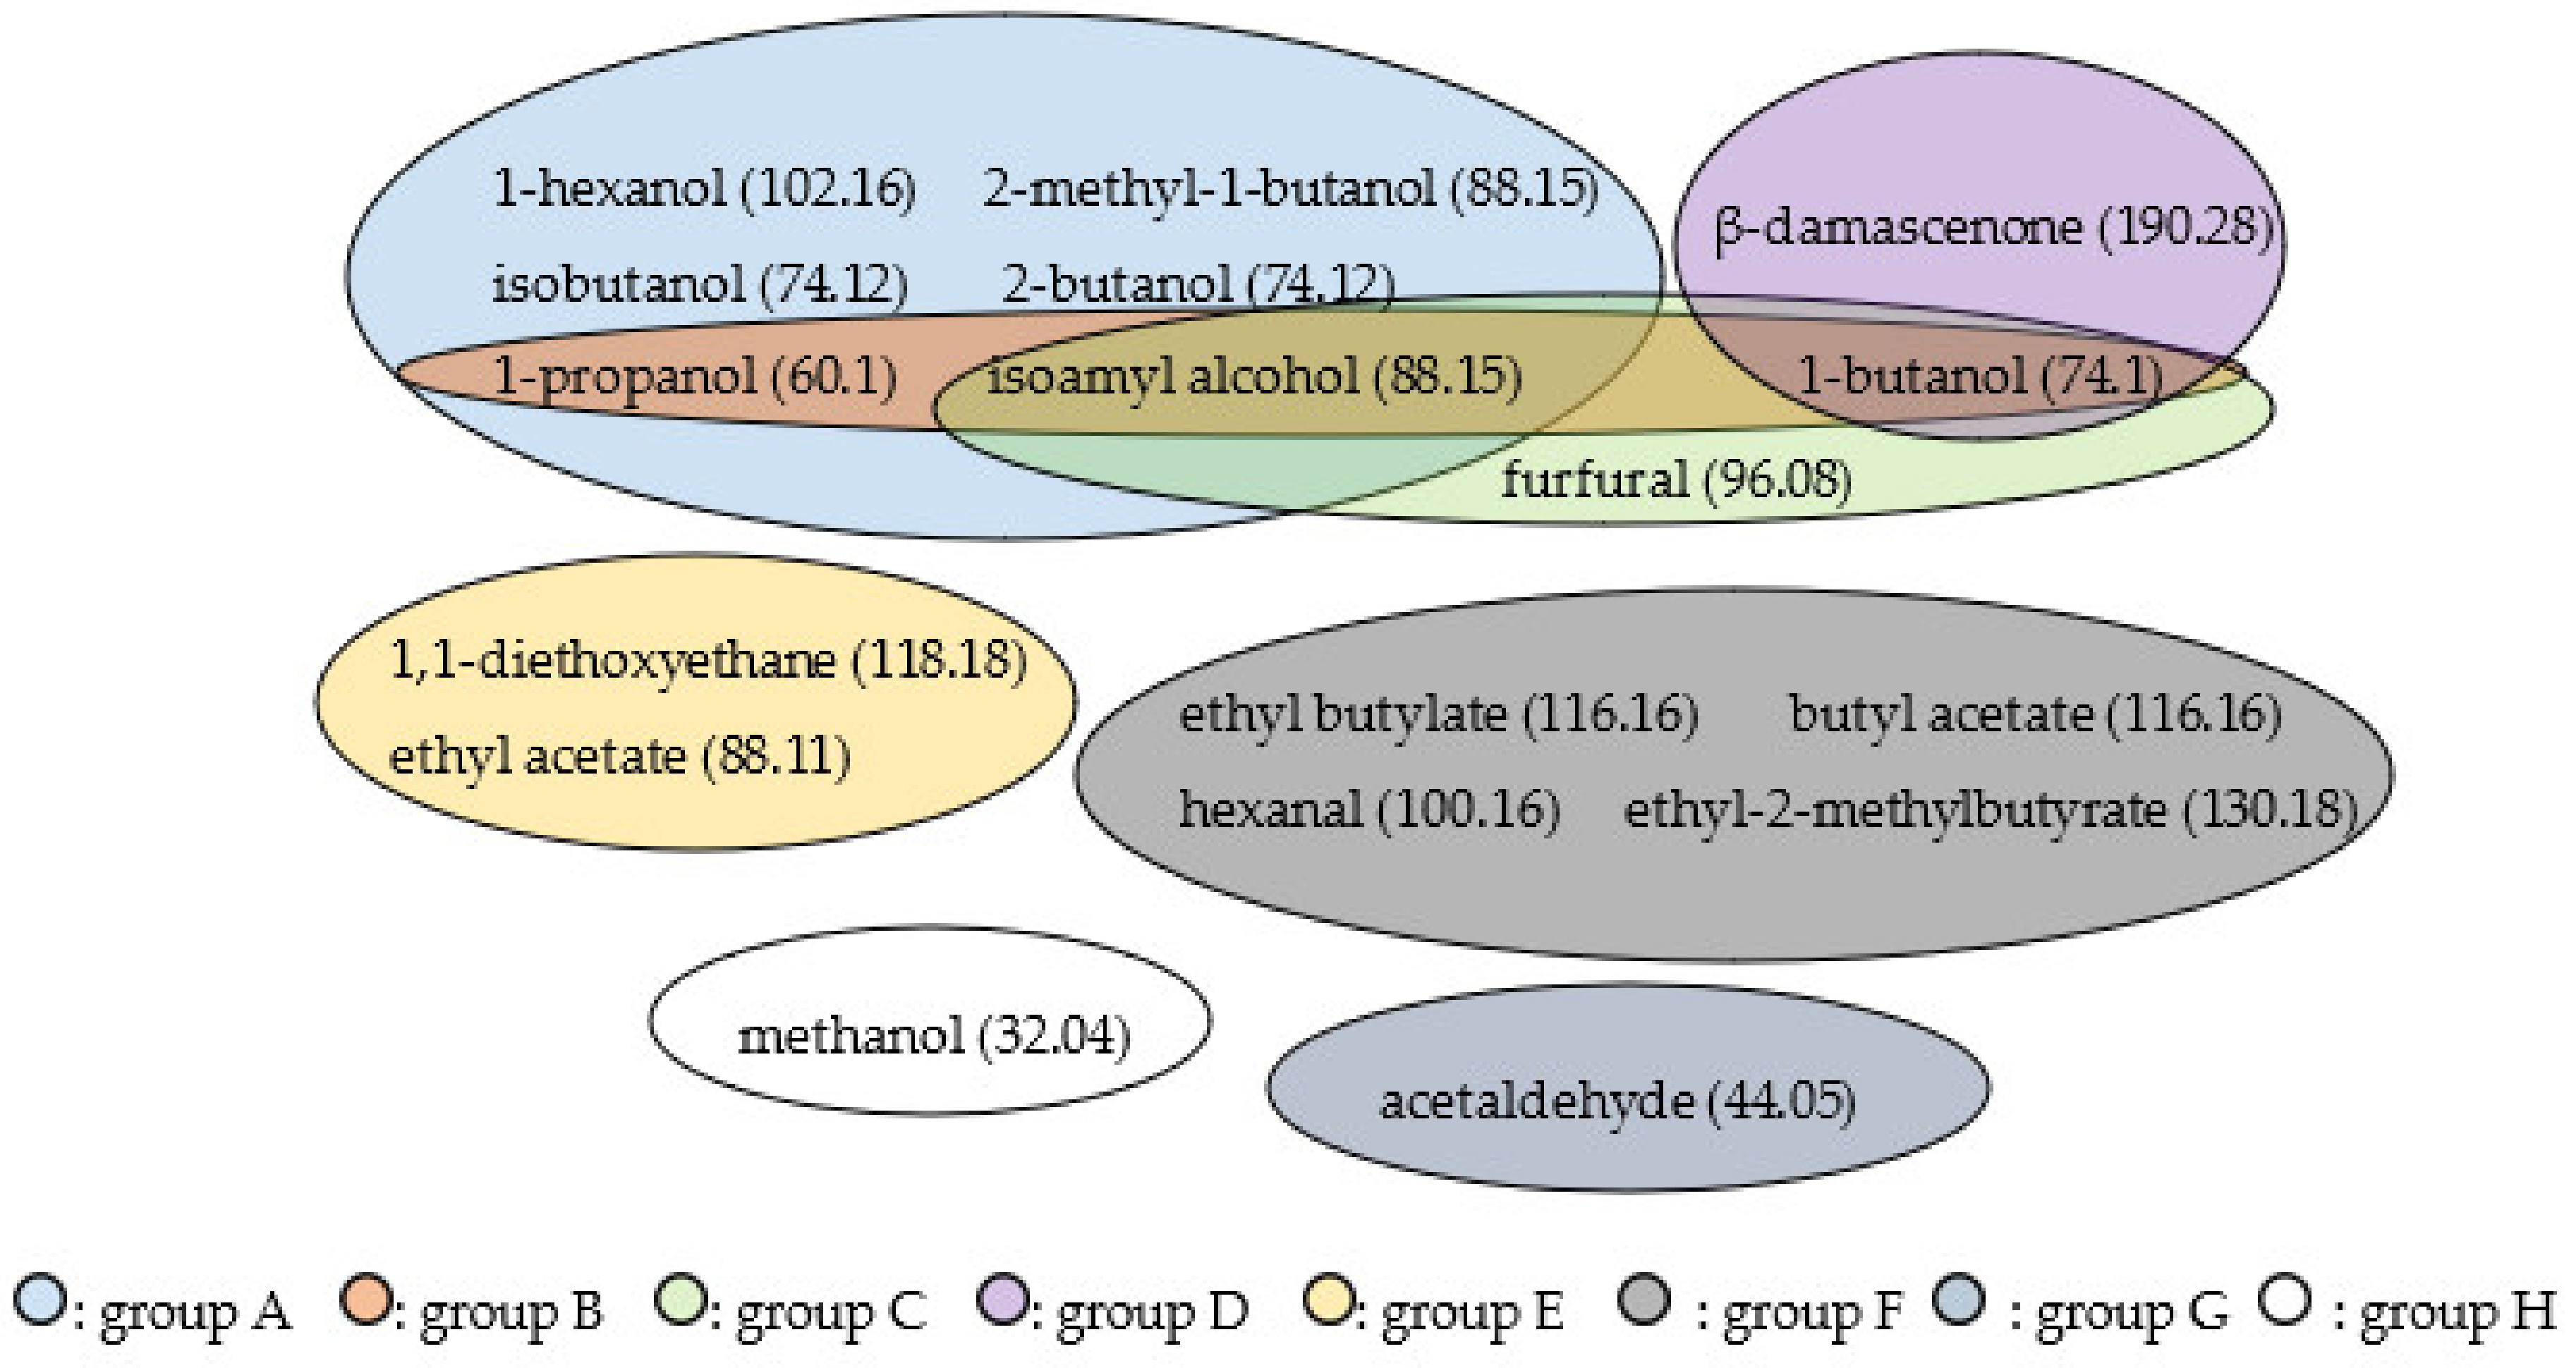
3.6. Results of Statistical Analysis

The results of the two-way ANOVA (molecular weight, functional group, and the interaction as factors) are presented in Table 2. The analysis of variances showed highly significant effects of molecular weight and the functional group on the relative volatility of compounds.
Based on the Pearson’s correlation matrix between relative volatilities of flavour compounds (Table A1 and Table A2), compounds with high correlations (>0.8) were grouped together and presented in a Venn diagram (Figure 6).
Five alcohols, 1-hexanol, 2-methyl-1-butanol, isobutanol, 2-butanol, and 1-butanol belong to either group A or B. Isoamyl alcohol and 1-propanol belong to the overlapping area of the two groups. As to esters, all esters except ethyl acetate belonged to group F. These results indicate that the behaviours of alcohols and esters strongly depend on their functional group. However, all three aldehydes were assigned to three different groups: group C, group F, and group G. Acetaldehyde and methanol were not highly correlated with other compounds, assumingly due to their low molecular weight.
Analysis of the variances from the two-way ANOVA analysis suggested that the relative volatilities of compounds were strongly influenced by the functional group and molecular weight. However, the behaviour of the compound cannot be elucidated by these two factors alone, since ethyl acetate was not assigned to group F, which the other esters were assigned to it. This indicates that more factors, such as the polarity of compounds and complex intermolecular interactions, are involved in the determination of relative volatilities. In general, the Venn diagram based on Pearson’s correlation matrix showed that the prediction of the behaviour of compounds from the perspective of the functional group was possible to some extent, especially for alcohols and esters.

3.7. Validation of Results

To validate our results, they were compared with previously published data [4,5,14] (Figure 7). Pearson’s correlations were calculated solely for the reference data, where the experiments were conducted in triplicate. All the results showed a good correlation with the reference data (r > 0.8), particularly for methanol and isobutanol (r > 0.9). The data obtained in this study for acetaldehyde and isoamyl alcohol were consistent with the reference data (Pearson’s correlations not shown). The only compound that did not correlate well with the reference data was 1,1-diethoxyethane (Pearson’s correlations not shown), which was due to the incoherence of the reference data. Nonetheless, the data obtained for 1,1-diethoxyethane in this study were coherent as a set.

4. Conclusions

The relative volatilities of seventeen compounds were determined, among which the relative volatilities of six compounds (2-butanol, hexanal, ethyl butyrate, butyl acetate, ethyl 2-methylbutyrate, and β-damascenone), to our knowledge, had not been reported so far. All the data in this study, both ethanol–water equilibrium and relative volatilities, corresponded well with previously published reference data, except for 1,1-diethoxyethane. Due to the nature of our simple distillation apparatus, the thermodynamic equilibrium could not be reached in our system. Despite its technically simple setup, high correlations with the reference data, measured by circulating distillation units, were observed. As a conclusion, the method with the simple distillation unit proved to be valid for measuring the empirical relative volatility of flavour compounds. Hence, simple distillation setups could help to understand flavour compound behaviour during fruit spirit distillation in the future.

Author Contributions

Conceptualization, investigation, and writing, M.Y.; supervision and editing, R.K.; funding acquisition, project administration, and editing, D.E. All authors have read and agreed to the published version of the manuscript.

Funding

This IGF Project of the FEI was supported by AiF within the program for promoting the Industrial Collective Research (IGF) of the German Ministry of Economic Affairs and Energy (BMWi), based on a resolution of the German Parliament, grant number AiF 21620 N.

Data Availability Statement

Not applicable.

Acknowledgments

The authors are grateful for analytical and technical support from Julia Pesl.

Conflicts of Interest

The authors declare no conflict of interest.

Appendix A

Table A1. Pearson’s correlation matrix between relative volatilities.
1-Hexanol1,1-Diethoxyethane2-Methyl-1-ButanolAcetaldehydeIsobutanol2-Butanol1-PropanolIsoamyl Alcohol
1,1-diethoxyethane−0.382
2-methyl-1-butanol0.964 ***−0.096
acetaldehyde−0.767 ***0.171−0.883 ***
isobutanol0.927 ***0.0290.985 ***−0.864 ***
2-butanol0.835 ***0.1610.936 ***−0.821 ***0.976 ***
1-propanol0.842 ***0.0130.939 ***−0.918 ***0.962 ***0.959 ***
isoamyl alcohol0.861 ***−0.1190.970 ***−0.905 ***0.963 ***0.946 ***0.950 ***
furfural0.633 **−0.384 *0.778 ***−0.904 ***0.726 ***0.682 ***0.789 ***0.840 ***
methanol−0.686 **−0.205−0.824 ***0.796 ***−0.878 ***−0.925 ***−0.927 ***−0.865 ***
ethyl acetate−0.4240.874 ***−0.3470.535 **−0.234−0.106−0.289−0.393 *
1-butanol0.592 **−0.2480.797 ***−0.830 ***0.798 ***0.758 ***0.831 ***0.840 ***
ethyl butylate0.1560.763 ***0.423 *−0.2600.522 **0.636 **0.478 *0.409 *
hexanal0.3720.571 **0.594 **−0.3740.687 ***0.763 ***0.624 **0.567 **
butyl acetate0.2820.522 **0.541**−0.2990.644 **0.732 ***0.589 **0.530 **
ethyl-2-methylbutyrate0.1640.669 **0.426 *−0.1840.541 **0.623 **0.483 *0.367
β-damascenone0.130−0.750 **0.224−0.548 *0.161−0.0100.3260.327
* p < 0.05; ** p < 0.01; *** p < 0.001.
Table A2. Pearson’s correlation matrix between relative volatilities (Continued).
FurfuralMethanolEthyl Acetate1-ButanolEthyl ButylateHexanalButyl AcetateEthyl-2-Methylbutyrate
1,1-diethoxyethane
2-methyl-1-butanol
acetaldehyde
isobutanol
2-butanol
1-propanol
isoamyl alcohol
furfural
methanol−0.679 ***
ethyl acetate−0.708 ***0.112
1-butanol0.789 ***−0.709 ***−0.527 **
ethyl butylate0.034−0.580 **0.591 **0.266
hexanal0.156−0.661 **0.430 *0.482 *0.937 ***
butyl acetate0.095−0.644 **0.445 *0.452 *0.892 ***0.979 ***
ethyl-2-methylbutyrate−0.057−0.544 **0.599 **0.2980.895 ***0.947 ***0.950 ***
β-damascenone0.527 *−0.152−0.808 **0.883 ***−0.757 **−0.699 **−0.672 **−0.749 **
* p < 0.05; ** p < 0.01; *** p < 0.001.

Appendix B

Table A3. Duration time for sampling and vapour temperatures during distillation of control experiments and flavour category 1.
ControlFlavour Category 1
Ethanol Concentration% (v/v)xethanolD.T. (sec)Temp. 1 (°C)Temp. 2 (°C)D.T. (sec)Temp. 1 (°C)Temp. 2 (°C)
50.0159227 ± 2.9487.4 ± 0.70493.6 ± 0.704221 ± 13.390.8 ± 0.32794.4 ± 0.492
150.0509139 ± 10.582.2 ± 0.57986.8 ± 0.579131 ± 4.7884.4 ± 4.9986.2 ± 0.432
250.0910116 ± 19.479.1 ± 4.2483.4 ± 4.235113 ± 8.9980.2 ± 0.34082.3 ± 0.294
350.1371107 ± 14.579.7 ± 0.26280.4 ± 0.262105 ± 3.6879.2 ± 0.53580.6 ± 0.464
450.1921107 ± 4.2477.7 ± 0.66578.3 ± 0.665102 ± 5.4478.3 ± 0.35679.3 ± 0.455
550.2588103 ± 6.0278.4 ± 0.21678.9 ± 0.216101 ± 0.9477.4 ± 0.53178.5 ± 0.082
650.3430112 ± 10.976.8 ± 0.45077.4 ± 0.450101 ± 6.4876.7 ± 0.47877.6 ± 0.386
750.4518102 ± 2.0577.3 ± 0.08277.7 ± 0.08296 ± 5.675.5 ± 0.33077.2 ± 0.787
850.601696.3 ± 0.94375.4 ± 0.16376.4 ± 0.16391 ± 7.673.4 ± 1.6775.3 ± 0.957
Note: Temp. 1 and temp. 2 were vapour temperatures when the first sample droplet and the last sample droplet fell into a graduated cylinder, respectively. D.T. is duration time for sampling.
Table A4. Duration time for sampling and vapour temperatures during distillation of experiments of flavour category 2 and flavour category 3.
Flavour Category 2Flavour Category 3
Ethanol Concentration % (v/v)xethanolD.T. (sec)Temp. 1 (°C)Temp. 2 (°C)D.T. (sec)Temp. 1 (°C)Temp. 2 (°C)
50.0159218 ± 10.885.5 ± 0.36895.8 ± 0.929263 ± 29.185.7 ± 0.83893.1 ± 0.732
150.0509144 ± 8.6077.6 ± 0.65582.2 ± 0.613155 ± 17.583.5 ± 0.46487.0 ± 0.368
250.0910114 ± 7.3676.4 ± 0.38678.0 ± 0.668128 ± 12.078.1 ± 0.30080.0 ± 0.386
350.1371113 ± 3.7475.3 ± 0.41177.8 ± 0.249121 ± 16.478.2 ± 0.24981.4 ± 0.492
450.1921106 ± 6.6874.5 ± 1.1478.2 ± 0.249119 ± 9.0377.6 ± 0.38679.0 ± 0.400
550.2588104 ± 4.7173.8 ± 0.24977.5 ± 0.478118 ± 10.877.4 ± 0.82979.2 ± 0.125
650.3430102 ± 3.6873.5 ± 0.28775.4 ± 0.63898 ± 0.4777.1 ± 0.55678.1 ± 0.497
750.451890 ± 8.873.9 ± 0.53575.1 ± 1.2087 ± 3.176.0 ± 1.55878.2 ± 0.125
850.601694 ± 3.470.8 ± 0.75972.7 ± 1.3184 ± 1275.3 ± 0.87376.9 ± 0.125
Note: Temp. 1 and temp. 2 were vapour temperatures when the first sample droplet and the last sample droplet fell into a graduated cylinder, respectively. D.T. is duration time for sampling.

References

  1. Puentes, C.; Joulia, X.; Athès, V.; Esteban-Decloux, M. Review and Thermodynamic Modeling with NRTL Model of Vapor-Liquid Equilibria (VLE) of Aroma Compounds Highly Diluted in Ethanol-Water Mixtures at 101.3 kPa. Ind. Eng. Chem. Res. 2018, 57, 3443–3470. [Google Scholar] [CrossRef] [Green Version]
  2. Puentes, C.; Joulia, X.; Paricaud, P.; Giampaoli, P.; Athès, V.; Esteban-Decloux, M. Vapor-Liquid Equilibrium of Ethyl Lactate Highly Diluted in Ethanol-Water Mixtures at 101.3 kPa. Experimental Measurements and Thermodynamic Modeling Using Semiempirical Models. J. Chem. Eng. Data 2018, 63, 365–379. [Google Scholar] [CrossRef] [Green Version]
  3. Deterre, S.; Albet, J.; Joulia, X.; Baudouin, O.; Giampaoli, P.; Decloux, M.; Athès, V. Vapor-liquid equilibria measurements of bitter orange aroma compounds highly diluted in boiling hydro-alcoholic solutions at 101.3 kPa. J. Chem. Eng. Data 2012, 57, 3344–3356. [Google Scholar] [CrossRef]
  4. Williams, C.G. Vapor-liquid equilibria of organic homologues in ethanol-water solutions. Am. J. Enol. Vitic. 1962, 13, 169–182. [Google Scholar]
  5. Ikari, A.; Hatate, Y.; Fukumoto, T. Vapor-Liquid Equilibria of a Minute Amount of Methanol, Isovaleraldehyde and Diacetyl in Aqueous Ethanol Solution under Reduced Pressure. Kagaku Kogaku Ronbunshu 1998, 24, 111–115. [Google Scholar] [CrossRef] [Green Version]
  6. Ikari, A.; Kubo, R. Behavior of Various Impurities in Simple Distillation of Aqueous Solution of Ethanol. J. Chem. Eng. Jpn. 1975, 8, 294–299. [Google Scholar] [CrossRef] [Green Version]
  7. Ikari, A.; Hatate, Y.; Yanagida, M.; Eda, M. Vapor-Liquid Equilibria of a Minute Amount of n-Propyl, Isobutyl, and Isoamyl Alcohol in Aqueous Ethanol Solution under Reduced Pressure. Kagaku Kogaku Ronbunshu 1990, 16, 1101–1104. [Google Scholar] [CrossRef] [Green Version]
  8. Ikari, A.; Yasuo, H.; Seiichi, K.; Yukinori, S. Behavior of a Minute amount of Furfural Distillation of Aqueous Ethanol Solution in a simple mathematical model employing Murphree. J. Chem. Eng. Jpn. 1984, 17, 486–490. [Google Scholar] [CrossRef] [Green Version]
  9. Ikari, A.; Yasuo, H.; Aiko, R. Vapor-Liquid Equilibria of Trace Isobutyraldehyde, Ethyl Acetate and Isoamyl Acetate in Aqueous Ethanol Solution under Reduced Pressure. Kagaku Kogaku Ronbunshuu 1998, 24, 678–681. [Google Scholar] [CrossRef] [Green Version]
  10. Gillespie, C.T.D. Vapor-Liquid Equilibrium Still for Miscible Liquids. Ind. Eng. Chem. 1946, 18, 575–577. [Google Scholar] [CrossRef]
  11. Martín, A.; Carrillo, F.; Trillo, M.L.; Rosello, A. A quick method for obtaining partition factor of congeners in spirits. Eur. Food Res. Technol. 2009, 229, 697–703. [Google Scholar] [CrossRef]
  12. Athès, V.; Lillo, Y.P.M.; Bernard, C.; Pérez-Correa, R.; Souchon, I. Comparison of Experimental Methods for Measuring Infinite Dilution Volatilities of Aroma Compounds in Water/Ethanol Mixtures. J. Agric. Food Chem. 2004, 52, 2021–2027. [Google Scholar] [CrossRef] [PubMed]
  13. Lei, Z.; Wang, H.; Zhou, R.; Duan, Z. Influence of salt added to solvent on extractive distillation. Chem. Eng. J. 2002, 87, 149–156. [Google Scholar] [CrossRef]
  14. Athès, V.; Paricaud, P.; Ellaite, M.; Souchon, I.; Fürst, W. Vapour-liquid equilibria of aroma compounds in hydroalcoholic solutions: Measurements with a recirculation method and modelling with the NRTL and COSMO-SAC approaches. Fluid Phase Equilib. 2008, 265, 139–154. [Google Scholar] [CrossRef]
  15. Kurihara, K.; Nakamichi, M.; Kojima, K. Isobaric Vapor-Liquid Equilibria for Methanol + Ethanol + Water and the Three Constituent Binary Systems. J. Chem. Eng. Data 1993, 38, 446–449. [Google Scholar] [CrossRef]
  16. Heller, D.; Einfalt, D. Reproducibility of Fruit Spirit Distillation Processes. Beverages 2022, 8, 20. [Google Scholar] [CrossRef]
  17. Spaho, N. Distillation Techniques in the Fruit Spirits Production. In Distillation—Innovative Applications and Modeling, 1st ed.; Mendes, M., Ed.; IntechOpen: London, UK, 2017; pp. 129–152. [Google Scholar]
  18. de la Fuente-Blanco, A.; Saenz-Navajas, M.P.; Ferreira, V. On the effects of higher alcohols on red wine aroma. Food Chem. 2016, 210, 107–114. [Google Scholar] [CrossRef]
  19. García-Llobodanin, L.; Achaerandio, I.; Ferrando, M.; Güell, C.; López, F. Pear Distillates from Pear Juice Concentrate: Effect of Lees in the Aromatic Composition. J. Agric. Food Chem. 2007, 55, 3462–3468. [Google Scholar] [CrossRef]
  20. Zheng, J.; Liang, R.; Huang, J.; Zhou, R.P.; Chen, Z.J.; Wu, C.D.; Zhou, R.Q.; Liao, X.P. Volatile Compounds of Raw Spirits from Different Distilling Stages of Luzhou-flavor Spirit. Food Sci. Technol. Res. 2014, 20, 283–293. [Google Scholar] [CrossRef] [Green Version]
  21. Claus, J.M.; Berglund, A.K. Fruit Brandy production by batch column distillation with reflux. J. Food Process Eng. 2005, 28, 53–67. [Google Scholar] [CrossRef]
  22. Lukić, I.; Tomas, S.; Miličević, B.; Radeka, S.; Peršurić, Đ. Behaviour of Volatile Compounds during Traditional Alembic Distillation of Fermented Muscat Blanc and Muškat Ruža Porečki Grape Marcs. J. Inst. Brew. 2011, 117, 440–450. [Google Scholar] [CrossRef]
  23. Spaho, N.; Dürr, P.; Grba, S.; Velagić-Habul, E.; Blesić, M. Effects of distillation cut on the distribution of higher alcohols and esters in brandy produced from three plum varieties. J. Inst. Brew. 2013, 119, 48–56. [Google Scholar] [CrossRef]
  24. Tian, T.T.; Ruan, S.L.; Zhao, Y.P.; Li, J.M.; Yang, C.; Cao, H. Multi-objective evaluation of freshly distilled brandy: Characterisation and distribution patterns of key odour-active compounds. Food Chem. X 2022, 14, 100276. [Google Scholar] [CrossRef] [PubMed]
Figure 1. Vapour–liquid phase equilibrium data of ethanol and water mixtures (n = 3). The reference data were measured by means of extractive distillation by Lei et al. [13], using a circulating distillation unit by Ikari et al. [5] and a liquid–vapour ebullition-type equilibrium still [15]. Pearson’s correlation coefficients (r_Lei et al., 2022, r_Ikari et al., 1998, and r_Kurihara et al., 1993) were calculated between the data in this study and the reference data.
Beverages 09 00032 g001
Figure 2. Relative volatility of alcohols as a function of the ethanol concentration in the liquid phase (n = 3). Relative volatility of (a) 1-hexanol, (b) 2-butanol, (c) 1-butanol, (d) 1-propanol, (e) isoamyl alcohol, (f) 2-methyl-1-butanol, (g) methanol and (h) isobutanol are shown in sub-figures (ah).
Beverages 09 00032 g002aBeverages 09 00032 g002b
Figure 3. Relative volatility of esters as a function of the ethanol concentration in the liquid phase (n = 3). Relative volatility of (a) ethyl butyrate, (b) butyl acetate, (c) ethyl acetate and (d) ethyl 2-methylbutyrate are shown sub-figures (ad).
Beverages 09 00032 g003
Figure 4. Relative volatility of aldehydes as a function of the ethanol concentration in the liquid phase (n = 3). Relative volatility of (a) acetaldehyde, (b) furfural and (c) hexanal are shown sub-figures (ac).
Beverages 09 00032 g004
Figure 5. Relative volatility of (a) β-damascenone and (b) 1,1-diethoxyethane as a function of the ethanol concentration in the liquid phase (n = 3).
Beverages 09 00032 g005
Figure 6. Groups of flavour compounds according to the correlation matrix of relative volatilities. Note: Compounds with the high correlation matrix (>0.8) were grouped together. The number in brackets refers to molecular weight.
Beverages 09 00032 g006
Figure 7. Comparison of our data with published data. Comparison of relative volatility of (a) methanol, (b) isobutanol, (c) ethyl acetate, (d) acetaldehyde, (e) isoamyl alcohol and (f) 1,1-diethoxyethane are shown in sub-figures (af). The reference results were taken from Ikari et al. [5], Athès et al. [14] and Williams [4]. The Pearson’s correlation coefficients (r_Ikari, 1998 and r_Athés et al., 2008) were calculated between the relative volatilities in this study and the reference data for each compound. Pearson’s correlations were not computed for the reference marked with an asterisk (*) due to the reference experiments being performed with less than three replicates.
Beverages 09 00032 g007
Table 1. Physico-chemical properties of compounds in this study, their concentrations in hydroalcoholic solutions, and categorized group for lab scale experiments.
Functional GroupCompoundConcentration in Solutions (mg/100 mL a.a.)MW (g/mol)Boiling Point (°C)SupplierPurity (≥%)Flavour Category *
AlcoholMethanol130032.0464.7Roth99.92
1-Propanol35060.1097Merck99.52
Isobutanol7074.12108Fluka99.51
1-Butanol574.10117.7Fluka993
Isoamyl alcohol15088.15131Sigma-Aldrich98.52
2-Methyl-1-butanol5088.15129Roth97.51
Phenethyl alcohol25122.16225Sigma-Aldrich991
2-Butanol20074.12100Roth98.52
1-Hexanol15102.16157Fluka991
AldehydeAcetaldehyde8044.0520.2Roth99.51
Hexanal5100.16129Sigma-Aldrich953
Furfural 10096.08162Merck982
Acetal1,1-Diethoxyethane50118.18102Sigma-Aldrich981
EsterEthyl butyrate5116.16121Sigma-Aldrich99.53
Butyl acetate5116.16126Sigma-Aldrich993
Ethyl 2-methylbutyrate5130.18133Sigma-Aldrich983
Ethyl acetate50088.1177.1Sigma-Aldrich99.92
Ketoneβ-Damascenone5190.28116Sigma-Aldrich983
* To avoid co-elution in GC analysis, flavour compounds were categorized into three different groups, and the samples were prepared accordingly. The number in the ‘Flavour Category’ column represents the group to which each flavour compound was assigned.
Table 2. Two-way ANOVA analysis on relative volatilities of flavour compounds.
dfSum of SquaresMean SquareF Valuep Value
Molecular Weight143.1043.1022.84<0.0001
Functional Group2177.3188.6646.98<0.0001
Interaction286.4043.2022.89<0.0001
Disclaimer/Publisher’s Note: The statements, opinions and data contained in all publications are solely those of the individual author(s) and contributor(s) and not of MDPI and/or the editor(s). MDPI and/or the editor(s) disclaim responsibility for any injury to people or property resulting from any ideas, methods, instructions or products referred to in the content.

