Article

Single and Interactive Effects of Unmalted Cereals, Hops, and Yeasts on Quality of White-Inspired Craft Beers

1
Dipartimento di Scienze Agrarie, Alimenti, Risorse Naturali e Ingegneria (DAFNE), University of Foggia, Via Napoli, 25, 71122 Foggia, Italy
2
Institute of Sciences of Food Production, National Research Council, Lecce-Monteroni, 73100 Lecce, Italy
3
CREA—CI Research Centre for Cereal and Industrial Crops, 71122 Foggia, Italy
*
Author to whom correspondence should be addressed.
Beverages 2023, 9(1), 9; https://doi.org/10.3390/beverages9010009
Submission received: 25 November 2022 / Revised: 28 December 2022 / Accepted: 12 January 2023 / Published: 24 January 2023

Abstract

:
White beers owe their name to their straw yellow colour deriving from the use of unmalted wheat, which also supplies a relatively high protein content causing haze formation. This study aimed to develop white-inspired craft beers made with combinations of three mixtures of barley malt/unmalted wheat (alternatively durum-var. Dauno III, soft-var. Risciola, or emmer-var. Padre Pio), two hop varieties (Cascade or Columbus), and two Saccharomyces cerevisiae strains (Belgian yeast and a high-ester producing yeast); and assess the single and interactive effects of these ingredients on physical, chemical, and sensory characteristics of the beers. According to the graphical representation of the results for the Principal Component Analysis, most of the samples appear overlapped since they had similar characteristics, but it was possible to highlight two clusters of beers different from the others: those produced with (a) Risciola wheat and Columbus hop and (b) Dauno III wheat, Cascade hop, and the Belgian yeast. The beers of these clusters obtained the highest scores for their overall quality that, in turn, was positively correlated with concentrations of citric acid, 4-hydroxybenzoic acid, syringic acid, and epicatechin; alcohol %, colour, amount and persistence of foam, intensity of fruity flavour, and body.

Graphical Abstract

1. Introduction

Although there is not an internationally shared definition of the term “craft beer”, most of the legal and working definitions established by national laws and trade organizations generally include references to “small” or “micro” dimensions and to the independence from other companies. The absence of technical requirements concerning raw materials, processing, and/or final beers is evident, with some exceptions: the freedom to use conventional ingredients together with unusual ones highlighted by the definition of the Brewers Association; the absence of pasteurization and micro-filtration steps established by the Italian legal definition (Baiano, 2021) [1]. With this in mind, the production of craft beer can conform to the classic beer styles or be freely inspired by them, in order to achieve differentiation in a market that is becoming increasingly crowded (for example, through the use of innovative blends of grains, and or unusual hop varieties and yeast cultures); and/or enhance local raw materials (for example, rediscovering ancient grains).
According to the Brewers Association [2], 103 different styles have been classified among three categories (lager, ale, and hybrid/mixed), further subcategorized by origins (German, Belgian, French, USA, British, Irish, and others). Among these, the Belgian-style witbier refers to beers called “white beers” in English, “biere blanche” in French and “witbier” (or simply “wit”) in Flemish. It is one of the various types of wheat beer and it owes its name to its light golden colour deriving from the use of unmalted wheat, which also supplies a relatively high protein content causing haze formation. Combinations of unmalted wheat grain and barley malt are the starchy materials used in the production of Belgian-style white beers, with the first ingredient commonly employed at a rate of 40–60% of the total raw material. The reference to an unmalted wheat is rather generic, as it is never specified whether soft (Triticum aestivum) or durum wheat (Tritium durum) mixtures of them are used. The traditional white beer is made with 54% extremely pale barley malt, 41% unmalted wheat, and 5% unmalted oats; it is spiced with coriander and the peels of sweet and bitter oranges; it is only lightly hopped (<20 IBU) due to the use of hops with low-alpha acid content, generally Styrian Goldings, Saaz, or Kent Goldings; and it is fermented by low flocculating yeast strains (ale yeasts) to create the desired cloudy appearance and aroma.
Until now, wheat beers have been investigated by several researchers but the results are sometimes contrasting or not comparable, and they often refer to commercial wheat without further specification about its nature (Triticum aestivum—soft wheat, Triticum durum—durum wheat, Triticum monococcum and dicoccum—emmer, and Triticum spelta—spelt). Depraetere et al. investigated the influence of the addition of 40% of 11 Triticum aestivum wheat varieties on the physicochemical properties of white beers [3]. First, the results revealed that the effects of this addition depend on wheat varieties. Furthermore, the influence of wheat on foam stability depends on the foaming potential of barley malt used for brewing. If barley malt has a high foaming potential, wheat exerts a negative influence. On the contrary, if wheat is added to an over-modified malt with low foam potential, it improves foaming characteristics. Moreover, the addition of wheat reduces the beer phenolic content and wheat gluten proteins are haze-active compounds. In a study by Mascia et al., a Sardinian durum wheat beer was compared with a German and a Czech wheat beer [4]. The first was made with 60% malted barley, 20% commercial malted wheat, and 20% unmalted “Cappelli wheat” while the others were made with 50% malted barley and 50% malted wheat. The Sardinian beer had the highest polyphenol content and was more balanced in taste while the Czech beer had the highest concentration of volatile esters and total alcohols. Another recent study demonstrated that brewing with up to 100% of raw unmalted old wheat varieties is technically feasible and gave beers with the same basic features of 100% malt beers, showing potentially healthy qualities in terms of antioxidant content and activity [5]. Marconi et al. used the hulled wheat varieties Rossorubino (Triticum dicoccum) to produce three beers: a 100% hulled Emmer malt beer, a 40% hulled Emmer malt–60% barley malt beer, and a 40% dehulled Emmer malt–60% barley malt beer [6]. The results highlighted that the 100% hulled Emmer malt beer showed the lowest phenolic content and medium–low scores for all the descriptors used for the sensory analysis. In particular, panellists evaluated the 100% hulled Emmer malt beer as fresh, with honey, floral, and citric notes. The foam stability was good.
The brewing aptitude of hops depends on content and composition of α-acids and essential oil, respectively responsible for bitterness and aroma. In this light, Mozzon et al. focused their attention on 15 international hop varieties to assess their suitability for brewing [7]. The researchers identified a first group of cultivars (Centennial, Brewer’s Gold, Sterling, Cascade, Nugget, and Columbus) characterized by high content of α- and β-acids and by the monoterpene myrcene in their aroma; a second group of cultivars, namely Mount Hood, Northern Brewer, Northdown, Galena, Willamette, and Fuggle, characterized by lower percentages of humulones and the predominance of sesquiterpene hydrocarbons; a third groups of three cultivars (Chinook, Yeoman, and Hallertau), characterized by desirable high α-acids content and a sesquiterpene-type aroma. Hop is also able to affect the beer-reducing power. In particular, hops with low-α-acid content (Saaz, Hallertau) exert higher antioxidant activities than bitter varieties (Nugget, Challenger) due to their flavanoid content [8].
The beer quality also depends on yeasts, not only in terms of fermentation efficiency, but also for their influence on flavour, since most of the volatile compounds are intermediate metabolites and by-products of yeast metabolism [9]. Almost all the strains used for the production of ale beers belong to the Saccharomyces cerevisiae species; they differ from each other in terms of amount and type of volatile compounds produced. This behaviour depends on the different ability of the various strains to use more carbohydrates and nitrogenous compounds, so that their amount and composition significantly affect aldehydes, ketones, higher alcohols, ester, vicinal diketones, and H2S formation.
The development of the ingredient formulation of a craft beer freely inspired by a traditional style requires a preliminary step of physical, chemical, and sensory evaluation of the product quality. The overall quality characterization requires a multiparameter approach [10,11,12] that, in turn, needs the application of chemometric modelling classification techniques [13].
The objectives of this study were (1) to develop white-inspired craft beers made with combinations of three binary mixtures of barley malt/unmalted wheat (alternatively durum, soft, or emmer), two different hop varieties (Cascade or Columbus), and two different Saccharomyces cerevisiae strains; (2) to assess the effects of these combinations of ingredients on physical, chemical, and sensory characteristics of the resulting craft beers; (3) to search for formulations able to maximize beer quality in terms of antioxidant content and activity and sensory positive characteristics.

2. Materials and Methods

2.1. Brewing Materials

Barley malt cv. Fortuna was supplied by Agroalimentare Sud (Melfi, Potenza, Italy). The unmalted cereals, i.e., durum wheat cv. Dauno III, soft wheat cv. Risciola, and dehulled emmer cv. Padre Pio (Triticum dicoccum) came from the experimental fields of CREA-CI Research Centre for Cereal and Industrial Crops, Foggia, Italy. Two cultivars of dried hop cones were used: Cascade and Columbus (6.7 and 17.6% α-acid content, respectively). Cascade is a flavouring hop obtained from the cross between Fuggle and Serebrianka varieties (the latter is a Russian variety). The aroma of the Cascade is citrusy and floral with clear hints of grapefruit. Columbus hops are mainly used as bittering hops and are characterized by a citrusy and pungent profile with notes of black pepper, liquorice, and curry. Hops as well bitter orange peels and coriander were supplied by Birramia (Querceta, Lucca, Italy). For the wort fermentation trials, the following two Saccharomyces cerevisiae strains were used: M21 and M02 (Mangrove Jack’s, Rosedale, Auckland, New Zealand). The first is a Belgian wit yeast, able to produce a good balance between fruity esters and spice phenolics while the second is a high ester-producing strain used in cider elaboration.

2.2. Brewing Ingredient and Process

In order to comply with the Italian law on beer production establishing the minimum amount of malt to be used as a starch source, the beers were manufactured using 60% of barley malt and 40% of unmalted cereals [14]. The choice to use the maximum possible percentage of unmalted cereal was made to ensure the maximum possible differentiation in the finished products. Twelve different, white-inspired craft beers were produced by combining the 3 binary mixtures of barley malt and unmalted cereals (alternatively durum wheat cv. Dauno III, soft wheat cv. Risciola, or dehulled emmer cv. Padre Pio), the 2 hop varieties (Cascade, Columbus), and the 2 yeast strains (M21 and M02). It was decided to adopt this experimental plan instead of applying a CCD or other factorial plans as the intention was to make Belgian-style white beers (which involve the use of 40–60% unmalted cereal in the cereal mixture and a hopping around 15–20 IBU), emphasizing the effect of the selected variables but without distorting the type of product. For each type of beer, two technological replicates were performed. The amounts of ingredients in formulation of 100 L of finished beer were the following: water 135 L (100 L for mashing, and 35 for sparging); malted barley, 13.05 kg; unmalted cereal 8.7 kg; hop cones, 65 g of Cascade or 27.5 g of Columbus to rich the desired final bitterness IBU of ~15 IBU; 65 g of bitter orange peels; 65 g of coriander; 50 g of dehydrated yeasts.
All grains were crushed with a 2-roller mill (Albrigi Luigi, Stallavena, Verona, Italy) under mill gaps of 0.5 mm for malted barley and 0.6 mm for unmalted cereals. Brewing was performed in a 30 L Braumeister system (Speidel Tank-und Behälterbau GmbH, Ofterdingen, Germany). Mash-in temperature was 52 °C, followed by a 20 min stand at 55 °C, followed by a 30 min stand at 65 °C, a 30 min stand at 70 °C, and a final mash-off at 78 °C for 10 min. Temperature increases between stands were ramped at a rate of about 1.5 °C/min. Sparge water at 78–80 °C was passed through the grain bed and the resultant wort was boiled for 90 min with addition, 30 min after the start of boiling, of bitter orange peels, coriander, and hop cones. A final original gravity of 1.043 ± 0.005 was reached to obtain beers characterized by a relatively light body, fresh mouthfeel, and low-to-moderate alcohol contents. During mashing, pH was checked and corrected with lactic acid addition (always the same amount) in order to obtain final pH values close to 5.4. The wort was cooled at room temperature and inoculated with 10 g dried yeast to 20 L wort. The fermentation step was carried out at 20 ± 2 °C until an original gravity value of 1.012 ± 0.003 was reached, which required 21 ± 1 days, and was followed by maturation at 4 ± 1 °C for 4 days. Beers were packaged into 750 mL glass brown bottles with the addition of 6 g/L of sucrose and bottles were conditioned at 20 ± 1 °C for 1 month and subsequently stored at 5 ± 1 °C until analyses.

2.3. Analysis of the Mixtures of Malted and Unmalted Cereals

Moisture and ash contents (as %) were determined according to the AACC methods 44-15.02 and 08-01.01, respectively [15]. The protein content (%) was determined according to the Dumas combustion nitrogen method described in the AACC method 46–30.01 and using FP528 (Leco Corp., Saint Joseph, MI, USA) [15]. A factor of 5.7 was used to convert the nitrogen to protein. The β-Glucan content (expressed as g/100g dry matter) was determined following the ICC Generic Methods N° 166 using the K-BGLU Megazyme kits (Neogen, Ayr, Scotland) [16]. The extraction of total phenolics was performed according to the optimized procedure reported by Gandolpho et al. [17] with some modifications and TPC was determined using the Folin–Ciocalteu reagent [18]. The free phenolic acids were extracted according to the method described by Abdel-Aal and Hucl [19], with some modifications while the soluble-conjugated and the insoluble-bound phenolic acids were extracted as described by Brandolini et al. [20]. The extracts of phenolic acids were analyzed by HPLC (1290 UHPLC series Rapid Resolution; Agilent Technologies, Santa Clara, CA, USA) equipped with a diode array detector. Phenolic acid separation was carried out with a 50 mm × 2.1 mm × 1.8 µm column (Eclipse Plus-C18 RRHD; Agilent). The temperature of the column oven was set at 40 °C. Gradient elution was used, with the two mobile phases: 10−3 M phosphoric acid (solution A) and acetonitrile (solution B), as follows: 0–2 min, 90% A (isocratic); 2–3 min, 90–70% A; 3–5 min, 70–45% A; 5–7 min, 45–30% A; 7–8 min, 30% A (isocratic); 8–9 min, 30–90% A; 2 min equilibration, 90% A. The flow rate of the mobile phase was 0.3 mL/min, and the injection volume was 1 µL. The wavelengths used for quantification of the phenolic acids were 280, 320, and 360 nm. The compounds were identified on the basis of their retention times and comparing their spectra with those of standard materials and were quantified (μg gallic acid equivalents/g of dry matter) by comparing their peak areas with those of standard curves. The antioxidant activity of the mixtures was determined by 2,2-diphenyl-1-picrylhydrazyl (DPPH) radical-scavenging activity [21]. Quantification was performed using a calibration curve prepared with Trolox (6-hydroxy-2,5,7,8-tetramethylchroman2-carboxylic acid). The results of DPPH radical-scavenging activity were expressed both as % of remaining DPPH and mmol of Trolox (6-hydroxy-2,5,7,8-tetramethylchroman2-carboxylic acid) per g of dry matter.

2.4. Analysis of Beers

2.4.1. Basic Analyses

The pH values were measured using a Medidor pH meter BASIC 20, (CRISON, Modena, Italy). Dry matter was determined by a preliminary evaporation of a known volume of beer in a water bath until a syrupy consistency was reached and a subsequent drying at 105 °C until a constant weight was attained. Total soluble solids (as Brix) were measured by means of a Digital Hand-held “Pocket” Refractometer—PAL-RI (ATAGO Co., ltd., Tokyo, Japan) and the values were corrected on the basis of the beer alcohol content [22]. Beer colour was determined according to the standard Analytica-EBC colour measuring method [23]. More specifically, the absorbance of previously degassed and filtered (0.45 μm) samples was determined in 1 cm UV–Vis cuvettes at 430 nm by a spectrophotometer (UV-1601 Shimadzu, Japan) and then multiplied by 25 to obtain the EBC colour. The carbon dioxide content (as mg CO2/L) was determined though the HI 3818 Carbon Dioxide Test Kit (Hanna Instruments, Padova, Italy). Briefly, 0.1 mL of previously degassed beer was added to 0.9 mL of distilled water and then neutralized with a dilute sodium–hydroxide solution to a pH of 8.3 using phenolphthalein as the indicator. The alcohol content was determined by steam distillation (DualStil, Ing. C. Bullio, San Prospero, MO, Italy) after removal of CO2 by shaking the samples under a vacuum for 6 h at room temperature. The alcohol content of the distillate was determined using a hydrostatic balance (Exacta alcoweight, Ing. C. Bullio, San Prospero, MO, Italy). The titratable acidity of previously degassed beer samples was determined by titration with NaOH 0.1N until pH 7.0 was reached and the results were expressed as g lactic acid/L. The volatile acidity of previously degassed beer samples was determined by steam distillation and then titration of the distillate with 0.1M NaOH. The contribution of both free and combined sulphur dioxide was considered. Volatile acidity was expressed as g acetic acid/L.

2.4.2. Organic acids

Organic acids were identified onto an Agilent Hi-Plex H (300 × 7.7 mm) with internal particles of 8.0 μm (Agilent Technologies, Santa Clara, CA, USA). The temperature of the column compartment was maintained at 70 °C. The flow rate applied was 0.4 mL min−1 with a run time of 30 min. The phase was 4.0 mM L−1 H2SO4 in ultrapure water [24]. Standard solutions were injected to obtain the retention time of each compound. The detection of organic acids was conducted using a Diode Array Detector (DAD) at 210 nm. Quantification of individual organic acids was directly performed through the ChemStation software (Agilent) using a five-point regression curve (r2 ≥ 0.99) on the basis of authentic standards. The results were expressed as g/L.

2.4.3. Sugars and Glycerol

Maltodextrin, maltotriose, maltose, and glycerol concentrations were quantified through the same type of column used for organic acid analysis. Deionized water was used as mobile phase at a constant flow rate of 0.6 mL/min with a run time of 30 min. The detection was carried out through a Refractive Index Detector (RID). Quantification of individual sugars was performed directly through the ChemStation software (Agilent) using a five-point regression curve (r2 ≥ 0.99) on the basis of authentic standards. The results were expressed as g/L.

2.4.4. Total Phenolic Content, Phenolic Profile, and Antioxidant Activity

The beer TPC was estimated through the Folin–Ciocalteu method and expressed as mg gallic acid equivalents/L [18]. The phenolic profile was analyzed by a HPLC system equipped with a diode array detector (Agilent 1100 Liquid Chromatograph, Santa Clara, CA, USA) according to Aliakbarian et al. (2011) using a 100 mm × 4.6 mm × 3 µm RP-C18 Gemini column (Phenomenex, Aschaffenburg, Germany) [25]. Separation was achieved, using the following linear gradient of two solvents: solvent A (1.0% acetic acid in water v/v) and solvent B (50% methanol, 50% acetonitrile, v/v) at 30° C with a flow rate of 1 mL/min: from 5% to 30% B in 25 min; from 30% to 40% B in 10 min; from 40% to 48% B in 5 min; from 48% to 70% B in 15 min; from 70% to 100% B in 5 min; isocratic at 100% B for 10 min, followed by returning to the initial conditions (5 min) and column equilibration (5 min). The injection volume was 100 μL. The wavelengths used for quantification of the phenolic acids were 250, 280, and 320 nm. The compounds were identified on the basis of their retention times and comparing their spectra with those of standard materials and were quantified (mg/L) by comparing their peak areas with those of standard curves.
The antioxidant activity of beer samples was determined as already described for cereal mixtures. The results were expressed both as % of remaining DPPH and mmol of Trolox (6-hydroxy-2,5,7,8-tetramethylchroman2-carboxylic acid) per litre of beer.

2.4.5. Sensory Descriptive Analysis

A panel of six trained judges between 40 and 65 years of age, experienced in alcoholic beverage sensory evaluation, performed a Quantitative Descriptive Analysis (QDA) in a room free of noise, odours and with white light. Amounts of 50 mL of each beer was served to the panellists in crystal goblets at a temperature of 5 ± 1 °C. The parameters evaluated by the judges were selected among those found in the literature and those generated by the panel to give a complete description and avoid overlapping. Data were collected using a combined profile sheet including 5 visual (for foam: colour, amount, and persistence; for liquid portion: colour, and turbidity), 10 gustatory (sweetness, bitterness, saltiness, acidity/sourness, malty, hoppy, floral, fruity, spicy, alcoholic), and 2 tactile (effervescence and body) parameters. Panellists were also asked to evaluate the overall quality of each beer. All descriptors and the overall quality were evaluated on a 5-point scale with the exception of those referred to foam colour—which were evaluated on a 4-point scale (1 = white, 2 = rose, 3 = cream, or 4 = capuchin)—and liquid colour—which were evaluated on a 4-point scale (1 = pale straw yellow, 2 = straw yellow, 3 = golden yellow, or 4 = amber).

2.4.6. Statistical Analysis

Each analysis was replicated at least three times for each of the two technological replicates and then the averages and the standard deviations were calculated on at least 6 raw data, using Excel software V. 14.0.0 for Mac. The Analysis of Variance (ANOVA) and LSD test were applied to highlight significant differences among the starting cereal mixtures (p-value < 0.05). In order to provide information about the single and combined effects of barley malt/unmalted cereal mixtures, hop varieties, and yeast strains on each characteristic of the beers, Analysis of Variance (ANOVA) and LSD test were applied to highlight significant differences among samples (p-value < 0.01). Principal Component Analysis (PCA) was applied to separate the beer samples according to the results of the physical, chemical, and sensory analyses. The Pearson correlation coefficient at p-value < 0.01 was applied to individuate significant correlations among beer characteristics. ANOVA, Pearson correlation, and PCA were carried out using the statistical package Statistica for Windows V. 7.0. (Statsoft, Tulsa, OK, USA).

3. Results and Discussion

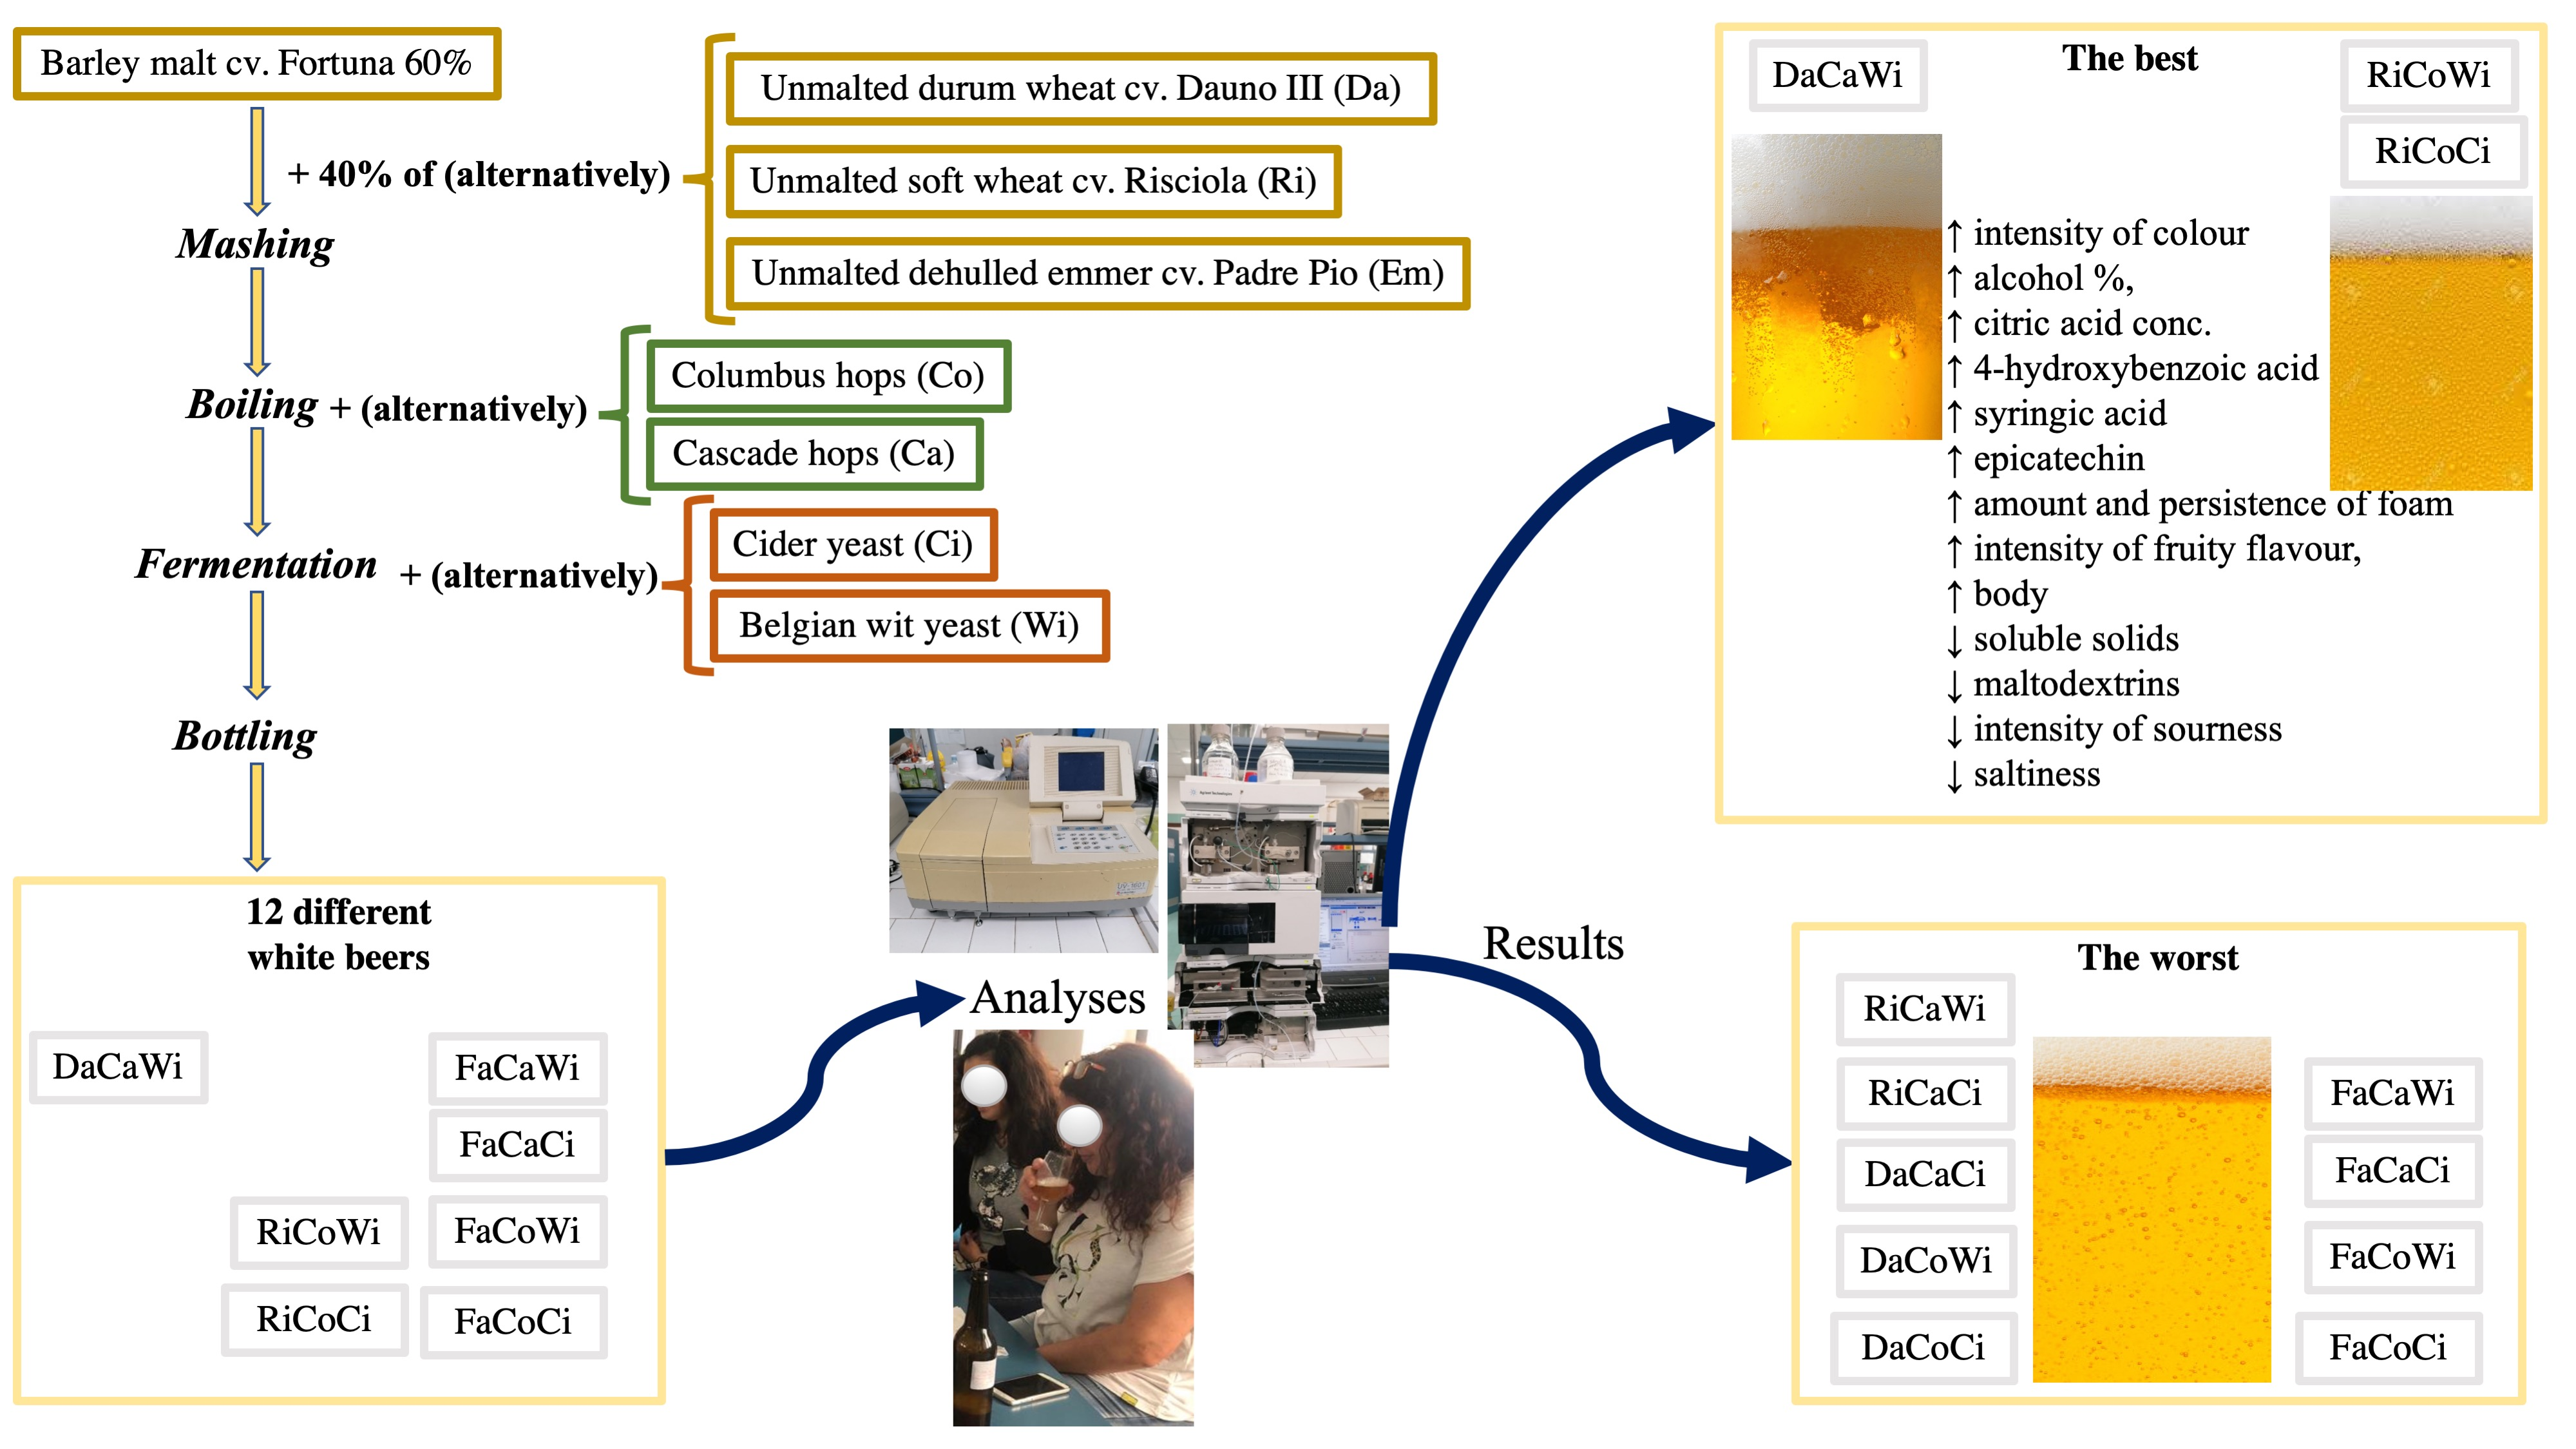
3.1. Characteristics of the Cereal Mixtures

This work aimed to highlight any differences in the final product resulting from the use of three different species of Triticum, also considering the hulled emmer (Triticum dicoccum). The intention of the raw material analysis shown in Table 1; Table 2 is to describe the composition of the starting cereal materials and to give an insight into some of the components responsible for the colloidal stability, such as proteins, polyphenols, and β-glucans [26], with the last two classes of compounds also known for their bioactive and antioxidant effects and nutritional value [27]. Em had the lowest moisture and protein content and the highest total phenolic content, while Da showed the highest ash and the lowest β–glucan content, and intermediate total phenolic content. The interest towards these compounds is related to their role in haze formation, as proteins conjoined with polyphenols (mainly proanthocyanidins and polymeric forms) are the major colloidal haze components in Belgian white beers with a certain contribution of glucose polymers (mainly starch or degraded starch and only to a minor extent β-glucans) [28]. Although the polymeric phenols have not been quantified in raw materials, the highest total phenolic content retrieved in the durum and common wheat can be considered as indicators of higher haze formation in the corresponding future beers with respect to those produced with unmalted emmer. The known role of high-molecular-weight (HMW) proteins as precursors of haze-active proteins [26] and the higher HMW glutenin subunits retrieved in durum and common wheat in respect to emmer [29] reinforce this prediction, with the same brewing process applied.
The interest towards phenolic content and profile of the raw materials is influenced by their contribution to polyphenols of the final beer considering that about 70% of beer phenolics come from the mashed cereal mixtures because of their significantly higher starting amount [30]. In terms of total phenols, Em had the highest concentrations followed by, in a decreasing order, Da and Ri(Table 2). Since phenolic compounds are the most important group of antioxidants [31], it was expected that the antioxidant activity of cereal mixtures was related to their total phenolic concentration. Instead, the remaining concentration of the DPPH radical (expected to be inversely proportional to the phenolic concentration) was, in a decreasing order, Da, Ri, and Em, and further quite different results were obtained by expressing the antioxidant activity in terms of Trolox equivalents, with Da highlighting the statistically significantly lowest values. This only apparent inconsistency depends on three factors: the different antioxidant assays applied; the different qualitative phenolic composition of the three cereal mixtures; the different phenolic distribution among free, conjugated, and bond forms of the three cereal mixtures. It is well known that different phenolic acids have different antioxidant activity because substituents on their aromatic rings affect the stabilization of structure and consequently their radical-quenching ability [32]. Rice-Evans et al. established a certain antioxidant activity hierarchy of phenolics measured as Trolox Equivalent with, citing some of those found in our cereal mixtures: rutin and catechin > p-coumaric acid > ferulic acid > chlorogenic and caffeic acids [33]. Although the phenolics retrieved in the highest concentrations were generally the same in the three considered mixtures (p-hydroxybenzoic, caffeic, and ferulic acids), Em differed from the others for the high concentration of 3,4 hydroxybenzoic acid (Table 2). Moreover, significant differences in the percentage of the free phenolic forms were highlighted among the three mixtures, with the following decreasing concentration order: Em (78%) > Ri (74%) > Da (71%).

3.2. Physicochemical Characteristics of the Finished Beers

The results of the physicochemical analyses of the 12 finished beers are reported in Table 3. As can be inferred from the data, the interactive effects of cereal mixtures, hops, and yeast strains were statistically significant on all parameters. Table 3 also includes the single effects of the independent variables, which will be discussed from time to time for those effects that are significant not only in statistical point terms. The average pH values were in the 3.76–4.26 range and these results are consistent with what is found in commercial Belgian white beers [28]. Types of cereal mixtures also exerted significant single effects on pH with the lowest values found for Em, as a consequence of its lower buffering potential, which in turn is due to its lower protein content. The beer soluble solid content ranged from 2.72 to 5.83 °Bx and significant single effects were exerted by cereal mixture and yeasts, with the lowest concentrations found for Da and Ci, respectively. The effect of Ci yeast was related to its higher attenuation ability with respect to Wi that leaves residual sugars. Dry matter varied from 1.83 (RiCoWi) and 7.56 (EmCaWi) % but this variability cannot be attributed to any of the independent variables. The colour of beers showed a great variability (2.62–8.45 EBC), with significant single effects exerted by cereal mixtures (respectively higher and lower when Da and Em are used), hop (higher when Cascade was used), and yeast (higher when the cider yeast was used). It is known that the beer colour depends mainly on the cereals used in the wort production process, in particular on their pigment content. The cereal mixtures used in this work had the following concentrations of carotenoids: 3.3, 3.0, and 2.6 μg/g for Da, Ri, and Em, respectively). It is also known that hopping with bitter hops led to a significant darkening of wort but in the present work, the bitter Co was added in lower amount that Ca in order to obtain the same final IBU [34]. Concerning the effect of yeast, it has been reported that high fermentation yeasts (as Wi is) produce beers with higher values of absorbance due to the browning and oxidation of the melanoidins [35].
The carbon dioxide in the investigated beers was in the range 2.55 (RiCoCi)-7.80 (EmCaCi) g/L. Carbonation contributes to the refreshing effect of a traditional wheat beer, which is why beers with a low level of carbonation are not accepted by consumers. Em and Wi positively affected CO2 content, the latter because it is specifically selected to produce carbonated beer (a rapid CO2 production in moderate sugar medium is an important phenotype in strains suitable for producing sparkling beverages).
Alcohol content was comprised between 2.81 (EmCoCi) and 4.86 (RiCoCi) % but 10 of the 12 types of beers produced had values lower than 4.5%. Alcohol content of traditional Belgian-type white beer is generally in the range 4.5–5.5%. Concerning the single effect of cereal mixture, the highest alcohol content of Ri and Da beers is explained by the higher carbohydrate contents in common (75%) and durum wheat (71%) compared to those of ancient wheats such as emmer [36].
Acidity is an important trait of white beers: they should have a moderate-to-high titratable acidity, but low-to-moderate volatile acidity since it is often an indicator of presence of acetic acid and other volatile components, such as acetaldehyde, responsible for off flavours. Very broad ranges of titratable (0.61–3.05 g/L) and volatile (0.30–2.59 g/L) acidity were observed, with the highest and the lowest values of both types of acidity found in RiCaCi and DaCaCi beers, respectively. Concerning the single effects of cereal mixture, the lowest values were found when Da was used, as a consequence of the strong buffer potential of its protein. Regarding yeast, the highest values were found when Wi strain was used, as expected by a yeast specifically selected as Belgian wit yeast. The discussion on the acidity of the finished beers can be deepened by considering their composition in organic acids (Table 4). First, the following assumptions are necessary: among the six compounds detected, only fumaric acid showed the same concentration in all the samples; during mashing, the same amount of lactic acid was added to worts to bring their pH to a value close to 5.4. Some organic acids related to the Krebs cycle were quantified and were found to vary widely from a beer to another: citric (0.67–1.02), malic (0.59–1.54), succinic (0.86–2.97), lactic (0.68–1.36), and acetic (5.67–1.52). Concerning the single effect of cereal mixtures, the highest concentration of citric and malic acids and the lowest concentrations of succinic, lactic, and acetic acids were detected in Da beers. Regarding the effect of yeast, the lowest concentration of citric acid and the highest concentrations of malic, succinic, and lactic and acetic acids were found in beers fermented by Wi. This data could be explained with the ability of yeast metabolism to influence levels of beer organic acids, which has been documented for decades [37], as well as the application of selection and crossing techniques to obtain yeasts with an overproduction of organic acids through a permanently altered carbon flow in the two branches of the tricarboxylic acid cycle.
The remaining carbohydrates from starch hydrolysis in the final beer mainly include non-fermentable dextrins (90%), which cannot be metabolized by yeast strains, and only low levels of fermentable sugars (maltotriose and maltose). They have been quantified in the produced beers (Table 4). Maltodextrin has a moderately sweet taste and enhances the body and palate fullness of beer. The maltodextrin concentrations in the final beers ranged from 26.39 and 40.73 g/L and mainly depended on cereal mixtures (Em > Ri > Da). The content of the fermentable sugar maltotriose ranged from 8.01 to 29.92 g/L and showed a behaviour similar to that of soluble solids. Maltose content was below the detection limit for all the beers, thus indicating that it was completely fermented by yeasts.
Finally, Table 3 shows the glycerol concentrations of the beers, which ranged from 2.05 to 4.06 g/L and the most significant effect was exerted by yeast, with higher glycerol production highlighted by Ci.

3.3. Phenolic Concentration and Antioxidant Activity of the Finished Beers

Together with its low alcohol content, the phenolic concentration and antioxidant activity of beer are relevant factors in terms of nutritional quality of beer [30]. The total phenolic content of the beers was between 173 (EmCoCi) and 364 mg/L, with the highest values found in DaCoCi, RiCoCi, and EmCoWi (Table 5). These are the results of interactions among cereal mixtures, hops, and yeasts, while the single effects of the same variables were not statistically significant. The TPCs were higher than those (76.8–177 mg/L) retrieved in the literature for both malted and unmalted wheat beers [4,38]. The remaining DPPH was in the range 51.29–73.23% while the millimoles of Trolox per L varied from 0.678 to 1.255. TPCs were not correlated with antioxidant activity while better correlations were found between the two ways in which antioxidant activity was measured, with the highest values detected in DaCoCi and RiCoWi and the lowest values observed in DaCaCi beers. It is only an apparent discrepancy since the antioxidant power of a beer does not depend only on the contribution of phenolic compounds provided by the ingredients but is further influenced by the complex transformations that take place during brewing, which are well documented by the scientific literature. It has been observed that mashing-in temperature affects the release of polyphenols: temperature around 40–45 °C allows the activity of arabinoxylan- and protein-degrading enzymes and thus the release of phenolic acids bound to cell walls, polysaccharides, or proteins [39]. Sparging, i.e., the step when the spent grain is washed through with hot water, is able to further recover phenolics. During boiling, the antioxidant activity increases thanks to the dissolution of hop polyphenols in the wort but, on the other hand, loss of polyphenols is experienced since they react with proteins and the resulting complexes precipitate and are separated from wort by whirlpooling [40,41]. However, always during boiling, Maillard reactions occur bringing to the formation of melanoidins that, together with phenolics, are the most important beer antioxidants [42]. During fermentation, the antioxidant activity can remain unchanged or suffers a decrease. As a result, the overall brewing process reduces the initial content of total phenols by 50%.
All these changes strongly affected the phenolic profiles of the finished beers (Table 5). Twelve phenolic compounds were detected in all the beers but in different concentrations depending on the starting cereal mixture, type of hop, and yeast strain: seven phenolic acids (gallic, 4-hydroxybenzoic, vanillic, caffeic, syringic, ferulic, p-coumaric); two flavanols (catechin and epicatechin); two flavonols (quercetin and rutin); one hydroxystilbene (resveratrol). Eight of these compounds were also retrieved in the cereal mixtures used in brewing: catechin, rutin, and the phenolic acids gallic, vanillic, caffeic, syringic, ferulic, and p-coumaric. Among these compounds, catechin and the phenolic acids, namely, gallic, vanillic, caffeic, ferulic, and p-coumaric were also contributed by hops. Epicatechin, quercetin, 4-hydroxybenzoic, and resveratrol were hop-derived beer polyphenols. The contribution of the yeasts is limited from a quantitative point of view but can have an influence on the organoleptic characteristics of the beers: part of xanthumol and higher oligomeric proanthocyanidins are adsorbed to yeast cells during fermentation [43,44]; ferulic acid increases during fermentation, due to possible feruloyl esterase activity in yeast [45].
The phenolics retrieved in the highest concentrations were, in a decreasing order, gallic acid (5.844–36.162 g/L), epicatechin (8.341–12.497 mg/L), rutin (2.574–10.126 mg/L), and 4-hydroxybenzoic acid (1.924–8.296mg/L). The other compounds were found in concentrations lower than 2.5 mg/L). Regarding the single effects exerted by the cereal mixtures on the beer phenolic profiles, Da allowed to obtain the highest concentrations of gallic acid, 4-hydroxybenzoic acid, syringic acid, rutin, resveratrol, and p-coumaric acid (together with Em), while Em showed the highest concentrations of catechin (together with Ri), caffeic acid, and quercetin. The single effects of the type of cereal mixtures on amounts of vanillic acid, epicatechin, and ferulic acid were not statistically significant. Concerning the single effect of hops, Ca beers showed the highest concentrations of gallic, 4-hydroxybenzoic, vanillic, syringic, and ferulic acids, rutin, and resveratrol while Co beers had the highest amounts of catechin. The effects of the type of hops on caffeic acid, p-coumaric acid, epicatechin, and quercetin were not significant. No differences were highlighted between the two yeast strains in terms of concentrations of caffeic acid, syringic acid, epicatechin, p-coumaric acid, and resveratrol. The highest concentrations of catechin were observed in beers fermented with Ci, while the highest concentrations of rutin, quercetin, and the phenolic acids, namely, gallic, 4-hydroxybenzoic, vanillic, ferulic were retrieved in beers fermented with Wi.

3.4. Sensory Characteristics of the Finished Beers

Table 6 shows the results of the sensory analysis. The evaluation of two visual (colour of foam and liquid) and eight gustatory (sweetness, bitterness, saltiness, hoppy, floral, fruity, spicy, and alcoholic) parameters showed high variability and thus any significant difference was highlighted between the 12 types of beer with reference to those characteristics. Regarding description, all the beers were characterized by a white foam and a straw yellow colour and were evaluated as moderately sweet, bitter, salty, and alcoholic. Moreover, moderate hoppy, floral, fruity, and spicy flavours were perceived.
Significant differences were highlighted for the other sensory characteristics. The amount of foam ranged between 1 and 5, while its persistence was in the range 1–4. Concerning the single effects, the highest amount of foam was observed in beers produced with Da, Ca, and Wi. On the other hand, little foam was observed in beers produced with Em. Among the cereal mixtures, Da and Ri highlighted the highest foam persistence, as well as Ca and Ci for the hops and yeast strain, respectively. Foaming in beer is mainly due to the interactions between proteins deriving from cereal mixtures and hop acids, while yeast proteins are mainly associated with foam stabilization [46]. Modification of the barley occurring during germination causes protein hydrolysis, which negatively correlates with foam persistence, due to the degradation of foam-positive protein factors [46]. The non-modified proteins of wheat added to over-modified malt ameliorates beer foaming characteristics also reducing the size of foam bubbles but the overall effect of wheat on foam stability depends on both the foaming potential of the barley malt and wheat variety used for brewing [3]. Concerning β-glucans deriving from the starting cereal mixtures, neither foam enhancement nor foam stabilization has been documented [47]. In the present work, foam persistence and amount correlated well with the protein content of the starting cereal mixtures. Concerning the effects of hop acids, Ca had lower iso-α-acids than Co (7.6% vs. 14.9%) but a higher amount of Ca was used to obtain the same IBU values, thus the final α-acid concentration was similar.
Turbidity, with scores included between 1 and 5, was higher in Da and Ri beers, i.e., in beers produced from the starting cereal mixtures having the highest protein content and this result matches well with the finding that haze intensity in wheat beers is mainly governed by the wheat gluten content of the beer, which in turn depends on the protein content of the starting cereals [48]. The single effect of yeasts was also significant, with the highest turbidity values observed in Ci-fermented beers. A recent study of Huismann et al. successfully applied fractionation for purifying and isolating proteins from high and low haze beers [49]. They observed two protein peaks in the high haze samples and one protein peak in the low haze ones, also discovering the presence of yeast cell wall mannoproteins.
The trained sensory panel also found remarkable differences in sourness/acidity of beers (scores from 2 to 5), with the highest intensity evaluated in Em beers, which were also the samples with the lowest pH values and the highest acetic acid contents. The highest intensity of the malty taste (whose scores ranged from 1 to 4) was attributed to Da beers, despite the maltose concentrations being under the detection limit for all the samples and the maltodextrins and maltotriose contents were higher in beers produced from Em and Ri cereal mixtures.
A great variability among beers was observed for effervescence (1 ≤ score ≤ 5) with a single significant effect exerted only by the type of hop. Beers produced with Ca were evaluated as the most effervescent, but that judgement was affected by the highest amount and stability of foam observed in those beers. The body ranged from 1 to 4, with the lowest scores obtained by Em beers, although they had the highest content of maltodextrins.
Finally, the best overall ratings were attributed to Ri and Da beers, which were the beers richer in foam, more full-bodied, less acidic, and (Da beers) with a more pronounced malt taste.

3.5. Statistical Data Evaluation

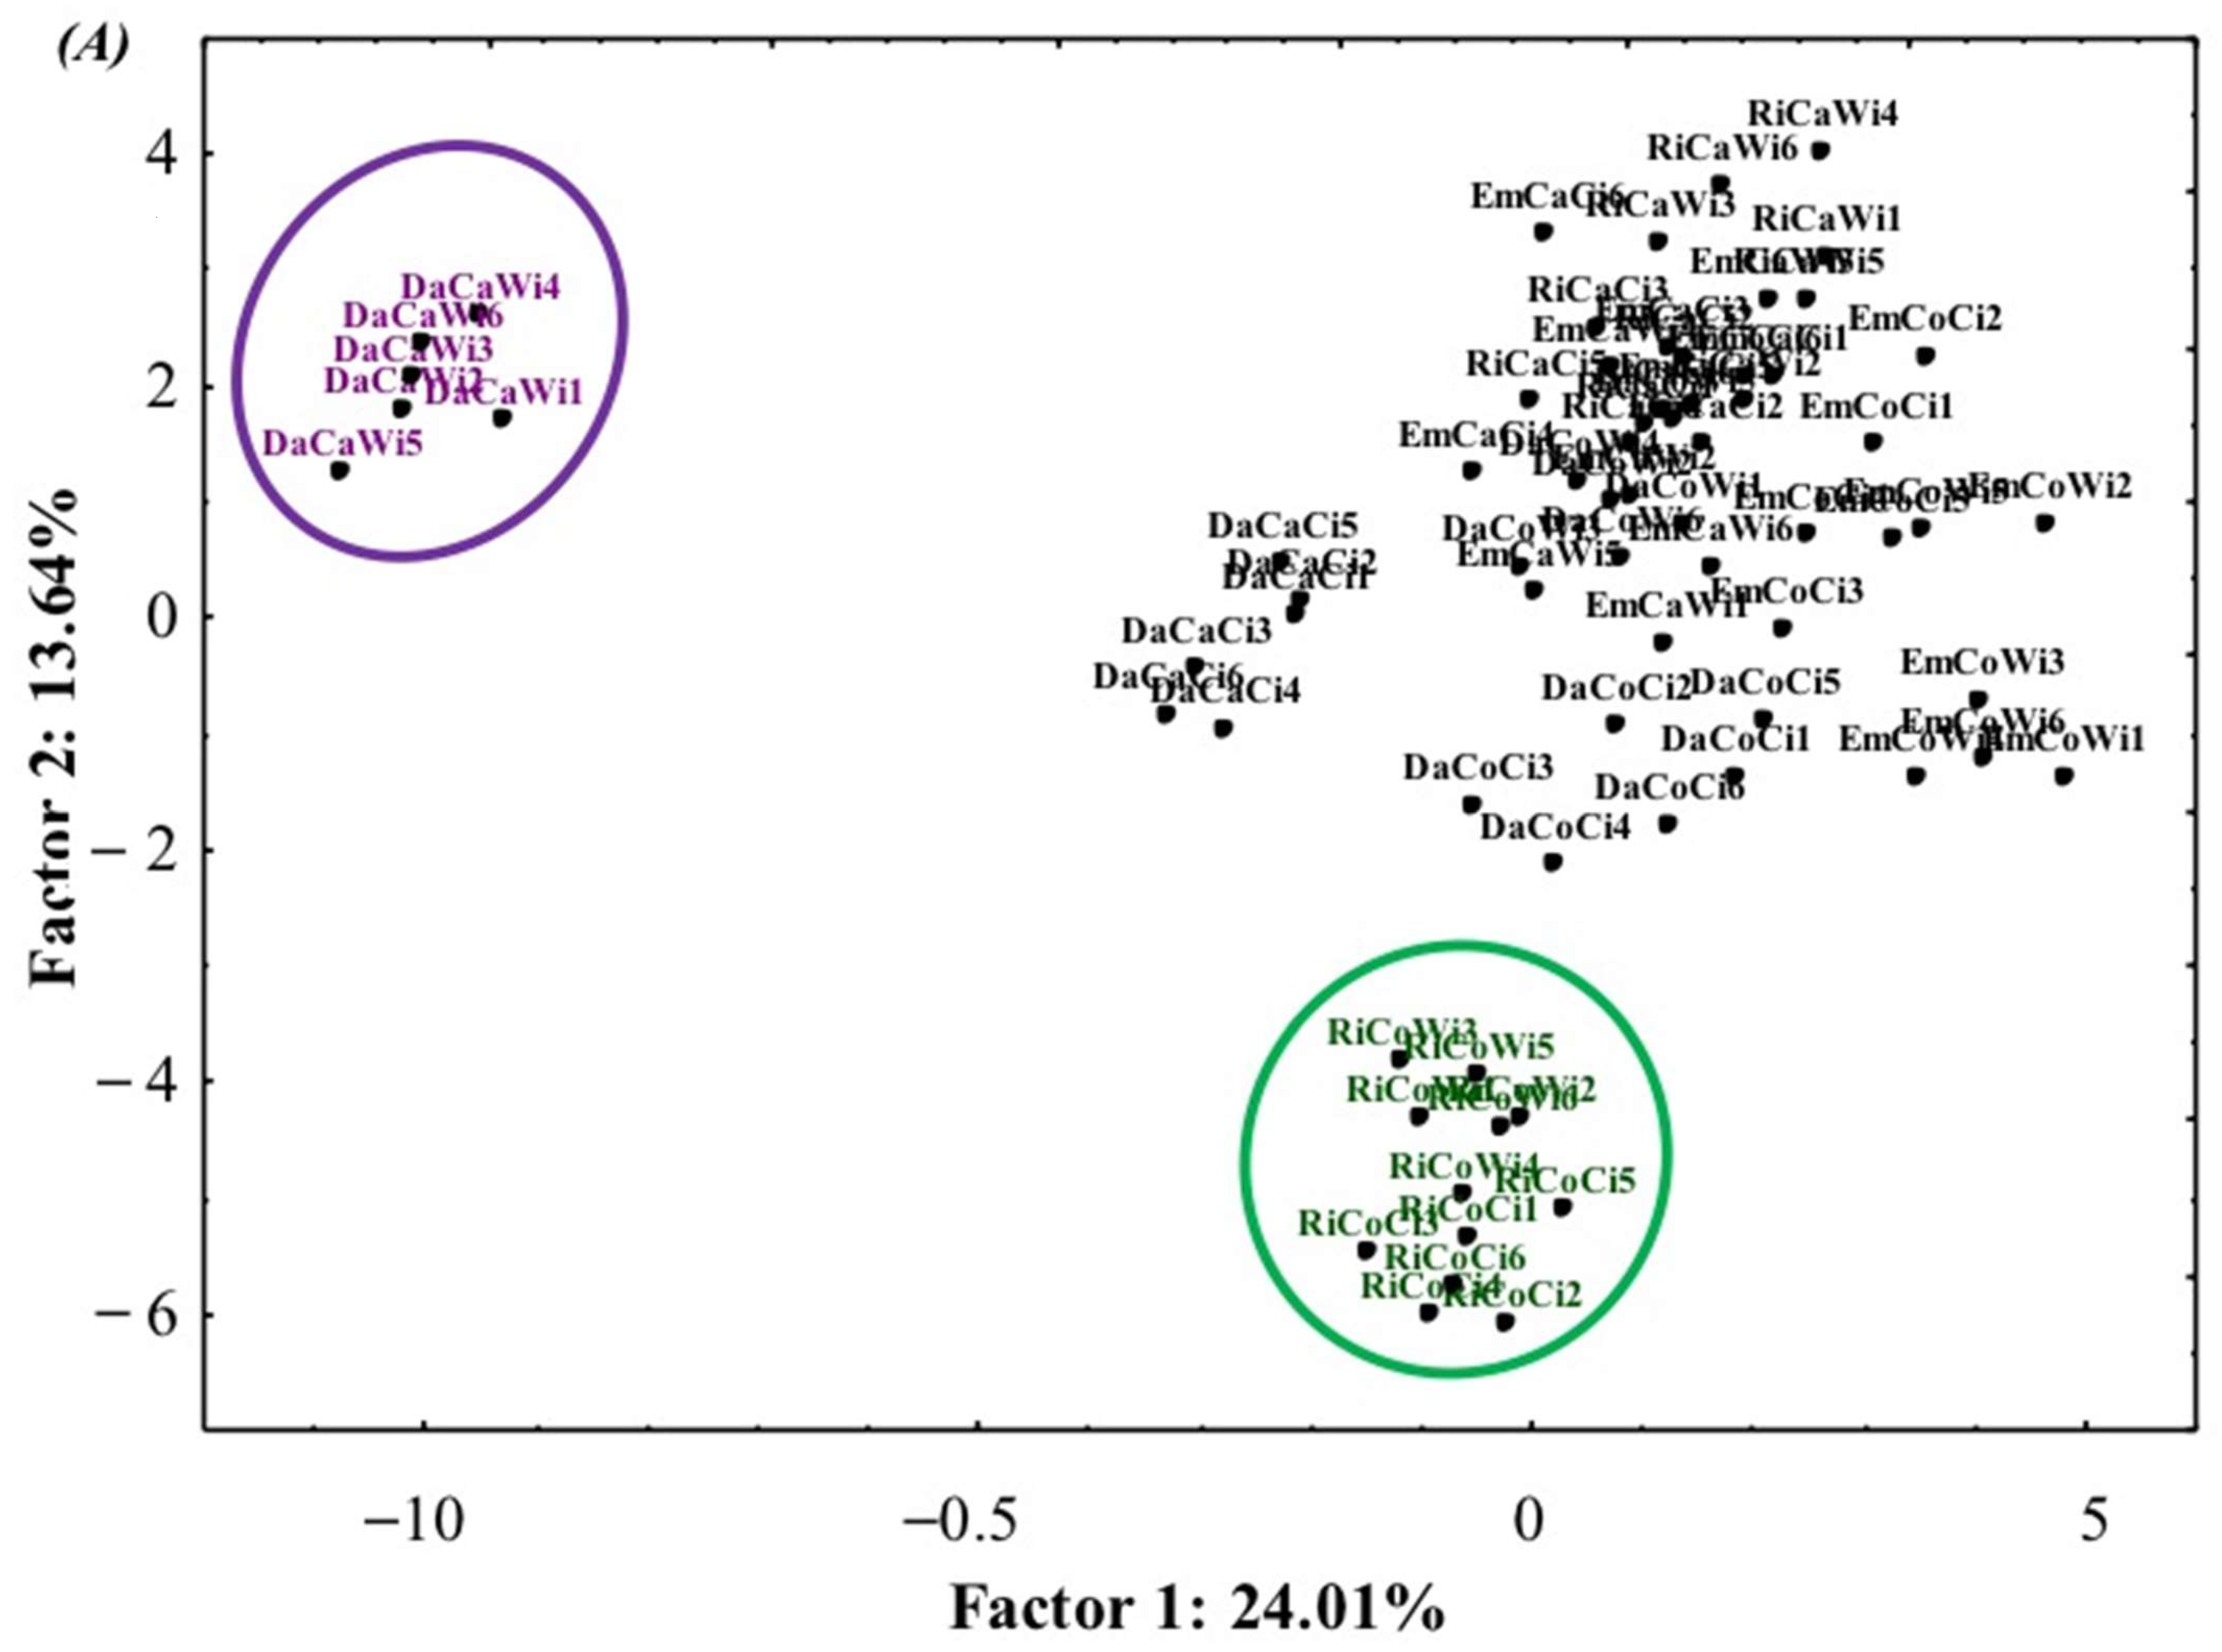
Principal Component Analysis was performed to visualize the relationship between the beers, their chemical composition, and their physical and sensory attributes. Figure 1 shows a biplot of Factors 1 and 2 which accounted for 37.65% of the variance in the whole data set. Most of the samples are concentrated around the centre of the factorial plane and, having similar characteristics from each other, appear overlapped. Two clusters of beers stand out for their positioning in the factorial plan: RiCo beers, which differ from the others for the negative loading of Factor 2; and DaCaWi beers, with negative loadings of Factors 1 and 2 (upper left quadrant). The negative loading of Factor 2 is associated with low values of titratable and volatile acidity; intermediate amounts of dry matter, carbon dioxide, organic acids (citric, malic, succinic), maltotriose; intermediate turbidity, sourness, effervescence, and body; high values of pH, soluble solids, EBC colour, alcohol %, lactic acid, maltodextrins, glycerol, and overall quality. The upper left quadrant corresponded to low amounts of soluble solids, dry matter, succinic acid, maltodextrins and maltotriose, and low sourness intensity; intermediate contents of carbon dioxide and lactic acid and intermediate intensity of the malty taste; high values of pH, EBC colour, alcohol %, titratable and volatile acidity, organic acids (citric, malic, acetic), glycerol, foam development, turbidity, effervescence, body, and overall quality.
Pearson correlation coefficients were calculated to evaluate significant (p < 0.01) correlations between pairs of variables. In the present work, the amount of foam was positively correlated with pH (0.60), alcohol % (0.42), and concentrations of gallic acid (0.61), 4-hydroxybenzoic acid (0.53), syringic acid (0.81), vanillic acid (0.46), epicatechin (0.69), and rutin (0.72), and negatively correlated with soluble solids (−0.58), dry matter (−0.45), and caffeic acid (−0.56). The persistence (stability) of foam was positively correlated with pH (0.57), and concentrations of gallic acid (0.64), 4-hydroxybenzoic acid (0.80), syringic acid (0.76), vanillic acid (0.53), epicatechin (0.68), and rutin (0.77), and negatively correlated with soluble solids (−0.64). A very high positive correlation was found between amount and stability of foam (0.82). The results are in agreement with those of Siebert [50], who found that intermediate pH and ethanol levels lead to the best foam. Concerning the positive correlation among phenolic content and foam development, it should be considered as an indirect measure of the effect of the protein content exerted by the starting cereal mixtures which, at the same time, are responsible for contributing most of the phenolic component to the beer.
The titratable and volatile acidity were positively correlated with CO2 (0.60 and 0.64, respectively) and acetic acid (0.97 and 0.96, respectively) contents. The acetic acid content was negatively correlated with alcohol % (−0.41) since ethanol is firstly oxidized to acetaldehyde that in turn is oxidized to acetic acid.
The total phenolic content was positively correlated with alcohol % (0.42) since beers lower in alcohol are brewed starting from worts having lower original gravity. Furthermore, the total phenolic content and the antioxidant activity expressed as Trolox were negatively correlated with resveratrol concentrations (−0.42 and −0.56, respectively), a behaviour already observed in wines [51].
Maltodextrin content was negatively correlated with amount and persistence of foam (−0.65 and −0.64, respectively) as well as maltotriose (−0.65 for the amount of foam; −0.54 for its persistence) in contrast with the use of maltodextrins to increase viscosity and stabilize foam of beer. Glycerol content was positively correlated with alcohol % (0.41) in agreement with the finding that the first is produced in great amount as a by-product of alcoholic fermentation.
Concerning sensory attributes, turbidity was positively correlated with pH (0.68) and alcohol % (0.67), and negatively correlated with acetic acid (−0.69), titratable acidity (−0.64), and volatile acidity (−0.69). These results are in agreement with Siebert and Lynn (2003) [52], whose results indicate that pH and alcohol content are likely to influence both the size of colloidal particles and light scattering. The malty taste was negatively correlated with soluble solids (−0.53) since it would be emphasized by high amount of low-degraded starch molecules. Bitterness was positively correlated with effervescence (0.45), since it is reinforced by acidity. The fruity taste was positively correlated with alcohol % (0.61) since the synthesis of esters (compounds responsible for this taste) increases with fermentation. Body was negatively correlated with soluble solids (−0.44) and maltodextrins (−0.61) and these results contrasted with the practice to add maltodextrins in alcohol-free beers at the end of the dealcoholization process, just in order to increase body and mouthfeel of the beer.
Finally, the overall quality of beers was positively correlated with concentrations of citric acid (0.52), 4-hydroxybenzoic acid (0.53), syringic acid (0.57), epicatechin (0.43), alcohol % (0.52), colour (0.52), amount and persistence of foam (0.55 and 0.63, respectively), intensity of fruity flavour (0.52), body (0.81), and negatively correlated with soluble solids (−0.47), maltodextrin content (−0.48), and intensity of sourness (−0.41) and saltiness (−0.44).

4. Conclusions

Witbier is a Belgian style of beers produced starting from malted barley and unmalted wheat mixed in different proportions, spiced with coriander and orange peel and characterized by a hazy, pale appearance and an IBU lower than 20. The nature of wheat employed is not specified but soft wheat is usually considered as the common raw material for the production beer. This work investigated the effects of changes in white beer formulation (by varying the type of unmalted wheat, hops, and yeast strain) on the quality of the resulting beers. The choice to use the maximum possible percentage of unmalted cereal allowed by the Italian law was made to ensure the maximum possible differentiation in the finished products. In total, 21 and 51 parameters of the starting cereal mixtures and the finished beers were analyzed, respectively. The different characteristics of the starting raw materials were levelled by the brewing process. As a consequence, most of the finished beers results were indistinguishable from each other, with the exception of two types of beer: those made with Risciola soft wheat and the Columbus hops and those obtained from Dauno III durum wheat, Cascade hops, and the Belgian yeast strain. The discriminating parameters included the following: titratable and volatile acidity, pH, concentrations of organic acids (citric, malic, succinic, lactic, and acetic), carbon dioxide content, soluble solids and dry matter, concentrations of carbohydrates (maltodextrins, maltotriose), concentrations of glycerol, colour, alcohol %, and sensory characteristics (amount and persistence of foam, turbidity, malty taste, sourness, effervescence, and overall quality). The best quality beers were characterized by a high intensity of colour, alcohol %, concentrations of citric acid, 4-hydroxybenzoic acid, syringic acid, and epicatechin; amount and persistence of foam, intensity of fruity flavour, and body. The best beers also showed low soluble solid and maltodextrin content, and low intensity of sourness and saltiness.

Author Contributions

Conceptualization, A.B.; methodology, A.B.; software, A.B.; validation, A.B., A.F., B.l.G., M.T., C.G., M.S. and F.G.; formal analysis, A.B., A.F., B.l.G., M.T., C.G., M.S. and F.G.; investigation, A.B., A.F., B.l.G., M.T., C.G., M.S. and F.G.; resources, A.B. and F.G.; data curation, A.B.; writing—original draft preparation, A.B.; writing—review and editing, A.B.; visualization, A.B., A.F., B.l.G., M.T., C.G., M.S. and F.G.; supervision, A.B.; project administration, A.B.; funding acquisition, A.B. and F.G. All authors have read and agreed to the published version of the manuscript.

Funding

The manuscript includes results obtained within the project entitled “Dal Campo al Boccale” funded by PSR PUGLIA 2014/2020-Misura 16-Cooperazione-Sottomisura 16.2—“Sostegno a progetti pilota e allo sviluppo di nuovi prodotti, pratiche, processi e tecnologie”.

Data Availability Statement

Not applicable.

Conflicts of Interest

The authors declare no conflict of interest.

Abbreviations

DaMixture of barley malt and unmalted durum wheat cv. Dauno III
RiMixture of barley malt and unmalted soft wheat cv. Risciola
EmMixture of barley malt and unmalted dehulled emmer
CaCascade hop
CoColumbus hop
CiM02 yeast strain
WiM21 yeast strain
IBUInternational Bitterness Unit
TPCTotal Phenolic Content

References

  1. Baiano, A. Craft beer: An overview. Compr. Rev. Food Sci. Food Saf. 2021, 20, 1829–1856. [Google Scholar] [CrossRef] [PubMed]
  2. Depraetere, S.A.; Delvaux, F.; Coghe, S.; Delvaux, F.R. Wheat variety and barley malt properties: Influence on haze intensity and foam stability of wheat beer. J. Inst. Brew. 2004, 110, 200–206. [Google Scholar] [CrossRef]
  3. Mascia, I.; Fadda, C.; Dostálek, P.; Olšovská, J.; Del Caro, A. Preliminary characterization of an Italian craft durum wheat beer. J. Inst. Brew. 2014, 120, 495–499. [Google Scholar] [CrossRef]
  4. Brewers Association. 2021 Brewers Association Style Guidelines. Available online: https://www.brewersassociation.org/edu/brewers-association-beer-style-guidelines/ (accessed on 20 October 2022).
  5. Albanese, L.; Ciriminna, R.; Meneguzzo, F.; Pagliaro, M. Innovative beer-brewing of typical, old and healthy wheat varieties to boost their spreading. J. Clean. Prod. 2018, 171, 297–311. [Google Scholar] [CrossRef]
  6. Marconi, O.; Mayer, H.; Chiacchieroni, F.; Ricci, E.; Perretti, G.; Fantozzi, P. The influence of glumes on malting and brewing of hulled wheats. J. Am. Soc. Brew. Chem. 2013, 71, 41–48. [Google Scholar] [CrossRef]
  7. Mozzon, M.; Foligni, R.; Mannozzi, C. Brewing quality of hop varieties cultivated in central italy based on multivolatile fingerprinting and bitter acid content. Foods 2020, 9, 541. [Google Scholar] [CrossRef]
  8. Lermusieau, G.; Liégeois, C.; Collin, S. Reducing power of hop cultivars and beer ageing. Food Chem. 2001, 72, 413–418. [Google Scholar] [CrossRef] [Green Version]
  9. Capece, A.; Romaniello, R.; Siesto, G.; Romano, P. Conventional and non-conventional yeasts in beer production. Fermentation 2018, 4, 38. [Google Scholar] [CrossRef] [Green Version]
  10. Biancolillo, A.; Bucci, R.; Magrì, A.L.; Magrì, A.D.; Marini, F. Data-fusion for multiplatform characterization of an italian craft beer aimed at its authentication. Anal. Chim. Acta 2014, 820, 23–31. [Google Scholar] [CrossRef]
  11. Campos Nunes Filho, R.; Galvan, D.; Effting, L.; Moreira Terhaag, M.; Yamashita, F.; de Toledo Benassi, M.; Spinosa, W.A. Effects of adding spices with antioxidants compounds in red ale style craft beer: A simplex-centroid mixture design approach. Food Chem. 2021, 365, 130478. [Google Scholar] [CrossRef]
  12. Cavallini, N.; Savorani, F.; Bro, R.; Cocchi, M. A Metabolomic approach to beer characterization. Molecules 2021, 26, 1472. [Google Scholar] [CrossRef] [PubMed]
  13. Giannetti, V.; Mariani, M.B.; Torrelli, P.; Marini, F. Flavour component analysis by HS-SPME/GC–MS and chemometric modeling to characterize Pilsner-style Lager craft beers. Microchem. J. 2019, 149, 103991. [Google Scholar] [CrossRef]
  14. Disciplina Igienica Della Produzione e Del Commercio Della Birra; Law 1354; Gazzetta Ufficiale Della Repubblica Italiana: Napoli, Italy, 1962; p. 234.
  15. American Association of Cereal Chemists. Official Methods 46–30.01 Crude Protein—Combustion Method; 44-15.02 Moisture—Air-Oven Methods; 08-01.01 Ash—Basic Method. In AACC International Approved Methods Analysis, 11th ed.; AACC International: St. Paul, MN, USA, 2012. [Google Scholar]
  16. ICC. Generic Methods N° 166 Determination of ß-Glucan in Barley, Oat and Rye. In ICC Standard Methods; International Association for Cereal Science and Technology: Vienna, Austria, 1998. [Google Scholar]
  17. Gandolpho, B.C.G.; Almeida, A.R.; Gandolpho, G.M.; Freitas, D.Z.; Gasparini, O.C.; Machado, M.H.; Barreto, P.L.M. Optimization of brewing waste’s (trub) phenolic compounds extraction by ultrasound assisted using response surface methodology. Quim. Nova 2021, 44, 478–483. [Google Scholar] [CrossRef]
  18. Singleton, V.L.; Rossi, J.A. Colorimetry of Total Phenolics with Phosphomolybdic-Phosphotungstic Acid Reagents. Am. J. Enol. Vitic. 1965, 16, 144–158. [Google Scholar]
  19. Abdel-Aal, E.S.M.; Hucl, P. Composition and stability of anthocyanins in bluegrained wheat. J. Agric. Food Chem. 2003, 51, 2174–2180. [Google Scholar] [CrossRef]
  20. Brandolini, A.; Castoldi, P.; Plizzari, L.; Hidalgo, A. Phenolic acids composition, total polyphenols content and antioxidant activity of Triticum monococcum, Triticum turgidum and Triticum aestivum: A two-year evaluation. J. Cereal Sci. 2013, 58, 123–131. [Google Scholar] [CrossRef]
  21. Brand-Williams, W.; Cuvelier, M.E.; Berset, C. Use of a free radical method to evaluate antioxidant activity. Food Sci.Technol. 1995, 28, 25–30. [Google Scholar] [CrossRef]
  22. da Costa Jardim, C.; De Souza, D.; Kasper Machado, I.C.; Massochin Nunes Pinto, L.; de Souza Ramos, R.C.; Garavaglia, J. Sensory profile, consumer preference and chemical composition of craft beers from Brazil. Beverages 2018, 4, 106. [Google Scholar] [CrossRef] [Green Version]
  23. European Brewery Convention. Method 9.6—Colour of beer: Spectrophotometric method. In Analytica-EBC; Schweizer Brauerei-Rundschau: Zürich, Switzerland, 1975. [Google Scholar]
  24. Coelho, E.M.; da Silva Padilha, C.V.; Miskinis, G.A.; de Sá, A.G.B.; Pereira, G.E.; de Azevêdo, L.C.; dos Santos Lima, M. Simultaneous analysis of sugars and organic acids in wine and grape juices by HPLC: Method validation and characterization of products from northeast Brazil. J. Food Comp. Anal. 2018, 66, 160–167. [Google Scholar] [CrossRef] [Green Version]
  25. Aliakbarian, B.; Casazza, A.A.; Perego, P. Valorization of olive oil solid waste using high pressure–high temperature reactor. Food Chem. 2011, 128, 704–710. [Google Scholar] [CrossRef]
  26. Krstanovic, V.; Habschied, K.; Lukinac, J.; Jukic, M.; Mastanjevic, K. The influence of partial substitution of malt with unmalted wheat in grist on quality parameters of lager beer. Beverages 2020, 6, 7. [Google Scholar] [CrossRef]
  27. Leitao, C.; Marchioni, E.; Bergaentzlé, M.; Zhao, M.; Didierjean, L.; Miesch, L.; Holder, E.; Miesch, M.; Ennahar, S. Fate of polyphenols and antioxidant activity of barley throughout malting and brewing. J. Cereal Sci. 2012, 55, 318–322. [Google Scholar] [CrossRef]
  28. Delvaux, F.; Delvaux, F.R.; Delcour, J.A. Characterization of the colloidal haze in commercial and pilot scale Belgian white beers. J. Inst. Brew. 2000, 4, 221–227. [Google Scholar] [CrossRef]
  29. Geisslitz, S.; Wieser, H.; Scherf, K.A.; Koehler, P. Gluten protein composition and aggregation properties as predictors for bread volume of common wheat, spelt, durum wheat, emmer and einkorn. J. Cereal Sci. 2018, 83, 204–212. [Google Scholar] [CrossRef]
  30. Nardini, M.; Foddai, M.S. Phenolics profile and antioxidant activity of special beers. Molecules 2020, 25, 2466. [Google Scholar] [CrossRef] [PubMed]
  31. Collin, S.; Jerkovic, V.; Bröhan, M.; Callemien, D. Polyphenols and beer quality. In Natural Products: Phytochemistry, Botany and Metabolism of Alkaloids, Phenolics and Terpenes, 2nd ed.; Ramawat, K., Mérillon, J.M., Eds.; Springer: Berlin/Heidelberg, Germany, 2013; pp. 2333–2359. [Google Scholar]
  32. Kumar, N.; Goel, N. Phenolic acids: Natural versatile molecules with promising therapeutic applications. Biotechnol. Rep. 2019, 24, e00370. [Google Scholar] [CrossRef]
  33. Rice-Evans, C.A.; Miller, N.J.; Paganga, G. Antioxidant properties of phenolic compounds. Trends Plant Sci. Rev. 1997, 2, 152–159. [Google Scholar] [CrossRef]
  34. Paszkot, J.; Kawa-Rygielska, J.; Anioł, M. Properties of dry hopped dark beers with high xanthohumol content. Antioxidants 2021, 10, 763. [Google Scholar] [CrossRef]
  35. Kolpin, K.M.; Shellhammer, T.H. The human bitterness detection threshold of iso-α-acids and tetrahydro-iso-α-acids in lager beer. J. Am. Soc. Brew. Chem. 2009, 67, 200–205. [Google Scholar] [CrossRef]
  36. de Sousa, T.; Ribeiro, M.; Sabença, C.; Igrejas, G. The 10,000-year success story of wheat. Foods 2021, 10, 2124. [Google Scholar] [CrossRef]
  37. Coote, N.; Kirsop, B.H. The content of some organic acids in beer and other fermented media. J. Inst. Brew. 1974, 80, 474–483. [Google Scholar] [CrossRef]
  38. Vogel, C. Avaliação da Adição de Pequenas Frutas (Berries) na Produção de Cerveja Artisanal: Análise Físico-Química, Sensorial, Compostos Fenólicos e Atividade Antioxidante; Bacharel em Engenhaira de Alimentos da Universidade Federal da Fronteira Sul; Universidade Federal da Fronteira Sul: Laranjeiras Do Sul, Brasil, 2017. [Google Scholar]
  39. Schwarz, K.J.; Boitz, L.I.; Methner, F.J. Release of phenolic acids and amino acids during mashing dependent on temperature, pH, time, and raw materials. J. Am. Soc. Brew. Chem. 2012, 70, 290–295. [Google Scholar] [CrossRef]
  40. Kuhbeck, F.; Schultz, M.; Thiele, F.; Krottenthaler, M.; Back, W. Influence of lauter turbidity and hot trub on wort composition, fermentation, and beer quality. J. Am. Soc. Brew. Chem. 2006, 64, 16–28. [Google Scholar] [CrossRef]
  41. Pascoe, H.M.; Ames, J.M.; Chandra, S. Critical stages of the brewing process for changes in antioxidant activity and levels of phenolic compounds in ale. J. Am. Soc. Brew. Chem. 2003, 61, 203–209. [Google Scholar] [CrossRef]
  42. Martinez-Gomez, A.; Caballero, I.; Blanco, C.A. Phenols and melanoidins as natural antioxidants in beer. structure, reactivity and antioxidant activity. Biomolecules 2020, 10, 400. [Google Scholar] [CrossRef] [Green Version]
  43. Siebert, K.J.; Troukhanova, N.V.; Lynn, P.Y. Nature of polyphenol-protein interactions. J. Agric. Food Chem. 1996, 44, 80–85. [Google Scholar] [CrossRef]
  44. Stevens, J.F.; Taylor, A.W.; Clawson, J.E.; Deinzer, M.L. Fate of xanthohumol and related prenylflavonoids from hops to beer. J. Agric. Food Chem. 1999, 47, 2421–2428. [Google Scholar] [CrossRef]
  45. Coghe, S.; Benoot, K.; Delvaux, F.; Vanderhaegen, B.; Delvaux, F.R. Ferulic acid release and 4-vinylguaiacol formation during brewing and fermentation: Indications for feruloyl esterase activity in Saccharomyces cerevisiae. J. Agric. Food Chem. 2004, 52, 602–608. [Google Scholar] [CrossRef]
  46. Blasco, L.; Viñas, M.; Villa, T.G. Proteins influencing foam formation in wine and beer: The role of yeast. Int. Microbiol. 2011, 14, 61–71. [Google Scholar] [CrossRef] [Green Version]
  47. Lusk, L.T.; Duncombe, G.R.; Kay, S.B.; Navarro, A.; Ryder, D. Barley β-glucan and beer foam stability. J. Am. Soc. Brew. Chem. 2001, 59, 183–186. [Google Scholar] [CrossRef]
  48. Delvaux, F.; Depraetere, S.; Delvaux, F.R.; Delcour, J.A. The ambiguous impact of wheat gluten proteins on the colloidal haze of wheat beers. J. Am. Soc. Brew. Chem. 2003, 61, 63–68. [Google Scholar] [CrossRef]
  49. Huismann, M.; Gormley, F.; Dzait, D.; Willoughby, N.; Stewart, K.; Speers, R.A.; Maskell, D.L. Unfilterable beer haze part II: Identifying suspect cell wall proteins. J. Am. Soc. Brew. Chem. 2022, 80, 26–34. [Google Scholar] [CrossRef]
  50. Siebert, K.J. Recent discoveries in beer foam. J. Am. Soc. Brew. Chem. 2014, 72, 79–87. [Google Scholar] [CrossRef]
  51. Yoncheva, T.; Guülcuü, M. Determination of antioxidant activity and resveratrol content in bulgarian wines from varieties with increased resistance to diseases and low winter temperatures. Ann. Food Sci. Technol. 2017, 18, 608–615. [Google Scholar]
  52. Siebert, K.J.; Lynn, P.Y. Effects of alcohol and ph on protein–polyphenol haze intensity and particle size. J. Am. Soc. Brew. Chem. 2003, 61, 88–98. [Google Scholar] [CrossRef]
Figure 1. Principal Component Analysis (PCA): projections of (A) beers and (B) their analytical profiles on the factorial plane. Phenolic compounds are reported in red font; organic acids are in green; sugars and glycerol are in purple; sensory attributes are reported in blue; the other variables are in black.
Beverages 09 00009 g001aBeverages 09 00009 g001b
Table 1. Composition of the 3 binary mixtures made of 60% barley malt and 40% unmalted cereals (alternatively durum wheat cv. Dauno III. Soft wheat cv. Risciola, or dehulled emmer).
MixturesMoisture (%)Ash (%)Proteins (g/100g d.m.)β-Glucan (g/100g d.m.)
Em4.4 ± 0.5 a2.3 ± 0.0 a9.5 ± 0.5 a2.5 ± 0.2 b
Ri4.8 ± 0.2 b2.2 ± 0.0 a11.1 ± 0.3 b2.8 ± 0.2 b
Da5.0 ± 0.4 b3.5 ± 0.3 b11.3 ± 0.5 b2.0 ± 0.1 a
In columns, different letters indicate significant differences (p < 0.05).
Table 2. Total phenolic content, antioxidant activity, and phenolic profile of the 3 binary mixtures made of 60% barley malt and 40% unmalted cereals.
MixturesTPC (μg/g d.m.)Antioxidant ActivityPhenolics (μg/g d.m.)
% Remaining DPPHmmol Trolox/g d.m.Gallic Acid3.4 Hydroxybenzoic Acidp- Hydroxybenzoic AcidCatechinVanillic AcidChlorogenic AcidCaffeic AcidSyringic AcidVanillinp-Coumaric AcidSyringaldeideFerulic AcidVitexinRutin
Mixtures of barley malt and unmalted durum wheat cv. Dauno III
Free 60.4191.247869101.020.6275.62.478.426-65-22.4
Conjugated -----------0.0--
Bound ---22.2---2.742.7106.635.5347.0--
Total3384 ± 31 b73.5 c0.012 ± 0.003 a60.4 c191.2 a478 b91.2 c101.0 a20.6 b275.6 a5.12 b121.1 c132.6 b35.5 a412.0 c- a22.4 a
Mixtures of barley malt and unmalted soft wheat cv. Risciola
Free 47.0208.6439.267.6111.86.6301.4-94.621.224.4--1.6
Conjugated --------4.84.5-12.210.24.5
Bound --2.7-3.0-10.9--108.532.6343.8-56.5
Total2789 ± 63 a64.7 b0.018 ± 0 b47.0 b208.6 a441.9 b67.6 a114.8 b6.6 a312.3 c- a99.4 a134.2 b57.0 b356.0 a10.2 b62.6 c
Mixtures of barley malt and unmalted dehulled emmer
Free 25.6538.2308.875.6142.830.0284.62.891.818.88.26.8-41.4
Conjugated ----8.6----3.8-11.213.1-
Bound --2.65.04.2-11.83.412.5105.827.2354.1--
Total3531 ± 182 c57.2 a0.018 ± 0 a25.6 a538.2 a311.4 a80.6 a155.6 c30.0 c296.44 a6.2 a104.3 a128.4 a35.4 a372.1 a13.1 a41.4 a
-: Not detected; in columns, different letters indicate significant differences (p < 0.05).
Table 3. Results of the basic analyses of beer samples. Single and interactive effects of cereal mixtures, hops, and yeasts used in brewing.
Beer SamplespHSoluble Solids °Bx)Dry Matter (%)Colour (EBC)CO2(g/L)Alcohol Content (%)Titratable Acidity (g/L)Volatile Acidity (g/L)
Interactive effects (cereal mixture*hop*yeast)
DaCaCi4.20 ± 0.03 f3.39 ± 0.04 b5.3 ± 0.2 bc2.97 ± 0.03 b2.70 ± 0.07 a3.12 ± 0.01 bc0.62 ± 0.02 a0.36 ± 0.08 a
DaCaWi4.20 ± 0.03 f2.78 ± 0.06 a2.4 ± 0.0 a8.28 ± 0.23 h4.60 ± 0.21 c3.67 ± 0.15 ef2.09 ± 0.03 ef1.50 ± 0.08 ef
DaCoCi3.98 ± 003 cd4.55 ± 0.08 f5.3 ± 0.8 bc2.64 ± 0.01 a3.53 ± 0.11 b3.80 ± 0.06 f1.47 ± 0.03 cd1.04 ± 0.03 b
DaCoWi3.92 ± 0.05 bc4,23 ± 0.04 d4.8 ± 0.3 bc3.84 ± 0.01 e7.28 ± 0.32 de3.57 ± 0.05 def2.06 ± 0.02 ef1.55 ± 0.15 ef
RiCaCi3.79 ± 0.02 a3.66 ± 0.07 c4.0 ± 0.1 ab3.58 ± 0.00 d4.55 ± 0.35 c3.27 ± 0.06 c3.04 ± 0.03 g2.57 ± 0.01 h
RiCaWi3.79 ± 0.03 a5.81 ± 0.04 k4.8 ± 1.1 bc3.05 ± 0.00 bc6.80 ± 0.07 de3.34 ± 0.05 cd2.87 ± 0.02 g2.43 ± 0.03 h
RiCoCi4.24 ± 0.03 f5.21 ± 0 h5.3 ± 0.6 bc4.12 ± 0.16 f2.70 ± 0.21 a4.84 ± 0.03 h1.09 ± 0.06 bc0.55 ± 0.01 a
RiCoWi4.11 ± 0.05 e4.68 ± 0.22 f3.5 ± 1.5 ab4.49 ± 0.06 g4.73 ± 0.21 c4.46 ± 0.02 g0.89 ± 0.02 ab0.48 ± 0.00 a
EmCaCi3.84 ± 0.03 a4.64 ± 0.04 f3.9 ± 1.3 ab3.18 ± 0.07 bc7.55 ± 0.35 e3.54 ± 0.19 de2.29 ± 0.45 f2.21 ± 0.10 g
EmCaWi4.01 ± 0.02 d4.38 ± 0.04 e6.1 ± 1.2 c3.19 ± 0.13 c3.75 ± 0.07 b3.14 ± 0.07 bc1.96 ± 0.03 ef1.45 ± 0.01 e
EmCoCi3.94 ± 0.01 bc4.91 ± 0 g3.5 ± 0.1 ab3.18 ± 0.00 bc5.75 ± 0.35 f2.85 ± 0.06 a1.85 ± 0.02 de1.70 ± 0.02 f
EmCoWi3.91 ± 0.01 b5.43 ± 0.05 i5.1 ± 0.0 bc3.45 ± 0.00 d6.55 ± 0.42 d2.96 ± 0.02 ab1.80 ± 0.01 de1.53 ± 0.05 ef
Significance********
Single effect (cereal mixture)
Emabaababb
Ribbabacbc
Dacaacabaa
Significance**n.s.*****
Single effect (hop)
Caaaabaabb
Cobbaaabaa
Significance**n.s.*n.s.***
Single effect (yeast)
Wiababbabb
Ciaaaaaaaa
Significancen.s.*n.s.**n.s.**
In columns, different letters indicate significant differences at p < 0.01 by LSD multiple range test; asterisks indicate significant differences at p < 0.01 by LSD multiple range test; n.s.: not significant.
Table 4. Contents in organic acids, sugars, and glycerol of beer samples. Single and interactive effects of cereal mixtures, hops, and yeasts used in brewing.
Organic Acids (g/L)Sugars (g/L)Glycerol
Beer AcronymsCitricMalicSuccinicLacticFumaricAceticMaltodextrinsMaltotrioseMaltose
Interactive effects (cereal mixture*hop*yeast)
DaCaCi0.98 ± 0.17 g0.59 ± 0.04 a0.86 ± 0.05 a0.73 ± 0.04 b0.02 ± 0.001 a1.52 ± 0.03 a27.49 ± 1.24 b8.21 ± 0.16 b- a2.69 ± 0.31 cde
DaCaWi1.00 ± 0.04 g1.05 ± 0.01 h1.75 ± 0.14 c0.99 ± 0.19 d0.02 ± 0.000 a4.61 ± 0.02 k26.39 ± 0.97 a8.01 ± 0.03 a- a3.44 ± 0.00 f
DaCoCi0.89 ± 0.01 ef0.90 ± 0.01 f1.78 ± 0.02 c0.72 ± 0.02 ab0.03 ± 0.000 a3.29 ± 0.01 d33.26 ± 0.91 e21.81 ± 0.21 e- a2.74 ± 0.03 de
DaCoWi0.82 ± 0.01 d1.54 ± 0.00 i2.02 ± 0.03 e0.68 ± 0.02 a0.02 ± 0.002 a4.03 ± 0.01 g33.48 ± 0.78 f23.83 ± 0.31 g- a2.42 ± 0.01 bc
RiCaCi1.02 ± 0.00 g0.78 ± 0.09 cd2.22 ± 0.03 f1.08 ± 0.02 f0.02 ± 0.000 a5.28 ± 0.04 l31.57 ± 0.29 c26.06 ± 0.08 k- a2.82 ± 0.09 e
RiCaWi0.86 ± 0.00 d0.90 ± 0.04 f1.84 ± 0.31 d1.03 ± 0.08 de0.02 ± 0.000 a5.67 ± 0.04 m31.92 ± 0.98 d25.48 ± 0.17 i- a2.47 ± 0.02 bcd
RiCoCi0.92 ± 0.05 f0.84 ± 0.02 e2.26 ± 0.12 f1.22 ± 0.03 g0.03 ± 0.001 a2.27 ± 0.03 b35.99 ± 2.36 i24.15 ± 0.08 h- a4.06 ± 0.15 g
RiCoWi0.73 ± 0.01 b0.79 ± 0.01 d2.97 ± 0.04 h1.36 ± 0.02 h0.02 ± 0.000 a2.34 ± 0.00 c34.54 ± 1.09 g17.92 ± 0.06 d- a3.31 ± 0.13 f
EmCaCi0.85 ± 0.14 de0.92 ± 0.18 f2.56 ± 0.53 g0.93 ± 0.05 c0.02 ± 0.000 a4.52 ± 1.26 i36.51 ± 0.53 k11.95 ± 0.09 c- a2.39 ± 0.38 b
EmCaWi0.78 ± 0.05 c0.99 ± 0.06 g2.25 ± 0.03 f1.07 ± 0.00 ef0.02 ± 0.000 a3.94 ± 0.48 f36.95 ± 1.11 l22.49 ± 0.09 f- a2.05 ± 0.09 a
EmCoCi0.72 ± 0.01 b0.64 ± 0.01 b1.76 ± 0.18 c0.90 ± 0.02 c0.02 ± 0.001 a4.12 ± 0.07 h35.46 ± 0.65 h25.47 ± 0.12 i- a3.92 ± 0.30 g
EmCoWi0.67 ± 0.11 a0.74 ± 0.09 c1.62 ± 0.08 b1.00 ± 0.05 d0.02 ± 0.000 a3.67 ± 0.06 e40.73 ± 0.52 m29.92 ± 0.23 l- a2.92 ± 0.16 e
Significance****n.s.***ns*
Single effect (cereal mixture)
Emaabbaccbaa
Ribaccabbcab
Dacbaaaaaaaa
Significance****n.s.***n.s.*
Single effect (hop)
Cabaaaaaaaaa
Coabbaaabbab
Significance***n.s.n.s.n.s.**n.s.*
Single effect (yeast)
Wiabbbabbbaa
Cibaaaaaaaab
Significance****n.s.***n.s.*
-: Not detected; in columns, different letters indicate significant differences at p < 0.01 by LSD multiple range test; asterisks indicate significant differences at p < 0.01 by LSD multiple range test; n.s.: not significant.
Table 5. Total phenolic content, antioxidant activity, and phenolic profile of beer samples. Single and interactive effects of cereal mixtures, hops, and yeasts used in brewing.
Beer AcronymsTPC (mg/L)Antioxidant ActivityPhenolics (mg/L)
% Remaining DPPHmmol Trolox/LGallic Acid4-hydroxybenzoic acidCatechinVanillic AcidCaffeic AcidSyringic AcidEpicatechinFerulic Acidp-Coumaric AcidRutinResveratrolQuercetin
Interactive effects (cereal mixture*hop*yeast)
DaCaCi244.67 ± 7.07 abc72.5 e0.696 ± 0.026 a16.471 ± 0.249 d3.306 ± 0.017 bcd1.177 ± 0.138 bcd1.147 ± 0.098 ab1.196 ± 0.118 ab0.940 ± 0.079 cd8.742 ± 0.690 a1.890 ± 0.019 bc1.366 ± 0.154 cd4.116 ± 0.115 c1.950 ± 0.083 e1.555 ± 0.145 bcd
DaCaWi221.33 ± 27.60 ab70.7 de0.743 ± 0.086 ab35.015 ± 1.622 g7.495 ± 0.901 h0.897 ± 0.102 ab1.963 ± 0.029 d0.914 ± 0.142 a1.693 ± 0.215 e11.069 ± 1.486 b2.047 ± 0.038 e1.504 ± 0.246 d9.117 ± 0.875 d1.733 ± 0.023 c1.820 ± 0.017 ef
DaCoCi316.67 ± 17.33 c64.8 cde0.9001 ± 0.030 abc21.015 ± 0.226 e3.146 ± 0.324 bc1.540 ± 0.105 e1.015 ± 0.115 a1.375 ± 0.166 ab0.894 ± 0.077 cd9.899 ± 0.697 ab1.882 ± 0.006 bc0.957 ± 0.093 a4.035 ± 0.083 c1.665 ± 0.067 c1.439 ± 0.040 ab
DaCoWi295.33 ± 25.28 bc53.1 a1.206 ± 0.069 e22.563 ± 0.414 e5.056 ± 0.509 fg0.708 ± 0.155 a1.507 ± 0.069 bc1.428 ± 0.029 ab0.790 ± 0.226 bc9.222 ± 0.625 a1.858 ± 0.031 ab0.891 ± 0.030 a3.825 ± 0.414 bc1.711 ± 0.027 d1.602 ± 0.054 bcde
RiCaCi290.67 ± 14.51 bc65.6 cde0.878 ± 0.107 abc17.845 ± 0.817 d3.513 ± 0.222 bcde1.179 ± 0.130 bcd1.403 ± 0.094 abc1.367 ± 0.307 ab0.919 ± 0.158 cd9.549 ± 0.740 ab1.901 ± 0.049 bcd0.858 ± 0.071 a2.876 ± 0.274 a1.415 ± 0.063 b1.242 ± 0.083 a
RiCaWi254.33 ± 43.94 abc64.4 cde0.909 ± 0.048 abc6.016 ± 0.242 a5.114 ± 0.364 g0.689 ± 0.056 a1.710 ± 0.118 cd1.299 ± 0.248 ab0.325 ± 0.096 a9.357 ± 0.079 a1.938 ± 0.029 bcd0.865 ± 0.055 a3.182 ± 0.159 ab1.669 ± 0.028 c1.664 ± 0.021 cdef
RiCoCi315.67 ± 25.28 c54.6 ab1.169 ± 0.058 de14.011 ± 0.352 c4.001 ± 0.353 cde1.395 ± 0.198 cde1.338 ± 0.125 abc1.560 ± 0.371 b1.053 ± 0.134 cd9.969 ± 0.908 ab1.994 ± 0.012 de1.221 ± 0.122 bc4.053 ± 0.201 c1.368 ± 0.021 ab1.771 ± 0.011 def
RiCoWi267.67 ± 21.35 abc53.1 a1.207 ± 0.042 e15.420 ± 0.004 cd4.350 ± 0.270 efg1.984 ± 0.144 f1.742 ± 0.514 cd1.347 ± 0.328 ab1.016 ± 0.119 cd9.844 ± 0.116 ab1.881 ± 0.014 bc1.034 ± 0.103 ab3.604 ± 0.223 abc1.225 ± 0.052 a1.399 ± 0.094 ab
EmCaCi253.00 ± 8.54 abc69.9 de0.765 ± 0.068 ab25.103 ± 0.374 f2.964 ± 0.180 ab1.689 ± 0.388 ef1.560 ± 0.022 bcd1.540 ± 0.299 b1.171 ± 0.269 d9.667 ± 0.427 ab1.852 ± 0.068 ab1.068 ± 0.084 ab3.805 ± 0.530 bc1.630 ± 0.089 c1.549 ± 0.017 bc
EmCaWi270.67 ± 3.42 abc63.0 bcd0.946 ± 0.046 bcd17.745 ± 0.250 d4.193 ± 0.376 def1.116 ± 0.438 bc1.656 ± 0.083 bcd1.601 ± 0.179 b0.780 ± 0.229 bc9.408 ± 0.490 a1.955 ± 0.081 cde1.427 ± 0.047 cd4.036 ± 0.134 c1.883 ± 0.020 de1.837 ± 0.067 f
EmCoCi196.33 ± 21.53 a67.2 cde0.835 ± 0.043 abc6.044 ± 0.038 a2.133 ± 0.226 a1.469 ± 0.103 de1.125 ± 0.236 ab1.562 ± 0.253 b0.528 ± 0.043 ab8.926 ± 0.207 a1.777 ± 0.043 a1.347 ± 0.102 cd4.133 ± 0.068 c1.659 ± 0.065 c1.732 ± 0.081 cdef
EmCoWi302.33 ± 7.07 c59.0 abc1.051 ± 0.150 cde10.457 ± 0.299 b3.218 ± 0.222 bc1.567 ± 0.130 e1.143 ± 0.223 ab1.566 ± 0.020 b0.352 ± 0.036 a9.310 ± 0.385 a1.953 ± 0.032 cde1.287 ± 0.067 bcd4.186 ± 0.101 c1.242 ± 0.001 a1.567 ± 0.096 bcd
Significance***************
Single effect (cereal mixture)
Emababababaaabbbb
Riaababbaabaaaaaaa
Daabaccaaabaabccab
Significancen.s.*****n.s.**n.s.n.s.****
Single effect (hop)
Caababbababababba
Coaabaabaaaaaaaaa
Significancen.s.******n.s.*n.s.*n.s.**n.s.
Single effect (yeast)
Wiaabbbabaaababab
Ciabaaabaaaaaaaaa
Significancen.s.******n.s.n.s.n.s.*n.s.*n.s.*
In columns, different letters indicate significant differences at p < 0.01 by LSD multiple range test; the asterisks indicate significant differences at p < 0.01 by LSD multiple range test; n.s.: not significant.
Table 6. Sensory evaluation of beer samples. Single and interactive effects of cereal mixtures, hops, and yeasts used in brewing.
Beer AcronymsColourFoamTurbidityGustatory CharacteristicsTactile CharacteristicsOverall Quality
FoamLiquidAmountPersistenceSweetnessBitternessSaltinessAcidity/SournessMaltyHoppyFloralFruitySpicyAlcoholicEffervescenceBody
Interactive effects (cereal mixture*Hop*Yeast)
DaCaCi1.0 ± 0.0 a2.5 ± 0.8 a2.7 ± 05 cd2.3 ± 0.5 cd3.0 ± 0.6 cd2.2 ± 0.8 a3.2 ± 0.4 a2.5 ± 0.5 a2.7 ± 0.8 ab3.3 ± 0.5 c2.8 ± 0.8 a1.7 ± 0.8 a2.7 ± 0.8 a1.8 ± 1.0 a2.8 ± 0.8 a3.0 ± 0.0 ab3.0 ± 0.0 bc3.7 ± 0.5 cde
DaCaWi1.0 ± 0.0 a2.7 ± 0.5 a4.7 ± 0.5 e3.8 ± 0.4 d2.8 ± 1.2 bcd2.3 ± 1.2 a3.0 ± 0.6 a2.5 ± 0.8 a2.5 ± 0.5 a2.8 ± 0.4 bc2.7 ± 0.8 a1.8 ± 1.0 a1.8 ± 0.8 a1.7 ± 0.8 a3.0 ± 0.6 a3.7 ± 0.8 b3.7 ± 0.5 c4.3 ± 0.5 e
DaCoCi1.3 ± 0.8 a2.7 ± 0.5 a2.2 ± 0.8 bc1.5 ± 0.5 ab2.0 ± 0.6 abc2.3 ± 0.8 a2.5 ± 0.5 a3.0 ± 0.6 a2.7 ± 0.8 ab2.7 ± 0.5 abc2.3 ± 0.5 a1.8 ± 0.8 a2.2 ± 0.8 a1.2 ± 0.4 a2.3 ± 0.5 a2.2 ± 0.8 a2.3 ± 0.5 ab3.0 ± 0.9 abcd
DaCoWi1.3 ± 0.8 a2.7 ± 0.8 a2.2 ± 0.4 bc2.0 ± 0.6 abc1.7 ± 0.5 a2.5 ± 0.8 a2.3 ± 0.5 a2.8 ± 0.4 a3.0 ± 0.9 abc2.8 ± 0.4 bc2.3 ± 0.5 a2.2 ± 0.8 a2.7 ± 0.5 a1.5 ± 0.5 a2.7 ± 0.5 a2.8 ± 0.4 ab2.7 ± 0.5 ab3.0 ± 0.0 abcd
RiCaCi1.3 ± 0.8 a2.2 ± 1.2 a2.0 ± 0.0 bc1.8 ± 0.4 abc1.7 ± 0.5 a2.3 ± 0.5 a2.7 ± 0.5 a3.5 ± 0.8 a3.0 ± 0.6 abc2.3 ± 0.5 ab2.3 ± 0.8 a2.2 ± 0.4 a2.3 ± 0.5 a1.7 ± 0.8 a2.5 ± 0.5 a3.5 ± 0.8 ab2.8 ± 0.4 ab3.7 ± 0.5 cde
RiCaWi1.0 ± 0.0 a2.7 ± 0.8 a2.0 ± 0.0 bc1.5 ± 0.5 ab1.7 ± 0.5 a2.2 ± 0.8 a2.7 ± 1.0 a3.3 ± 1.0 a3.7 ± 0.8 bc2.3 ± 0.8 ab2.5 ± 0.5 a1.7 ± 0.5 a2.2 ± 1.0 a1.8 ± 0.8 a2.3 ± 0.8 a3.3 ± 0.8 ab2.7 ± 0.5 ab2.8 ± 0.4 abc
RiCoCi1.0 ± 0.0 a1.8 ± 0.8 a2.5 ± 0.5 bcd2.3 ± 0.5 abc3.3 ± 0.8 e2.3 ± 1.0 a2.3 ± 0.5 a2.5 ± 0.8 a2.5 ± 0.5 a2.3 ± 0.5 ab2.5 ± 0.5 a2.0 ± 0.6 a2.5 ± 0.8 a1.3 ± 0.5 a2.5 ± 0.5 a2.5 ± 0.5 ab2.7 ± 0.5 ab3.3 ± 0.8 bcde
RiCoWi1.0 ± 0.0 a2.2 ± 0.8 a3.2 ± 0.4 d2.5 ± 0.5 c2.7 ± 0.5 abcd2.2 ± 0.4 a2.5 ± 0.5 a2.5 ± 0.5 a2.7 ± 0.5 ab2.2 ± 0.4 ab2.3 ± 0.5 a2.3 ± 0.5 a2.8 ± 0.8 a1.7 ± 0.8 a2.5 ± 0.5 a3.0 ± 0.9 ab2.8 ± 0.4 ab4.0 ± 0.0 de
EmCaCi1.0 ± 0 a2.8 ± 0.8 a2.2 ± 0.4 bc1.7 ± 0.8 abc1.8 ± 0.8 ab2.0 ± 0.9 a3.0 ± 0.9 a2.7 ± 1.2 a3.8 ± 0.8 c2.7 ± 0.8 abc2.0 ± 0.6 a2.2 ± 0.8 a2.3 ± 0.5 a2.0 ± 1.3 a2.2 ± 0.8 a3.0 ± 0.9 ab2.3 ± 1.0 ab2.71.0 abc
EmCaWi1.3 ± 0.8 a2.5 ± 0.8 a2.2 ± 0.4 bc2.0 ± 0.6 abc1.7 ± 0.5 a1.7 ± 0.8 a2.7 ± 1.2 a3.7 ± 0.8 a3.7 ± 1.0 bc1.8 ± 0.8 a2.5 ± 0.5 a2.0 ± 0.6 a2.0 ± 0.6 a1.8 ± 1.2 a2.5 ± 1.0 a3.7 ± 1.2 b2.2 ± 0.4 a2.3 ± 0.8 ab
EmCoCi1.3 ± 0.8 a1.7 ± 0.8 a1.8 ± 0.4 ab1.3 ± 0.50 a2.2 ± 1.0 abc2.2 ± 1.2 a2.7 ± 0.8 a3.3 ± 1.4 a3.7 ± 0.8 bc2.5 ± 0.5 abc2.5 ± 0.5 a1.7 ± 0.8 a2.0 ± 0.6 a2.0 ± 0.9 a2.5 ± 0.8 a3.3 ± 1.4 ab2.2 ± 0.4 a2.2 ± 0.8 a
EmCoWi1.7 ± 1.0 a1.7 ± 0.5 a1.2 ± 0.4 a1.2 ± 0.4 a1.7 ± 0.5 a2.3 ± 1.3 a2.8 ± 1.5 a2.7 ± 0.8 a3.3 ± 0.5 abc2.0 ± 0.9 ab2.0 ± 0.0 a1.3 ± 0.5 a1.8 ± 0.8 a1.8 ± 1.2 a2.2 ± 0.4 a2.8 ± 1.2 ab2.2 ± 0.4 a2.7 ± 0.8 abc
Significancen.s.n.s.***n.s.n.s.n.s.**n.s.n.s.n.s.n.s.n.s.***
Single effect (cereal mixture)
Emaaaaaaaabaaaaaaaaa
Riaabbabaaaaaaaaaaabb
Daaacbbaaaabaaaaaabb
Significancen.sn.s***n.sn.sn.s**n.sn.sn.sn.sn.sn.s**
Single effect (hop)
Caaabbaaaaaaaaaaabaa
Coaaaaaaaaaaaaaaaaaa
Significancen.sn.s**n.sn.sn.sn.sn.sn.sn.sn.sn.sn.sn.s*n.sn.s
Single effect (yeast)
Wiaabaaaaaaaaaaaaaaa
Ciaaabbaaaaaaaaaaaaa
Significancen.sn.s***n.sn.sn.sn.sn.sn.sn.sn.sn.sn.sn.sn.sn.s
In column, different letters indicate significant differences at p < 0.01 by LSD multiple range test; the asterisks indicate significant differences at p < 0.05 by LSD multiple range test; n.s.: not significant.
Disclaimer/Publisher’s Note: The statements, opinions and data contained in all publications are solely those of the individual author(s) and contributor(s) and not of MDPI and/or the editor(s). MDPI and/or the editor(s) disclaim responsibility for any injury to people or property resulting from any ideas, methods, instructions or products referred to in the content.

