Article

Climate Effect on Morphological Traits and Polyphenolic Composition of Red Wine Grapes of Vitis vinifera

by
Maria Inês Rouxinol
1,2,
Maria Rosário Martins
3,*,
Vanda Salgueiro
4,
Maria João Costa
4,
João Mota Barroso
5 and
Ana Elisa Rato
1,5,*
1
MED—Mediterranean Institute for Agriculture Environment and Development, CHANGE—Global Change and Sustainability Institute, Universidade de Évora, Pólo da Mitra Ap. 94, 7006-554 Évora, Portugal
2
Institute for Advanced Studies and Research, Universidade de Évora, Pólo da Mitra Ap. 94, 7006-554 Évora, Portugal
3
HERCULES Laboratory, Departamento de Ciências Médicas e da Saúde, Escola de Saúde e Desenvolvimento Humano, Universidade de Évora, Rua Romão Ramalho 59, 7000-671 Évora, Portugal
4
ICT—Instituto de Ciências da Terra (Polo de Évora), Earth Remote Sensing Laboratory (EaRSLab), Universidade de Évora, Rua Romão Ramalho 59, 7000-671 Évora, Portugal
5
Departamento de Fitotecnia, Escola de Ciências e Tecnologia, Universidade de Évora, Polo da Mitra Ap. 94, 7006-554 Évora, Portugal
*
Authors to whom correspondence should be addressed.
Beverages 2023, 9(1), 8; https://doi.org/10.3390/beverages9010008
Submission received: 24 November 2022 / Revised: 2 January 2023 / Accepted: 9 January 2023 / Published: 16 January 2023
(This article belongs to the Special Issue Phenolic Compounds in Wine)

Abstract

:
Wine quality is determined by the development of grape maturation, which is highly dependent on climate variations. Extreme weather events are becoming more common, which will affect the productivity and quality of grapes and wine. Grape development depends on many factors, including weather, and extreme events will influence berry size, skin thickness and the development of some key compounds, such as phenolics. In this work, the ripening evolution and phenolic content of Vitis vinifera extracts from a vineyard in Alentejo (Portugal) were evaluated in two distinct climatic years. During this period, the influence of climatic conditions on grape ripening, and thereby on red wine quality, was assessed. The results demonstrate differences in polyphenol compounds between years and the importance of monitoring their content during maturation. The reduction of berry size, apparently due to lower pluviosity and higher temperatures, resulted in a higher content of polyphenolic compounds related to grape quality.

1. Introduction

Wine is one of the most consumed alcoholic beverages in the world [1]. The culture of wine is important in Mediterranean countries because it is widely consumed with meals, and also has a social component [2]. This beverage has unique properties, including a rich composition of polyphenols with antioxidant properties. Polyphenolic compounds present in wine and grapes are known for their antioxidant, antimutagenic and neuroprotective effects on human health [3]. Besides their advantages for human health, polyphenolic compounds, such as anthocyanins and tannins, are responsible for organoleptic characteristics in grapes and lately in wine [4]. Anthocyanins are responsible for the typical red color of grape skins and wine [2], and tannins are responsible for the body and mouthfeel of wines [5]. Moderate red wine drinkers will consume polyphenols at levels well above the rest of the population, since some red wines can contain up to 3 g/L of total polyphenols [3].
Climate shifts that change normal weather parameters will affect grape development and consequently wine quality. Global warming is affecting both grape phenologic periods and grape composition [6]. High temperatures substantially affect grape development, cell wall composition and phenolic composition [3]. Berry size also has an impact on berry quality and consequently on wine. Lower water availability is known to decrease berry size, although it may contribute to an increase of phenolic compounds [1].
Grape skin is a thin outer layer made up of composite cuticle, epidermis and hypodermis [7], which constitutes about 5–10% of the total dry weight of grape berries [8]. Its main functions are to act as a hydrophobic barrier to fungal infections and to protect the berry against dehydration, UV light and physical injuries. This physical barrier also limits fruit growth [7]. Pectic polysaccharides are the main components of grape skin cell walls; hence, they are mainly responsible for contributing to intracellular adhesion and cell wall strength [9], and also protecting color and aroma components during winemaking [6]. Grape skins need to be broken down to make these components accessible in the winemaking process, resulting in higher-quality wines [8]. Thus, from an oenological point of view, skin cell walls are relevant since they directly influence the extractability of phenolic compounds in grapes; hence, they create a diffusion barrier which may contribute, during vinification, to impeding the release of these interesting compounds into the wine. Additionally, skin cell walls are composed of pectic polysaccharides that have the important effect of biding the tannins [9]. These compounds bounded to cell walls will precipitate during settling and, will contribute to the reduction of tannins in wine [3].
Climate has a significant impact on grape quality and on the synthesis of phenolic compounds [10]. In grape skins, phenolic compounds are bound to polysaccharides by hydrogen bounds and hydrophobic interactions [11]. The environmental conditions in the experimental area have a great influence on the phenolics that are present on cell walls [9]. Phenolics are located in the vacuoles of skins and seeds, and some may be retained in cell walls during maturation through adsorption by insoluble cell wall polymers [12]. It is widely accepted that the phenolics in red wine are quality indicators, and they are largely dependent on climate conditions during the growing season [6]. Non-volatile phenolic compounds play an essential role in wine and grape sensorial characteristics, since they are responsible for some of the main organoleptic characteristics in wine (including aroma, color, flavor, astringency and bitterness) [4] and are affected by many factors, including grape variety, maturation status, environmental factors (including soil and climate) [13] and the winemaking technology and fermenting and aging conditions [8].
Many agricultural practices have been developed to mitigate the worst effects of adverse weather conditions, such as canopy shading, kaolin foliar aerosol coating and irrigation. However, the detrimental effects on grape quality parameters, and consequently in wine characteristics [14], due to the use of these different practices, justify their limited use.
Cameron [15] studied 23 different grape varieties between 1999 and 2018 and found that the phonologic response depends on the variety of grape and the changes in climate conditions. Some varieties might show advancements of maturity, while others can show some delay. Costa [16] studied the influence of atmospheric conditions on berry quality parameters in three different Portugal regions (Alentejo, Douro and Dão) and found that high temperatures tend to decrease berry weight, titratable acidity, anthocyanins and total phenolic content, and increase pH and potential alcohol. These authors also found that the influence of precipitation depends on the location and variety.
In this study, the performance of four red wine grape varieties was followed up during two years, in Alentejo, south of Portugal. These two consecutive years were very different: 2017 was the second warmest year in Portugal with an annual total precipitation medium of 541.3 mm, the third lowest ever registered. In 2018, the medium air temperature was 15.4 °C, slightly above the normal registered temperature, and the total annual average pluviosity was 939.9 mm, corresponding to 107% of the regular value. Berry growth, skin thickness, cell wall composition and phenolic compounds were evaluated from veraison until harvest to understand how annual climate shifts can affect grape berries.

2. Materials and Methods

2.1. Experimental Design

Trials were conducted in a vineyard located in “Herdade da Mitra”, Valverde, Évora (center/south Portugal) (38°32′01.2″ N 8°00′57.7″ W). The vineyard was not irrigated. ‘Aragonês’, also known as ’Tempranillo’, ‘Syrah’, ‘Touriga Nacional’ and ‘Trincadeira’ (Vitis vinifera L.) grapes were harvested at five time points, along veraison in 2017 and 2018, until the end of maturation. Each sample consisted of 25 clusters picked randomly from different rows and different plants. About three hundred berries per variety were selected from two clusters per plant among a total of 100 plants.
After harvest, berries were manually separated from clusters, and 3 replicates of 50 grape berries were randomly sampled and weighed. Berries were frozen at −20 °C for further processing. The remaining berries were crushed, turned into must, and used for quantifying acidity and total soluble solids.
Meteorological data was collected from the Instituto de Ciências da Terra weather station in “Herdade da Mitra” (Évora). Radiation measurements in the ultraviolet (UVA and UVB) spectral region, and encompassing the whole short-wave (SW) spectral region (0.3 to 4 μm), were taken at the ICT Atmospheric Sciences Observatory, Évora (38°34′4.1″ N, 7°54′41.3″ W), a straight-line distance of 10 km from “Herdade da Mitra”. These measurements were used to quantify the UVA, UVB and SW doses (integral of the radiation measured during the period considered).
Chemicals were high-purity grade and were purchased from Sigma-Aldrich (St. Louis, MO, USA) or Merck KGaA (Darmstadt, Germany).

2.2. Titrable Acidity and Total Soluble Solids

The titratable acidity was determined by potentiometry, and the total soluble solid content by refractometry. Titratable acidity and pH were assessed using a pH meter Crison® compact titrator with an autosampler (Barcelona, Spain). Titratable acidity (TA) was evaluated by sample titration with 0.2 M sodium hydroxide up to pH 8, and expressed in tartaric acid equivalents. The total soluble solids of grape berry juice were determined using a digital refractometer, ATAGO PR-32α, and the results were expressed as ºBrix [2].

2.3. Grape Skin Extracts

Skins were manually separated from berries and weighted. To mimic wine and allow the extraction of polyphenolic compounds, 10 g of grape pericarp was added to 25 mL of extraction reagent (water:ethanol:hydrocloric acid = 50:49:1, v/v/v) and ground using an IKA T25 digital ultra turrax at 9000 rpm for 30 s. Then, samples were extracted in agitation for one hour, filtered and stored at −20 °C until posterior analyses, for polyphenolic assessment.

2.4. Sequential Extraction of Cell Wall Material

To extract skins’ AIR, after the preparation of grape skin extracts, grape skin remains were ground and then extracted with ethanol (72%) used in the proportion 1:6 (w/v) and boiled for 10 min. The supernatant was sequentially washed, filtered under vacuum conditions and air-dried overnight [17].

2.5. Quantification of Total Phenolic Compounds

The total phenolic compound content was determined by the Folin–Ciocalteu method adapted for microplate quantification [2]. Briefly, 5 μL of samples of ethanolic extracts and standards were diluted with 235 μL of distilled water, and then 15 μL of Folin reagent was added. After homogenization, 45 μL of saturated sodium carbonate solution was added. Plates were incubated at 40 °C for 30 min and the absorbance was read at 630 nm using a microplate reader Multiskan™ FC Microplate Photometer, Thermofisher (Waltham, MA, USA). For each sample and standards under analysis, 6 replicates were performed. A standard curve for total phenolic content was performed using gallic acid (0–500 µg/mL). Results were expressed in µg of gallic acid equivalents by g of grape skin fresh weight.

2.6. Total Flavonoid Content

Total flavonoid content in grape skin extracts was determined according to Hosu [5] with some modifications. Thus, in a 96-well microplate, 30 μL of sample was diluted with 200 μL of water, and then 25 μL of Aluminum Chloride 2% and 30 μL of Sodium Acetate were added. A blank assay was prepared by adding 30 μL of sample, 225 μL of water and 30μL of Sodium Acetate. After incubating for 15 min at room temperature, the absorbance was measured at 430 nm. Rutin ethanolic solution was used as standard (0–200 μg/mL). Samples and standards were performed in sextuplicate, and results were expressed in µg of rutin equivalents by g of grape skin fresh weight.

2.7. Anthocyanin’s Identification and Separation

Chromatographic analysis was performed using a UPLC Dionex Ultimate 3000, equipped with a diode array detector (DAD) and Chromeleon 6.8. software [2], according to Antoniolli (2015) [18] with some modifications. Separations were achieved at 35 °C on an RP-C18 LiChrospher 100 column (4 mm × 200 mm, 5 µm), using as the mobile phase ultrapure water:formic acid:acetonitrile (87:10:3, v/v/v) as solvent A, and ultrapure water:formic acid: acetonitrile (40:10:50, v/v/v) as solvent B. The gradient was as follows: 0 min 10% B; 0–10 min 25% B; 10–15 min 31% B; 15–20 min 40% B; 20–30 min 50% B; 30–35 min 100% B; 35–40 min 10% B; 40–47 min 10% B. The flow rate was 0.8 mL/min and the injection volume was 10 µL. The quantification was performed at 520 nm and a calibration curve was obtained using oenin-3-O-glucoside ethanolic solutions in a concentration range from 12.5–0.1 µg/mL. Standards and sample solutions were analyzed in triplicate, and the results were expressed in mg oenin-3-O-glucoside equivalents by g of skin fresh weight.

2.8. Total Tannins Quantification

Total tannins were determined by the Folin–Denis method [2]. The assay was performed in a microplate by diluting 5 μL of sample/standard with 240 μL of water, then adding the 20 μL of Folin–Denis reagent and 35 μL of a saturated solution of CO3Na2, and incubating for 30 min at room temperature. The absorbance was measured at 760 nm and the assay was performed in sextuplicate. A calibration curve was prepared using tannic acid ethanolic solution with a concentration range of 0–1.5 mg/mL. The results were expressed in mg of tannic acid equivalent by g of grape skin fresh weight.

2.9. Data Analysis

Multi-way ANOVA was carried out to determine the effects of harvest date and the variety as the response variables (Statistica 12.0 Statsoft). Means were separated using Tukey’s multiple comparison test. Differences between samples obtained at the p ≤ 0.05 level were considered significant.

3. Results

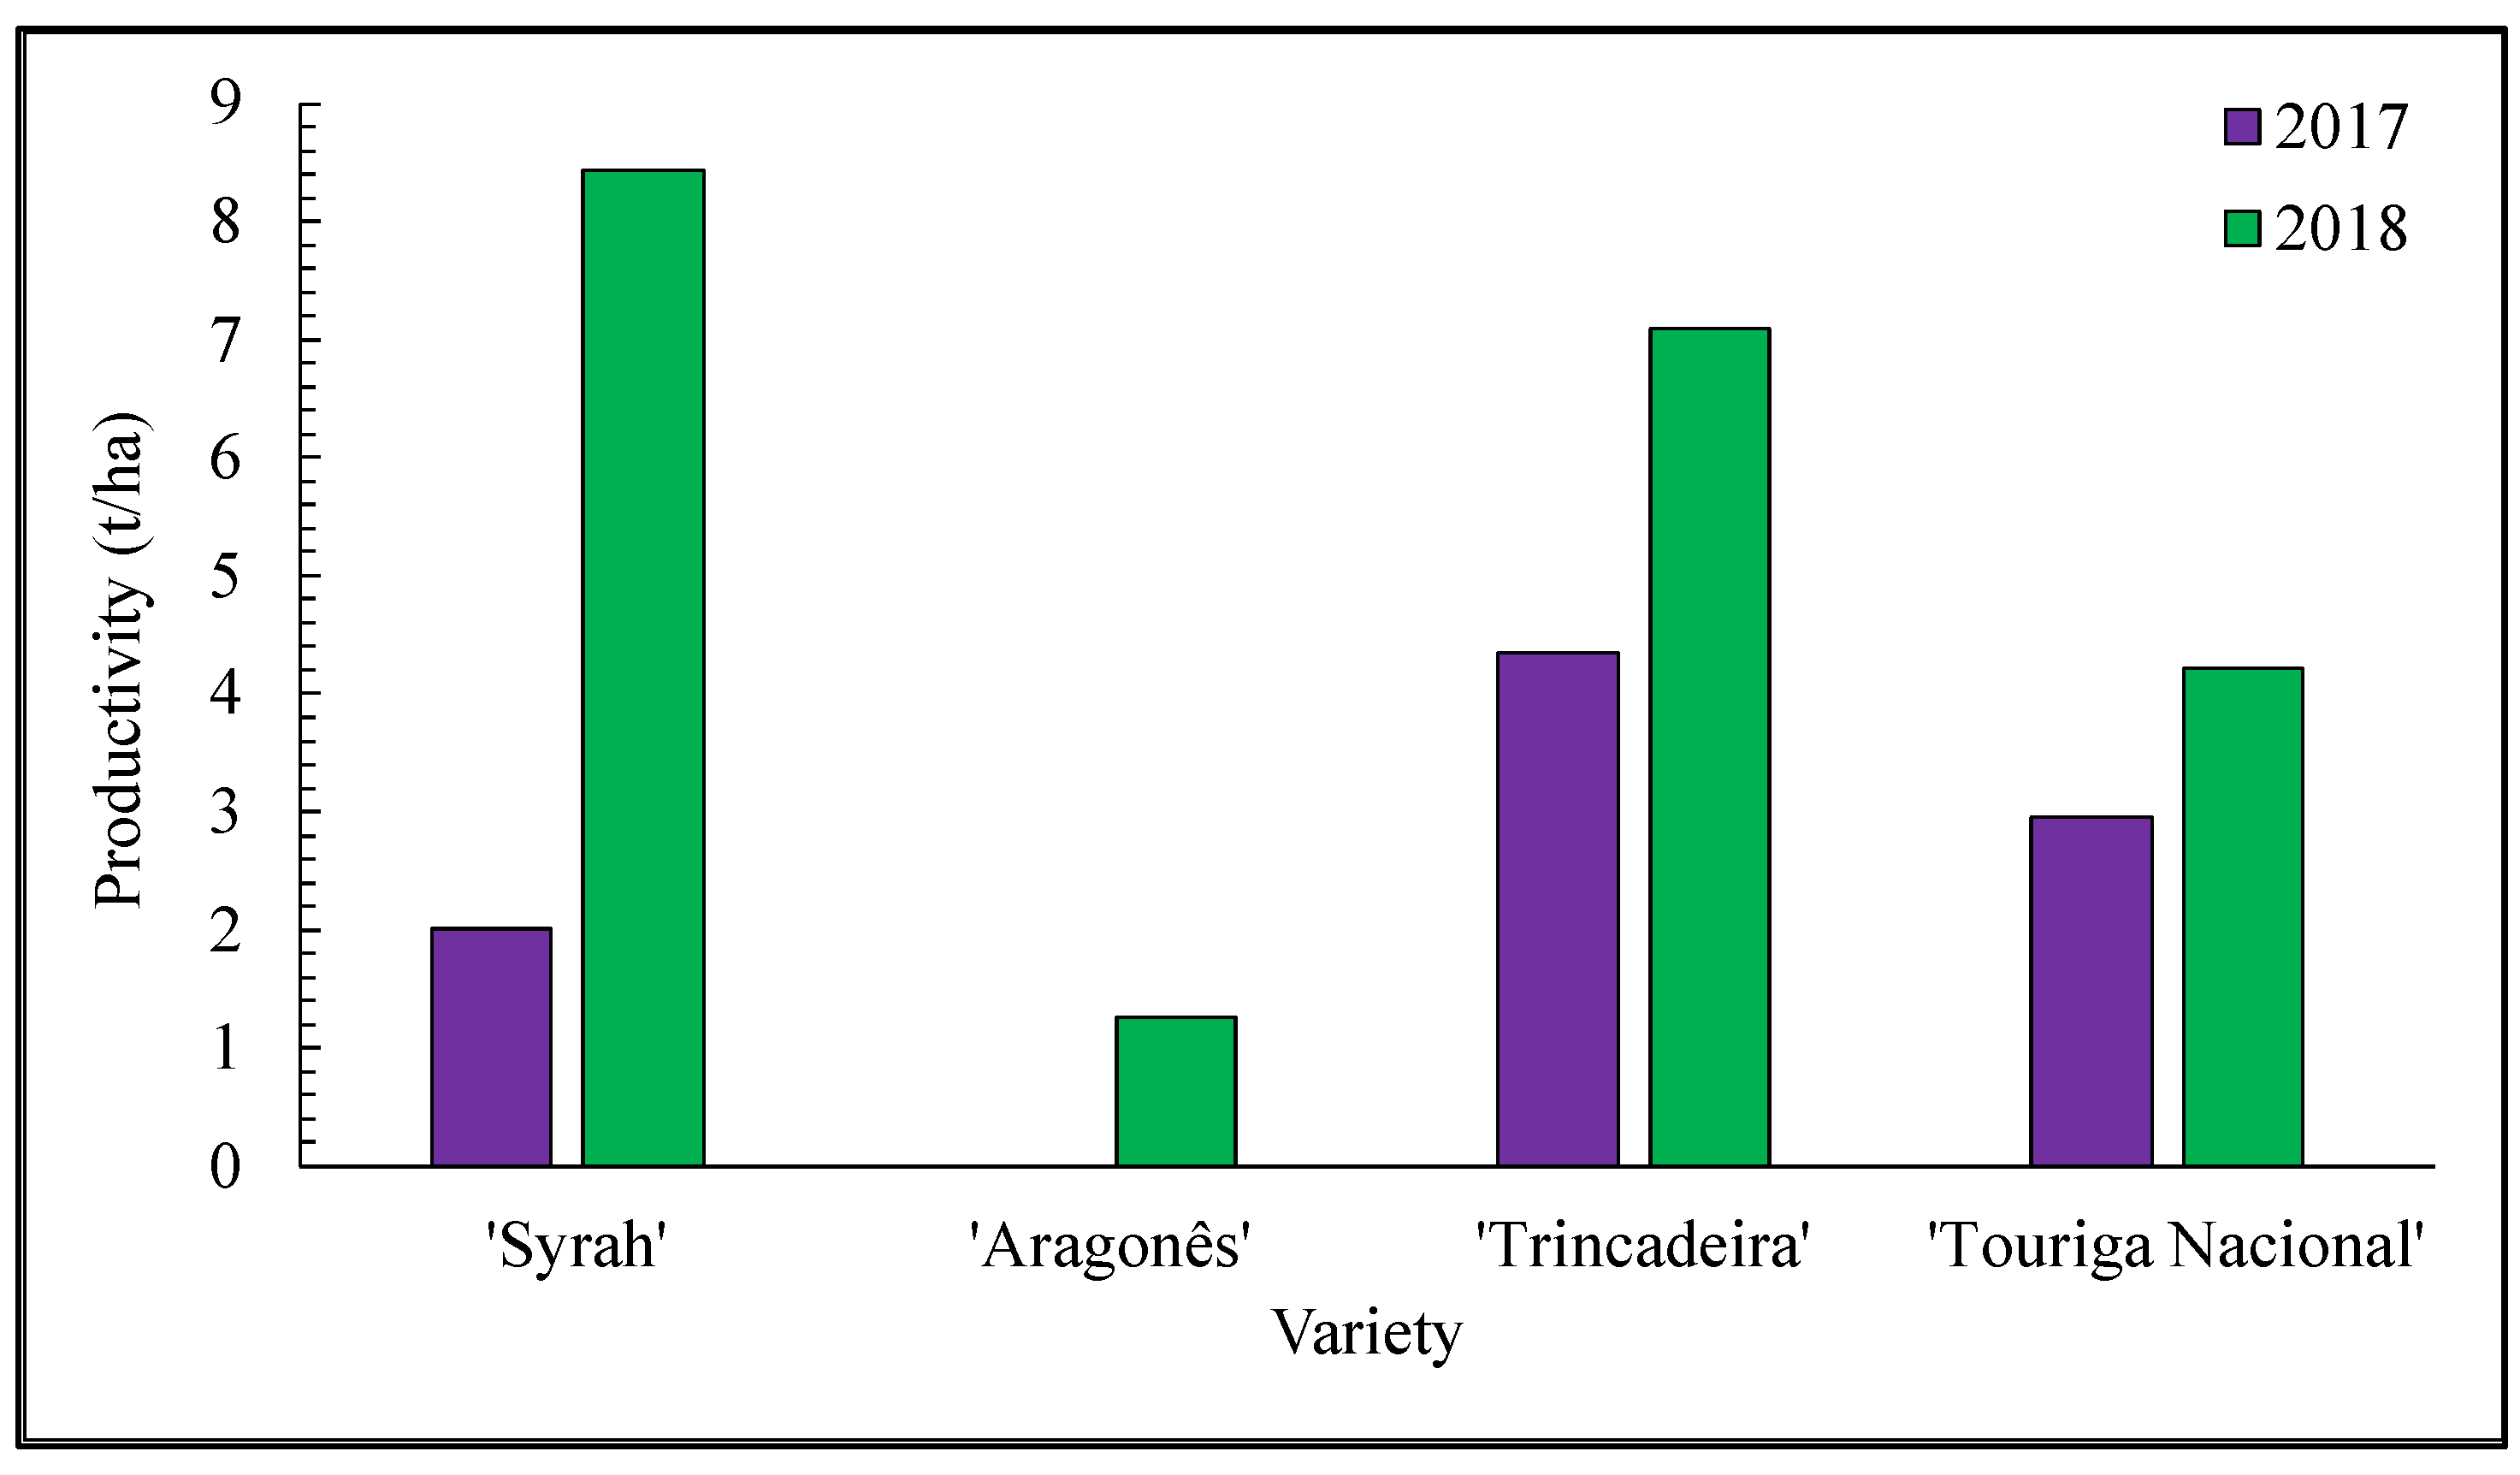
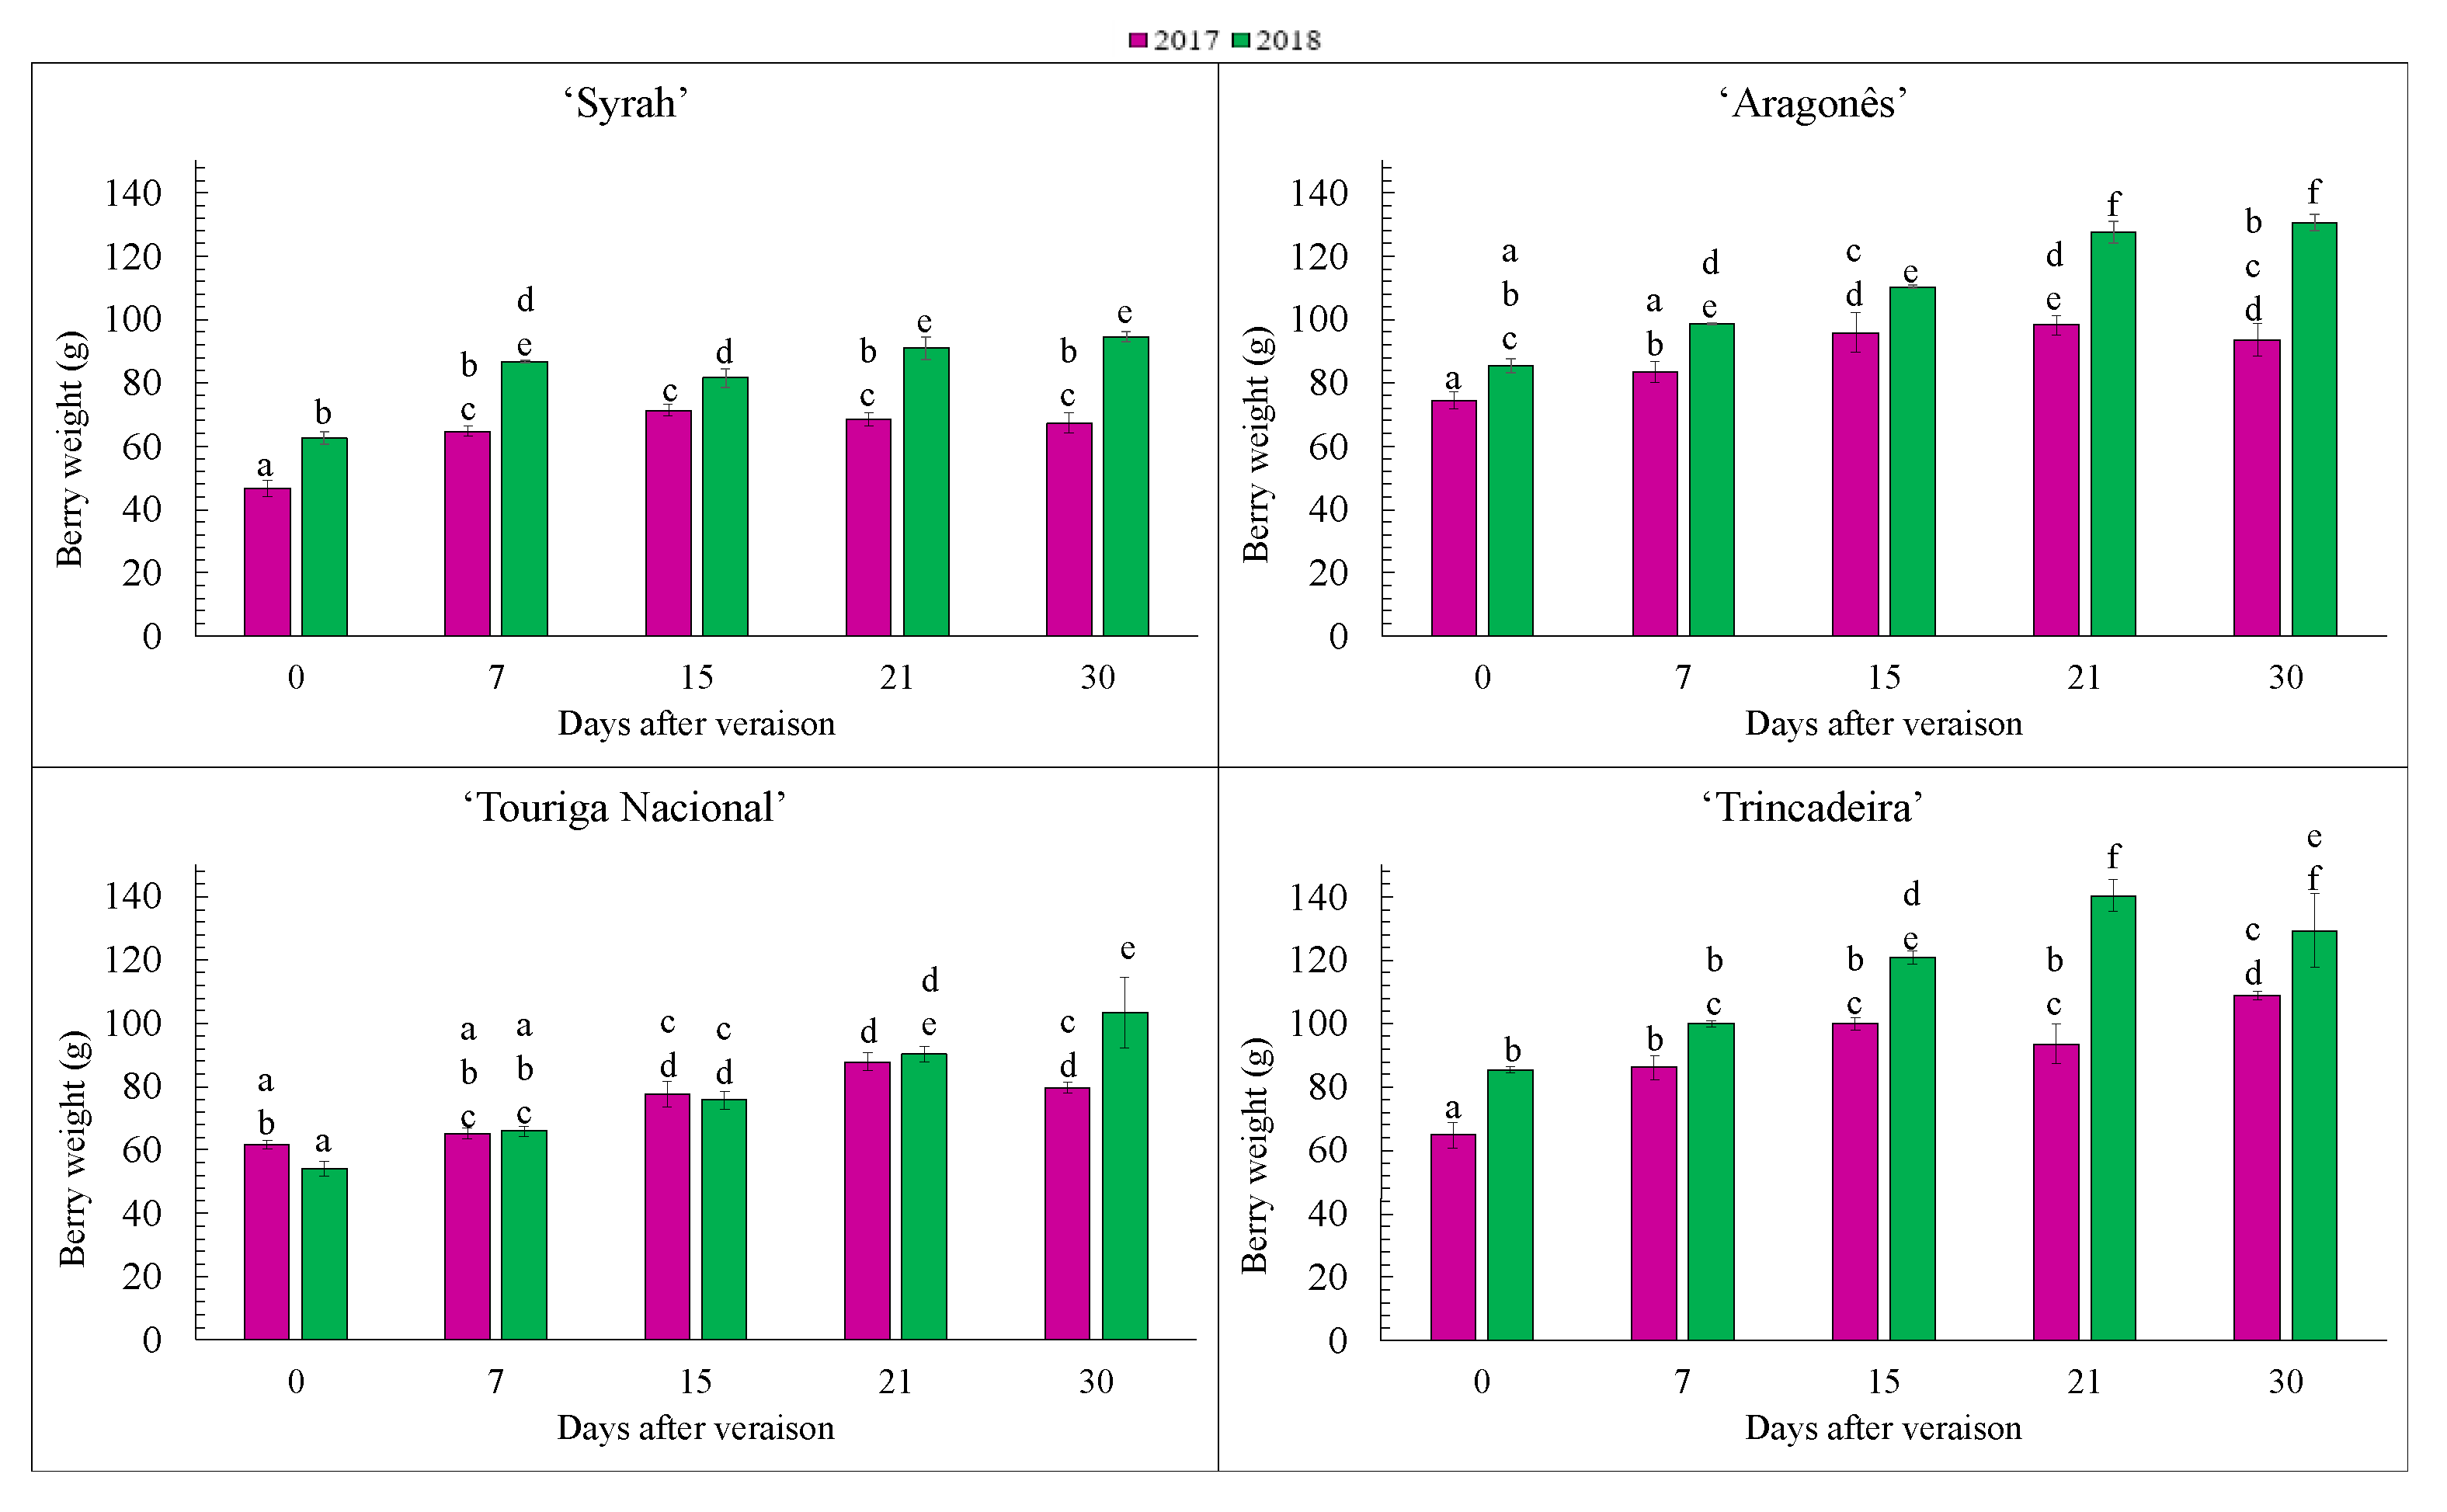
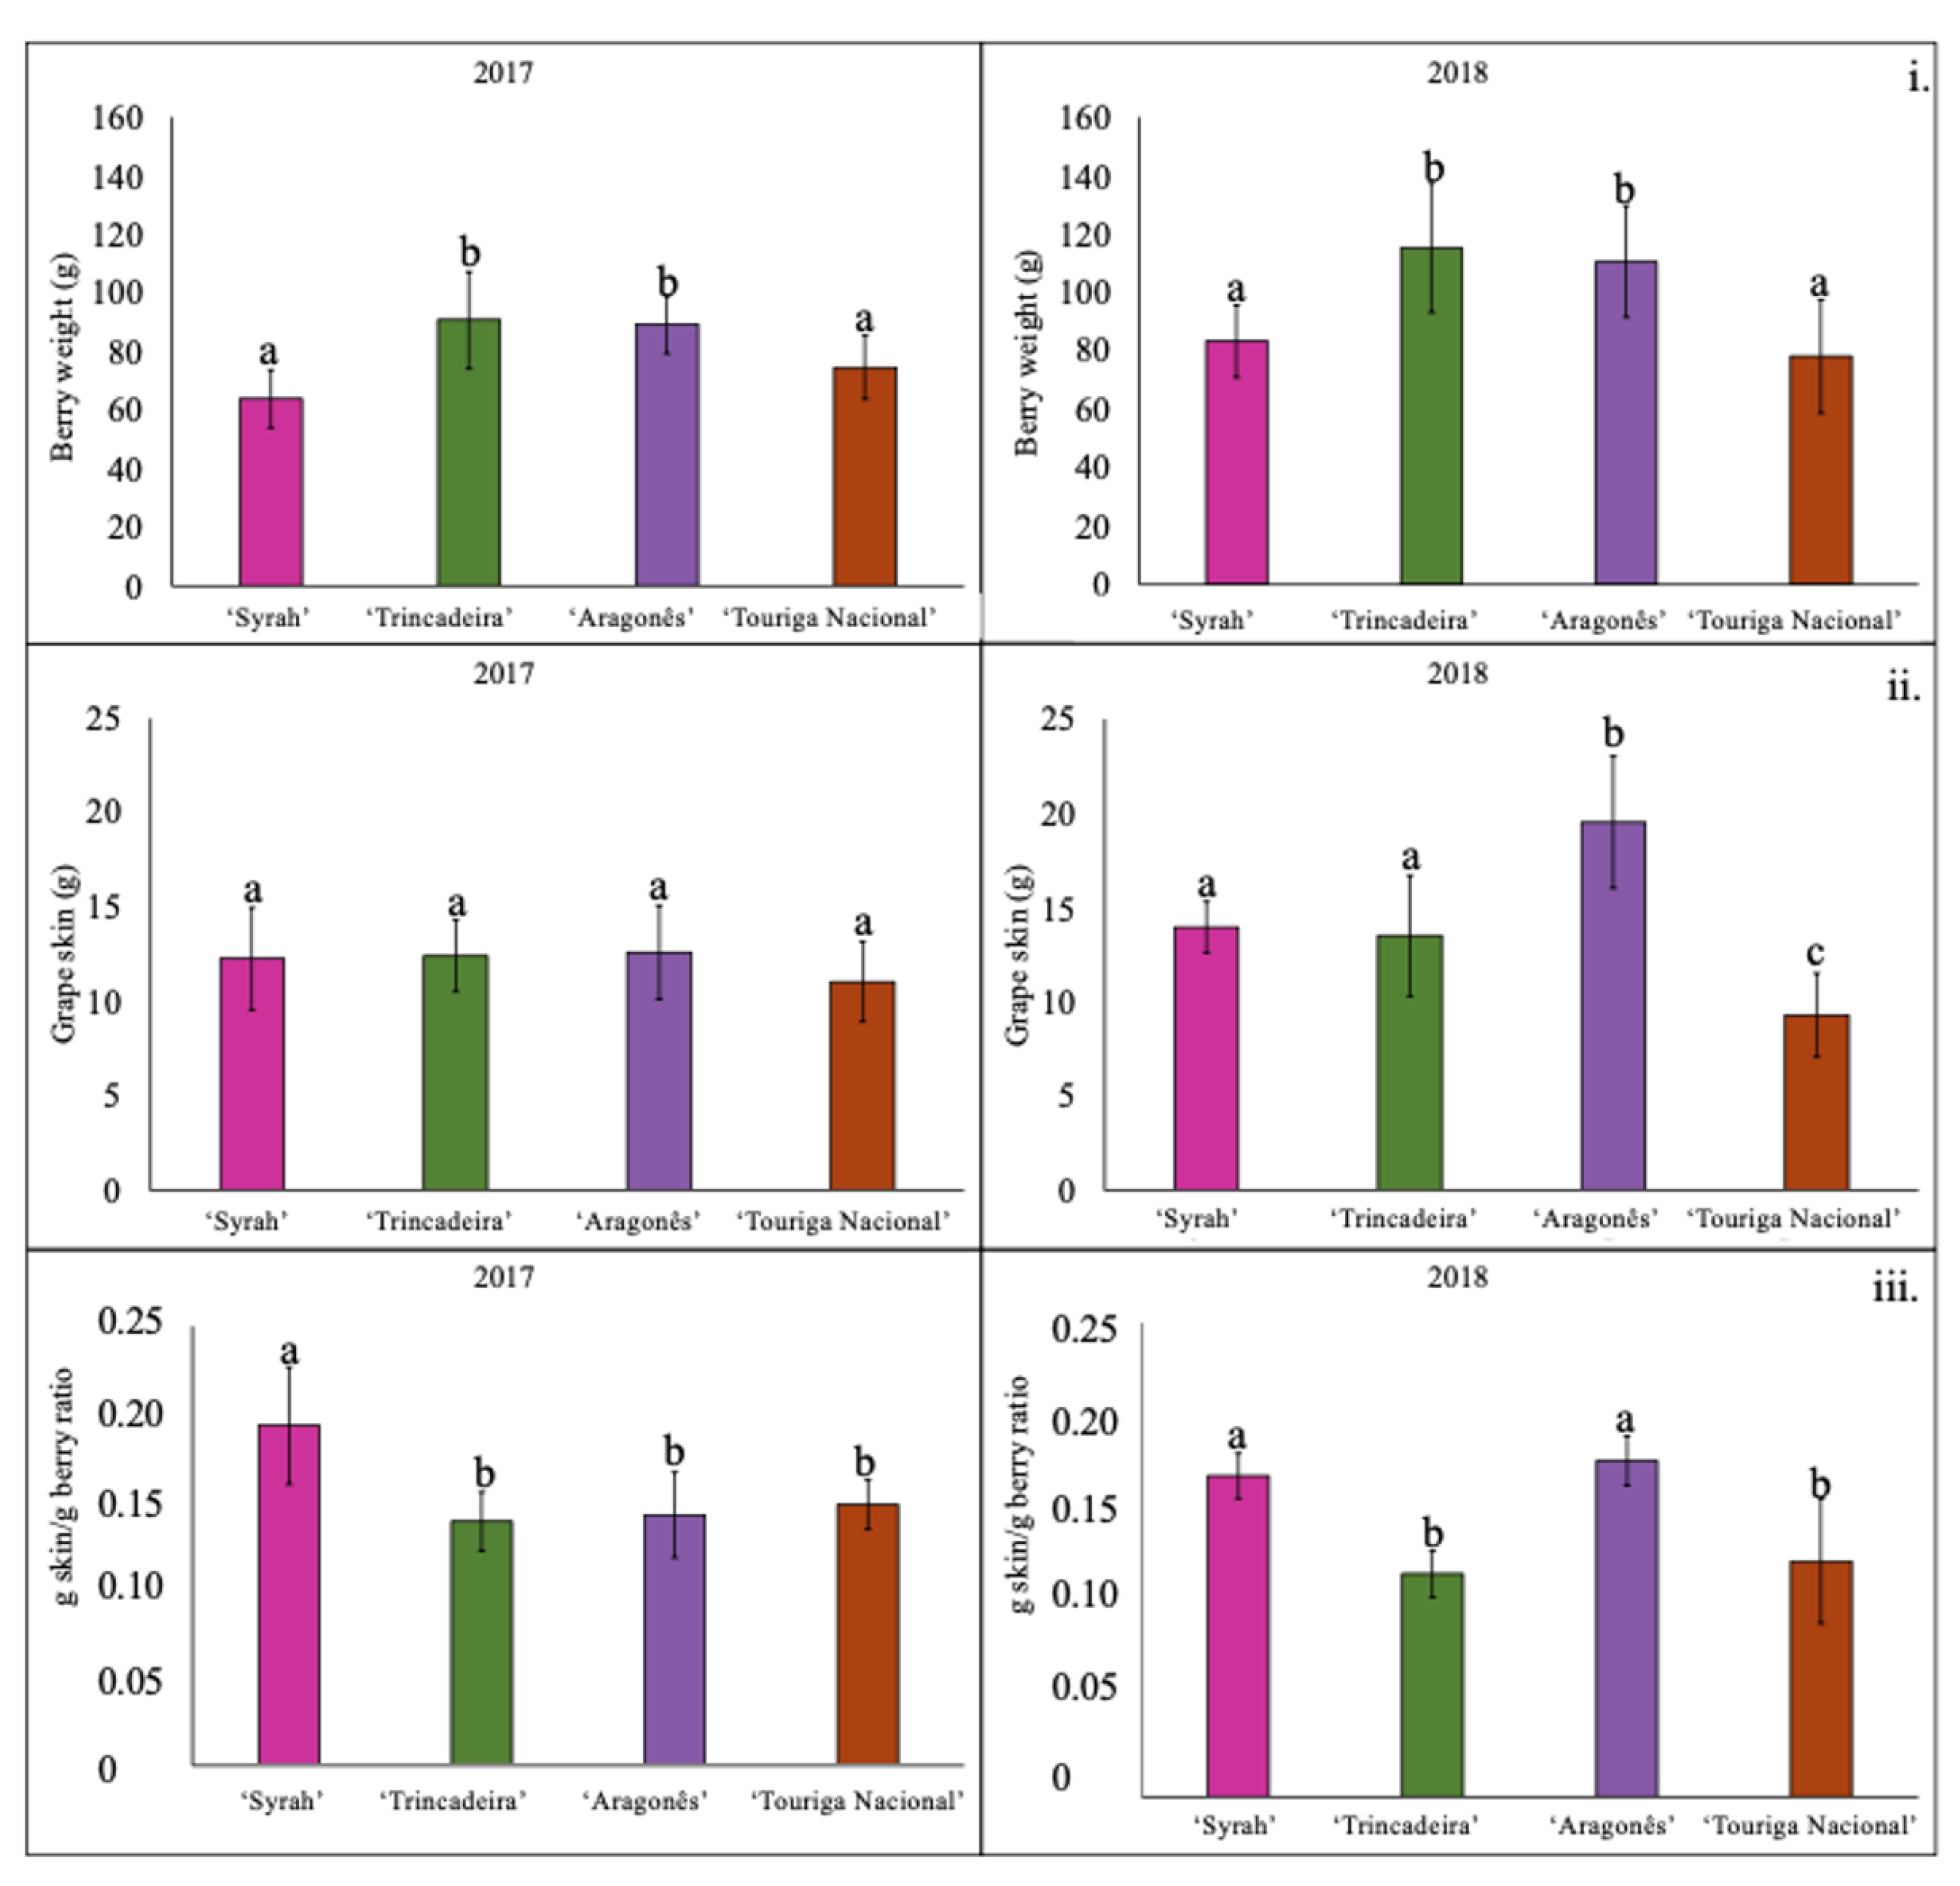
3.1. Influence of Climate in the Quality of Grape Berries

Medium air temperatures and accumulated rainfall can be found in Figure 1. The medium air temperature was stable for the whole year in both years, 2017 and 2018. Despite the nonappearance of significant differences in the average temperature in both years, during the summer months, an extreme weather event happened in 2018 which consisted in an intense temperature increase after a period of mild temperatures. Pluviosity was considerably higher in 2018, especially in March and April.
About two-thirds of the major viticulture areas of the world have annual precipitation below 700 mm [19]. Despite the differences in pluviosity found between 2017 and 2018, the pluviosity in this region in both years was considered normal, and both values are compatible with the pluviosity found in most viticulture areas; the total accumulated rainfall in 2017 was 314 mm and in 2018 was 695 mm. During the first phase of berry development, the pluviosity was 119 in 2017 and 361 in 2018. These differences influenced the soil-water availability in the beginning of spring and consequently had an impact on the initial phase of berry development. The pluviosity between June and September affected the third phase of berry development, and consequently the berry size. The lower pluviosity observed in the third phase of berry growth influenced the last phase of berry development in 2018, becoming more susceptible to higher temperatures and radiation. The negative impact in grape berry quality, caused by a low water availability in the soil, has been referred to by Tramontini [20].
The information about accumulated UV and SW radiation is presented in Table 1. The highest UVA, UVB and short-wave doses were found during the harvest week in 2017, and between the 7th and the 15th days in 2018, which coincided with an extreme episode, and consequently a higher availability of UV radiation that resulted in a higher accumulation of UV radiation during the 7th and the 15th days in 2018. Generally, accumulated UVA, UVB and short-wave radiation doses were higher in 2017 during veraison; however, during the second week of maturation (7th to 15th day of maturation) the UVA, UVB and short-wave radiation were higher in 2018. Besides the regulatory impact on plant growth and development, exposure to high UV radiation can also damage living tissues, causing burning and bleaching in plants and fruits [21]. The higher availability of UVA and UVB radiation has been suggested as the reason for the increase in the level of phenolic compounds in grapes as a response to a specific stress [22]. UV radiation is another climate element with an important impact on the concentration of some key compounds in grapes [23].
The average values of annual grape production were higher in 2018 than in 2017 (Figure 2). Productions in 2017 and 2018 were not repeated, and so any statistical comparisons should be avoided. In 2017, ‘Syrah’ had a production of about 2 tonnes per hectare, while in 2018 the production was 8.4 tonnes per hectare. ‘Aragonês’ had an extremely low production in 2017, as opposed to ‘Trincadeira’, which had the highest production in 2017. Comparing varieties, the high average production of ‘Trincadeira’ in 2017 in a warmer and dryer year is in accordance with the good performance of this variety in water-scarcity conditions. ‘Syrah’ had the highest production in 2018, followed by ‘Trincadeira’, ‘Touriga Nacional’ and ‘Aragonês’, which was the variety with the lowest production in both years.
Drought conditions in 2017 might explain the lower productivity in all grape varieties. In this year, the meteorological drought began in April and lasted until the end of the year [24]. According to Vaz [25], insufficient water can result in loss of yield, and this might explain the lower productivity in 2017. During the 7th and 15th days after veraison in 2018, a period of higher UV radiation occurred that caused sunburn events in some bunches and consequently lowered production. These symptoms were enhanced by the absence of pluviosity observed in June and July in 2018. Some varieties are more sensitive than others to drought conditions. ‘Aragonês’ is a variety sensitive to water scarcity, which might have led to a residual production in 2017. Despite these results suggesting a cause/effect relation to low water availability, ‘Trincadeira’ seems to be the less sensitive variety to higher temperatures and to low water availability. The grape isohydric and anisohydric behaviors might explain the differences found between 2017 and 2018. ‘Trincadeira’ seems to be the most well-adapted variety to extreme climate conditions. Chaves [26] found that ‘Touriga Nacional’, in situations of water stress, has a higher stomatal conductance, indicating that this variety has anisohydric behavior without stomatal closure, continually losing water through transpiration even in stress situations, which shows that this variety is not well-adapted to water stress.
Grape berries’ growth in 2017 and 2018 is indicated in Figure 3. In general, berries were bigger in 2018 in all varieties, probably due to the different weather conditions, including the higher pluviosity in 2018 during the berry set. Among varieties, it is observed that ‘Syrah’ and ‘Touriga Nacional’ are medium- and small-size berry varieties, respectively, and ‘Aragonês’ and ‘Trincadeira’ are large-size berry varieties. The berry weight is also a varietal characteristic; these data are in accordance with the phenotypic characterization of these varieties.
In vineyards, dryer climate conditions lead to lower water accumulation and lower photosynthetic activity, and these conditions result in smaller berries [10]; the same was observed in 2017 for all studied grape varieties. Additionally, berry composition is highly influenced by weather conditions. Dryer years can lead not only to smaller clusters with smaller berries but also to thicker skins. Vaz (2016) refers to ‘Trincadeira’ as being more resilient to water scarcity situations, since its stomatic control (isohydric behavior) is more efficient, and therefore more resistant to severe hydric stress when compared with ‘Aragonês’ [25]. In water scarcity conditions, ‘Aragonês’ loses leaves, resulting in a reduction of canopy area to reduce water loss by transpiration. ‘Trincadeira’ does not lose leaves but remobilizes water from the berries in case of dehydration, resulting in berry shriveling.

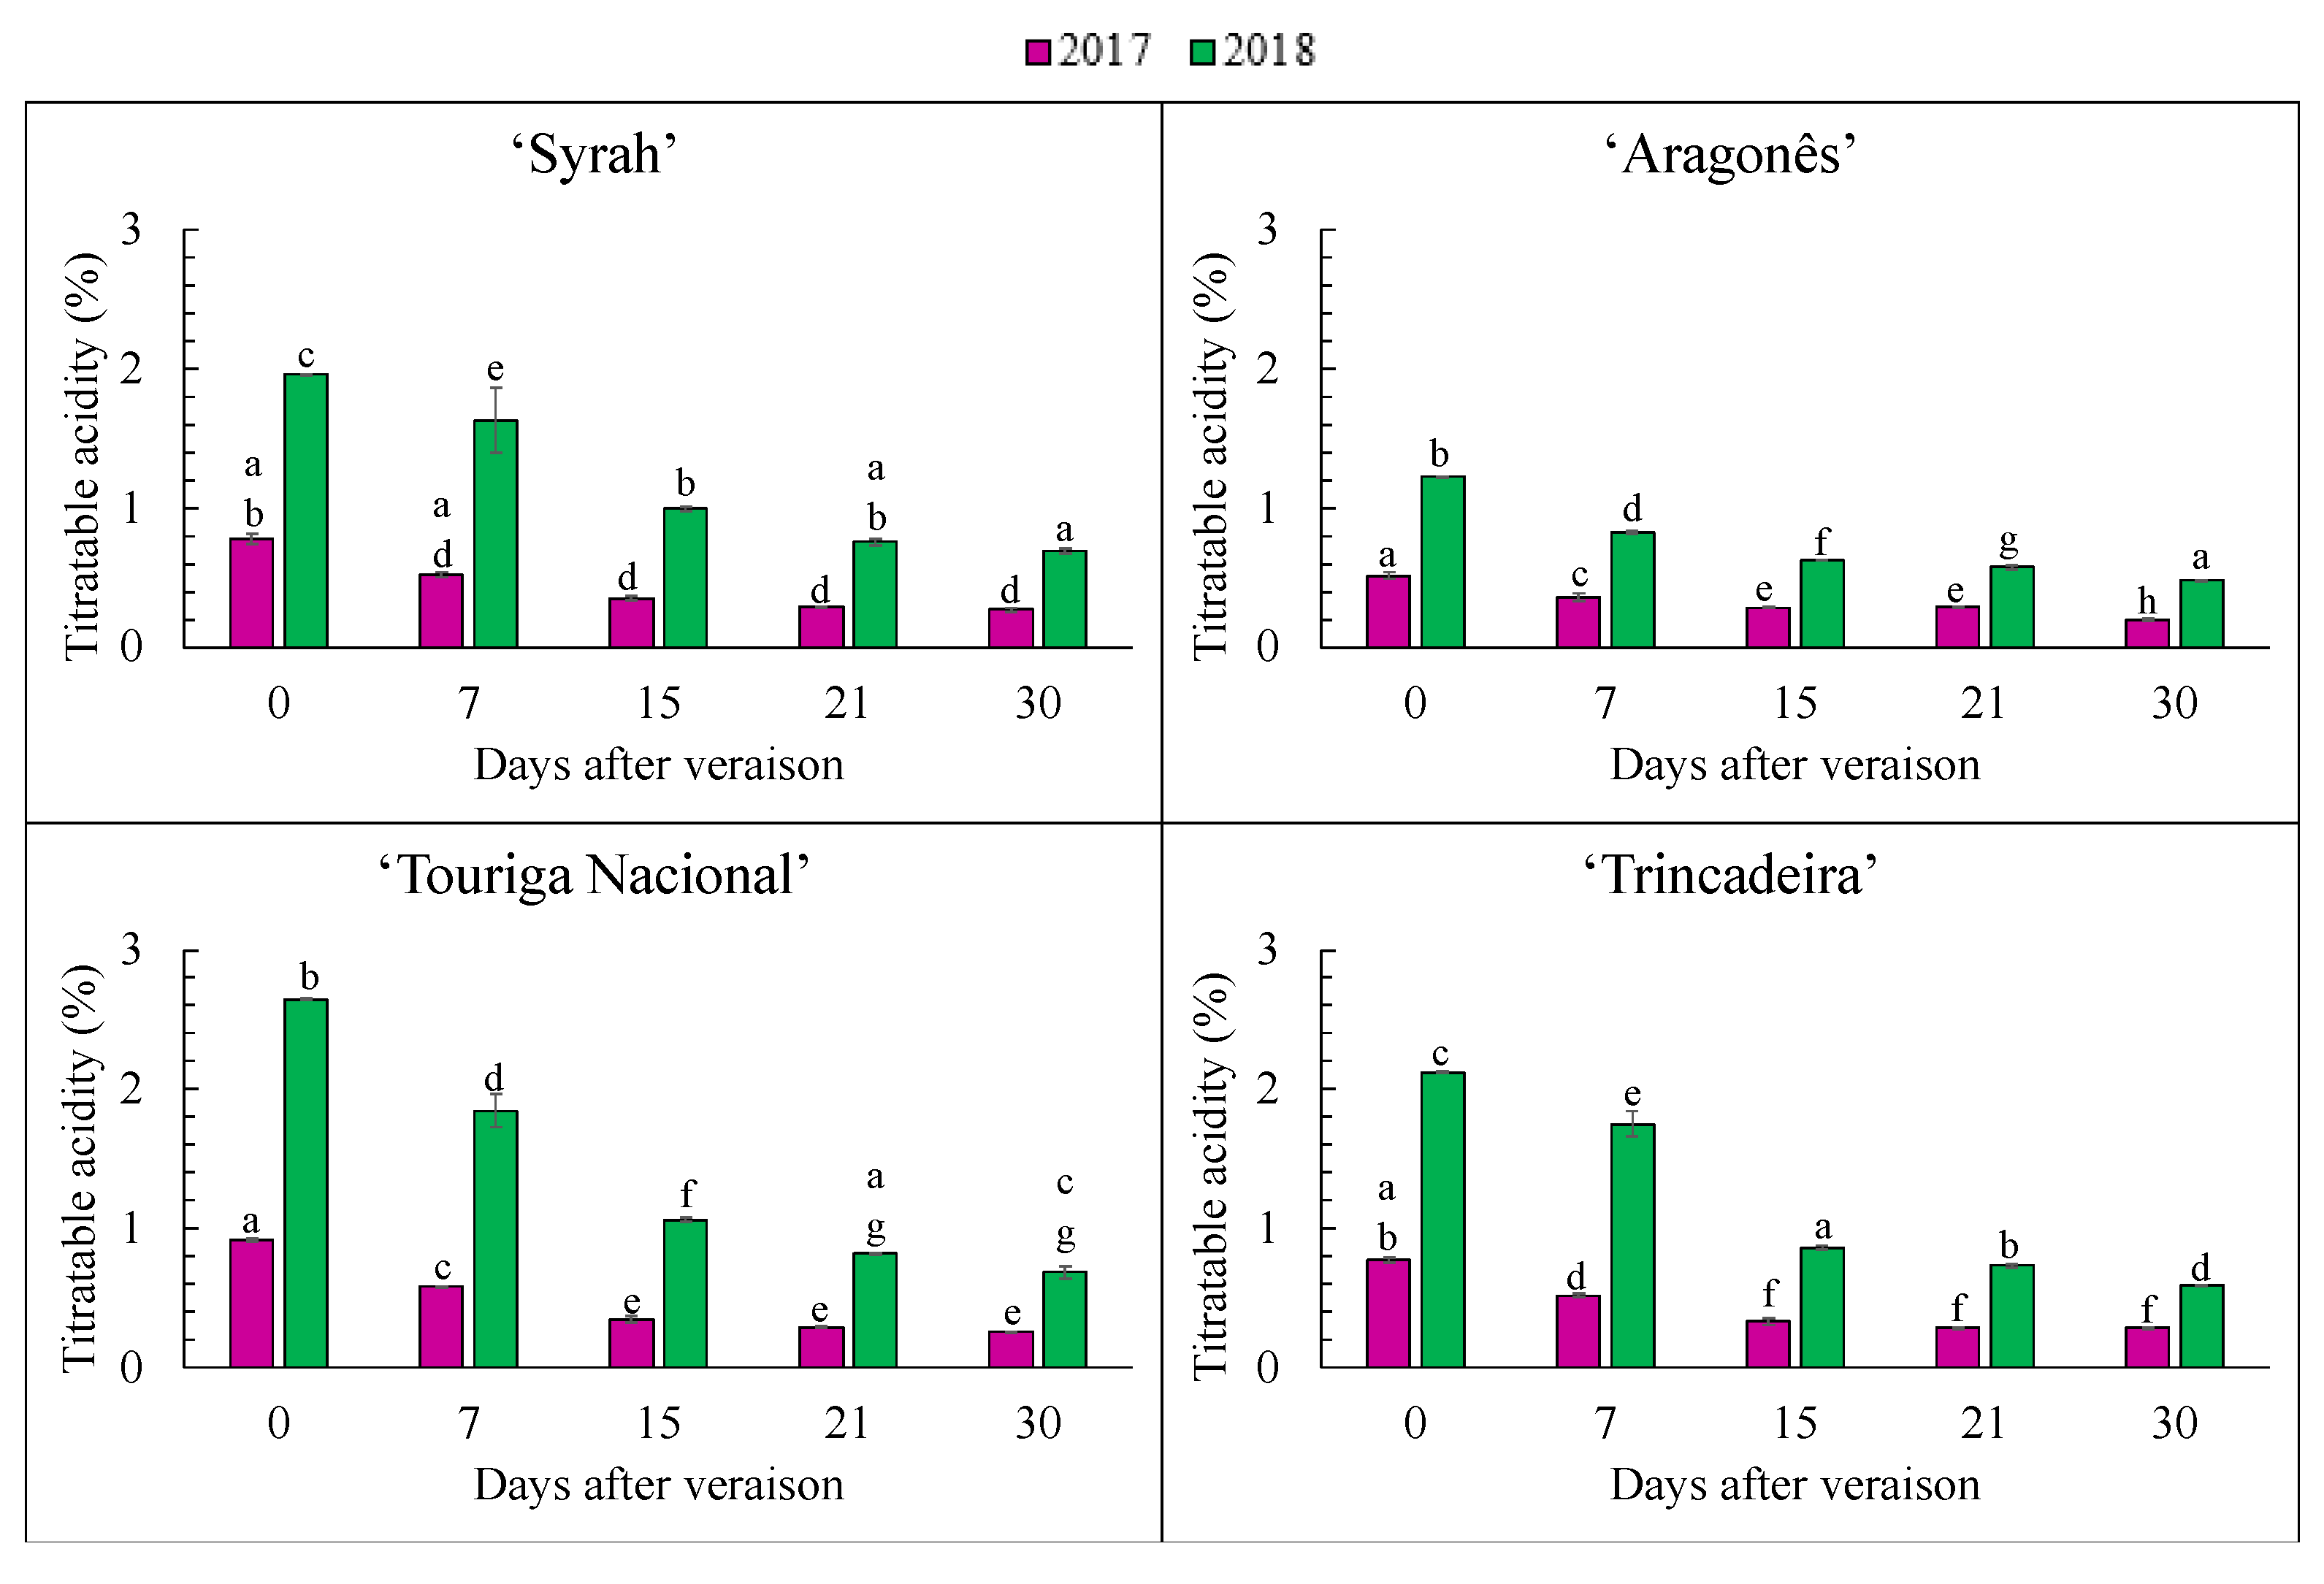
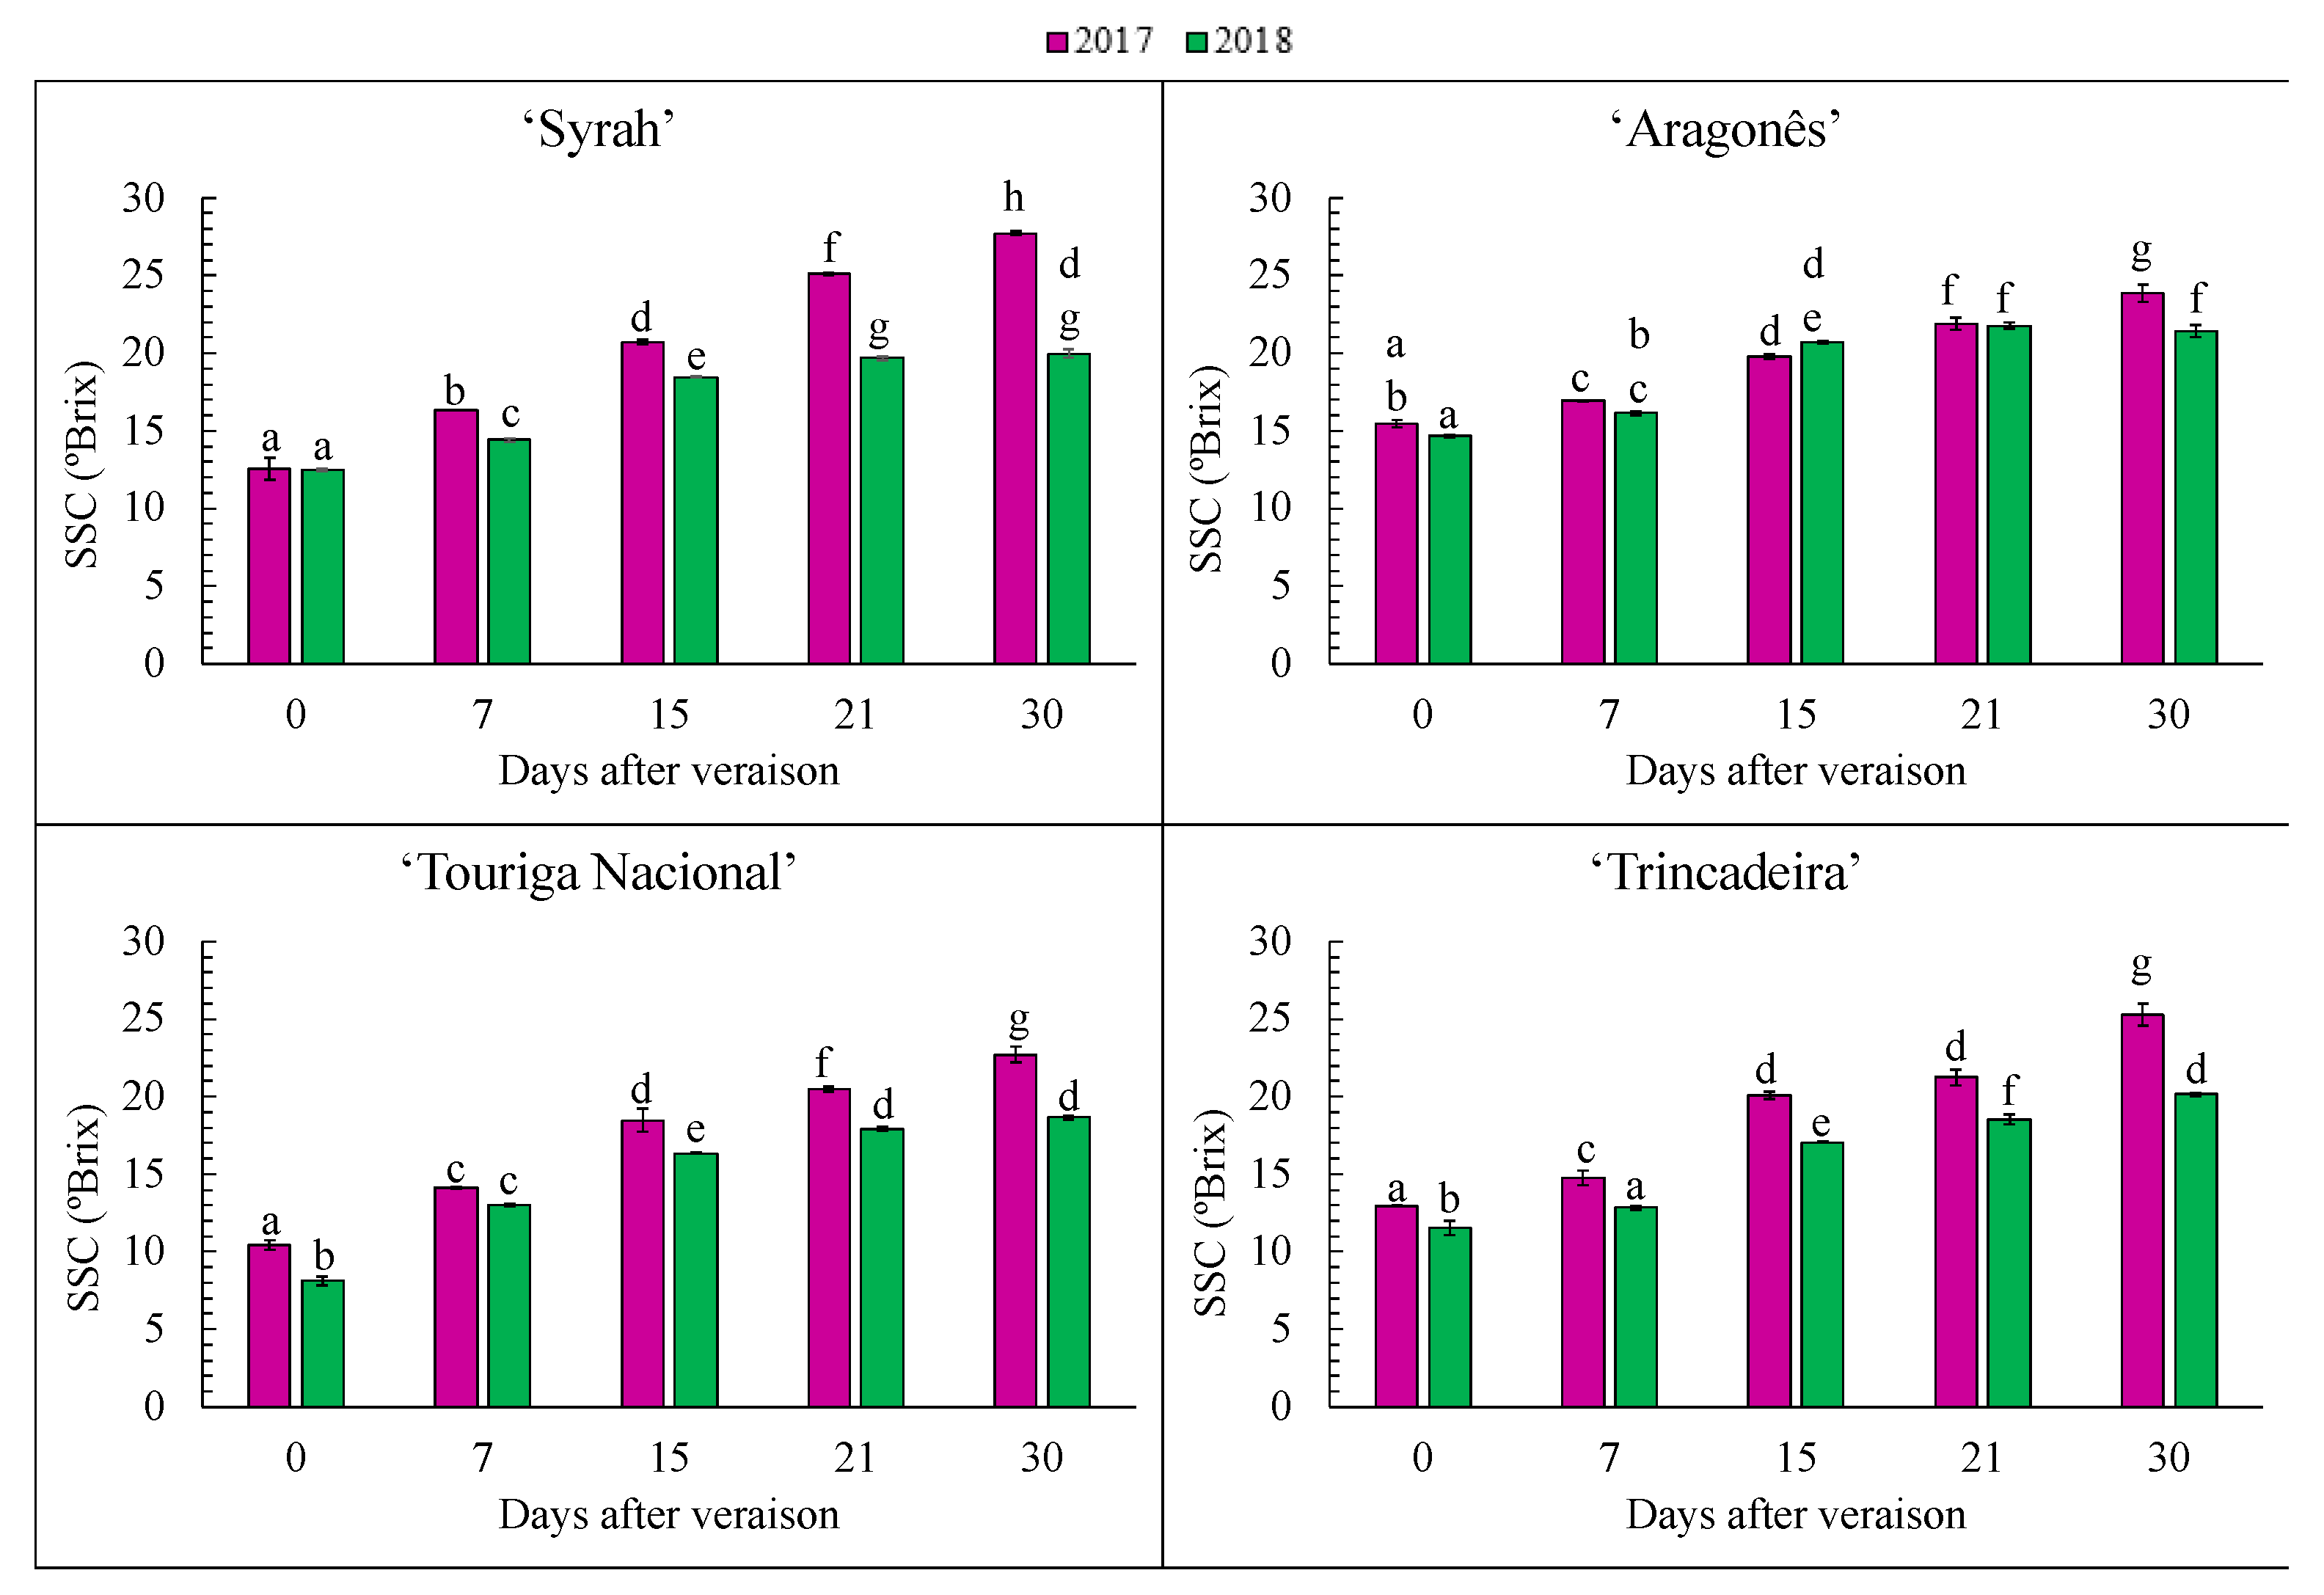
3.2. Evaluation of Acidity and Total Soluble Solids

Titratable acidity (TA) profile during the sampling period in 2017 and 2018 is represented in Figure 4. As expected, acidity decreased during maturation as part of the natural ripening process [3]. In 2018, the overall acidity was higher than in 2017, which is in accordance with the higher temperatures that occurred in 2017 and the higher pluviosity during 2018’s spring months. In fact, the loss of acidity is a consequence of high temperatures during grape ripening due to the respiration of malic acid in berries, contrary to low temperatures, which contribute to acid retention [13].
Considering the acidity profile, all varieties showed a decrease along the maturation period in both years. However, for all varieties, in 2017 the titratable acidity was lower than 2018 from veraison until harvest. In contrast, Jordão [27] observed that in ‘Touriga Nacional’ the water availability did not affect acidity. Higher temperatures have been reported to have a negative impact in TA in many fruit species and in wine grapes [28]. The effect of cold climates on acid maintenance, and consequently its effect on wine quality, has been widely reported [29].
Total soluble solids content (SSC) can be found in Figure 5. SSC content is one of the main indicators of the grapes’ maturation status. In all grape varieties, there was an increase of SSC during veraison. Between years, the SSC in 2017 showed higher values in almost all the time points.
A warmer and dryer year had a considerably positive impact on the accumulation of soluble solids in grape berries [2]. Petrie and Sadras [30] found that growing seasons with higher temperatures resulted in increased rates of sugar accumulation and earlier maturation dates, as was found in 2017. In Tannat grapes, Boido [31] found that grape sugar content increased at sampling times up to harvest, while the titratable acidity decreased during this time with pH values increasing.
The lower production level in all varieties in 2017 justifies a higher SSC. Since sugar content is dependent on leaf area, the effect of severe water stress on the reduction of the flower bud differentiation is widely known in vineyards [32]. In general, lower productivity level is associated with a lower number of grape clusters per vine.
SSC increased during maturation, contrary to TA, which decreased during the same period. The same observations were made by Buttrose [32], who found a marked decrease in acid concentration of grape berries. Independently of the differences between years, both TA and SSC showed expected values when considering the region of Portugal where the trial was located. Similar values were obtained in the south region of Portugal in ‘Touriga Nacional’ and ‘Tempranillo’ by Costa [33].

3.3. Grape Berry Composition
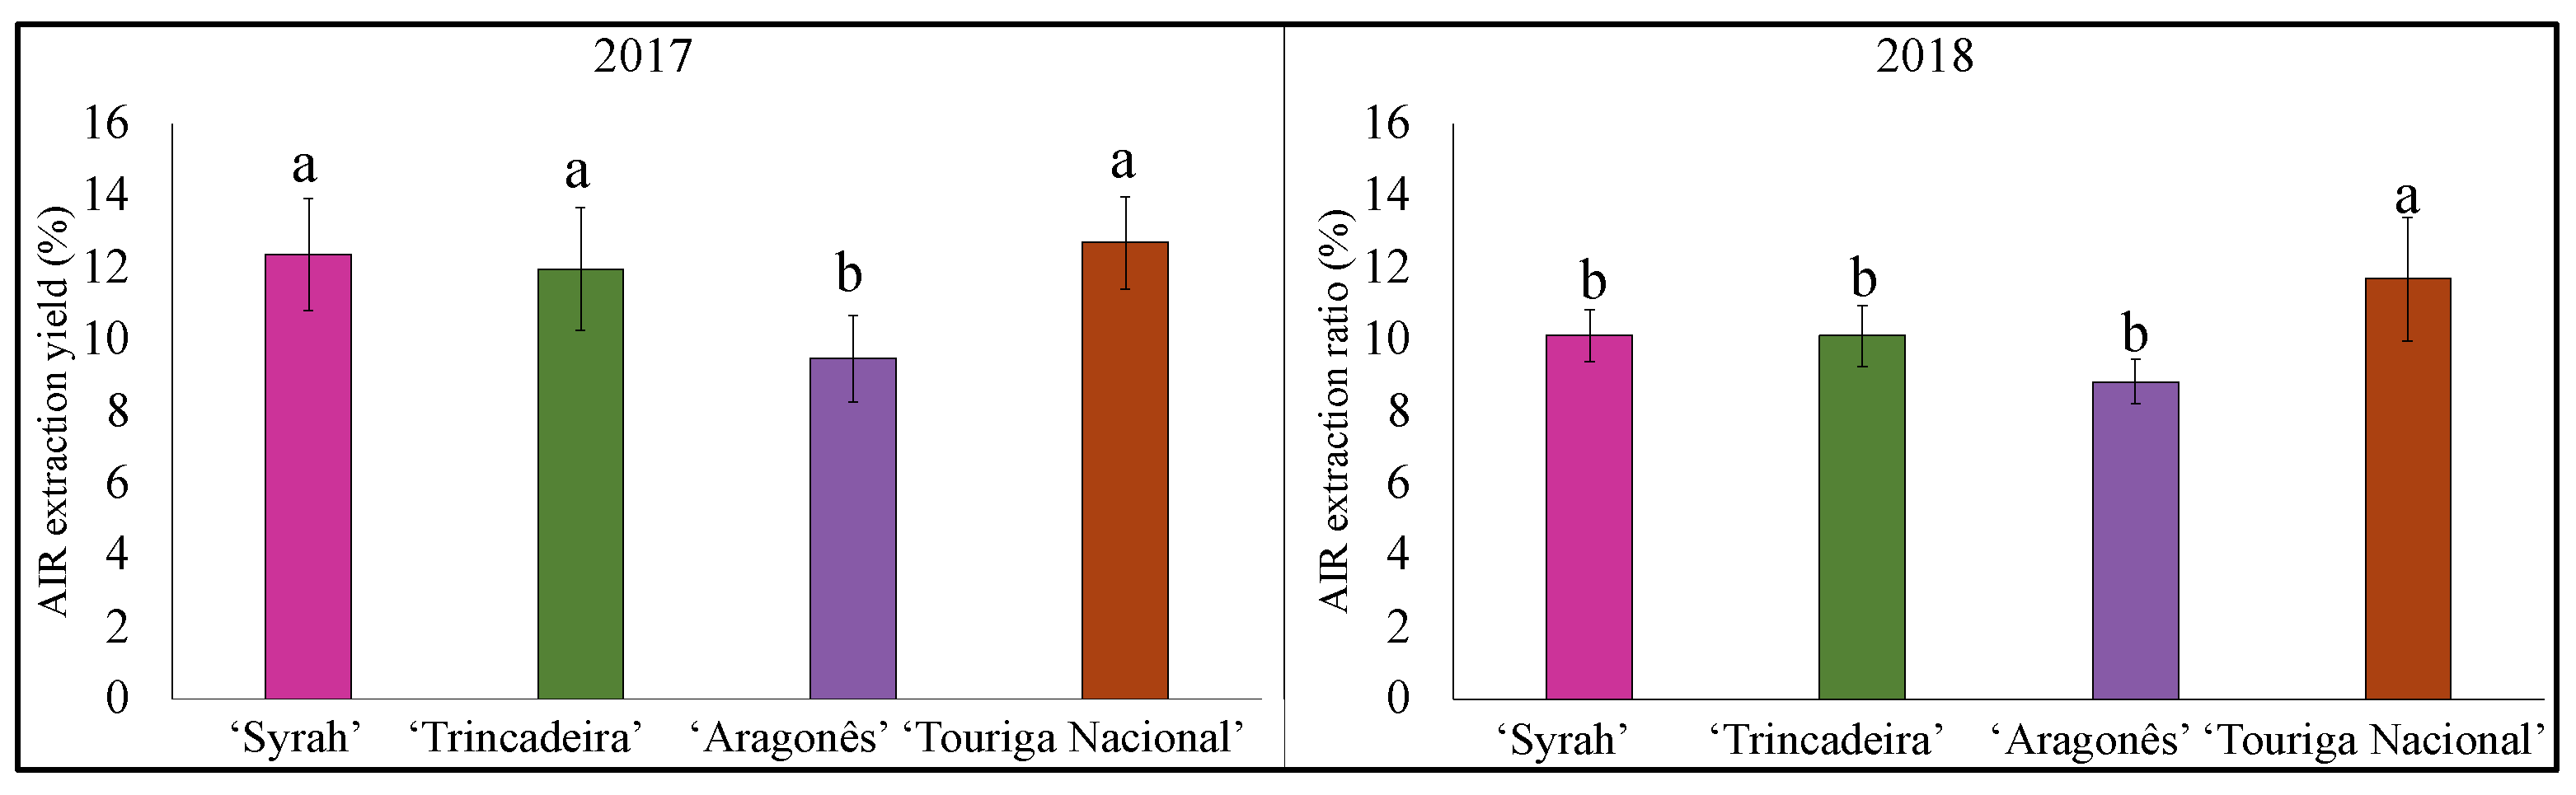
To confirm the traditional assumption that smaller berries have a higher skin-to-berry-weight ratio, berry weight, grape skin and skin/berry weight ratio were compared among varieties in both years separately. These results are presented in Figure 6.
Berry weight showed, in both years, the expected differences between small-sized berry varieties, ‘Touriga Nacional’ and ‘Syrah’, and large-sized berry varieties, ‘Trincadeira’ and ‘Aragonês’. Among varieties, the quantity of grape skin did not change significantly in 2017; however, in 2018, ‘Aragonês’ was the variety with the highest quantity of skin and ‘Touriga Nacional’ the variety with the lowest value (p < 0.05). These observations are in accordance with the fact that this variety is characterized by its small berries with thick skins [34].
Comparing grape varieties, in 2017, the skin-to-berry weight ratio showed the highest value in ‘Syrah’ and in 2018, ‘Syrah’ and ‘Aragonês’ showed higher values for skin-to-berry-weight ratio (p < 0.05). The higher value of this ratio in ‘Aragonês’ in 2018 may indicate that, in water availability conditions, this variety synthetizes both skin and pulp, but the skin synthesis is at a higher rate than the pulp. These findings do not confirm the general assumption that the increase in berry size will reduce the skin-to-pulp-weight ratio. In 2017, ‘Syrah’ showed the higher value of skin-to-berry-weight ratio and the lower value for berry weight. These relations may indicate that ‘Syrah’, which is a variety with medium-sized berries, have a high skin percentage, and this percentage may increase in smaller berries. However, the water availability during spring and the less extreme weather conditions in 2018 appeared to had an impact on grape development in ‘Syrah’, resulting in bigger berries with a lower skin-to-berry-weight ratio. These observations are in accordance with the general idea that water deficit may result in berries with more skin tissue relative to whole berry fresh mass. Changes in these proportions justifies the higher concentration of phenolic compounds in the musts from smaller berries. Additionally, Paladines-Paladines-Quezada [9] found that skin weight is positively correlated with berry weight but negatively correlated with skin percentage due to the variation of the volume/surface ratio, and that these differences can be attributed to different climate conditions. Berry composition is affected by stress, including the stress caused by excessive heat, which is considered an adaptive response. In this situation, there is, in grape skin, a significant increase in lignin biosynthesis, conferring additional strength and protection to the berry [35]. The skin thickness increase observed in 2017 can be explained by the extreme weather conditions that might have led to a higher biosynthesis of lignin in grape skin. In fact, the dilution effect in grape berry skins due to the irrigation of vineyards, and to the increase of berry volume, is a much-debated subject which has not been clarified yet.

3.4. Skin Cell Wall

AIR (Alcohol-Insoluble Residue) corresponds to the polysaccharide fraction present in the cells after the removal of all the cytosolic content, which correspond to the cell wall material. The AIR percentage in grape skins was used as a first approach to understand the evolution of total skin polysaccharides in all varieties in both years of this study (Figure 7). The percentage of AIR extractability varied between 8 and 16%. These results are in accordance with the work of Apolinar-Valiente [36] in Vitis vinifera intra-specific hybrids, in which = extractability percentages of AIR were found to vary between 12.9 and 21.2%. Comparing both years, the AIR extraction yield was higher in 2017, which might indicate that the lack of water could lead to thicker skins or skins with less water inside the cell’s vacuole and consequently a higher AIR percentage. In 2018, the berries were bigger, with a higher content of skin fresh weight but a lower AIR extraction yield. This may indicate that, between years, the skins in 2018 had a higher water content, and in 2017 there were more skin cell walls but with less cytosolic content. The water restrictions that occurred in 2017 imposed limits on grape development, which may have influenced the AIR % extractability [36].
‘Syrah’ is a variety with medium-sized berries, but showed, in 2017, a high percentage of AIR, which is in accordance with the high skin weight observed in this variety. Additionally, skin weight is directly related to a high cell wall synthesis and thus a high AIR content. Conversely, ‘Aragonês’, which is a variety with large-sized berries, showed a low AIR extraction yield in both years; however, berries from 2017 were much smaller (p < 0.05). In 2018, this variety showed a higher value of skin tissue relative to whole berry fresh mass, with larger berries, which might indicate a higher accumulation of water in skin cell walls in 2018, considering that the amount of skin cell walls did not change in both years.
‘Aragonês’ is a more sensitive variety to weather variations according to its anisohydric behavior. Lower plant water potentials are attained in water deficit conditions in anisohydric varieties [26]. Additionally, berries can suffer from berry shriveling under certain stress conditions, which attest to the high capacity of ‘Aragonês’ to regulate plant water status [10].
‘Touriga Nacional’, despite its thinner skins and smaller berries, showed the highest AIR yield of all studied varieties (p < 0.05). A high skin-cell-wall content, combined with a thinner skin, might indicate a higher number of cells with thicker walls in ‘Touriga Nacional’. “Trincadeira” is also considered a variety with large berries and thinner skins, resulting in a lower skin/berry ratio, with an AIR yield similar to ‘Syrah’ in both years.

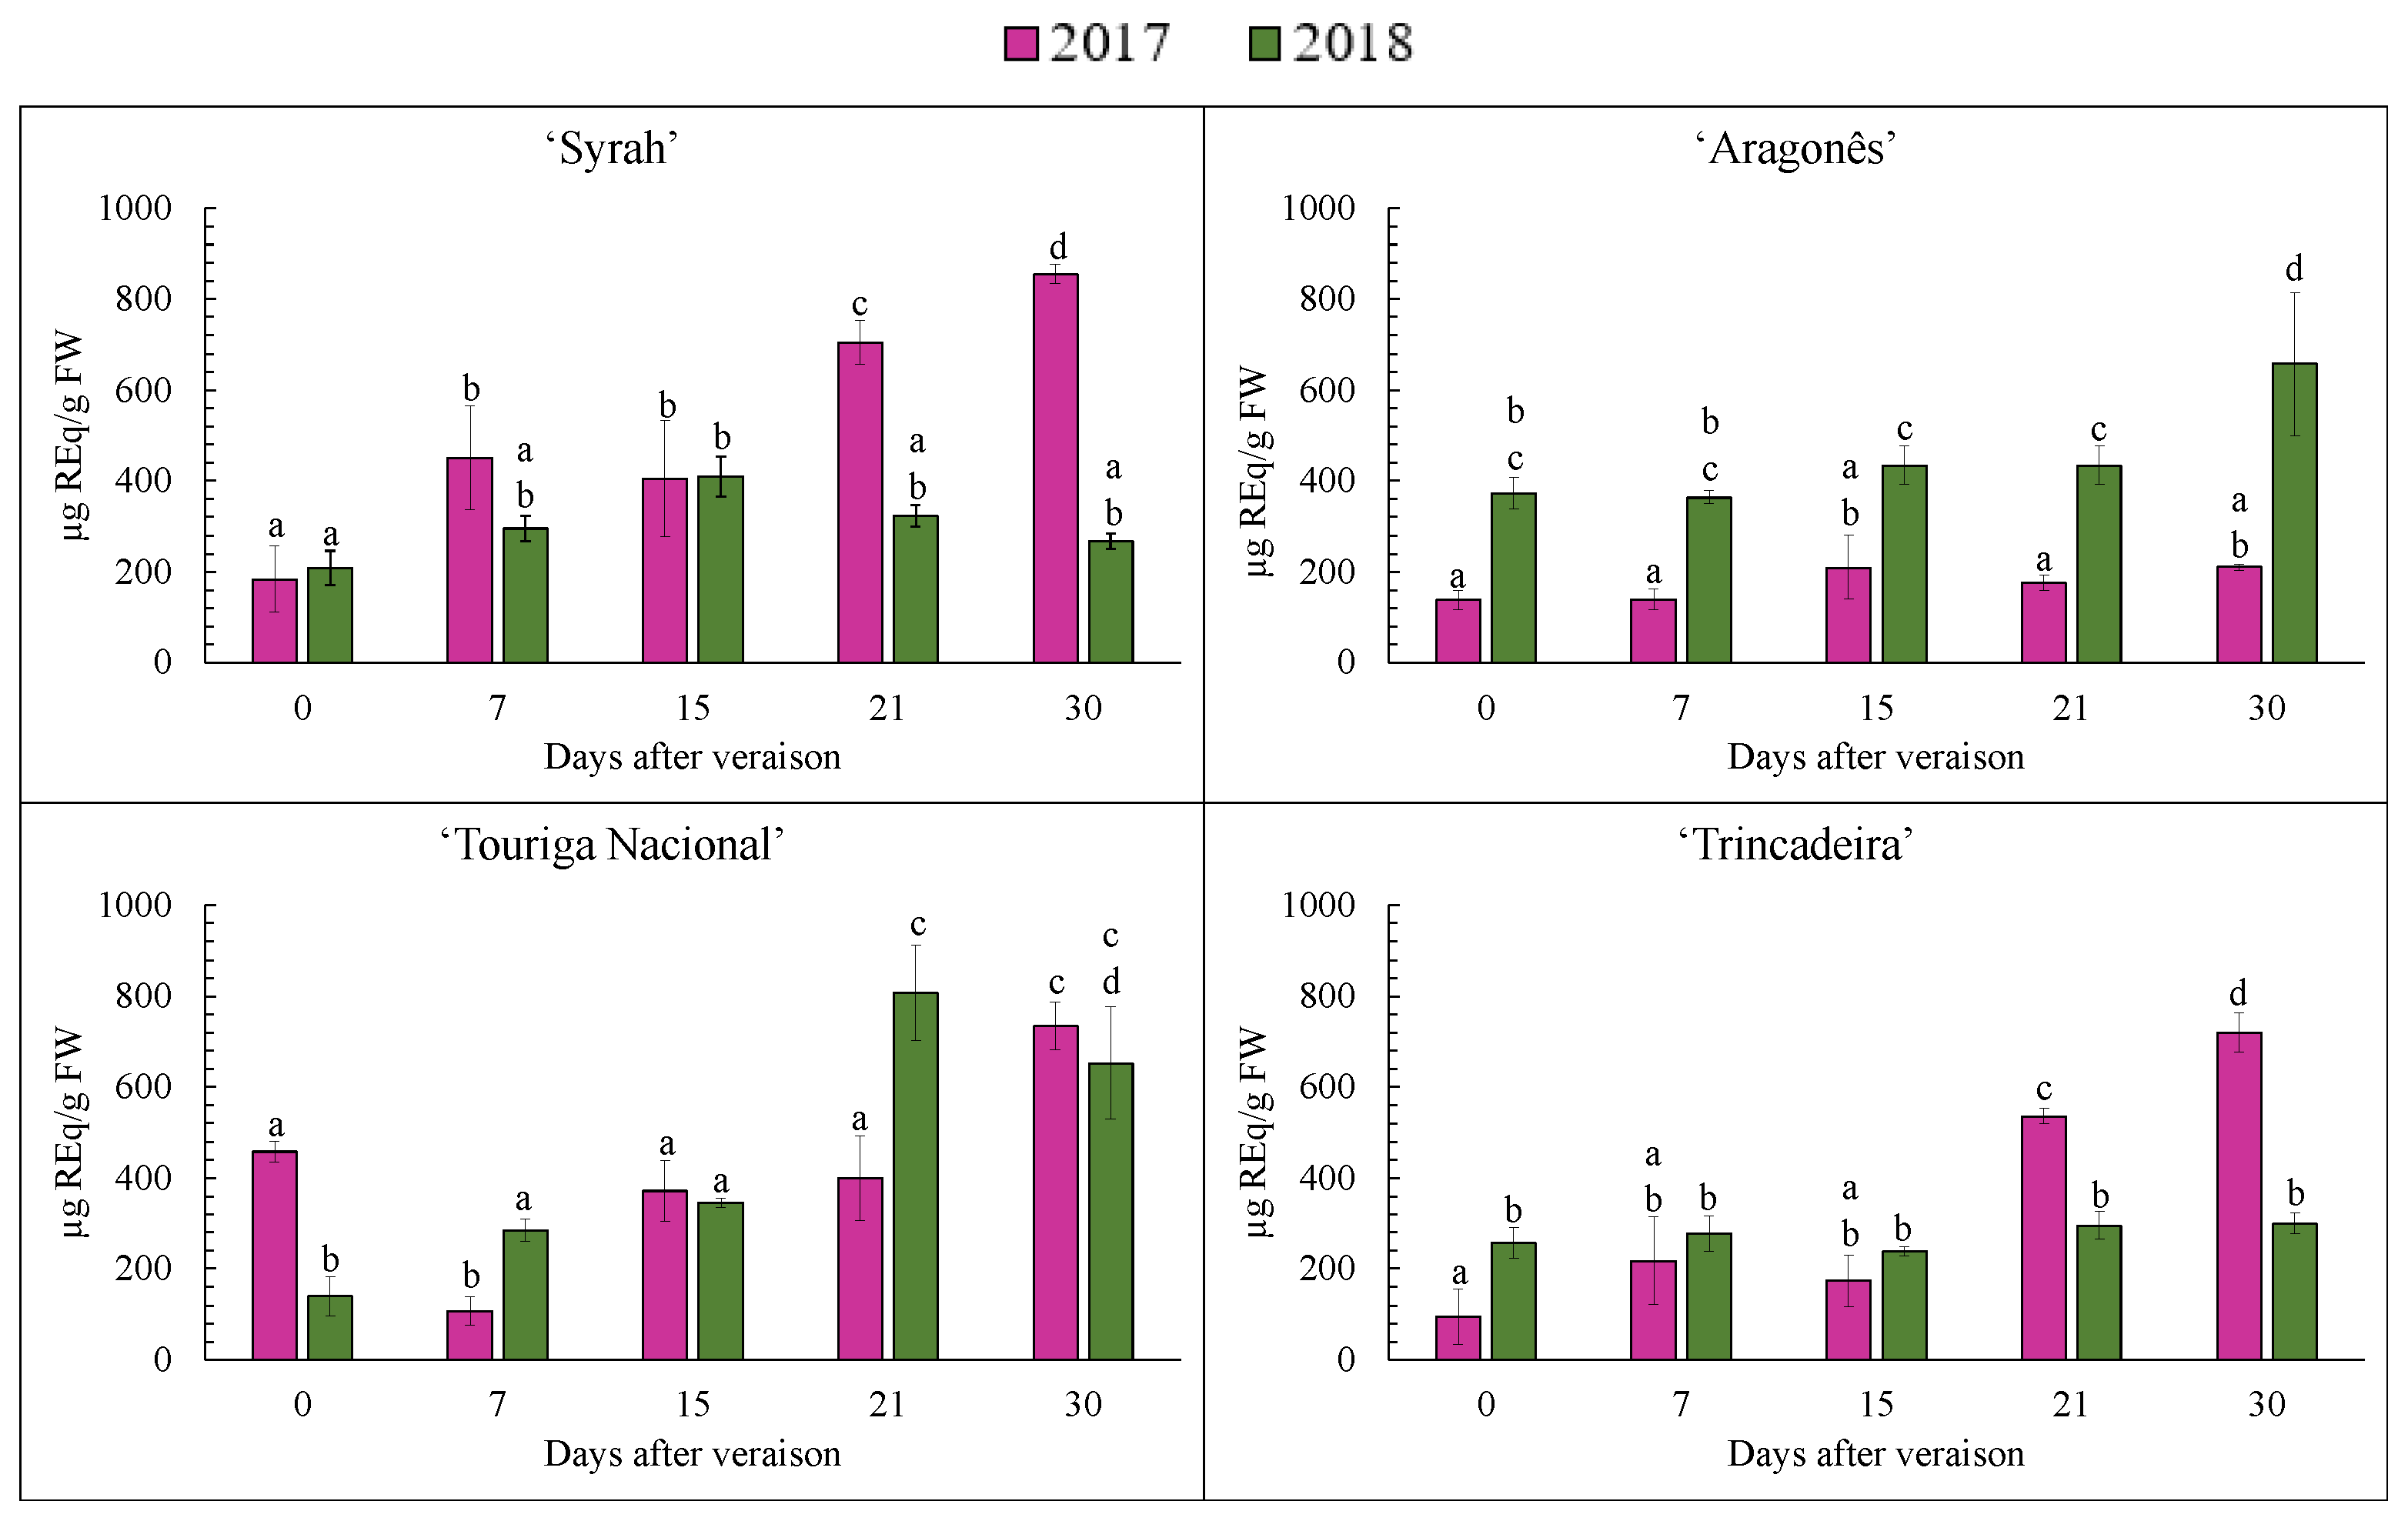
3.5. Total Phenolic Content

The evolution of total phenolic compounds in grape skin during maturation is represented in Figure 8. Despite the differences, the average total phenolic content was similar in both years for each variety, with no statistically significant differences between them (p > 0.05). ‘Touriga Nacional’ was the variety that presented higher phenolic content during veraison, compared to ‘Aragonês’ and ‘Trincadeira’ (p < 0.05) and to ‘Syrah’ (p > 0.05). ‘Trincadeira’ was the variety that showed the lowest phenolic content of the varieties studied, but significant differences were not observed when comparing ‘Syrah’ and ‘Aragonês’ (p > 0.05).
Phenolic content is affected by many factors, including the variety, year of production, geographic origin of grapes, the chemistry of soil, and degree of maturation [3]. Silva and Queiroz [37] studied different red wine grape varieties in the Dão region and also found that ‘Touriga Nacional’ (among others) was the variety with the higher phenolic composition, with a higher amount of non-colored phenolics, anthocyanins and phenolic acids. Although the total phenolic content was high for ‘Touriga Nacional’ and ‘Syrah’, there were no statistically significant differences between years (p > 0.05). Garrido [38] found that tinning has a higher impact on the phenolic content than water deficit/stress, which might explain why the differences on pluviosity did not impact the phenolic content. Younis [39] studied how UV radiation impacts total phenolic content using the Folin–Ciocalteau method, and his results also showed that higher radiation did not have an impact on the total phenolic content. In this work, despite the UV radiation being higher in 2017, it also did not seem to influence the total phenolic content in most studied varieties since no differences were found. The variation of the phenolic content in the same variations in different locations can be explained by the different terroir found in each region [4].

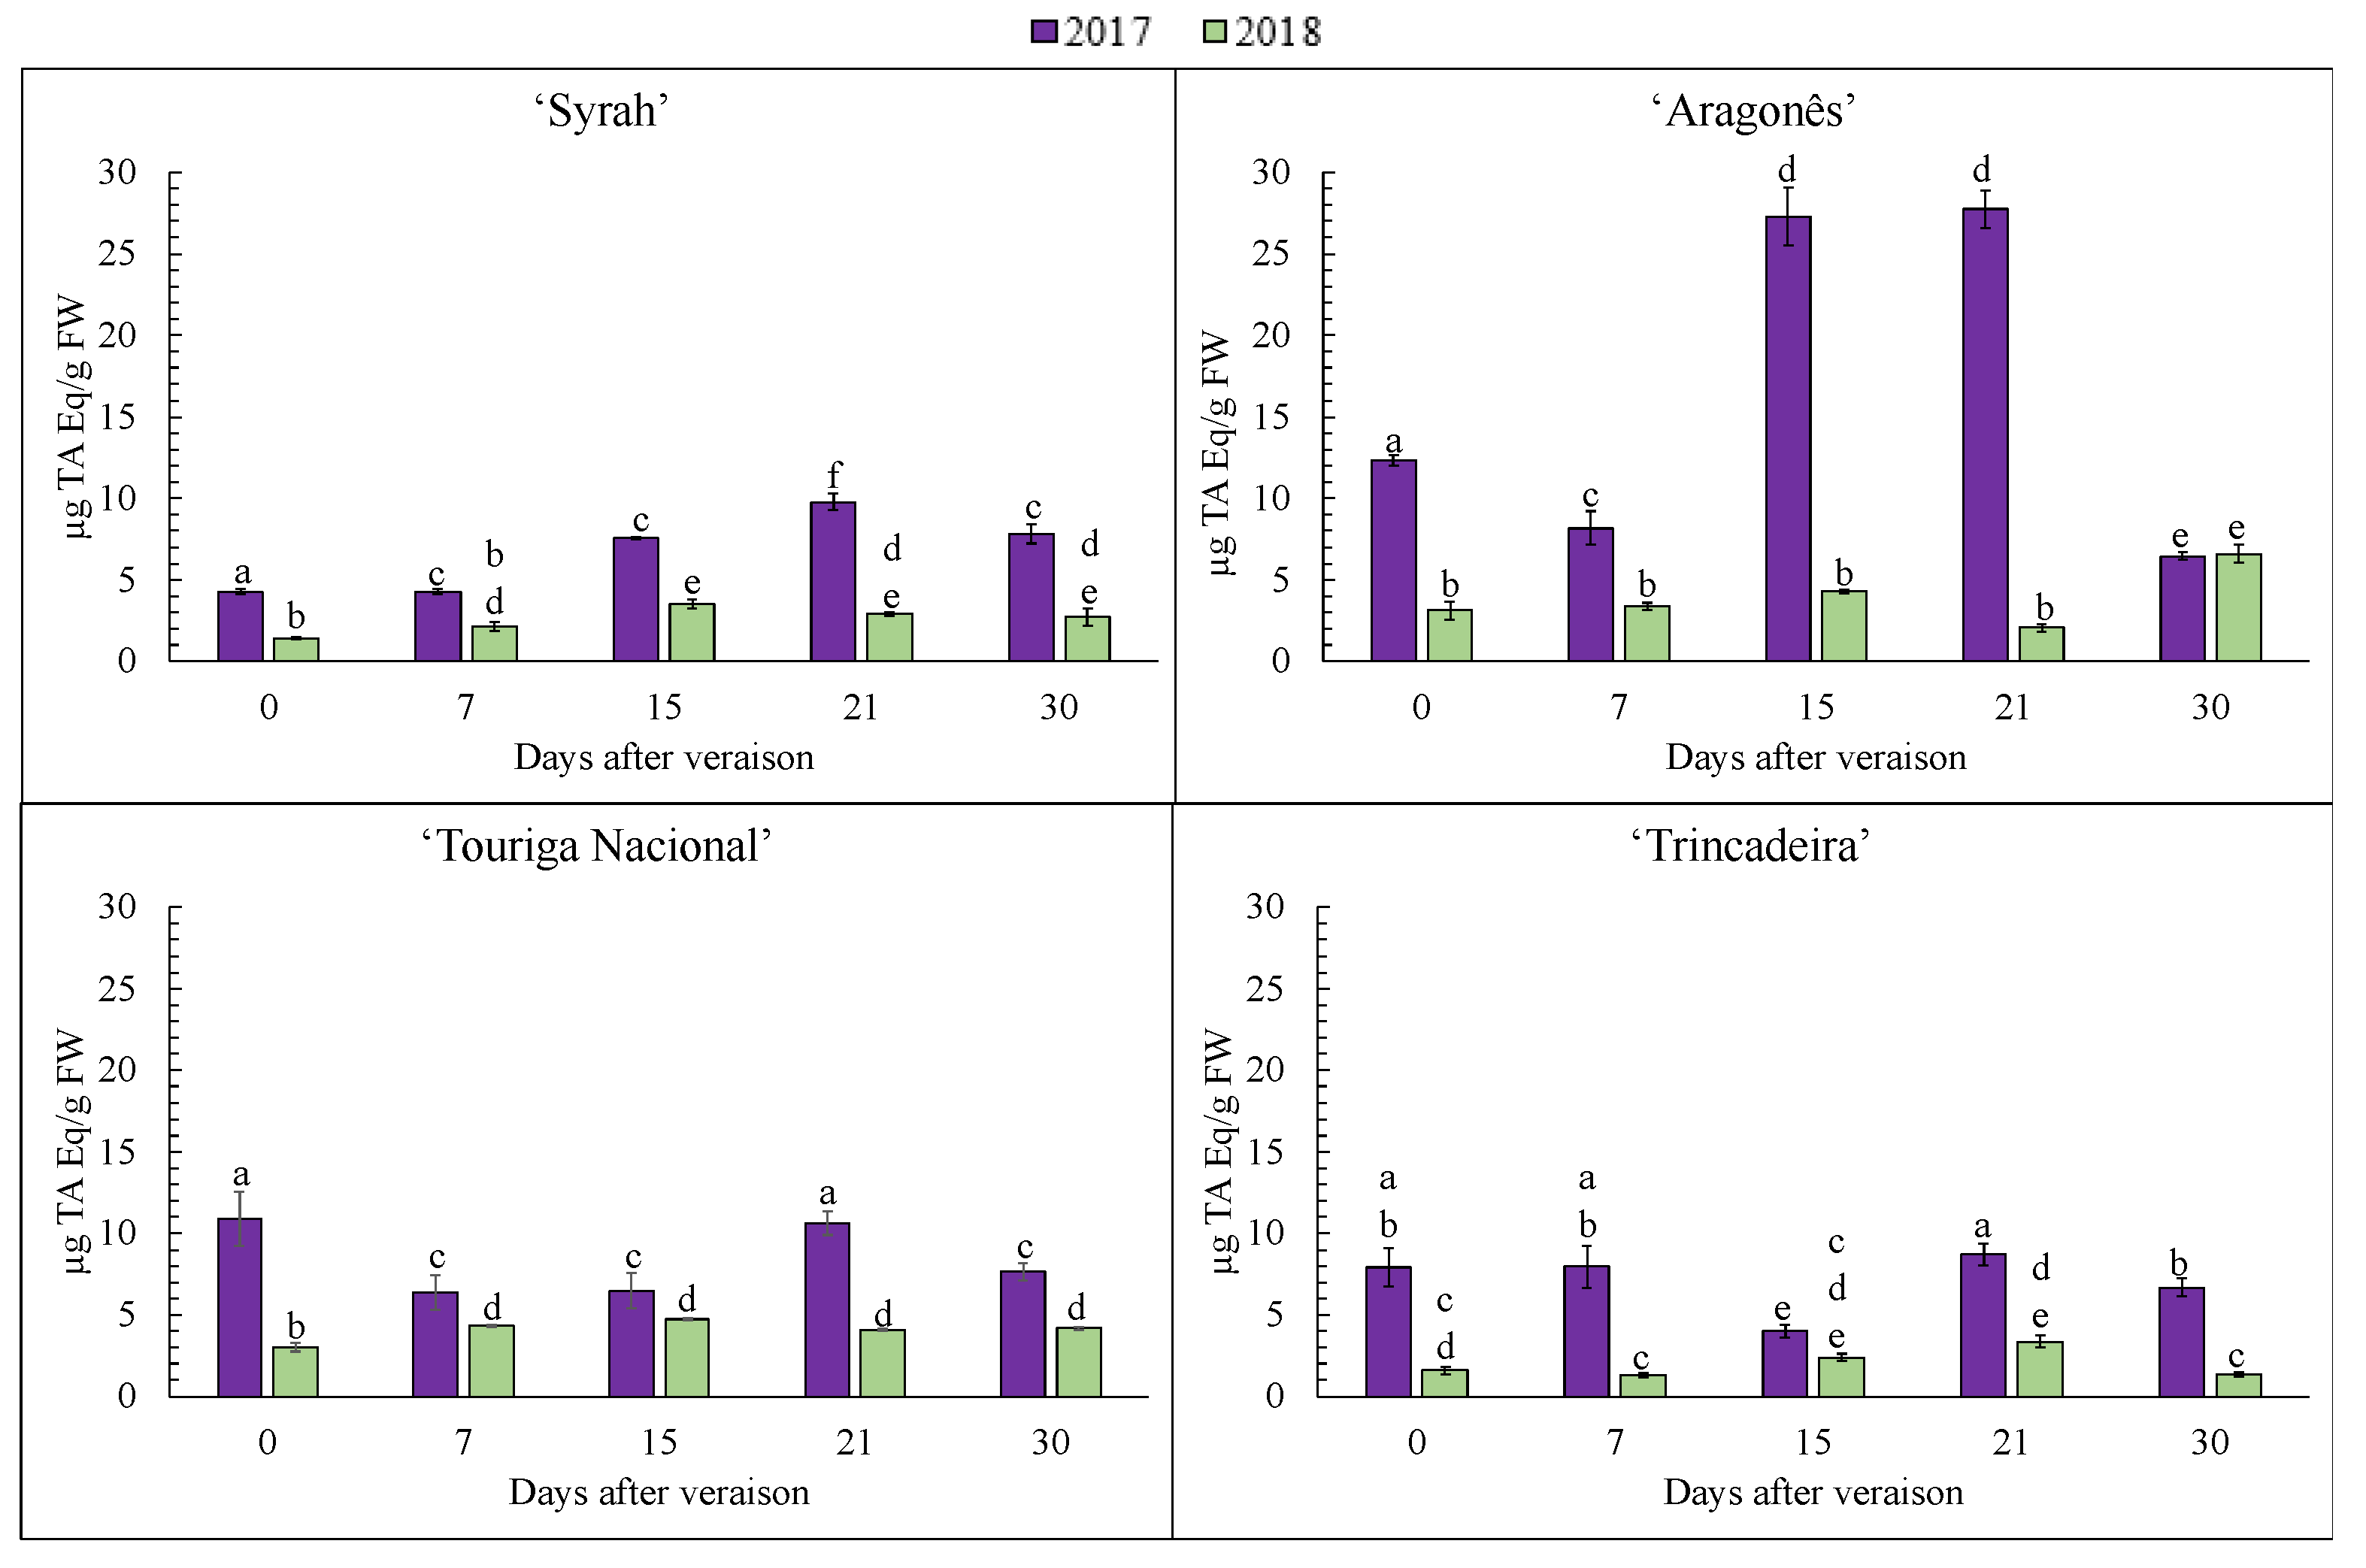
3.6. Total Flavonoids

Total flavonoid content evolution is presented in Figure 9. The flavonoid evolutive profile, for most varieties, increased with maturation, from veraison until harvest, but it seems to be year-dependent. ‘Syrah’ and ‘Trincadeira’ showed a higher flavonoid content in 2017 than in 2018, but in ‘Aragonês’, the total flavonoid content was higher in 2018. Comparing varieties, ‘Syrah’ skin extracts had the highest flavonoid content and ‘Aragonês’ the lowest in 2017, but the profile changed in 2018, with an increase of flavonoid content in ‘Aragonês’ skin extracts. Indeed, ‘Syrah’s’ total flavonoid content was higher in 2017, increasing throughout maturation until harvest (p < 0.05), but in 2018 there were no statistically significant differences during the maturation period (p > 0.05), and at the end of ripening, values were lower than in 2017 (p < 0.05). ‘Aragonês’ total flavonoid content in 2017 was stable during maturation (p > 0.05), but in 2018 the flavonoid content was higher and increased during maturation (p < 0.05). ‘Touriga Nacional’ showed a high flavonoid content at the end of maturation, and in 2018 it was the variety with the highest flavonoid value. In the year of 2018, at harvest, both ‘Syrah’ and ‘Trincadeira’ showed lower flavonoid contents.
During 2017, there was generally higher ultra-violet radiation, which is known for its influence on flavonoid synthesis and accumulation [40]. As previously mentioned, in 2018 there was an extreme UV radiation event which might have had a negative impact on the flavonoid synthesis. Excess UV can be harmful for plants and negatively affect the synthesis of some compounds [3]. Llorens [40] found that higher UV radiation influences plant physiology and metabolism, although more studies are needed to understand the impact in vivo. UV radiation might have an impact on flavonoid biosynthesis. UV-B radiation can have a destructive effect on proteins, lipids and nucleic acids, although, in Cabernet Sauvignon grapes, UV radiation can have a beneficial effect on the accumulation of flavonoids in grapes [40]. Additionally, Ferreyra [41] demonstrated that the presence of the OH group on the 3-position of the flavonoid skeleton is present in chelating metal ions such as iron, copper, zinc, aluminum, and therefore inhibits the formation of free radicals, resulting in the reduction of ROS formed, suggesting that flavonols might play yet uncharacterized roles in the UV stress response. Despite most varieties having a higher flavonoid content, ‘Aragonês’ had a different evolutive pattern, generally higher in 2018. Although these results seem slightly uncharacteristic when compared with other varieties, the findings on this specific variety are in accordance with the findings of Zarrouk [42]. In her study, she found that the ‘Aragonês’ variety had a higher flavonoid content when the water availability was higher. In the year 2018, the water availability was higher due to higher pluviosity, which seems to have affected the flavonoid biosynthesis pathway on this variety.

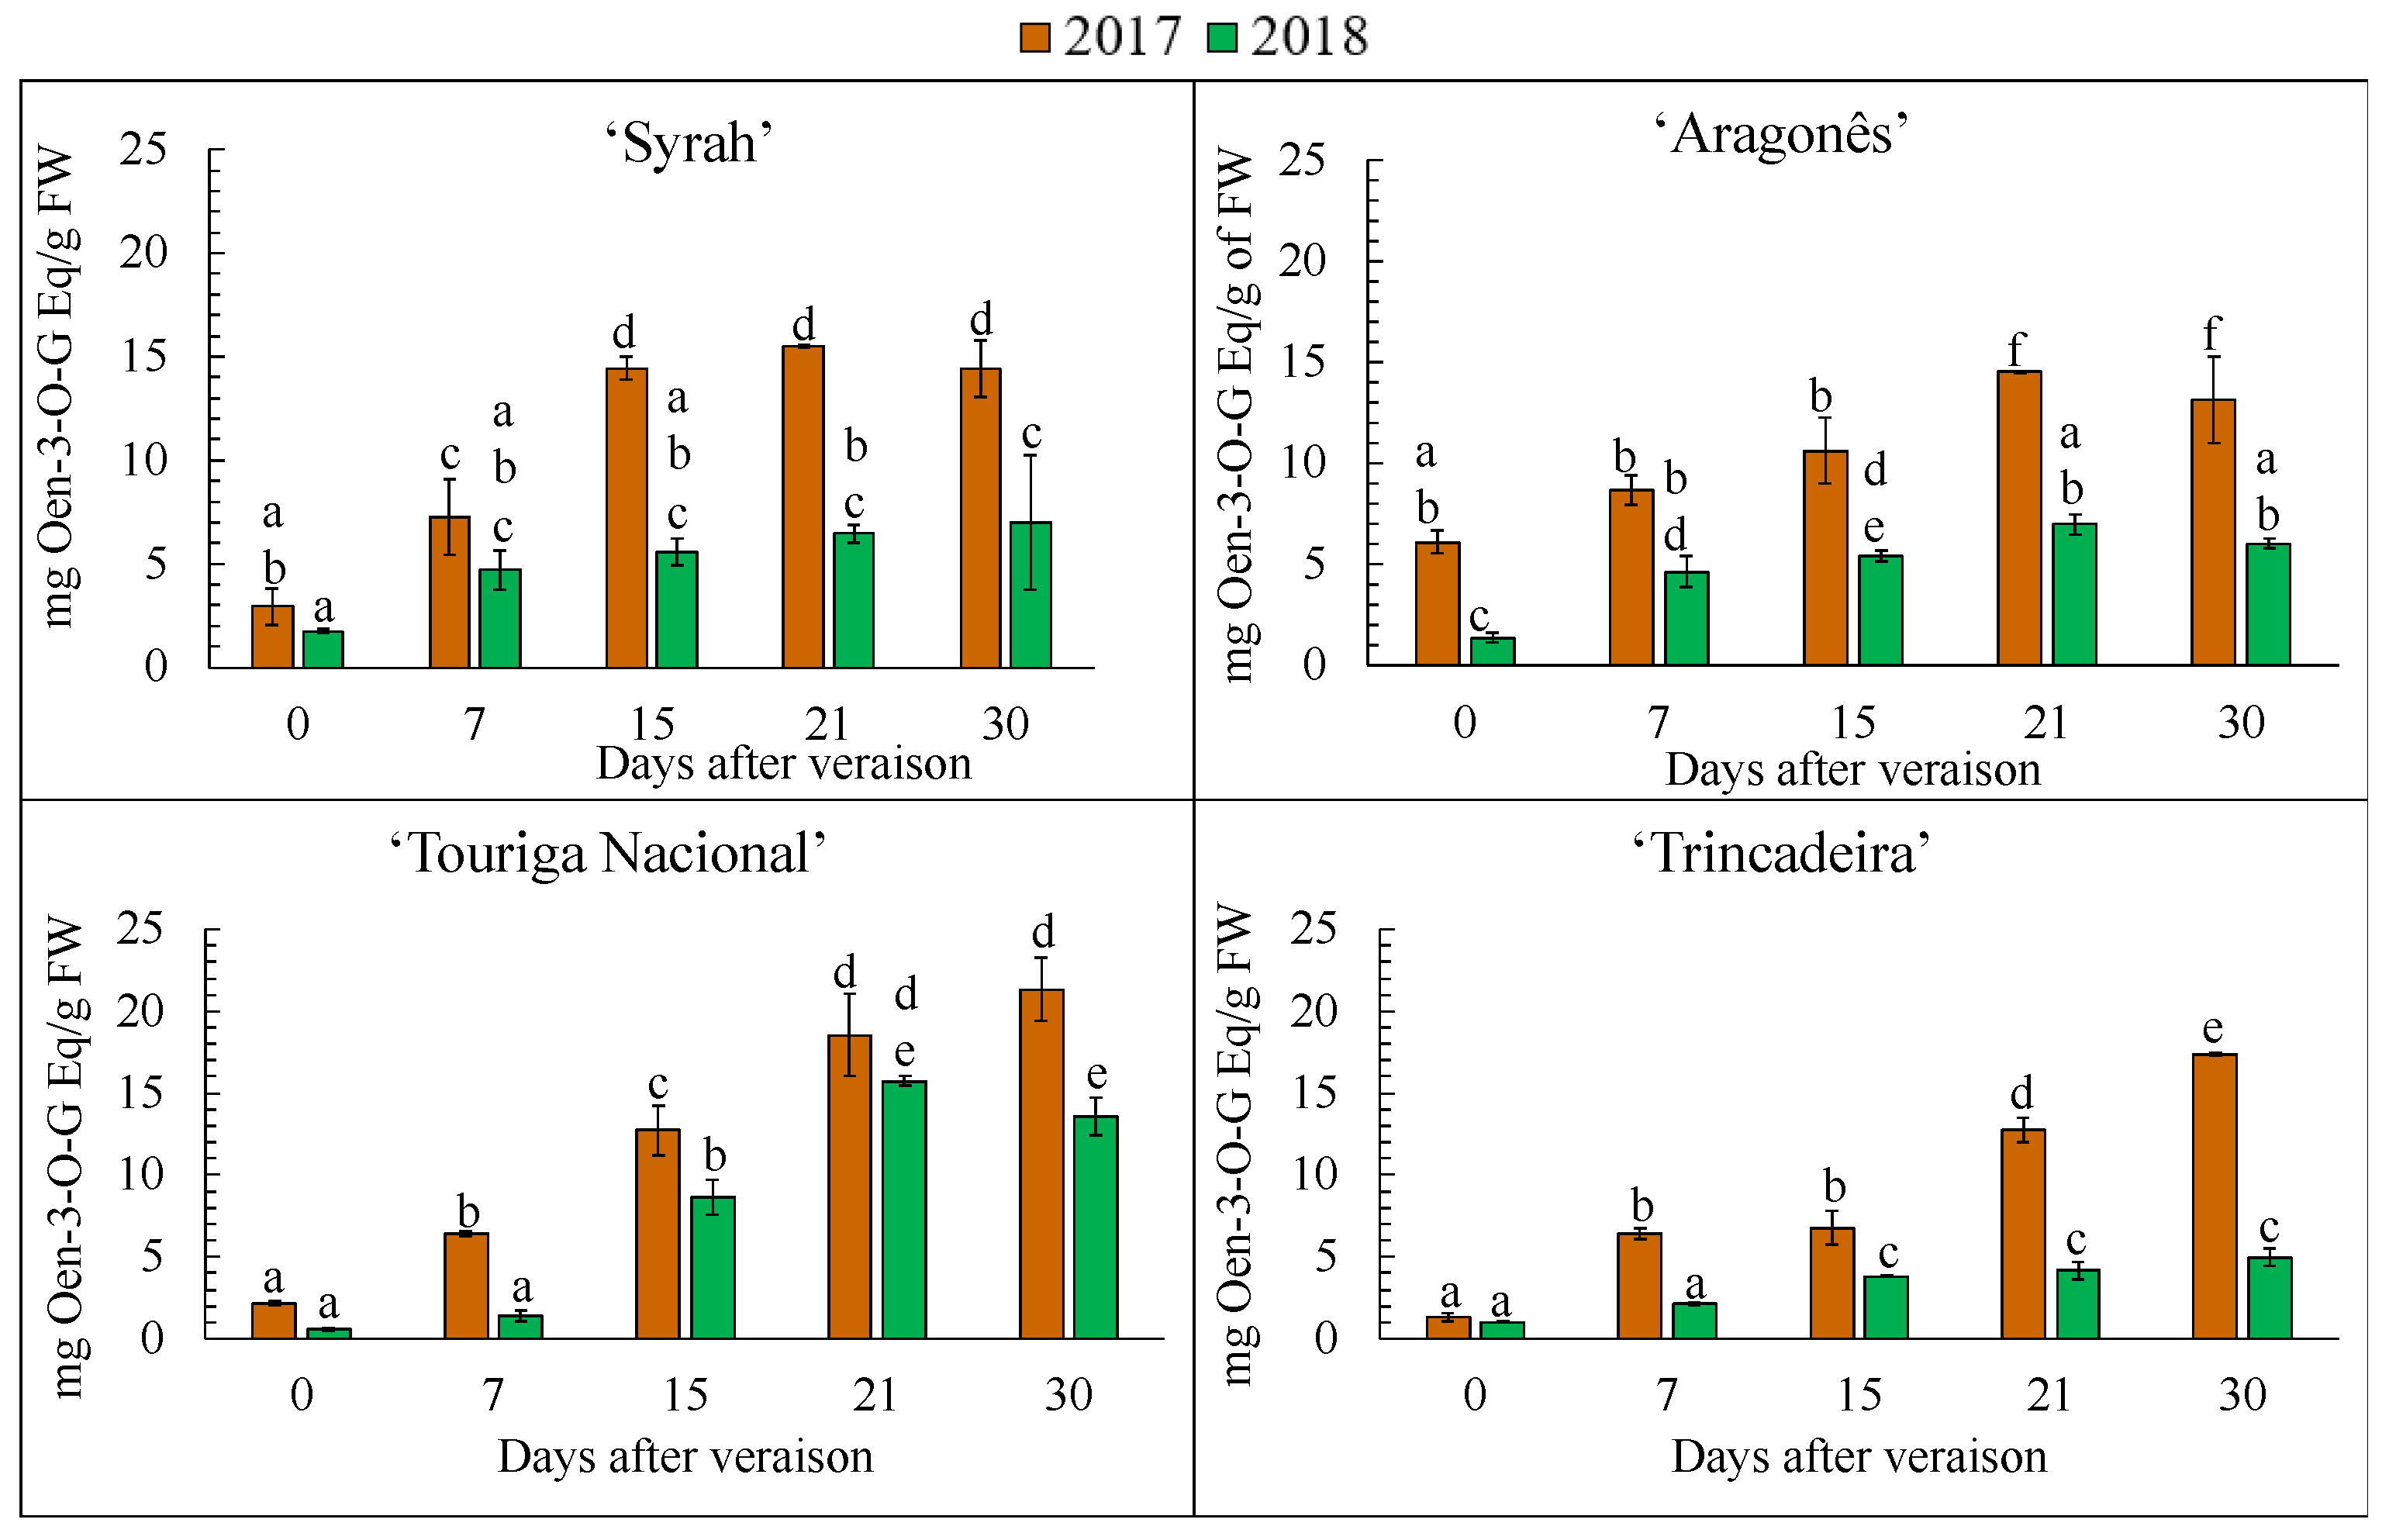
3.7. Anthocyanin Separation, Identification and Quantification

The total anthocyanins presented in grape skin extracts is shown in Figure 10. For all varieties, the anthocyanin content was higher in 2017. In 2017, ‘Touriga Nacional’ was the variety with the highest anthocyanin content and ‘Aragonês’ the variety with the lowest content. In 2018, ‘Touriga Nacional’ was also the variety with the highest anthocyanin content, but ‘Trincadeira’ was the variety with the lowest.
The total anthocyanin profile was similar for all varieties in both years, with an increase of anthocyanin content during maturation. It is expected that the synthesis of anthocyanins increases during maturation, reaching its maximum close to harvest [5]. The anthocyanin content is influenced by numerous factors; there is a huge variability between varieties even when they are collected on the same site, sharing the same cultivation and environmental conditions [13]. Many authors have found a similar anthocyanin evolutive profile, in which the anthocyanin content keeps growing during the maturation process [16]. According to Jordão, depending on the variety, anthocyanin content can increase progressively until harvest or, for some varieties, suffer a slight decrease as maturation ends [43]. The author reported that the anthocyanin content in grape berries of Touriga Francesa increased during maturation and decreased at harvest, contrarily to Castelão grapes, in which the total anthocyanin content increased progressively until harvest [43]. Torchio [44] described that the anthocyanin content should reach its maximum at harvest, as was observed in our results.

3.8. Total Tannins

Total tannin profile during veraison is presented in Figure 11. Although the higher tannin content was found in 2017 for all varieties, their evolutive pattern was different in each variety. In 2017, the tannin content of ‘Syrah’ increased during maturation but decreased at harvest (p < 0.05). ‘Aragonês’ had a more variable tannin content during maturation. Despite showing differences between years during maturation, with higher content in the middle of 2017 maturation, this variety did not show differences in tannin content at harvest when comparing both years (p > 0.05). In ‘Touriga Nacional’, the tannin content was also variable during maturation, but the higher values were found in 2017 (p < 0.05). At harvest, ‘Syrah’ and ‘Touriga Nacional’ had higher tannin content in 2017 (p < 0.05) and ‘Aragonês’ had higher tannin content in 2018. ‘Trincadeira’ was the variety that developed the lowest tannin content over both years.
The reduction of tannins can be a result of reduced extractability due to the bonding of tannins to other cellular contents [45]. The authors reported that grape skin tannins increase during the later stages of ripening and undergo reactions with pectin and anthocyanins, which may affect the mouthfeel and texture of red wines, as well as color stability. The results of that study showed that skin tannins in different varieties diminished during ripening [46]. Thus, the extractability of tannins might have become more difficult in ‘Aragonês’ and ‘Touriga Nacional’ in 2017 and ‘Trincadeira’ in 2018, since their tannin content reduced during maturation.

4. Conclusions

The lower grape productivity in 2017 than in 2018 was probably related to the lowest pluviosity registered during spring. In 2018, pluviosity had normal values, but on the second week of the study there was an event of extreme UV radiation with a detrimental effect on grape quality and causing scald. ‘Trincadeira’ was the variety with the highest productivity in both years and ‘Aragonês’ was the variety more affected by the water higher availability in 2018, synthesizing berry skin at a higher rate than the pulp. The weather conditions found in 2017 had a negative influence on grape size and production, resulting in smaller berries, although with thicker skins. ‘Syrah’ had the smaller berries in both years, although with a higher skin-to-berry-weight ratio.
The results suggest that the weather may have an impact on the polyphenolic profile, since anthocyanins and tannins reached higher values in 2017 and water stress conditions stimulated anthocyanin biosynthesis. Monitoring polyphenols during maturation in different years gives important information about the impact of different factors on grape quality. The reduction of berry size due to lower pluviosity and higher temperatures resulted in grapes with a higher content of compounds related to quality, which will affect wine. To study the weather impact on berries, it is essential to understand how wine quality compounds will be affected and to develop new strategies to mitigate climate effects on wine grapes.

Author Contributions

Conceptualization, A.E.R., M.I.R., M.R.M. and J.M.B.; methodology, M.I.R., M.R.M. and A.E.R.; climate data curation, V.S. and M.J.C.; writing—original draft preparation, M.I.R., M.R.M. and A.E.R.; writing—review and editing, M.R.M., A.E.R., M.I.R., data processing and statistical analysis, A.E.R., M.I.R. and M.R.M.; project administration, A.E.R. and M.R.M.; funding acquisition, A.E.R., M.I.R. and M.R.M. All authors have read and agreed to the published version of the manuscript.

Funding

This research received no external funding.

Data Availability Statement

Data used in this study are partially available at https://www.icterra.pt/g1/, last accessed on 9 November 2022.

Acknowledgments

The authors thanks to the Projects UIDB/05183/2020 from MED-Mediterranean Institute for Agriculture Environment and Development; to the Projects UIDB/04449/2020 and UIDP/04449/2020 from HERCULES Laboratory; and to the Projects UIDB/04683/2020 and UIDP/04683/2020 from the Institute of Earth Sciences (Évora Pole)-ICT; all funded by FCT – Foundation for Science and Technology (Portugal). V.S. also thanks to TOMAQAPA (PTDC/CTAMET/29678/2017) project.

Conflicts of Interest

The authors declare no conflict of interest.

References

  1. Gutiérrez-Escobar, R.; Aliaño-González, M.J.; Cantos-Villar, E. Wine Polyphenol Content and Its Influence on Wine Quality and Properties: A Review. Molecules 2021, 26, 718. [Google Scholar] [CrossRef] [PubMed]
  2. Rouxinol, M.I.; Martins, M.R.; Murta, G.C.; Mota Barroso, J.; Rato, A.E. Quality Assessment of Red Wine Grapes through NIR Spectroscopy. Agronomy 2022, 12, 637. [Google Scholar] [CrossRef]
  3. Allegro, G.; Pastore, C.; Valentini, G.; Filippetti, I. The Evolution of Phenolic Compounds in Vitis vinifera L. Red Berries during Ripening: Analysis and Role on Wine Sensory—A Review. Agronomy 2021, 11, 999. [Google Scholar] [CrossRef]
  4. Tomasi, D.; Gaiotti, F.; Jones, G.V. Organoleptic Characteristics of the Wines. In The Power of the Terroir: The Case Study of Prosecco Wine; Springer: Basel, Switzerland, 2013; pp. 149–166. ISBN 978-3-0348-0627-5. [Google Scholar]
  5. Hosu, A.; Cristea, V.-M.; Cimpoiu, C. Analysis of Total Phenolic, Flavonoids, Anthocyanins and Tannins Content in Romanian Red Wines: Prediction of Antioxidant Activities and Classification of Wines Using Artificial Neural Networks. Food Chem. 2014, 150, 113–118. [Google Scholar] [CrossRef] [PubMed]
  6. Moreno-Olivares, J.D.; Paladines-Quezada, D.F.; Giménez-Bañón, M.J.; Cebrían-Pérez, A.; Férnandez-Férnandez, J.I.; Gómez-Martínez, J.C.; Bleda-Sánchez, J.A.; Gil-Muñoz, R. Cell Wall Characterization of New Monastrell Hybrid Descendants and Their Phenolic Wine Composition. Eur. Food Res. Technol. 2022, 248, 1253–1265. [Google Scholar] [CrossRef]
  7. Chang, B.-M.; Keller, M. Cuticle and Skin Cell Walls Have Common and Unique Roles in Grape Berry Splitting. Hortic. Res. 2021, 8, 168. [Google Scholar] [CrossRef]
  8. Gao, Y.; Zietsman, A.J.J.; Vivier, M.A.; Moore, J.P. Deconstructing Wine Grape Cell Walls with Enzymes During Winemaking: New Insights from Glycan Microarray Technology. Molecules 2019, 24, 165. [Google Scholar] [CrossRef] [Green Version]
  9. Paladines-Quezada, D.F.; Moreno-Olivares, J.D.; Fernández-Fernández, J.I.; Bleda-Sánchez, J.A.; Gil-Muñoz, R. Application of Elicitors at Two Maturation Stages of Vitis vinifera L. Cv Monastrell: Changes in Skin Cell Walls. Chemistry 2022, 4, 98–111. [Google Scholar] [CrossRef]
  10. Deloire, A.; Rogiers, S.; Šuklje, K.; Antalick, G.; Zeyu, X.; Pellegrino, A. Grapevine Berry Shrivelling, Water Loss and Cell Death: An Increasing Challenge for Growers in the Context of Climate Change: Original Language of the Article: English. Tech. Rev. 2021. [Google Scholar] [CrossRef]
  11. Ferrer-Gallego, R.; Hernández-Hierro, J.M.; Rivas-Gonzalo, J.C.; Escribano-Bailón, M.T. Determination of Phenolic Compounds of Grape Skins during Ripening by NIR Spectroscopy. LWT—Food Sci. Technol. 2011, 44, 847–853. [Google Scholar] [CrossRef]
  12. Inoue, E.; Kobayashi, H.; Hoshino, R.; Hisamoto, M.; Watanabe-Saito, F.; Okuda, T. Adsorption Properties of Grape Phenolics to Grape Insoluble Cell Wall Materials. FSTR 2019, 25, 863–869. [Google Scholar] [CrossRef]
  13. Gladstones, J. Viticulture and Environment; Trivinum Press Pty Ltd.: Adelaide, Australia, 2021; Volume 1, ISBN 978-0-9945016-0-8. [Google Scholar]
  14. Cataldo, E.; Fucile, M.; Mattii, G.B. Effects of Kaolin and Shading Net on the Ecophysiology and Berry Composition of Sauvignon Blanc Grapevines. Agriculture 2022, 12, 491. [Google Scholar] [CrossRef]
  15. Cameron, W.; Petrie, P.R.; Barlow, E.W.R.; Patrick, C.J.; Howell, K.; Fuentes, S. Advancement of Grape Maturity: Comparison between Contrasting Cultivars and Regions. Aust. J. Grape Wine Res. 2020, 26, 53–67. [Google Scholar] [CrossRef]
  16. Costa, E.; Cosme, F.; Jordão, A.M.; Mendes-Faia, A. Anthocyanin Profile and Antioxidant Activity from 24 Grape Varieties Cultivated in Two Portuguese Wine Regions. J. Int. Des Sci. De La Vigne Et Du Vin 2014, 48, 51–62. [Google Scholar] [CrossRef]
  17. Nunes, C.; Rato, A.E.; Barros, A.S.; Saraiva, J.A.; Coimbra, M.A. Search for Suitable Maturation Parameters to Define the Harvest Maturity of Plums (Prunus domestica L.): A Case Study of Candied Plums. Food Chem. 2009, 112, 570–574. [Google Scholar] [CrossRef]
  18. Antoniolli, A.; Fontana, A.R.; Piccoli, P.; Bottini, R. Characterization of Polyphenols and Evaluation of Antioxidant Capacity in Grape Pomace of the Cv. Malbec. Food Chem. 2015, 178, 172–178. [Google Scholar] [CrossRef]
  19. dos Santos Costa, D.; Oliveros Mesa, N.F.; Santos Freire, M.; Pereira Ramos, R.; Teruel Mederos, B.J. Development of Predictive Models for Quality and Maturation Stage Attributes of Wine Grapes Using Vis-Nir Reflectance Spectroscopy. Postharvest Biol. Technol. 2019, 150, 166–178. [Google Scholar] [CrossRef]
  20. Tramontini, S.; van Leeuwen, C.; Domec, J.-C.; Destrac-Irvine, A.; Basteau, C.; Vitali, M.; Mosbach-Schulz, O.; Lovisolo, C. Impact of Soil Texture and Water Availability on the Hydraulic Control of Plant and Grape-Berry Development. Plant Soil 2013, 368, 215–230. [Google Scholar] [CrossRef]
  21. Cockell, C.S.; Horneck, G. The History of the UV Radiation Climate of the Earth—Theoretical and Space-Based Observations. Photochem. Photobiol 2001, 73, 447. [Google Scholar] [CrossRef]
  22. Del-Castillo-Alonso, M.-Á.; Monforte, L.; Tomás-Las-Heras, R.; Martínez-Abaigar, J.; Núñez-Olivera, E. To What Extent Are the Effects of UV Radiation on Grapes Conserved in the Resulting Wines? Plants 2021, 10, 1678. [Google Scholar] [CrossRef]
  23. Boulet, J.C.; Ducasse, M.A.; Cheynier, V. Ultraviolet Spectroscopy Study of Phenolic Substances and Other Major Compounds in Red Wines: Relationship between Astringency and the Concentration of Phenolic Substances. Aust. J. Grape Wine Res. 2017, 23, 193–199. [Google Scholar] [CrossRef]
  24. Palma, P.; Fialho, S.; Lima, A.; Catarino, A.; Costa, M.J.; Barbieri, M.V.; Monllor-Alcaraz, L.S.; Postigo, C.; de Alda, M.L. Occurrence and Risk Assessment of Pesticides in a Mediterranean Basin with Strong Agricultural Pressure (Guadiana Basin: Southern of Portugal). Sci. Total Environ. 2021, 794, 148703. [Google Scholar] [CrossRef] [PubMed]
  25. Vaz, M.; Coelho, R.; Rato, A.; Samara-Lima, R.; Silva, L.L.; Campostrini, E.; Mota, J.B. Adaptive Strategies of Two Mediterranean Grapevines Varieties (Aragonez Syn. Tempranillo and Trincadeira) Face Drought: Physiological and Structural Responses. Theor. Exp. Plant Physiol. 2016, 28, 205–220. [Google Scholar] [CrossRef]
  26. Chaves, M.M.; Zarrouk, O.; Francisco, R.; Costa, J.M.; Santos, T.; Regalado, A.P.; Rodrigues, M.L.; Lopes, C.M. Grapevine under Deficit Irrigation: Hints from Physiological and Molecular Data. Ann. Bot. 2010, 105, 661–676. [Google Scholar] [CrossRef] [PubMed] [Green Version]
  27. Jordão, A.M.; Ricardo-da-Silva, J.M.; Laureano, O. Influência Da Rega Na Composição Fenólica Das Uvas Tintas Da Casta TOURIGA FRANCESA (Vitis vinifera L.). Cienc. Y Tecnol. Aliment. 1998, 2, 60–73. [Google Scholar] [CrossRef]
  28. Sugiura, T.; Sato, A.; Shiraishi, M.; Amamiya, H.; Ohno, H.; Takayama, N.; Miyata, N.; Sakaue, T.; Konno, S. Prediction of Acid Concentration in Wine and Table Grape Berries from Air Temperature. Hortic. J. 2020, 89, 208–215. [Google Scholar] [CrossRef] [Green Version]
  29. Santos, J.A.; Fraga, H.; Malheiro, A.C.; Moutinho-Pereira, J.; Dinis, L.-T.; Correia, C.; Moriondo, M.; Leolini, L.; Dibari, C.; Costafreda-Aumedes, S.; et al. A Review of the Potential Climate Change Impacts and Adaptation Options for European Viticulture. Appl. Sci. 2020, 10, 3092. [Google Scholar] [CrossRef]
  30. Petrie, P.; Sadras, V. Advancement of Grapevine Maturity in Australia between 1993 and 2006: Putative Causes, Magnitude of Trends and Viticultural Consequences. Aust. J. Grape Wine Res. 2008, 14, 33–45. [Google Scholar] [CrossRef]
  31. Boido, E.; García-Marino, M.; Dellacassa, E.; Carrau, F.; Rivas-Gonzalo, J.C.; Escribano-Bailón, M.T. Characterisation and Evolution of Grape Polyphenol Profiles of Vitis vinifera L. Cv. Tannat during Ripening and Vinification: Polyphenolic Profiles of Tannat. Aust. J. Grape Wine Res. 2011, 17, 383–393. [Google Scholar] [CrossRef]
  32. Buttrose, M.S.; Hale, C.R.; Kliewer, W.M. Effect of Temperature on the Composition of “Cabernet Sauvignon” Berries. Am. J. Enol. Vitic. 1971, 22, 71–75. [Google Scholar]
  33. Costa, C.; Graça, A.; Fontes, N.; Teixeira, M.; Gerós, H.; Santos, J.A. The Interplay between Atmospheric Conditions and Grape Berry Quality Parameters in Portugal. Appl. Sci. 2020, 10, 4943. [Google Scholar] [CrossRef]
  34. Antunes, M.T.; Lehmann, J.; Dias, J.E.E.; Böhm, J. Atlas Das Castas Da Península Ibérica: História, Terroir, Ampelografia; Dinalivros: Lisboa, Portugal, 2011; ISBN 9789725765913. [Google Scholar]
  35. Pinelo, M.; Arnous, A.; Meyer, A.S. Upgrading of Grape Skins: Significance of Plant Cell-Wall Structural Components and Extraction Techniques for Phenol Release. Trends Food Sci. Technol. 2006, 17, 579–590. [Google Scholar] [CrossRef]
  36. Apolinar-Valiente, R.; Gómez-Plaza, E.; Terrier, N.; Doco, T.; Ros-García, J.M. The Composition of Cell Walls from Grape Skin in Vitis Vinifera Intraspecific Hybrids: Cell Wall Composition of Skin of Intraspecific Hybrid Grapes. J. Sci. Food Agric. 2017, 97, 4029–4035. [Google Scholar] [CrossRef]
  37. Silva, L.R.; Queiroz, M. Bioactive Compounds of Red Grapes from Dão Region (Portugal): Evaluation of Phenolic and Organic Profile. Asian Pac. J. Trop. Biomed. 2016, 6, 315–321. [Google Scholar] [CrossRef] [Green Version]
  38. Garrido, I.; Uriarte, D.; Hernández, M.; Llerena, J.L.; Valdés, M.E.; Espinosa, F. The Evolution of Total Phenolic Compounds and Antioxidant Activities during Ripening of Grapes (Vitis vinifera L.,Cv. Tempranillo) Grown in Semiarid Region: Effects of Cluster Thinning and Water Deficit. Int. J. Mol. Sci. 2016, 17, 1923. [Google Scholar] [CrossRef] [Green Version]
  39. Younis, E.B.M.; Hasaneen, A.G.M.N.; Abdel-Aziz, H.M.M. An Enhancing Effect of Visible Light and UV Radiation on Phenolic Compounds and Various Antioxidants in Broad Bean Seedlings. Plant Signal. Behav. 2010, 5, 1197–1203. [Google Scholar] [CrossRef] [Green Version]
  40. Llorens, L.; Neugart, S.; Vandenbussche, F.; Castagna, A. Editorial: Ultraviolet Radiation: Friend or Foe for Plants? Front. Plant Sci. 2020, 11, 10–11. [Google Scholar] [CrossRef]
  41. Falcone Ferreyra, M.L.; Rius, S.P.; Casati, P. Flavonoids: Biosynthesis, Biological Functions, and Biotechnological Applications. Front. Plant Sci. 2012, 3, 222. [Google Scholar] [CrossRef] [Green Version]
  42. Zarrouk, O.; Francisco, R.; Pinto-Marijuan, M.; Brossa, R.; Santos, R.R.; Pinheiro, C.; Costa, J.M.; Lopes, C.; Chaves, M.M. Impact of Irrigation Regime on Berry Development and Flavonoids Composition in Aragonez (Syn. Tempranillo) Grapevine. Agric. Water Manag. 2012, 114, 18–29. [Google Scholar] [CrossRef]
  43. Jordão, A.M.; Correia, A.C. Relationship Between Antioxidant Capacity, Proanthocyanidin and Anthocyanin Content During Grape Maturation of Touriga Nacional and Tinta Roriz Grape Varieties. S. Afr. J. Enol. Vitic. 2012, 33, 214–224. [Google Scholar] [CrossRef] [Green Version]
  44. Torchio, F.; Cagnasso, E.; Gerbi, V.; Rolle, L. Mechanical Properties, Phenolic Composition and Extractability Indices of Barbera Grapes of Different Soluble Solids Contents from Several Growing Areas. Anal. Chim. Acta 2010, 660, 183–189. [Google Scholar] [CrossRef] [PubMed]
  45. Gao, Y.; Fangel, J.U.; Willats, W.G.T.; Vivier, M.A.; Moore, J.P. Dissecting the Polysaccharide-Rich Grape Cell Wall Changes during Winemaking Using Combined High-Throughput and Fractionation Methods. Carbohydr. Polym. 2015, 133, 567–577. [Google Scholar] [CrossRef] [PubMed]
  46. Ortega-Regules, A.; Romero-Cascales, I.; Ros García, J.M.; Bautista-Ortín, A.B.; López-Roca, J.M.; Fernández-Fernández, J.I.; Gómez-Plaza, E. Anthocyanins and Tannins in Four Grape Varieties (Vitis vinifera L.) Evolution of Their Content and Extractability. J. Int. Des Sci. De La Vigne Et Du Vin 2008, 42, 147–156. [Google Scholar] [CrossRef]
Figure 1. Thermo-pluviometric graphic—“Herdade da Mitra” Station.
Beverages 09 00008 g001
Figure 2. Grape production in vineyard of “Herdade da Mitra” in 2017 and 2018, expressed in tons (t) by hectare (ha).
Beverages 09 00008 g002
Figure 3. Berry weight during veraison in 2017 and 2018. Each column represents the mean of three replicates of 50 grape berries ± standard deviation. Tukey’s test compares the means between years in each variety separately, and the groups marked with different letters (a–f) showed significant differences (p < 0.05).
Beverages 09 00008 g003
Figure 4. Titratable acidity (%) in 2017 and 2018. Each column represents the mean of six replicates ± standard deviation. Tukey’s test compares the means between years in each variety separately, and the groups marked with different letters (a–g) showed significant differences (p < 0.05).
Beverages 09 00008 g004
Figure 5. Total soluble solid content (SSC) evolution in 2017 and 2018. Each column represents the mean of six replicates ± standard deviation. Tukey’s test compares the means between years in each variety separately, and the groups marked with different letters (a–f) showed significant differences (p < 0.05).
Beverages 09 00008 g005
Figure 6. The berry weight (i), grape skin (ii) and grape skin/berry weight ratio (iii) for each grape variety in 2017 and 2018. Each column represents the mean of five time points with three replicates of 50 grape berries ± standard deviation. Tukey’s test compares the means between years in each variety separately, and the groups marked with different letters (a–c) showed significant differences (p < 0.05).
Beverages 09 00008 g006
Figure 7. AIR extraction yield (%). Each column represents the mean of five time points with three replicates of 50 grape berries ± standard deviation. Tukey’s test compares the means among varieties in each year separately and the groups marked with different letters (a, b) showed significant differences (p < 0.05).
Beverages 09 00008 g007
Figure 8. Total phenolic content (TPC) of each grape variety during veraison in 2017 and 2018. Results were expressed in mg of gallic acid equivalents (GA eq) by g of skin fresh weight. Each column represents the mean of five time points with three replicates of 50 grape berries ± standard deviation. Tukey’s test compares the means of each variety in each year, and the groups marked with different letters (a–c) showed significant differences (p < 0.05).
Beverages 09 00008 g008
Figure 9. Flavonoid content profile during 2017 and 2018 maturation, expressed in μg of rutin equivalents (REq) by g of skin fresh weight (FW). Each column represents the mean of three replicates of 50 grape berries ± standard deviation. Tukey’s test compares the means of 2017 and 2018 in each variety separately, and the groups marked with different letters (a–d) showed significant differences (p < 0.05).
Beverages 09 00008 g009
Figure 10. Total anthocyanin content during veraison. Results were expressed in mg of Oenin-3-O-glucoside eq/g of skin (F.W). Each column represents the mean of three replicates ± standard deviation. Tukey’s test compares the means of 2017 and 2018 in each variety separately, and the groups marked with different letters (a–f) show significant differences (p < 0.05).
Beverages 09 00008 g010
Figure 11. Total tannin content profile for each variety in 2017 and 2018. Results were expressed in mg of tannin equivalents (TA eq)/g of skin fresh weight (FW). Each column represents the mean of three replicates ± standard deviation. Tukey’s test compares the means of 2017 and 2018 in each variety separately, and the groups marked with different letters (a–f) showed significant differences (p < 0.05).
Beverages 09 00008 g011
Table 1. Accumulated UV radiation during the weeks of the study in both years.
Days after VeraisonPeriodDose UVA (KJm−2)Dose UVB (KJm−2)Dose SW (KJm−2)
0 to 617–23 July 20179810.933.4172,877.9
7 to 1424–30 July 20179278.230.9169,268.2
15 to 2231 July–6 August 20179653.431.0171,743.1
23 to 307–16 August 201711,387.336.2214,957.3
0 to 67–12 August 20187796.723.3139,616.4
7 to 1413–22 August 201812,219.834.8218,720.0
15 to 2223–28 August 201885997.516.5108,362.6
23 to 3029 August–4 September 20186072.717.01,114,000.9
Disclaimer/Publisher’s Note: The statements, opinions and data contained in all publications are solely those of the individual author(s) and contributor(s) and not of MDPI and/or the editor(s). MDPI and/or the editor(s) disclaim responsibility for any injury to people or property resulting from any ideas, methods, instructions or products referred to in the content.

