
Bioactive Compounds in Different Coffee Beverages for Quality and Sustainability Assessment

Department of Management, Sapienza University of Rome, Via del Castro Laurenziano 9, 00161 Rome, Italy
*
Author to whom correspondence should be addressed.
Beverages 2023, 9(1), 3; https://doi.org/10.3390/beverages9010003
Submission received: 14 November 2022
/
Revised: 7 December 2022
/
Accepted: 23 December 2022
/
Published: 5 January 2023
(This article belongs to the Special Issue Health Beneficial Effects of Plant Beverages: From In Vitro to In Vivo Evidence)
Abstract
:Coffee is one of the most widely consumed beverages worldwide, mainly due to its organoleptic, and psychoactive properties. Coffee brewing techniques involve the use of different extraction/infusion conditions (i.e., time, temperature, pressure, water/powder ratio, etc.), which can influence the quality of the final product. The study aimed to analyze the effect of four brewing coffee techniques (industrial espresso machine, Moka machine, pod machine, and capsule machine), which are the most used coffee brewing methods in Italy, on the quality and safety of the coffee brews, taking into account the profile of biogenic amines (BAs), total polyphenol content (TPC), total flavonoid content (TFC) and anti-radical activity (DPPH and ABTS assay). Eight coffee powders and brewed beverages from two different brands belonging to the 100% Arabica variety (country of origin Brazil) were analysed. The brewing techniques all resulted in a reduction of both BA content (27–30%), TPC (55–60%), TFC (50–55%), and anti-radical assays (45–50%) in coffee beverages compared to ground coffee samples. The study also showed that Moka is the method that yields the highest TPC (2.71–3.52 mg GAE/g coffee powder) and TFC (8.50–8.60 mg RUT/g coffee powder) content and highest anti-radical capacity in coffee beverages. The multivariate statistical analysis revealed a difference between coffee powder and infusions and coffee infusions obtained by different extraction techniques. Moreover, an analysis of the environmental impacts related to the different coffee preparation methods examined was conducted. This was performed by applying the Life Cycle Assessment (LCA) methodology through SimaPro v.9.2.2. software.
1. Introduction
Coffee, valued mainly for its organoleptic-nutritional characteristics, is one of the most consumed foods/drinks in the world. Moreover, coffee is one of the most traded commodities globally [1]. In 2020, coffee production reached 10.7 million tonnes with a value of approximately USD 102 million. Brazil (34.7%) is among the main producing countries, followed by Vietnam (16.5%), Colombia (7.8%), Indonesia (7.3%), Ethiopia (5.5%), and Peru (3.5%) [2]. According to the International Coffee Organisation (ICO), more than 169 million 60 kg bags of coffee were produced in 2020, with an increase of 0.3% compared to the previous year. As coffee production and consumption are expected to steadily grow in the coming years, the amount of coffee by-products produced by the coffee industry is also expected to increase [1,2].
Hot and cold coffee drinks can be produced from a different variety of beans (i.e., Arabica and Robusta). The two most important species in terms of economics are Coffea arabica L. (generally referred to as Arabica), which accounts for about 70% of production, and Coffea canephora (generally referred to as Robusta). Arabica and Robusta coffees differ in terms of ideal pedo-climatic conditions (soil composition, climate, temperature, etc.), physical aspects (size of the green coffee, etc.), chemical composition, and the characteristics of the brew obtained after roasting [1]. In particular, considering the chemical composition, Robusta coffee contains higher amounts of antioxidant compounds, caffeine, and soluble solids, resulting in increased body and strong flavor and aroma. The caffeine content in seeds ranges from 0.3% to 2.7% and is twice as high in Coffee Robusta as in Coffee Arabica, which contains almost 1.5%. While Arabica coffee offers superior cup quality and aroma, different secondary metabolites (i.e., minor isomers of chlorogenic acids and diterpenes), are not present in C. Arabica [1,2,3].
There are many coffee preparation techniques, involving the use of different extraction/infusion conditions (i.e., time, temperature, pressure, water/powder ratio, etc.) [4,5]. Concerning the coffee brewing methods mostly used in Italy, 87% of the home-brewed coffee beverage is mainly characterized by Moka, and the semi-sweet brewing method [6]. However, nowadays, coffee preparation with traditional techniques is slowly giving way to faster brewing methods such as pods and capsules. These are small containers containing previously roasted and ground coffee beans that are used in special systems to brew them. The introduction of these new systems resulted in an increase in domestic coffee consumption [7,8].
The chemical composition of coffee beverages mainly depends on the processing techniques (i.e., pre-roasting and roasting) of green coffee beans. Moreover, processing methods at the harvesting stage and industrial processes of green coffee, as well as the methods used by consumers to prepare the coffee beverage, contribute to changes in the concentration of certain compounds within the finished product. The study of the chemical composition of coffee also referred to as “coffeeology”, has highlighted more than 1000 different volatile and non-volatile compounds, exhibiting several functional properties, such as antioxidant, anti-inflammatory, antihypertensive and antimicrobial activities, that act both positively and negatively on the consumer’s health [9,10].
Considering the physiochemical properties, coffee beans consist of (i) an outer skin (exocarp), which is rich in caffeine, chlorogenic acids, and tannins [9]; (ii) a middle pulp and a mucilaginous layer (mesocarp), which is a source of carbohydrates, such as glucose, and pectin; (iii) parchment, composed of cellulose, caffeine, and minerals; (iv) silver skin (integument), composed of polysaccharides, such as cellulose, and hemicellulose, as well as proteins and phenolic compounds [9], and (v) finally, the seeds (endocarp), containing significant concentrations of caffeine, polyphenols, flavonoids and triacylglycerols (TAGs), bioactive compounds with high antioxidant and antimicrobial activities [10]. The content of bioactive compounds (i.e., antioxidants, biogenic amines, etc.) depends on the coffee species, growing conditions, harvesting techniques, and the processing techniques the bean undergoes (i.e., roasting at high temperatures) [11,12,13]. Among its bioactive compounds, there are biogenic amines (BAs), consisting of basic low-molecular weight compounds derived from microbial and/or thermal decarboxylation of amino acids. These compounds, which can have both undesirable effects on health (e.g., histamine, cadaverine, tyramine, etc.) and positive effects (e.g., serotonin), are considered an indicator of food quality and safety. Studies have reported that the concentration of BA, especially polyamines (spermine, spermidine, and putrescine) changes considerably during the formation of the fruit and the processing phases, especially during the roasting phase of green coffee. Among the most abundant amine is putrescine, followed by spermine, spermidine, and serotonin [1,13]. Whereas the BA present in smaller quantities is cadaverine, histamine, and tyramine. Among other bioactive compounds, coffee contains significant amounts of polyphenols, i.e., molecules produced by the secondary metabolism of plants that can have positive effects on human health (i.e., anti-atherosclerotic activity, antioxidant activity, etc.). Among the polyphenols most commonly found in coffee are chlorogenic acid, hydroxycinnamic acid, and their derivatives (i.e., caffeic acid, ferulic acid, etc.), as they are molecules with a high scavenging activity towards free radicals [14]. The polyphenol content in coffee varies considerably between green and roasted coffee, indeed the roasting process of the beans leads to the degradation of approximately 70–75% of the polyphenols contained in green coffee [14,15,16].
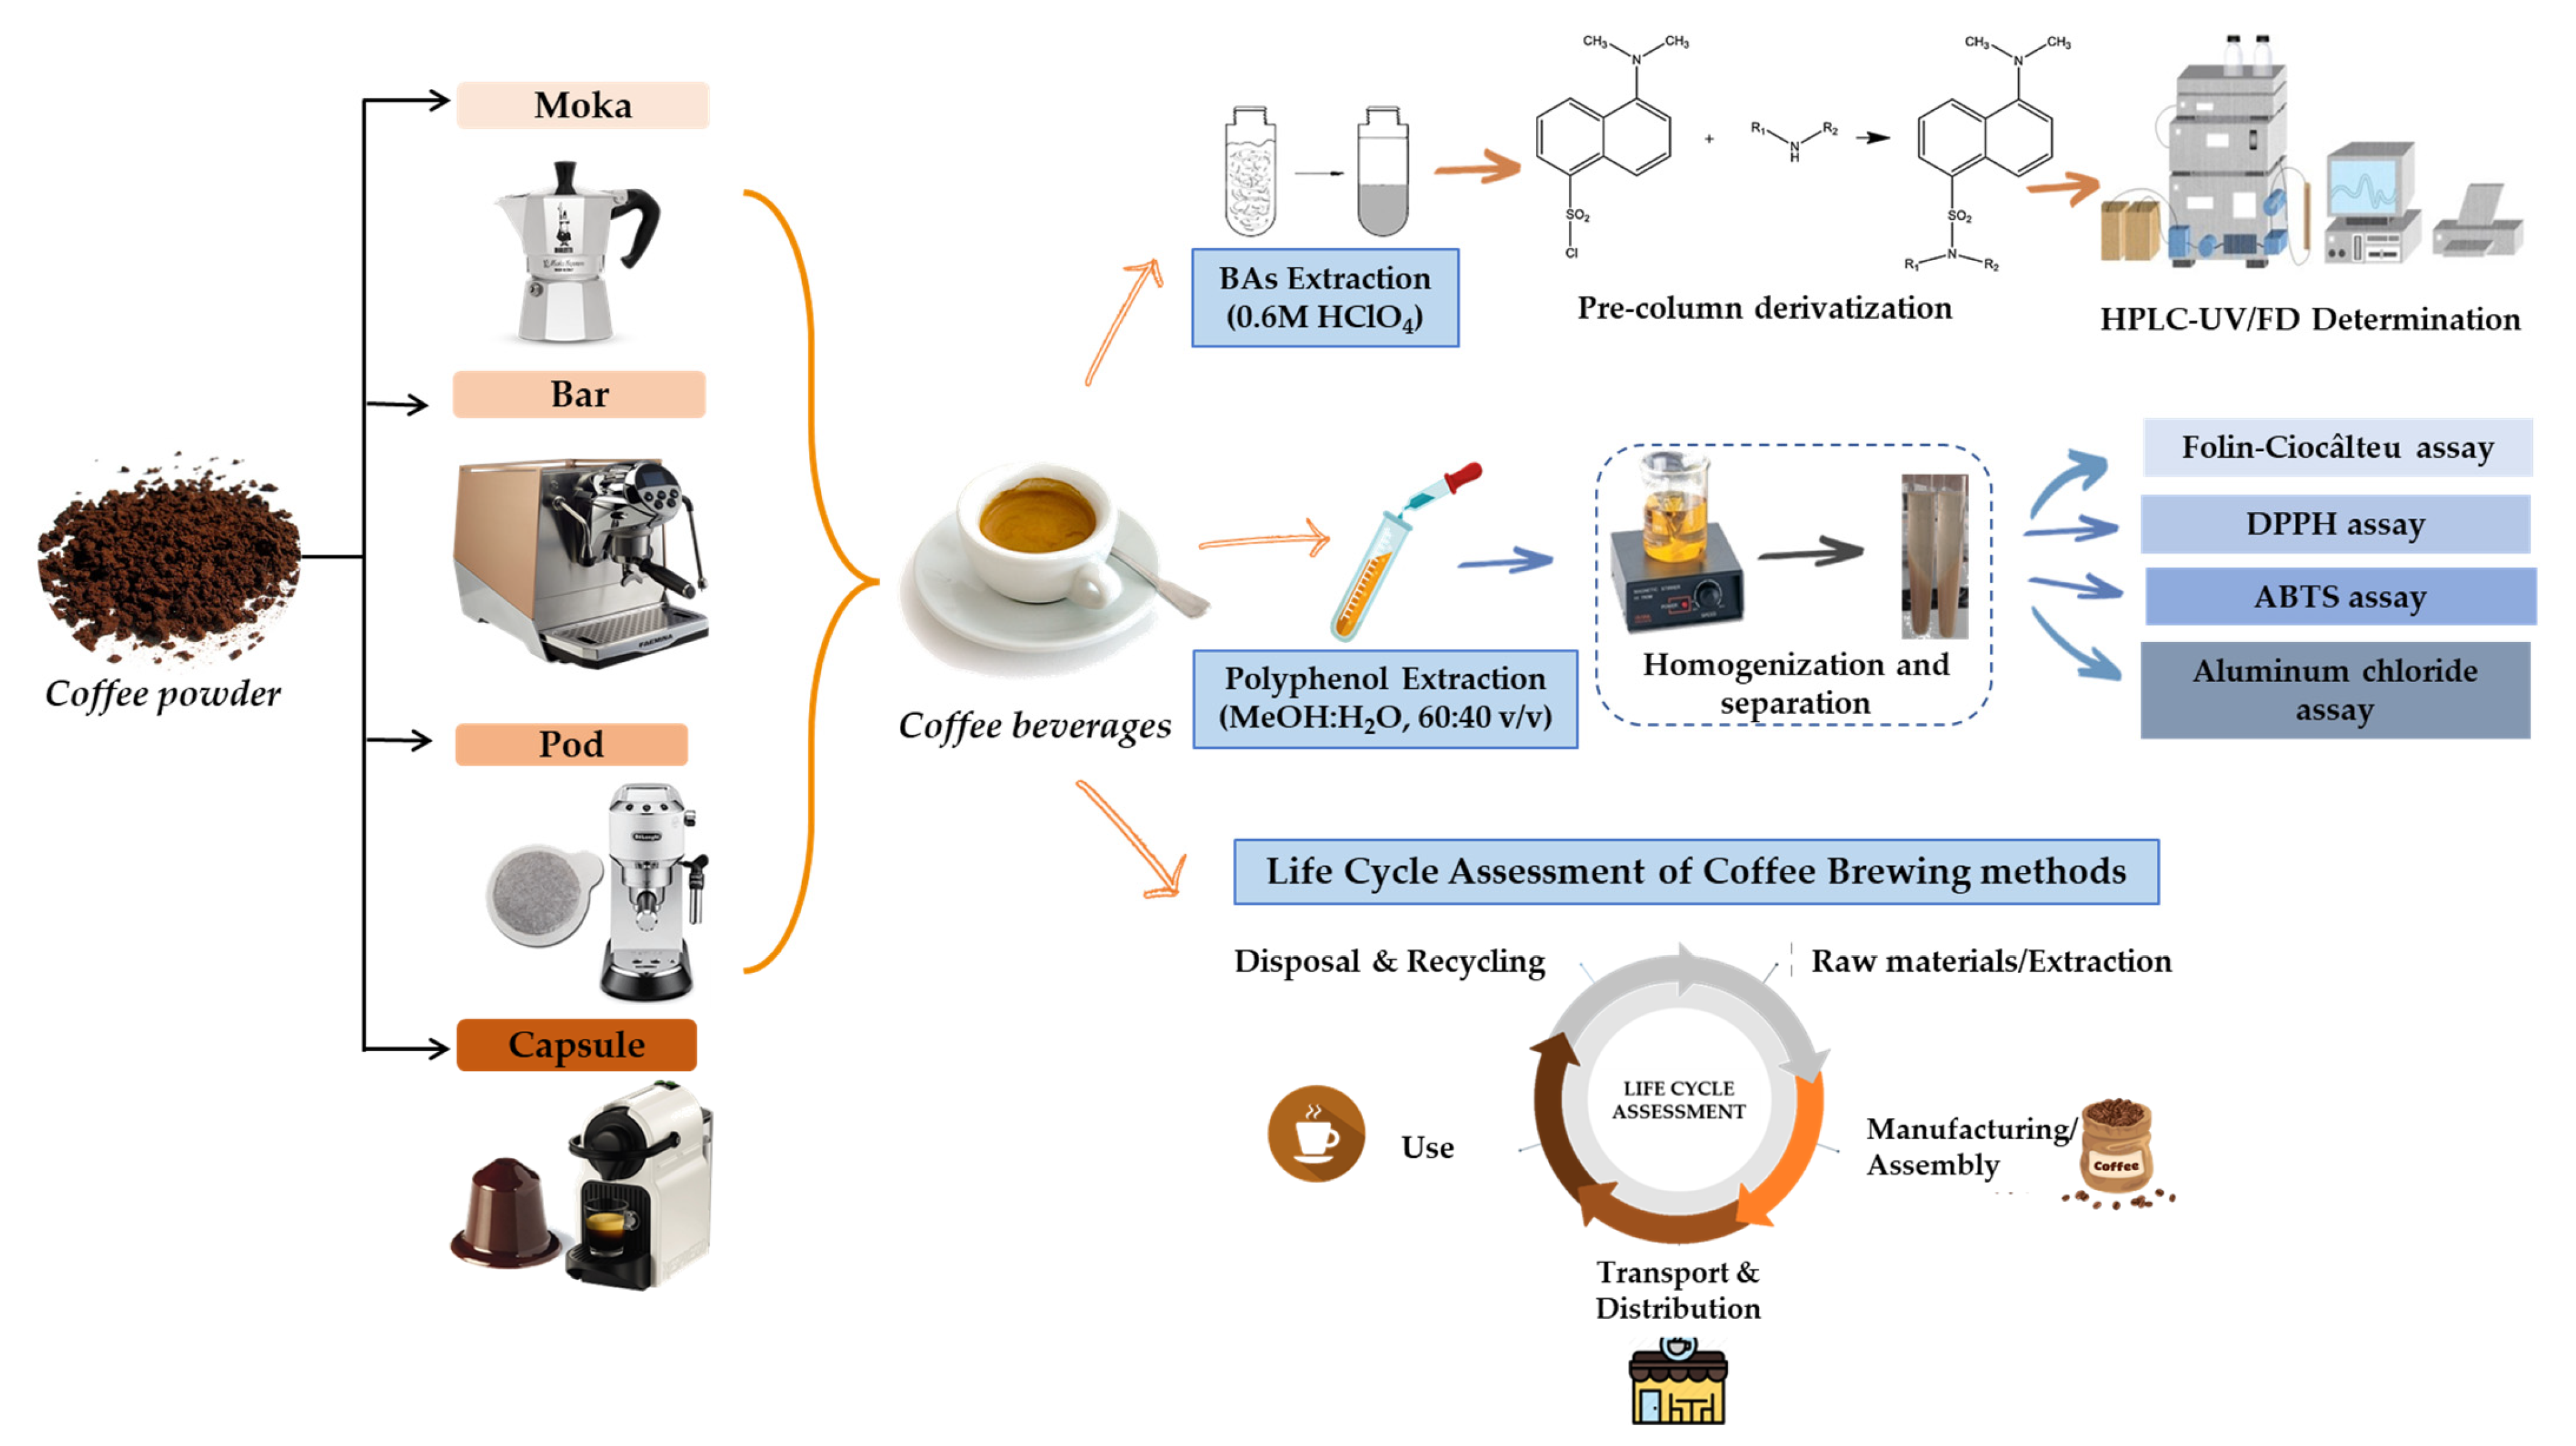
Bioactive compounds in coffee beverages have been studied using different brewing preparation techniques (espresso machines, capsule machines, pod machines, and Moka) with different infusion conditions (i.e., time, temperature, pressure, etc.). Some studies have considered the possibility of evaluating multiple bioactive compounds in coffee powder and respective brewed coffees obtained by different techniques [13]. Therefore, this study aimed to evaluate the effect of four different coffee extraction methods (professional coffee machine, Moka machine, pod machine, and capsule machine), on the quality and safety of the final product, as shown in Figure 1. Therefore, the effect of these four coffee preparation methods was evaluated for the content of eight biogenic amines (serotonin, histamine, spermidine, putrescine, tyramine, cadaverine, and β-phenylethylamine), the total polyphenol (TPC) and flavonoid (TFC) content, and the anti-radical capacity (ABTS and DPPH assay). For both coffee powders and the infusions obtained from them by the different extraction techniques, the quantitative determination of BA was carried out by HPLC-FD, while for TPC, TFC, and the DPPH and ABTS assays were performed by means of UV-Vis spectrophotometric analysis. Indeed, univariate, and multivariate statistical analysis was performed on the spectrophotometric and chromatographic results of coffee powder and coffee beverages. Furthermore, concerning the influence that different brewing techniques have on the final coffee beverage and packaging, an analysis of the environmental impacts could be of relevance for an all-encompassing quality and sustainability assessment. Over the latest ten years, several studies have been carried out to assess the environmental performances of the coffee production process and packing stages. Brommer et al. (2011) estimated GHGs emissions associated with the preparation of 2000 cups of coffee based on a cradle-to-gate approach, thus highlighting coffee cultivation as the most impactful phase responsible for 55.4% of total GHGs emissions, followed by post-consumer phases (36%), and coffee packaging, and distribution (6.6%) [17]. Concerning the packaging of different brewing methods, Dubois et al. (2011) observed the environmental burdens associated with 40-mL Nespresso capsules based on the different types of packaging materials (i.e., polypropylene or PP, polyethylene or PE, polyethylene terephthalate or PET, Aluminium or Al, and PE-Al-PET multi-layer bags). They highlighted that the most impactful materials derived from the waste disposal of PE capsules in landfill are due to direct CH4 emissions associated with the degradation of starch [18].
The results of the above-mentioned studies were only slightly comparable since they differ in several factors (such as coffee varieties, coffee beverage volume from 40 to 237 mL, etc). Besides, with coffee brewing methods, the method-energy efficiency significantly affects the overall environmental impacts associated with a single-use phase.
In this regard, the environmental sustainability of different coffee brewing methods analyzed in the study was evaluated through the application of Life Cycle Assessment methodology (ISO 14000:2006) using the software SimaPro v. 9.2.2. The LCA analyses focused on a gate-to-gate approach, thus allowing the comparison of coffee brewing methods based in detail on the preparation technique, its energy-demand, and packaging materials.
2. Materials and Methods
2.1. Chemicals
2-phenylethylamine (B-Pea), Putrescine (Put), Cadaverine (Cad), Histamine (His), Tyramine (Tyr), Spermine (Spm), Spermidine (Spd), and Serotonin (Ser) were purchased from Supelco (Bellefonte, PA, USA), as well as the derivatizing agent (Dansyl-Chloride, DSN-CL), sodium bicarbonate (NaHCO3), ammonium hydroxide (NH4OH) and sodium hydroxide (NaOH). Folin-Ciocalteu reagent, sodium carbonate (Na2CO3), 2,2-Diphenyl-1-picrylhydrazyl (DPPH), 2,2’-azino-bis (ABTS), sodium nitrite (NaNO2) and aluminum chloride (AlCl3). In addition, the following solvents were purchased from Sigma-Aldrich (St. Louis, MO, USA): acetone (C3H6O), perchloric acid (HClO4), acetonitrile; ACN (CH3CN), methanol (CH₃OH) and double-distilled water (d-H2O).
2.2. Instruments
The following instruments were used for the analysis: Bandelin Sonorex RK100H water and ultrasonic thermostatic bath, IKA T18 digital Ultra–Turrax (IKA-group, Saufen, Germany), and Whatman 0.45 µm 100 (PTFE) syringe filters (Sigma Aldrich, Milan, Italy), UV-Vis spectrophotometer (Jenway, Stone, UK), NEYA 10R refrigerate centrifuge (Exacta Optech, Modena, Italy). The chromatographic analysis of biogenic amines was performed using an ATVP LC-10 HPV binary pump with an RF-10° XL fluorimetric (FD) detector (Shimadzu, Kyoto, Japan) operating to λ emission = 320 nm, and λ excitation = 523 nm. A Supelcosil LC-18 column (250 mm × 4.6 mm, 5 µm) with a Supelguard LC-18 (Supelco, Bellefonte, PA, USA) pre-column was used for the determination of BAs.
2.3. Sampling
Eight coffee powders and brewed beverages from two different brands belonging to the 100% Arabica variety (country of origin Brazil) were analysed. For each brand, n = 2 coffee powders for domestic use (Moka), n = 2 coffee powders for professional use (Bar), n = 2 coffee powders for the capsule brewing method, and n = 2 coffee powders for the pod brewing method were considered, as shown in Figure 1. All types of coffee powder packaged for the above-mentioned coffee brewing methods refer to the same brand. The samples were purchased from local retailers in the city of Rome, Italy. The coffee packages were opened just before analysis to avoid and limit oxidative damage. Extracts (coffee beverages) were obtained in triplicate for each type of coffee powder and stored at T = +4 °C until the day of analysis. Different extraction methods were used for the analyses: Moka coffee machine (model Bialetti, Omegna, Italy), capsule machine (model Krups Nespresso INISSIA XN100, Naples, Italy), pod machine (model De’Longhi Dedica EC685.W, Treviso, Italy), and professional espresso machine (model Faema Hot Steam, Milan, Italy). For each type of extraction, the amount of coffee required for the specific machine was used with a known amount of demineralized water. The extraction conditions are shown in Table 1.
For espresso coffee preparation by the traditional method, the professional coffee machine was used. After weighing 7 g of coffee powder for catering use, i.e., the quantity required for the filter holder of the machine, the coffee was pressed into the filter. While, the single-serving Moka was prepared by weighing 5 g of coffee powder for domestic use, without pressing it into the filter, and 25 mL of water, relative to the volume of the machine’s boiler. The capsule coffee was extracted by placing the capsule, containing weighted amounts of coffee powders, and sealed in a protective atmosphere (5 ± 0.5 g), into the machine with a compatible capsule system. Each capsule was used only once and then disposed of. For coffee pods, another machine specifically for this product was used, the pods consisted of pre-packaged coffee (7 ± 0.5 g) and hermetically sealed between two sheets of filter paper. In both methods, the volume of water used was approximately 20 mL. The samples obtained by the different extraction methods were stored at refrigerated temperatures (T = 4 ± 2 °C) until analysis.
2.4. Determination of Biogenic Amines
Biogenic amine extraction in coffee powder samples was performed according to the method previously described by Vinci et al. (2021) [19] with some modifications. 1 g of coffee powder was weighed and placed in a centrifuge tube, then 10 mL of 0.6 M HClO4 was added and homogenized in an ultrasonic bath for 10 min at 400 Hz at room temperature. Then, after centrifugation (3000 rpm for 10 min), the supernatant was stored in an amber vial. For the coffee beverage samples, the extraction was performed according to the method of Vinci et al., 2021 [19], with some modifications. Briefly, 1 mL of sample was placed in a 10 mL amber flask then acidified by adding 0.6 mL of 10.3 M HClO4 to obtain a final concentration of 0.6 M and made up to volume with distilled H2O. The extracts thus obtained for coffee powders and coffee infusions were stored at a temperature of 4 ± 2 °C.
Following BA extraction in coffee powders and coffee beverages, the samples were then derivatized by adding 200 µL NaOH 2 N and 300 µL saturated NaHCO3 solution to 1 mL of acid extract. Subsequently, 2 mL of DNS-Cl at a concentration of 2 mg/mL in acetone is added. The sample was placed in the dark for one hour at 45 °C in the ultrasonic bath (Bandelin Sonorex RK100H). Subsequently, the solutions were made up to a volume of 5 mL with acetonitrile (ACN) and filtered through 0.45 µm FPTE syringe filters. Biogenic amines were detected by HPLC-FD following the standardized method defined by ISO 19343:2017, with some modifications [20]. Analytes were eluted using Supelcosil LC-10 column (250 × 4.6 mm; 5 µm) in reverse phase with Supelguard LC-18 pre-column (Supelco), coupled with fluorimetric detector (λ excitation = 320 nm; λ emission = 523 nm). The flow rate was set at 1.2 mL/min, while the column temperature was set at 30 °C. The elution program starts with 3 min of isocratic elution (50% ACN; 50% water) reaching 100% of ACN after 18 min to finish after 3 min of isocratic elution. After that, the start isocratic condition (50% ACN; 50% water) was restored. The results were obtained through a calibration curve ranging from 0.1 to 25 mg/L for each BA. Based on BA results, the Biogenic Amines Quality Index (BAQI) was calculated to assess the coffee samples’ quality. For BAQI values < 10, the product can be considered safe [21]. It was calculated as follows and expressed in µg/g of coffee powder:
2.5. Polyphenol, Flavonoid, and Antioxidant Activity Determination
A hydroalcoholic extraction was performed on the coffee powder samples and their infusions. The hydroalcoholic extraction procedure in the coffee powder samples was as follows: 0.1 g of coffee powder was weighed, to which 5 mL of MeOH:H2O (60:40, v/v) was added [22]. The solutions were centrifuged at 3000 rpm for 10 min at room temperature and the supernatant was collected in a 10 mL volumetric flask. A second extraction was performed on the supernatant as described above. For the coffee infusions, the extraction was performed by placing 1 mL of sample in a 50 mL volumetric flask and making up to volume with MeOH:H2O (60:40, v/v). Extractions were performed on the day the infusions were prepared and all extracts were stored at 4 ± 2 °C.
2.5.1. Total Polyphenols Content
The total polyphenols content (TPC) was assessed for both hydroalcoholic extracts of coffee powder and coffee infusions according to the method described by Vinci et al. (2022) [22] with some modifications. 0.5 mL of the hydroalcoholic extract was mixed with 0.25 mL of Folin Ciocâlteu reagent in a 10 mL amber volumetric flask. After 3 min, 0.5 mL of aqueous sodium carbonate solution (7.5% w/v) was added and the flask was kept in the dark for 30 min. It was then made up to volume with distilled water. The absorbance of the samples was read at 750 nm. The results were expressed as milligrams of gallic acid equivalents per gram of coffee powder (mg GAE/g coffee powder). The results were obtained through a calibration curve ranging from 10 to 100 mg/L (R2 = 0.9998) and the blank was the solvent used for sample extraction.
2.5.2. Determination of Total Flavonoid Content
The total flavonoid content (TFC) was evaluated in all powdered and infused coffee extracts. The TFC was determined according to the method described by Abdel-Naeem et al. (2021), with some modifications [23]. To 0.5 mL of extract, 2 mL of distilled water and 150 µL of NaNO2 (5% w/v) were added to a 5 mL volumetric flask. The solution was stirred and incubated in the dark for 5 min, then 150 µL of AlCl3 (10% w/v) was added and the solution was put back in the dark for 5 min. Next, 2 mL of NaOH (1 M) was added to the solution and left in the dark for a further 15 min. Subsequently, 5 mL was made up to a volume of 5 mL. The absorbance of the extracts was read at 510 nm. TFC results were expressed as milligrams of rutin equivalents (Rut) per gram of coffee powder (mg Rut/g coffee powder). As the TPC assay, the TFC blank corresponds to the solvent used for the extraction of polyphenols from coffee samples.
2.5.3. Determination of Antioxidant Activity
The antioxidant activity of coffee powders and infusion extracts was evaluated by using two different reagents: ABTS and DPPH [24,25]. The scavenging activity of the ABTS radical in the samples was evaluated by measuring the decrease in absorbance at 734 nm. A 7 mM solution of ABTS was prepared by dissolving 0.19 g of ABTS powder in 50 mL of distilled water, while the PBS solution was prepared by dissolving 0.38 g of PBS powder in 10 mL of d-H2O. 25 mL of 7 mM ABTS and 0.4 mL of PBS (1.9 mg/mL) were placed in an amber flask. The solution was kept in the dark for 16 h at room temperature to activate the reagent. 3.6 mL of the reagent was added to 0.4 mL of hydroalcoholic extract, and the sample with the reagent was placed in the dark for 15 min and then read on the UV-Vis spectrophotometer. The scavenging activity of coffee samples was also assessed for both types of extracts by DPPH assay. A 2.5 ng/mL DPPH solution was prepared by dissolving 125 mg of standard powder in 50 mL of methanol. To 1 mL of hydroalcoholic extract, 1.5 mL of DPPH solution (2.5 ng/mL) was added and kept in the dark for 30 min at room temperature. The absorbance (λ = 517 nm) was then measured against methanol using a UV-Vis spectrophotometer. The results were calculated using the inhibition rate (I%) of the radical cation for both assays, according to the following equation:
where A0 is the absorbance of the control (blank) and A1 is the absorbance of the DPPH or ABTS radical in the extract.
I% = (A0 − A1)/A0
2.6. Life Cycle Assessment (LCA)
Following standards ISO 14040:2006 and ISO 14044:2006, Life Cycle Assessment (LCA) is considered a standardized and valuable tool for environmental impact assessment, and it should involve four phases [26,27]: (1) Goal and scope definition, describing the objective of the study, the functional unit (FU) and the system boundary; (2) Life Cycle Inventory (LCI), collecting the input data for the environmental assessment of a product, process, or activity; (3) Life Cycle Impact Assessment (LCIA), which is aimed at evaluating sustainability in terms of impacts on the environment, human health, and resources; and (4) Interpretation of results, in which LCIA results are interpreted according to the objectives and scope definition. SimaPro 9.2.2., software was used for the evaluation of environmental impacts.
2.6.1. Goal and Scope Definition
The study was aimed at assessing the environmental performances of different brewing methods (Moka, espresso bar, espresso pods, and capsules) for coffee beverages, by taking into account operational conditions in terms of time, temperature, coffee powder, water consumption, and packaging materials. The functional unit (FU) is a 40-mL cup of espresso coffee with no additional ingredients (i.e., milk, sugar, etc.) and by the Italian Coffee Committee’s disciplinaries [28]. The system boundaries are referred to as a gate-to-gate approach. In this regard, the life cycle included the use of the aforementioned coffee machines, considering their operational conditions (in terms of electricity usage), roasted and ground coffee, water use, and primary packaging materials used (i.e., paper filters, low-density polyethylene, polypropylene, etc.). Nevertheless, the system boundaries did note GHGs emissions arising from the capital goods production, such as coffee machines, as well as their maintenance and disposal due to: i. lack of data, ii. the exclusion of operating goods in previous LCA studies on coffee brewing methods [17,28,29] and, iii. the assumption that these inputs could be considered negligible because of their minor contribution to a single cup of espresso coffee. Therefore, the coffee production chain (cultivation, transportation of coffee beans, as well as coffee roasting and grounding) was excluded from the study, since it was assumed to be the same for the coffee beverages obtained from the different brewing systems analyzed [28,29]. Waste disposal of both spent coffee grounds, and all packaging materials used, were excluded from the study.
2.6.2. Life Cycle Inventory (LCI)
The input data concerning the preparation of a 40-mL cup of coffee beverage (FU) are shown in Table 2.
The primary data were provided by a coffee company, located in Rome (Lazio, RM, Italy), and referred to roasted and ground coffee, as well as primary packaging materials. The secondary data for electric coffee machines usage were extracted from the Ecoinvent v3.8 database, provided by SimaPro 9.2.2. software [30].
2.7. Statistic Analysis
The data were obtained from the analysis of three replicates and were expressed as mean ± standard deviation. The normality of the data distribution was checked using the Shapiro–Wilk test, the homogeneity of variances using Levene’s test, and the significance of differences between the extracts was tested using one-way analysis of variance (ANOVA) with p < 0.05. After ANOVA, multiple comparison tests were performed for statistically significant variables, using Dann’s post hoc test (homogeneity of variance was assumed) at the level of p < 0.05. Following the characterization of the coffee samples with different brewing methods, a multivariate analysis was carried out to interpret the results using principal component analysis (PCA). The data were pre-treated (autoscaling) to exclude variance related to the different units of measurement of the analyses performed. Analyses were performed using CAT software.
3. Results and Discussion
3.1. Biogenic Amiens Content in Coffee Samples
The BA content in coffee powder and beverage samples is shown in Table 3. The differences in BA concentrations in the ground and respective brewed samples could be associated with some factors involved in the extraction mechanisms (water/coffee ratio, temperature, pressure, brewing time, etc.), but also with the particle size of coffee powder [31,32]. During the coffee extraction phase, water can extract the soluble compounds from the coffee powder [1,11]. Furthermore, through the pressure generated by water on the sample, less soluble or physically bound compounds are extracted by physical mechanisms. Another aspect to be considered is the extraction temperature, which can lead to the degradation of thermolabile compounds and help the emulsification of fats in the final extract. Therefore, to make the data as comparable as possible, we eliminated the granulation effect by choosing coffee powders with the same degree of grinding. In addition, similar extraction parameters were selected, always bearing in mind the peculiarities of each infused coffee preparation technique [1].
The total BA amounts in the coffee powder samples ranged between 67.01 µg/g of coffee powder and 96.83 µg/g of coffee powder, thus in line with the results found in the literature [33,34]. These BA concentration differences in coffee powder samples could be related to the different agronomic techniques and the different transformation processes that coffee beans undergo along the supply chain. Furthermore, it has been shown that the presence of high BA concentrations in food may also be related to product storage and shelf-life [1]. Among all the BAs considered, only Cad and Put were not found in the samples. In coffee powder samples, the BAs present the highest concentrations are Ser (62.13–84.24 µg/g of coffee powder), followed by β-Pea (2.22–11.93 µg/g of coffee powder) and His (2.22–7.30 µg/g of coffee powder), with a large degree of variability depending on the sample considered.
The data showed that in the coffee beverages obtained by the different extraction methods, the profile of biogenic amines reflected the coffee powder samples, except for Put, which was only found in the sample obtained with the professional espresso machine (Bar 1 and 2). In all coffee beverages, there was a reduction in the biogenic amine content varying between 50 and 77%. This is probably because ABs at high temperatures tend to degrade; therefore, the extraction process may influence the concentration of BAs in the final extract. The total content of biogenic amines for the different beverage extraction techniques varies between 16.02 and 5.15 µg/g of coffee powder. In coffee beverages, the most represented amine is serotonin (12.75–33.46 µg/g of coffee powder), followed by histamine (0.22–20.57 µg/g of coffee powder). The concentration in the infusions obtained with a professional espresso machine and Moka coffee machine is higher than in ground coffee, probably due to the time/temperature and extraction pressure [1]. However, the Biogenic Amines Quality Index (BAQI) showed that AB concentrations do not pose a health risk to the consumer. Furthermore, the histamine content in coffee beverages was found to be below alert levels defined by Regulation (EU) 2073/2005 [35].
3.2. Total Polyphenol Content
The Folin-Ciocâlteu assay was used to determine the total content of polyphenols (TPC) in coffee and respective brews obtained from the different extraction processes (Moka, professional espresso, espresso pods, and espresso capsules). The TPC expressed as mg gallic acid equivalent (GAE) per g of coffee powder is shown in Table 4.
The highest TPC was found in capsule coffee preparations (28.46–29.61 mg GAE/g of coffee powder), this trend, however, was not maintained by the infusion processes. The coffee infusions that presented a higher concentration of total polyphenols in the final extract were the samples obtained with the Moka machine (2.71–3.52 mg GAE/g of coffee powder) and the professional bar machine (1.51–1.72 mg GAE/g of coffee powder). This is probably due to the longer contact time between water and ground coffee and the higher extraction temperatures. The water volume and the coffee powder amount ratio used has been highlighted as limiting factor for the extraction of TPC from coffee for all types of extraction techniques; in addition, other factors that could influence the extraction of polyphenols from coffee in the different extraction methods are temperature, contact time between water and coffee powder, pressure and powder size [16,31,32,33].
3.3. Total Flavonoid Content
The results of the total flavonoid content (TFC) are shown in Table 5. In coffee powder samples, the TFC varied between 82.33 ± 0.84 and 113 ± 1.05 mg RUT/g of coffee powder. The samples with the highest TFC content were capsule coffee powder (99.40–113.69 mg RUT/g of coffee powder) and Moka coffee powder (93.64–97.67 mg RUT/g of coffee powder). After infusion, there was a reduction in the total flavonoid content in all infused coffee samples. However, the best method of preparation of the infused coffee was the use of the Moka technique (8.55–8.60 mg RUT/g of coffee powder) [31,32]. Furthermore, the variability in flavonoid concentration in coffee beverage samples may be related to time, extraction temperature, and the ratio of water to the coffee powder, as pointed out by Uslu (2021) [36].
3.4. Determination of Antioxidant Activity
To assess the antioxidant activity of the coffee samples examined, two antiradical assays were performed: ABTS and DPPH. The ABTS assay showed that for the coffee powder samples and the extracts obtained from them, the extraction process did not affect the antiradical activity of coffee (Table 6).
The ABTS assay was characterized by high antiradical activity for both ground coffee (96–99% of Inhibition) and coffee infusions (97–99% of Inhibition), in agreement with the literature studies [32,36]. Concerning the DPPH assay, the results obtained showed a difference in radical inhibition between the ground coffee samples and the respective infusions (Table 6). Among the coffee powder samples, the Moka samples were found to have a higher antioxidant capacity of about 65% DPPH radical inhibition for both samples, followed by the ground coffees for professional brewing (60.89–61.09% of Inhibition).
However, the extracts obtained with the different infusion methods showed a lower scavenging capacity towards the DPPH radical, probably due to the influence of the extraction factors on the antioxidant compounds [36,37]. Furthermore, the results obtained showed a difference in the antiradical activity within the ABTS and DPPH assays, and this is probably due to the different target molecules of the two reagents [38,39]. In particular, ABTS is mainly oxidized by peroxyl radicals and it is soluble in both aqueous and organic solvents, so can be used to determine both the hydrophilic and lipophilic antioxidant capacity (AOC) of extracts [40]. Therefore, it could be worth noting the strong scavenging abilities of both coffee powders and coffee brews against ABTS radicals.
3.5. Statistics Analysis
The data obtained from the biogenic amines analysis and the spectrophotometric assays for the determination of polyphenols, flavonoids, and scavenging activities were analyzed by univariate and multivariate analysis. The Pearson correlation between the eight biogenic amines analyzed and the spectrophotometric assays (TPC; TFC; ABTS and DPPH) was evaluated (Table 7).
The results showed that there was a strong positive correlation (r > 0.900; p > 0.05) between the total polyphenol content, the total flavonoid content, and the DPPH antioxidant assay. Regarding BA concentration, the analysis showed that serotonin, β-phenylethylamine, and putrescine are positively correlated (r > 0.678; p < 0.05) with total polyphenol content, total flavonoid content, and scavenging activity towards the DPPH radical. Spermidine is positively correlated (r > 0.607; p < 0.05) to the DPPH antioxidant assay. Furthermore, β-Pea correlated positively with Ser (r = 0.809; p > 0.05), while Put and Spd positively correlated with both serotonin and β-Pea content (r > 0.667; p > 0.05).
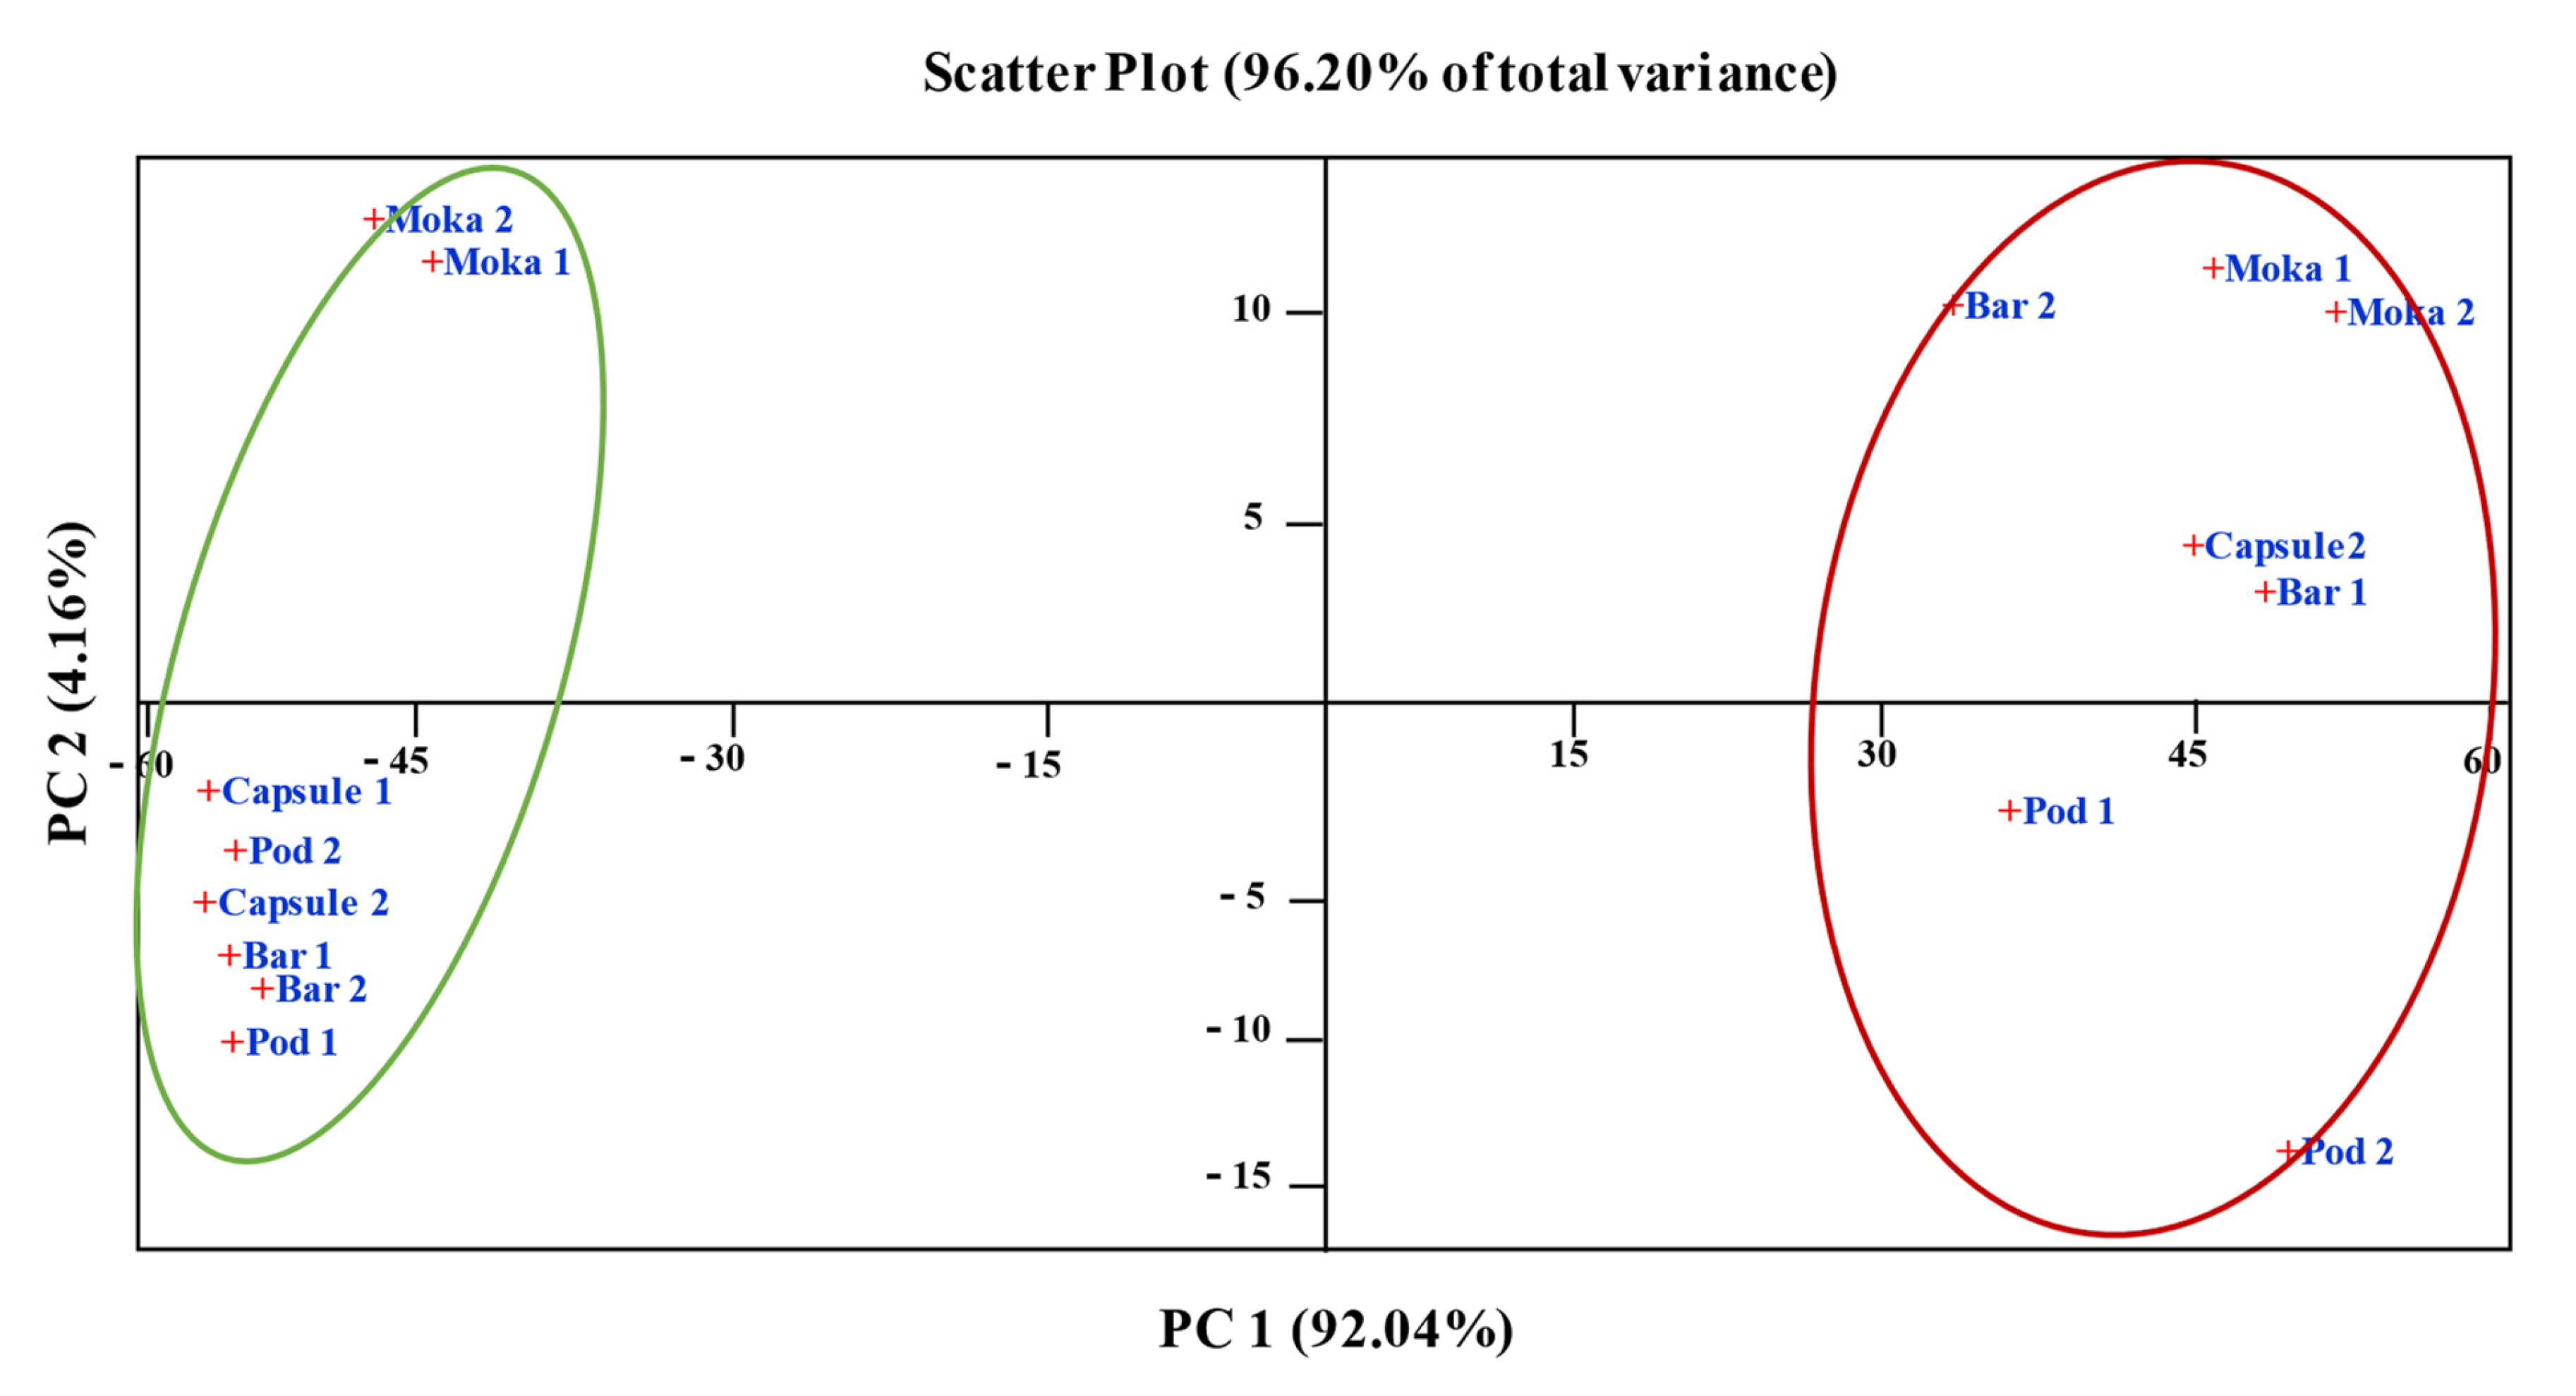
In addition, an exploratory analysis using Principal Component Analysis (PCA) was performed on the data obtained from the analyses of the spectrophotometric assays and the biogenic amine content. Firstly, PCA was performed considering all the results obtained from the analyses (Figure 2).
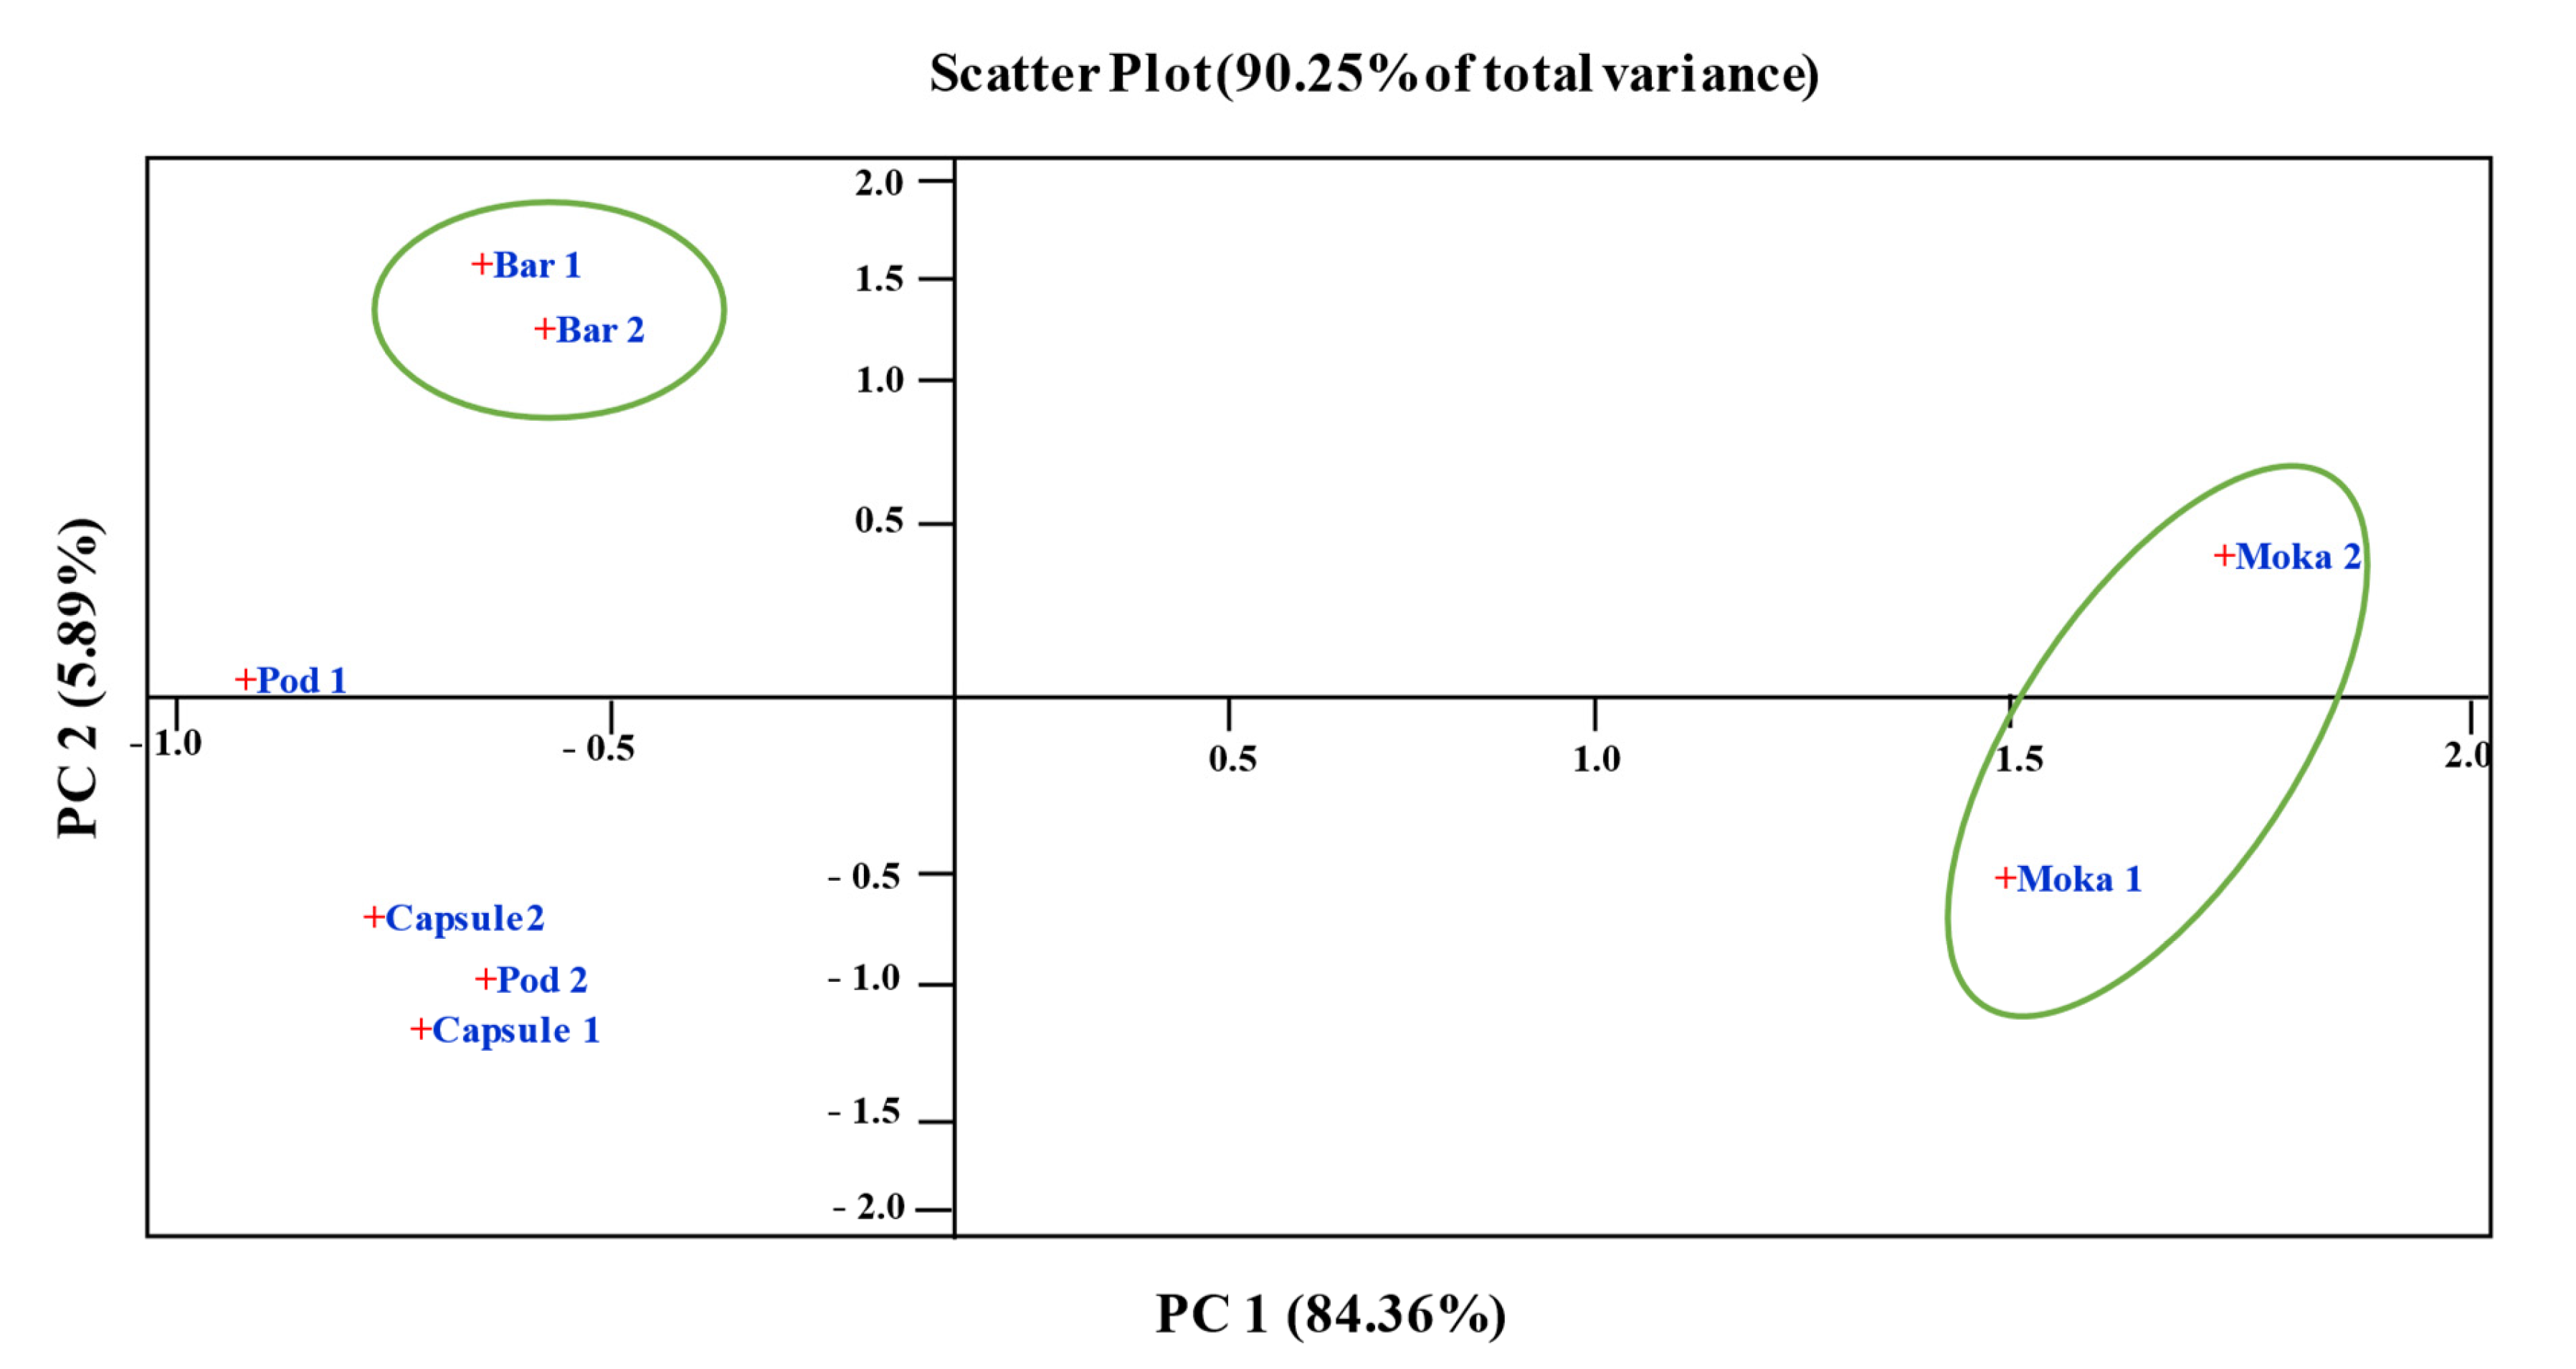
Considering this exploratory investigation, it was found that the first two principal components explain approximately 96% of the variance. Furthermore, from the Scatter Plot between Principal Component 1 (PC1) and Principal Component 2 (PC2), two groupings along the x-axis (PC1) were formed between the ground coffee and infused coffee samples. Loadings analysis showed that the variables that weigh positively on Principal Component 1 are total polyphenol content and total flavonoid content, followed by serotonin, whereas the variables that weigh positively on PC2 are serotonin concentration and histamine concentration followed by β-phenylethylamine. The variables that weigh negatively on PC2 are TFC and TPC. The Scatter plot also shows a separation along the PC2 component for the Moka-infused coffee samples; therefore, to better assess how the variables affected the Moka-infused coffee samples, the principal component analysis was performed for these samples only (Figure 3). The total variance explained by the two principal components in this second PCA analysis was around 90%. It was also shown that the coffee beverage samples were separated according to the extraction procedure. Therefore, it can be concluded that the multivariate principal component analysis showed a difference between the ground and infused coffee samples and that even with a small number of samples, clustering between the infused coffee samples is evident for the variables studied [41,42].
3.6. Life Cycle Assessment Impact Assessment of Coffee Brewing Methods
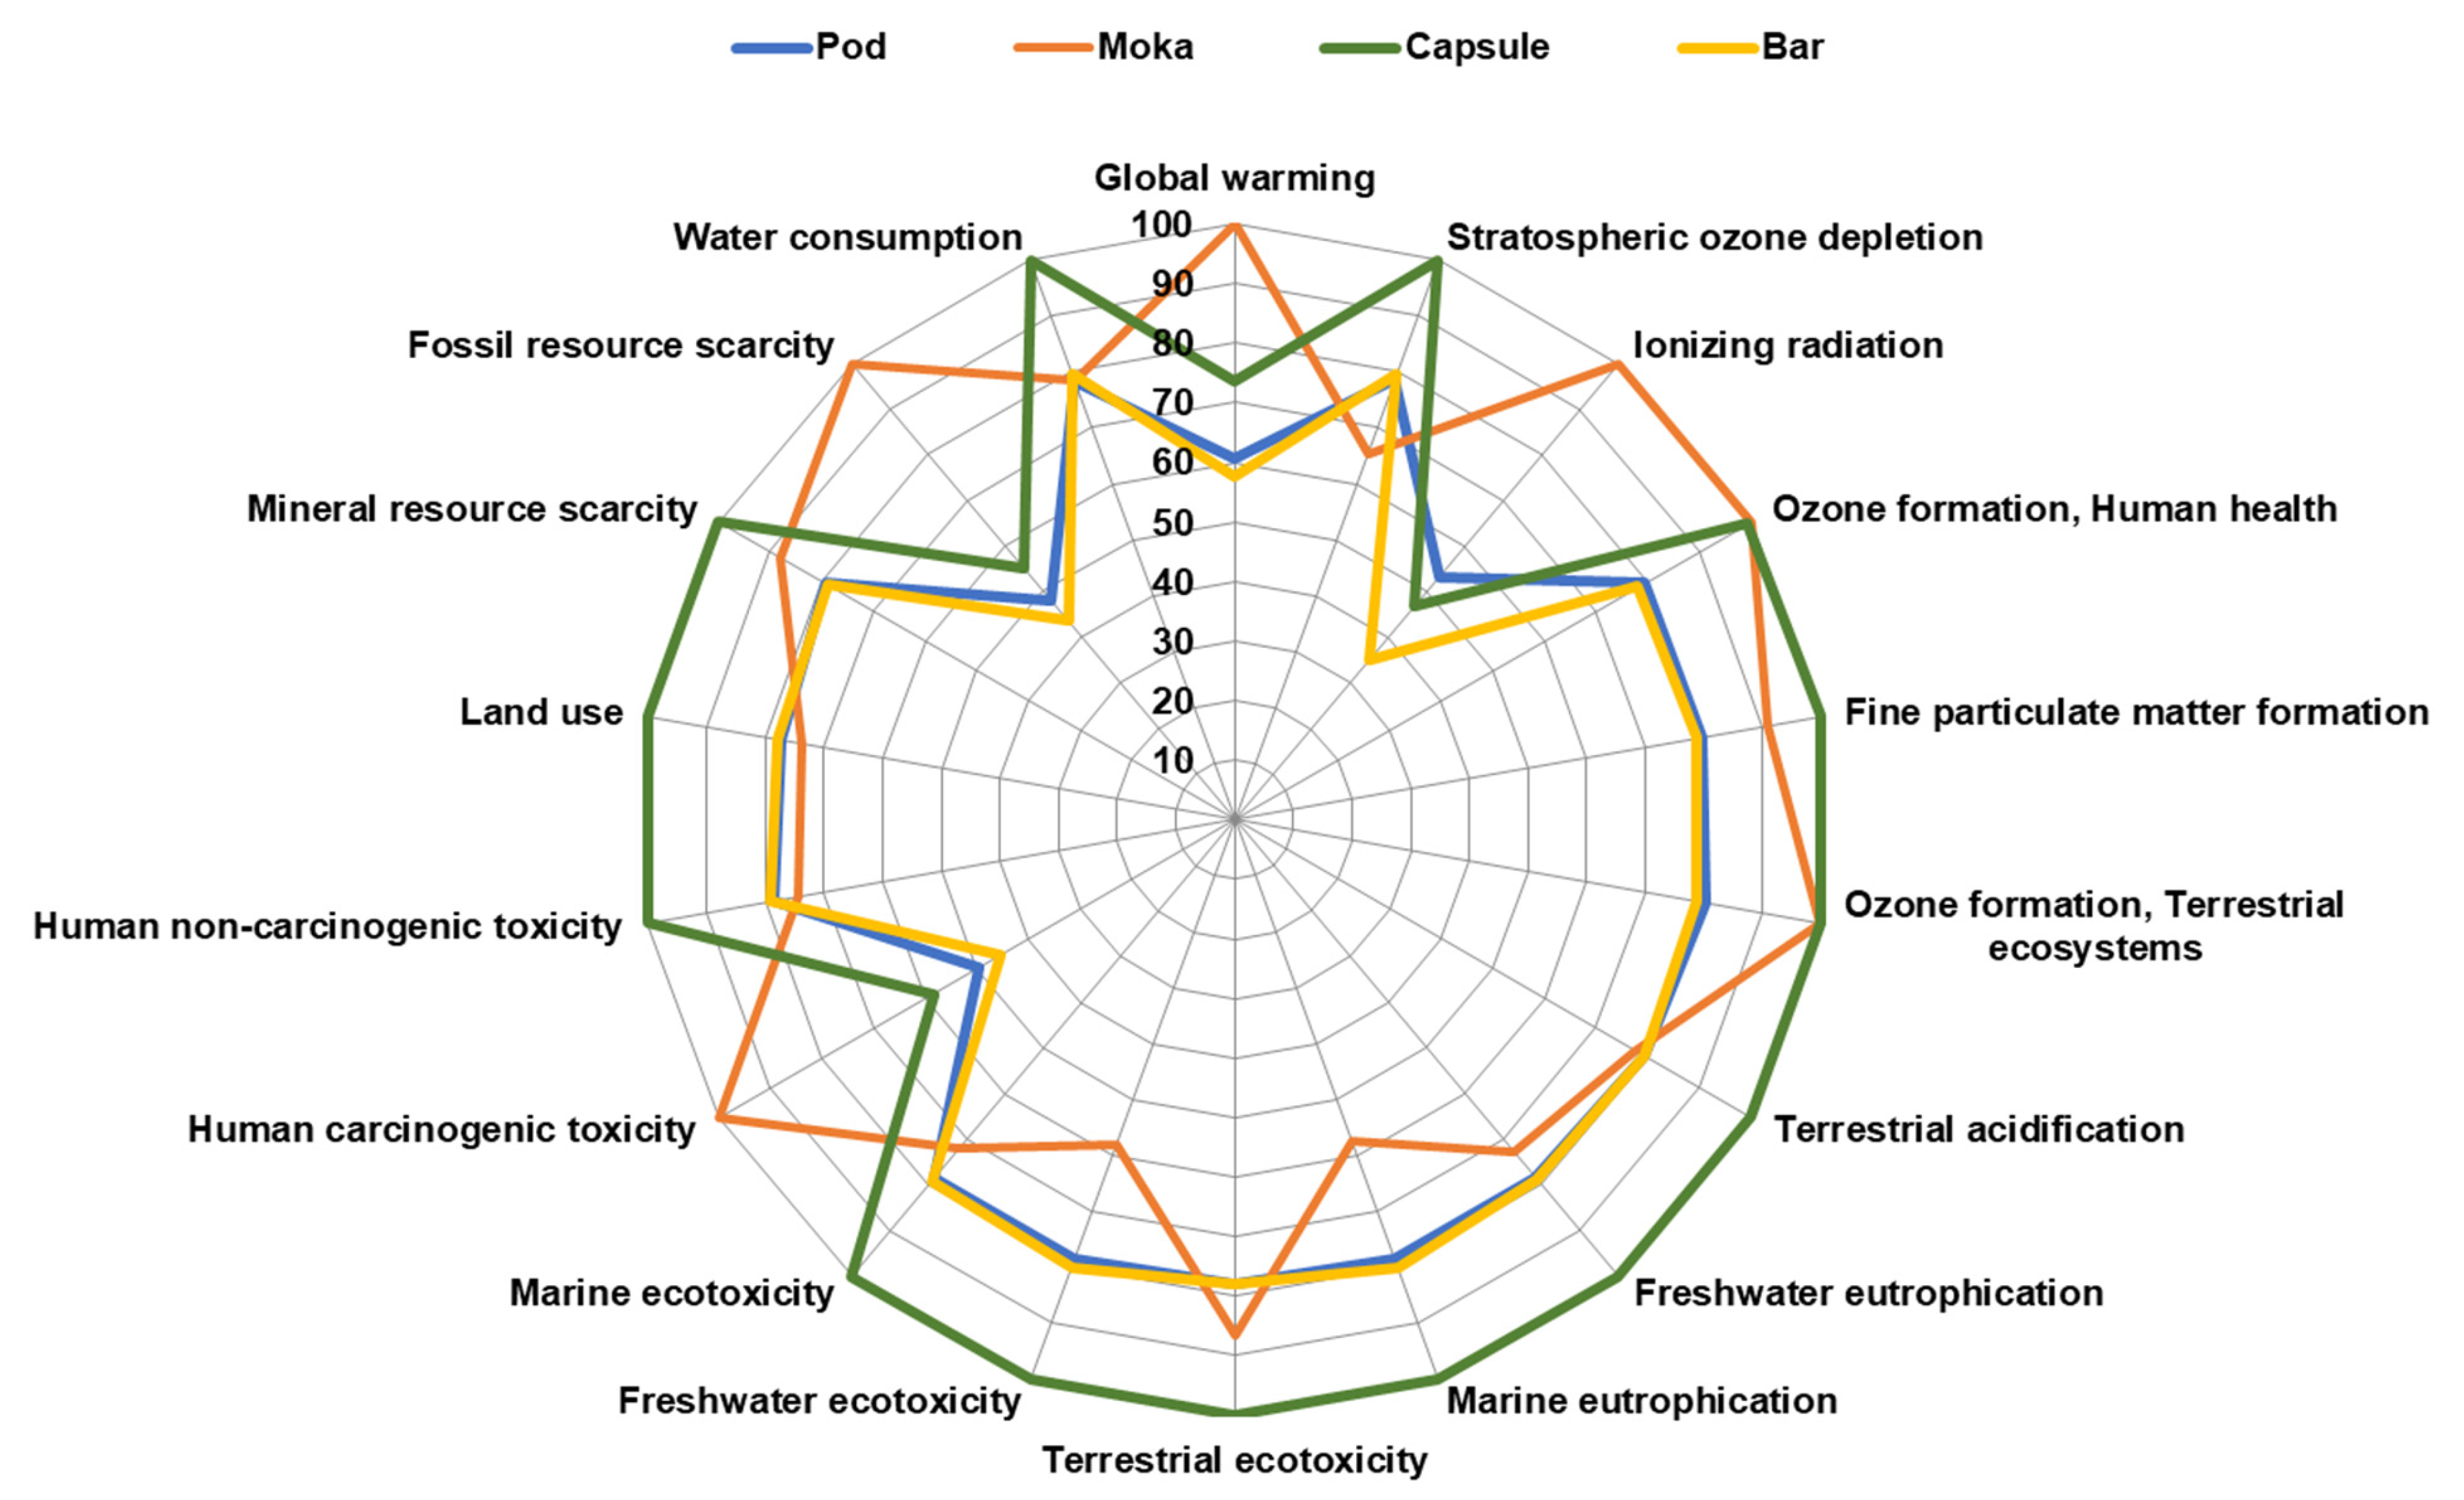
The LCA analysis was conducted to assess the environmental impact of the four different coffee preparation methods examined (Moka, industrial coffee machine, capsule machine, and pod machine). The analysis was carried out by applying the global ReCiPe Midpoint (H) method, which considers 18 different impact categories [43]. The data obtained showed that the method with the highest weighting on almost all 18 impact categories is the capsule method. Table 8 showed LCA results obtained for the coffee brewing methods analyzed in the study. The results of LCA comparison among the four coffee brewing methods (Moka, bar, capsule, and pod) analyzed in this study, revealed a variation depending on the preparation method used by the consumer. A remarkable difference among coffee brewing methods was recorded for five impact categories: Global Warming, Terrestrial Ecotoxicity, Human Non-Carcinogenic Toxicity, Land Use, and Fossil Resource Scarcity.
The capsule was the coffee brewing method that weighs the most on 14 out of 18 impact categories considered. It heavily impacts Terrestrial Ecotoxicity (4.21 × 10⁻¹ kg 1.4-DCB), Human non-carcinogenic toxicity (1.12 × 10⁻¹ kg 1.4-DCB), and Land Use (1.35 × 10⁻¹ m2a crop eq). This could probably be related to the release of heavy metals into soil, air, and water mainly related to the primary packaging of the brewing method; in particular, aluminum (Al) used for capsules had a key role in human and environmental ecotoxicity. As stated by different authors [44,45], the environment may be contaminated by Al mainly from anthropogenic sources and through the weathering of rocks and minerals. Several chemical compounds with Al (i.e., Al nitrate, Al phosphate, Al sulfate, etc.) are widely used in various products and processes associated with human activities, such as for the manufacturing of cooking utensils and foils, as well as layers for capsule production. However, for some impact categories, the capsule has less impact than the other brewing methods considered. It was found that Global Warming (1.38 × 10⁻¹ kg CO2 eq), it has a lower impact than Moka by about 9%, Ionizing radiation by 23%, Human carcinogenic toxicity by 16%, and Fossil resource scarcity by 18%.
Furthermore, the type of primary packaging used for storing the coffee also plays a decisive role in Moka coffee beverage, thus resulting in a higher impact for the categories Terrestrial and Freshwater Ecotoxicity (3.64 × 10⁻¹ kg 1.4-DCB; 2.99 × 10⁻³ kg 1.4-DCB, respectively) [46].
Characterized results obtained with the ReCiPe Midpoint method for the coffee brewing methods impact assessment are shown in Figure 4. In addition, Moka coffee beverage resulted in the highest value for Fossil Resource Scarcity (4.94 × 10⁻² kg oil eq), thus representing 40% of the total impact generated by all coffee brewing methods considered for this impact category. This could be attributable to the differences in energy consumption of the respective preparation techniques [17]. The Moka method requires higher electricity consumption, which is based on the use of fossil fuels, thus being responsible for the direct emission of greenhouse gases such as CO2 and N2O, which inevitably affect Global Warming, as well as Fine Particulate Matter Formation [46,47].
Meanwhile, the preparation method with the lowest environmental impact is the industrial machine and this is probably related to less time spent on coffee preparation and reduced packaging of the raw material, as it is packaged in 3–5 kg LDPE bags, which are then collected as organic waste [28,29]. The study found that the concentration of coffee powder used, as well as the ratio of packaging mass to the volume of the beverage prepared, has a significant effect on the environmental impact of coffee preparation methods.
Cibelli et al. (2021) highlighted a greater amount of GHGs emissions associated with a multi-layer packing bag (i.e., Al-PP-PE) as well as post-consumer wastes, for espresso coffee machines than for capsule or pod coffee machines [28].
4. Conclusions
In recent years, the market for nourishing foods and beverages has become increasingly diversified in response to structural changes in consumer demand, which calls for increased attention to the health-promoting effects, the preservation of the environment, and the socio-economic well-being of small producers. As the brewing method can be considered the main contributing factor for the coffee beverage chemical-nutritional composition, this study demonstrated that bioactive compound content (polyphenols, antioxidants, and BAs) greatly depends on the brew preparation technique adopted. Coffee powders used directly for professional espresso machines, and Moka, and coffee powders packaged for pods and capsules, and subsequently extracted by different brewing methods were considered. All four different coffee beverages obtained were then compared with the corresponding non-extracted coffee powders.
Analyses of coffee powders showed total BA concentration ranging from 67.01 µg/g to 96.83, thus highlighting a decrease of 39% in coffee beverages (16.02–53.92 µg/g). Among all BAs, Serotonin was the prevailing amine in both ground coffee samples (62.13–84.24 µg/g) and coffee beverage samples (12.75–33.46 µg/g). β-Pea, Put, His, Spd, and Spm were found in wide variations of concentration observed depending on the coffee brewing method. When considering coffee brews, phenolic compounds (polyphenols, flavonoids, antioxidants) are the class of bioactive compounds most abundant in coffee, which undergo significant variation during coffee beverage preparation. It was found that the total polyphenol content was higher in the starting ground coffee powders (22.96–29.61 mg GAE/g) and decreased significantly in coffee beverages, between 80% and 90%, depending on the different beverage preparation methods. The same trend was found for the TFC assay, thus observing in ground coffee samples a flavonoid content approximately 15 times higher than coffee beverages samples.
The overall reduction of bioactive compounds in coffee beverages could probably be due to the high brewing temperatures and pressures, which lead to the degradation of these compounds; in addition, the water/coffee contact surface and the particle size of the coffee powder may affect the extractant capacity of biogenic amines and phenolic compounds [1,5]. Furthermore, using multivariate analysis, it was possible to show that the variables considered allowed the samples to be grouped into ground coffee and coffee beverages and that they were heavily influenced based on the brewing method adopted.
The application of LCA methodology allowed the sustainability assessment of coffee brewing methods, thus highlighting lower environmental impact for the industrial coffee machine compared to the capsule brewing method, which showed the highest environmental burden in 14 out of 18 impact categories analyzed. However, the LCA study presents limitations, since the coffee cultivation and production stages were not considered for the sustainability assessment, in a cradle-to-grave approach. For this reason, future studies will have to expand the boundaries of the system, also considering the disposal and reuse of processing by-products. In addition, different coffee preparation techniques (e.g., Turkish, French, American brewing techniques, etc.) can be compared to highlight the most efficient one in terms of both the quality and sustainability of the final coffee beverage.
Author Contributions
Conceptualization, G.V. and L.G.; methodology, L.M. and S.A.P.; software, L.M. and S.A.P.; validation, G.V. and L.G.; formal analysis, L.M. and S.A.P.; investigation, G.V., L.M. and S.A.P.; resources, L.G. and G.V.; data curation, G.V., L.M. and S.A.P.; writing—original draft preparation, L.M. and S.A.P.; writing—review and editing, G.V. and L.G.; visualization, G.V., L.G., L.M. and S.A.P.; supervision, G.V. and L.G.; project administration, L.G.; funding acquisition, G.V. and L.G. All authors have read and agreed to the published version of the manuscript.
Funding
This research received no external funding.
Data Availability Statement
Data can be accessible upon request to the corresponding author ([email protected]).
Conflicts of Interest
The authors declare no conflict of interest.
References
- Restuccia, D.; Spizzirri, U.G.; Parisi, O.I.; Cirillo, G.; Picci, N. Brewing Effect on Levels of Biogenic Amines in Different Coffee Samples as Determined by LC-UV. Food Chem. 2015, 175, 143–150. [Google Scholar] [CrossRef]
- Mitraka, G.C.; Kontogiannopoulos, K.N.; Batsioula, M.; Banias, G.F.; Assimopoulou, A.N. Spent Coffee Grounds’ Valorization towards the Recovery of Caffeine and Chlorogenic Acid: A Response SurfaceMethodology Approach. Sustainability 2021, 13, 8818. [Google Scholar] [CrossRef]
- International Coffee Organisation (ICO). Cocoa Market Report—October 2022. Available online: https://www.ico.org/Market-Report-22-23-e.asp (accessed on 12 October 2022).
- Zarebska, M.; Stanek, N.; Barabosz, K.; Jaszkiewicz, A.; Kulesza, R.; Matejuk, R.; Andrzejewski, D.; Biłos, Ł.; Porada, A. Comparison of Chemical Compounds and Their Influence on the Taste of Coffee Depending on Green Beans Storage Conditions. Sci. Rep. 2022, 12, 2674. [Google Scholar] [CrossRef] [PubMed]
- Stanek, N.; Zarębska, M.; Biłos, Ł.; Barabosz, K.; Nowakowska-Bogdan, E.; Semeniuk, I.; Błaszkiewicz, J.; Kulesza, R.; Matejuk, R.; Szkutnik, K. Influence of Coffee Brewing Methods on the Chromatographic and Spectroscopic Profiles, Antioxidant and Sensory Properties. Sci. Rep. 2021, 11, 21377. [Google Scholar] [CrossRef] [PubMed]
- Muzykiewicz-Szymá Nska, A.; Nowak, A.; Wira, D.; Klimowicz, A.; Oszmianski, J.; Lachowicz, S.; Cacciola, F. The Effect of Brewing Process Parameters on Antioxidant Activity and Caffeine Content in Infusions of Roasted and Unroasted Arabica Coffee Beans Originated from Different Countries. Molecules 2021, 26, 3681. [Google Scholar] [CrossRef]
- Nzekoue, F.K.; Khamitova, G.; Angeloni, S.; Sempere, A.N.; Tao, J.; Maggi, F.; Xiao, J.; Sagratini, G.; Vittori, S.; Caprioli, G. Spent Coffee Grounds: A Potential Commercial Source of Phytosterols. Food Chem. 2020, 325, 126836. [Google Scholar] [CrossRef]
- Bastian, F.; Hutabarat, O.S.; Dirpan, A.; Nainu, F.; Harapan, H.; Emran, T.B.; Simal-Gandara, J.; Fernández-Ruiz, V.; Morales, P. From Plantation to Cup: Changes in Bioactive Compounds during Coffee Processing. Foods 2021, 10, 2827. [Google Scholar] [CrossRef]
- de Melo Pereira, G.V.; de Carvalho Neto, D.P.; Júnior, A.I.M.; do Prado, F.G.; Pagnoncelli, M.G.B.; Karp, S.G.; Soccol, C.R. Chemical composition and health properties of coffee and coffee by-products. Adv. Food Nutr. Res. 2020, 91, 65–96. [Google Scholar] [PubMed]
- Carvalho Neto, D.P.D.; Gonot-Schoupinsky, X.P.; Gonot-Schoupinsky, F.N. Coffee as a naturally beneficial and sustainable ingredient in personal care products: A systematic scoping review of the evidence. Front. Sustain. 2021, 2, 697092. [Google Scholar] [CrossRef]
- Muzaifa, M.; Hasni, D.; Febriani; Patria, A.; Abubakar, A. Chemical Composition of Green and Roasted Coffee Bean of Gayo Arabica Civet Coffee (Kopi Luwak). IOP Conf. Ser. Earth Environ. Sci. 2020, 425, 012001. [Google Scholar] [CrossRef]
- Oliveira, S.D.; Franca, A.S.; Glória, M.B.A.; Borges, M.L.A. The Effect of Roasting on the Presence of Bioactive Amines in Coffees of Different Qualities. Food Chem. 2005, 90, 287–291. [Google Scholar] [CrossRef]
- Cortés-Macías, E.T.; López, C.F.; Gentile, P.; Girón-Hernández, J.; López, A.F. Impact of Post-Harvest Treatments on Physicochemical and Sensory Characteristics of Coffee Beans in Huila, Colombia. Postharvest Biol. Technol. 2022, 187, 111852. [Google Scholar] [CrossRef]
- Casal, S.; Oliveira, M.B.P.P.; Ferreira, M.A. Determination of Biogenic Amines in Coffee by an Optimized Liquid Chromatographic Method. J. Liq. Chromatogr. Relat. Technol. 2002, 25, 2535–2549. [Google Scholar] [CrossRef]
- Chongsrimsirisakhol, O.; Pirak, T. Total Polyphenol Content and Antioxidant Properties of Cold Brew Coffee Extracts as Affected by Ultrasound Treatment and Their Application in Low Fat Pork Sausage. Int. J. Food Prop. 2022, 2022, 813–826. [Google Scholar] [CrossRef]
- Vignoli, J.A.; Viegas, M.C.; Bassoli, D.G.; Benassi, M.d.T. Roasting Process Affects Differently the Bioactive Compounds and the Antioxidant Activity of Arabica and Robusta Coffees. Food Res. Int. 2014, 61, 279–285. [Google Scholar] [CrossRef] [Green Version]
- Brommer, E.; Stratmann, B.; Quack, D. Environmental Impacts of Different Methods of Coffee Preparation. Int. J. Consum. Stud. 2011, 35, 212–220. [Google Scholar] [CrossRef]
- Dubois, C.; Humbert, S.; Margni, M. Comparative Full Life Cycle Assessment of B”C Cup of Espresso Made Using a Packaging and Distribution system from Nespresso Espresso and Three Generic Products; Quantis: Lausanne, Switzerland, 2011. [Google Scholar]
- Vinci, G.; Maddaloni, L.; Prencipe, S.A.; Ruggieri, R. Natural Contaminants in Wines: Determination of Biogenic Amines by Chromatographic Techniques. Int. J. Environ. Res. Public Health 2021, 18, 10159. [Google Scholar] [CrossRef]
- Mietz, J.L.; Karmas, E. Chemical quality index of canned tuna as determined by high-pressure liquid chromatography. J. Food Sci. 1977, 42, 155–158. [Google Scholar] [CrossRef]
- Duflos, G.; Inglebert, G.; Himber, C.; Degremont, S.; Lombard, B.; Brisabois, A. Validation of Standard Method EN ISO 19343 for the Detection and Quantification of Histamine in Fish and Fishery Products Using High-Performance Liquid Chromatography. Int. J. Food Microbiol. 2019, 288, 97–101. [Google Scholar] [CrossRef]
- Vinci, G.; D’Ascenzo, F.; Maddaloni, L.; Prencipe, S.A.; Tiradritti, M. The Influence of Green and Black Tea Infusion Parameters on Total Polyphenol Content and Antioxidant Activity by ABTS and DPPH Assays. Beverages 2022, 8, 18. [Google Scholar] [CrossRef]
- Abdel-Naeem, H.H.S.; Sallam, K.I.; Malak, N.M.L. Improvement of the Microbial Quality, Antioxidant Activity, Phenolic and Flavonoid Contents, and Shelf Life of Smoked Herring (Clupea harengus) during Frozen Storage by Using Chitosan Edible Coating. Food Control. 2021, 130, 108317. [Google Scholar] [CrossRef]
- Chen, Z.; Wang, Z.; Yuan, H.; He, N. From Tea Leaves to Factories: A Review of Research Progress in l -Theanine Biosynthesis and Production. J. Agric. Food Chem. 2021, 69, 1187–1196. [Google Scholar] [CrossRef] [PubMed]
- Alves, R.C.; Rodrigues, F.; Antónia Nunes, M.; Vinha, A.F.; Oliveira, M.B.P.P. State of the Art in Coffee Processing By-Products. In Handbook of Coffee Processing By-Products: Sustainable Applications; Elsevier Inc.: Amsterdam, The Netherlands, 2017; pp. 1–26. ISBN 9780128112915. [Google Scholar]
- ISO 14040:2006; Environmental Management—Life Cycle Assessment—Principles and Framework. ISO: Geneva, Switzerland, 2006.
- ISO 14044:2006; Environmental Management—Life Cycle Assessment—Requirements and Guidelines. ISO: Geneva, Switzerland, 2006.
- Cibelli, M.; Cimini, A.; Moresi, M. Carbon Footprint of Different Coffee Brewing Methods. Chem. Eng. Trans. 2021, 87, 373–378. [Google Scholar] [CrossRef]
- Cibelli, M.; Cimini, A.; Cerchiara, G.; Moresi, M. Carbon Footprint of Different Methods of Coffee Preparation. Sustain. Prod. Consum. 2021, 27, 1614–1625. [Google Scholar] [CrossRef]
- Pré Consultants, P. SimaPro (Version 9.2.0.2.) [Computer Software]; Pré Sustainability: Amersfoort, The Netherlands, 2017; Available online: Https://Simapro.Com (accessed on 5 October 2022).
- Spizzirri, U.G.; Picci, N.; Restuccia, D. Extraction Efficiency of Different Solvents and LC-UV Determination of Biogenic Amines in Tea Leaves and Infusions. J. Anal. Methods Chem. 2016, 2016, 1–10. [Google Scholar] [CrossRef] [Green Version]
- Panzella, L.; Moccia, F.; Nasti, R.; Marzorati, S.; Verotta, L.; Napolitano, A. Bioactive Phenolic Compounds From Agri-Food Wastes: An Update on Green and Sustainable Extraction Methodologies. Front. Nutr. 2020, 7, 60. [Google Scholar] [CrossRef]
- Zannou, O.; Koca, I. Greener Extraction of Anthocyanins and Antioxidant Activity from Blackberry (Rubus Spp) Using Natural Deep Eutectic Solvents. LWT 2022, 158, 113184. [Google Scholar] [CrossRef]
- Zannou, O.; Pashazadeh, H.; Ibrahim, S.A.; Koca, I.; Galanakis, C.M. Green and Highly Extraction of Phenolic Compounds and Antioxidant Capacity from Kinkeliba (Combretum Micranthum G. Don) by Natural Deep Eutectic Solvents (NADESs) Using Maceration, Ultrasound-Assisted Extraction and Homogenate-Assisted Extraction. Arab. J. Chem. 2022, 15, 103752. [Google Scholar] [CrossRef]
- EU COMMISSION REGULATION (EC) No 2073/2005 of 15 November 2005 on Microbiological Criteria for Foodstuffs. Brussels, Belgium. Available online: http://data.europa.eu/eli/reg/2005/2073/oj (accessed on 10 November 2022).
- Zargar, B.; Majeed, D.; Ganai, S.A.; Mir, S.A.; Dar, B.N. Effect of Different Processing Parameters on Antioxidant Activity of Tea. Food Meas. 2018, 12, 527–534. [Google Scholar] [CrossRef]
- Wyrostek, J.; Kowalski, R. The Effect of Water Mineralization on the Extraction of Active Compounds from Selected Herbs and on the Antioxidant Properties of the Obtained Brews. Foods 2021, 10, 1227. [Google Scholar] [CrossRef]
- Niseteo, T.; Komes, D.; Belščak-Cvitanović, A.; Horžić, D.; Budeč, M. Bioactive Composition and Antioxidant Potential of Different Commonly Consumed Coffee Brews Affected by Their Preparation Technique and Milk Addition. Food Chem. 2012, 134, 1870–1877. [Google Scholar] [CrossRef] [PubMed]
- Uslu, N. The Influence of Decoction and Infusion Methods and Times on Antioxidant Activity, Caffeine Content and Phenolic Compounds of Coffee Brews. Eur. Food Res. Technol. 2022, 248, 2021–2030. [Google Scholar] [CrossRef]
- Prior, R.L.; Wu, X.; Schaich, K. Standardized Methods for the Determination of Antioxidant Capacity and Phenolics in Foods and Dietary Supplements. J. Agric. Food Chem. 2005, 10, 4290–4302. [Google Scholar] [CrossRef] [PubMed]
- Caporaso, N.; Genovese, A.; Canela, M.D.; Civitella, A.; Sacchi, R. Neapolitan Coffee Brew Chemical Analysis in Comparison to Espresso, Moka and American Brews. FRIN 2014, 61, 152–160. [Google Scholar] [CrossRef]
- Batista, N.N.; de Andrade, D.P.; Ramos, C.L.; Dias, D.R.; Schwan, R.F. Antioxidant Capacity of Cocoa Beans and Chocolate Assessed by FTIR. Food Res. Int. 2016, 90, 313–319. [Google Scholar] [CrossRef]
- Vauchel, P.; Colli, C.; Pradal, D.; Philippot, M.; Decossin, S.; Dhulster, P.; Dimitrov, K. Comparative LCA of Ultrasound-Assisted Extraction of Polyphenols from Chicory Grounds under Different Operational Conditions. J. Clean Prod. 2018, 196, 1116–1123. [Google Scholar] [CrossRef]
- Sualeh, A.; Tolessa, K.; Mohammed, A. Biochemical Composition of Green and Roasted Coffee Beans and Their Association with Coffee Quality from Different Districts of Southwest Ethiopia. Heliyon 2020, 6, e05812. [Google Scholar] [CrossRef]
- Igbokwe, I.O.; Igwenagu, E.; Igbokwe, N.A. Aluminum Toxicosis: A Review of Toxic Actions and Effects. Interdiscip. Toxicol. 2020, 12, 45–70. [Google Scholar] [CrossRef] [Green Version]
- Hicks, A.L.; Halvorsen, H. Environmental Impact of Evolving Coffee Technologies. Int. J. Life Cycle Assess. 2019, 24, 1396–1408. [Google Scholar] [CrossRef]
- Hicks, A.L. Environmental Implications of Consumer Convenience: Coffee as a Case Study. J. Ind. Ecol. 2018, 22, 79–91. [Google Scholar] [CrossRef]
Figure 1.
Scheme of quality and sustainability assessment of coffee brewing methods.

Figure 2.
Scatter Plot of the main components (PC1 vs. PC2) of ground coffee (orange), and infused coffee (green) samples.
Figure 2.
Scatter Plot of the main components (PC1 vs. PC2) of ground coffee (orange), and infused coffee (green) samples.

Figure 3.
Scatter Plot of the main components (PC1 vs. PC2) of coffee infusion obtained with different brews techniques.
Figure 3.
Scatter Plot of the main components (PC1 vs. PC2) of coffee infusion obtained with different brews techniques.

Figure 4.
Characterized results for environmental impacts of coffee brewing methods.


Table 1.
Extraction conditions for different coffee brewing techniques.
| Extraction Condition | Coffee Powder Weight (g) | Water Volume (mL) | Pressure (Pa) | Time (s) | Temperature (°C) |
|---|---|---|---|---|---|
| Moka | 5 | 25 | 10 × 105 | 300 | 95 |
| Espresso Professional | 7 | 25 | 18 × 105 | 25 | 96 |
| Espresso Pods | 7.5 | 20 | 18 × 105 | 30 | 90 |
| Espresso Capsules | 5.5 | 20 | 15 × 105 | 30 | 90 |
Table 2.
Inventory data for different coffee beverage brewing methods. All data referred to a 40-mL cup of coffee beverage (FU).
Table 2.
Inventory data for different coffee beverage brewing methods. All data referred to a 40-mL cup of coffee beverage (FU).
| INPUTS | Coffee Brewing Methods | ||||
|---|---|---|---|---|---|
| Unit | Coffee Moka | Coffee Bar | Coffee Capsule | Coffee Pod | |
| Roasted and ground coffee | g | 8.0 | 11.2 | 14.0 | 11.0 |
| Water for preparation | g | 100 | 100 | 54.08 | 40.3 |
| Electricity | kW·h | 0.266 | 0.014 | 0.022 | 0.021 |
| Primary packaging | |||||
| Low-density polyethylene (LDPE) | g | 0.352 | 0.493 | - | - |
| Paper filters | g | - | - | 2.47 | |
| Poly-laminated bag (PE-Al-PP) | g | - | - | 2.01 | |
| OUTPUTS | |||||
| 1 cup of coffee beverage | mL | 40 | 40 | 40 | 40 |
Table 3.
Biogenic amines amount (µg/g of coffee powder) ± standard deviation (SD) in ground coffee and brewed coffee samples.
Table 3.
Biogenic amines amount (µg/g of coffee powder) ± standard deviation (SD) in ground coffee and brewed coffee samples.
| Samples | Biogenic Amines (µg/g of Coffee Powder) | BAs Tot | BAQI | ||||||||
|---|---|---|---|---|---|---|---|---|---|---|---|
| Ser | B-Pea | Put | His | Cad | Tyr | Spd | Spm | ||||
| Coffee powder | Bar 1 | 71.77 ± 1.02 c | 8.97 ± 0.23 b | 0.33 ± 0.07 a | 2.78 ± 0.23 b | nd | nd | 0.72 ± 0.09 b | 0.74 ± 0.12 a | 84.59 | 1.26 |
| Bar 2 | 75.50 ± 1.21 a | 11.93 ± 0.33 a | 0.35 ± 0.04 a | 2.32 ± 0.20 a | nd | nd | 0.51 ± 0.07 b | 0.67 ± 0.17 b | 90.77 | 1.22 | |
| Capsule 1 | 63.46 ± 0.76 b | 3.26 ± 0.12 a | 0.52 ± 0.13 c | 3.62 ± 0.14 c | nd | nd | 0.19 ± 0.03 c | 0.78 ± 0.11 c | 71.85 | 2.10 | |
| Capsule 2 | 57.87 ± 0.84 c | 3.65 ± 0.17 a | 0.45 ± 0.11 a | 4.19 ± 0.17 a | nd | nd | 0.10 ± 0.01 a | 0.74 ± 0.13 a | 67.01 | 2.52 | |
| Moka 1 | 82.61 ± 1.32 a | 5.81 ± 0.36 b | 0.43 ± 0.06 a | 7.30 ± 0.51 b | nd | nd | 0.29 ± 0.02 a | 0.38 ± 0.03 a | 96.83 | 4.60 | |
| Moka 2 | 84.24 ± 0.91 b | 5.35 ± 0.36 b | 0.42 ± 0.01 a | 5.78 ± 0.32 a | nd | nd | 0.21 ± 0.05 b | 0.39 ± 0.05 b | 96.38 | 3.89 | |
| Pod 1 | 62.13 ± 0.53 c | 2.75 ± 0.25 a | 0.40 ± 0.03 b | 2.22 ± 0.13 b | nd | nd | 0.34 ± 0.01 b | 0.55 ± 0.07 b | 67.88 | 1.89 | |
| Pod 2 | 72.47 ± 1.32 c | 2.22 ± 0.12 a | 0.35 ± 0.02 a | 3.20 ± 0.21 a | nd | nd | 0.33 ± 0.02 b | 0.57 ± 0.08 a | 81.15 | 1.87 | |
| Coffee beverages | Bar 1 | 14.38 ± 0.56 b | 0.52 ± 0.08 b | 0.18 ± 0.02 b | 8.29 ± 0.58 a | nd | nd | 0.14 ± 0.02 a | 0.24 ± 0.11 c | 23.60 | 6.81 |
| Bar 2 | 12.75 ± 0.41 c | 0.52 ± 0.05 b | 0.16 ± 0.03 a | 7.97 ± 0.74 c | nd | nd | 0.12 ± 0.03 b | 0.20 ± 0.09 b | 21.61 | 6.76 | |
| Capsule 1 | 14.42 ± 0.65 a | 0.41 ± 0.31 a | nd | 0.77 ± 0.21 b | nd | nd | 0.11 ± 0.03 a | 0.32 ± 0.08 a | 16.02 | 0.54 | |
| Capsule 2 | 19.95 ± 0.25 c | 0.48 ± 0.11 b | nd | 0.85 ± 0.26 b | nd | nd | 0.06 ± 0.01 c | 0.22 ± 0.14 b | 21.75 | 0.57 | |
| Moka 1 | 33.46 ± 0.84 b | 0.51 ± 0.08 b | nd | 14.66 ± 0.54 b | nd | nd | 0.04 ± 0.02 a | 0.25 ± 0.06 a | 48.92 | 11.38 | |
| Moka 2 | 31.82 ± 0.67 c | 0.44 ± 0.05 a | nd | 20.57 ± 0.86 a | nd | nd | 0.07 ± 0.01 b | 0.26 ± 0.09 b | 53.15 | 15.50 | |
| Pod 1 | 21.38 ± 0.35 a | 0.85 ± 0.14 a | nd | 0.37 ± 0.36 b | nd | nd | 0.03 ± 0.01 c | 0.20 ± 0.04 a | 22.83 | 0.30 | |
| Pod 2 | 18.46 ± 0.62 b | 0.31 ± 0.04 a | nd | 0.22 ± 0.05 a | nd | nd | 0.14 ± 0.02 b | 0.15 ± 0.06 c | 19.28 | 0.17 | |
Ser: Serotonin; B-Pea: B-Phenylethylamine; Put: Putrescine; His: Histamine; Cad: Cadaverine; Tyr: Tyramine; Spd: Spermidine; Spm: Spermine; nd = not detectable; BAs Tot: Total amount of biogenic amines; BAQI: Biogenic amine quality index. The superscripts a, b, and c denote significant (p < 0.05) differences.
Table 4.
Total polyphenols content (mg GAE/g of coffee powder) ± SD in coffee powder and beverage samples. The superscripts a, b, and c denote significant (p < 0.05) differences.
Table 4.
Total polyphenols content (mg GAE/g of coffee powder) ± SD in coffee powder and beverage samples. The superscripts a, b, and c denote significant (p < 0.05) differences.
| Sample | TPC (mg GAE/g of Coffee Powder) | |
|---|---|---|
| Coffee Powder | Coffee Beverages | |
| Bar 1 | 25.37 ± 0.52 b | 1.51 ± 0.26 a |
| Bar 2 | 23.33 ± 0.61 c | 1.72 ± 0.21 a |
| Capsule 1 | 22.96 ± 0.38 b | 1.46 ± 0.02 b |
| Capsule 2 | 23.87 ± 0.71 b | 1.49 ± 0.05 a |
| Moka 1 | 23.03 ± 0.23 c | 2.71 ± 0.25 b |
| Moka 2 | 24.06 ± 0.41 b | 3.52 ± 0.08 a |
| Pod 1 | 29.61 ± 0.26 b | 1.30 ± 0.06 b |
| Pod 2 | 28.46 ± 0.53 a | 1.44 ± 0.07 c |
Table 5.
Total flavonoid content (mg RUT/g coffee powder) ± SD for ground coffee and respective beverages samples. The superscripts a, b, and c denote significant (p < 0.05) differences.
Table 5.
Total flavonoid content (mg RUT/g coffee powder) ± SD for ground coffee and respective beverages samples. The superscripts a, b, and c denote significant (p < 0.05) differences.
| Sample | TFC | |
|---|---|---|
| Coffee Powder | Coffee Beverages | |
| Bar 1 | 86.78 ± 0.42 c | 5.13 ± 0.21 c |
| Bar2 | 79.90 ± 0.56 a | 4.77 ± 0.36 b |
| Capsule 1 | 82.33 ± 0.84 b | 4.39 ± 0.25 b |
| Capsule 2 | 90.02 ± 0.72 a | 5.01 ± 0.14 b |
| Moka 1 | 93.64 ± 0.63 a | 8.55 ± 0.24 a |
| Moka 2 | 97.67 ± 0.82 b | 8.60 ± 0.31 c |
| Pod 1 | 113.69 ± 1.05 b | 4.41 ± 0.09 a |
| Pod 2 | 99.40 ± 0.94 b | 3.94 ± 0.11 b |
Table 6.
Inhibition percentage (I%) ± SD of coffee powder and beverage samples for ABTS and DPPH assays. The superscripts a, b, and c denote significant (p < 0.05) differences.
Table 6.
Inhibition percentage (I%) ± SD of coffee powder and beverage samples for ABTS and DPPH assays. The superscripts a, b, and c denote significant (p < 0.05) differences.
| Sample | ABTS | DPPH | ||
|---|---|---|---|---|
| Coffee Powder | Coffee Beverages | Coffee Powder | Coffee Beverages | |
| Bar 1 | 99.03 ± 0.21 a | 97.63 ± 0.11 a | 61.09 ± 0.23 b | 27.03 ± 0.12 a |
| Bar 2 | 99.12 ± 0.23 c | 97.71 ± 0.13 a | 60.89 ± 0.11 a | 27.42 ± 0.18 a |
| Capsule 1 | 97.59 ± 0.11 b | 99.35. ± 0.21 b | 48.76 ± 0.15 a | 7.84 ± 0.06 c |
| Capsule 2 | 96.31 ± 0.22 c | 99.42 ± 0.25 b | 49.04 ± 0.13 a | 9.06 ± 0.09 a |
| Moka 1 | 99.88 ± 0.25 b | 99.62 ± 0.13 b | 64.65 ± 018 b | 16.01 ± 0.25 c |
| Moka 2 | 99.96 ± 0.27 b | 99.73 ± 0.17 b | 64.82 ± 0.16 c | 14.78 ± 0.17 a |
| Pod 1 | 98.23 ± 0.19 a | 97.68 ± 0.15 a | 54.75 ± 0.09 b | 24.23 ± 0.24 a |
| Pod 2 | 98.52 ± 0.17 b | 97.76 ± 0.14 a | 55.21 ± 0.05 a | 22.04 ± 0.15 b |
Table 7.
Pearson correlation (p < 0.05) between spectrophotometric assays (TPC, TFC, DPPH, and ABTS) and biogenic amines determined in coffee samples.
Table 7.
Pearson correlation (p < 0.05) between spectrophotometric assays (TPC, TFC, DPPH, and ABTS) and biogenic amines determined in coffee samples.
| ABTS | DPPH | TPC | TFC | Ser | B-Pea | Put | His | Spd | |
|---|---|---|---|---|---|---|---|---|---|
| ABTS | 0.163 | 0.187 | 0.195 | 0.414 | 0.448 | 0.034 | 0.087 | 0.465 | |
| DPPH | 0.878 | 0.904 | 0.900 | 0.810 | 0.906 | −0.272 | 0.607 | ||
| TPC | 0.990 | 0.925 | 0.678 | 0.912 | −0.213 | 0.555 | |||
| TFC | 0.933 | 0.713 | 0.927 | −0.228 | 0.542 | ||||
| Ser | 0.809 | 0.847 | −0.090 | 0.667 | |||||
| B-Pea | 0.649 | −0.232 | 0.879 | ||||||
| Put | −0.195 | 0.444 | |||||||
| His | −0.247 |
Table 8.
LCIA results for different coffee brewing methods.
| Impact Category | Unit | Pod | Moka | Capsule | Bar |
|---|---|---|---|---|---|
| Global warming | kg CO2 eq | 1.14 × 10⁻¹ | 1.87 × 10⁻¹ | 1.38 × 10⁻¹ | 1.08 × 10⁻¹ |
| Stratospheric ozone depletion | kg CFC11 eq | 7.78 × 10⁻⁷ | 6.48 × 10⁻⁷ | 9.90 × 10⁻⁷ | 7.89 × 10⁻⁷ |
| Ionizing radiation | kBq Co−60 eq | 6.05 × 10⁻⁴ | 1.14 × 10⁻³ | 5.33 × 10⁻⁴ | 3.98 × 10⁻⁴ |
| Ozone formation, Human health | kg NOx eq | 3.57 × 10⁻⁴ | 4.49 × 10⁻⁴ | 4.46 × 10⁻⁴ | 3.50 × 10⁻⁴ |
| Fine particulate matter formation | kg PM2.5 eq | 2.75 × 10⁻⁴ | 3.13 × 10⁻⁴ | 3.45 × 10⁻⁴ | 2.72 × 10⁻⁴ |
| Ozone formation, Terrestrial ecosystems | kg NOx eq | 3.71 × 10⁻⁴ | 4.62 × 10⁻⁴ | 4.63 × 10⁻⁴ | 3.64 × 10⁻⁴ |
| Terrestrial acidification | kg SO2 eq | 1.33 × 10⁻³ | 1.29 × 10⁻³ | 1.67 × 10⁻³ | 1.33 × 10⁻³ |
| Freshwater eutrophication | kg P eq | 1.57 × 10⁻⁵ | 1.46 × 10⁻⁵ | 2.00 × 10⁻⁵ | 1.58 × 10⁻⁵ |
| Marine eutrophication | kg N eq | 2.25 × 10⁻⁴ | 1.65 × 10⁻⁴ | 2.86 × 10⁻⁴ | 2.29 × 10⁻⁴ |
| Terrestrial ecotoxicity | kg 1.4-DCB | 3.28 × 10⁻¹ | 3.64 × 10⁻¹ | 4.21 × 10⁻¹ | 3.28 × 10⁻¹ |
| Freshwater ecotoxicity | kg 1.4-DCB | 4.05 × 10⁻³ | 2.99 × 10⁻³ | 5.16 × 10⁻³ | 4.12 × 10⁻³ |
| Marine ecotoxicity | kg 1.4-DCB | 9.02 × 10⁻⁴ | 8.29 × 10⁻⁴ | 1.15 × 10⁻³ | 9.10 × 10⁻⁴ |
| Human carcinogenic toxicity | kg 1.4-DCB | 1.18 × 10⁻³ | 2.39 × 10⁻³ | 1.40 × 10⁻³ | 1.09 × 10⁻³ |
| Human non-carcinogenic toxicity | kg 1.4-DCB | 8.78 × 10⁻² | 8.31 × 10⁻² | 1.12 × 10⁻¹ | 8.86 × 10⁻² |
| Land use | m2a crop eq | 1.04 × 10⁻¹ | 9.95 × 10⁻² | 1.35 × 10⁻¹ | 1.05 × 10⁻¹ |
| Mineral resource scarcity | kg Cu eq | 5.17 × 10⁻⁴ | 5.74 × 10⁻⁴ | 6.52 × 10⁻⁴ | 5.14 × 10⁻⁴ |
| Fossil resource scarcity | kg oil eq | 2.38 × 10⁻² | 4.94 × 10⁻² | 2.72 × 10⁻² | 2.15 × 10⁻² |
| Water consumption | m3 | 7.96 × 10⁻³ | 7.95 × 10⁻³ | 1.01 × 10⁻² | 8.08 × 10⁻³ |
Disclaimer/Publisher’s Note: The statements, opinions and data contained in all publications are solely those of the individual author(s) and contributor(s) and not of MDPI and/or the editor(s). MDPI and/or the editor(s) disclaim responsibility for any injury to people or property resulting from any ideas, methods, instructions or products referred to in the content. |
© 2023 by the authors. Licensee MDPI, Basel, Switzerland. This article is an open access article distributed under the terms and conditions of the Creative Commons Attribution (CC BY) license (https://creativecommons.org/licenses/by/4.0/).
Share and Cite
MDPI and ACS Style
Gobbi, L.; Maddaloni, L.; Prencipe, S.A.; Vinci, G. Bioactive Compounds in Different Coffee Beverages for Quality and Sustainability Assessment. Beverages 2023, 9, 3. https://doi.org/10.3390/beverages9010003
AMA Style
Gobbi L, Maddaloni L, Prencipe SA, Vinci G. Bioactive Compounds in Different Coffee Beverages for Quality and Sustainability Assessment. Beverages. 2023; 9(1):3. https://doi.org/10.3390/beverages9010003
Chicago/Turabian StyleGobbi, Laura, Lucia Maddaloni, Sabrina Antonia Prencipe, and Giuliana Vinci. 2023. "Bioactive Compounds in Different Coffee Beverages for Quality and Sustainability Assessment" Beverages 9, no. 1: 3. https://doi.org/10.3390/beverages9010003
Note that from the first issue of 2016, this journal uses article numbers instead of page numbers. See further details here.