Review

Functional Beverages in the 21st Century

by
Mateusz Sugajski
1,2,3,
Magdalena Buszewska-Forajta
4,5 and
Bogusław Buszewski
1,2,3,*
1
Centre for Modern Interdisciplinary Technologies, Nicolaus Copernicus University in Torun, Wileńska 4, 87-100 Torun, Poland
2
Department of Environmental Chemistry and Bioanalytics, Faculty of Chemistry, Nicolaus Copernicus University in Torun, Gagarina 7, 87-100 Torun, Poland
3
Prof. Jan Czochralski Kuyavian-Pomeranian Science and Technology Center in Przysiek near Torun, Parkowa 1, 87-134 Przysiek, Poland
4
Institute of Veterinary Medicine, Faculty of Biological and Veterinary Sciences, Nicolaus Copernicus University in Torun, 1 Lwowska St., 87-100 Torun, Poland
5
Department of Plant Physiology, Genetics, and Biotechnology, University of Warmia and Mazury in Olsztyn, 10-229 Olsztyn, Poland
*
Author to whom correspondence should be addressed.
Beverages 2023, 9(1), 27; https://doi.org/10.3390/beverages9010027
Submission received: 10 February 2023 / Revised: 3 March 2023 / Accepted: 6 March 2023 / Published: 14 March 2023

Abstract

:
Underlying the dawn of humanity was primarily the search for food and access to drinking water. Over the course of civilization, there has been a significant increase in drinking water quality. By the average of the nutritional standards, the daily water demand is 2.5 L (also including liquid products such as tea, coffee, or soup). However, it is worth noticing that the need is strictly individual for each person and depends on two major factors, namely, epidemiological (sex, age state of health, lifestyle, and diet) and environmental (humidity and air temperature). Currently, our diet is more and more often enriched with isotonic drinks, functional drinks, or drinks bearing the hallmarks of health-promoting products. As a result, manufacturing companies compete to present more interesting beverages with complex compositions. This article will discuss both the composition of functional beverages and their impact on health.

1. Introduction

Undeniably, water is one of the most important chemical substances found on Earth. It is found in three states of aggregation: in solid form (ice) and liquid form, it is found in an area exceeding 70% of the entire surface of the Earth, while in gaseous form (water vapor), it is an essential component of the atmospheric layer [1,2].
From a chemical point of view, the water molecules are composed of an oxygen atom and two hydrogen atoms that are linked by a polar covalent bond. The water molecule is electrically neutral since it has an equal number of electrons and protons. Additionally, it is also polar due to the asymmetric distribution of electrons responsible for covalent bonds forming between the oxygen (O) and hydrogen (H) atoms. The angular shape of the water molecule focuses negative charges on the oxygen atom, while positive ones are located at the hydrogen atom. As a result, the oxygen atom acquires a partial negative charge, while a partial positive charge appears on each hydrogen atom, causing the formation of two dipoles at H-O bonds [3].
In 1952, Bjerum [4] presented the configuration of the water molecule in the form of a tetrahedron with an oxygen atom in the center. The shape of the water molecule is forced by the form of the extreme electron orbitals of the oxygen atom. The two bonds of the oxygen atom with the hydrogen atoms face the two corners of the tetrahedron, while the other two face the indivisible pairs of electrons present in the hybridized sp3 orbitals. However, it should be noticed that the shape of the water molecule is rather angular than tetrahedral. With this, the angle between the covalent bonds of the two hydrogen atoms to oxygen is 104.5°, which is slightly narrower than the angle in an ideal tetrahedron (109.5°).
These physical and chemical properties are reflected in the widespread use of water as the so-called “source of life” and the main, natural solvent of various chemical substances (molecules, microorganisms, etc.).

2. The Role of Water in Human Life

The core of human history focuses on the search for sources of food and drinking water. Lack of access to clean drinking water forced the relocation of settlements. The earliest information on water treatment comes from ancient Egypt [5]. At that time, boiling, chemical treatment, and filtration were the main methods used to purify water. Nowadays, methods of water purification, especially chlorination and filtration, are considered the most important achievements of the 20th century in the sphere of public health [6]. With the implementation of chlorination of drinking water, the incidence of cholera, dysentery, and typhoid drastically decreased, with the result being that microbiological contamination of water has become less dangerous than chemical contamination caused by both organic and inorganic factors [7,8]. Main sources of drinking water contaminants include municipal and industrial wastewater, environmental contamination, agriculture, mining, natural geological formations, water supply networks, and treatment processes. Drinking water contaminants may cause several disease development such as cancer, miscarriages, cardiovascular disease, and neurological disorders. Epidemiological studies indicate that aluminum and arsenic compounds, lead, radon, fluorine compounds, sulfates, nitrates, pesticides, and disinfection byproducts are potentially responsible for these diseases [9,10].
The standards and quality of drinking water resources are strictly monitored by relevant legislative regulations. Due to the rapid development of technology and civilization, the criteria for the quality of drinking water resources are constantly being made stricter and changed, which is mainly due to the increasing contamination of surface water, which belongs to the essential sources of obtaining drinking water. Since the level of contamination and the number of harmful agents is increasing, the list of compounds that must be labeled and standardized so that drinking water can be safe for health is constantly growing [11]. However, the amount and permissible concentration limits of water pollutants vary from country to country, which has to do with the different intensities of water pollution in different regions of the world, as well as the technical and economic realities of obtaining water of adequate quality. The recommendations of international organizations, such as the World Health Organization (WHO) or the Council of the European Union, are also relevant [12].
As a source of water extraction from the environment, surface water is used daily, which includes rivers and lakes. Water extracted from deep-water intakes undergoes processes of preliminary partial treatment in water treatment plants, from which it is directly directed to the water supply network. In principle, the course of treatment is influenced by several measures, which include the elimination of solid particles (sedimentation), removal of hard-to-settle suspended solids (coagulation, filtration), and elimination of bacterial contaminants (disinfection). However, the above-mentioned methods, unfortunately, do not ensure the elimination of dissolved contaminants in the water. Indeed, only a few water treatment plants introduce additional filtration with the use of activated carbon, which can reduce by half the presence of undesirable compounds of organic origin [13].
The quality of tap water is largely determined by the condition of the surface or groundwater from which it is drawn. Thus, it can be rich in natural mineral (inorganic) salts, as well as contain other components resulting from human activity. In tap water, there may also be small amounts of organic compounds from environmental pollution [14]. These include petroleum and fuel hydrocarbons, detergents, plastic degradation products, solvents, and substances particularly hazardous to human health, such as pesticides and polycyclic aromatic hydrocarbons. Among inorganic ions, lead, cadmium, and mercury cations are found to be the most toxic. In addition, many other metal cations, belonging to the so-called trace elements, can have adverse effects at increased concentrations. Inorganic ions found in nature are mainly anions, namely, chloride, sulfate (VI), bicarbonate, silicate, and cations, namely, sodium, potassium, calcium, magnesium, iron (II), iron (III), and manganese (II). It should be added that despite previous disinfection of water by specialized entities, bacteria, fungi, and viruses can also appear in the water as a result of prolonged transportation through pipelines [15,16].
As a rule, water from natural sources has an alkaline reaction, sometimes slightly acidic. The alkalinity of the water is mainly caused by the presence of dissolved calcium bicarbonate or other alkaline metal compounds. Dissolved carbon dioxide or organic acids from peat soil are responsible for the acidic reaction. Sulfates, on the other hand, are found to be man-made by-products of industry. Polluted air, entering the waters following precipitation, can lead to water contamination. Additionally, the water treatment process can amplify the acidity of water. It should be understood that there are no contraindications to consuming slightly acidic water, but alkaline water is particularly recommended. In general, water for general use has a pH of approximately 7 [17,18]. The presence of bacteria in contaminated water can cause diseases that include cholera, typhoid fever, bacterial dysentery, and gastroenteritis [19]. Meanwhile, viral diseases resulting from contact with contaminated water include viral hepatitis and, less commonly, poliomyelitis [20]. Biologically based diseases, on the other hand, include parasites such as solitary parasites, liver fluke, and amoebae [21].
Water is of great importance in the proper daily functioning of the human body. The human body consists of almost 60–65% water. Although water is not a nutrient, which can be converted into energy through physiological pathways, there is no doubt that without water, life could not exist. Its presence in the human body enables the dissolution of inorganic salts as well as most organic compounds, with particular attention paid to those that have a hydrophilic group. Inside the body’s cells, life-determining biochemical processes take place, in which water is both an intermediate component and the primary reactant. In addition, water performs transport functions, supplying the body’s cells with components necessary for life [22,23]. The amount of water in the human body is dynamic and strictly related to age. In a fetus, it is about 90% water, in newborns, it is close to 80%. With age, the percentage of water decreases, and an adult consists of about 60–65% of it. Without exception, water is found in all tissue structures; however, its distribution remains uneven. We distinguish three major areas:
  • Intercellular (inside the cell);
  • Extracellular (blood plasma, lymph);
  • Transcellular (body water contained in the epithelial-lined spaces) [22].
These spaces are not separated from each other, and there is a constant flow of fluid between them, such as saliva. Approximately 8 L of liquid are poured into the digestive tract daily. In the process of digestion, food is transformed into a state that allows it to dissolve in water and be further broken down into finer particles. This allows the food to pass through the walls of the small and large intestines into the blood, and from there via the bloodstream into the cells [23]. Water is also a heat transmitter and regulator. Any excess heat absorbed is excreted through the skin by evaporation. It participates in all biochemical reactions, moistens the mucous membranes and the eyeball, and ensures the mobility of the joints [24].
In the human body, water is constantly exchanged. Its replacement occurs in 20 days [25]. During the day, the body of a healthy person can release from 3% to 6% of its water. On the other hand, each day, water must be introduced to the human body. According to diet, the body’s daily water requirement averages 2.5 L, while also depends on the ambient temperature and physical activity. In a healthy and balanced diet, the human body can assimilate 1 to 1.5 L of water from food (fruits, vegetables, and meat), while the rest must be introduced to the body as liquids in a preferable form of water, rather than sweetened drinks, coffee, tea, or even fresh juices. A very important factor is the quality of the water we supply to the body. Mineral waters containing calcium, magnesium, potassium, and sodium ions are highly preferred [25,26].
Sodium and potassium are found to be the most essential elements responsible for proper water absorption into the body. In practice, both of them can be presented as elements of a pump that pumps water into and out of cells. Briefly, potassium is responsible for absorbing water (it moves between cell membranes carrying nutrients and removing toxins), and sodium is responsible for maintaining this water in the body’s cells.
Importantly, the balance between both elements and the processes taking place must be preserved for effective hydration of the body. However, sodium is identified with table salt, while both potassium and sodium are introduced to food during technological processes. Unfortunately, food manufacturers even add salt into sweets, with the result that sodium is easily overdosed [27].
From the biological point of view, the overdose of sodium causes excessive water storage in the body, swelling of the body, circulation problems, etc. For this reason, its supply should be reduced, and its concentration should be monitored. The concentration of sodium and potassium is also correlated with another microelement, namely, magnesium. Magnesium is involved in more than 300 metabolic processes in the body. This element has a major impact on the proper functioning of sodium and potassium [28], similarly to the impact calcium has on water management. In the human body, calcium seals blood vessels, and its deficiency can lead to the initiation of water accumulation as well as swelling of the body [27,29,30].

3. Drinks for Athletes: Are We Sure about That?

For more than two decades, very intensive progress in the distribution of nutritional and health drinks dedicated to the so-called “average person” as well as sports people, from amateurs and hobbyists to professionals, can be noticed. Proposed beverages should significantly improve the health of customers as well as the results achieved in sports. Undoubtedly, the last two years of the COVID-19 pandemic have also had an impact on the growth of public interest in drinks that enables faster recovery after the infection. Market needs and consumer expectations led to the development of this branch of industry. The nutritional beverage industry has grown from a single electrolyte formulation to a multi-billion dollar category within the larger sports drink, sports food, and sports supplement market. Nowadays, the functional beverage can be divided into seven classes listed below [31,32,33]:
  • Sports and Performance Drinks
  • Energy drinks
  • Ready-to-drink teas
  • Milk-based drinks
  • Fortified fruit drinks
  • Soy-based drinks
  • Fortified water
Energy drinks are a group of stimulating beverages containing caffeine. Energy drinks are promoted under the banner of products that influence the raising of mental and body energy levels. Meanwhile, the amount of evidence supporting this thesis is limited. Currently, the category of sports and performance drinks is found to be one of the most dynamically developing classes in the food industry. According to data provided by Zion Market Research [34], the global market for all types of sports nutrition was estimated at USD 28.37 billion in 2016 and was expected to reach USD 45.27 billion by 2022. One group of compounds within it are sports drinks. Sports drinks are a unique category of beverages that were developed to quickly restore fluids and electrolytes lost through exercise-induced sweating and to provide carbohydrates (sugar) to replenish glycogen stores, thereby maintaining adequate performance. The first mention of a sports drink was made in 1927, when a drink called Glucozade was developed. However, this drink was not successfully commercialized at that time. The first sports drink of commercial significance, namely, Gatorade, was created by a research group at the University of Florida College of Medicine in 1965. Gatorade was developed for a college football team called the Gators and was composed of water, sugar, lemon juice, and electrolytes (sodium, potassium, and phosphate). The drink’s popularity soared in 1966 when the college team won its first Orange Bowl. At that time, Gatorade was considered an effective drink for replenishing electrolytes and carbohydrates lost during training sessions [35].
Sports drinks stimulate the process of rapid absorption of fluids, accelerate the hydration of the body, provide a source of carbohydrates as an energy resource used during exercise, and facilitate full recovery after exercise. However, the effectiveness of hydration resulting from the consumption of sports drinks is not immediate, as the fluid must be absorbed in the proximal part of the small intestine, where 50–60% of any fluid taken orally is absorbed. Therefore, “optimal” sports drinks should provide rapid gastric emptying, maintain fluid balance, provide minerals that are normally lost through sweat, and be a sufficient source of carbohydrates. There are three main types of sports drinks: isotonic, hypertonic, and hypotonic containing different amounts of fluids, electrolytes, and carbohydrates [36,37].
Sports drinks may be divided into three subgroups, namely, hypotonic drinks, hypertonic drinks, and isotonic drinks. However, all of them are found as sports drinks, and their composition, and thus the impact on the human body, is radically different. The main purpose of a hypertonic drink is to reduce water content, while a hypotonic one should increase it. The consumption of isotonic drinks provides the proper content of minerals in the human body. The differences between the subgroups of sports drinks are shown in Figure 1.
Hypotonic drinks are characterized by low osmolarity and sugar concentration (around 4 g/100 mL or even less). They are absorbed better than pure water but less so than isotonic drinks. Due to the low concentration of sugar, hypotonic drinks provide less energy compared to other sports drinks. For best results, they should be taken in combination with energy gels or bars. Due to their low calorific value, they are dedicated for shorter workouts where hydration is important, and calorie restriction is essential [38,39].
The opposite of hypotonic drinks is hypertonic drinks. Hypertonic beverages have a higher osmolarity than body fluids. The concentration of carbohydrates and electrolytes is higher than 8 g per 100 mL of drinks. They are absorbed more slowly than pure water, so they reduce the rate of fluid replenishment and, in the case of large differences in osmolarity, lead to the release of water from the cells. It is a consequence of the excess concentration of sugars in the form of sucrose, glucose or fructose, and electrolyte ions (sodium, potassium, magnesium, calcium, chloride, and phosphate) [40,41].
Of all the types of sports drinks mentioned, isotonic drinks are the most popular. Therefore, when we use the term sports drinks, in 99% of all cases, we will be dealing with an isotonic drink [42,43]. Isotonic drinks are a group of functional drinks whose primary purpose is to hydrate the body and preserve the correct content of minerals in the body. Osmolality is one of the factors used as an indicator of their suitability for adequate hydration. According to European Commission guidelines, the osmolality value of isotonic beverages should be in the range of 270–330 mOsm/kg. Isotonic drinks, due to their expected effects and normative requirements, should be richer in sugars, with a high glycemic index (GI) of no less than 75% of the total carbohydrate content. The glycemic index is the percentage increase in blood glucose levels after consuming a serving of a product containing 50 g of assailable carbohydrates. The base of the scale (100%) is taken as the increase in blood sugar after consuming 50 g of glucose. The direct utilization of glucose by the body’s cells is associated with maintaining a constant blood glucose concentration of 70–120 mg/dL in a healthy person [43,44,45].
For sports people aiming to maintain adequate blood glucose levels during intense exercise, this is extremely important. Carbohydrates are mainly responsible for the energy value of isotonic drinks, and the amount of energy derived from them should be between 60 and 65% of the total energy supply. The energy value of isotonic drinks must range between 80 and 350 kcal/L. For this reason, therefore, athletes supplement with isotonic drinks rich in carbohydrates with a high glycemic index (>70), including glucose, sucrose, and fructose. The higher the GI value of a given product, the higher the blood glucose concentration. After using the glucose source, the body uses the glycogen stored in the liver and muscles, but its reserves are about 450 g, which is enough for 2 h of intensive exercise and 11 h of light work [39].
Another parameter that must be monitored in the case of isotonic drinks is the concentration of sodium. By European Commission recommendation, the concentration of sodium must range between 460 mg/L (20 mmol/L) and 1150 mg/L (50 mmol/L). By supplementation with isotonic drinks, two major minerals, namely, sodium and potassium, are introduced to the body to maintain the electrolyte balance. The normal blood concentration is between 136 and 145 mmol/L. The correct content of this component in the body fluid solution guarantees the correct maintenance of physiological processes [46,47].
The characteristics of all subgroups of sports drinks are summarized in Table 1.

4. Composition of Sports Drinks

As outlined above, sports drinks, including isotonic drinks, are mainly dedicated to people who are physically active or handle high-stress mental work. Their primary task is to protect the body from excessive water loss, but also to provide carbohydrates and restore electrolyte concentrations. Isotonic drinks are products with a specially selected composition containing mainly carbohydrates, electrolytes, and a few minor ingredients to improve taste or provide vitamins [44]. The compositions of popular isotonic drinks are summarized in Table 2. The values shown in Table 2 are in accordance with the manufacturers’ specifications and on the products’ labels.
Carbohydrates provide energy for the muscles and brain and also contribute to the taste of sports drinks. It is known that the consumption of carbohydrates can have a positive impact on performance in many sports [48]. According to the Academy of Nutrition and Dietetics, sports drinks should contain 6%–8% carbohydrates and be isotonic, allowing the stomach to empty faster during exercise [49]. Some drinks may also contain maltodextrin, a polymer of glucose that is digested faster and behaves the same way as glucose, which is more readily utilized during exercise. According to some studies [49], sports drinks containing a mix of carbohydrates, such as glucose and sucrose, rather than a single carbohydrate source, may improve intestinal absorption of carbohydrates, as different sugars are absorbed through different pathways in the intestinal tract. This results in an increased amount of carbohydrates being delivered to active muscle groups. Despite these facts, there is still a need to monitor the qualitative and quantitative profile of sports drinks, because most beverages consumed during certain sports do not contain an optimal saccharide profile [50,51].
The systematic intake of simple sugars during prolonged exercise accelerates gastric emptying, intestinal fluid absorption, and fluid delivery. This is caused by absorption by transporters of glucose and fructose. Glucose transport across the intestinal brush border is mediated by sodium-dependent glucose transporter 1 (SGLT1), while fructose is absorbed by GLUT 5 [52]. In addition, ingestion of solutions containing glucose and fructose increases exogenous carbohydrate oxidation and endurance performance compared to solutions containing single carbohydrates. A high intake of glucose along with fructose at 90 g for each hour of exercise prevents the feeling of fullness in the stomach compared to the intake of glucose alone. Research suggests that a glucose-to-fructose ratio of 1.2:1 to 1:1 is optimal for increasing exogenous carbohydrate oxidation while minimizing gastrointestinal discomfort during exercise [53,54].
Proper replenishment of lost fluids with the right sports drinks can also prevent or neutralize other common ailments, such as heat exhaustion and muscle cramps. Excessive sweating leads to electrolyte loss, which in turn is associated with involuntary muscle cramps [55]. Because of these inconveniences, the food sector has decided to develop a range of products with high electrolyte content to meet nutritional needs. Nowadays, most sports drinks on the market contain sodium, chloride, and potassium ions, because during physical exertion, there is an increased loss of these minerals [56].
Sodium, which is one of the electrolytes lost in significant amounts with sweat during and after exercise, participates in maintaining fluid balance, nerve transmission, and acid-base balance by facilitating intestinal fluid absorption and improving hydration. From the organoleptic properties, sodium improves taste and stimulates thirst mechanisms, prompting an increased fluid intake and an improvement in hydration [57]. Potassium is helpful in the process of muscle contraction, as well as helps to maintain proper electrolyte balance and stabilize blood pressure. For this reason, the combination of sodium and potassium in sports drinks helps prevent involuntary muscle contractions, which are found to be a key aspect of improving performance. However, because, sodium and potassium are electrolytes that are lost in significant amounts with sweat, sports drinks are enriched with magnesium and calcium, thus creating the conditions to combat muscle cramps and ensure optimal muscle function. [58,59].
An important element of sports drinks, along with carbohydrates and electrolytes, is taste. The more we like the taste of a drink, the more willing we are to drink it. The latest generation of sports drinks is developed based on natural ingredients. This kind of drink reduces the addition of artificial ingredients with sweeteners and organic syrup as a source of carbohydrates. Its composition is based on natural sea salt and coconut water as a source of electrolytes [60,61]. Products marketed as sports drinks also contain other substances such as vitamins, amino acids, and herbs. Keep in mind that additional ingredients can affect the taste sensation and subsequent consumption of a sports drink. Minerals such as sodium bicarbonate can also be added to sports drinks to buffer acid and carbon dioxide that builds up in the muscles and blood during high-intensity exercise [62,63]. This can delay muscle fatigue and increase endurance. However, the addition of sodium bicarbonate is limited. it is known that some people are intolerant to this additive, which manifests in gastrointestinal upset. B-complex vitamins and antioxidants such as vitamins A, C, and E, selenium, and green tea extract are also common in sports products. B-complex vitamins and vitamin C are water soluble, so excessive intake can be excreted in the urine. In a few exceptions, however, complications can arise; for example, vitamin B6 consumed in excessive amounts can cause peripheral nerve damage [64,65,66].

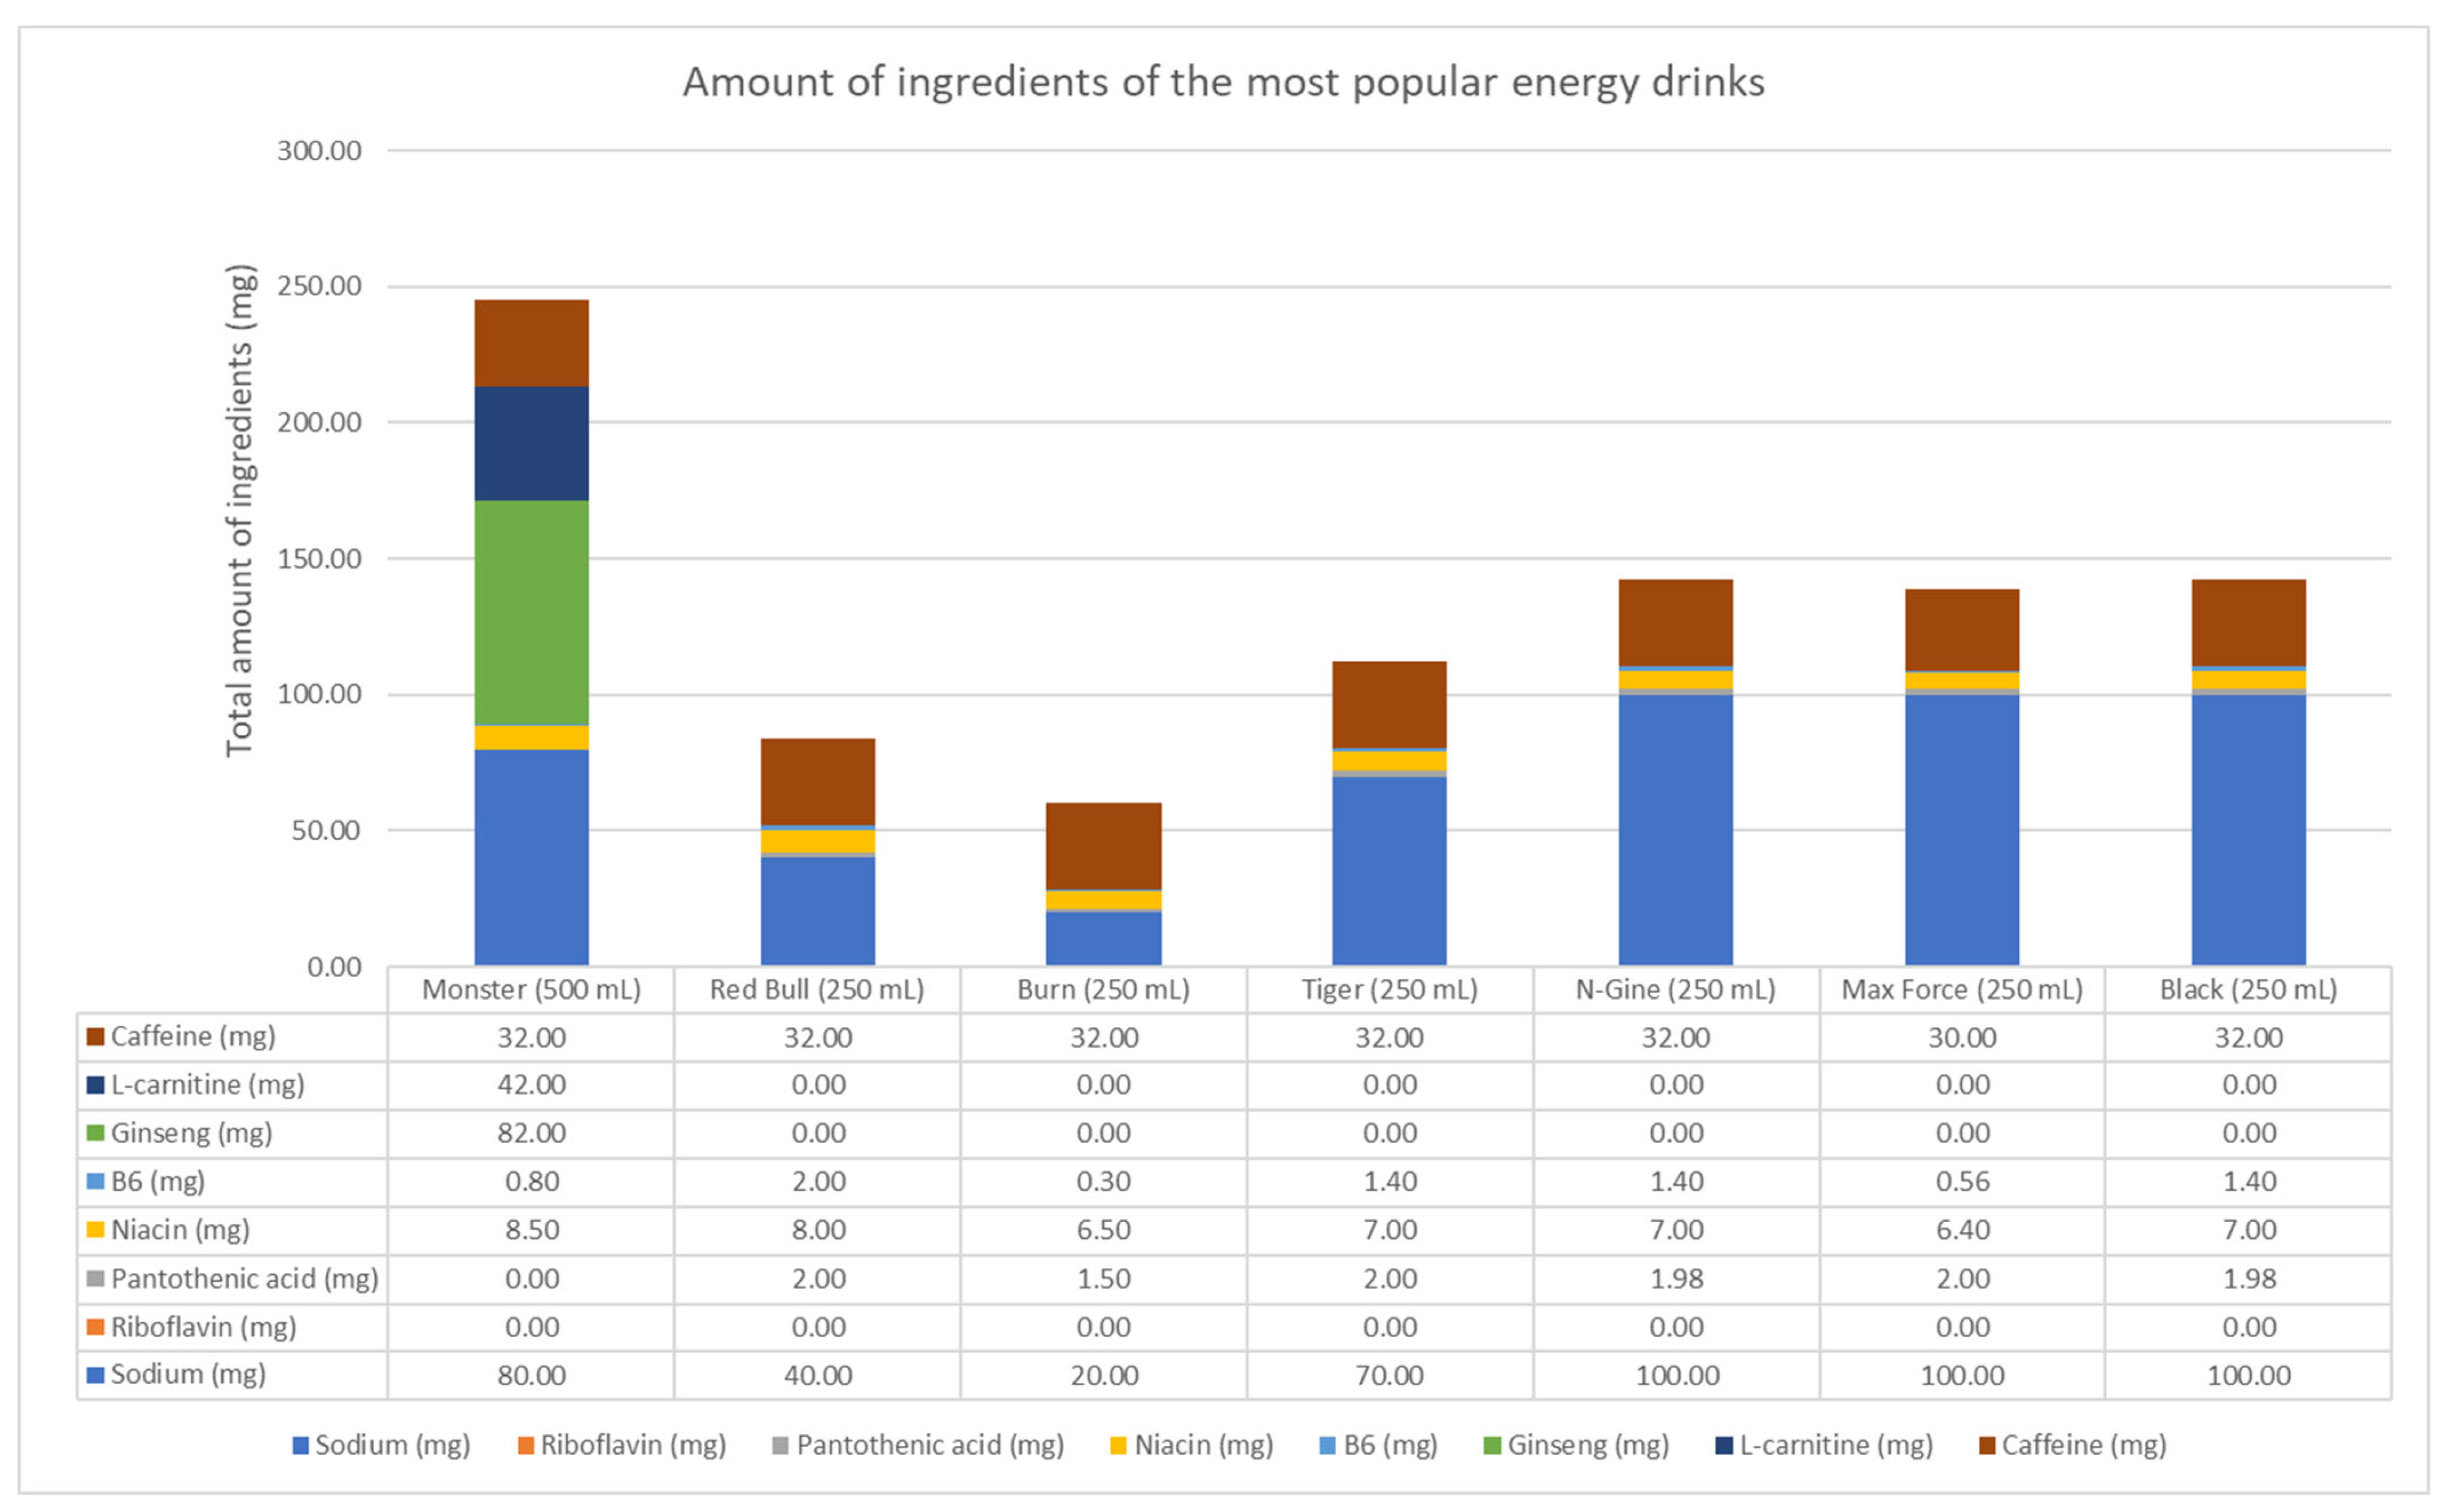
5. Composition of Energy Drinks

Caffeine is the primary ingredient in an energy drink, which is combined with other substances in such a way as to produce the desired stimulating effect. According to the WHO, caffeine in energy drinks should be limited to 80 mg per 250 mL (0.32 mg/mL). Some countries have set their own rules on caffeine dosage in energy drinks by adolescents. In Canada, the limit for caffeine in energy drinks is 400 mg/L, and one cup should contain about 180 mg of caffeine. In Europe, the limit of caffeine in energy drinks varies from country to country, but a drink that exceeds 150 mg/L of caffeine is classified as a high-caffeine drink. It has been shown that taking too much caffeine regularly can raise blood pressure, disrupt sleep patterns in teenagers, and increase mental illness [67]. A recent study found that, unfortunately, some manufacturers do not disclose the exact caffeine content of their products. It was found that the caffeine content of some products was about 20% higher than the amount of caffeine stated on the label [68].
In one of the most popular energy drinks on the market today, the caffeine content is about 77 mg per 300 mL (0.26 mg/mL). The second most popular energy drink has 86.4 mg per 500 mL (0.17 mg/mL). The effect of caffeine plays a very important role in maintaining cognitive function. Caffeine taken in doses of 3.0–5.0 mg per kilogram of body weight [69,70] enhances the brain’s cognitive abilities [71]. However, excess caffeine carries negative effects, such as anxiety, insomnia, elevated blood pressure, increased palpitations, and gastrointestinal upset.
Taurine is an organic compound, first identified in 1827, which has a wide range of biological activity. It gets its name from the word Taurus, meaning ox or bull, and the name was given because taurine was originally derived from the semen of a bull or the bile of an ox. However, energy drink manufacturers report that taurine used in commercial energy drinks is chemically synthesized [72]. The source of taurine is mainly the metabolism of methionine and cysteine. Taurine’s actions in the human body include the detoxification process, stabilization of cell membranes, osmoregulation, and maintenance of adequate calcium levels in cells [73]. In addition to its presence in energy drinks, it is used for such ailments as cardiovascular disease, epilepsy, Alzheimer’s disease, liver failure, and cystic fibrosis. The beneficial effects of taurine have also been noted in the treatment of hypertension and type 1 and type 2 diabetes mellitus. Taurine shows its healing and health properties only when consumed in the right amount. It was reported that one can (capacity 300 mL) of the most popular energy drink contains 1 g of taurine. According to available knowledge, taurine taken at a concentration of 1.5 g/day for 90 days can reduce the formation of platelet aggregates and thus treat diabetes [74,75,76].
Paullinia cupana, commonly known as guarana, is found in regions of Brazil and the Amazon. Its seeds are collected and then dried, roasted, and powdered [77]. Guarana is famous for having more than twice the caffeine content of coffee beans. This is due to the presence of guaranine, an alkaloid similar to caffeine. Guarana’s antioxidant effects and medicinal properties are what make it so popular in energy drinks. The high amount of polyphenolic compounds, such as tannins, allow us to assign guarana as a powerful antioxidant. The consumption of guarana inhibits the oxidation of fats in the body, which prevents cardiovascular disease. In addition, it improves the elasticity of the arteries and reduces inflammation and blood clots [78]. Guarana contains purine alkaloids, such as theobromine and theophylline, which act as stimulants. Studies show that theobromine is effective in treating asthma and several other respiratory infections, among other conditions [79]. The combination of guaranine, theobromine, and theophylline acts as an appetite suppressant and aids weight loss.
Ginseng is another additive present in energy drinks. Biologically active compounds of ginseng origin possess stimulant properties and are used in energy drinks to increase energy levels in the human body as well as to reduce stress levels [80,81].
Panax ginseng, also called ginseng, is a traditional herb used for its medicinal value in Korea, Japan, and China. According to tradition, it is believed that ginseng can be used to treat all types of diseases [68]. Several pharmacologically active compounds are present in the herb, some of which are ginsenosides, also known as tetracyclic terpenoid saponins, polyacetylenes, acidic polysaccharides, and polyphenolic compounds. Ginsenosides are divided into three different categories depending on their aglycone structure and are listed below:
-
Protopanaxadiol group: Examples: Rc, Rd, Rb1 and Rb2, (Figure 2); [82]
-
Protopanaxatriol group: Examples: Re, Rf, Rg1, and Rg2 (Figure 3); [82]
-
Oleate group: Examples: Ro (Figure 4). [83]
However, ginseng is known as an herb with therapeutic properties. Recent studies have shown that ginsenosides such as Rb1, Rg1, Rg3, Re, and Rd are more effective in treating ailments than whole plants [83]. The antioxidant, anti-inflammatory, and anti-cytotoxic effects of ginseng and ginsenosides have beneficial effects on the nervous and cardiovascular systems. The ginsenoside Rb1, used at low concentrations (10 μM), inhibits human umbilical vein endothelial cell (HUVEC) proliferation. People with high homocysteine levels have hardening of the arteries and blood clots, increasing the risk of heart disease. Homocysteine activity in endothelial cells is inhibited by the ginsenosides Rb1 [85].
In the technological process of producing energizers, complexes of vitamin B such as B1, B2, B3, B5, B6, B7, B9, and B12 are also added. The aforementioned water-soluble vitamins are collectively known as the B vitamin complex. Their most important function is to maintain the production and breakdown of important components such as carbohydrates, fats, and proteins [86]. Several studies have observed that the effects of certain B vitamins, such as pantothenic acid (B5) and niacin (B3), improve mental performance and reduce fatigue and drowsiness. An energy drink with an energy value of 45 kcal has been shown to contain 40 mg of niacin (B3), 10 mg of pantothenic acid (B5), 10 mg of pyridoxine (B6), and 10 μg of cyanocobalamin (B12). Energy drinks are also supplemented by riboflavin (B2). Riboflavin can be added in two forms: pure vitamin B2, or in the form of riboflavin sodium phosphate. The added form of vitamin B2 is very important due to bioavailability because it is known that riboflavin sodium phosphate is better absorbed in comparison to pure form. Unfortunately, riboflavin sodium phosphate can cause allergic reactions in the human body. Therefore, the concentrations used in the drink play an important role. According to the guidelines, an adult can consume a maximum of 100 mg of B vitamins per day [87,88].
Another addition to energy drinks is Ginkgo biloba. Commonly known as the maidenhair tree, it has been popular for centuries for its medicinal and healing properties. The use of Ginkgo biloba extracts is well known in China for the treatment of asthma and bronchitis. The extracts are obtained from the dried leaves. Consumption of about 120–600 mg, may result in improved cognitive reflexes. Extracts of Ginkgo biloba have antioxidant properties [89,90]. Energy drinks are also enriched with amino acids, mainly L-carnitine. L-carnitine is made from methionine and lysine. The main function of L-carnitine is to break down fat during exercise and provide energy through fat metabolism. The beneficial impact of L-carnitine on human health by urging intense exercise has been also proved. For clinical purposes, carnitine can be consumed by healthy individuals in amounts up to 0.25 g to 2 g. However, patients suffering from kidney disorders or undergoing dialysis are advised against its consumption [91,92].
In every commonly available energy drink, there are significant amounts of sugar. For example, 250 mL of the most popular energy drink contains about 50–60 g of sugar, which corresponds to 10–12 teaspoons [93]. Consuming excessive amounts of sugar over a long period increases the risk of obesity and diabetes. Furthermore, exposing the human body to large amounts of sugar leads to insulin-resistant development. It is a consequence of the inhibition of the beta cells of the pancreas to secrete insulin in adequate amounts, thereby increasing blood glucose levels, and causing diabetes [85,94]. The compositions of popular energy drinks are summarized in Table 3 and illustrated in Figure 5.
Additionally, the composition of the energy drinks are presented in Figure 4.

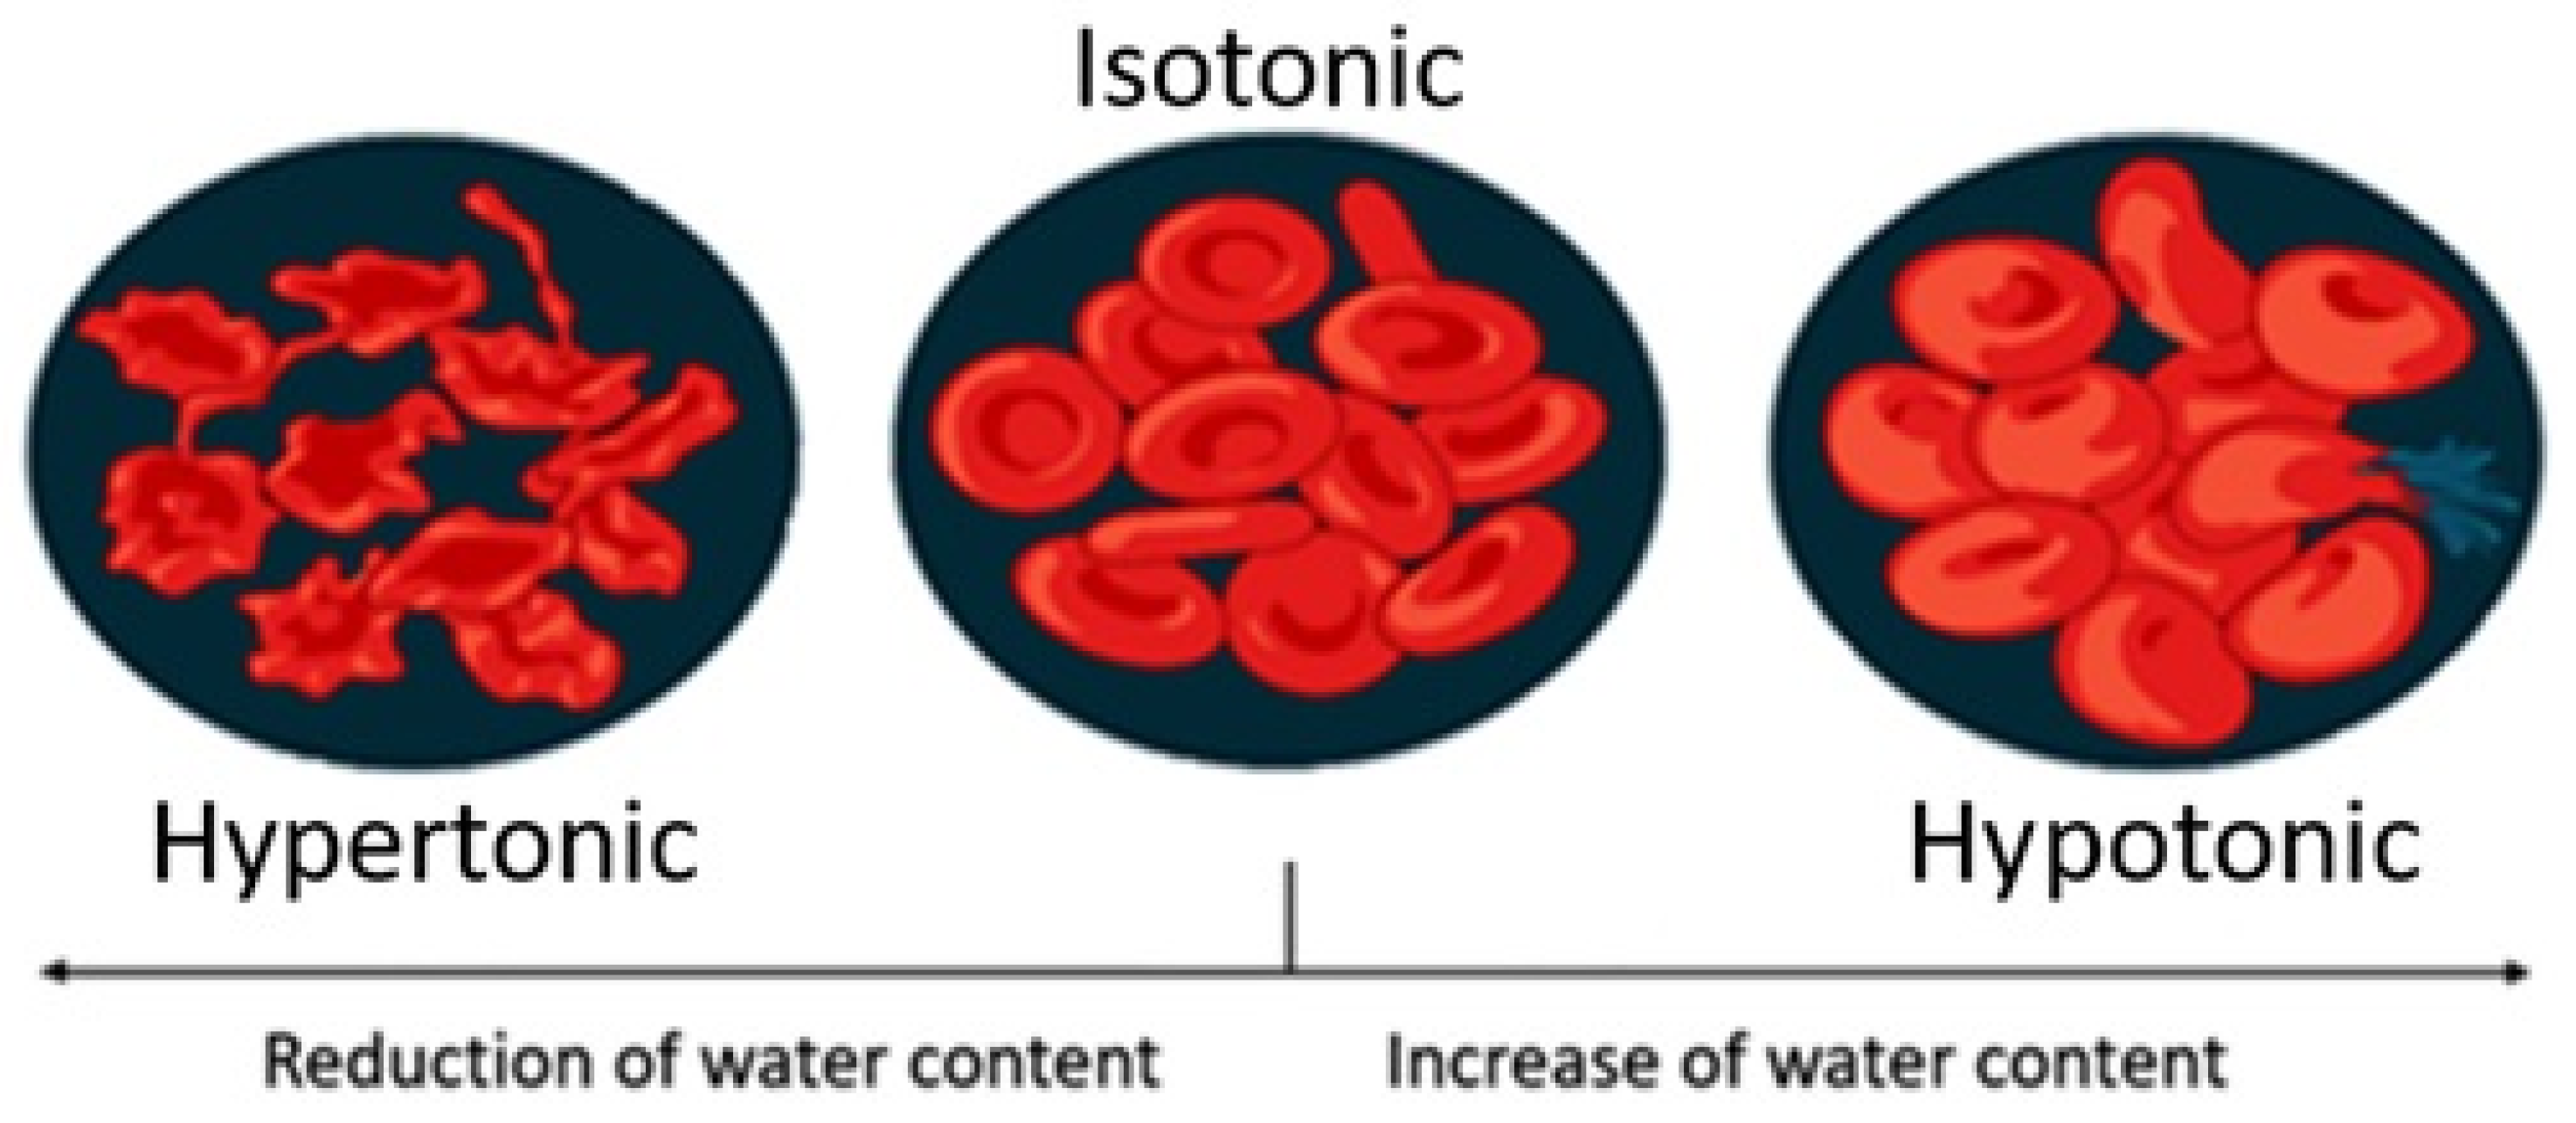
6. The Difference between Isotonic Sports Drinks and Energy Drinks

Isotonic sports drinks and energy drinks are a hallmark of modern society, constantly focused on maintaining good health. However, these drinks have differences in both the purposes for which they are used as well as their chemical composition. Energy drinks contain stimulating compounds, such as caffeine. It is worth highlighting that caffeine is one of the cheapest and most commonly used stimulants, with no nutritional value [44]. Year after year, energy drinks are gaining more and more customers. This is mainly due to the belief that they improve mental and physical performance by providing “energy.” In addition to this, manufacturers claim that the energy thus provided is significantly different from that derived from food. The chemical composition of energizers is extremely varied, but the most common substance, as was mentioned earlier, is caffeine. These drinks contain sweeteners, mainly artificial, very rarely natural, nitrogenous compounds (amino acids, alkaloids, etc.), vitamins (B and C), and herbal extracts (guarana, green tea, ginseng, Ginkgo biloba, etc.). On another note, sports drinks are designed to improve and support athletes’ performance by providing water and salts lost through sweating [36].
Energy drinks were developed for a specific purpose, namely, to provide real and visible mental enhancement and/or performance. Consuming energy drinks before exercise is believed to improve mental focus, alertness, anaerobic capacity, and endurance performance. While some of the substances in energetics are important for the normal functioning of the body, this does not mean that a person consuming the drink is deficient in them [95]. Therefore, several studies have been conducted over the years to evaluate issues related to overall consumption and occurred side effects. The primary ergogenic component of most popular energy drinks on the market is carbohydrates combined with caffeine. Most brands sold on the market contain large amounts of glucose, and some brands offer artificially sweetened versions. The most common form of added sugar besides glucose is sucrose or corn syrup, which contains significant amounts of fructose. The amount of carbohydrates exceeds the recommended intake for physically active people and has health consequences. Frequent consumption of energy drinks potentially contributes to an increased risk of type 2 diabetes and obesity in people with sedentary lifestyles [96]. In addition, high sugar levels can slow the rate of fluid absorption into the bloodstream or lead to gastrointestinal upset [97]. The main ingredients of a popular isotonic sports drink are shown in Table 2, while those of energy drinks are in Table 3. The values shown in Table 3 are in accordance with the manufacturers’ specifications and the products’ labels.

7. Pros and Cons of Sports and Energy Drinks

Despite numerous studies showing the ergogenic effects of sports drinks and energy drinks, and manufacturers’ assurances that they are suitable and safe for consumers, there have been serious concerns about the need and safety of these products. Therefore, this paper aimed to summarize the most important aspects of these beverages, including their nutritional composition, applicability, biological properties, and beneficial and adverse health effects.
The consumption of sports drinks effectively restores the balance of fluids in the body, which are lost due to exercise. Maintaining the right amount of fluids is very important because any change can lead to a decrease in performance, deterioration of mood, and, in extreme cases, illness. From this point of view, sports drinks can have a beneficial effect on the body, as they replenish the electrolytes lost during training. Consumption of energy drinks is mainly intended to increase energy and improve cognitive performance, i.e., increase concentration and analytical skills. The caffeine contained in these drinks is mainly responsible for these effects.
Niacin relieves inflammation and joint pain by increasing muscle strength and flexibility, while pantothenic acid reduces anxiety disorders.
The undeniable danger of this group of beverages is the high sugar content. Sports drinks contain sugar as well as acidic additives, which together cause tooth enamel erosion and decay. The pH of most sports drinks is kept between 2.5 and 4.5. Citric acid is very commonly used in sports drinks, which has a huge impact on teeth. Minerals present in the outermost layers of the teeth are degraded by citric acid, exposing the dentin layer, which is further damaged, leading to tooth sensitivity.
Additionally, the large amount of carbohydrates present in sport drinks is harmful to the human body. Their excessive quantity causes gastrointestinal disorders manifested by water retention in the intestines. Exceed dose of sugar lead to obesity and also negatively affects the liver.
Excessive intake of sports drinks causes abnormal fluid absorption by the kidneys, which leads to lower blood sodium concentrations and, as a consequence, leads to hyponatremia.
Obesity is another danger of excessive drink consumption. It is not only due to the high sugar content. The presence of guarana and caffeine in energy drinks causes lipogenesis in the human body. Excess fat in the body accelerates its accumulation in the liver, which leads to insulin resistance, causing increasing fat accumulation in the lower abdominal region.

8. Summary

In summary, in just 50 years of existence, sports drinks have been scientifically proven to quickly replenish energy and fluids in the body, which directly translates to increased performance. From the secret weapon of Gold Star athletes, they have become a multi-billion dollar industry, available and distributed in the global marketplace. Considering the current trends focused on promoting health and well-being, these products will continue to be the first choice for Polish people and other nations around the world. However, it should be remembered that these drinks are dedicated to people during convalescence as well as during intensive training. Daily, excessive consumption of this type of drink leads to serious health consequences. As can be seen, the consumption of these beverages increases year by year, and producers are trying to develop new recipes that will surprise the consumer with innovative solutions while meeting their requirements.
Many newly published studies are trying to determine what changes will occur in this industry, whether it be in the development of taste and flavor, packaging, marketing, or health promotion. One thing is certain: basic ingredients such as water, carbohydrates, and electrolytes will always be key factors in creating sports drinks.

Author Contributions

Conceptualization, M.S., M.B.-F.; software, M.S.; writing—original draft preparation, M.S., M.B.-F.; writing—review and editing, B.B.; visualization, M.S.; supervision, B.B.; project administration, B.B. All authors have read and agreed to the published version of the manuscript.

Funding

This research received no external funding.

Data Availability Statement

No new data were created or analyzed in this study. Data sharing is not applicable to this article.

Conflicts of Interest

The authors declare no conflict of interest.

References

  1. Ahmed, U.; Mumtaz, R.; Anwar, H.; Mumtaz, S.; Qamar, A.M. Water Quality Monitoring: From Conventional to Emerging Technologies. Water Sci. Technol. Water Supply 2020, 20, 28–45. [Google Scholar] [CrossRef]
  2. Calderon, R.L. The Epidemiology of Chemical Contaminants of Drinking Water. Food Chem. Toxicol. Int. J. Publ. Br. Ind. Biol. Res. Assoc. 2000, 38, S13–S20. [Google Scholar] [CrossRef] [Green Version]
  3. Starzak, M.; Mathlouthi, M. Cluster Composition of Liquid Water Derived from Laser-Raman Spectra and Molecular Simulation Data. Food Chem. 2003, 82, 3–22. [Google Scholar] [CrossRef]
  4. Bjerrum, N. Structure and Properties of Ice. Science 1952, 115, 385–390. [Google Scholar] [CrossRef]
  5. Smith, L. Chapter Twelve—Historical Perspectives on Water Purification. In Chemistry and Water; Ahuja, S., Ed.; Elsevier: Amsterdam, The Netherlands, 2017; pp. 421–468. ISBN 978-0-12-809330-6. [Google Scholar]
  6. Cahoon, L.B. Chapter 15—Water Purification: Treatment of Microbial Contamination. In Advances in Water Purification Techniques; Ahuja, S., Ed.; Elsevier: Amsterdam, The Netherlands, 2019; pp. 385–395. ISBN 978-0-12-814790-0. [Google Scholar]
  7. Owa, F.D. Water Pollution: Sources, Effects, Control and Management. Mediterr. J. Soc. Sci. 2013, 4, 65. [Google Scholar] [CrossRef]
  8. Pandey, S. Water Pollution and Health. Kathmandu Univ. Med. J. 2006, 4, 128–134. [Google Scholar]
  9. Revenga, C.; Mock, G. Dirty Water: Pollution Problems Persist. Pilot Anal. Glob. Ecosyst. Freshw. Syst. 2001, 6, ISBN 1-56973-460-7. [Google Scholar]
  10. Anthonj, C.; Diekkrüger, B.; Borgemeister, C. Thomas Kistemann Health Risk Perceptions and Local Knowledge of Water-Related Infectious Disease Exposure among Kenyan Wetland Communities. Int. J. Hyg. Environ. Health 2019, 222, 34–48. [Google Scholar] [CrossRef]
  11. Wen, X.; Chen, F.; Lin, Y.; Zhu, H.; Yuan, F.; Kuang, D.; Jia, Z.; Yuan, Z. Microbial Indicators and Their Use for Monitoring Drinking Water Quality—A Review. Sustainability 2020, 12, 2249. [Google Scholar] [CrossRef] [Green Version]
  12. Cha, Y.; Park, S.S.; Kim, K.; Byeon, M.; Stow, C.A. Water resources of the Black Sea Basin at high spatial and temporal. Water Resour. Res. 2014, 10, 5375–5377. [Google Scholar] [CrossRef] [Green Version]
  13. Linden, K.G.; Mohseni, M. Applications of Advanced Oxidation Processes (AOPs) in Drinking Water Treatment; Springer: Cham, Switzerland, 2019; Volume 67, ISBN 978-3-319-76881-6. [Google Scholar]
  14. Cidu, R.; Frau, F.; Tore, P. Drinking Water Quality: Comparing Inorganic Components in Bottled Water and Italian Tap Water. J. Food Compos. Anal. 2011, 24, 184–193. [Google Scholar] [CrossRef]
  15. Xu, Z.; Shen, J.; Qu, Y.; Chen, H.; Zhou, X.; Hong, H.; Sun, H.; Lin, H.; Deng, W.; Wu, F. Using Simple and Easy Water Quality Parameters to Predict Trihalomethane Occurrence in Tap Water. Chemosphere 2022, 286, 131586. [Google Scholar] [CrossRef] [PubMed]
  16. Ober, J.; Karwot, J. Tap Water Quality: Seasonal User Surveys in Poland. Energies 2021, 14, 3841. [Google Scholar] [CrossRef]
  17. Sofi, M.H.; Gudi, R.; Karumuthil-Melethil, S.; Perez, N.; Johnson, B.M.; Vasu, C. PH of Drinking Water Influences the Composition of Gut Microbiome and Type 1 Diabetes Incidence. Diabetes 2014, 63, 632–644. [Google Scholar] [CrossRef] [PubMed] [Green Version]
  18. Koufman, J.A.; Johnston, N. Potential Benefits of PH 8.8 Alkaline Drinking Water as an Adjunct in the Treatment of Reflux Disease. Ann. Otol. Rhinol. Laryngol. 2012, 121, 431–434. [Google Scholar] [CrossRef]
  19. Cabral, J.P.S. Water Microbiology. Bacterial Pathogens and Water. Int. J. Environ. Res. Public Health 2010, 7, 3657–3703. [Google Scholar] [CrossRef]
  20. Rodríguez-Lázaro, D.; Cook, N.; Ruggeri, F.M.; Sellwood, J.; Nasser, A.; Nascimento, M.S.J.; D’Agostino, M.; Santos, R.; Saiz, J.C.; Rzeżutka, A.; et al. Virus Hazards from Food, Water and Other Contaminated Environments. FEMS Microbiol. Rev. 2012, 36, 786–814. [Google Scholar] [CrossRef] [Green Version]
  21. Hikal, W.M. Parasitic Contamination of Drinking Water and Egyptian Standards for Parasites in Drinking Water. Open J. Ecol. 2020, 10, 1–21. [Google Scholar] [CrossRef] [Green Version]
  22. Schoeller, D.A. Changes in Total Body Water with Age. Am. J. Clin. Nutr. 1989, 50, 1176–1181. [Google Scholar] [CrossRef]
  23. Shimamoto, H.; Komiya, S. The Turnover of Body Water as an Indicator of Health. J. Physiol. Anthropol. Appl. Human Sci. 2000, 19, 207–212. [Google Scholar] [CrossRef] [PubMed] [Green Version]
  24. Wiggins, P.M. Role of Water in Some Biological Processes. Microbiol. Rev. 1990, 54, 432–449. [Google Scholar] [CrossRef] [PubMed]
  25. Gana, F.M. Sources and function of a water in the human body. Int. J. Adv. Sci. Res. 2022, 2, 22–27. [Google Scholar] [CrossRef]
  26. Kleiner, S.M. Water: An Essential but Overlooked Nutrient. J. Am. Diet. Assoc. 1999, 99, 200–206. [Google Scholar] [CrossRef] [PubMed]
  27. Karppanen, H.; Karppanen, P.; Mervaala, E. Why and How to Implement Sodium, Potassium, Calcium, and Magnesium Changes in Food Items and Diets? J. Hum. Hypertens. 2005, 19, S10–S19. [Google Scholar] [CrossRef] [Green Version]
  28. Glasdam, S.M.; Glasdam, S.; Peters, G.H. The Importance of Magnesium in the Human Body: A Systematic Literature Review. Adv. Clin. Chem. 2016, 73, 169–193. [Google Scholar] [CrossRef] [PubMed] [Green Version]
  29. Ilich, J.Z.; Blanuša, M.; Orlić, Ž.C.; Orct, T.; Kostial, K. Comparison of Calcium, Magnesium, Sodium, Potassium, Zinc, and Creatinine Concentration in 24-h and Spot Urine Samples in Women. Clin. Chem. Lab. Med. 2009, 47, 216–221. [Google Scholar] [CrossRef]
  30. Wenk, C.; Kuhnt, M.; Kunz, P.; Steiner, G. Methodological Studies of the Estimation of Loss of Sodium, Potassium, Calcium and Magnesium through the Skin during a 10 Km Run. Z. Ernahrungswiss. 1993, 32, 301–307. [Google Scholar] [CrossRef]
  31. Sutehall, S.; Muniz-Pardos, B.; Bosch, A.N.; Di Gianfrancesco, A.; Pitsiladis, Y.P. Sports Drinks on the Edge of a New Era. Curr. Sports Med. Rep. 2018, 17, 112–116. [Google Scholar] [CrossRef]
  32. Jiménez, S.L.; Díaz-Lara, J.; Pareja-Galeano, H.; Del Coso, J. Caffeinated Drinks and Physical Performance in Sport: A Systematic Review. Nutrients 2021, 13, 2944. [Google Scholar] [CrossRef]
  33. Meenakshi Sharma Mineral Supplements, Multivitamins, and Energy Drinks Are Commonly Consumed. Soc. Sci. J. Adv. Res. 2021, 1, 10–14. [CrossRef]
  34. Placentino, U.; Sogari, G.; Viscecchia, R.; De Devitiis, B.; Monacis, L. The New Challenge of Sports Nutrition: Accepting Insect Food as Dietary Supplements in Professional Athletes. Foods 2021, 10, 1117. [Google Scholar] [CrossRef]
  35. Agnihotri, A.; Bhattacharya, S. “BodyArmor Versus Gatorade: A Proxy Cola War?”. In SAGE Business Cases; SAGE Publications Ltd.: London, UK, 2023. [Google Scholar] [CrossRef]
  36. Jäger, R.; Harris, R.C.; Purpura, M.; Francaux, M. Comparison of new forms of creatine in raising plasma creatine levels. J. Int. Soc. Sports Nutr. 2007, 4, 17. [Google Scholar] [CrossRef] [Green Version]
  37. Fields, S.K.; Macdonald, J.; Joseph, A.M.; Wold, L.E.; Collins, C.L.; Dawn Comstock, R. Consumption of Sports and Energy Drinks by High School Athletes in the United States: A Pilot Study. Beverages 2015, 1, 218–224. [Google Scholar] [CrossRef] [Green Version]
  38. Bonetti, D.L.; Hopkins, W.G. Effects of Hypotonic and Isotonic Sports Drinks on Endurance Performance and Physiology. Sportscience 2010, 14, 63–70. [Google Scholar]
  39. Rowlands, D.S.; Kopetschny, B.H.; Badenhorst, C.E. The Hydrating Effects of Hypertonic, Isotonic and Hypotonic Sports Drinks and Waters on Central Hydration During Continuous Exercise: A Systematic Meta-Analysis and Perspective. Sport. Med. 2022, 52, 349–375. [Google Scholar] [CrossRef] [PubMed]
  40. Martínez-Lagunas, V.; Ding, Z.; Bernard, J.R.; Wang, B.; Ivy, J.L. Added Protein Maintains Efficacy of a Low-Carbohydrate Sports Drink. J. Strength Cond. Res. 2010, 24, 48–59. [Google Scholar] [CrossRef] [PubMed] [Green Version]
  41. Rowlands, D.S.; Bonetti, D.L.; Hopkins, W.G. Unilateral Fluid Absorption and Effects on Peak Power after Ingestion of Commercially Available Hypotonic, Isotonic, and Hypertonic Sports Drinks. Int. J. Sport Nutr. Exerc. Metab. 2011, 21, 480–491. [Google Scholar] [CrossRef]
  42. Colakoglu, F.F.; Cayci, B.; Yaman, M.; Karacan, S.; Gonulateş, S.; Ipekoglu, G.; Er, F. The Effects of the Intake of an Isotonic Sports Drink before Orienteering Competitions on Skeletal Muscle Damage. J. Phys. Ther. Sci. 2016, 28, 3200–3204. [Google Scholar] [CrossRef] [PubMed] [Green Version]
  43. Sadowska, A.; Świderski, F.; Kulik, K.; Waszkiewicz-Robak, B. Designing Functional Fruit-Based Recovery Drinks in Powder Form That Contain Electrolytes, Peptides, Carbohydrates and Prebiotic Fiber Taking into Account Each Component’s Osmolality. Molecules 2021, 26, 5607. [Google Scholar] [CrossRef] [PubMed]
  44. Leśniewicz, A.; Grzesiak, M.; Żyrnicki, W.; Borkowska-Burnecka, J. Mineral Composition and Nutritive Value of Isotonic and Energy Drinks. Biol. Trace Elem. Res. 2016, 170, 485–495. [Google Scholar] [CrossRef] [PubMed]
  45. Bechke, E.E.; Zaplatosch, M.E.; Choi, J.Y.; Adams, W.M. Utility of an Isotonic Beverage on Hydration Status and Cardiovascular Alterations. Nutrients 2022, 14, 1286. [Google Scholar] [CrossRef]
  46. Tomczyk, M.; Zaguła, G.; Dżugan, M. A Simple Method of Enrichment of Honey Powder with Phytochemicals and Its Potential Application in Isotonic Drink Industry. LWT 2020, 125, 109204. [Google Scholar] [CrossRef]
  47. Styburski, D.; Dec, K.; Baranowska-Bosiacka, I.; Goschorska, M.; Hołowko, J.; Żwierełło, W.; Skórka-Majewicz, M.; Janda, K.; Rosengardt, A.; Gutowska, I. Can Functional Beverages Serve as a Substantial Source of Macroelements and Microelements in Human Nutrition?—Analysis of Selected Minerals in Energy and Isotonic Drinks. Biol. Trace Elem. Res. 2020, 197, 341–348. [Google Scholar] [CrossRef]
  48. Sidery, M.B.; Macdonald, I.A. The Effect of Meal Size on the Cardiovascular Responses to Food Ingestion. Br. J. Nutr. 1994, 71, 835–848. [Google Scholar] [CrossRef]
  49. Tappy, L.; Lê, K.A.; Tran, C.; Paquot, N. Fructose and Metabolic Diseases: New Findings, New Questions. Nutrition 2010, 26, 1044–1049. [Google Scholar] [CrossRef]
  50. Burke, L.M.; Hawley, J.A.; Wong, S.H.S.; Jeukendrup, A.E. Carbohydrates for Training and Competition. J. Sports Sci. 2011, 29 (Suppl. S1), S17–S27. [Google Scholar] [CrossRef]
  51. Urdampilleta, A.; Gómez-Zorita, S.; Soriano, J.M.; Martínez-Sanz, J.M.; Medina, S.; Gil-Izquierdo, A. Hydration and Chemical Ingredients in Sport Drinks: Food Safety in the European Context. Nutr. Hosp. 2015, 31, 1889–1899. [Google Scholar] [CrossRef] [Green Version]
  52. Jeukendrup, A.E.; Moseley, L.; Mainwaring, G.I.; Samuels, S.; Perry, S.; Mann, C.H. Exogenous Carbohydrate Oxidation during Ultraendurance Exercise. J. Appl. Physiol. 2006, 100, 1134–1141. [Google Scholar] [CrossRef]
  53. Rowlands, D.S.; Thorburn, M.S.; Thorp, R.M.; Broadbent, S.; Shi, X. Effect of Graded Fructose Coingestion with Maltodextrin on Exogenous 14C-Fructose and 13C-Glucose Oxidation Efficiency and High-Intensity Cycling Performance. J. Appl. Physiol. 2008, 104, 1709–1719. [Google Scholar] [CrossRef] [Green Version]
  54. O’Brien, W.J.; Rowlands, D.S. Fructose-Maltodextrin Ratio in a Carbohydrate-Electrolyte Solution Differentially Affects Exogenous Carbohydrate Oxidation Rate, Gut Comfort, and Performance. Am. J. Physiol. Gastrointest. Liver Physiol. 2011, 300, 181–189. [Google Scholar] [CrossRef] [Green Version]
  55. Coombes, J.S.; Hamilton, K.L. The Effectiveness of Commercially Available Sports Drinks. Sport. Med. 2000, 29, 181–209. [Google Scholar] [CrossRef]
  56. Shirreffs, S.M. Hydration in Sport and Exercise: Water, Sports Drinks and Other Drinks. Nutr. Bull. 2009, 34, 374–379. [Google Scholar] [CrossRef]
  57. Thomas, D.T.; Erdman, K.A.; Burke, L.M. American College of Sports Medicine Joint Position Statement. Nutrition and Athletic Performance. Med. Sci. Sports Exerc. 2016, 48, 543–568. [Google Scholar] [CrossRef] [PubMed]
  58. Kerksick, C.M.; Wilborn, C.D.; Roberts, M.D.; Smith-Ryan, A.; Kleiner, S.M.; Jäger, R.; Collins, R.; Cooke, M.; Davis, J.N.; Galvan, E.; et al. ISSN exercise & sports nutrition review update: Research & recommendations. J. Int. Soc. Sports Nutr. 2018, 15, 38. [Google Scholar] [CrossRef] [Green Version]
  59. Halder, S.; Daw, S. Importance of sports drinks as a performance prerequisites. Senhri J. Multidiscip. Stud. 2020, 5, 2582–6840. [Google Scholar] [CrossRef]
  60. Jacob, S. Consumption Pattern of Nutritional Health Drinks and Energy Drinks among University Students in Ajman, UAE. Gulf Med. J. 2013, 2, 22–26. [Google Scholar]
  61. Visram, S.; Cheetham, M.; Riby, D.M.; Crossley, S.J.; Lake, A.A. Consumption of Energy Drinks by Children and Young People: A Rapid Review Examining Evidence of Physical Effects and Consumer Attitudes. BMJ Open 2016, 6, e010380. [Google Scholar] [CrossRef] [Green Version]
  62. Tahmassebi, J.F.; BaniHani, A. Impact of Soft Drinks to Health and Economy: A Critical Review. Eur. Arch. Paediatr. Dent. 2020, 21, 109–117. [Google Scholar] [CrossRef] [Green Version]
  63. Wardle, J.; Huon, G. An Experimental Investigation of the Influence of Health Information on Children’s Taste Preferences. Health Educ. Res. 2000, 15, 39–44. [Google Scholar] [CrossRef] [Green Version]
  64. Angeles-agdeppa, I.; Kurilich, A.C.; Harjani, Y.; Capanzana, M.V. The Effect of a Nutrient Fortified Oat Drink on Iron, Zinc, Vitamin A, and Vitamin C Status among Filipino Children. World Acad. Sci. Eng. Technol. 2012, 70, 1119–1127. [Google Scholar]
  65. Obuzor, G.U.; Ajaezi, N.E. Nutritional Content of Popular Malt Drinks Produced in Nigeria. Afr. J. Food Sci. 2010, 4, 585–590. [Google Scholar]
  66. Tynes, M.; Hepprich, M.; Timper, K. Regular Intake of Energy Drinks and Multivitamin Supplements Is Associated with Elevated Plasma Vitamin B6 Levels in Post-Bariatric Patients. Sci. Rep. 2021, 11, 17830. [Google Scholar] [CrossRef]
  67. Reid, J.L.; McCrory, C.; White, C.M.; Martineau, C.; Vanderkooy, P.; Fenton, N.; Hammond, D. Consumption of Caffeinated Energy Drinks Among Youth and Young Adults in Canada. Prev. Med. Rep. 2017, 5, 65–70. [Google Scholar] [CrossRef] [Green Version]
  68. Higgins, J.P.; Tuttle, T.D.; Higgins, C.L. Energy Beverages: Content and Safety. Mayo Clin. Proc. 2010, 85, 1033–1041. [Google Scholar] [CrossRef] [Green Version]
  69. Acheson, K.J.; Zahorska-Markiewicz, B.; Pittet, P.; Anantharaman, K.; Jéquier, E. Caffeine and Coffee: Their Influence on Metabolic Rate and Substrate Utilization in Normal Weight and Obese Individuals. Am. J. Clin. Nutr. 1980, 33, 989–997. [Google Scholar] [CrossRef] [PubMed] [Green Version]
  70. Alford, C.; Cox, H.; Wescott, R. The Effects of Red Bull Energy Drink on Human Performance and Mood. Amino Acids 2001, 21, 139–150. [Google Scholar] [CrossRef]
  71. Grgic, J.; Mikulic, P. Caffeine Ingestion Acutely Enhances Muscular Strength and Power but Not Muscular Endurance in Resistance-Trained Men. Eur. J. Sport Sci. 2017, 17, 1029–1036. [Google Scholar] [CrossRef]
  72. Caine, J.J.; Geracioti, T.D. Taurine, Energy Drinks, and Neuroendocrine Effects. Cleve. Clin. J. Med. 2016, 83, 895–904. [Google Scholar] [CrossRef] [Green Version]
  73. Sawabe, Y.; Tagami, T.; Yamasaki, K. Determination of Taurine in Energy Drinks by HPLC Using a Pre-Column Derivative. J. Health Sci. 2008, 54, 661–664. [Google Scholar] [CrossRef] [Green Version]
  74. Lage-Yusty, M.A.; Villar-Blanco, L.; López-Hernandez, J. Evaluation of Caffeine, Vitamins and Taurine in Energy Drinks. J. Food Nutr. Res. 2019, 58, 107–114. [Google Scholar]
  75. Doerner, J.M.; Kuetting, D.L.; Luetkens, J.A.; Naehle, C.P.; Dabir, D.; Homsi, R.; Nadal, J.; Schild, H.H.; Thomas, D.K. Caffeine and Taurine Containing Energy Drink Increases Left Ventricular Contractility in Healthy Volunteers. Int. J. Cardiovasc. Imaging 2015, 31, 595–601. [Google Scholar] [CrossRef]
  76. De Carvalho, F.G.; Galan, B.S.M.; Santos, P.C.; Pritchett, K.; Pfrimer, K.; Ferriolli, E.; Papoti, M.; Marchini, J.S.; de Freitas, E.C. Taurine: A Potential Ergogenic Aid for Preventing Muscle Damage and Protein Catabolism and Decreasing Oxidative Stress Produced by Endurance Exercise. Front. Physiol. 2017, 8, 710. [Google Scholar] [CrossRef] [Green Version]
  77. Schimpl, F.C.; da Silva, J.F.; de Carvalho Gonçalves, J.F.; Mazzafera, P. Guarana: Revisiting a Highly Caffeinated Plant from the Amazon. J. Ethnopharmacol. 2013, 150, 14–31. [Google Scholar] [CrossRef]
  78. Moustakas, D.; Mezzio, M.; Rodriguez, B.R.; Constable, M.A.; Mulligan, M.E.; Voura, E.B. Guarana Provides Additional Stimulation over Caffeine Alone in the Planarian Model. PLoS ONE 2015, 10, e0123310. [Google Scholar] [CrossRef]
  79. Patrick, M.; Kim, H.A.; Oketch-Rabah, H.; Marles, R.J.; Roe, A.L.; Calderón, A.I. Safety of Guarana Seed as a Dietary Ingredient: A Review. J. Agric. Food Chem. 2019, 67, 11281–11287. [Google Scholar] [CrossRef]
  80. Rath, M. Energy Drinks: What Is All the Hype? The Dangers of Energy Drink Consumption. J. Am. Acad. Nurse Pract. 2012, 24, 70–76. [Google Scholar] [CrossRef] [PubMed]
  81. D’Angelo, S.; Ascione, A. Guarana and Physical Performance: A Myth or Reality? 2020. J. Hum. Sport Exerc. 2020, 15 (Proc3), S539–S551. [Google Scholar] [CrossRef]
  82. Yang, M.S.; Wu, M.Y. Chinese Ginseng. In Nutraceuticals; Gupta, R.C., Ed.; Academic Press: Boston, MA, USA, 2016; pp. 693–705. ISBN 978-0-12-802147-7. [Google Scholar]
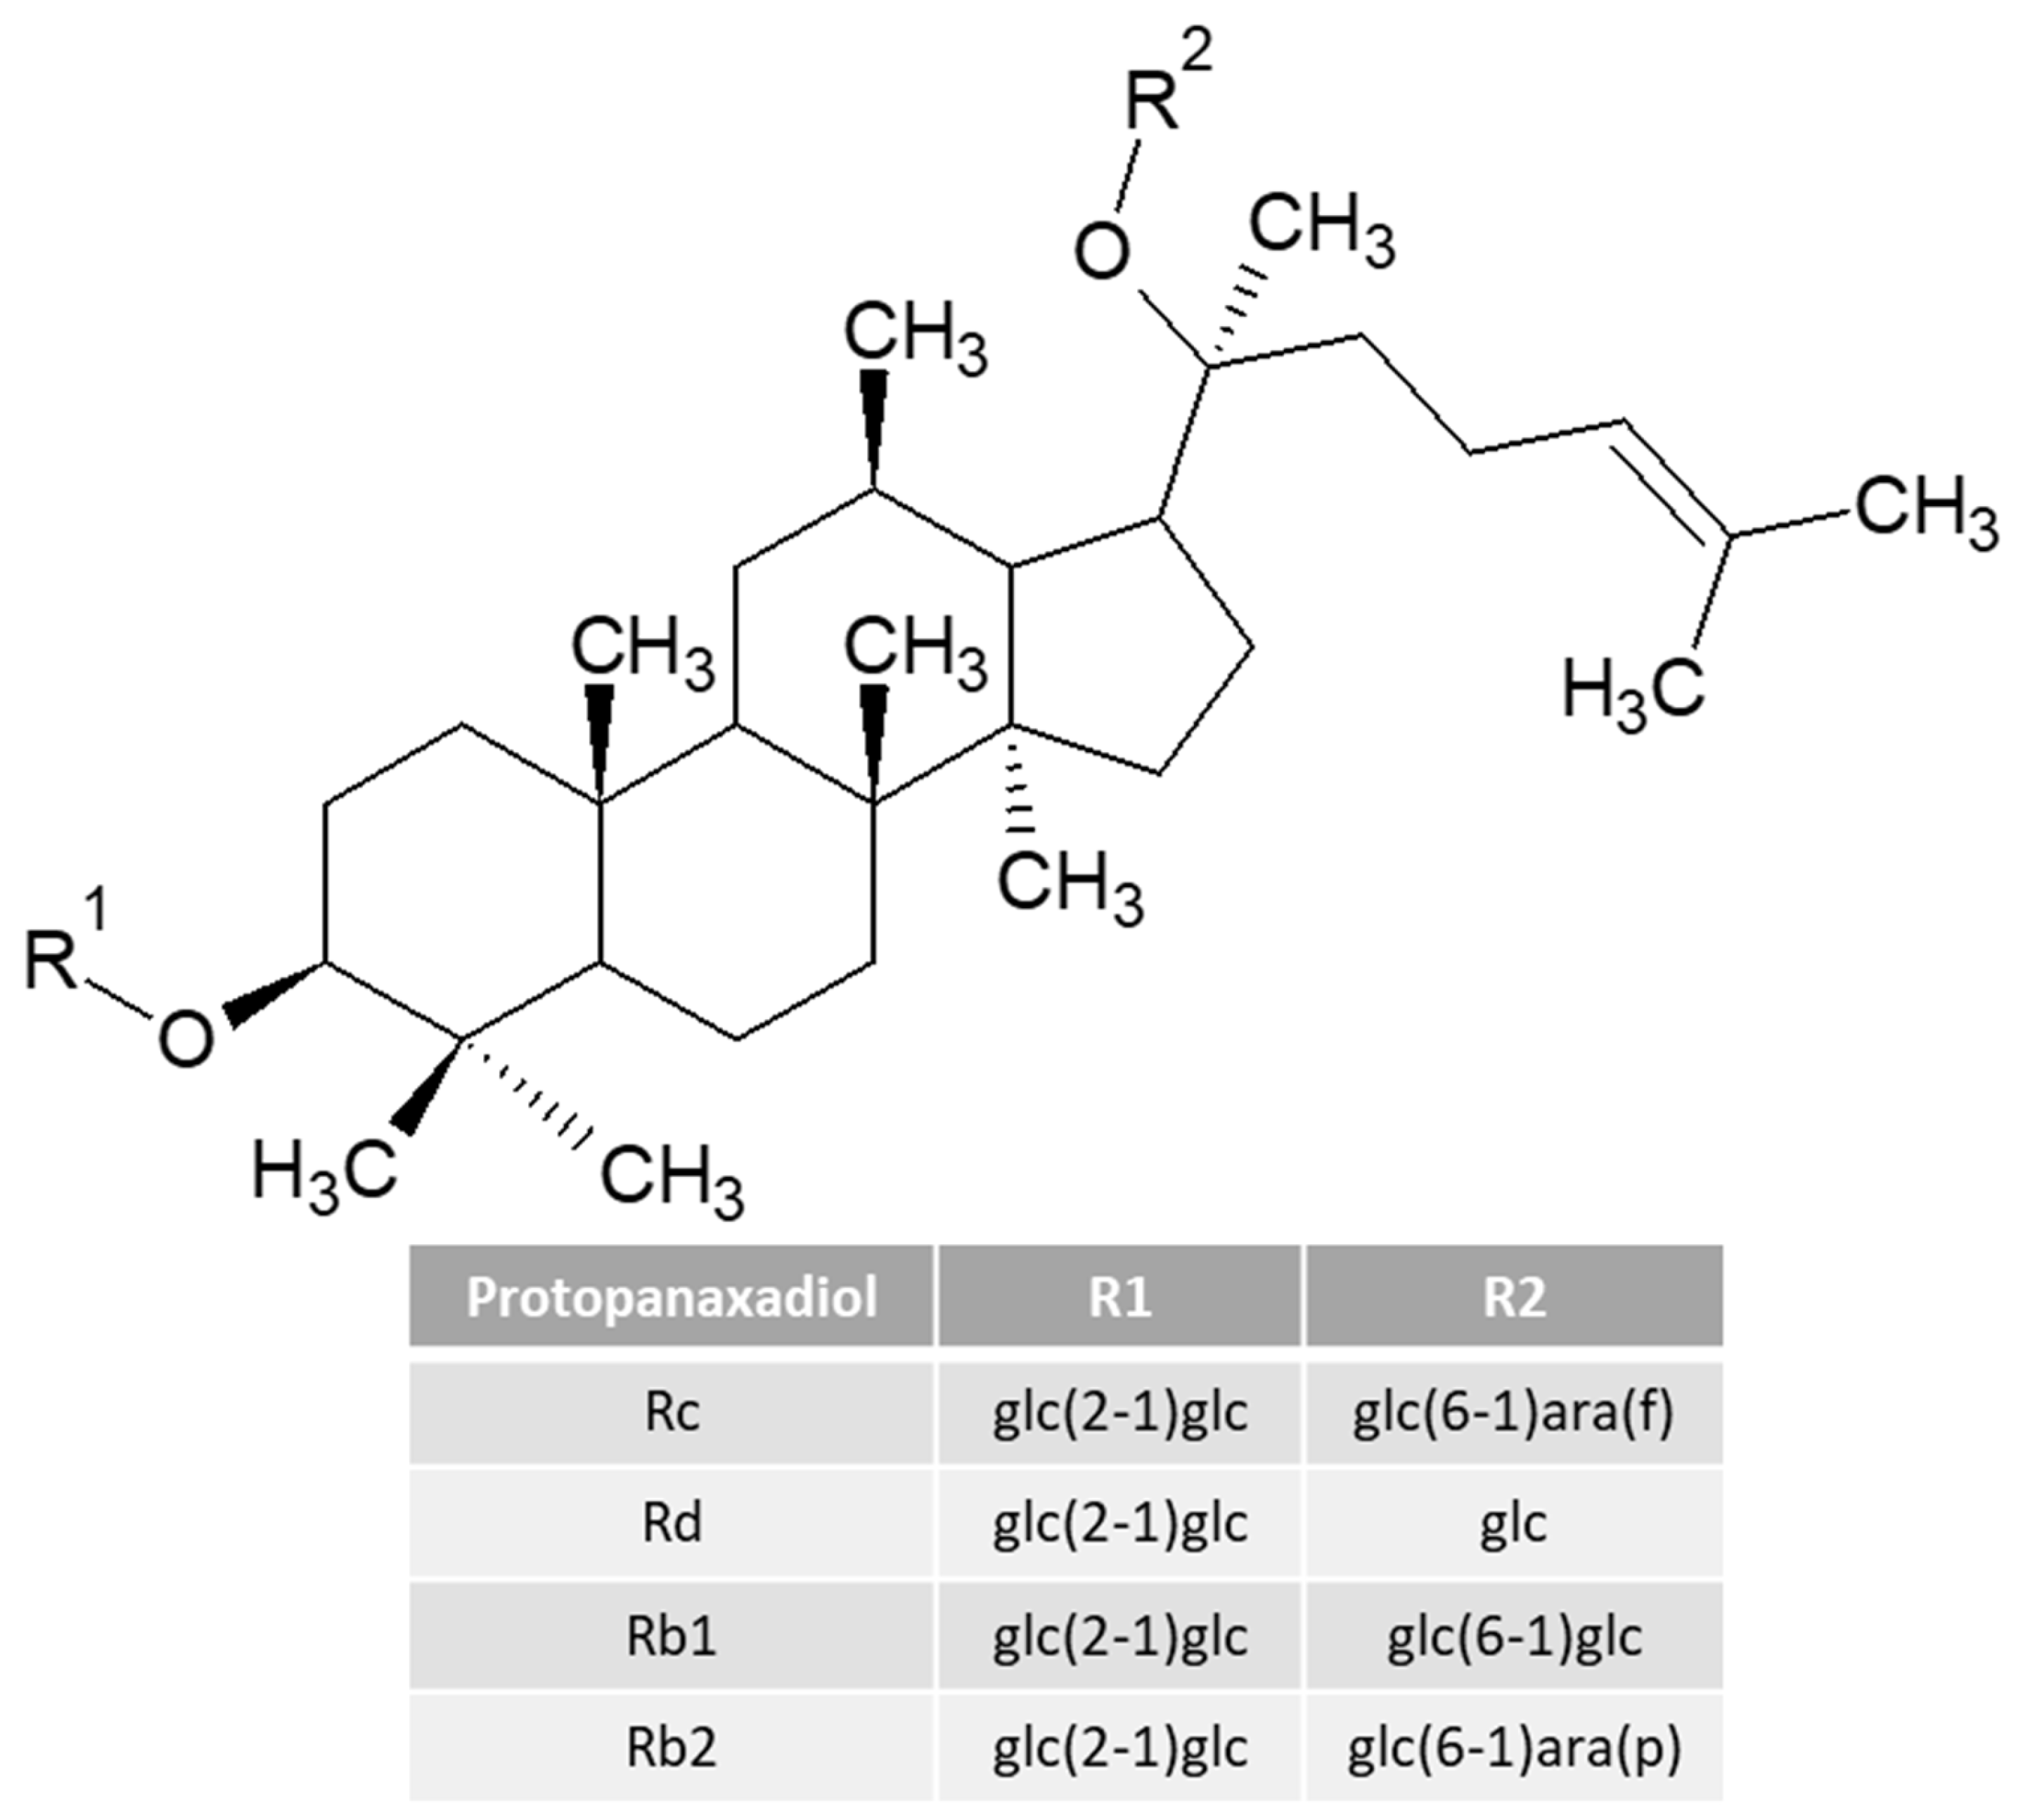
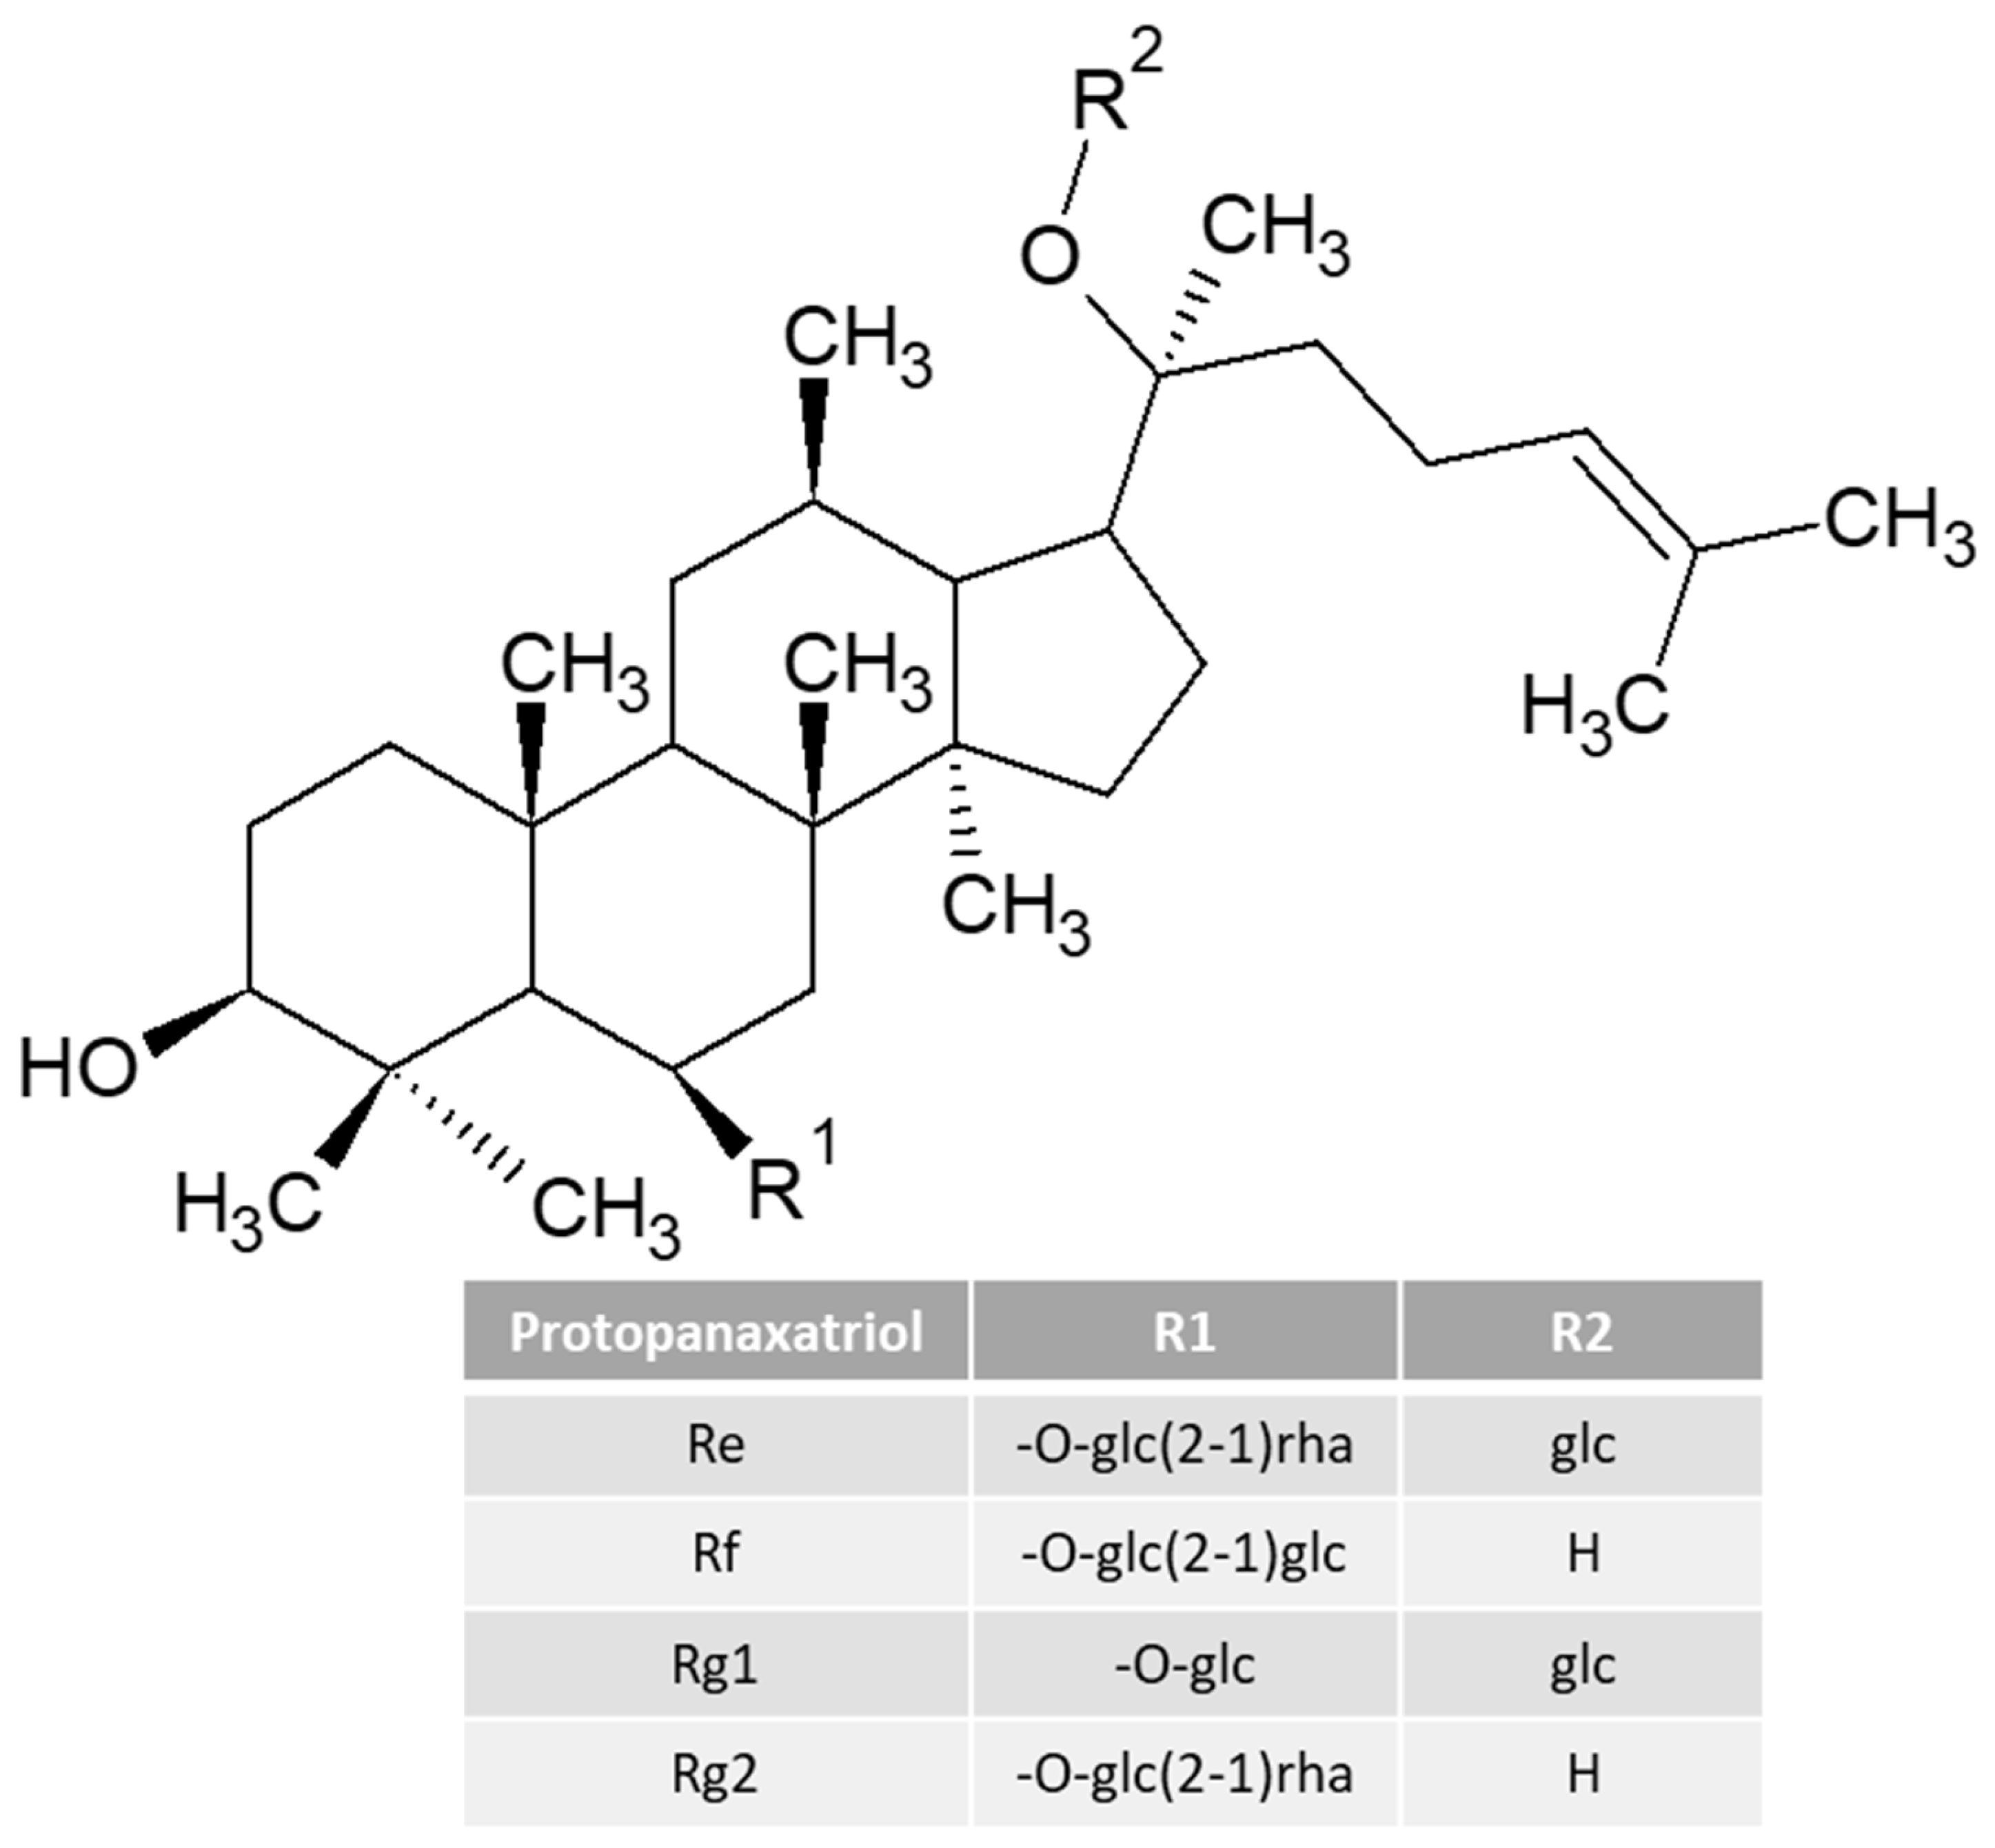
  83. Qi, B.; Zhang, L.; Zhang, Z.; Ouyang, J.; Huang, H. Effects of Ginsenosides-Rb1 on Exercise-Induced Oxidative Stress in Forced Swimming Mice. Pharmacogn. Mag. 2014, 10, 458–463. [Google Scholar] [CrossRef] [PubMed] [Green Version]
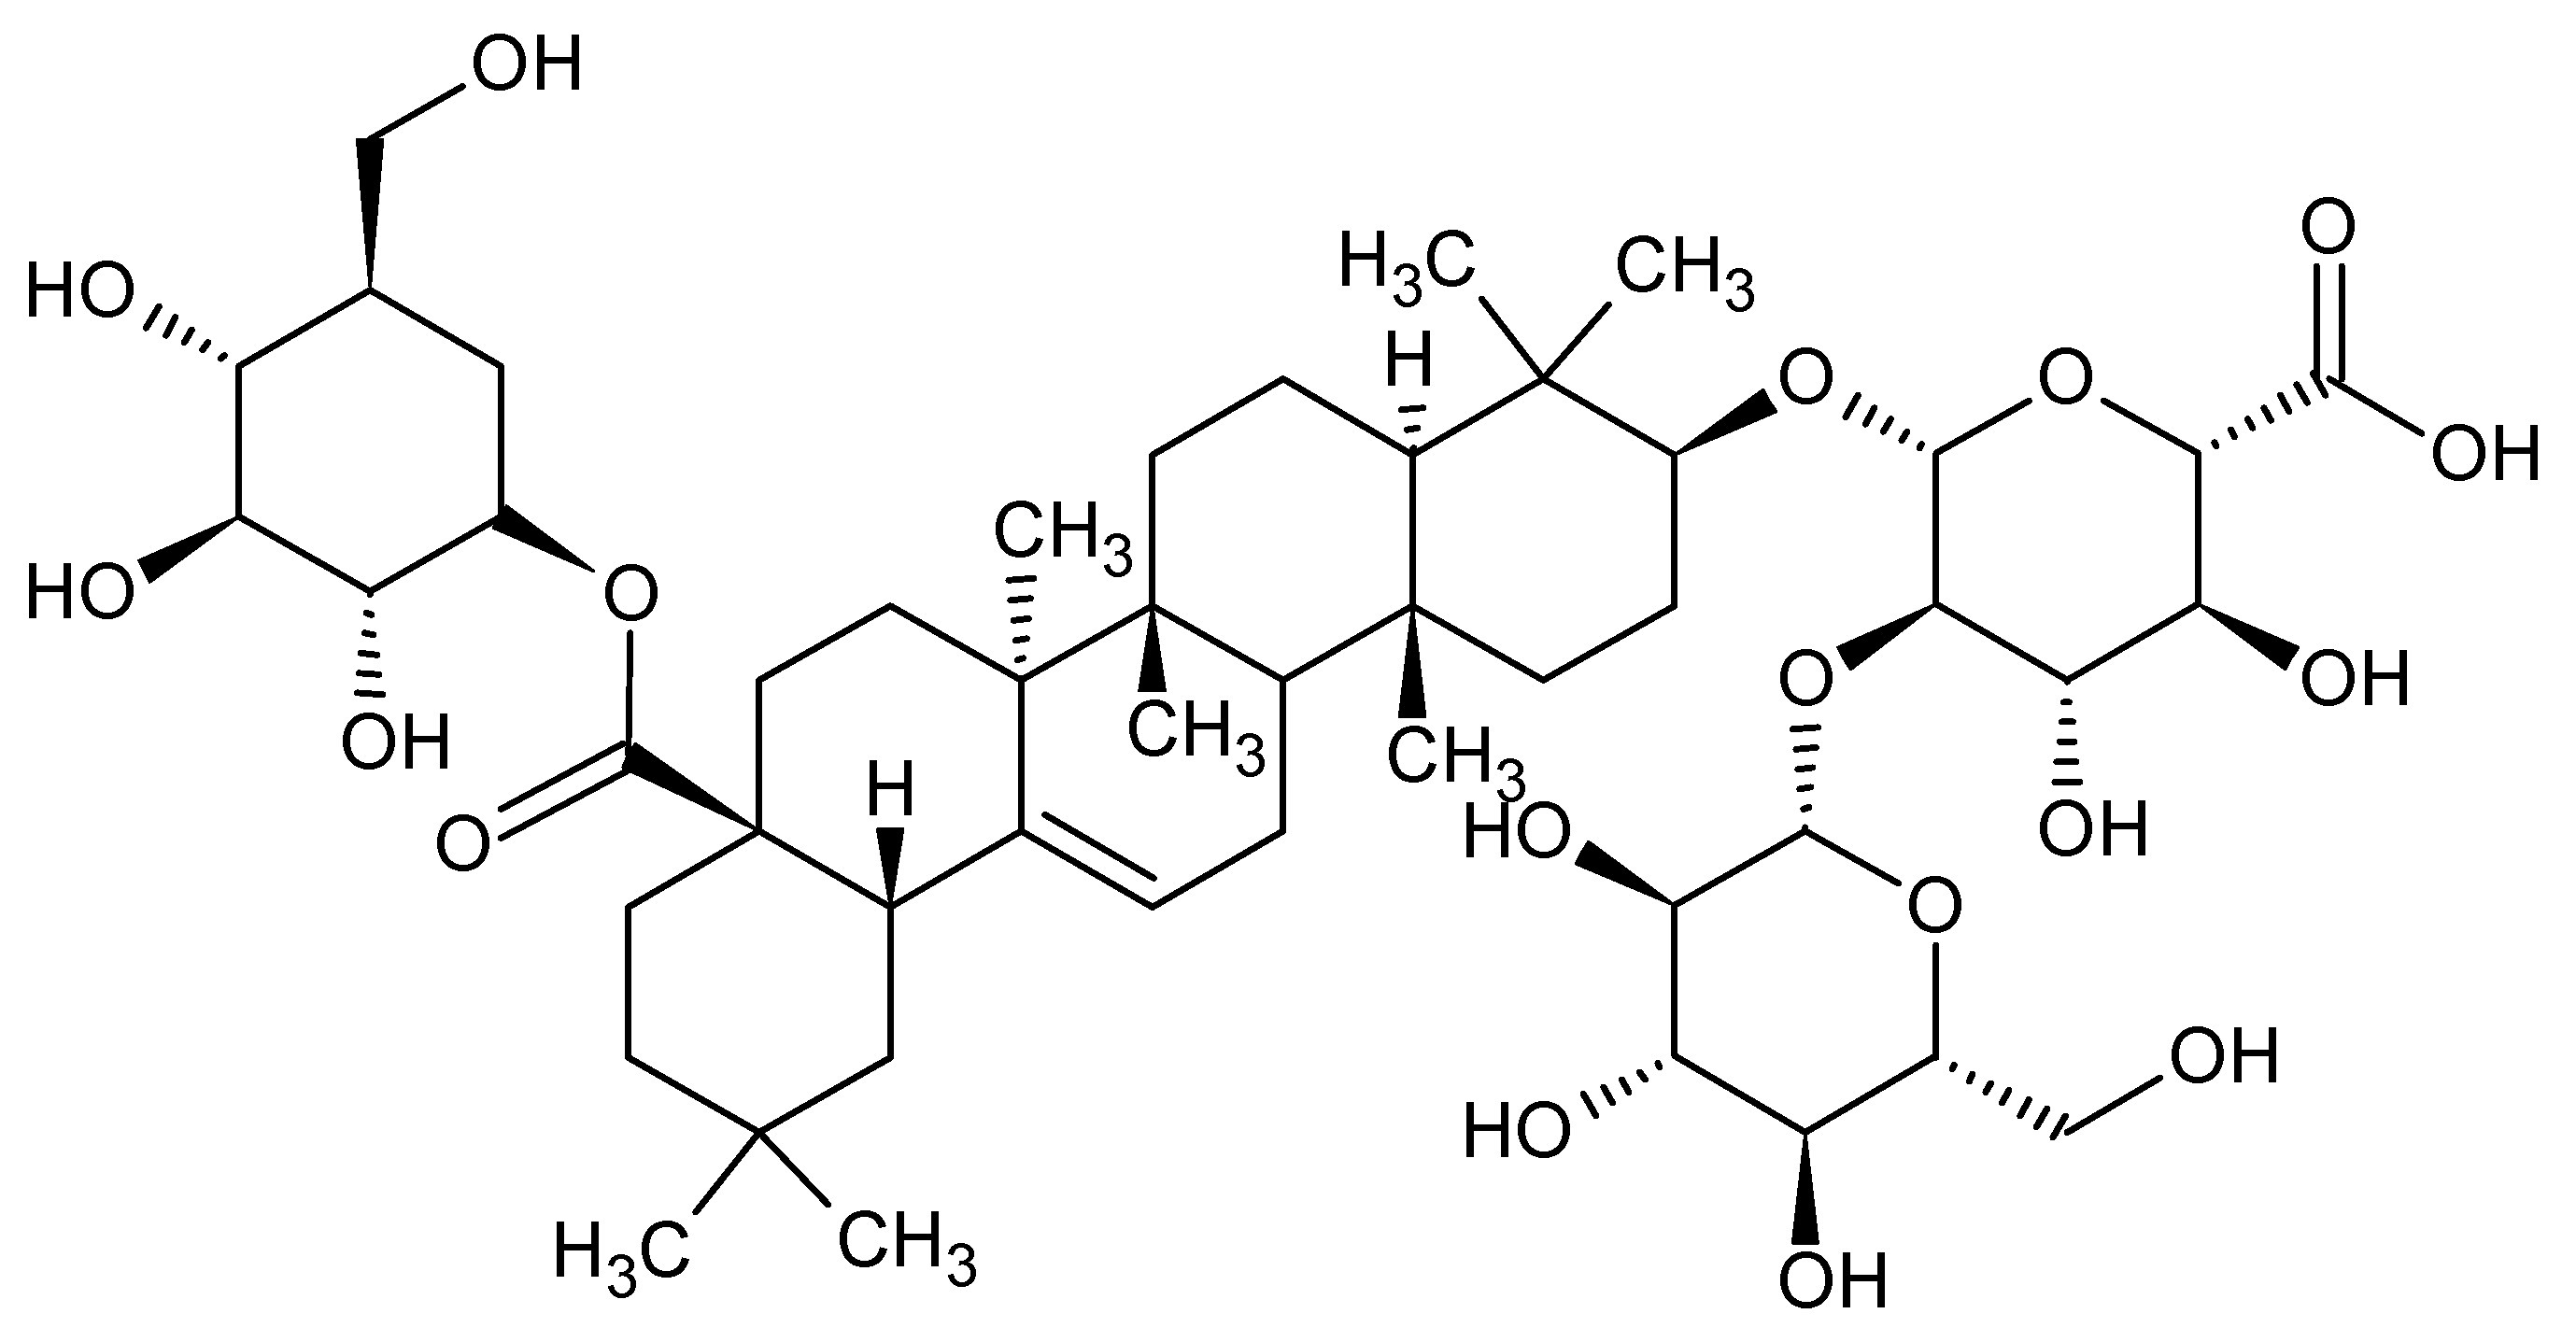
  84. Zheng, S.-W.; Xiao, S.-Y.; Wang, J.; Hou, W.; Wang, Y.-P. Inhibitory Effects of Ginsenoside Ro on the Growth of B16F10 Melanoma via Its Metabolites. Molecules 2019, 24, 2985. [Google Scholar] [CrossRef] [Green Version]
  85. Duchan, E.; Patel, N.D.; Feucht, C. Energy Drinks: A Review of Use and Safety for Athletes. Phys. Sportsmed. 2010, 38, 171–179. [Google Scholar] [CrossRef]
  86. Ballard, S.L.; Wellborn-Kim, J.J.; Clauson, K.A. Effects of Commercial Energy Drink Consumption on Athletic Performance and Body Composition. Phys. Sportsmed. 2010, 38, 107–117. [Google Scholar] [CrossRef]
  87. Kennedy, D.O.; Veasey, R.; Watson, A.; Dodd, F.; Jones, E.; Maggini, S.; Haskell, C.F. Effects of High-Dose B Vitamin Complex with Vitamin C and Minerals on Subjective Mood and Performance in Healthy Males. Psychopharmacology 2010, 211, 55–68. [Google Scholar] [CrossRef] [PubMed] [Green Version]
  88. Mora-Rodriguez, R.; Pallarés, J.G. Performance Outcomes and Unwanted Side Effects Associated with Energy Drinks. Nutr. Rev. 2014, 72 (Suppl. S1), 108–120. [Google Scholar] [CrossRef] [PubMed] [Green Version]
  89. Scholey, A.B.; Kennedy, D.O. Cognitive and Physiological Effects of an “Energy Drink”: An Evaluation of the Whole Drink and of Glucose, Caffeine and Herbal Flavouring Fractions. Psychopharmacology 2004, 176, 320–330. [Google Scholar] [CrossRef] [PubMed]
  90. Mix, J.A.; Crews, W.D.J. An Examination of the Efficacy of Ginkgo Biloba Extract EGb761 on the Neuropsychologic Functioning of Cognitively Intact Older Adults. J. Altern. Complement. Med. 2000, 6, 219–229. [Google Scholar] [CrossRef] [PubMed]
  91. Karlic, H.; Lohninger, A. Supplementation of L-Carnitine in Athletes: Does It Make Sense? Nutrition 2004, 20, 709–715. [Google Scholar] [CrossRef]
  92. Fielding, R.; Riede, L.; Lugo, J.P.; Bellamine, A. L-Carnitine Supplementation in Recovery after Exercise. Nutrients 2018, 10, 349. [Google Scholar] [CrossRef] [Green Version]
  93. Pomeranz, J.L.; Munsell, C.R.; Harris, J.L. Energy Drinks: An Emerging Public Health Hazard for Youth. J. Public Health Policy 2013, 34, 254–271. [Google Scholar] [CrossRef]
  94. Road, S.; Kingdom, U. Energy Drinks: What’ s the Evidence? Food Res. Collab. 2017, 44, 1–13. [Google Scholar] [CrossRef]
  95. Kwiatkowska, K.; Winiarska-Mieczan, A.; Kwiecień, M.; Klebaniuk, R.; Danek-Majewska, A.; Kowalczuk-Vasilev, E.; Kwiatkowski, P. Spożywanie Napojów Energetyzujących Przez Młodzież Województwa Lubelskiego Consumption of Energy Drinks by Teenagers in Lublin Province. Probl. Hig. Epidemiol. 2018, 99, 140–145. [Google Scholar]
  96. Shearer, J.; Graham, T.E. Performance Effects and Metabolic Consequences of Caffeine and Caffeinated Energy Drink Consumption on Glucose Disposal. Nutr. Rev. 2014, 72, 121–136. [Google Scholar] [CrossRef] [PubMed]
  97. Żukiewicz-Sobczak, W.; Sobczak, P.; Siłuch, M.; Weiner, M.; Pawłowicz-Sosnowska, E.T.; Wojtyła-Buciora, P.; Chmielewski, J.; Żeber-Dzikowska, I.; Gworek, B.; Zagórski, J. Analysis of the Chemical Composition of Energy Drinks for Contents of Stimulant and Filling Compounds. Przem. Chem. 2018, 97, 560–564. [Google Scholar] [CrossRef]
Figure 1. Red blood cell behavior when blood composition changes from isotonic to hypertonic and hypotonic state.
Beverages 09 00027 g001
Figure 2. Chemical structure of different protopanaxadiol. The structure was drawn using ChemSketch (Freeware) (https://www.acdlabs.com/resources/free-chemistry-software-apps/chemsketch-freeware/, accessed on 10 January 2023).
Beverages 09 00027 g002
Figure 3. Chemical structure of different protopanaxatriol. The structure was drawn using ChemSketch (Freeware) (https://www.acdlabs.com/resources/free-chemistry-software-apps/chemsketch-freeware/, accessed on 10 January 2023).
Beverages 09 00027 g003
Figure 4. Chemical structure of Ro from Oleate group. The structure was drawn using ChemSketch (Freeware) (https://www.acdlabs.com/resources/free-chemistry-software-apps/chemsketch-freeware/, accessed on 10 January 2023) [84].
Beverages 09 00027 g004
Figure 5. Amount of ingredients of the most popular energy drinks (chart does not include data for carbohydrates and Taurine).
Beverages 09 00027 g005
Table 1. Comparison of hypo-, iso-, and hypertonic sports beverages.
Sport BeveragesOsmolarityBeneficial Additional IngredientsAmount of Carbohydrates Per 100 mL BeverageCalories Per 100 mLExample of a DrinkRecommendations for ConsumptionReferences
Hypotonic drink lower than body fluidsnone (in fruit juices vitamins)0–6 g0–16 kcallight solution of fruit juice in water, spring water,before and during exercise[38,39]
Isotonic drinkclose to body fluidsvitamins, mineral salts6–10 g24–32 kcalcommercially available productsphysical workers and pro- and hobbyist athletes,[40,41]
Hypertonic drink higher than body fluidsnone (in fruit juices vitamins)over 10 g40 kcalcola, soft drinks, lemonade, fruit juiceafter training for pro- and hobbyist athletes[43,44,45]
Table 2. Composition of the most popular isotonic drinks.
Ingredient4 Move Zero (750 mL)Powerade (500 mL)Oshee (750 mL)Crazy Wolf (500 mL)Gatorade (591 mL)Isostar (750 mL)
Carbohydrates (g)0.13.95.76.55.86.7
Sodium (mg)2050n.d.404970
Potassium (mg)1312.5n.d.n.d.n.d.n.d.
Calcium (mg)1.61.3n.d.n.d.n.d.32
Magnesium (mg)0.70.6n.d.n.d.n.d.12
Artificial sweetenersYesYesYesYesNoNo
Energy content (kJ)4.576910111497122
Table 3. Overview of the compositions of the most popular energy drinks.
IngredientMonster (500 mL)Red Bull (250 mL)Burn (250 mL)Tiger (250 mL)N-Gine (250 mL)Max Force (250 mL)Black (250 mL)
Carbohydrates (g)121113.310.910.810.910.8
Sodium (g)0.080.040.020.070.10.10.1
Riboflavin (mg)0.7xxxxxx
Pantothenic acid (mg)x21.521.9821.98
Niacin (mg)8.586.5776.47
B6 (mg)0.820.31.41.40.561.4
B12 (ug)2.520.380.50.50.50.5
Taurine (mg)400400400400400400400
Ginseng (mg)82xxxxxx
L-carnitine (mg)42xxxxxx
Caffeine (mg)32323232323032
Energy content (kJ)203192242197196198195
Disclaimer/Publisher’s Note: The statements, opinions and data contained in all publications are solely those of the individual author(s) and contributor(s) and not of MDPI and/or the editor(s). MDPI and/or the editor(s) disclaim responsibility for any injury to people or property resulting from any ideas, methods, instructions or products referred to in the content.

