Article

A Comprehensive Comparison of Gluten-Free Brewing Techniques: Differences in Gluten Reduction Ability, Analytical Attributes, and Hedonic Perception

1
School of Agricultural, Forestry, Food and Environmental Sciences (SAFE), University of Basilicata, Viale Dell’ Ateneo Lucano 10, 85100 Potenza, Italy
2
Department of Agricultural, Food and Environmental Science, University of Perugia, Via San Costanzo, 06126 Perugia, Italy
3
Innovation Centre for Brewing & Fermentation (IBF), Department of Biotechnology, Faculty of Bioscience Engineering, Ghent University, Valentin Vaerwyckweg 1, 9000 Ghent, Belgium
4
Innovation Centre for Brewing & Fermentation (IBF), AgroFoodNature, Department of Biosciences and Industrial Engineering, HOGENT University of Applied Sciences and Arts, Valentin Vaerwyckweg 1, 9000 Ghent, Belgium
5
Laboratory of Enzyme, Fermentation and Brewing Technology (EFBT), KU Leuven, Technology Campus Ghent, Gebroeders de Smetstraat 1, 9000 Ghent, Belgium
*
Author to whom correspondence should be addressed.
Beverages 2023, 9(1), 18; https://doi.org/10.3390/beverages9010018
Submission received: 19 January 2023 / Revised: 31 January 2023 / Accepted: 3 February 2023 / Published: 14 February 2023

Abstract

:
This study provides a comprehensive comparison among the most common gluten-free (GF) brewing practices, with a focus on the impact of each treatment on physicochemical parameters and consumer acceptability of the final beer. In addition, the influence of a longer cold maturation on the natural reduction of the gluten content was investigated. Prolyl endopeptidase addition was found to be the most effective treatment in reducing gluten levels (−75.93%), followed by silica gel (−53.09%), longer cold maturation (−4.32%), and tannins (−1.85%). Nonetheless, none of the treated beer samples was gluten-free (gluten content > 20 ppm) due to the high nitrogen content of the original wort. The silica gel application treatment affected the physicochemical and sensory characteristics of the final beer the least. According to the difference from control test results, no significant difference in terms of overall liking, appearance, odor/aroma, or taste was observed between the silica gel-treated sample and control beer (p > 0.05). On the other hand, the application of enzymes and tannins significantly affected the appearance and the beer odor/aroma. Nevertheless, all beer samples received positive sensory acceptance scores.

Graphical Abstract

1. Introduction

Beer is traditionally produced from the gluten-containing raw material barley. The final gluten content in beer is influenced by several factors, such as beer style, grist composition, barley variety, malting conditions, brewing process (for example, protein rest, wort filtration, vigorous boiling, fermentation, or beer clarification), the nitrogen content of wort, type of fermentation (ale or lager), and production scale (craft or industrial beer) [1,2]. In most beers, although gluten molecules undergo modification and degradation during all brewing process steps, the concentrations of gluten peptides remain too high to fall within the “gluten-free” (GF) specification. According to the Commission Implementing Regulation (EU) No 828/2014 of 30 July 2014 [3], on the requirements for the provision of information to consumers on the absence or reduced presence of gluten in food, foodstuffs for people intolerant to gluten shall not contain a gluten content exceeding 20 mg/kg (ppm). Moreover, the Commission met the needs of individuals with different levels of sensitivity to gluten by providing the “very low gluten” statement that can be applied to foodstuffs containing no more than 100 mg/kg of gluten [3]. The GF-safe threshold of 20 ppm is the most applied; however, in countries such as Australia and New Zealand, the legislation is more stringent by setting mandatory gluten labeling for foodstuffs with a gluten content below 20 ppm. In addition, in the United States, Canada, Australia, and New Zealand, a food product made from a gluten-containing grain, albeit processed in order to reduce the gluten content, cannot be defined as GF and must be labeled “processed to remove gluten” [4]. Several studies focused on monitoring the gluten concentrations in different commercial beers [1,2,5,6,7,8,9,10,11]. Most of them could be considered as “low in gluten”. However, only a few beers did not exceed the GF threshold. Nevertheless, the consumer demand for GF beers is increasing. For this reason, different approaches for producing GF beer have been developed recently. The use of GF grains in brewing, the addition of prolyl endopeptidase from Aspergillus niger (AN-PEP), and the use of precipitation treatments are the most common strategies to produce GF beers. Each GF brewing practice has strengths and weaknesses [12].
Brewing with GF cereals or pseudocereals as alternatives to barley malt is considered challenging by brewers due to serious technological drawbacks. Replacement of barley malt can cause long saccharification time and increased mash viscosity, leading to prolonged wort separation, lower extract yield, and hence, the low alcohol content in the final beer [13]. These issues result in extended time for the entire brewing process and difficulties in process scalability. The low processability when GF adjuncts are used in brewing depends also on the fraction of these grains in the grist composition [14,15,16]. Previous studies demonstrated that GF grains such as sorghum and quinoa are suitable for brewing, taking into account both technological and sensory aspects [17,18,19].
AN-PEP catalyzes the proline-containing gluten molecules into harmless peptides leading to a final gluten content below 20 ppm. Enzyme addition did not negatively affect the main physicochemical parameters and sensory profile of the beer. Enzymatic treatment was observed to have a deleterious effect on the foam stability [20,21,22,23]. Although the use of AN-PEP, commercially available on the market as Brewers Clarex®, can be considered one of the easiest ways to reduce gluten levels, there are conflicting opinions regarding the safety of these gluten-reduced beers since some of the remaining gluten peptides may still contain immunopathogenic epitopes [24,25].
Beer stabilizers, such as silica gel or tannins, are commonly used by brewers to remove protein–polyphenol complexes that are responsible for colloidal haze. Haze-active proteins are rich in proline. Therefore, the application of these processing aids also leads to gluten reduction. The effectiveness in reducing gluten concentrations depends mainly on the dose of application. High dosages of tannins resulted in adverse effects on beer quality, mainly with regard to odor/aroma. Silica gel proved suitable for reducing gluten levels without adversely affecting the beer’s characteristics [26].
Although there have been several studies on the production of GF beers, none investigated the impact of gluten reduction treatments on the consumer acceptability of the beer, which is especially important for the marketability of the finished product. The aim of this study was to carry out a comprehensive comparison of the main GF brewing approaches concentrating on different aspects: gluten reduction capability to determine the most effective gluten reduction treatment; the effects on physicochemical attributes; and the impact on consumer acceptability and sensory characteristics (appearance, odor/aroma, and taste) of the finished beers. Moreover, the influence of a longer cold maturation on a natural reduction in gluten content was investigated to determine whether gluten reduction is possible without the application of processing aids.

2. Materials and Methods

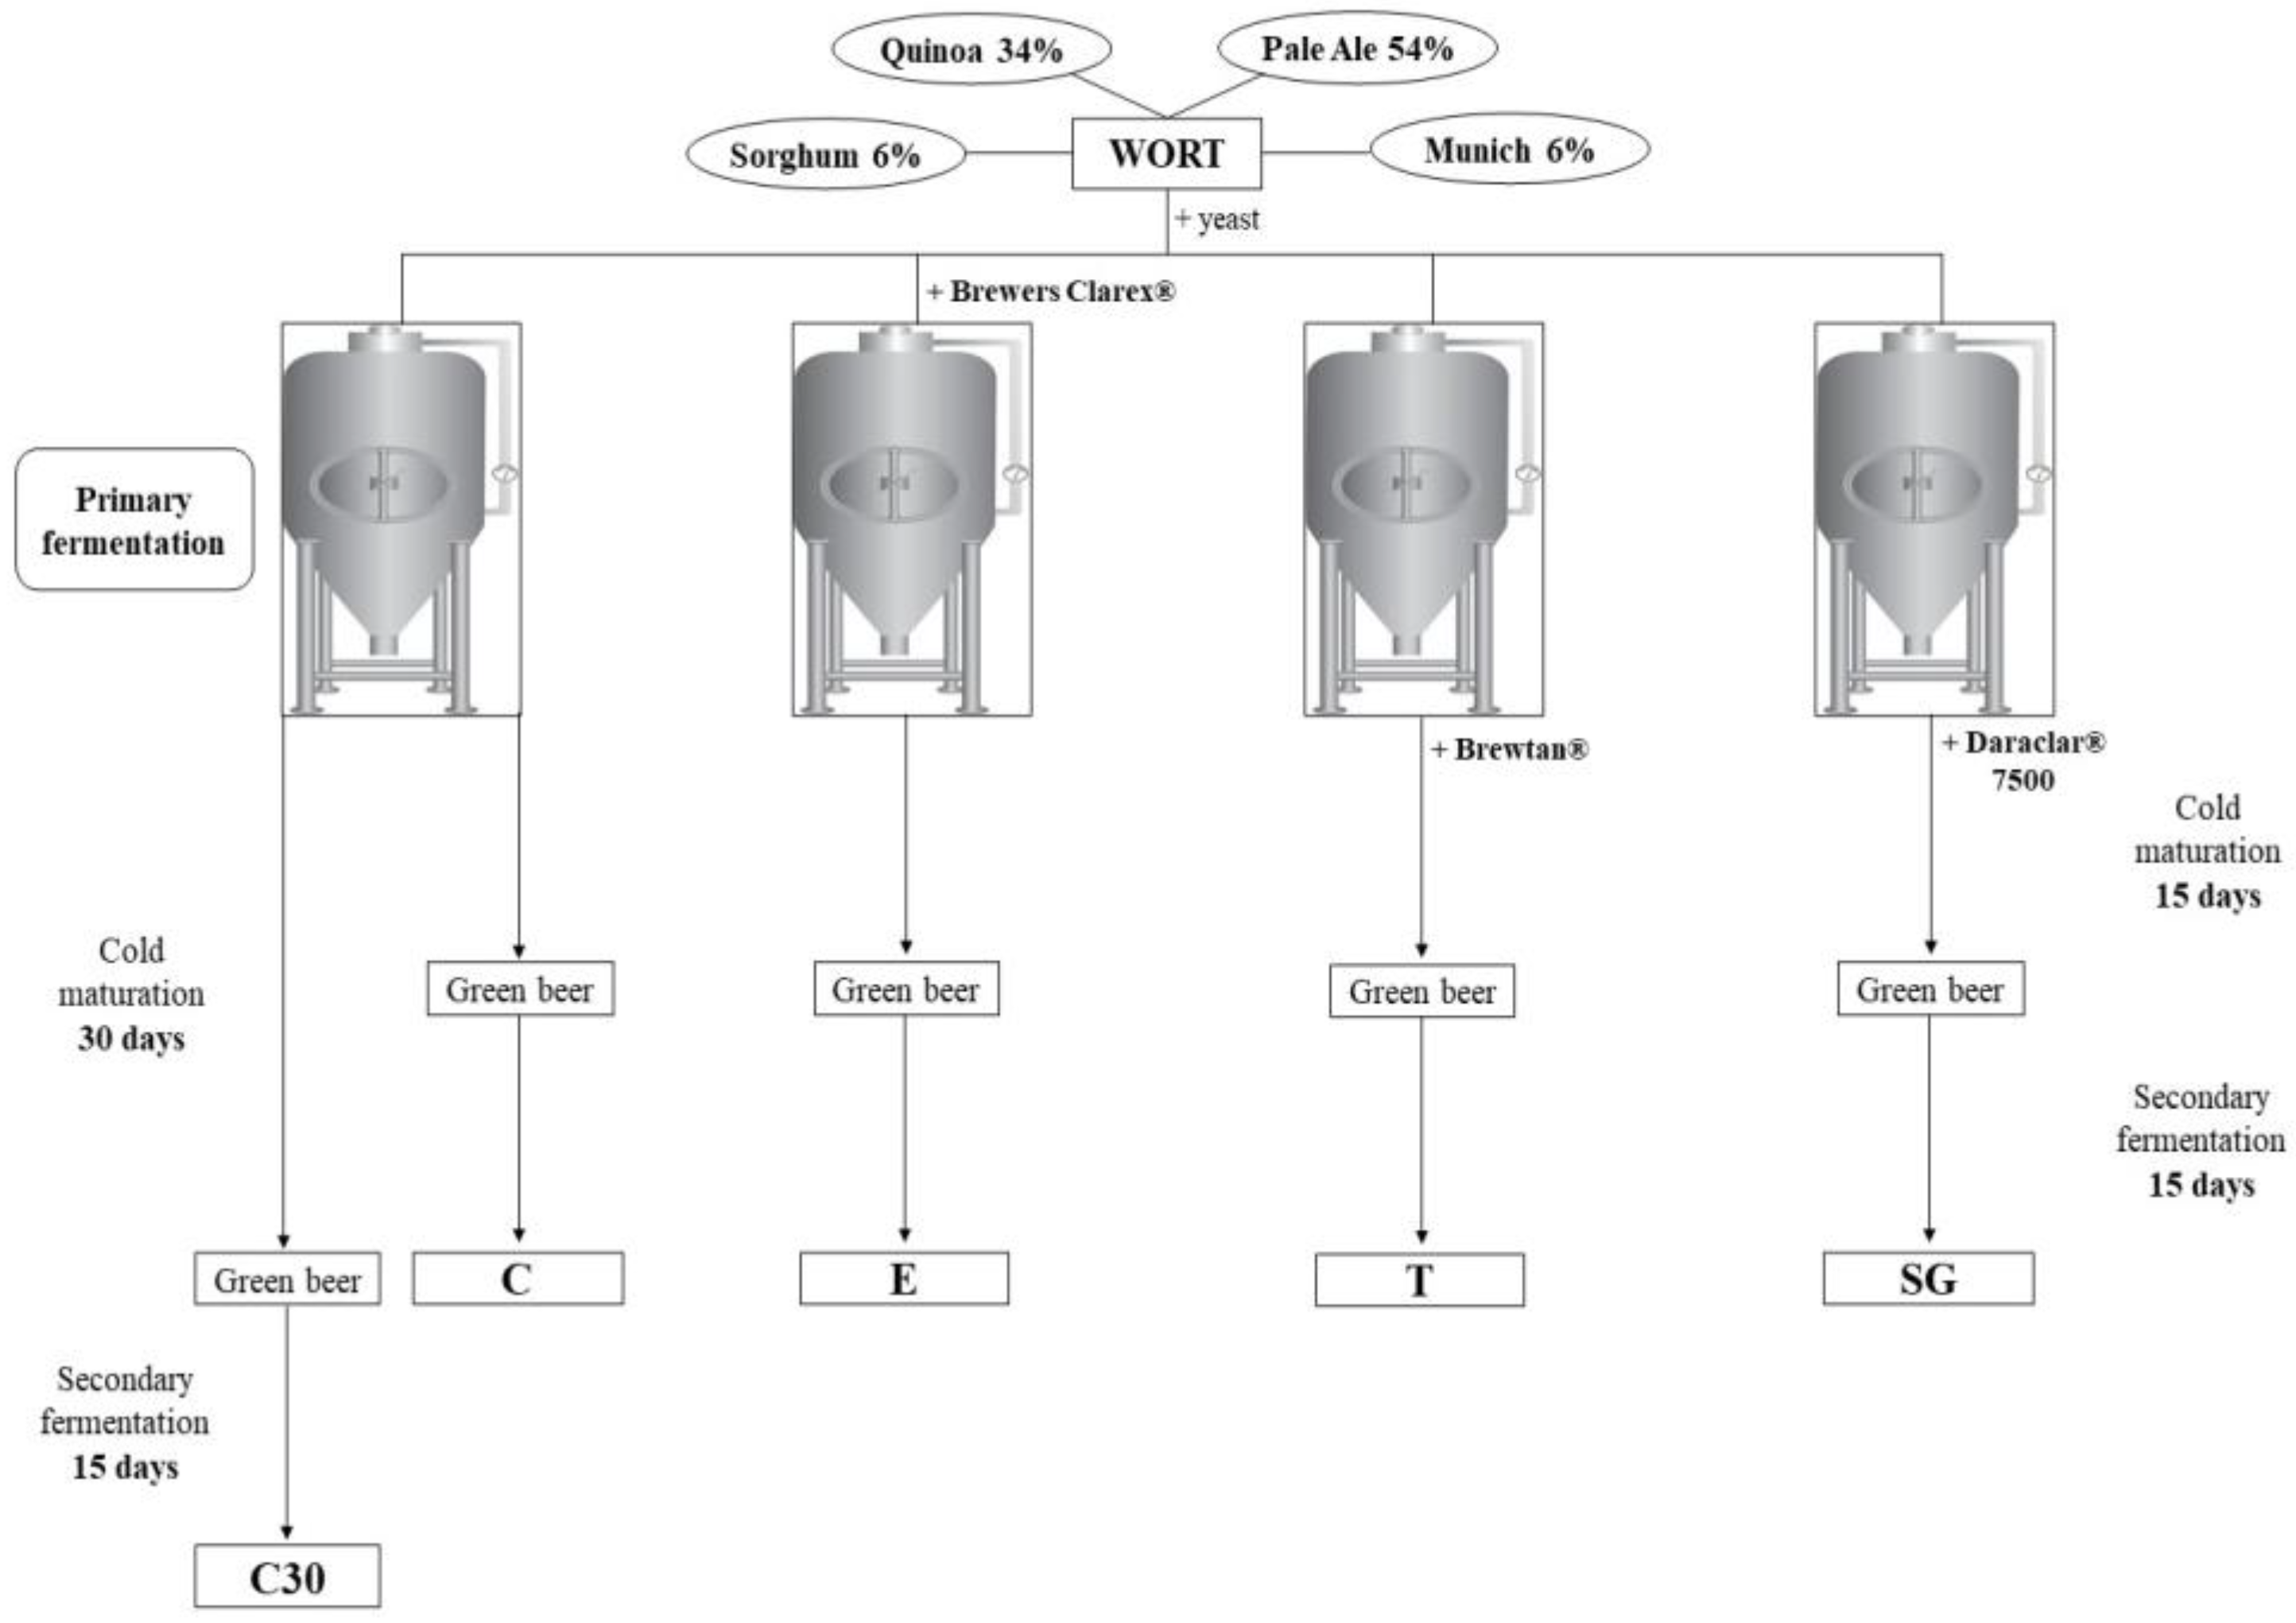
2.1. Pilot-Scale Brewing

2.1.1. Wort Production

Wort was produced in the 5 hL pilot brewing plant (Meura, Péruwelz, Belgium) at the KU Leuven Technology Campus Ghent (Ghent, Belgium). The applied mashing ratio was 2.35 L brewing water/kg grains. In this study, 40% of barley malt was replaced with a combination of unmalted sorghum and quinoa. The maximum concentration of replaced barley malt was chosen to comply with the Italian legislation, according to which a minimum barley malt content (60%) is required to define a finished product as “beer” [27]. The proper sorghum:quinoa ratio was selected based on findings from our previous studies [28]. Finely milled (hydromill, Meura, Péruwelz, Belgium) Pale Ale malt (57 kg; Dingemans, Stabroek, Belgium), Munich malt (6.5 kg; Dingemans, Stabroek, Belgium), unmalted sorghum (6.5 kg; Walter de Milliano, Hoeve Dierkensteen, Oostburg, The Netherlands), and unmalted quinoa (36 kg; BioGrano, Zwevegem, Belgium) were mixed with 2.50 hL of deaerated, reverse osmosis (RO) brewing water enriched with the addition of CaCl2 and CaSO4 (119 ppm Ca2+, 161 ppm SO42−, and 92 ppm Cl). To achieve complete saccharification, Brewers Compass®, an enzymatic preparation consisting of α-amylase, β-glucanase, and endopeptidase, was added at the end of the milling step (0.3 g/kg grist; DSM, Delft, the Netherlands). The pH of the mash was adjusted to pH 5.2 with 30% (v/v) lactic acid. The following mashing protocol was applied: 52 °C (20 min); 67 °C (60 min); 78 °C (5 min); and a temperature rise of 3 °C/min. The obtained wort was filtered using a membrane-assisted thin bed filter (Meura 2001, Meura, Péruwelz, Belgium). Given that the mash filter allowed a high extract recovery (the first sweet wort extract was 22.37 °P), no sparging was applied. At the onset of boiling, the sweet wort was adjusted to 13 °P. The wort was boiled for 60 min using clean-steam injectors. Hopping was performed with hop pellets aiming at 30 mg iso-α-acids/L in the finished beer: first hop—Amarillo (7.0% (w/w) α-acids; 89.8 g/hL), added at the onset of wort boiling; second hop—Chinook (12.0% (w/w) α-acids; 58.3 g/hL), added the last 15 min of boiling; Cascade (4.5% (w/w) α-acids; 40.0 g/hL), added during decantation. Wort clarification was performed using decantation with a duration of 15 min. A wort sample for analysis was collected at the end of cooling.

2.1.2. Fermentation, Maturation, and Bottling

After cooling and aeration, the wort was split into 4 cylindroconical 90 L fermentation tanks and pitched with re-hydrated top-fermenting yeast (SafAle™ US-05, Fermentis, Marcq-en-Baroeul Cedex, France). Dry yeast was re-hydrated for 1 h in 10 mL of sterile RO water per gram of the dry yeast, and it was used in a concentration of 50 g/hL. Each fermentation tank pointed to a different gluten reduction treatment. Primary fermentation was carried out at 22 °C for 8 days. Cold maturation at 0 °C was performed in the same fermentation tanks for 15 days, except for one beer sample for which cold maturation lasted 30 days. Beer samples were bottle conditioned for 15 days by adding sucrose and dry yeast for refermentation (5 g/hL; SafAle™ F-2, Fermentis, Marcq-en-Baroeul Cedex, France) to reach a final CO2 level of 6.8 g/L (3.8 volumes). Beers were bottled in 250 mL brown glass bottles using a 6-head rotating counter pressure filler with double pre-evacuation and over-foaming with hot water injection before capping (CIMEC, Nizza Monferrato, Italy). Detailed information about the experimental design for gluten reduction is described below and is reported in Figure 1:
  • Enzymatic-treated beer (E): Brewers Clarex® (DSM, Delft, The Netherlands) was added at the beginning of fermentation, without dilution, directly to the top of the tank and apart from the yeast, using a recommended dosage of 6.5 g/hL;
  • Tannins-treated beer (T): 2 g/hL of tannic acid (Brewtan® B, ≥98%, S.A. Ajinomoto, OmniChem N.V., Wetteren, Belgium) were added on the last day of cold maturation;
  • Silica gel-treated beer (SG): 100 g/hL of silica xerogel (Daraclar® 7500, Grace GmbH & Co.KG, Ind. Hollerhecke 1, D-67547 Worms, Germany) were added on the last day of cold maturation;
  • Cold maturation beer: after 15 days of cold maturation, 35 L of untreated beer (C) was bottle-conditioned. The remaining 35 L was kept in the fermentation tank for an additional 15 days at 0 °C for a total maturation period of 30 days (C30).
Figure 1. Schematic overview of the experimental design.
Beverages 09 00018 g001

2.2. Physicochemical Characterization

The following parameters were measured in wort and beer samples, in triplicate, using an Anton-Paar Alcoholyzer in combination with a DMA 5000 density meter (Anton Paar Benelux, Ghent, Belgium): original extract (% w/w) of wort (collected after cooling), alcohol, extract (real and apparent), and real and apparent degree of fermentation of beer samples (after 15 days of secondary fermentation). Beer foam stability was assessed using a NIBEM foam stability tester (Haffmans, Venlo, The Netherlands). Cold (at 0 °C) and permanent beer haze (at room temperature) were determined using a VOS ROTA 90 turbidity meter (Haffmans, Venlo, The Netherlands). EBC methods [29] were used for the following chemical parameters in wort: pH (8.17), wort color (8.5), wort bitterness (8.8), and total nitrogen (8.9.1). The EBC methods performed on beer samples were pH (9.35); beer color (9.6), sensitive protein (9.40), total polyphenols content (9.11), beer bitterness (9.8), and total nitrogen (9.9.1). Protein content (%) was determined by multiplying total nitrogen (%) by 6.25. The soluble protein content in beer was assessed according to the Bradford [30] method using the Bio-Rad Protein Assay (Art. No. 500-0006, Bio-Rad, München, Germany). The gluten levels of the finished beers were determined at the Innovation centre for Brewing & Fermentation of UGent/HOGENT (Ghent, Belgium) using RIDASCREEN® competitive R5-ELISA (R-Biopharm, Darmstadt, Germany), according to the manufacturer’s instructions.

2.3. Sensory Analysis

The beer samples C, E, T, and SG were subjected to sensory evaluation by 109 non-celiac untrained consumer volunteers (58 females and 51 males), aged between 19 and 60 years. They were recruited among students and staff members of the University of Basilicata (Potenza, Italy) and among beer consumers of Basilicata and its surroundings. All participants gave informed consent before sensory evaluation. All procedures performed in this study involving human participants were in accordance with the 1964 Helsinki Declaration and its later amendments. In addition, we followed the Regulation (EU) 2016/679 of the European Parliament and of the Council of 27 April 2016 on the protection of natural persons regarding the processing of personal data and on the free movement of such data.
Sensory evaluation was performed in individual booths under white light at ambient temperature. Beer samples were served at 6 ± 2 °C in 200 mL transparent plastic cups in a monadic form using a Latin Square order designed with FIZZ software (BioSystem, Couternon, France) so as to avoid first-order and carry-over effects. Participants cleaned their palates with unsalted crackers and water to restore mouth neutrality during a mandatory washing procedure of 120 s between each sample. For each beer sample, participants were first asked to express their overall liking score using a nine-point structured hedonic scale ranging from 1 = “Dislike extremely” to 9 = “Like extremely”. Then, a difference from control (DFC) test was conducted to determine whether sensory differences existed between the test (E, T, SG) and control sample (C) regarding appearance, odor/aroma, and taste/flavor/mouthfeel and also to estimate the degree of any such differences using a labeled category scale (1 = “No difference”; 2 = “Very slightly different”; 3 = “Slightly different”; 4 = “Moderate difference”; 5 = “Large difference”; 6 = “Very large difference”). For DFC tests, all consumers received simultaneously the control sample labeled “C” and the test sample labeled with a three-digit code. A blind control sample, with a 3-digit random number, was included in each test.

2.4. Statistical Analysis

Statistical analyses were performed using the software XLSTAT Premium (Version 2020.3.1, Addinsoft, Paris, France). Physicochemical analyses were performed in triplicate, and results were expressed as mean ± standard deviation. Physicochemical outputs were analyzed with one-way ANOVA using a Tukey’s HSD (honestly significantly different) post hoc test (α = 0.05). A principal component analysis (PCA) was carried out to summarize the main analytical differences between samples. Differences in mean overall liking score were assessed using ANOVA and Tukey’s HSD post hoc test. For DFC test data analysis, the mean difference scores between control sample (C) and each test sample/blind control (samples E, T, and SG) were calculated and evaluated using ANOVA followed by Dunnett’s multiple comparison test at a significance level of the test of p = 0.05.

3. Results and Discussion

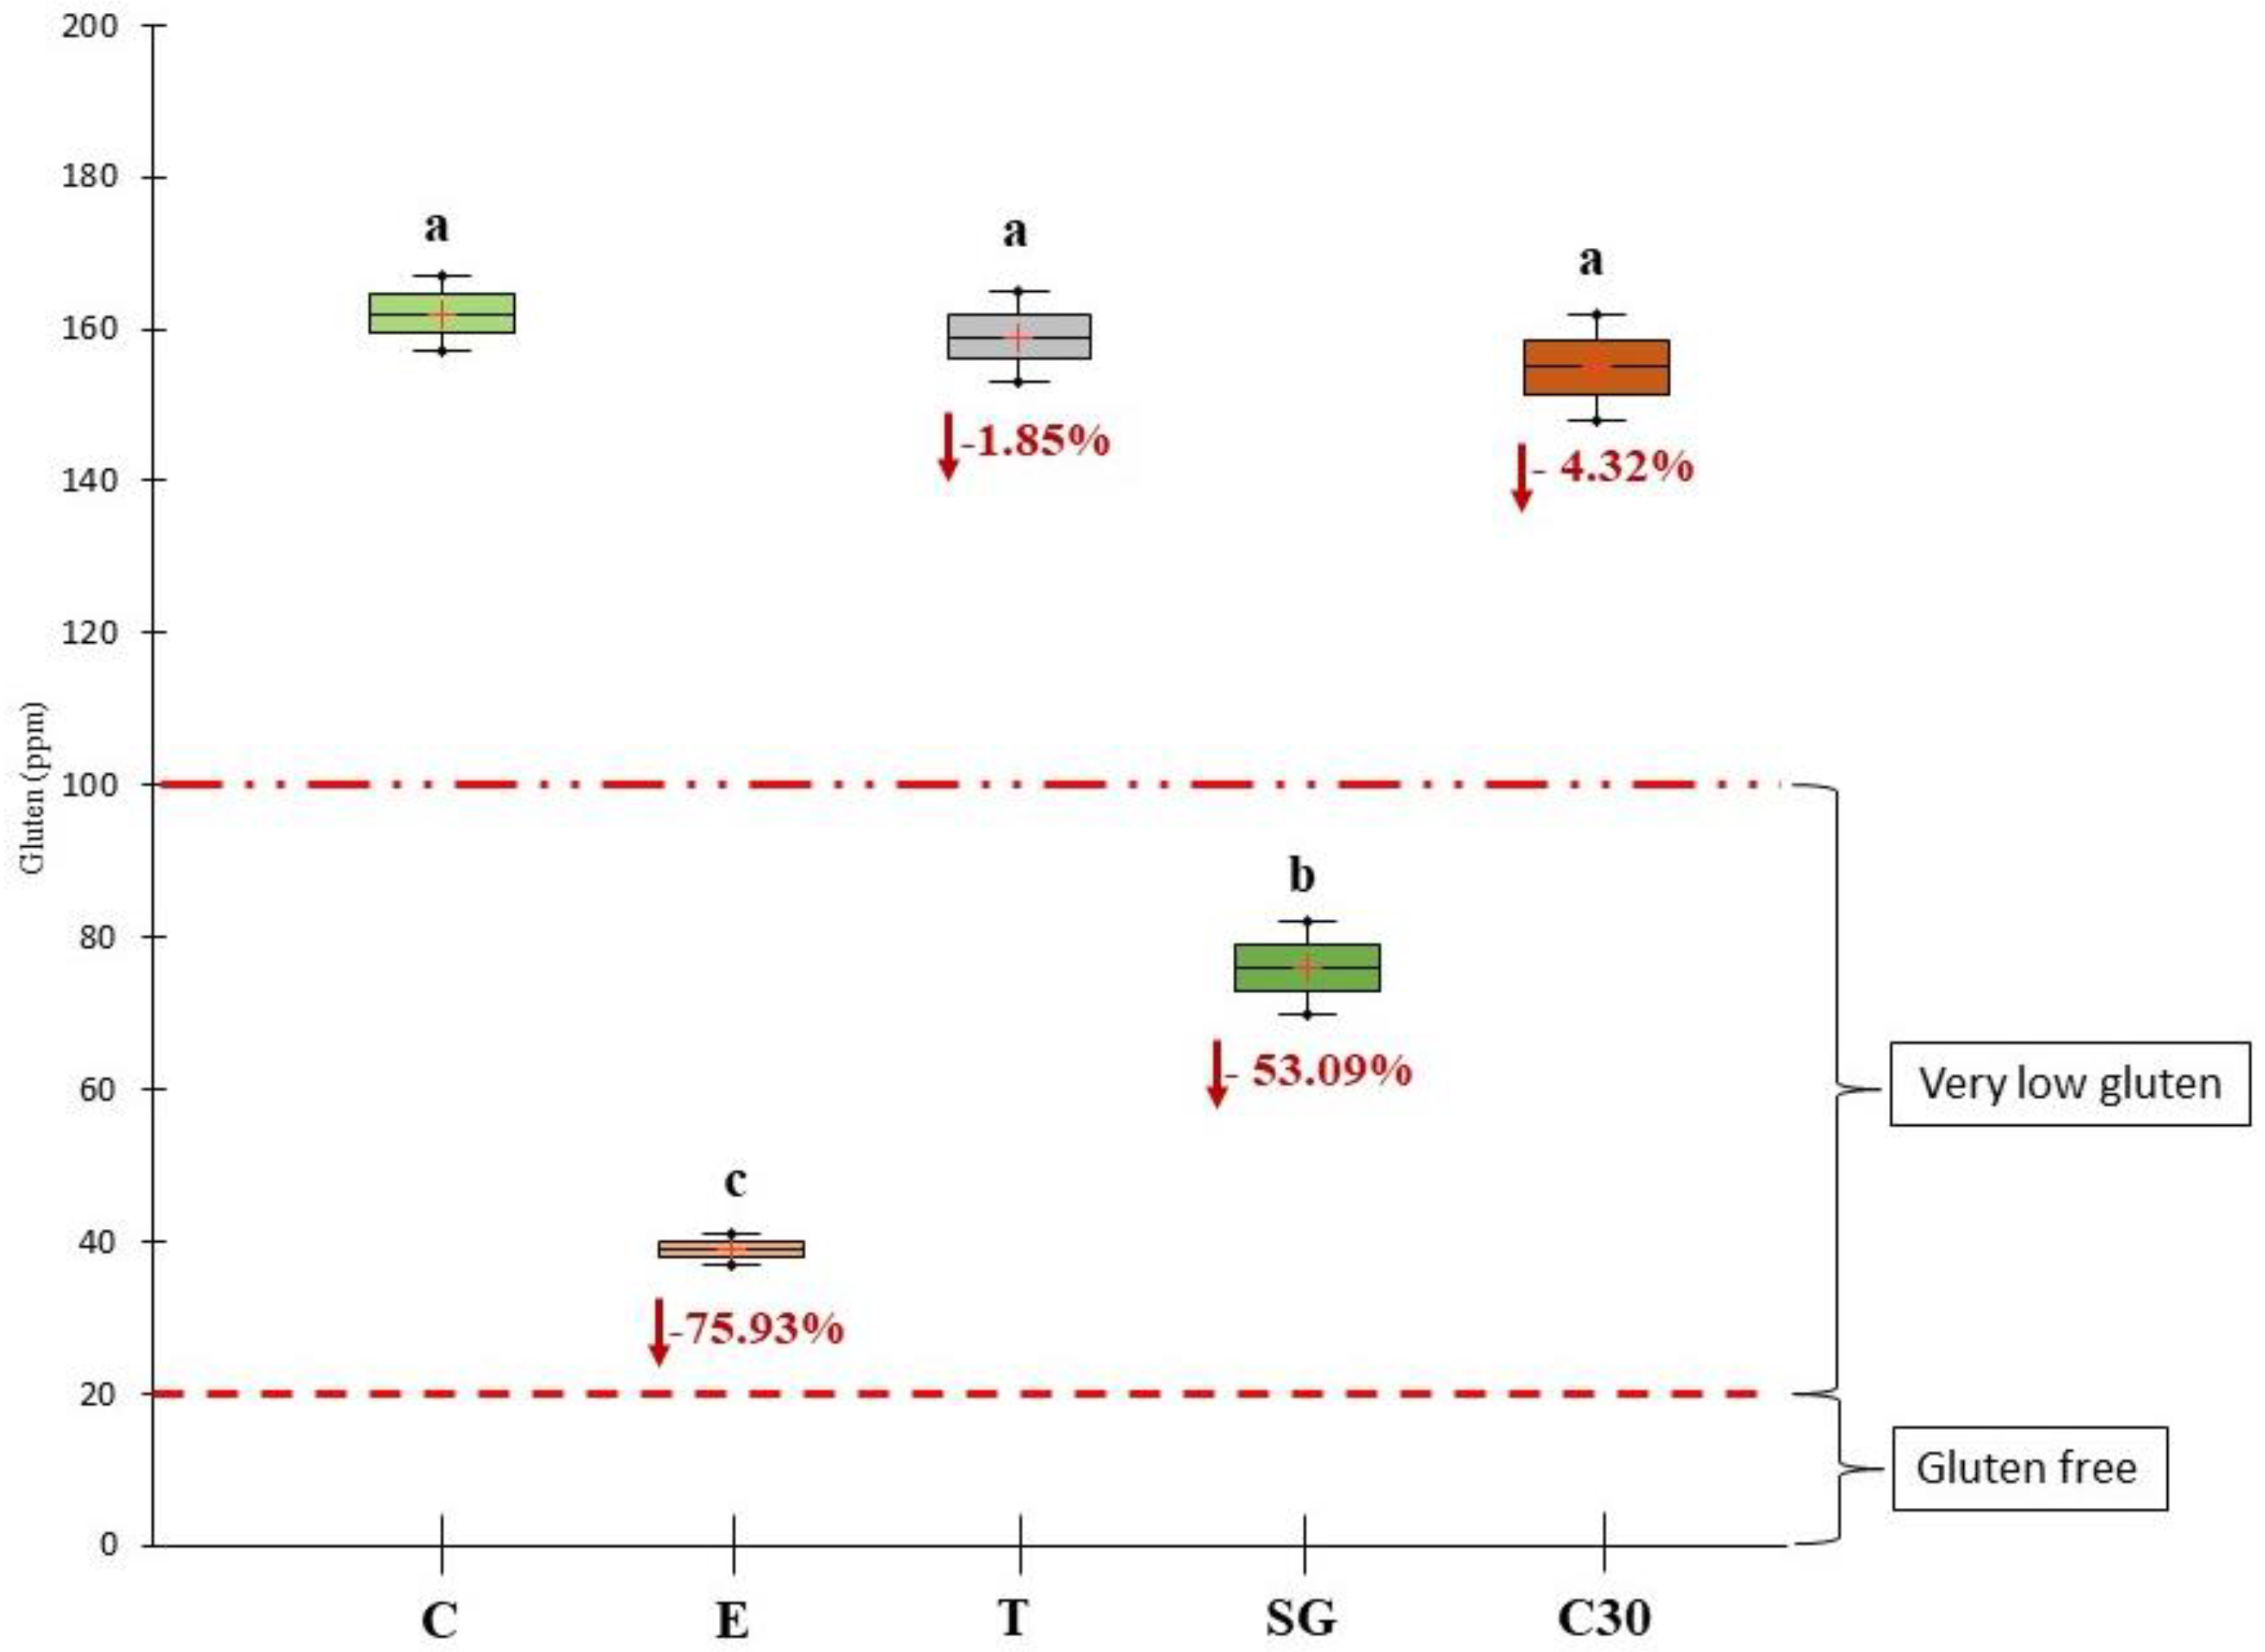
3.1. Gluten Content and Percentage Reduction

Figure 2 shows RIDASCREEN® ELISA results for all beer samples with the indication of the percentage of reduction in gluten content to evaluate which studied treatment is the most effective for gluten reduction.
Treatment with Brewers Clarex® at the beginning of fermentation allowed the highest percentage reduction (75.93%), due to the specific capacity of the enzyme to break down the prolamin fraction of gluten. The great ability of Brewers Clarex® to reduce the gluten content of the finished beer was also widely confirmed in previous studies [20,21,22,23,31], despite the fact that its dosage used was lower than that used in the current study. Therefore, brewers have a valid tool at their disposal to effectively decrease the gluten content without requiring an excessive modification of the brewing process. The proper dosage should be identified to allow an effective reduction in gluten without compromising the physicochemical and sensory quality of the beer.
Brewtan® gallotannins can react with SH groups of haze-sensitive proteins. These proteins are also rich in proline, the most abundant amino acid in gluten molecules. Therefore, the use of tannins in brewing allows simultaneous reduction of turbidity and gluten content. In contrast to earlier findings [23,26], in this study, the gluten content of sample T (159 ppm) was not statistically different from sample C (p > 0.05). However, this conflicting result may have been caused by several factors: low dosage (2 g/hL instead of 5 g/hL, which is the usual dose); the limited time for the formation of polyphenols–proteins complexes; incomplete precipitation thereof due to the fermenter design, in particular, the height to diameter ratio, which did not assure complete and rapid sedimentation of complexes at the bottom of the fermenter; and the lack of centrifugation or filtration as stabilization process.
The application of silica gel provided a decrease in the gluten content of 53.09%, higher than tannins, in agreement with Taylor et al. [26]. Combining silica gel addition with beer filtration or centrifugation could be more effective in gluten reduction, as also suggested in previous studies [23,32].
Cold crash is a practice used by brewers to clarify beer by lowering the temperature after primary fermentation is complete. Since there has been growing interest in recent years in natural beer stabilization methods, this study applied a long cold maturation to evaluate the possibility of a natural decrease in gluten concentration without applying processing aids traditionally used for gluten reduction or to enhance beer clarity. The gluten content of sample C30 was 155 ppm, meaning that extending the maturation step by another 15 days resulted in a percentage decrease in the gluten content of only 4.32% compared to sample C. Based on these results and since the energy required for the refrigeration system is one of the major fixed costs in a brewery, this study suggested that, for sustainability reasons, longer cold maturation can be excluded as a gluten reduction treatment. Therefore, sample C30 was not considered for sensory evaluation.
None of the beer samples analyzed in the current study fell under the “gluten free” designation. Indeed, the gluten concentration of the control sample was 162 ppm, well above both the “gluten free” standard and “very low gluten” status. No significant difference (p > 0.05) was observed between the gluten content of samples C, T, and C30. Sample E and SG contained 39 and 76 ppm of gluten, respectively, and were thus considered “low in gluten”. Despite the high effectiveness of the enzyme and silica gel treatment in gluten reduction, the reason for a gluten content above the “gluten free” threshold in all beer samples can be attributed to the high nitrogen content of the original wort (1302 mg/L). This was probably due to the brewing techniques used. By using a mash filter instead of a lauter tun as a wort separation technique, the spent grains are collected in the membrane chambers and then compressed under high pressure (1 to 1.5 bar). This compression forces proteins from spent grains into the wort, whereas the lauter process removed a higher fraction of the protein than mash filtration, as also reported in Watson et al. [23]. Consequently, more material enters the wort and, thus, also higher levels of gluten [33]. In addition, the lack of a whirlpool after wort boiling resulted in a weak deposition of hot wort-suspended solids, mainly represented by proteins and hop materials, which were not successfully removed from the wort. Moreover, incomplete precipitation during cold maturation due to the fermenter design and the lack of clarification steps, such as micro-filtration or centrifugation, can be considered as conditions that influenced the high nitrogen content of the wort and the finished beer. Nonetheless, further studies are currently ongoing to repeat the experiment on an industrial scale. In fact, it should be considered that in previous laboratory-scale mashing trials [17,28], the total nitrogen content in the finished beer could be obtained that was lower than in this pilot-scale production, suggesting that a low gluten content in the original wort can be achieved using practical measures in the future.

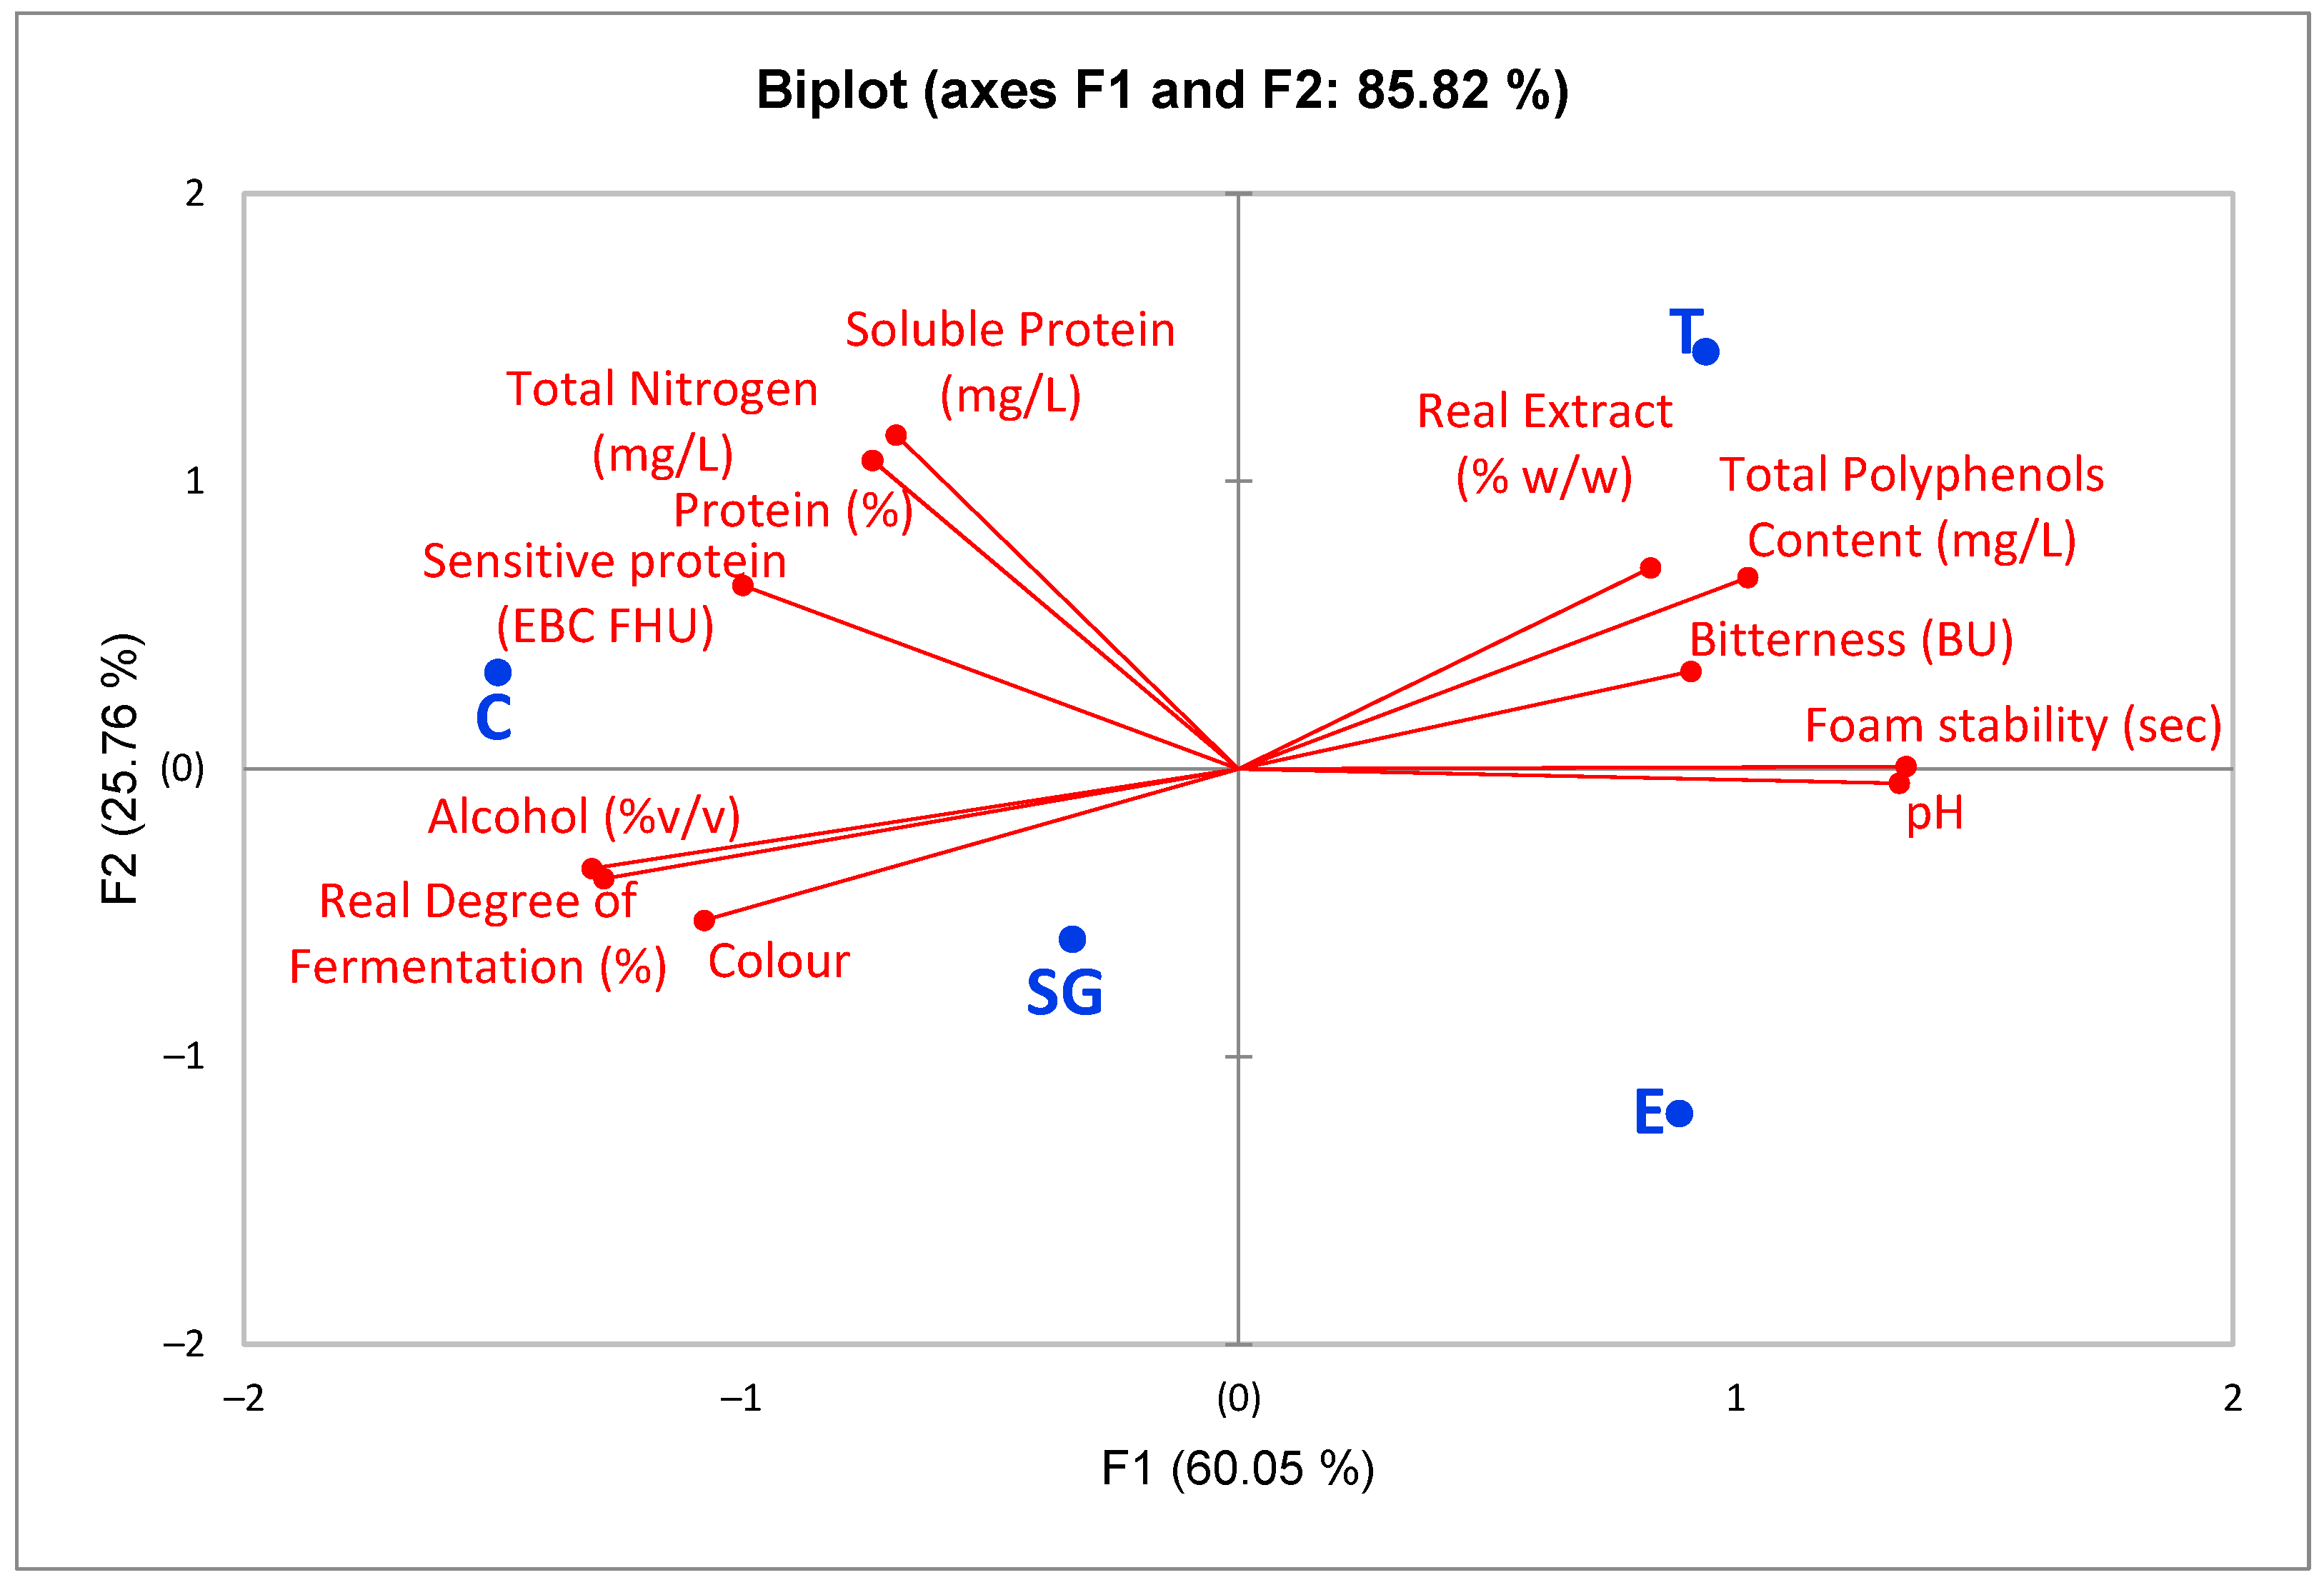
3.2. Effect of Gluten Reduction Treatments on Physicochemical Parameters

As reported in Table 1, all physicochemical parameters were significantly influenced (p < 0.05) by the gluten reduction treatments.
Melanoidins, the main compounds responsible for the color of beer, may interact with tannins as well as with silanol groups of the silica gel [26], thus explaining the significantly lower (p < 0.05) color value in the T and SG beer samples compared to the untreated sample.
The beer sample produced with the addition of prolyl endopeptidase showed higher foam stability than the untreated beer (p < 0.05). On the other hand, Guerdrum & Bamforth [21] reported that the addition of 1.5 g/hL of Brewers Clarex® had no impact on foam stability, a result subsequently confirmed by Knorr et al. [22] but not by Di Ghionno et al. [20]. In the latter cited study, significantly lower foam stability was observed in beer produced with the addition of 3.5 g/hL of Brewers Clarex® compared to the control sample. Therefore, it can be assumed that a high dosage of this enzyme could adversely affect foam stability. Despite the higher dosage used in this study (6.5 g/hL), set according to the manufacturer’s instructions for the purpose of gluten reduction, the effect of Brewers Clarex® on foam stability showed inconsistent results. Indeed, foam stability is influenced by several factors: Evans et al. [34] suggested that barley variety, protein composition, foam testing methods, and brewing scale may all contribute to foam stability. Furthermore, it is negatively influenced by alcohol content, while total polyphenols content and iso-α-acids are considered foam-positive factors [35]. As shown in Table 1, sample E demonstrated a lower alcohol content and higher total polyphenols content and bitterness units (a measure of iso-α-acids) compared to the untreated sample, which probably explains the higher foam stability of the enzymatic-treated beer sample than the untreated one. However, according to the evaluation scale reported by Kunze [36], all beer samples showed “very poor” foam stability (<220 s).
Bitterness is one of the main characteristics of beer, derived mainly from iso-α-acids, but also from barley and hop polyphenols [37]. The use of Brewtan® gallotannins resulted in increased total polyphenol content and, as a consequence, higher bitterness units in sample T than in the untreated sample.
The turbidity of all beer samples exceeded the measuring range of the instrument (>99.99 EBC). The high level of turbidity was probably due to the lack of filtration, a stabilization process not allowed by Italian law in the “craft” beer [38]. Therefore, the presence of yeast and protein/polyphenol complexes may be the main cause of the high turbidity in these experimental beers. Nevertheless, the impact of the gluten reduction treatments on sensitive proteins was investigated to evaluate their ability to improve beer clarity. Brewers Clarex® is often used by brewers as a beer stabilizer because it shows high specificity for proline residues, thus preventing the cross-linking of polyphenols and proline sites of turbidity-sensitive proteins and thereby reducing haze formation. A significantly lower value for sensitive proteins (p < 0.05) was observed in E, with a 76.59% reduction compared to C. Therefore, since haze formation is related to the presence of sensitive proteins [39], the findings of this study confirmed the suitable stabilization activity of Brewers Clarex®. The ability of the latter to reduce sensitive proteins was greater than that of tannins but equal to that of silica gel (Table 1). In this study, Brewtan® gallotannins enabled a 53.62% reduction of sensitive proteins due to the ability of the hydroxyl groups of tannins to react with haze-sensitive protein SH groups [40]; higher dose rates could improve the reduction of sensitive proteins. Silica gel enabled a 76.82% reduction due to the mechanism of protein absorption [41]. These results are consistent with those reported by Fanari et al. [42], as no statistically significant difference was found in turbidity and chill-haze between enzymatically and silica-treated beer samples.
PCA was performed to consider all physicochemical properties simultaneously. Figure 3 shows the corresponding biplot of PCA based on the correlation matrix. The first two dimensions F1 and F2 explained 85.82% of the total variance, with F1 and F2 accounting for 60.05% and 25.76%, respectively. As shown in Figure 3, the experimental beer samples were separated into two clusters: C and SG were grouped on the negative plane of the F1 axis, showing higher values of nitrogen compounds, alcohol, RDF, and color. Positive values of the F1 axis were exhibited by the other cluster of beer samples, consisting of T and E, showing higher values for bitterness, total polyphenols content, real extract, foam stability, and pH. Therefore, the PCA of the matrix of mean values of twelve physicochemical attributes for four different beers confirms that foam stability is strongly related to bitterness units and total polyphenols content, as discussed above. In addition, a positive relationship between foam stability and pH was observed, indicating that higher pH contributed to foam formation. Moreover, a negative correlation between foam stability and alcohol and RDF was also confirmed by the PCA results. In conclusion, the physicochemical data reported in Table 1 and the PCA data shown in Figure 3 indicate that the application of gluten reduction treatments affects the physicochemical properties of the finished beer.
The mean values of sample C30 were compared with those of sample C to unravel the effect of an extended cold maturation on the analytical characteristics of the beer. Longer cold maturation had a significant impact on RDF, alcohol content, color, and sensitive proteins, according to the p-values reported in Table 2. During maturation, the lipid transfer protein (LTP1), one of the main foam-positive substances, is degraded by yeast proteinase A (Kunze, 2004a). Therefore, a long cold maturation may negatively influence foam stability, especially in unpasteurized beer, since no treatment inactivates yeast proteinase A. Nevertheless, no significant impact (p > 0.05) of prolonged cold maturation on foam stability was observed in this study. Sample C30 showed a significantly higher RDF and alcohol content (p < 0.05) than C, probably because the yeast fermented the total residual sugars slowly, yielding a higher ethanol level. Few studies focused on changes in beer color over a long cold storage period. Salek et al. (2022) [43] demonstrated that the duration of cold maturation did not affect beer color. The findings of the current study did not support this observation; in fact, there was a significant reduction in color (p < 0.05). In general, 30 days of cold maturation did not have an excessive impact on the physicochemical properties of the beer.

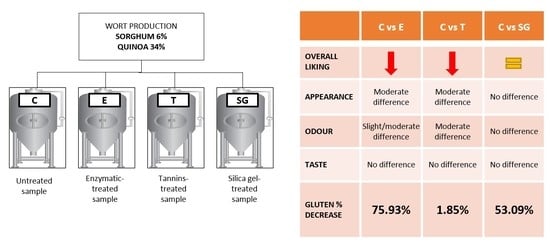
3.3. Sensory Evaluation: Difference from Control Test Results

Brewers should have a thorough knowledge of all effects of the application of gluten reduction treatments on the quality attributes of beer. Given this statement, the sensory characteristics of finished products should always be considered when evaluating the applicability of new technologies. Some of the previous studies on gluten reduction treatments evaluated the sensory profile of beer using descriptive analysis with trained tasters or by applying discriminative methods to test the similarity/dissimilarity between samples. Previous triangle test results showed no difference between untreated and gluten-reduced beer [20,22,42]. In this study, sample T showed a mean overall liking score that was significantly lower compared to the others (p < 0.05). The most preferred sample by consumers was sample C, which was considered “moderately likable”, followed by sample SG, which received a slightly but non-significantly lower liking score than the control sample. As shown in Table 3, the use of tannins as a gluten reduction treatment resulted in a significant (p < 0.05) decrease in the overall liking score. These results could be of interest to the brewers when choosing the proper treatment in order to develop a marketable GF beer.
To determine which gluten reduction treatment had the greatest effect on the sensory quality of the finished beers, the difference from control test was employed, as it allowed us to obtain an indication of the magnitude of any differences. Table 3 summarizes the results of the difference from control test. The p-values showed that there was no significant difference between the taste of the test and control samples (p > 0.05), suggesting that none of the gluten reduction treatments affected the taste of the final beer. On the other hand, the appearance and odor/aroma of the beer were significantly affected (p < 0.05) by the application of the gluten reduction treatments. According to the Dunnett’s test results, samples E and T were found to be significantly different from the blind control sample (p < 0.05) in terms of appearance and odor/aroma since consumers perceived a moderate difference with these sensory characteristics of the untreated sample. The difference in appearance could be explained by the lower color intensity and turbidity of samples E and T compared to sample C. In addition, consumers involved in this sensory evaluation perceived a difference in the odor profile. This was probably due to the impact of the enzyme and tannin addition on some of the main volatile compounds responsible for beer odor. In fact, Taylor et al. [26] stated that tannic acid, especially when used in excessive doses, led to lower levels of esters, ketones, and aldehydes. Moreover, Di Ghionno et al. [20] reported that enzyme-treated beer was perceived to be fruitier due to higher levels of esters, and a significant increase in acetaldehyde, furfural, and hexanal was observed when Brewers Clarex® was added to the wort.
In conclusion, the findings of this study suggested that the use of treatments to reduce gluten altered the sensory profile of the finished beers, but without causing an excessive decrease in consumer acceptability of the beers, which nevertheless received positive liking scores. Silica gel addition was the only treatment that did not affect both the overall liking and sensory characteristics (appearance, odor/aroma, and taste) of the beer.

4. Conclusions

The main strategies to produce GF beers are the use of non-gluten-containing grains in brewing and the application of gluten reduction treatments. In this study, a wort produced by replacing barley malt with 6% of sorghum and 34% of quinoa was subjected to the most common gluten reduction treatments, such as the addition of prolyl endopeptidase, silica gel, and tannic acid. The aim of this study was to make a comprehensive comparison between the different GF brewing approaches so as to assess the extent to which each treatment can reduce gluten and their effects on the physicochemical parameters of the finished beers. In addition, since no previous studies focused on the impact of gluten reduction treatments on consumer acceptability, the sensory evaluation carried out in this study aimed to unravel the overall liking of the experimental beers. Furthermore, another novel feature of this study was the evaluation of the magnitude of the sensory difference between control and treated samples.
The use of Brewers Clarex® at the beginning of fermentation allowed the lowest gluten content, followed by silica gel addition and the application of tannins, at the dosage rates used in this study, leading to a 75.93, 53.09 and 1.85% gluten reduction, respectively. However, despite the great ability of the enzyme and the addition of silica gel in reducing gluten levels, the gluten content of none of the beers was below the GF threshold (<20 ppm) because of the high gluten concentration of the original pilot-scale wort. Based on these findings, future activities will be carried out in order to optimize the same experimental design at an industrial scale, taking practical measures to keep the gluten content at low levels. In fact, previous laboratory-scale trials [17,28] that formed the basis for this study produced beers with lower total nitrogen content, suggesting that, in the future activities, by applying some technological advances, exploiting the considerable effectiveness of the enzyme and silica gel in reducing gluten, and validating the process with process replicates, it may become feasible to lower the gluten content within the limit for GF labeling.
The hypothesis that a natural reduction in gluten levels could be achieved simply by extending the cold maturation phase without applying processing aids was rejected, as no significant difference (p > 0.05) was found between the gluten content of samples C and C30.
The PCA results explained 85.82% of the total variance, suggesting that all considered properties of wort and beer quality attributes were statistically affected by the gluten reduction treatments. The use of silica gel was the treatment that affected the physicochemical parameters of the finished beer the least. This evidence was in accordance with the DFC test results, which were used in this study as a discriminatory method to assess which gluten reduction treatment showed the greatest impact on the sensory quality of the beers. No significant differences (p > 0.05) in overall liking, appearance, odor/aroma, and taste were observed between the silica gel-treated sample and the control beer. On the other hand, consumers perceived a moderate difference in appearance and odor/aroma when the enzyme and tannins were added for gluten reduction purposes. All samples received positive sensory acceptance scores, with an average overall liking score ranging from 6.41 to 6.93.
One of the main limitations of this study is the lack of process replicates since brewing trials were time-consuming and expensive, due to the high cost of raw materials (mainly quinoa) and the need to have enough fermenters of the same size available and occupied until the end of the maturation process. For these reasons, in most studies, only single brewing trials are performed [44]. Despite this, the results from this study can help brewers choose the most suitable method for the production of GF beers, with a special focus on consumer liking of the finished beers.

Author Contributions

Conceptualization, N.C. (Nazarena Cela), G.P. and G.D.R.; methodology, N.C. (Nazarena Cela), N.C. (Nicola Condelli), F.G. and G.D.R.; validation, N.C. (Nazarena Cela), G.P. and G.D.R.; formal analysis, N.C. (Nazarena Cela) and M.D.C.; investigation, N.C. (Nazarena Cela) and J.D.C.; resources, G.D.R. and J.D.C.; writing—original draft preparation, N.C. (Nazarena Cela) and M.D.C.; writing—review and editing, N.C. (Nicola Condelli), G.P., J.D.C., F.G. and G.D.R.; visualization, N.C. (Nazarena Cela); supervision, N.C. (Nicola Condelli), G.P., J.D.C., F.G. and G.D.R.; project administration, N.C. (Nicola Condelli), G.P. and F.G.; funding acquisition, N.C. (Nicola Condelli), G.P., F.G. and G.D.R. All authors have read and agreed to the published version of the manuscript.

Funding

This research received no external funding.

Institutional Review Board Statement

This study was conducted according to the guidelines of the Declaration of Helsinki. Ethical review and approval for this study were waived for the following reasons: (a) participation was voluntary and all data were anonymous; (b) this study was carried out on beer samples obtained from standard established process; (c) potential adverse effects for the participants were excluded as only small amount of alcohol was consumed in order to comply with the alcohol legislation and the obligations and prohibitions deriving therefrom.

Informed Consent Statement

Participants gave informed consent before participating in this study, about which appropriate information were provided.

Data Availability Statement

The data presented in the manuscript are available upon request.

Acknowledgments

The authors would like to thank Wouter De Sutter and Agata Soszka for their technical support with brewing and chemical analysis. The authors would also like to thank “Regione Basilicata” for providing a scholarship to the student working on this project.

Conflicts of Interest

The authors declare no conflict of interest.

References

  1. Fernández-Gil, M.; Simon, E.; Gibert, A.; Miranda, J.; Alcoba, E.R.; Martínez, O.; Cerezo, E.V.; Bustamante, M. Gluten Assessment in Beers: Comparison by Different Commercial ELISA Kits and Evaluation of NIR Analysis as a Complementary Technique. Foods 2021, 10, 1170. [Google Scholar] [CrossRef] [PubMed]
  2. Watson, H.; Decloedt, A.; Vanderputten, D.; Van Landschoot, A. Variation in gluten protein and peptide concentrations in Belgian barley malt beers. J. Inst. Brew. 2018, 124, 148–157. [Google Scholar] [CrossRef]
  3. European Commission, Commission Implementing Regulation (EU) No. 828/2014 of 30 July 2014 on the Requirements for the Provision of Information to Consumers on the Absence or Reduced Presence of Gluten in Food. Available online: https://eur-lex.europa.eu/legal-content/EN/TXT/PDF/?uri=CELEX:32014R0828&from=EN (accessed on 19 January 2023).
  4. Vriesekoop, F. Beer and Allergens. Beverages 2021, 7, 79. [Google Scholar] [CrossRef]
  5. Colgrave, M.L.; Goswami, H.; Howitt, C.; Tanner, G.J. What is in a Beer? Proteomic Characterization and Relative Quantification of Hordein (Gluten) in Beer. J. Proteome Res. 2011, 11, 386–396. [Google Scholar] [CrossRef] [PubMed]
  6. Fanari, M.; Porcu, M.C.; Zinellu, M.; Farina, D.; Scognamillo, S.; Forteschi, M.; Pretti, L. A Preliminary Study about Gluten Levels in Sardinian Craft Beers. J. Microbiol. Biotechnol. Food Sci. 2017, 6, 1195–1198. [Google Scholar] [CrossRef]
  7. Guerdrum, L.J.; Bamforth, C.W. Levels of gliadin in commercial beers. Food Chem. 2011, 129, 1783–1784. [Google Scholar] [CrossRef]
  8. Kerpes, R.; Göller, F.; Kollmannsberger, H.; Becker, T. Aroma profile of a gluten-free barley malt beer crafted to remove gluten using a barley malt extract with high peptidase activity. Eur. Food Res. Technol. 2022, 249, 23–32. [Google Scholar] [CrossRef]
  9. Pernica, M.; Boško, R.; Svoboda, Z.; Benešová, K.; Běláková, S. Monitoring of gluten in Czech commercial beers. Czech J. Food Sci. 2020, 38, 255–258. [Google Scholar] [CrossRef]
  10. Rubio-Flores, M.; Serna-Saldivar, S.O. Technological and Engineering Trends for Production of Gluten-Free Beers. Food Eng. Rev. 2016, 8, 468–482. [Google Scholar] [CrossRef]
  11. Van Landschoot, A. Gluten-free barley malt beers. Cerevisia 2011, 36, 93–97. [Google Scholar] [CrossRef]
  12. Cela, N.; Condelli, N.; Caruso, M.C.; Perretti, G.; Di Cairano, M.; Tolve, R.; Galgano, F. Gluten-Free Brewing: Issues and Perspectives. Fermentation 2020, 6, 53. [Google Scholar] [CrossRef]
  13. Zdaniewicz, M.; Pater, A.; Hrabia, O.; Duliński, R.; Cioch-Skoneczny, M. Tritordeum malt: An innovative raw material for beer production. J. Cereal Sci. 2020, 96, 103095. [Google Scholar] [CrossRef]
  14. Yorke, J.; Cook, D.; Ford, R. Brewing with Unmalted Cereal Adjuncts: Sensory and Analytical Impacts on Beer Quality. Beverages 2021, 7, 4. [Google Scholar] [CrossRef]
  15. Demeester, A.; Laureys, D.; Baillière, J.; Huys, J.; Vermeir, P.; De Leyn, I.; Vanderputten, D.; De Clippeleer, J. Comparison of Congress Mash with Final 65 °C Mash for Wort Production with Unmalted Barley, Tritordeum, and Quinoa, with or without Pregelatinization and/or Enzyme Addition. J. Am. Soc. Brew. Chem. 2021, 81, 66–75. [Google Scholar] [CrossRef]
  16. Myncke, E.; Laureys, D.; Baillière, J.; Vanderputten, D.; De Clippeleer, J. Mashing with Unmalted Buckwheat: Influence of Proportion, Grind Size, and Exogenous Enzymes on Small-Scale Lautering. MBAA TQ 2022, 59, 55–62. [Google Scholar]
  17. Cela, N.; Galgano, F.; Perretti, G.; Di Cairano, M.; Tolve, R.; Condelli, N. Assessment of brewing attitude of unmalted cereals and pseudocereals for gluten free beer production. Food Chem. 2022, 384, 132621. [Google Scholar] [CrossRef]
  18. Baillière, J.; Laureys, D.; Vermeir, P.; Van Opstaele, F.; De Rouck, G.; De Cooman, L.; Vanderputten, D.; De Clippeleer, J. 10 unmalted alternative cereals and pseudocereals: A comparative analysis of their characteristics relevant to the brewing process. J. Cereal Sci. 2022, 106, 103482. [Google Scholar] [CrossRef]
  19. Kordialik-Bogacka, E.; Bogdan, P.; Pielech-Przybylska, K.; Michałowska, D. Suitability of unmalted quinoa for beer production. J. Sci. Food Agric. 2018, 98, 5027–5036. [Google Scholar] [CrossRef] [PubMed]
  20. Di Ghionno, L.; Marconi, O.; Sileoni, V.; De Francesco, G.; Perretti, G. Brewing with prolyl endopeptidase from Aspergillus niger: The impact of enzymatic treatment on gluten levels, quality attributes and sensory profile. Int. J. Food Sci. Technol. 2017, 52, 1367–1374. [Google Scholar] [CrossRef]
  21. Guerdrum, L.J.; Bamforth, C.W. Prolamin Levels through Brewing and the Impact of Prolyl Endoproteinase. J. Am. Soc. Brew. Chem. 2012, 70, 35–38. [Google Scholar] [CrossRef]
  22. Knorr, V.; Wieser, H.; Koehler, P. Production of gluten-free beer by peptidase treatment. Eur. Food Res. Technol. 2016, 242, 1129–1140. [Google Scholar] [CrossRef]
  23. Watson, H.; Vanderputten, D.; Van Landschoot, A.; Decloedt, A. Applicability of different brewhouse technologies and gluten-minimization treatments for the production of gluten-free (barley) malt beers: Pilot- to industrial-scale. J. Food Eng. 2019, 245, 33–42. [Google Scholar] [CrossRef]
  24. Fiedler, K.L.; Cao, W.; Zhang, L.; Naziemiec, M.; Bedford, B.; Yin, L.; Smith, N.; Arbuckle, M.; Lopez-Hernandez, A.; Jackson, L.S. Detection of gluten in a pilot-scale barley-based beer produced with and without a prolyl endopeptidase enzyme. Food Addit. Contam. Part A 2019, 36, 1151–1162. [Google Scholar] [CrossRef] [PubMed]
  25. Watson, H.G.; Decloedt, A.I.; Hemeryck, L.Y.; Van Landschoot, A.; Prenni, J. Peptidomics of an industrial gluten-free barley malt beer and its non-gluten-free counterpart: Characterisation and immunogenicity. Food Chem. 2021, 355, 129597. [Google Scholar] [CrossRef]
  26. Taylor, J.P.; Jacob, F.; Arendt, E.K. Fundamental study on the impact of silica gel and tannic acid on hordein levels in beer. Innov. Food Sci. Emerg. Technol. 2015, 31, 177–184. [Google Scholar] [CrossRef]
  27. Gazzetta Ufficiale della Repubblica Italiana. Disciplina Igienica della Produzione e del Commercio Della Birra, Legge del 16/08/1962, n. 1354; Gazzetta Ufficiale della Repubblica Italiana: Rome, Italy, 1962. [Google Scholar]
  28. Cela, N.; Condelli, N.; Perretti, G.; Di Cairano, M.; Tolve, R.; Galgano, F. Gluten reduction in beer: Effect of sorghum:quinoa ratio and protein rest time on brewing parameters and consumer acceptability. J. Cereal Sci. 2023, 109, 103607. [Google Scholar] [CrossRef]
  29. Analytica-EBC. European Brewery Convention, 5th ed.; Fachverlag Hans Carl: Nürnberg, Germany, 2007. [Google Scholar]
  30. Bradford, M.M. A Rapid and Sensitive Method for the Quantitation of Microgram Quantities of Protein Utilizing the Principle of Protein-Dye Binding. Anal. Biochem. 1976, 72, 248–254. [Google Scholar] [CrossRef]
  31. Kerpes, R.; Fischer, S.; Becker, T. The production of gluten-free beer: Degradation of hordeins during malting and brewing and the application of modern process technology focusing on endogenous malt peptidases. Trends Food Sci. Technol. 2017, 67, 129–138. [Google Scholar] [CrossRef]
  32. Benítez, E.I.; Acquisgrana, M.R.; Peruchena, N.M.; Sosa, G.L.; Lozano, J.E. Effects of silica gel on reduction in gluten during several beer brewing stages. Int. J. Food Sci. Technol. 2016, 51, 920–928. [Google Scholar] [CrossRef]
  33. van Donkelaar, L.H.G.; Hageman, J.A.; Oguz, S.; Noordman, T.R.; Boom, R.M.; van der Goot, A.-J. Combining unmalted barley and pearling gives good quality brewing. J. Inst. Brew. 2016, 122, 228–236. [Google Scholar] [CrossRef]
  34. Evans, D.E.; Finn, J.E.C.; Robinson, L.H.; Eglinton, J.K.; Sheehy, M.; Stewart, D.C. The Effects of Hop-α-Acids and Proline-Specific Endoprotease (PSEP) Treatments on the Foam Quality of Beer. J. Inst. Brew. 2011, 117, 335–342. [Google Scholar] [CrossRef]
  35. Kunze, W. Finished Beer. In Technology Brewing and Malting; VLB: Berlin, Germany, 2004; p. 741. [Google Scholar]
  36. Kunze, W. Wort Production. In Technology Brewing and Malting; VLB: Berlin, Germany, 2004; pp. 283–284. [Google Scholar]
  37. Habschied, K.; Košir, I.J.; Krstanović, V.; Kumrić, G.; Mastanjević, K. Beer Polyphenols—Bitterness, Astringency, and Off-Flavors. Beverages 2021, 7, 38. [Google Scholar] [CrossRef]
  38. Gazzetta Ufficiale della Repubblica Italiana. LEGGE 28 Luglio 2016, n. 154 Deleghe Al Governo e Ulteriori Disposizioni in Materia Di Semplificazione, Razionalizzazione e Competitivita’ Dei Settori Agricolo e Agroalimentare, Nonche’ Sanzioni in Materia Di Pesca Illegale. Available online: https://www.gazzettaufficiale.it/eli/id/2016/08/10/16G00169/sg%20 (accessed on 19 January 2023).
  39. Stewart, G.G. The Chemistry of Beer. J. Chem. Educ. 2004, 81, 963. [Google Scholar] [CrossRef]
  40. Krekora, M.; Nawrocka, A. Effect of a polyphenol molecular size on the gluten proteins—Polyphenols interactions studied with FT-Raman spectroscopy. Food Biophys. 2022, 17, 535–544. [Google Scholar] [CrossRef]
  41. Królak, K.; Kobus, K.; Kordialik-Bogacka, E. Effects on beer colloidal stability of full-scale brewing with adjuncts, enzymes, and finings. Eur. Food Res. Technol. 2022, 249, 47–53. [Google Scholar] [CrossRef]
  42. Fanari, M.; Forteschi, M.; Sanna, M.; Zinellu, M.; Porcu, M.C.; Pretti, L. Comparison of enzymatic and precipitation treatments for gluten-free craft beers production. Innov. Food Sci. Emerg. Technol. 2018, 49, 76–81. [Google Scholar] [CrossRef]
  43. Salek, R.N.; Lorencová, E.; Gál, R.; Kůrová, V.; Opustilová, K.; Buňka, F. Physicochemical and Sensory Properties of Czech Lager Beers with Increasing Original Wort Extract Values during Cold Storage. Foods 2022, 11, 3389. [Google Scholar] [CrossRef]
  44. Gahr, A.; Forster, A.; Van Opstaele, F. Reproducibility trials in a research brewery and effects on the evaluation of hop sub-stances in beer. Part 1: Reproducibility in fresh beers. Brew. Sci. 2016, 69, 103–111. [Google Scholar]
Figure 2. Percentage reduction and gluten content of the experimental beer samples. Different letters indicate statistically significant differences (p < 0.05), following pairwise comparison with Tukey’s HSD test. C = untreated sample; E = enzymatic-treated sample; T = tannins-treated sample; SG = silica gel-treated sample; C30 = long cold maturation.
Beverages 09 00018 g002
Figure 3. Principal component analysis of the physicochemical properties of the experimental beers. C = untreated sample; E = enzymatic-treated sample; T = tannins-treated sample; SG = silica gel-treated sample.
Beverages 09 00018 g003
Table 1. Physicochemical attributes of the experimental beer samples.
Physicochemical AttributesCETSG
Real Extract (% w/w)5.27 ± 0.01 c5.30 ± 0.02 b5.34 ± 0.01 a5.21 ± 0.01 d
Real Degree of Fermentation (%)62.48 ± 0.38 a60.86 ± 0.04 c60.30 ± 0.07 d62.10 ± 0.03 b
Alcohol (% v/v)5.37 ± 0.12 a5.10 ± 0.04 b5.01 ± 0.04 b5.28 ± 0.01 a
pH4.29 ± 0.005 c4.38 ± 0.01 a4.39 ± 0.01 a4.35 ± 0.01 b
Color (EBC-units)28.04 ± 1.38 a24.95 ± 0.07 b21.20 ± 0.06 c23.94 ± 0.41 b
Foam stability (s)135 ± 3.67 c212 ±0.82 a210 ± 2.04 a163 ± 2.04 b
Bitterness (BU)34.52 ± 0.58 c36.48 ± 0.67 b38.82 ± 0.91 a38.26 ± 1.02 a
Total Polyphenols Content (mg/L)294 ± 2.51 c301 ± 2.28 b307 ± 0.74 a290 ± 4.79 c
Total Nitrogen (mg/L)988 ± 3.27 a784 ± 6.13 d973 ± 1.63 b931 ± 1.25 c
Protein (%)0.618 ± 0.002 a0.490 ± 0.004 d0.608 ± 0.001 b0.581 ± 0.001 c
Soluble Protein (mg/L)417 ± 5.14 a325 ± 3.16 d408 ± 1.09 b371 ± 4.93 c
Sensitive Protein (EBC FHU)33.87 ± 1.18 a7.93 ± 0.24 c15.71 ± 1.33 b7.85 ± 0.29 c
C = untreated sample; E = enzymatic-treated sample; T = tannins-treated sample; SG = silica gel-treated sample. Data are expressed as mean ± standard deviation. Values in the same row followed by a different letter are statistically different (p < 0.05), following pairwise comparison with Tukey’s HSD test.
Table 2. p-values of the two-sample test comparison, which tested for similarities between untreated sample (C) and beer subjected to a longer cold maturation (C30).
Physicochemical Parametersp-Values
Real Extract (% w/w)1.000
Real Degree of Fermentation (%)<0.0001
Alcohol (% v/v)0.048
pH0.157
Color0.001
Foam stability (s)0.402
Bitterness (BU)0.312
Total Polyphenol Content (mg/L)0.162
Total Nitrogen (mg/L)0.517
Protein (%)0.472
Soluble Protein (mg/L)0.636
Sensitive Protein (EBC FHU)0.001
p-value < 0.05 = statistically significant difference.
Table 3. Overall liking score and difference from control (DFC) test results.
SampleOverall LikingMean DFC
AppearanceOdorTaste
C6.93 ± 1.48 a3.343.063.50
E6.61 ± 1.22 ab3.75 *3.53 *3.74
T6.41 ± 1.34 b3.72 *3.65 *3.77
SG6.90 ± 1.33 a3.313.263.52
p-value 0.0240.0040.335
C = untreated sample; E = enzymatic-treated sample; T = tannins-treated sample; SG = silica gel-treated sample. Different letters are statistically different (p < 0.05), following pairwise comparison using Tukey’s HSD test. * Differed significantly from control sample according to Dunnett’s multiple comparison test at a significance level of p < 0.05.
Disclaimer/Publisher’s Note: The statements, opinions and data contained in all publications are solely those of the individual author(s) and contributor(s) and not of MDPI and/or the editor(s). MDPI and/or the editor(s) disclaim responsibility for any injury to people or property resulting from any ideas, methods, instructions or products referred to in the content.

