Article

δ13C-Ethanol as a Potential Exclusionary Criterium for the Authentication of Scotch Whiskies in Taiwan: Normal vs. 3-Parameter Lognormal Distributions of δ13C-Ethanol Found in Single Malt and Blended Scotch Whiskies

Department of Forensic Science, Central Police University, No.56, Shujen Rd., Takang Vil., Kueishan District, Taoyuan City 33304, Taiwan
*
Author to whom correspondence should be addressed.
Beverages 2023, 9(1), 13; https://doi.org/10.3390/beverages9010013
Submission received: 18 December 2022 / Revised: 12 January 2023 / Accepted: 30 January 2023 / Published: 1 February 2023

Abstract

:
With the difference in the photosynthesis process between C3- and C4-plants, the 13C/12C stable isotope ratio of ethanol, i.e., δ13C-ethanol, can potentially be a basis for the discrimination of Scotch whiskies derived from different raw materials. This study analyzed 51 authentic single malt Scotch whiskies and 34 authentic blended Scotch whiskies by gas chromatography–combustion–isotope ratio mass spectrometry (GC-C-IRMS) and examined the resulting data by a series of fitting distribution processes. The evaluation result demonstrated that δ13C-ethanol distribution of single malt Scotch whiskies fitted both normal and 3-parameter lognormal distribution. For blended Scotch whiskies, however, the data distribution of δ13C-ethanol conformed with a 3-parameter lognormal distribution rather than a normal one. Moreover, 99.7% of the confidence intervals (CI) of δ13C-ethanol for single malt Scotch whiskies would define between −23.21‰ to −30.07‰ for 3-parameter lognormal distribution, while from −11.19‰ to −28.93‰ for blended Scotch whiskies on the basis of the statistical properties. The simulative adulterated Scotch whiskies using more than 30% C4-derived edible distilled spirits can be effectively discriminated by means of CI of δ13C-ethanol. Since the addition of rectified spirits produced from the C4 plant has been found in some cases of seized Scotch whiskies in Taiwan, establishing a CI of δ13C-ethanol would be valuable for the purpose of Scotch whisky authentication.

Graphical Abstract

1. Introduction

Over the past decades, Scotch whisky has become the most popular imported spirit in the alcohol market in Taiwan. According to the Scotch Whiskey Association report, Taiwan ranked third among the top 10 export markets for Scotch whisky by value in 2021 [1]. Meanwhile, the import market value of Taiwan is as high as 226.1 million GBP. The Taiwanese consumption habit includes two categories of Scotch whiskies, i.e., single malt Scotch whiskies and blended Scotch whiskies, which occupy nearly 92% of the whisky market in Taiwan. Unlike the consumption habits of other countries, the Taiwanese are particularly fond of single malt Scotch whisky. According to the marketing reports, the sales market for single malt Scotch whisky is almost as close as blended Scotch whisky in Taiwan [1,2]. Based on the great business profits, illicit single malt Scotch whiskies and illicit blended Scotch whiskies have been seized in Taiwan in some cases.
So far as the modus operandi is concerned, the fake whiskies in Taiwan can be classified into two types: adulterated Scotch whisky and counterfeit Scotch whisky. An adulterated Scotch whisky commonly uses a bottle of a well-known brand of Scotch whisky blended with a small amount of genuine Scotch whisky and a large amount of rectified spirit. In contrast, counterfeit Scotch whisky does not even have an actual distillery set up in Scotland. Instead, counterfeiters create misleading Scotch whiskies using an obscuring Scotch whisky name by blending a large part of rectified spirit with some artificial food flavoring and/or a small amount of genuine Scotch whisky. To reduce manufacturing costs, large amounts of rectified spirit were found to be used in all the seized fake whiskies in Taiwan. According to case reports provided by the competent authorities in Taiwan, illegal whiskies are often sold in nightclubs, bars, KTVs, and other places where consumers are not easily aware of the authenticity of Scotch whisky. Sometimes, lawbreakers recycle empty bottles of high-priced Scotch whisky from these places, refill empty bottles with adulterated Scotch whisky, and sell them again. Therefore, the consumer and relative competent authorities eagerly require a more valuable and efficient method to support authenticity analyses.
The composition of Scotch whisky involves several aspects, including the ingredients used in production, the finished product’s chemical composition, and the organoleptic characteristics of Scotch whisky. For the authentication purpose of whisky with qualitative techniques in earlier studies, gas chromatography with flame-ionization detection (GC-FID), gas chromatography–mass spectrometry (GC-MS), and liquid chromatography–mass spectrometry (LC-MS) have usually been employed to analyze the composition of whiskies [3,4,5,6,7,8]. Moreover, a number of spectroscopic methods combined with principal component analysis (PCA) or partial least squares (PLS) regression have been developed for rapid and reliable discrimination, including Fourier-transform infrared spectroscopy (FT-IR), near-infrared spectroscopy (NIR), mid-infrared spectroscopy, UV-Vis analysis, and Raman spectroscopy [9,10,11,12,13,14]. These investigations aimed to differentiate from the brand, age, or spectrum characteristics of whisky samples. Apart from qualitative research, mass spectrometry was also used based on the quantitative analysis of the contents of whiskies. Herein, GC-MS and LC-MS are regarded as powerful techniques to establish authenticity. Attributed to the high sensitivity of mass spectrometry, the concentration of compounds in whiskies can be determined and serve as the comparative identification targets for the authentication of whiskies [15,16,17,18,19].
In recent years, the isotope ratio mass spectrometer (IRMS) has been adopted to detect fake Scotch whiskies. The stable isotope analytical method is a highly efficient approach, normally used by archaeologists and biologists, to analyze and justify the origin or constituent information of an animal’s bones or identify a plant’s photosynthesis process. With its powerful analytical effectiveness, several studies have investigated the significant difference of stable isotopes to determine the origin of whiskies [20,21,22,23,24]. From the isotope analysis point of view, many factors affect the measured isotope ratio, such as the origins of raw materials, the species of raw materials, the reaction pathway, the procedure of treatment for samples, and the analysis process. Subtle fractionation involves both thermodynamics and kinetics effects. So far as thermodynamics is concerned, slightly different stable isotope ratios may give different equilibrium constants for a specific chemical reaction; that is, slightly different amounts of reaction products may result from reactants with slightly different isotope ratios. As to kinetics, the lighter isotopes will proceed faster through the photosynthetic process, resulting in products richer in the lighter isotopes. Therefore, these intrinsic properties are displayed in the variety of mass discrimination associated with various pathways of reactions [6]. Typically, the photosynthesis of plants can be sorted as C3, C4, and Crassulacean acid metabolism (CAM) photosynthesis. These different photosynthesis processes of plants lead to changes in observed stable isotope ratios [25,26,27,28]. Edible rectified spirit, also known as a neutral spirit, is a kind of spirit from a raw material such as grain, potato, beet, molasses, honey, or fruit. Because of the manufacturing process of the edible rectified spirit from the continuous distillation method, the alcohol content is usually greater than 95%, and it contains almost no other ingredients except water. The raw materials of edible rectified spirits vary on the basis of the customs and trade condition between different countries. In Taiwan, sugar cane is the primary raw material of edible rectified spirit. Sugarcane was once a heavily grown crop in Taiwan, especially in southern Taiwan. According to the photosynthesis of plants, sugarcane belongs to C4 plants; therefore, edible rectified spirits sold in Taiwan are mainly C4-derived spirits.
According to the definition given in Scotch Whisky Regulation 2009 [29], blended Scotch whisky can be made by blending various Scotch whiskies, including single malt Scotch whiskies and grain Scotch whiskies. Hence, it may be manufactured completely by C3-derived spirits or different proportions of C3- to C4-derived spirits, while single malt Scotch whiskies are only made from C3-derived spirits [30]. In view of the relationship between the photosynthesis processes of plants and stable isotope ratios, measurement of δ13C-ethanol has been used to differentiate between the raw materials of spirits from C3 plants with δ13C (‰) values of −21‰ to −34‰ and C4 plants with δ13C values of −9‰ to −20‰, sequentially [20,21,22,23,24,25]. δ13C is the ratio of two stable isotopes of carbon, 13C and 12C, used to represent the isotopic composition of carbon sources and fractionation during photosynthesis. For authentication purposes, however, the wide range of δ13C for C3 and C4 plants may limit the practical forensic application if the seized Scotch whiskies were adulterated by adding rectified spirits in authentic Scotch whiskies. On the other hand, single malt Scotch whisky is only made from malted barley, which belongs to the C3 plant, according to the restriction from Scotch Whisky Regulation 2009 [29]. Although many researchers have studied the stable isotope ratios for C3 plants, the exact range of stable isotope values for δ13C-ethanol produced through malted barley fermentation reaction is rarely discussed. Therefore, in practice, it sometimes affects the uncertainty of the authenticity of Scotch whisky, thus increasing the difficulty of discrimination.
In our previous work, we developed an exclusion method to successfully distinguish adulterated samples from authentic Scotch whiskies via the confidence interval (CI) of methanol (MeOH) concentration without any other reference samples of authentic whisky [19]. For discrimination purposes, many studies discuss various analytical methods for Scotch whiskies authentication, but only some evaluate the statistical implications for forensic meaning. In particular, statistical treatments, such as PCA and PLS, are mainly used to deal with data for the classified purpose. Much research has primarily focused on discussing characteristics of origins, including brand, geography, or botanical origin [31,32,33,34,35]. However, in modern statistical practice, a proper data distribution model could describe the data population of authentic Scotch whiskies to facilitate the discrimination procedures and consequently avoid bias due to analyzing a few scattered samples [19]. A model fitting method is a statistical tool usually used to find the most efficient and accurate statistical structure to describe the observed data distribution [36]. Otherwise, statistical parameters, such as means and standard deviation, should be explained under suitable distribution. Therefore, the distribution fitting method could summarize the data distribution by a proper statistical model, further predicting other data under the same observation, and avoiding statistical mistakes [36,37]. Especially in practice, collecting all reference samples to compare with each seized sample is difficult and challenging. Hence, it is helpful to establish reasonable and efficient discrimination methods for forensic purposes. Moreover, the case reports from competent authorities show that the illegal Scotch whisky seized in Taiwan are mainly adulterated Scotch whiskies, whose modus operandi is mainly through diluting the authentic Scotch whisky with edible rectified spirit. After dilution with edible rectified spirit, the stable isotope ratio of δ13C-ethanol, MeOH concentration [19], and the intensity of fermentation congeners of Scotch whisky should all be affected. Therefore, it is crucial to define the exclusionary discriminating criterium established from real Scotch whisky samples and then compare it with the simulative adulterated Scotch whiskies diluting with different ratios of edible rectified spirit.
In this study, we attempted to fit and define the distribution range of δ13C for ethanol in Scotch whiskies, including single malt Scotch whisky and blended Scotch whisky, in order to establish the CI of δ13C-ethanol as a criterion for authentication purposes. In addition, this study expects to determine the stable isotope value of δ13C-ethanol in Scotch whiskey through the analysis of a large number of reference samples and to define the stable isotope value range of δ13C-ethanol produced by malted barley fermentation, thereby improving the reliability of discriminating power in practice. In addition, with a known modus operandi of illicit Scotch whiskies, a series of simulative experiments with adding rectified spirits to authentic Scotch whiskies may evaluate the parts of clues from seized Scotch whisky cases and further verify the importance of establishing a CI of δ13C-ethanol for authentication of Scotch whiskies.

2. Materials and Methods

2.1. Preparation of Reference Whiskies and Simulative Samples

The reference materials prepared to establish the discrimination criteria of Scotch whisky were all imported from Scotland and purchased from legally operated tobacco and alcohol shops in Taiwan, including 51 single malt Scotch whiskies and 34 blended Scotch whiskies. Moreover, three edible rectified spirits from Taiwan Sugar Corp., Taiwan Tobacco & Liquor Corp., and Echo Chemical Co., Ltd. were also prepared to determine the δ13C-ethanol value for reference.
The addition samples were prepared by adding a proper amount of diluted rectified spirit to a proper amount of authentic Scotch whiskies, where the diluted rectified spirit was prepared by diluting edible rectified spirit (purity of ethanol ≥ 96%, Taiwan Sugar Corp.) with distilled water to 40% alcohol by volume (ABV). As a result, serial addition solutions of authentic Scotch whisky and diluted rectified spirit were prepared with the addition ratio of 9:1, 8:2, 7:3, 6:4, and 5:5, respectively.

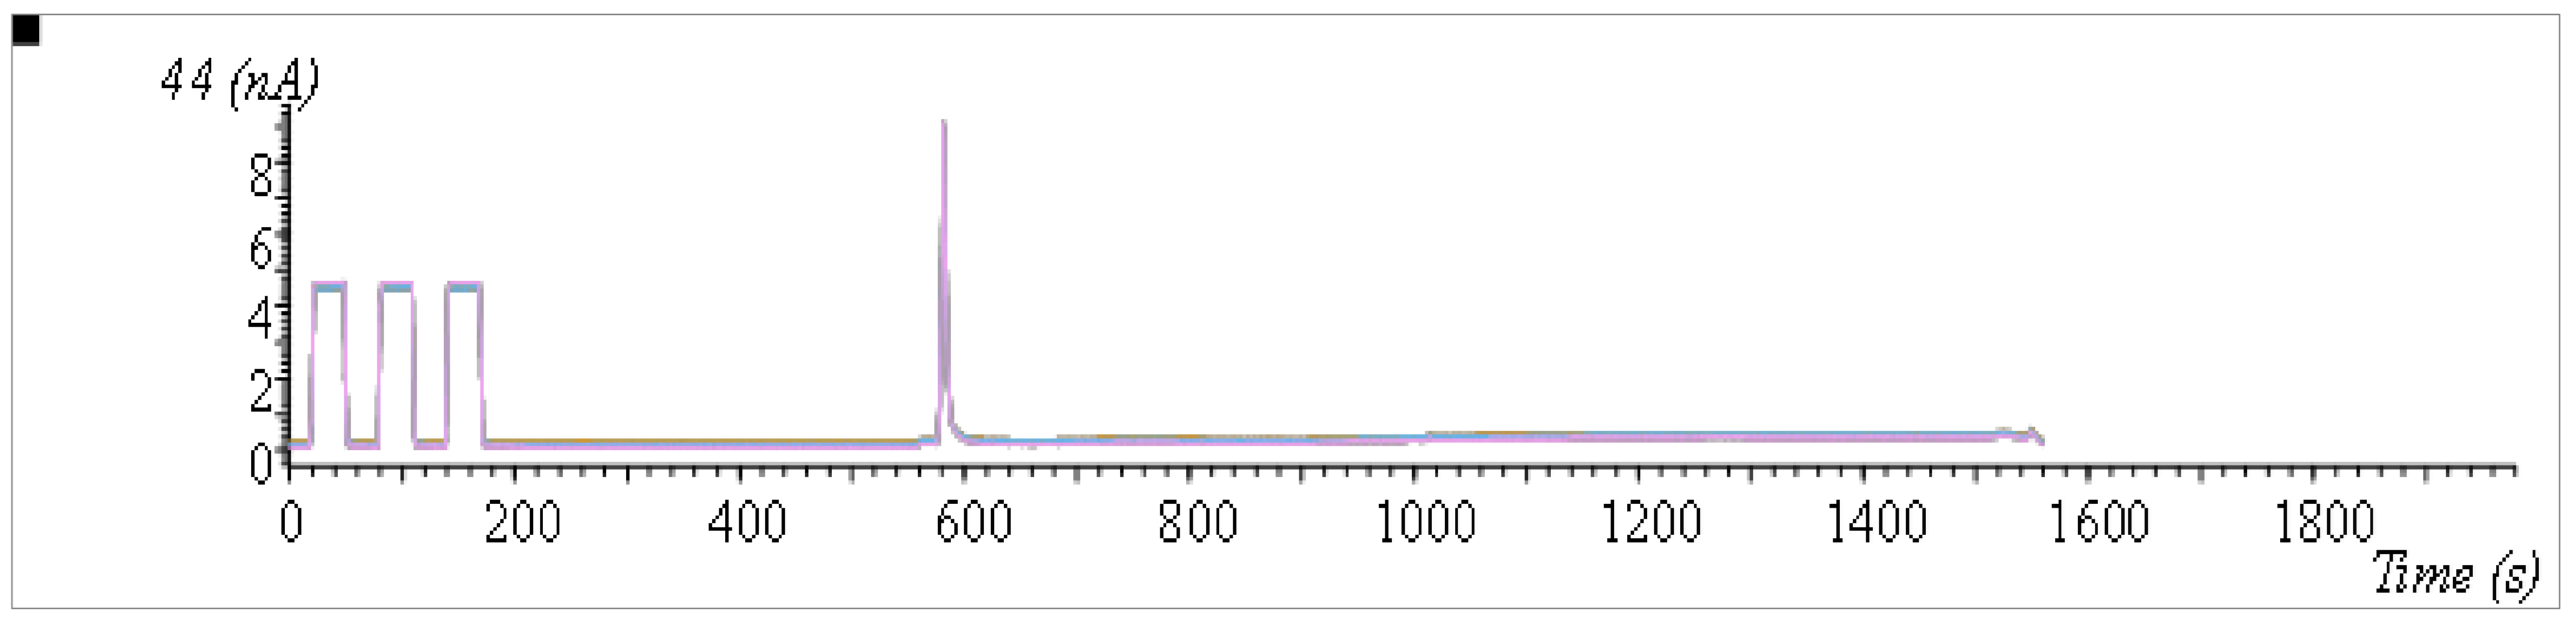
2.2. Stable Isotopic Measurement of Ethansol

The δ13C measurement was performed by a gas chromatography–combustion–isotope ratio mass spectrometry (GC-C-IRMS) system. A GC 7890A with an Agilent J&W CP-Wax 57 CB fused capillary column (50 m × 0.25 mmID × 0.2 μm) were coupled with an IsoPrime IRMS (Elementar, Germany) via an open split. Before the δ13C measurement of each sample batch, the GC-C-IRMS must conform to the criteria of stability of δ13C ≤ 0.08‰ (Std. Dev. of fit) and linearity of δ13C ≤ 0.03‰/nA. The CO2 reference gas was calibrated against the acetanilide standard reference, which is certified by the Department of Geography, Indiana University (USA) with a δ13C value of −29.53‰ (±0.01‰). A 1 mg acetanilide standard reference was dissolved in 1 mL of acetone (HPLC Grade, Burdick & Jackson). Samples of 0.2 μL each were injected with a split ratio of 1:20. The flow rate for carrier gas was set as 1.0 mL/min. Due to the high boiling point of acetanilide (b.p. = 304 °C), the injection port of temperature for the GC-FID system were at 325 °C. The oven temperature was set as follows: initially 100 °C, elevated to 200 °C at 20 °C min−1, and then maintained for 35 min.
Samples of 12 μL each were diluted with 1.5 mL of acetone (HPLC Grade, Sigma Aldrich). Samples of 0.2 μL each were injected with a split ratio of 1:15. The oven temperature of GC-FID instrumental parameters were set as follows: initially 35 °C for 2 min, elevated to 60 °C at 3 °C min−1, and to 200 °C at 30 °C min−1, and then maintained for 10 min.

2.3. Statistical Analysis

The δ13C-ethanol data analysis was executed by the statistical software SPSS (IPM), Minitab, and SPC (BPI Consulting, LLC, Katy, TX, United States). In subsequent, to appropriately deduce the distribution model, the data distribution fitting was exanimated by the software SPC. Furthermore, the Anderson–Darling and Kolmogorov–Smirnov tests were employed to verify the normality of the log-transformed δ13C value of Scotch whiskies with a p-value of >0.05 to double confirm the fitting result.

3. Results and Discussion

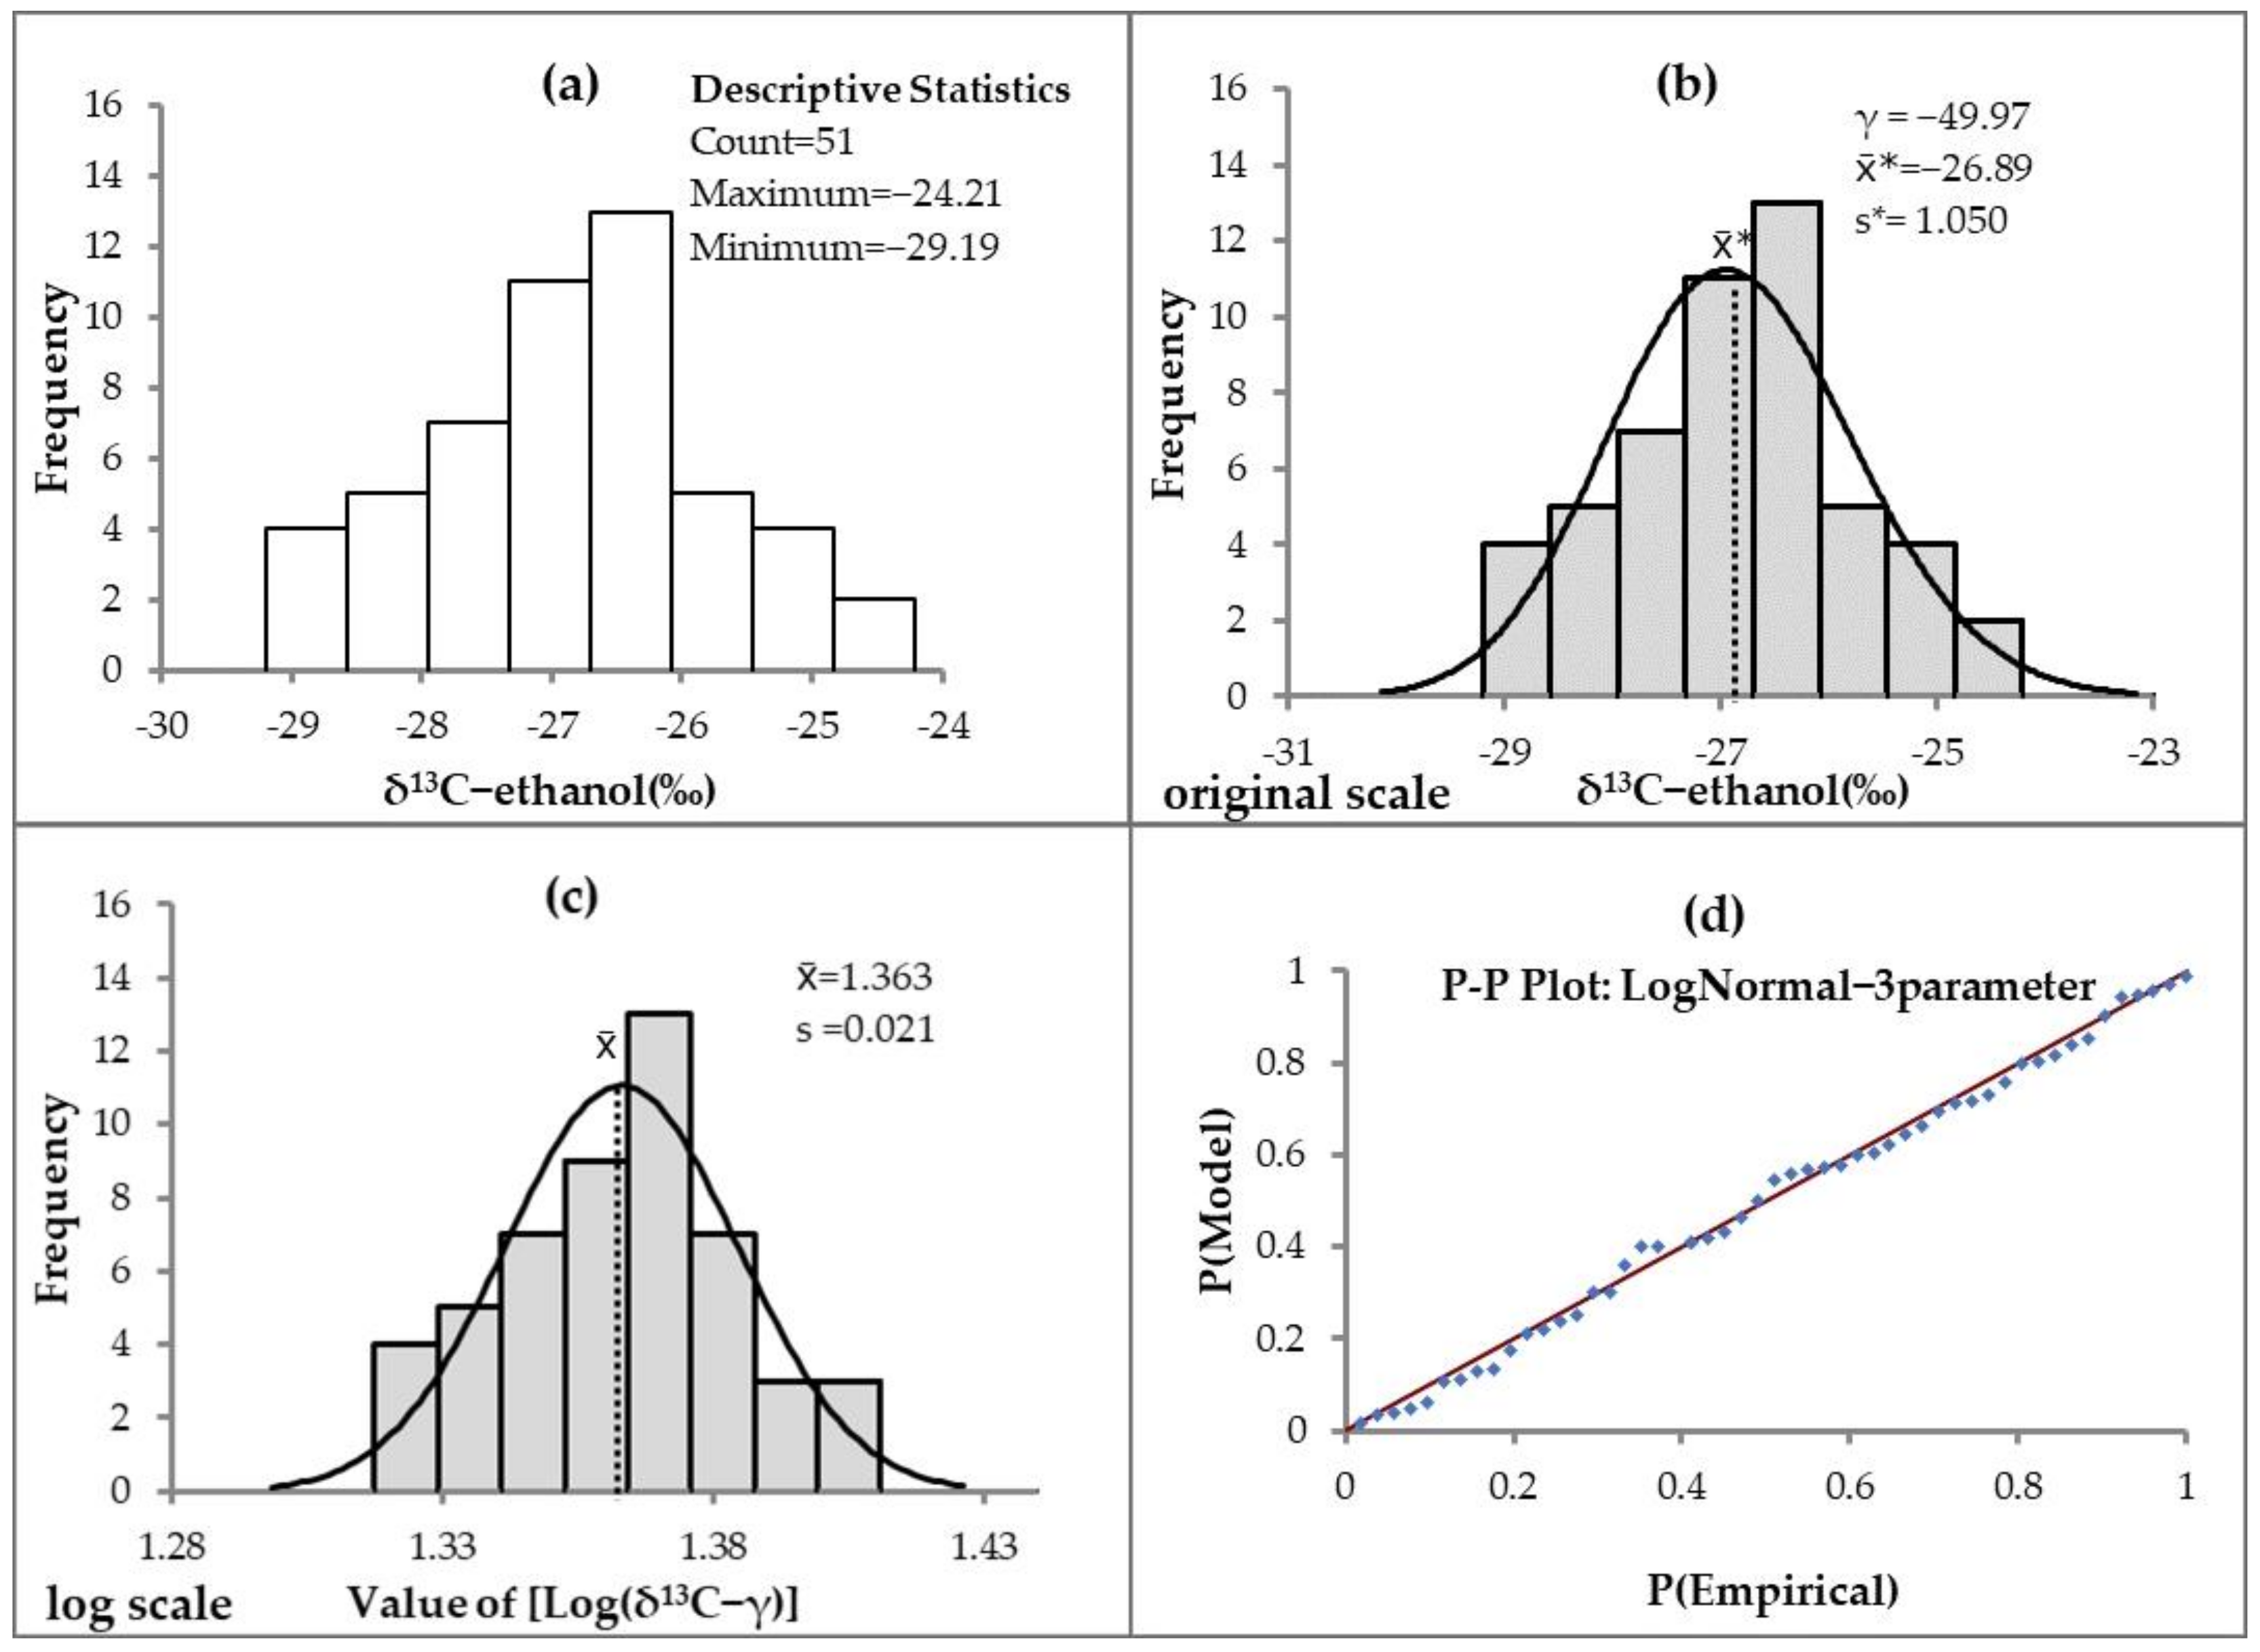
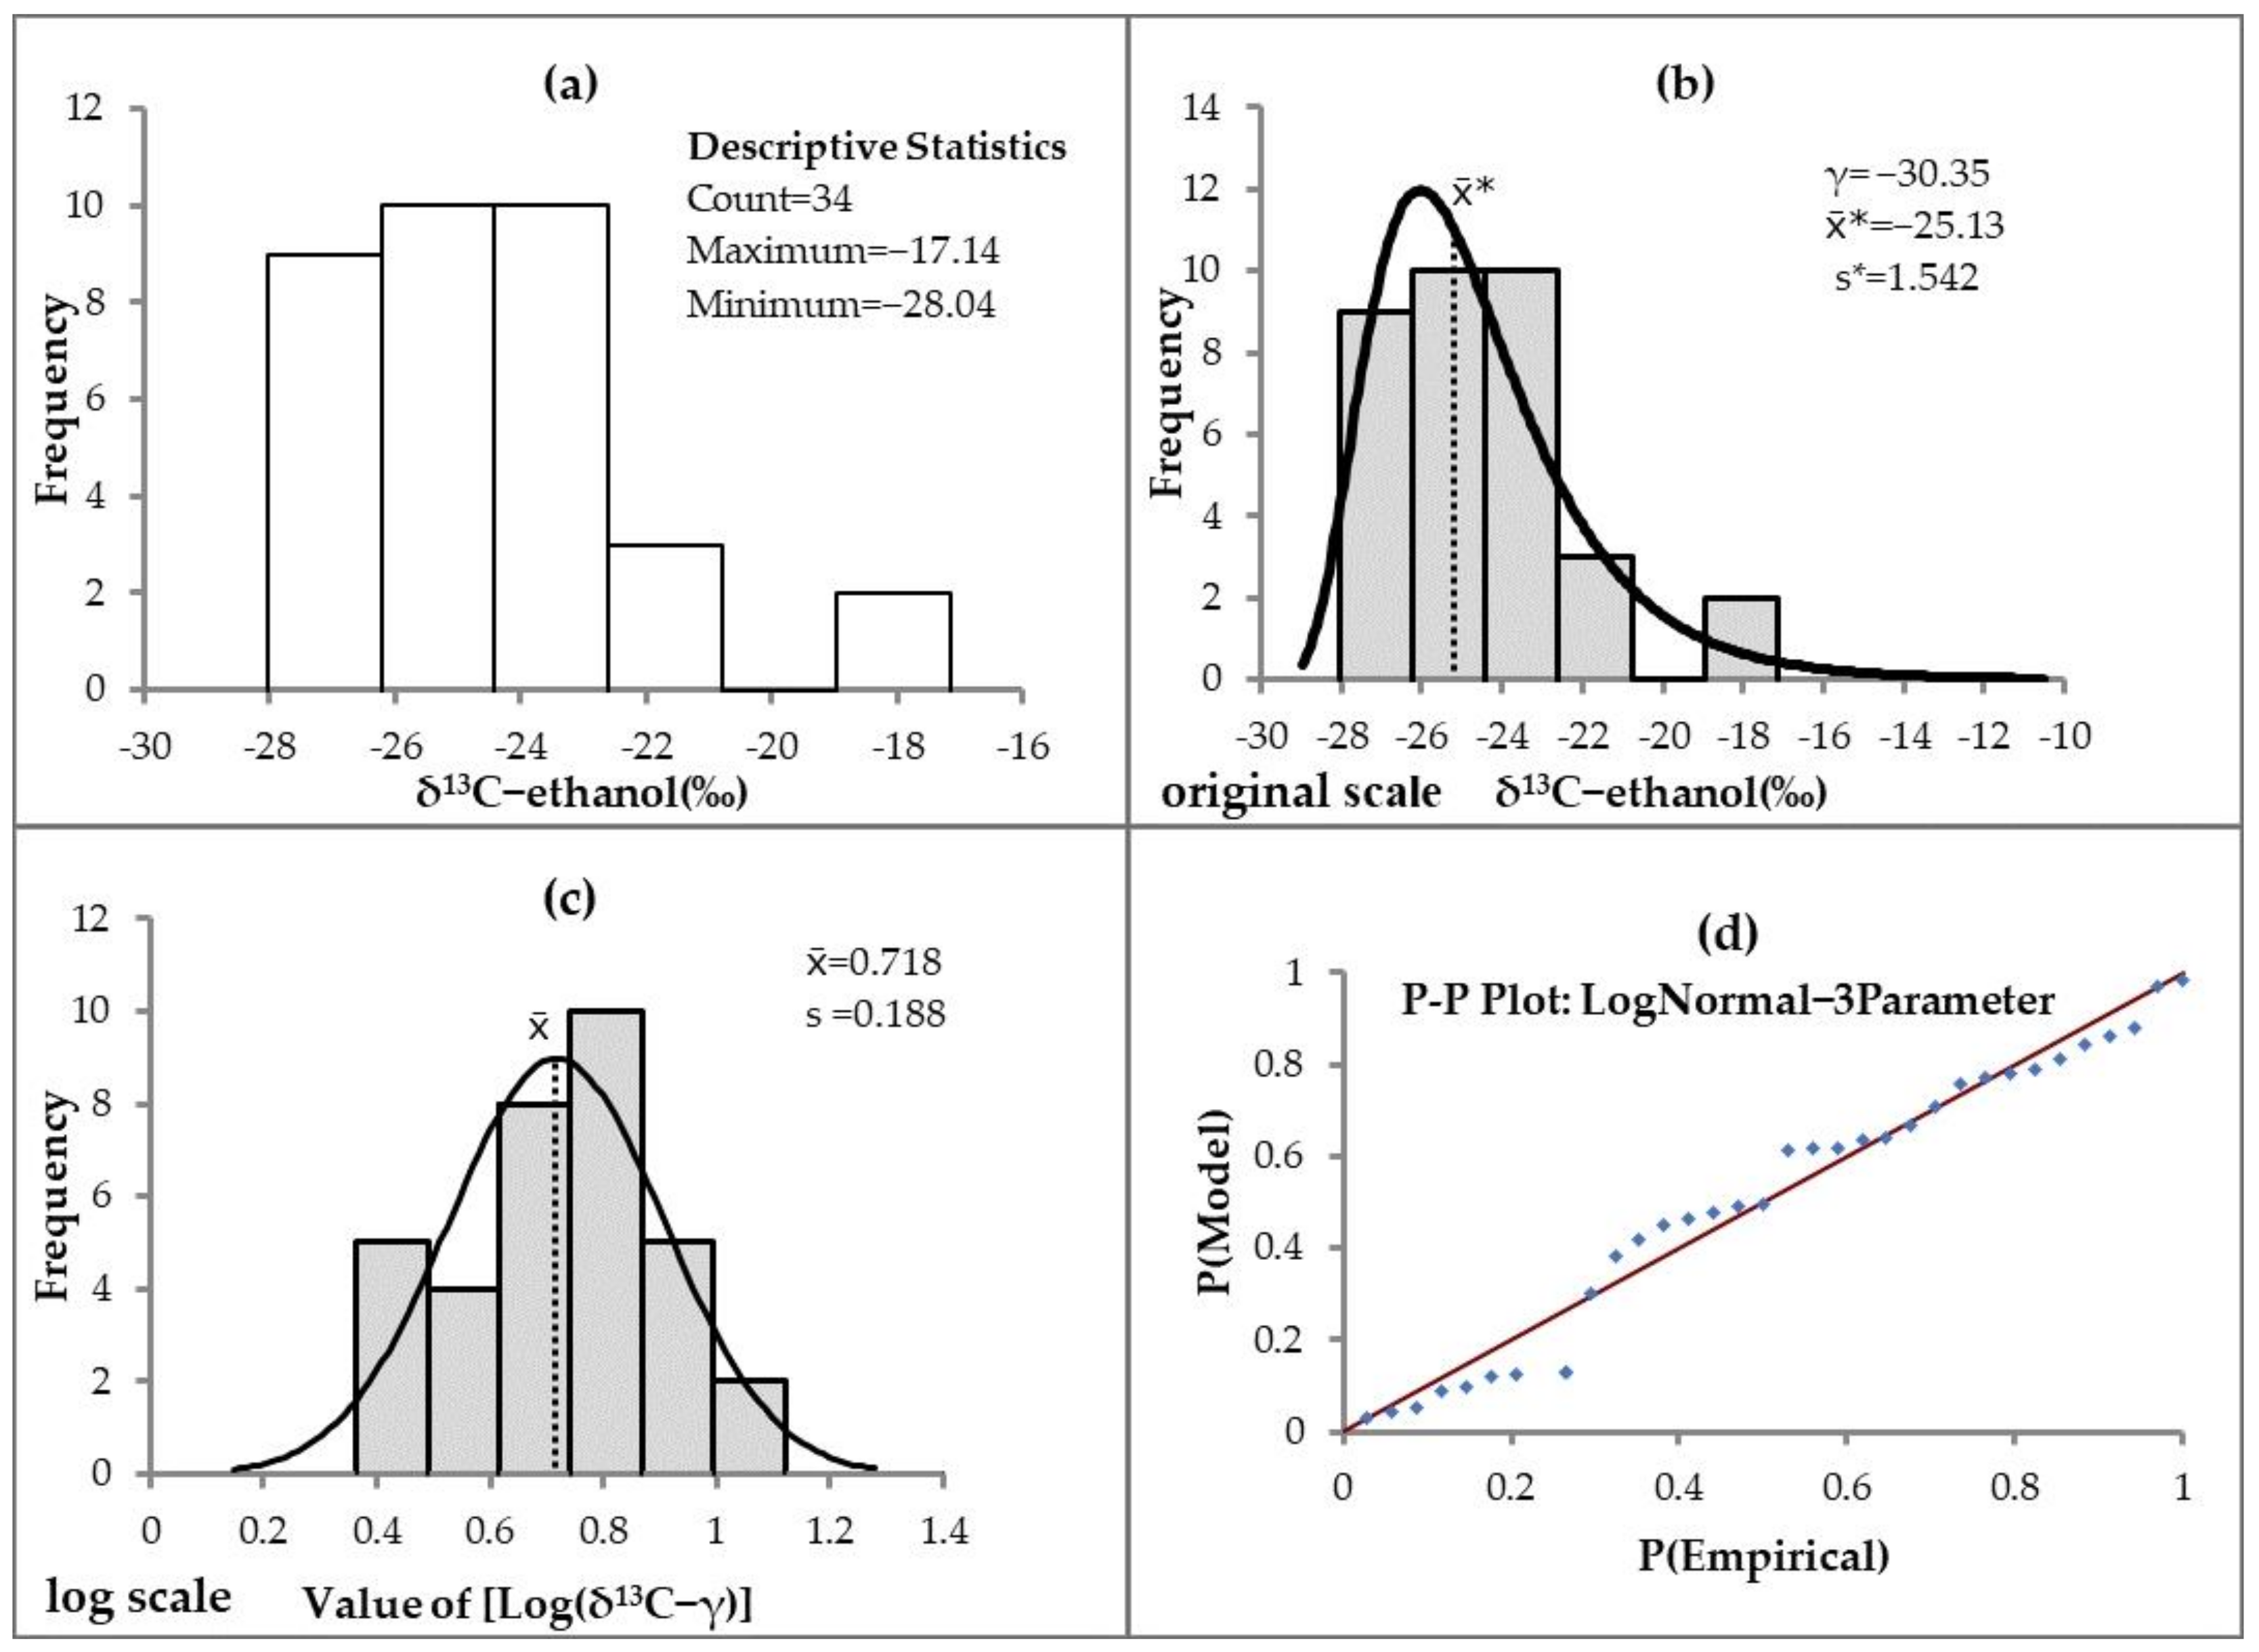
3.1. Measurements and Statistical Analysis of δ13C-ethanol Data in Scotch Whiskies

A typical chromatogram of GC-C-IRMS is displayed in Figure 1, where the ethanol peak appears at around 590 s. To avoid interference and clear the relevant data, all those signals from other constituents except ethanol were led to the FID detector. Three injections of all samples were performed for each measurement to evaluate the precision of the analytic method. All the relative standard deviations (RSD) of measurements were within 2%.
A histogram plot of the δ13C-ethanol data for 51 authentic single-malt Scotch whiskies is shown in Figure 2a and is slightly positively skewed. By the statistical definition of skewness, this positively skewed histogram may imply that the distribution of δ13C-ethanol data fits another statistical model than a normal distribution. After checking by the software SPC, a fitting distribution demonstrated that the δ13C-ethanol data of single malt Scotch whiskies not only conformed to the normal distribution but also to the 3-parameter lognormal distribution.
Furthermore, a normality test was performed in terms of Anderson-Darling and Kolmogorov–Smirnov methods [38,39] by logarithm data transformed from the raw value of δ13C-ethanol to certify the distribution attribute of the δ13C-ethanol data of authentic single malt Scotch whiskies. On the basis of the characteristics of the 3-parameter lognormal distribution, the distribution shape and range can be described by three factors, the threshold(γ), the means ( x ¯ ), and the standard deviation(s). In this study, the threshold (γ) of 3-parameter lognormal distribution was first calculated by both the SPC and Minitab software programs via the maximum likelihood estimation method and obtained the value of −49.97‰ for the δ13C-ethanol data for authentic single malt Scotch whiskies. Subsequently, all data of δ13C-ethanol as variable x were converted to log(x-γ) and tested for their normality on a log scale, as shown in Figure 2c. With their logarithmic data, both normality test results in Table 1 demonstrate the normality. As a result, the 3-parameter lognormal distribution corresponds with the distribution characters of δ13C-ethanol in authentic single-malt Scotch whiskies.
According to the statistical characteristics, the δ13C-ethanol distribution could be log-transformed to a normal one with a geometric mean x ¯ ; and a multiplicative standard deviation s, due to that a lognormal distribution is illustrative for the multiplicative central limit theorem [36]. Therefore, for authentic single malt Scotch whiskies, a distribution fitting procedure was performed on the δ13C-ethanol observations in Figure 2a and redrawn as Figure 2b, fitting a 3-parameter lognormal distribution with γ =−49.97, x ¯ * =−26.89 and s* =1.050 on the original scale, where x ¯ * and s* is back-transformed from x ¯ and s* on the log scale. The data descriptions of δ13C-ethanol data for authentic Scotch whiskies are summarized in Table 2, including the min and max of the observed values. Moreover, after refitting distribution, the transformed data of δ13C-ethanol data in single malt Scotch whiskies exhibited a normal distribution on the log scale, as shown in Figure 2c. Hence, it is concluded that the stable isotope analysis results of 51 authentic single malt Scotch whisky samples are representative, demonstrating that the δ13C-ethanol data of authentic single malt Scotch whiskies not only conform to a normal distribution but also to a 3-parameter lognormal distribution. Moreover, a probability–probability plot (P-P plot) is used to evaluate the distribution’s consistency and skewness via the visual comparison between the theoretical line and the actual spots out of the cumulative distribution functions. Figure 2d shows the P-P plot of the δ13C-ethanol data of authentic Scotch whiskies compared to the theoretical line of a 3-parameter lognormal distribution. The straight diagonal line in the figure is essentially confirming that the δ13C-ethanol data distribution in authentic single malt Scotch whiskies corresponds well to the 3-parameter lognormal distribution.
On the other hand, statistical analysis of the δ13C-ethanol data was also performed on authentic blended Scotch whisky, undergoing the same evaluation process as aforementioned. As a result, in Figure 3a, the histogram of the δ13C-ethanol data from authentic blended Scotch whiskies presents an apparent skewed pattern with the right tail, compared to Figure 2a. Moreover, after performing the data fitting process, it is found that the δ13C-ethanol distribution of the authentic blended Scotch whiskies could be described as a 3-parameter lognormal one, as shown in Figure 3b,c. After logarithmic transformation, as can be observed in Figure 3c, the data of δ13C-ethanol of authentic blended Scotch whiskies complies with a normal distribution. Meanwhile, the normality test of the transformed data, shown in Table 1, also certifies the same result.
Similarly, to obtain the threshold γ, the means x ¯ *, and the standard deviation s* of the δ13C-ethanol data, the mentioned evaluation, and back-transformed procedure was also carried out for the authentic blended Scotch whisky samples, resulting in the values in Table 2. With all investigated results, it is certified that the distribution of δ13C-ethanol data for authentic blended Scotch whiskies corresponds to a 3-parameter lognormal distribution. Likewise, Figure 3d demonstrates an excellent fit to the distribution of δ13C-ethanol data in authentic blended Scotch whiskies.

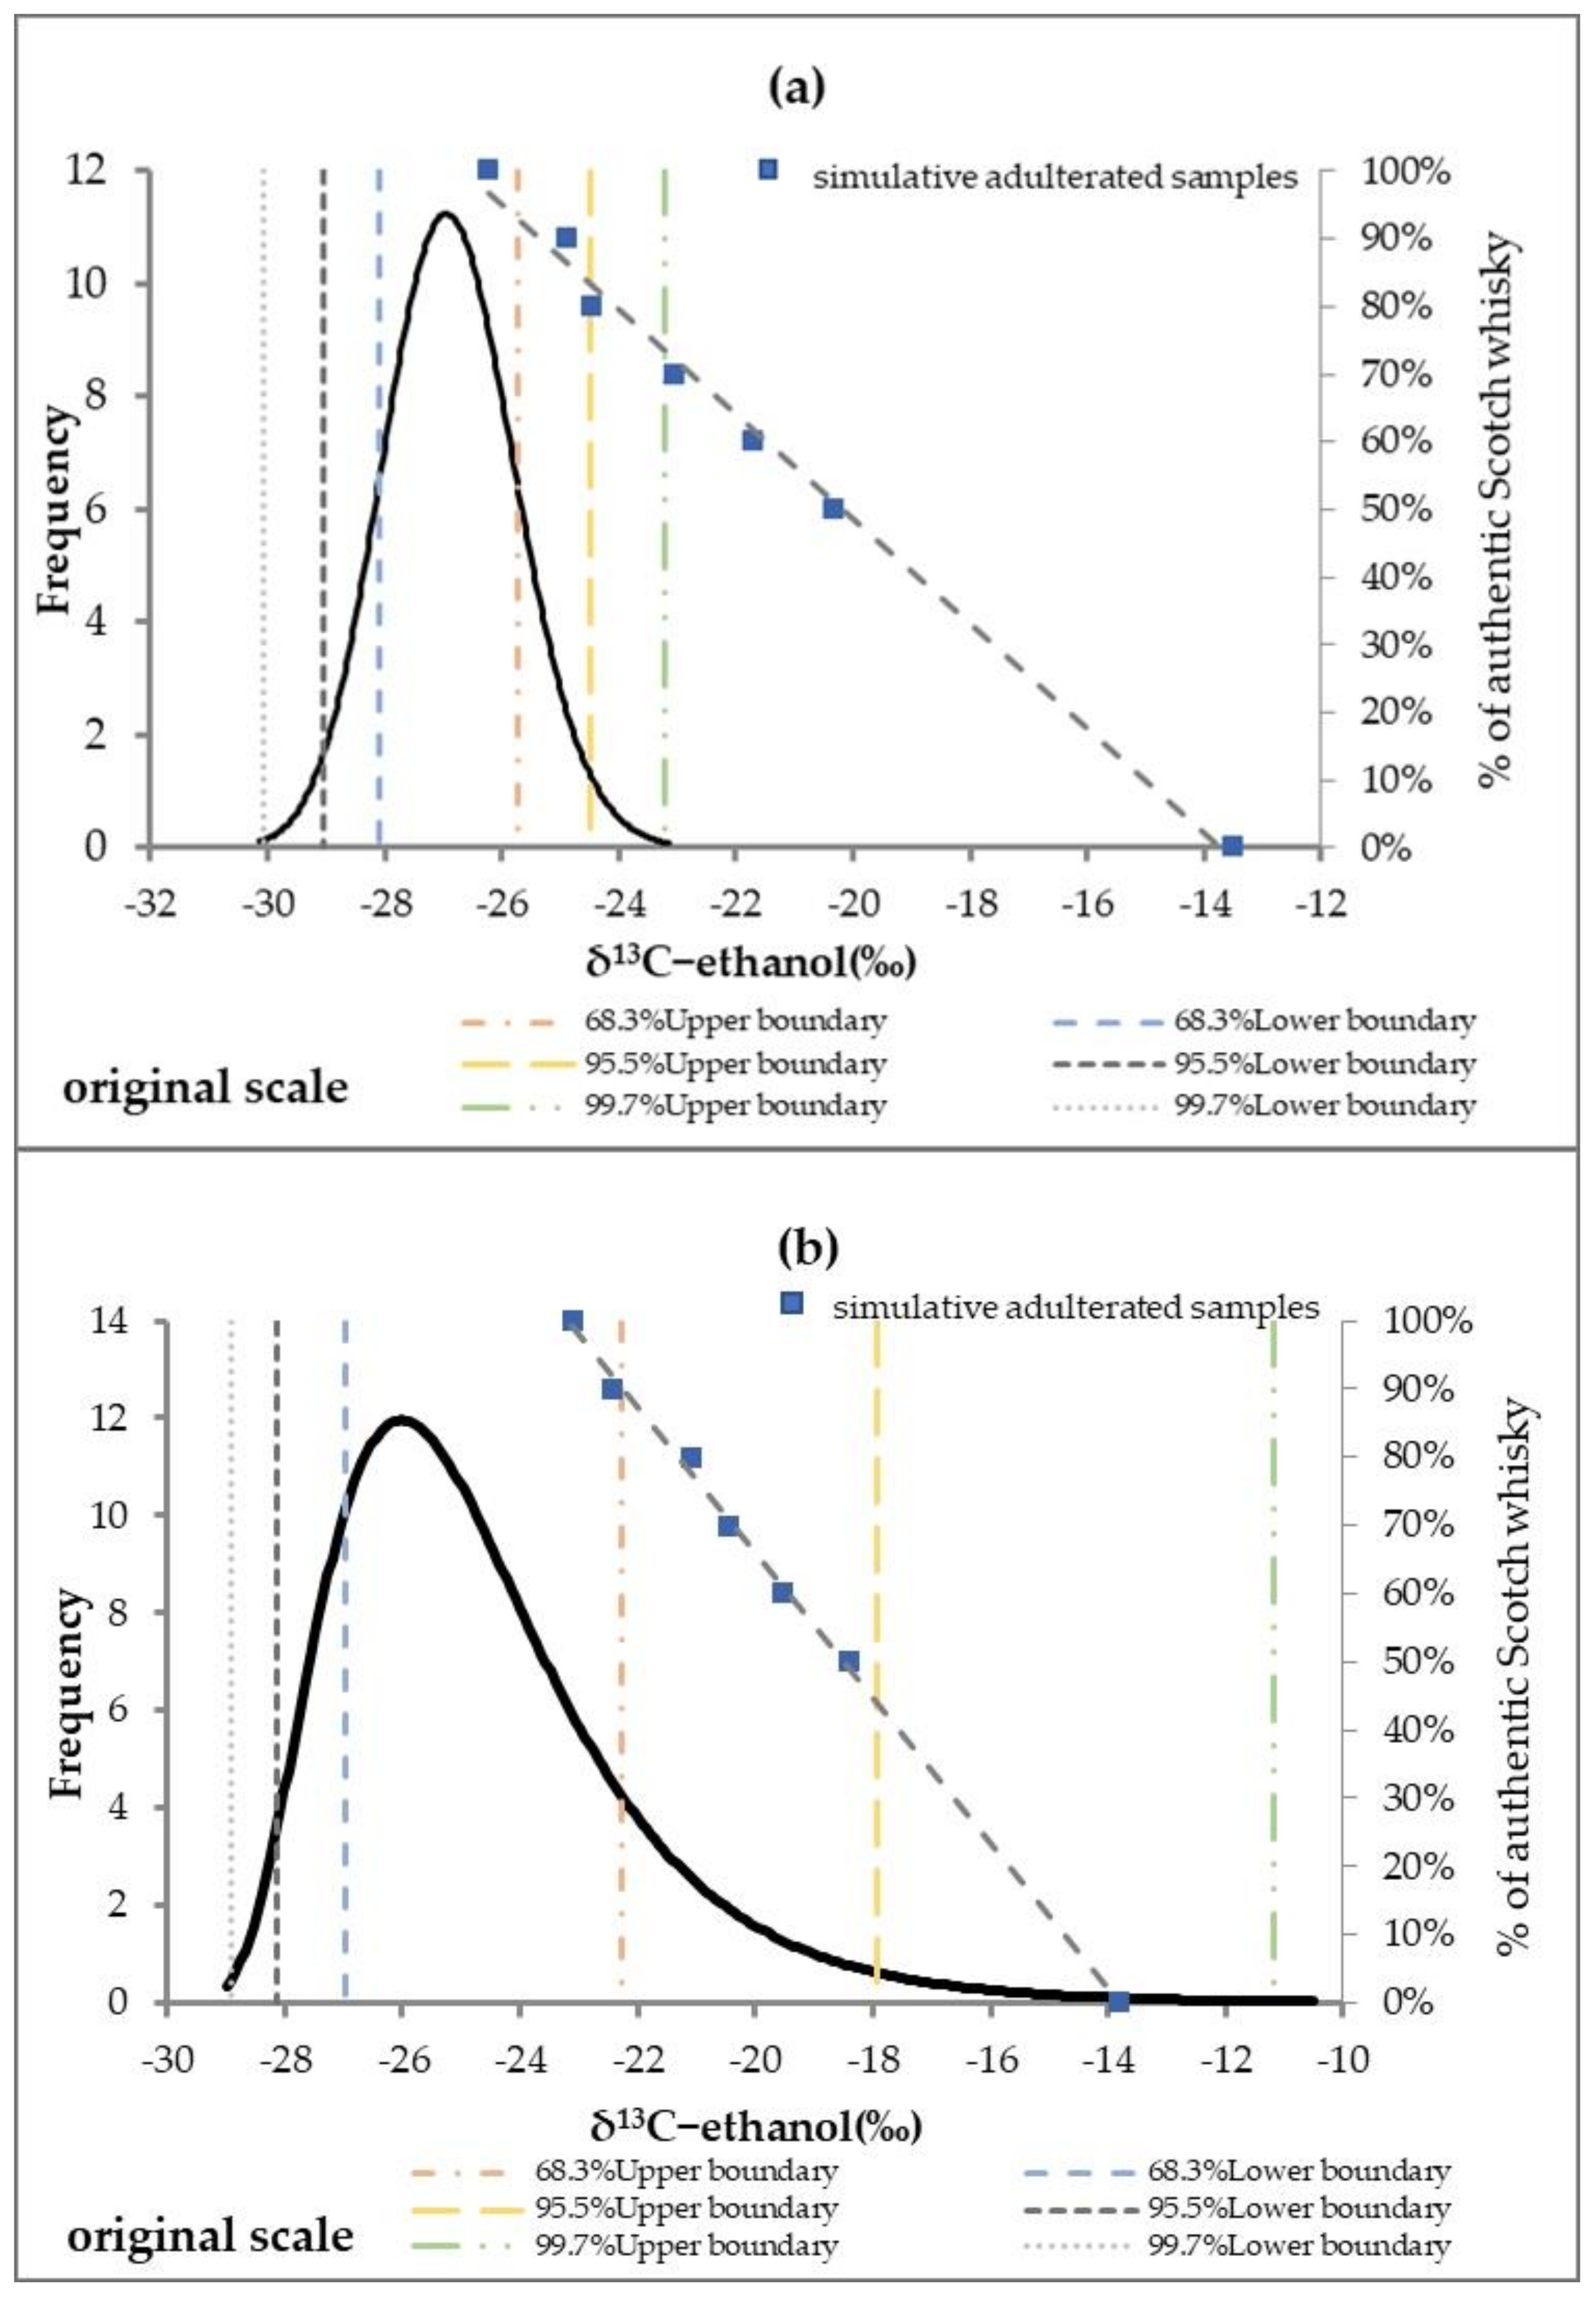
3.2. Confidence Interval of δ13C-Ethanol Data and Its Implication for Scotch Whiskies

Ideally, many experiments assume that the observed data could be described as the normal distribution, which is usually used to study the random variation of data in many investigations. However, several researchers have reported that their experimental data could not be entirely consistent with normal distribution but with the lognormal distribution [36,40,41,42,43]. Therefore, statistical evaluation should be processed under accurate distribution and result in reasonable interpretation. In the whisky production process, various factors such as raw material characteristics, microbial mechanism, and environmental conditions may lead to a multiplicative effect, resulting in a non-normal distribution of the observed δ13C-ethanol data. Ethanol is the major product of yeast fermentation, which may react with other ingredients in various ways. From the viewpoint of such variations, it is reasonable that the distribution of δ13C-ethanol data for single malt Scotch whisky and blended Scotch whisky follows a 3-parameter lognormal distribution.
With characteristics of the empirical rule, calculating the confidence intervals for δ13C-ethanol in Scotch whiskies can also be performed by their logarithm values. For the 3-parameter lognormal distribution, the confidence intervals (CI) on the log scale can be defined with the probability of 68.3% as ( x ¯ ± s), of 95.5% as ( x ¯ ± 2s), and of 99.7% as ( x ¯ ± 3s) after transforming the raw observed data to their logarithmic value. Once turned into the original scale, the corresponding CI can be performed with a probability of 68.3% as [γ + ( x ¯ * − γ) ×/s*], of 95.5% as [γ + ( x ¯ * − γ) ×/(s*)2], and of 99.7% as [γ + ( x ¯ *−γ) ×/(s*)3]. Table 3 shows the back-transformed data of δ13C-ethanol in Scotch whiskies. For a 95.5% confidence level, the boundaries of the δ13C-ethanol data are −24.50‰ to −29.06‰ for single malt Scotch whiskies, and −17.93‰ to −28.15‰ for the blended Scotch whiskies, respectively.

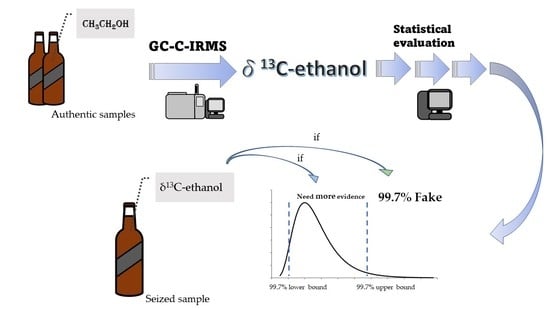
3.3. Exclusionary Criterium for Scotch Whiskies Authentication on the Basis of the Confidence Interval of δ13C-Ethanol Data

To make adulterated or counterfeit Scotch whiskies, three commonly-used edible rectified spirits by forgers, which comply with regulations of “The Tobacco and Alcohol Administration Act” in Taiwan [44], were selected to examine the δ13C-ethanol for reference. Two samples belonged to C4-derived spirits, and one was a C3-derived spirit, as shown in Table 4. Since the single malt Scotch whisky belongs to C3-derived spirits, C3-derived edible rectified spirit is not suitable by using the exclusory criterium for seized Scotch whiskies by stable isotope analysis in this study. On the basis of the types of rectified spirits found in some seized cases of Scotch whiskies in Taiwan, the C4-derived rectified spirit was selected to prepare the simulative Scotch whiskies in this study. The simulative results are shown in Figure 4.
In Figure 4a, a series of the simulative adulterated single malt Scotch whiskies were prepared by adding 40% ABV rectified spirit with a δ13C-ethanol of −13.50 to an authentic single malt Scotch whisky with a δ13C-ethanol of −26.21 with various ratios. The selection of the rectified spirit for use in these spikes was due to its easy acquirement and extensive use in Taiwan. In this case, the δ13C-ethanol data of authentic single malt Scotch whiskies would become more positive when a more diluted rectified spirit of 40% ABV was added. Once the adding volume ratio of diluted rectified spirit becomes more than 30% of the total solution, i.e., the volume ratio of authentic single malt Scotch whisky less than 70% of the total solution, the δ13C-ethanol for simulated adulterated single malt Scotch whisky would be above the 99.7% CI boundary. Therefore, it turns out to be fake. Based on the reports from seized cases in Taiwan, most forgers adulterated or counterfeit Scotch whiskies with more than 30% dilution in order to gain high profits. Consequently, the simulation experiment of adding C4-derived spirits to authentic single-malt Scotch whisky proves the importance of establishing δ13C-ethanol CI and provides a reference for seized Scotch whisky cases in Taiwan.
Similarly, Figure 4b is the relation between the observed δ13C-ethanol data of simulative adulterated blended Scotch whiskies and their corresponding adding volume ratio of an authentic blended Scotch whisky and diluted rectified spirit. As the δ13C-ethanol of the rectified spirit is −13.50, which is still within the domains of 95.5% and 99.7% CIs of authentic blended Scotch whiskies, the δ13C-ethanol of simulative adulterated blended Scotch whiskies explains less exclusive power for authentication. In other words, the elimination of authentic single malt Scotch whiskies is more evidential than authentic blended Scotch whiskies in this study. Taking into consideration the CIs and the experimental results from simulative adulterated samples, these data could provide significant clues for the authentication of Scotch whiskies. As a result, the CI established in this study could be considered as a role as an eliminative tool for the discrimination of seized Scotch whiskies.
For the δ13C-ethanol investigation, some research for wine authentication was also studied with a statistical approach. In addition, Spitzke and Fauhl-Hassek established confidence intervals for regression lines of ethanol and other components in wine [45]. Based on their results, the correlation of δ13C values between ethanol and other components may provide more evidence for authentication after the first exclusory evaluation.

4. Conclusions

In this study, we first demonstrate that a suitable distribution model, a 3-parameter lognormal distribution, can describe the δ13C-ethanol values measured by GC-C-IRMS through a series of rigorous statistical interpretations. In addition, we further evaluated and narrowed the distribution of δ13C-ethanol in single malt Scotch whisky and blended Scotch whisky by the 3-parameter lognormal distribution principle. Moreover, we evaluated the exact range of stable isotope values for δ13C-ethanol produced by malted barley fermentation reaction as between −23.21‰ to −30.07‰ on the basis of δ13C-ethanol data in single malt Scotch whisky through a series of reliable statistical processes. With these CI boundaries, the simulative adulterated Scotch whiskies could also be exclusively screened while the seized Scotch whisky containing more than 30% C4-derived edible distilled spirits without comparing specific authentic reference samples. This result has been proven to effectively discriminate most adulterated and counterfeit Scotch whiskies in Taiwan. Therefore, based on the above results, the importance of establishing the CI with δ13C-ethanol is demonstrated to provide an effective method for primary discriminating seized Scotch whiskies.
It should be emphasized that the CI boundaries established in this work for exclusive authentication are based on the δ13C-ethanol value, which is highly associated with the characteristics of raw materials used in the process of Scotch whiskies. For those adulterated Scotch whiskies whose δ13C-ethanol values fell into the CI boundaries, those results can not be directly recognized as authentic Scotch whiskies. To obtain other evidence, some of the analytical methods, such as pH measurement, the gas chromatography–mass spectrometry analysis of methanol or other Scotch whisky congeners, or other spectra measurements, should be considered to establish more authentication criteria.

Author Contributions

Conceptualization, methodology, and validation, H.-W.H. and W.-T.C.; formal analysis, investigation, data curation, writing—original draft preparation and visualization, H.-W.H.; writing—review and editing, supervision, project administration, W.-T.C. All authors have read and agreed to the published version of the manuscript.

Funding

This research was funded by the Ministry of the Interior, Republic of China (Taiwan), project no. 109-0805-05-17-01.

Data Availability Statement

Data available upon request.

Conflicts of Interest

The authors declare no conflict of interest.

References

  1. International Trade, Scotch Whisky 2021 Exports Report, Scotch Whisky Association. Available online: https://www.scotch-whisky.org.uk/insights/international-trade/ (accessed on 11 February 2021).
  2. foodNEXT. Rare in the World! Why Does Taiwan Love to Drink Single Malt Whisky so Much? (Chinese Version). Available online: https://reurl.cc/kEXV0r (accessed on 30 October 2020).
  3. Câmara, J.S.; Marques, J.C.; Perestrelo, R.M.; Rodrigues, F.; Oliveira, L.; Andrade, P.; Caldeira, M. Comparative study of the whisky aroma profile based on headspace solid phase microextraction using different fibre coatings. J. Chromatogr. A 2007, 1150, 198–207. [Google Scholar] [CrossRef] [PubMed]
  4. González-Arjona, D.; López-Pérez, G.; González-Gallero, V.; González, A.G. Supervised Pattern Recognition Procedures for Discrimination of Whiskeys from Gas Chromatography/Mass Spectrometry Congener Analysis. J. Agric. Food Chem. 2006, 54, 1982–1989. [Google Scholar] [CrossRef] [PubMed]
  5. Wiśniewska, P.; Dymerski, T.; Wardencki, W.; Namiesnik, J. Chemical composition analysis and authentication of whisky. J. Sci. Food Agric. 2015, 95, 2159–2166. [Google Scholar] [CrossRef] [PubMed]
  6. Stupak, M.; Goodall, I.; Tomaniova, M.; Pulkrabova, J.; Hajslova, J. A novel approach to assess the quality and authenticity of Scotch Whisky based on gas chromatography coupled to high resolution mass spectrometry. Anal. Chim. Acta 2018, 1042, 60–70. [Google Scholar] [CrossRef] [PubMed]
  7. Smith, B.L.; Hughes, D.M.; Badu-Tawiah, A.K.; Eccles, R.; Goodall, I.; Maher, S. Rapid Scotch Whisky Analysis and Authentication using Desorption Atmospheric Pressure Chemical Ionisation Mass Spectrometry. Sci. Rep. 2019, 9, 7994. [Google Scholar] [CrossRef]
  8. Kew, W.; Goodall, I.; Clarke, D. Chemical Diversity and Complexity of Scotch Whisky as Revealed by High-Resolution Mass Spectrometry. J. Am. Soc. Mass Spectrom. 2017, 28, 200–213. [Google Scholar] [CrossRef]
  9. Power, A.C.; Néill, C.N.; Geoghegan, S.; Currivan, S.; Deasy, M.; Cozzolino, D. A Brief History of Whiskey Adulteration and the Role of Spectroscopy Combined with Chemometrics in the Detection of Modern Whiskey Fraud. Beverages 2020, 6, 49. [Google Scholar] [CrossRef]
  10. Wiśniewska, P.; Boqué, R.; Borràs, E.; Busto, O.; Wardencki, W.; Namieśnik, J.; Dymerski, T. Authentication of whisky due to its botanical origin and way of production by instrumental analysis and multivariate classification methods. Spectrochim. Acta Part A Mol. Biomol. Spectrosc. 2017, 173, 849–853. [Google Scholar] [CrossRef]
  11. MacKenzie, W.M.; Aylott, R.I. Analytical strategies to confirm Scotch whisky authenticity. Part II;: Mobile brand authentication. Analyst 2004, 129, 607–612. [Google Scholar] [CrossRef]
  12. Ashok, P.C.; Praveen, B.B.; Dholakia, K. Near infrared spectroscopic analysis of single malt Scotch whisky on an optofluidic chip. Opt. Express 2011, 19, 22982–22992. [Google Scholar] [CrossRef] [Green Version]
  13. Sujka, K.; Koczńn, P. The application of FT-IR spectroscopy in discrimination of differently originated and aged whisky. Eur. Food Res. Technol. 2018, 244, 2019–2025. [Google Scholar] [CrossRef]
  14. Martins, R.; Talhavini, M.; Vieira, M.L.; Zacca, J.J.; Braga, J.W.B. Discrimination of whisky brands and counterfeit identification by UV–Vis spectroscopy and multivariate data analysis. Food Chem. 2017, 229, 142–151. [Google Scholar] [CrossRef] [PubMed]
  15. Arslan, M.M.; Zeren, C.; Aydin, Z.; Akcan, R.; Dokuyucu, R.; Keten, A.; Cekin, N. Analysis of methanol and its derivatives in illegally produced alcoholic beverages. J. Forensic Leg. Med. 2015, 33, 56–60. [Google Scholar] [CrossRef]
  16. Aylott, R.I.; Clyne, A.H.; Fox, A.P.; Walker, D.A. Analytical strategies to confirm Scotch whisky authenticity. Analyst 1994, 119, 1741–1746. [Google Scholar] [CrossRef]
  17. Aylott, R.I.; MacKenzie, W.M. Analytical Strategies to Confirm the Generic Authenticity of Scotch Whisky. J. Inst. Brew. 2010, 116, 215–229. [Google Scholar] [CrossRef]
  18. Singer, D.D. The proportion of 2-methylbutanol and 3-methylbutanol in some brandies and whiskies as determined by direct gas chromatography. Analyst 1966, 91, 790–794. [Google Scholar] [CrossRef]
  19. Huang, H.-W.; Chang, W.-T. Methanol Concentration as a Preceding Eliminative Marker for the Authentication of Scotch Whiskies in Taiwan. Forensic Sci. Int. 2022, 339, 111413. [Google Scholar] [CrossRef]
  20. Parker, G.; Kelly, S.D.; Sharman, M.; Dennis, M.J.; Howie, D. Investigation into the use of carbon isotope ratios (13C/12C) of Scotch whisky congeners to establish brand authenticity using gas chromatography-combustion-isotope ratio mass spectrometry. Food Chem. 1998, 63, 423–428. [Google Scholar] [CrossRef]
  21. Rhodes, C.N.; Heaton, K.; Goodall, I.; Brereton, P.A. Gas chromatography carbon isotope ratio mass spectrometry applied to the detection of neutral alcohol in Scotch whisky: An internal reference approach. Food Chem. 2009, 114, 697–701. [Google Scholar] [CrossRef]
  22. Meier-Augenstein, W. Applied gas chromatography coupled to isotope ratio mass spectrometry. J. Chromatogr. A 1999, 842, 351–371. [Google Scholar] [CrossRef]
  23. Meier-Augenstein, W.; Kemp, H.F.; Hardie, S. Detection of counterfeit scotch whisky by 2H and 18O stable isotope analysis. Food Chem. 2012, 133, 1070–1074. [Google Scholar] [CrossRef]
  24. Cook, G.; Dunbar, E.; Tripney, B.; Fabel, D. Using Carbon Isotopes to Fight the Rise in Fraudulent Whisky. Radiocarbon 2020, 62, 51–62. [Google Scholar] [CrossRef]
  25. Bender, M.M. Variations in the 13C/12C ratios of plants in relation to the pathway of photosynthetic carbon dioxide fixation. Phytochemistry 1971, 10, 1239–1244. [Google Scholar] [CrossRef]
  26. Gregoricka, L.A. Stable isotopes. In The International Encyclopedia of Biological Anthropology; John Wiley & Sons, Inc.: Hoboken, NJ, USA, 2018; ISBN 9781118584422. [Google Scholar] [CrossRef]
  27. Guy, R.D.; Fogel, M.; Berry, J.A. Photosynthetic Fractionation of the Stable Isotopes of Oxygen and Carbon. Plant Physiol. 1993, 101, 37–47. [Google Scholar] [CrossRef]
  28. Meier-Augenstein, W. Stable Isotope Forensics: An Introduction to the Forensic Application of Stable Isotope Analysis; Academic Press: Cambridge, MA, USA, 2010; ISBN 978-0-470-51705-5. [Google Scholar]
  29. The Scotch Whisky Regulations 2009 No. 2890. 2009. Available online: https://www.legislation.gov.uk/uksi/2009/2890/pdfs/uksi_20092890_en.pdf (accessed on 23 November 2009).
  30. Stewart, G.; Russell, I. Whisky: Technology, Production and Marketing, 2nd ed.; Wiley-Blackwell: Hoboken, NJ, USA, 2014; ISBN 978-0124017351. [Google Scholar]
  31. Simpkins, W.A.; Rigby, D. Detection of the illicit extension of potable spirituous liquors using13C:12C ratios. J. Sci. Food Agric. 1982, 33, 898–903. [Google Scholar] [CrossRef]
  32. Bauer-Christoph, C.; Wachter, H.; Christoph, N.; Rossmann, A.; Adam, L. Assignment of raw material and authentication of spirits by gas chromatography, hydrogen- and carbon-isotope ratio measurements I. Analytical methods and results of a study of commercial products. Z. Lebensm. Unters. Forsch. 1997, 204, 445–452. [Google Scholar] [CrossRef]
  33. Calderone, G.; Holland, M.V.; Reneiro, F.; Guillou, C. An Overview of Isotopic Analysis for the Control of Alcoholic Drinks and Spirits. European Commission Joint Research Centre. 2005, pp. 1–31. Available online: https://www.researchgate.net/publication/285365882 (accessed on 1 January 2005).
  34. Martin, G.J.; Martin, M.L.; Mabon, F.; Michon, M.J. A new method for the identification of the origin of ethanols in grain and fruit spirits: High-field quantitative deuterium nuclear magnetic resonance at the natural abundance level. J. Agric. Food Chem. 1983, 31, 311–315. [Google Scholar] [CrossRef]
  35. Gajek, M.; Pawlaczyk, A.; Maćkiewicz, E.; Albińska, J.; Wysocki, P.; Jóźwik, K.; Szynkowska-Jóźwik, M.I. Assessment of the Authenticity of Whisky Samples Based on the Multi-Elemental and Multivariate Analysis. Foods 2022, 11, 2810. [Google Scholar] [CrossRef]
  36. Limpert, E.; Stahel, W.A.; Abbt, M. Log-normal Distributions across the Sciences: Keys and Clues. BioScience 2001, 51, 341–352. [Google Scholar] [CrossRef]
  37. Motulsky, H.J. Common misconceptions about data analysis and statistics. Br. J. Pharmacol. 2015, 172, 2126–2132. [Google Scholar] [CrossRef]
  38. Razali, N.M. Power comparisons of Shapiro-Wilk, Kolmogorov-Smirnov, Lilliefors and Anderson–Darling tests. J. Stat. Model. Anal. 2011, 2, 21–33. [Google Scholar]
  39. Cousineau, D.; Engmann, S. Comparing distributions: The two-sample Anderson–Darling test as an alternative to the Kolmogorov–Smirnov test. J. Appl. Quant. Methods 2011, 6, 1–17. [Google Scholar]
  40. Siano, D.B. The log-normal distribution function. J. Chem. Educ. 1972, 49, 755–757. [Google Scholar] [CrossRef]
  41. Annila, A.; Grönholm, T. Natural Distribution. Math. Biosci. 2007, 210, 659–667. [Google Scholar]
  42. Graddum, J.H. Lognormal distribution. Nature 1945, 156, 463–466. [Google Scholar] [CrossRef]
  43. Koch, L. The logarithm in biology 1. Mechanisms generating the log-normal distribution exactly. J. Theor. Biol. 1966, 23, 276–290. [Google Scholar] [CrossRef] [PubMed]
  44. The Tobacco and Alcohol Administration Act, Ministry of Finance (R.O.C). Available online: https://law.moj.gov.tw/ENG/LawClass/LawAll.aspx?pcode=G0330011 (accessed on 27 December 2017).
  45. Spitzke, M.E.; Fauhl-Hassek, C. Determination of the 13C/12C ratios of ethanol and higher alcohols in wine by GC-C-IRMS analysis. Eur. Food Res. Technol. 2010, 231, 247–257. [Google Scholar] [CrossRef]
Figure 1. A GC-C-IRMS chromatogram with an ethanol peak at around 590 s. The colors in the figure present the isotopologues of CO2, which are m/z 44,45,46.
Beverages 09 00013 g001
Figure 2. Statistical evaluating results of authentic single malt Scotch whiskies. (a) The histogram of δ13C−ethanol. (b) The distribution of observed δ13C−ethanol. (c) The distribution of transformed δ13C−ethanol. (d) The P-P plot of δ13C−ethanol.
Beverages 09 00013 g002
Figure 3. Statistical evaluating results of authentic blended Scotch whisky. (a) The histogram of δ13C-ethanol. (b) The distribution of observed δ13C−ethanol. (c) The distribution of transformed δ13C−ethanol. (d) The P-P plots of δ13C−ethanol.
Beverages 09 00013 g003
Figure 4. The relation between the percentage of authentic Scotch whisky and the observed δ13C-ethanol after adding various amounts of rectified spirit with a δ13C−ethanol of −13.50‰(avg.) to (a) an authentic single malt Scotch whisky with a δ13C−ethanol of −26.21‰(avg.) and (b) an authentic blended Scotch whisky with a δ13C−ethanol of −23.12‰(avg.).
Beverages 09 00013 g004
Table 1. Normality test results of log-transformed δ13C-ethanol data of authentic Scotch whiskies.
Anderson–Darling MethodKolmogorov–Smirnov Method
StatisticdfSig.StatisticdfSig.
Single malt Scotch whisky0.152510.9580.479510.976
Blended Scotch whisky0.526340.1670.762340.607
Table 2. Data descriptions of δ13C-ethanol data for authentic Scotch whiskies.
No. of SamplesMinMaxThresholdMeanStandard Deviation *Standard Deviation **
Single malt Scotch whisky51−29.19‰−24.21‰−49.97 ‰−26.89‰1.0500.021
Blended Scotch whisky34−28.04‰−17.14‰−30.35 ‰−25.13‰1.5420.188
* On the original scale; ** On the log scale.
Table 3. Confidence intervals of δ13C-ethanol data for authentic Scotch whiskies.
68.3%95.5%99.7%
Upper BoundLower BoundUpper BoundLower BoundUpper BoundLower Bound
Unit: (‰)
Single malt Scotch whisky−25.73−28.01−24.50−29.06−23.21−30.07
Blended Scotch whisky−22.29−26.96−17.93−28.15−11.19−28.93
Table 4. δ13C-ethanol data of commonly-used edible rectified spirit in Taiwan.
SupplierTaiwan Sugar Corp.Taiwan Tobacco & Liquor Corp.Echo Chemical Co., Ltd.
δ13C-ethanol−13.50 (‰)−14.63 (‰)−24.76 (‰)
TypeC4-derived spiritC4-derived spiritC3-derived spirit
Disclaimer/Publisher’s Note: The statements, opinions and data contained in all publications are solely those of the individual author(s) and contributor(s) and not of MDPI and/or the editor(s). MDPI and/or the editor(s) disclaim responsibility for any injury to people or property resulting from any ideas, methods, instructions or products referred to in the content.

