1. Introduction
Like many industries, Australian cider production declined during the COVID-19 pandemic, which resulted in a reduction in local production, consumption, and exports. However, boutique and craft cider breweries are expected to experience a period of growth over the next five years. According to a market report published by IBISWorld [
1], consumer demand for higher-quality ciders is increasing, and as such, the producer’s focus is likely to follow suit. It was suggested by Wilson et al. [
2] that in order to support the growth of the Australian cider industry, there needs to be a similar growth in research. Given the anticipated demand for higher-quality cider products, research needs to focus on technologies and methods that introduce and improve favourable organoleptic properties, mainly taste and aroma.
The aromatic alcohol 2-phenylethanol (2-PE) is a naturally occurring compound that occurs most commonly in rose flowers [
3]. Known for its intense floral, rose, and honey aromas [
4], it is extensively used in the cosmetics, perfumes, and food industries [
5,
6]. Moreover, 2-PE is also one of the most important and abundant VOCs found in cider [
2,
7,
8], being reported at concentrations as high as 100 mg L
−1 [
9]; well above its aroma threshold of 10 mg L
−1 in 10% ethanol [
10].
In 2010, the global industrial production of 2-PE was estimated at 10,000 tons p.a. [
11]. Most of the 2-PE produced for these industries is via synthetic pathways, specifically the ethylene oxidation of benzene or the reduction of styrene oxide [
11]. The resulting synthetic 2-PE is valued at about U.S.
$5/kg. Although inexpensive, synthetic production methods take a considerable toll on the environment, requiring high temperatures and pressure and several chemicals resulting in unwanted chemical waste. Alternatively, naturally sourced 2-PE is far more environmentally friendly, but it is valued at U.S.
$1000/kg [
11].
Historically, the concept of a natural flavour compound requires extraction from its natural source, such as 2-PE extraction from rose petals [
12]. However, in 2001 the U.S. Food and Drug Administration and European legislation declared that for labelling and product compliance, a compound was considered natural if it was produced from a natural substrate by enzymatic, microbial, or physical processes [
13]. This legislative change resulted in the research and development of improved methods to produce 2-PE using natural substrates, predominantly for use in the perfume and food additive industry. Therefore, the industry requires biotechnological pathways that consistently and economically allow for the production of high-quality natural compounds with minimal adverse environmental effects. The versatility of microbial-based biotechnologies positions them as a prime candidate for such a role [
14], as many biosynthetic pathways that produce desirable compounds can be expressed by microbes such as yeast [
15].
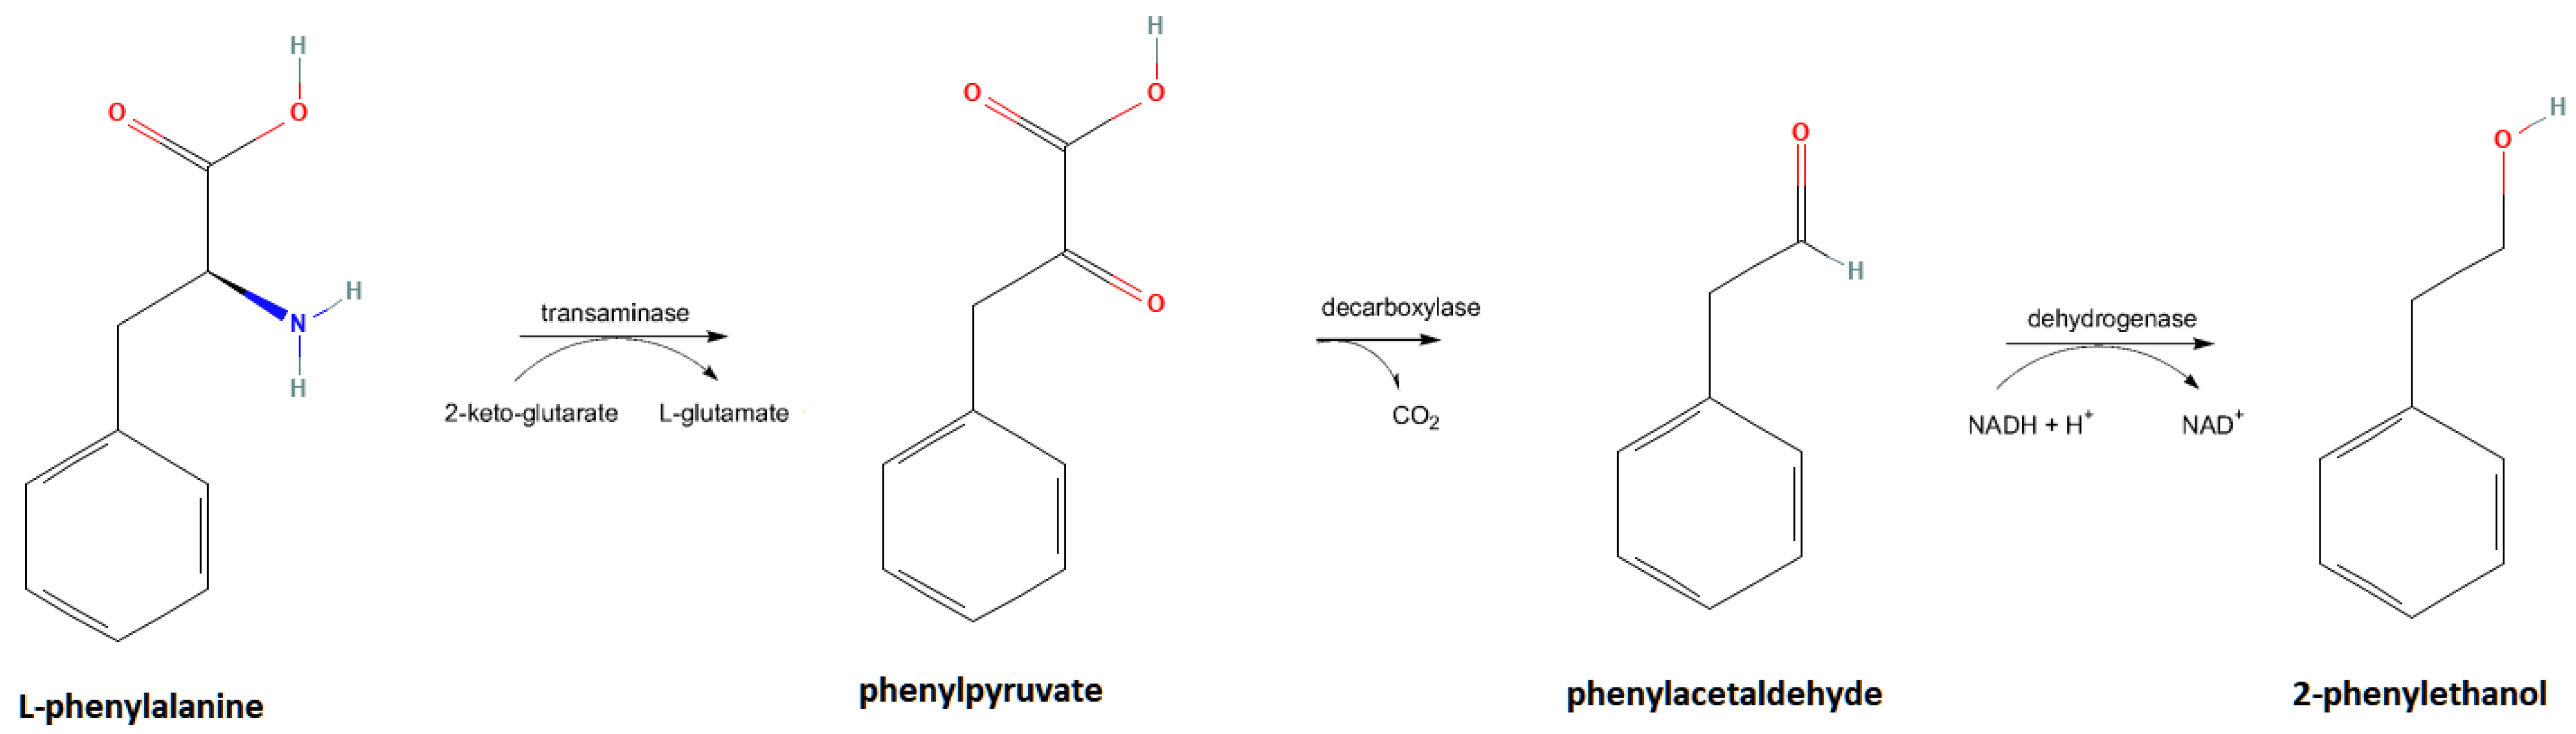
The most prominent pathway for the biological production of natural 2-PE is the Ehrlich pathway (
Figure 1). L-phenylalanine (L-phe) is transaminated to phenylpyruvate, which is decarboxylated to phenylacetaldehyde, which is then reduced to 2-PE [
11]. However, it has been reported that on average (across eight common apple varieties) L-phe accounts for less than 0.2% of the overall amino acid profile [
16]. As such, it is highly likely that the natural production of 2-PE within ciders is primarily achieved with assistance from the shikimate pathway. In the shikimate pathway, phosphoenolpyruvate and erythrose-4-phosphate from glycolysis undergo a condensation reaction with chorismate and prephenate, forming phenylpyruvate, which is substituted into the Ehrlich pathway [
12,
17]. However, the shikimate pathway suffers from considerable feedback inhibition [
18]. Additionally, the phenylethylamine pathway runs parallel to the Ehrlich pathway, which used phenylethylamine rather than phenylpyruvate, and cannot benefit from the shikimate pathway [
19]. Of the direct pathways, phenylethylamine is more prominent in plants, while the Ehrlich pathway is more prominent in microorganisms and as such, is more applicable to microbial-based technologies [
19].
It has been reported that the Ehrlich pathway is only dominant when L-phe is the most preferred source of nitrogen available [
20]. Yeasts, and specifically
Saccharomyces cerevisiae, display a preference in nitrogen metabolism. Nitrogen-containing compounds such as ammonium, asparagine, glutamine, serine, aspartic acid, alanine, arginine, and glutamic acid are all preferred over L-phe [
21]. When preferred sources of nitrogen are present L-phe will be assimilated via the cinnamate pathway, which does not yield 2-PE [
12]. Indicating that to achieve the most efficient production of 2-PE multiple conditions must be met. Firstly, there must be an excess of L-phe, for activation of the Ehrlich pathway without the need for substitution from the shikimate pathway. Secondly, there must be an absence or restriction of all preferred nitrogen sources to reduce cinnamate pathway activation and enhance the Ehrlich pathway.
The interest in exploring these microbes and pathways, coupled with developing more efficient processes, builds the foundation of the current research trends in biotechnologically derived natural scent and flavour compounds.
Figure 1.
Diagram of the Ehrlich pathway depicting the series of bioconversions in which 2-phenylethanol is produced from L-phenylalanine. Note the structural similarity between L-phenylalanine and 2-phenylethanol. Furthermore, note the various cofactors and byproducts, carbon dioxide (CO
2), nicotinamide adenine dinucleotide (NAD
+), reduced nicotinamide adenine dinucleotide (NADH), hydrogen ion (H
+). 2-D structural images from PubChem generated images under allowed usage guidelines [
22,
23,
24,
25,
26].
In a study by Villière et al. (2015) [
27], biomass reduction was used to remove up to 90% of the nitrogen-containing compounds from a must, creating a sluggish fermentation. In line with commercial practices, assimilable nitrogen (asparagine and thiamine) was added to speed up the fermentation to avoid a stuck fermentation—A fermentation that has ceased before the desired concentration of residual sugar has been reached [
28]. The subsequent 2-PE levels were statistically lower than the biomass reduction control [
27]. While the causation of such low 2-PE levels was not the study’s focus, a transition from the Ehrlich to the cinnamate pathway was likely due to the reduction of L-phe, and the introduction of excess asparagine Another study found that 2-PE was positively correlated with the quantity of 18-proteic amino acids (including L-phe) added to a nitrogen deficient must [
29]. This indicates that biomass reduction combined with the addition of L-phe may increase the production of 2-PE during cider fermentation.
Another important consideration is the effect of yeast strain on the production of 2-PE. In work conducted by Lorenzini et al. (2019) [
7], it was found that
Saccharomyces uvarum SU3 was the highest producer of 2-PE when used to ferment pasteurised golden delicious apple juice, which had not undergone biomass reduction [
7]. However, it is essential to note that of the 29 VOCs investigated by these authors, only seven of the compounds shared a statistically similar concentration between
S. uvarum SU3 and
S. cerevisiae EC1118, the yeast of choice among many cider producers [
7]. This highlights the importance of considering the overall VOC composition profile when using novel yeast strains specifically for increasing the production of 2-PE. Another factor that must be considered is fermentation temperature, as cider is typically fermented at temperatures between 12–20 °C [
30]. The fermentation temperature and yeast strain must be considered collectively when assessing the effectiveness of 2-PE production methods, as it has been observed that
S. cerevisiae tends to produce more 2-PE at temperatures as high as 28 °C [
31,
32], whereas
S. uvarum tends to produce more 2-PE at 12 °C [
31].
The increased production efficiency of 2-PE through biotechnological methods is of current research interest. Investigations are generally aimed at developing systems where a high yield of 2-PE can be maintained, and the product can be efficiently extracted from the system. While some of the more successful methods may not be readily implemented in the brewing industry, L-phe saturation and assimilate nitrogen restriction can be incorporated as part of conventional biomass reduction practices. Therefore, using L-phe saturation and assimilating nitrogen restriction may increase the production of 2-PE. This could potentially improve the organoleptic properties of the cider and change the frame in which we see biotechnological modification within the fermented beverage industry. However, there is little or no published information on the effects of L-phe supplementation on the cider fermentation process and the eventual VOC profiles of the product. Additionally, it is unknown how L-phe supplementation may interact with different levels of biomass reduction to influence the VOC profile. This study aimed to fill these knowledge gaps and provide direction for the future production of high-value ciders.
2. Materials and Methods
2.1. Reagents
All reagents used were of analytical grade. Dichloromethane (DCM) was purchased from Merck Australia (Sydney, Australia). Anhydrous sodium sulphate, 2-phenylethanol, L-phenylalanine, phosphoric acid, and 2-propanol were purchased from Sigma Aldrich Australia (Sydney, Australia). Methanol was purchased from Honeywell Burdick & Jackson (Muskegon, MI, USA). Ethanol, acetonitrile, and anhydrous sodium hydroxide were purchased from ChemSupply Australia (Gillman, Australia). EC1118 yeast was purchased from Lallemand brewing (Montreal, Canada), and apple juice (Woolworths Apple Juice 2L) was purchased from Woolworths (Rockhampton, Australia).
2.2. Brix
Brix measurements were made using a digital refractometer (Eclipse Digital Refractometer model DR103) with a reported accuracy of ±0.2 in the range of 0–35 Brix (% w/w sucrose). The digital refractometer was zeroed using Milli-Q water, and Brix measurements of the required treatments were conducted in triplicate.
2.3. Rehydration and Fermentation
Before inoculating the apple juice, the EC1118 yeast sachet was rehydrated as per the manufacturers’ instructions. Firstly, 2.5 g of dry yeast was added to 50 mL of Milli-Q water warmed to 35 °C. The yeast mixture was then kept at 35 °C for 20 min with light agitation every five minutes. Next, the yeast mixture was allowed to return to room temperature for another 20 min to avoid temperature shock and damage to the yeast.
After a total period of 40 min, which was within the manufacturer’s guideline of <45 min for rehydration, the yeast mixture was added to 14 L of room temperature apple juice and stored in a 30 L Pail Fermenter from Keg King-Beer Equipment Specialists (Victoria, Australia). The fermenter was then sealed using a one-way valve (to allow gas to escape from the vessel) and lightly mixed. Fermentation of all stages of the project occurred at room temperature (24.8 ± 0.8 °C).
Stage one of the fermentation continued for 43 h, at which point biomass reduction was conducted, and the fermentation was separated into its necessary treatment groups, where stage two of the fermentation commenced.
2.4. Biomass Reduction and L-Phenylalanine Spike
Biomass reduction was conducted 43 h into the first fermentation stage. Approximately 2400 mL of the must was transferred to 48 separate 50 mL centrifuge tubes and centrifuged (4969 G for 25 min). The supernatant was collected and pooled, with extra care not to disturb the yeast “pellet” formed on the bottom of the tube. This pooled biomass reduced (BMR) must was mixed to ensure homogeneity.
Fermentation was conducted in 50 mL centrifuge tubes, each of which had the appropriate volumes of L-phenylalanine stock solution, Milli-Q water, and BMR must be added. In total, 21 different treatment combinations were prepared in triplicate, biomass reductions consisted of an 80%, 90% and a 0% BMR treatment. As 90% BMR has been used in most previous literature [
27], 80% BMR was chosen as an intermediate BMR treatment, while 0% BMR was used as a baseline comparison group (no reduction of biomass).
Each biomass treatment consisted of six L-phe spike treatments (0.0, 0.5, 1.0, 1.5, 2.0, 2.5 g L−1 L-phe) and one control. To achieve the desired degree of biomass reduction, the 80% and 90% BMR treatments contained 20% and 10% non-BMR must, respectively, while the 0% BMR treatment contain 100% non-BMR must.
Subsequently, the centrifuge tubes were sealed with a rubber stopper and one-way value, allowing gasses to exit the vessel. Additionally, all vessels and instruments that encountered any component of the fermentations were sterilised with 0.1 M sodium hydroxide and then rinsed with Milli-Q water prior to use.
2.5. Fermentation Monitoring
During the secondary fermentation period, mass loss was determined using an analytical balance (Mettler Toledo AB204-S) with a reported accuracy of ±0.0001 g. The analytical balance was used to measure the mass loss of the fermentation over 11 days. Evaporation was measured using a control which contained 100% BMR and was inoculated with 0.1 M sodium hydroxide. Starting on day five, six days of evaporation data were collected, and the average daily mass loss was calculated and used to correct for evaporation when analysing the mass loss of the fermentations.
Due to the size of the fermentation vessel, the upper window of the analytical balance had to be left open. To account for this error, a series of repeat measurements were made on a representative weight to quantify the error associated with the open upper window during operation. As a result, it was determined that under the required conditions, the accuracy of the analytical balance was ±0.0002 g, which was determined sufficient for this work.
The fermentation was considered complete once the daily mass loss of the L-phenylalanine treatments was no longer statistically higher than that of the controls within each biomass condition.
2.6. 2-Phenylethanol Determination
Determination of 2-phenylethanol was done using an Agilent 1100 high-performance liquid chromatography (HPLC) system, comprising a G1313A autosampler, G1322A vacuum degasser, G1311A quaternary pump, and G1315B diode array detector. A C
18 column (Agilent Eclipse XDB-C
18; 150 × 4.6 mm; 5 µm pore size) fitted with a guard cartridge (Gemini C
18 4 × 2 mm) was used. Method development was achieved by the repeated analysis of a 4.000 g L
−1 solution of 2-phenylethanol in Milli-Q water and an apple cider sample spiked with 4.0 g L
−1 2-phenylethanol. The method was modified from a method previously used on the same device for phenolic profiling of mungbeans [
33]. The optimization procedure involved altering the mobile phase gradient, injection volume, flow rate and run time.
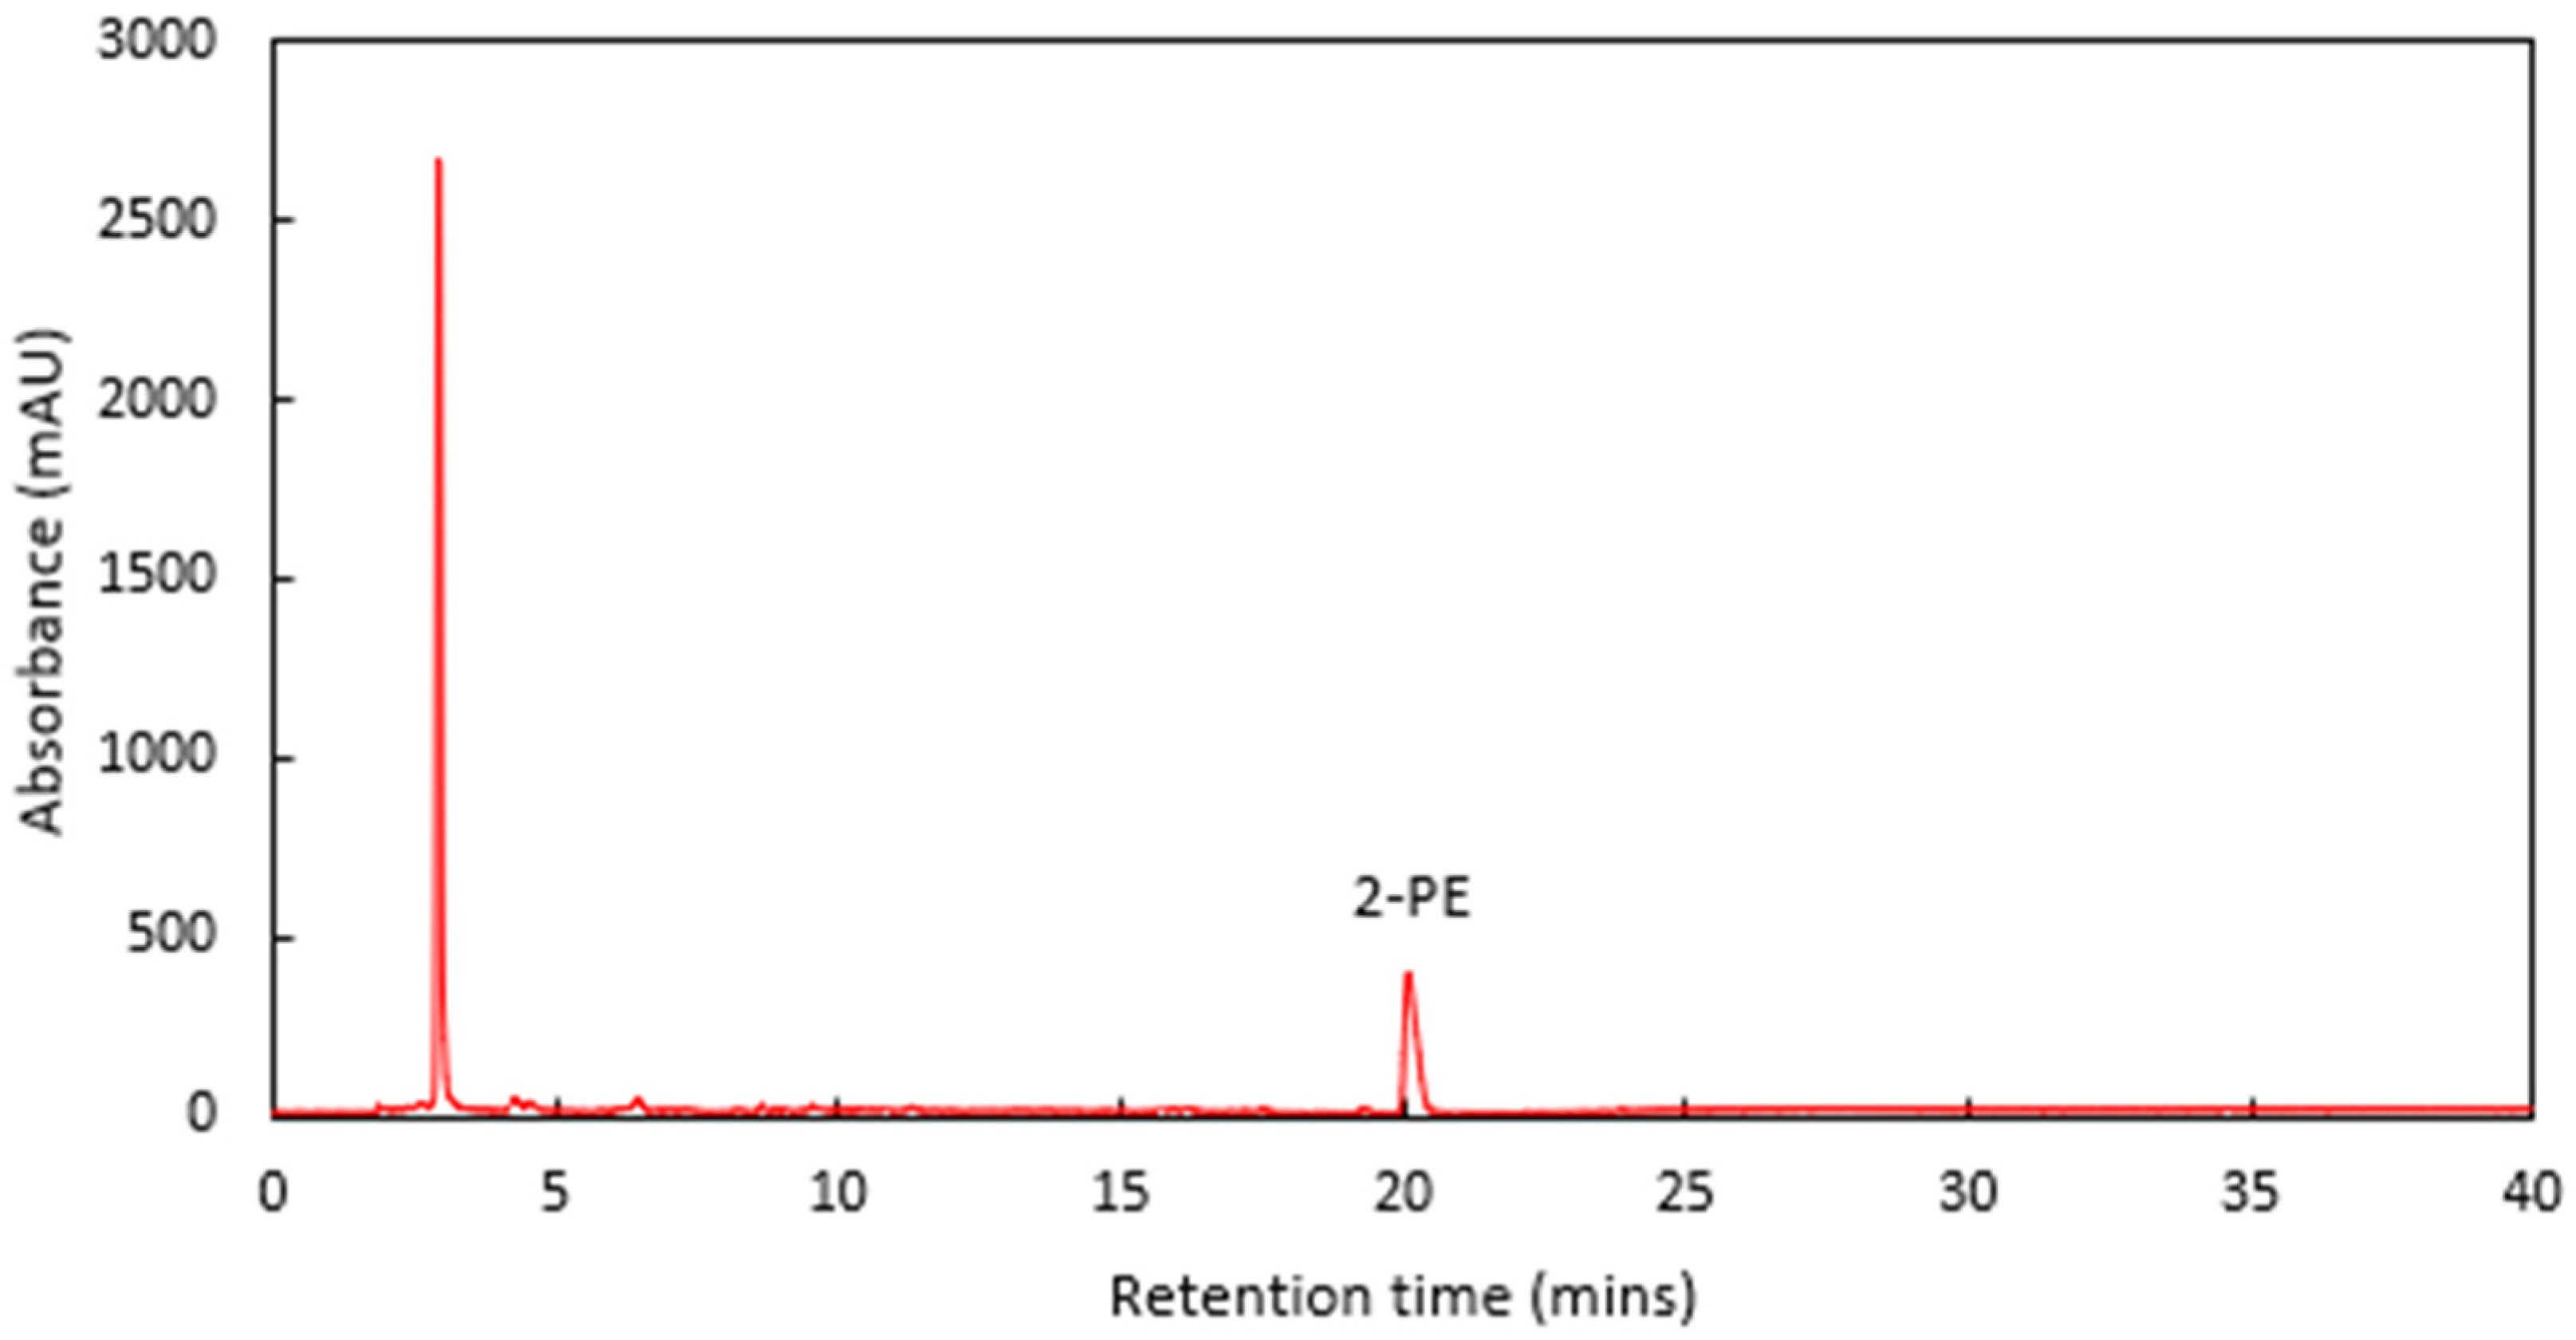
In the finalized method, the mobile phase of the analysis comprised 0.01 M phosphoric acid (H3PO4; phase A) and HPLC grade methanol (MeOH; phase B), with an injection volume of 25 µL and detection wavelength of 250 nm. The mobile phase gradient began at 0% B and a flow rate of 0.7 mL min−1, which increased to reach 1 mL min−1 by 5 min. The percentage of phase B was then ramped linearly to reach 10% at 7 min, 35% at 15 min, and 45% at 20 min. It then increased to 100% by 25 min, alongside an increase in flow rate to 1.3 mL min−1. The mobile phase was held at this composition for a further 5 min to flush out the column.
The 2-PE eluted at 20.1 min, with no nearby interfering compounds observed in a spiked cider sample (
Figure 2). Standards and calibrations were produced from an analytical grade 99% stock solution of 2-PE, using an intermediate working stock comprising of 10.10 g L
−1 2-PE. These comprised a total of nine standards, (0.00, 0.51, 1.01, 1.51, 2.02, 2.52, 3.03, 3.52, and 4.04 g L
−1 2-PE). The Pearson’s correlation coefficient of the calibration standards was R = 0.9999, with a root-mean-square deviation (RMSD) of 0.41% (calculated using Equation (1) provided below). Additionally, the theoretical limit of detection (LOD) and limit of quantification (LOQ) was determined using the standard error of the estimate (SEE) in place of the traditional standard deviation of a blank response [
34], as for this method of analysis there is often a zero-blank response. These formulae are provided in Equations (2)–(4). The LOD was calculated to be 2.79 mg L
−1 2-PE, and the LOQ was calculated to be 8.45 mg L
−1 2-PE. Standards were analysed in the same batch as the experimental samples.
The cider samples were analysed directly (no dilution) after filtration with 0.45 µm polytetrafluoroethylene (PTFE) syringe filters (Livingstone brand; Sydney, Australia).
2.7. L-Phenylalanine Determination
L-phenylalanine was determined using the previously described Agilent 1100 HPLC system, but with a reversed-phase o-phthalaldehyde (OPA) column (Alltech Adsorbosphere OPA-HR; 150 × 4.6 mm; 5 µm pore size) and Gemini C
18 guard cartridge (4 × 2 mm). The mobile phase of the analysis comprised deionised (Milli-Q) water (phase A), acetonitrile (MeCN; phase B) and MeOH (phase C). Method development was achieved by the repeated analysis of a 4.000 g L
−1 solution of L-phenylalanine in Milli-Q water and an apple cider sample spiked with 4.000 g L
−1 L-phenylalanine. The method was based on a protocol previously used on the same device for the separation and quantification of the amino acids arginine and citrulline [
35]. Again, the optimization procedure involved changing the mobile phase composition, gradient, flow rate and injection volume.
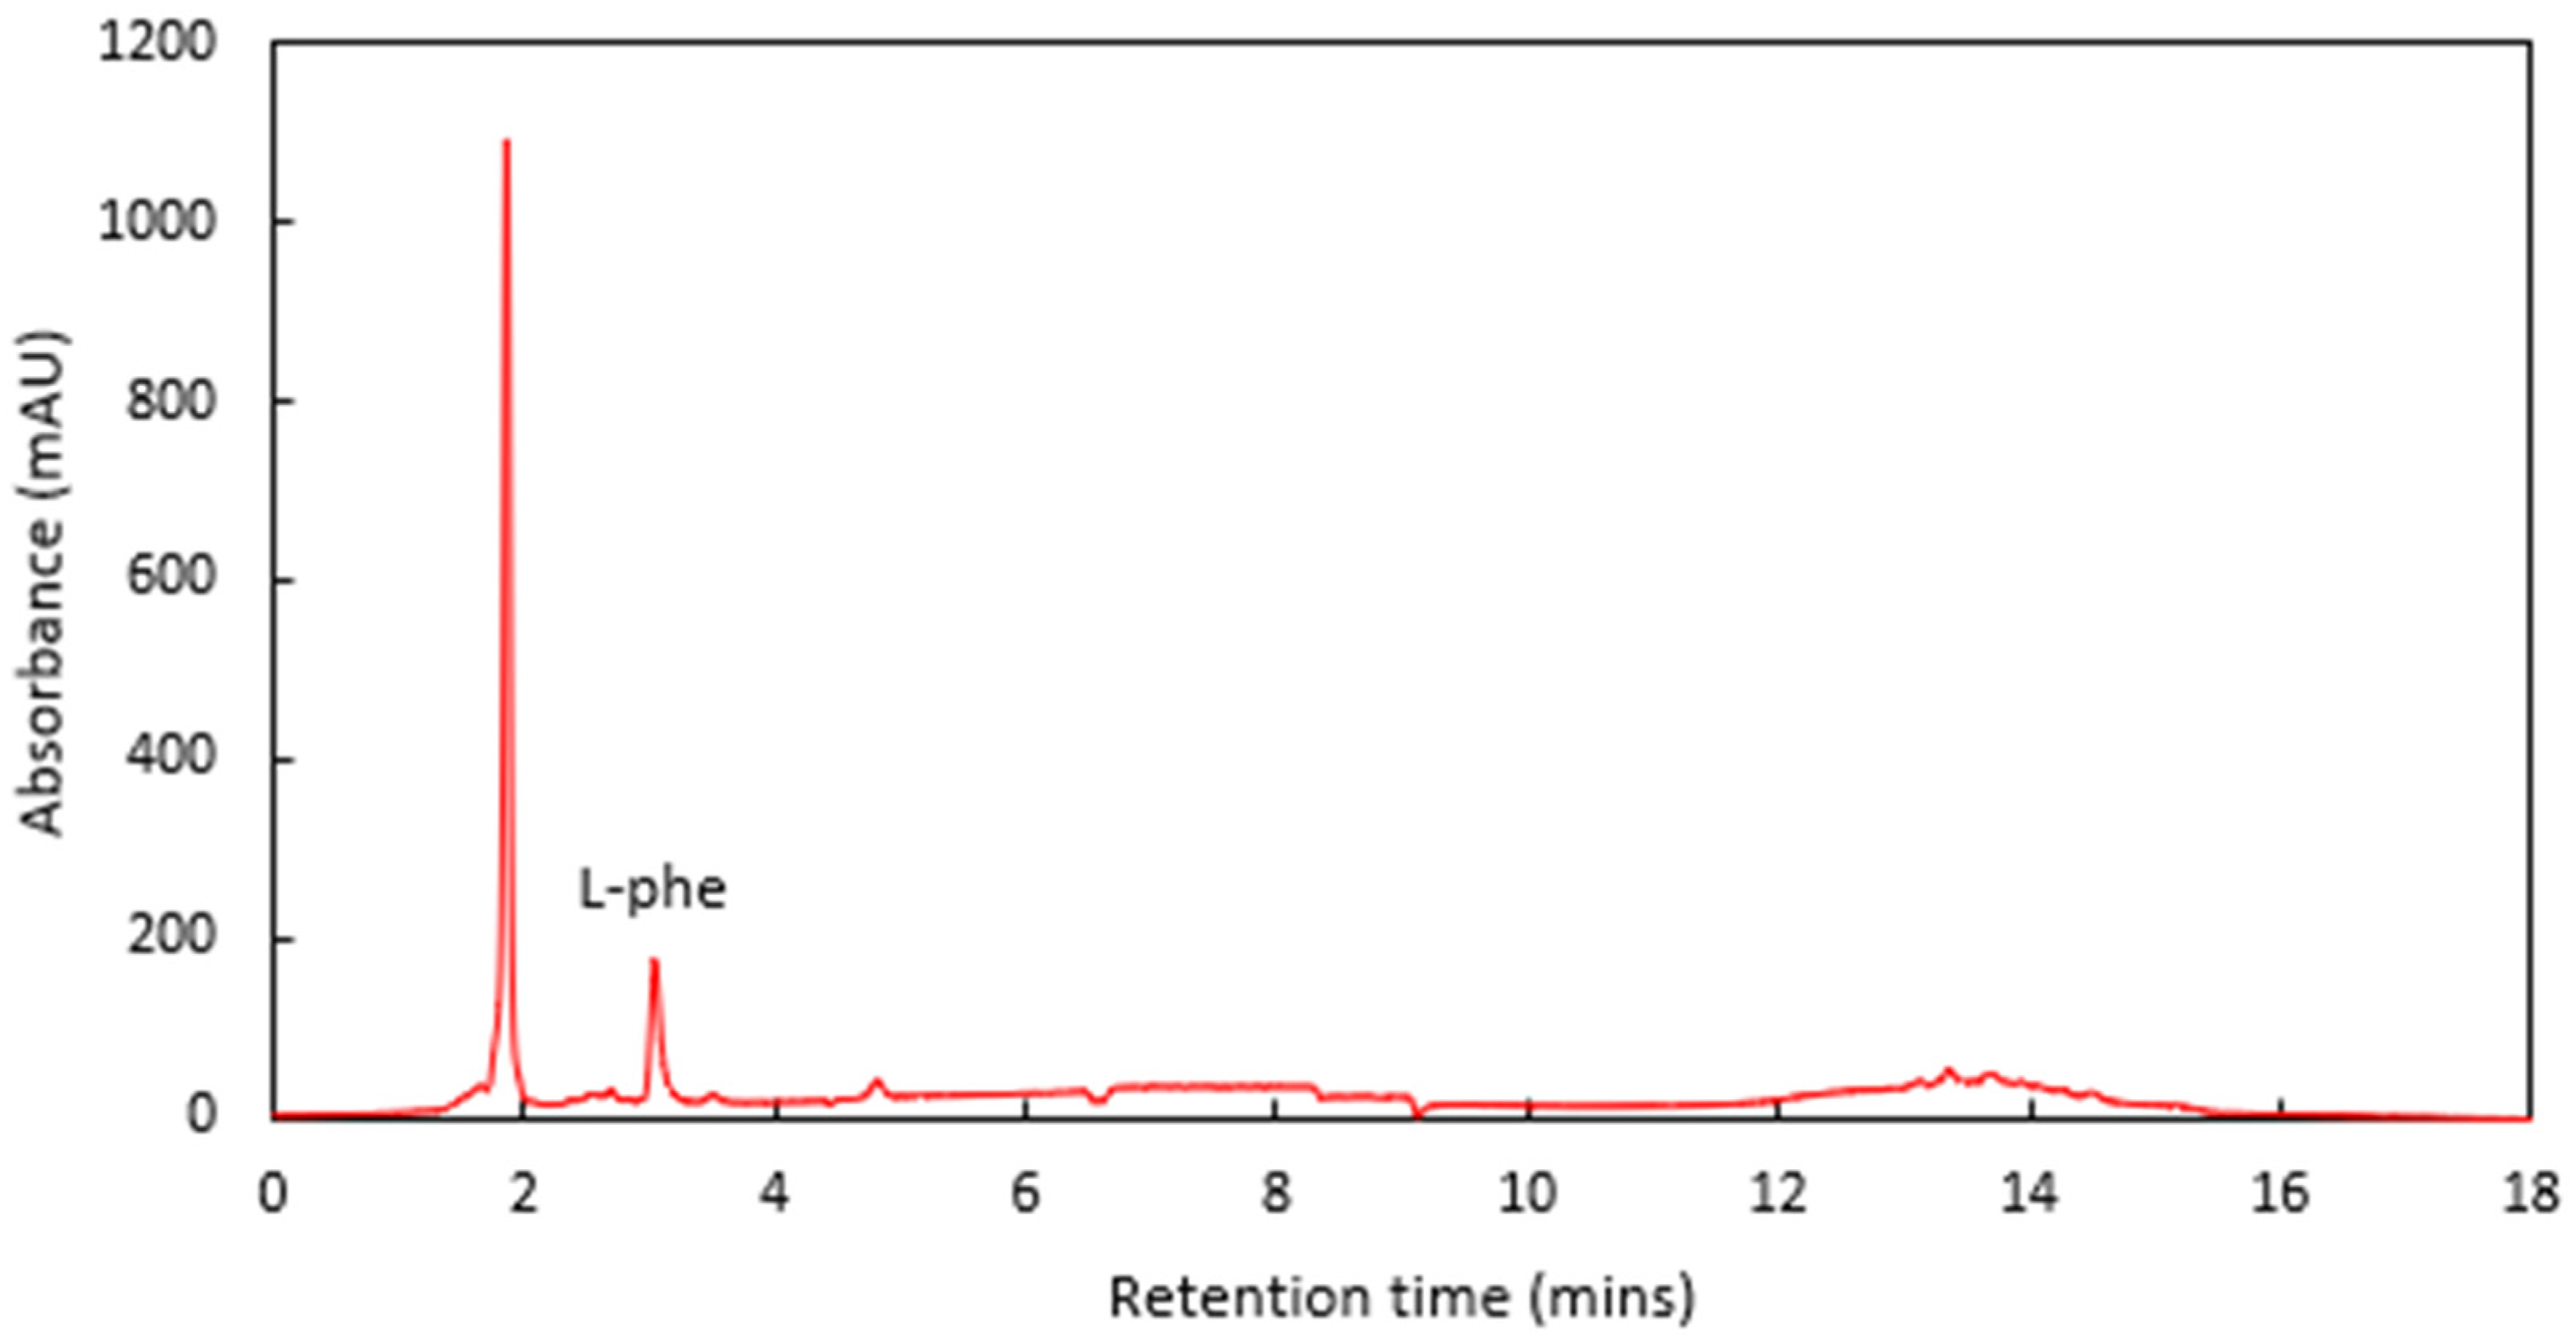
The final method used an injection volume of 5 µL and a detection wavelength of 260 nm. The gradient began at 80/10/10% phase A/B/C and a flow rate of 0.7 mL min
−1, ramping to reach 60/20/20% at 3 min, where it was held for a further 3 min. The gradient then ramped to reach 50/0/50% and a flow rate of 1 mL min
−1 at 10 min, then 0/0/100% and 1.3 mL min
−1 by 12 min, where it was held for a further 6 min to flush out the column. The L-phe was eluted at 3.05 min, with minimal interferants observed in a spiked cider sample (
Figure 3).
For quantitative work, L-phe standards were prepared by weighing out the appropriate mass of L-phe powder, dissolving it in Milli-Q water and making up to an exact volume in a volumetric flask. Six standard concentrations were used to create the L-phe calibration (0.00, 0.54, 1.08, 1.62, 2.16, and 2.71 g L−1 L-phe). The Pearson’s linear correlation coefficient was R = 0.9999, with an RMSD of 1.60%. Furthermore, the LOD was calculated to be 8.59 mg L−1 L-phe, and the LOQ was calculated to be 26.02 mg L−1 L-phe.
The cider samples were syringe filtered (0.45 µm PTFE) and injected directly into the HPLC with no prior dilution.
2.8. Ethanol Determination
An Agilent 6890N GC-FID system (Santa Clara, CA, USA) with manual injection was used for the analysis of ethanol content. Separation was achieved using an Agilent 19091s-510e column (8 m, 0.32 mm, 20 µm) with a fused silica stationary phase and helium gas (57.3 mL min
−1) as the mobile phase. The inlet temperature was 250 °C, and the detector temperature was 300 °C. A split ratio of 40:1 with a 10 µL injection volume was used. The oven temperature was held at 120 °C for one minute, followed by a linear ramp to 165 °C over three minutes, with a one-minute post-run. Calibration was conducted using a set of four ethanol standards: 0.0%, 4.0%, 8.0%, and 12.0% (
v/
v) ethanol. Additionally, each calibration and cider sample were spiked with equal volumes of 4% (
v/
v) propanol, which was used as an internal standard. A highly accurate calibration was produced, demonstrating a strong linear correlation (Pearson’s correlation coefficient) of R = 0.9995. Additionally, the standard error of the estimate was determined to be 0.18%
v/
v ethanol, lower than the minimum standard (0.2%
v/
v) for determining alcohol content by analytical methods in Australia [
36].
2.9. Volatile Extraction Procedure
Extraction of the volatile compounds in the cider was achieved using a simple dichloromethane (DCM) extraction previously used to extract volatile compounds in a range of Queensland ciders [
2]. In short, 1.0 mL of DCM was added to 5 mL of each cider sample, and one method was blank (
n = 12). The extractions were then homogenised for 15 min using a Ratek RM4 end-over-end shaker (Melbourne, Australia) operating at 50 rpm. A further 1.0 mL DCM was added, and the mixture was homogenised, resulting in final volumes of 2.0 mL DCM and 5 mL cider sample. Next, the DCM layer containing the volatile compounds was carefully extracted from the mixture and set aside in another vial, where approximately 2.0 g of sodium sulphate was added to remove water from the DCM extract.
After centrifugation at 2000× g for 10 min, the anhydrous DCM soluble supernatant was carefully extracted and filtered (0.45 µm PTFE; Livingstone brand) into 1.5 mL vials and stored at 4.0 °C until analysis by gas chromatography mass spectrometry (GC-MS).
2.10. VOC Analysis by GC-MS
CG-MS analysis was conducted on the DCM extracts of the experimental triplicates of selected treatments (
n = 12). The GC-MS procedure and volatile analysis were conducted as previously described in Wilson et al. [
2]. Peak integration was primarily done manually, in which peaks were integrated based on the peak shape, peak area, and similarity search result (>85% similarity). Linear retention indices (LRI) were also calculated using the method of van Den Dool and Kratz [
37]. Compound identification was done using the similarity search function of the NIST14s GC-MS library and comparing the experimental LRI values of published articles with similar chromatographic conditions. Compounds listed as identified had a similarity search result of greater than 95%, and compounds with a similarity between 85–95% were listed as tentative.
2.11. Statistical and Chemometric Analysis
All fundamental statistical analysis was done using IBM SPSS statistics (version 28) (International Business Machines Corporation; Armonk, New York, NY, USA). Data sets, including daily mass loss, cumulative mass loss, 2-PE levels, and L-phe consumption, were analysed using a factorial multivariate analysis of variance (MANOVA) and analysis of variance (ANOVA) to determine statistical significance. Additional testing was done using Scheffe’s and least significant difference (LSD) post hoc tests to make pairwise comparisons of the treatment means, allowing a more thorough exploration of significant results in the MANOVA/ANOVA tests. All analysis was done with an alpha value of α = 0.05 unless otherwise stated.
Chemometric analysis was performed in the Unscrambler X (version 10) (Camo Analytics; Oslo, Norway). The principal component analysis (PCA) exploratory data reduction technique was utilised to investigate the relationships between treatments and VOC profile. PCA is a commonly used data analysis method that reduces large datasets with many variables into smaller manageable principal components (PCs) [
38]. Due to the massive disparity in instrument response across the different variables, data normalisation was used to reduce the impact of single VOCs on calculating PCs. Normalisation was achieved by dividing each value by the standard deviation of that compound across all treatments. Additionally, hierarchical cluster analysis (HCA) was conducted on the normalised data set using the single-linkage cluster method and the Euclidean distance method. This analysis method helps identify “clusters” comprising treatments with similar VOC profiles.
3. Results and Discussion
Throughout this study, 2-PE and L-phe levels were determined quantitively for all samples. Ethanol levels were also determined quantitively, but only for three representative samples from each biomass condition. Brix measurements of the representative samples were also collected. Lastly, semi-quantitative data was collected on the VOC composition of triplicate samples of twelve treatments. The volatile data underwent chemometric analysis to better understand any relationships between treatments and particular compounds. The purpose of this data collection method was to focus on the primary goals of this study; namely, to determine the effect that L-phe saturation and biomass reduction have on the production of 2-PE in a simple cider fermentation and to begin to explore the effect these treatments have on the VOC profile. Ethanol concentration and Brix were used to demonstrate the success of the biomass reduction technique. Additionally, the experimental ciders presented the essential characteristics of a simple cider.
3.1. Quantification of 2-Phenylethanol and L-Phenylalanine
The results of 2-PE and L-phe quantification in the cider samples are shown in
Table 1. The absolute uncertainty for each treatment combination was calculated using the combined error from the RMSD of the calibration with the standard deviation (STDEV) of the replicate measurements (Equation (5)).
In addition to calculating the final concentration of L-phe, the consumption of L-phe was also established. Consumption was calculated by combining the L-phe concentration measured in the initial juice substrate (0.1146 g L
−1) with the spike concentration minus the final L-phe concentration. L-phe consumption was used in further statistical analysis to better understand the relationship between L-phe spike, biomass reduction, and 2-PE concentration. The statistical exploration of this data is presented in the following section (
Section 3.2).
3.2. Statistical Analysis of 2-Phenylethanol Concentration and L-Phenylalanine Consumption
A layered statistical approach was adopted to determine any significance of the dependent variables (L-phe consumption and 2-PE concentration). Initially, a multivariate analysis of variance (MANVOA) was conducted to protect against type 1 statistical error [
39] so that subsequent analysis of variance (ANOVAs) and post hoc tests can be conducted confidently. However, as the independent variables consist of two categorical variables (biomass treatment, L-phe spike), a factorial MANOVA must be conducted. Prior to the conduct of the factorial MANOVA, several assumptions were addressed:
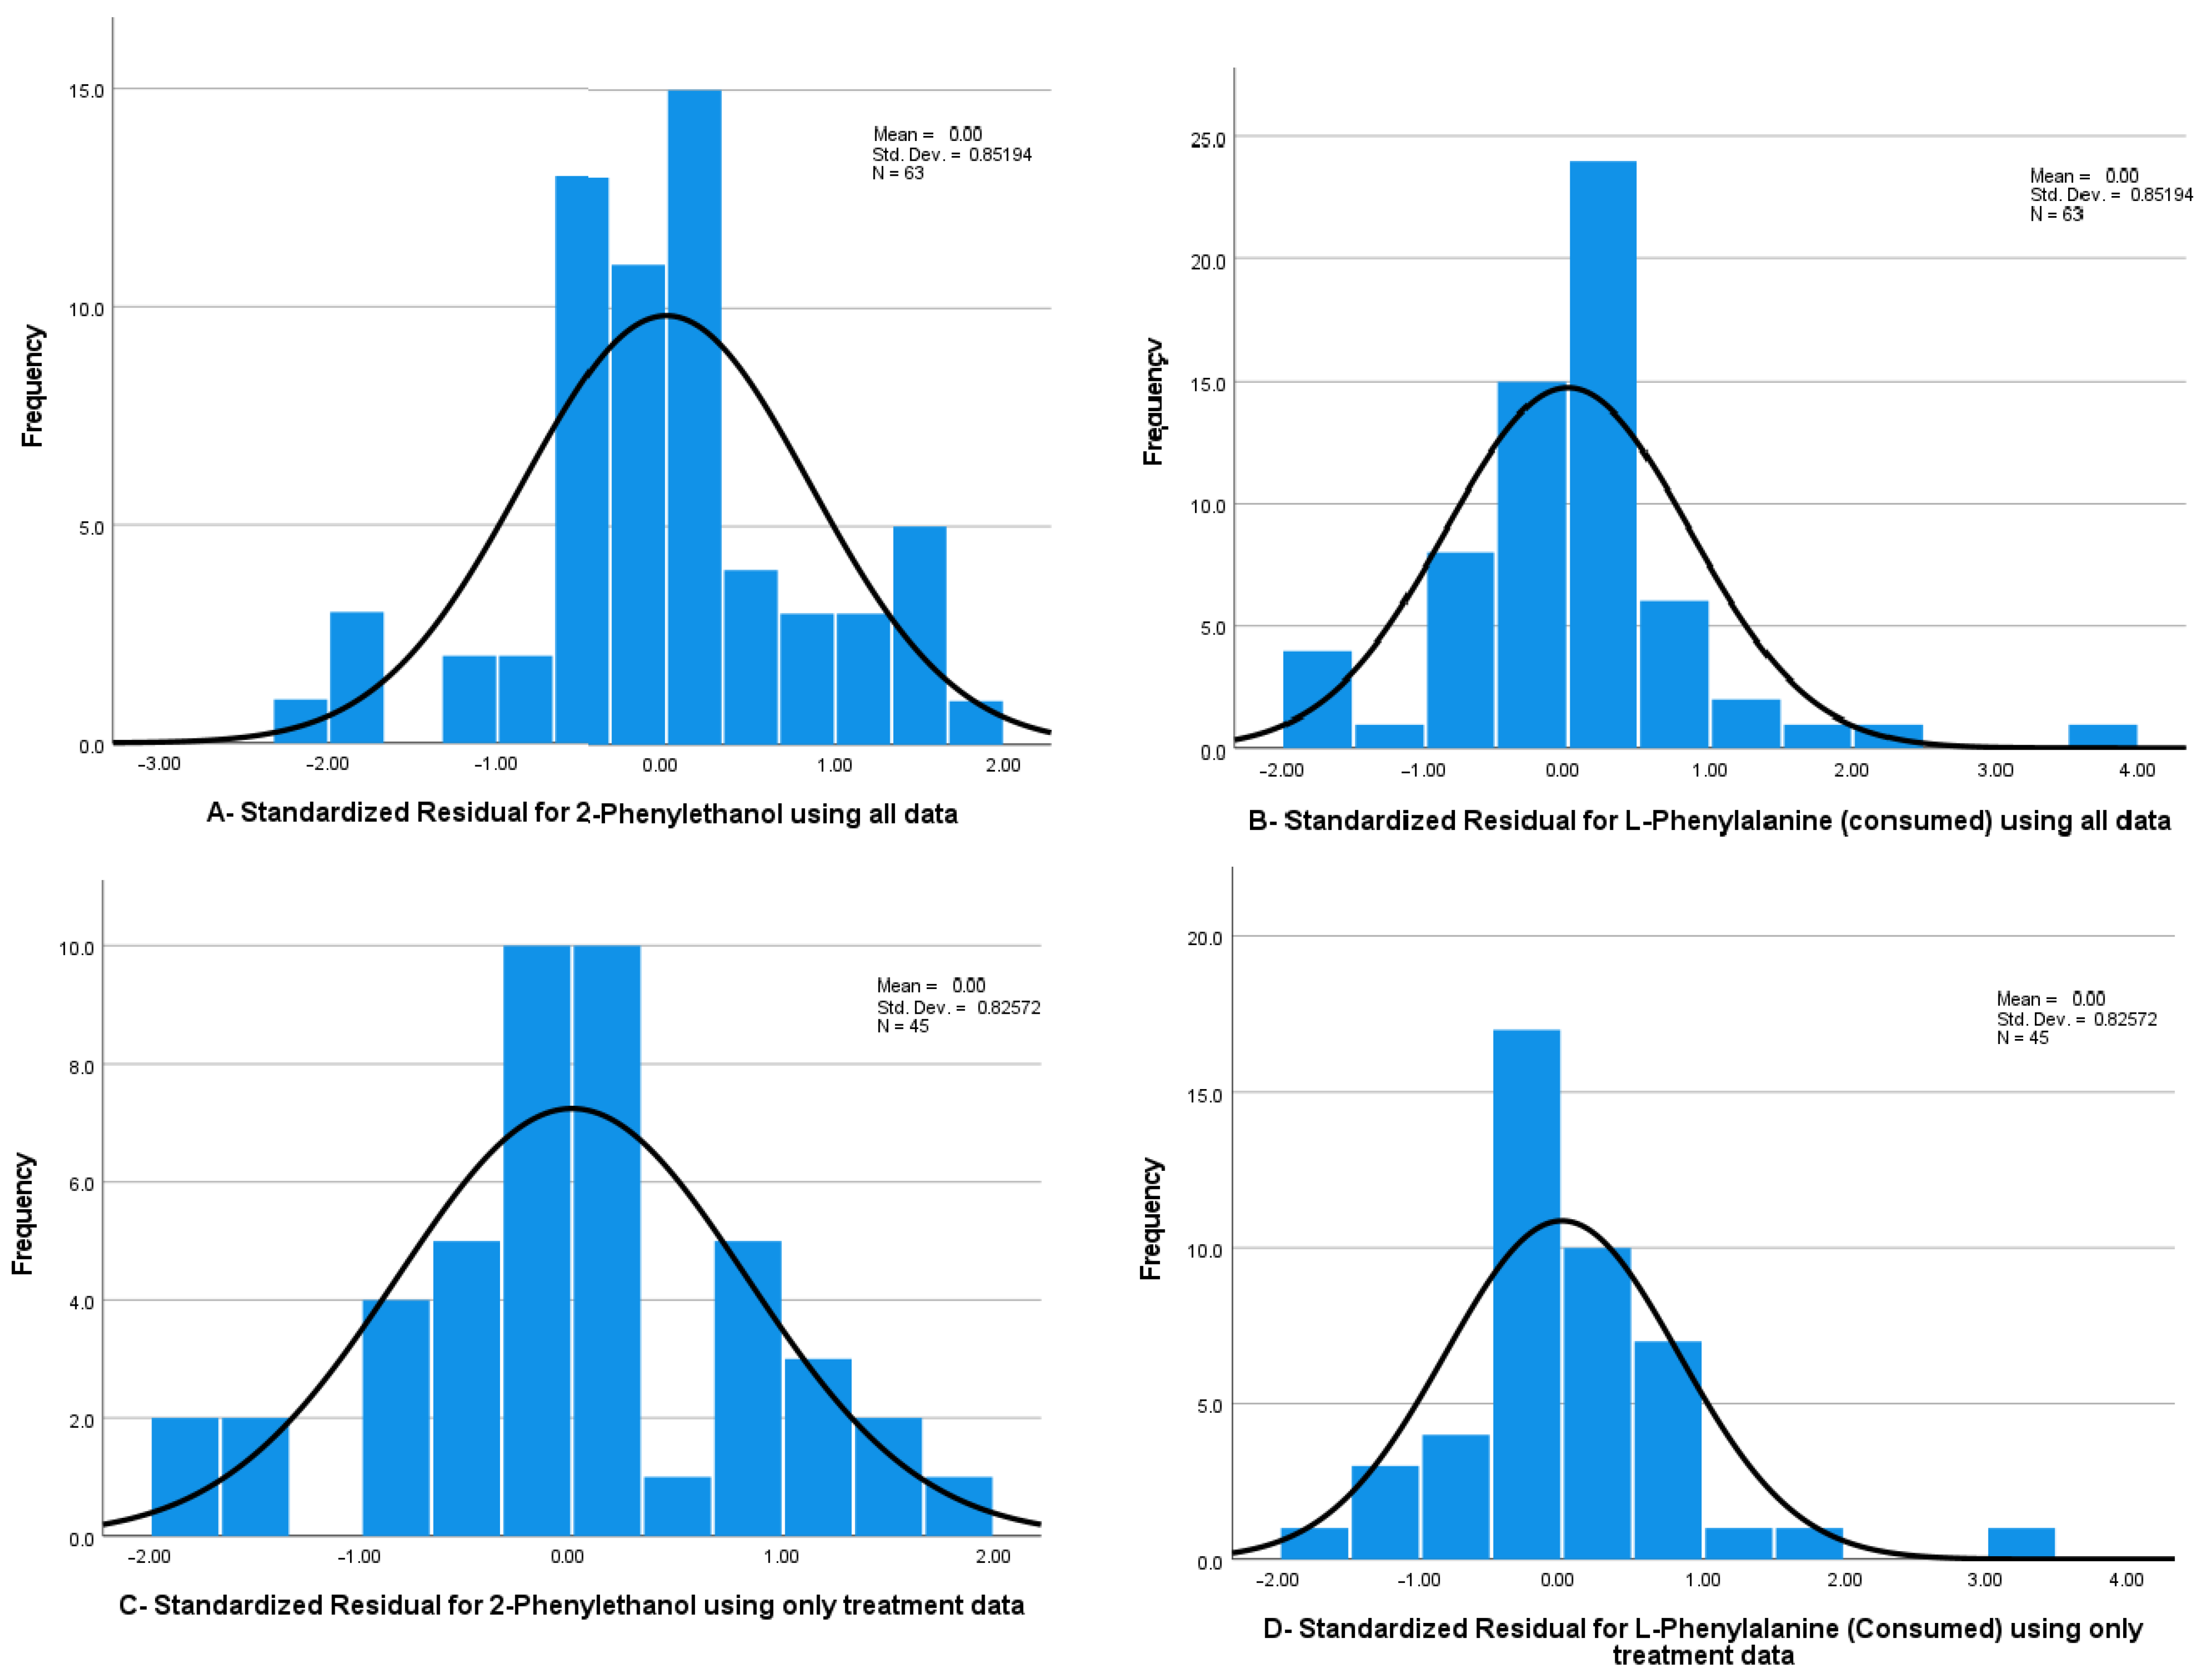
Multivariate normality–standardised residuals have a slight deviation from a normal distribution. However, frequency histograms indicate that the 2-PE data deviates from normality at the zero point and on the extremities of the histogram (see
Figure 4A). Likewise, it is indicated that the standardised residuals for L-phe consumed have a negative skewness, as observed in
Figure 4B.
Sample independence–Samples were fermented, collected, and analysed individually with sound laboratory practices, ensuring sample independence.
Equality of variance–Box’s M test of equality of covariance was used, reporting a Box’s M value of 153.348 and a significance of p = 0.001, indicating that the variances are not equal across groups.
Multivariate outliers-variables were assessed using the significance of the Mahalanobis distance versus that of the chi-square statistic with equal degrees of freedom [
40,
41]. All combinations of independent variables were assessed (spike, biomass, and spike*biomass), and no outliers in the data were detected.
While it is generally understood that a MANOVA is robust regarding deviations from multivariate normality and equality of variance [
42], it was observed that the normality could be improved by assessing the treatment data separately from the control data. Before separating the control and treatment data, nonparametric testing was done to indicate the statistical significance of the treatment compared to the control. Mann-Whitney tests were conducted on both the 2-PE concentration and the L-phe concentration. The absence or administration of an L-phe spike was used as the grouping variable. The results indicated a significance difference between the control and treatment groups in both 2-PE concentration (U = 0.00,
p < 0.001), and L-phe consumption (U = 11.50,
p < 0.001). This confirmed that the treatment effect was significant (see
Figure 5), justifying the separation of the treatment and control data for a more powerful statistical analysis.
Separating the control groups from the treatment groups improved the multivariate normality of the data (see
Figure 4C,D). Likewise, the equality of variances was also improved. Box’s M test indicated that the variances were now equal across groups, reporting a Box’s M value of 112.015 and a non-significant result of
p = 0.013, which is greater than the recommended alpha value of 0.005 [
43].
Once the data set was deemed suitable for analysis, a factorial MANOVA was conducted to test for significance in the differences between 2-PE concentration and L-phe consumption based on biomass treatment and L-phe spike. Significance testing was conducted using Pillai’s trace, as it is understood to be robust to any deviations from the required assumptions of multivariate analysis [
44,
45]. A statistically significant MANOVA effect was obtained for L-phe spike; Pillai’s Trace = 0.663, F(8, 60) = 3.722,
p < 0.001. A multivariate effect size of 0.332 indicates that the L-phe spike accounted for 33.2% of the variance in 2-PE concentration and L-phe consumption.
Likewise, the effect of biomass treatment was found to be statistically significant; Pillai’s Trace = 0.712, F(4, 60) = 8.272,
p < 0.001. A multivariate effect size of 0.356 indicates that 35.6% of the variance in 2-PE concentration and L-phe consumption was accounted for by biomass treatment. As a significant factorial, MANOVA offers protection against the inflation of type one statistical error when conducting repeated multiple and pairwise comparisons [
39,
46]; the data set was then subject to multiple ANOVAs. It was determined that 2-PE concentration was only significantly affected by the biomass treatment (F(2, 14) = [12.991],
p < 0.001). In contrast, L-phe consumption was significantly affected by both biomass treatment (F(2, 14) = [5.370],
p = 0.010), and L-phe spike treatment (F(4, 8) = [7.148],
p < 0.001). Additionally, two two-way ANOVAs demonstrated no significant interaction between biomass treatment and L-phe spike for either 2-PE production or L-phe consumption.
To further investigate the significance of the results, a series of post hoc analyses were conducted. Initially, the effect of BMR on 2-PE concentration was explored. For these initial unplanned comparisons, Scheffe’s procedure was the most appropriate as Scheffe’s procedure provides adequate protection against type I statistical error [
47].
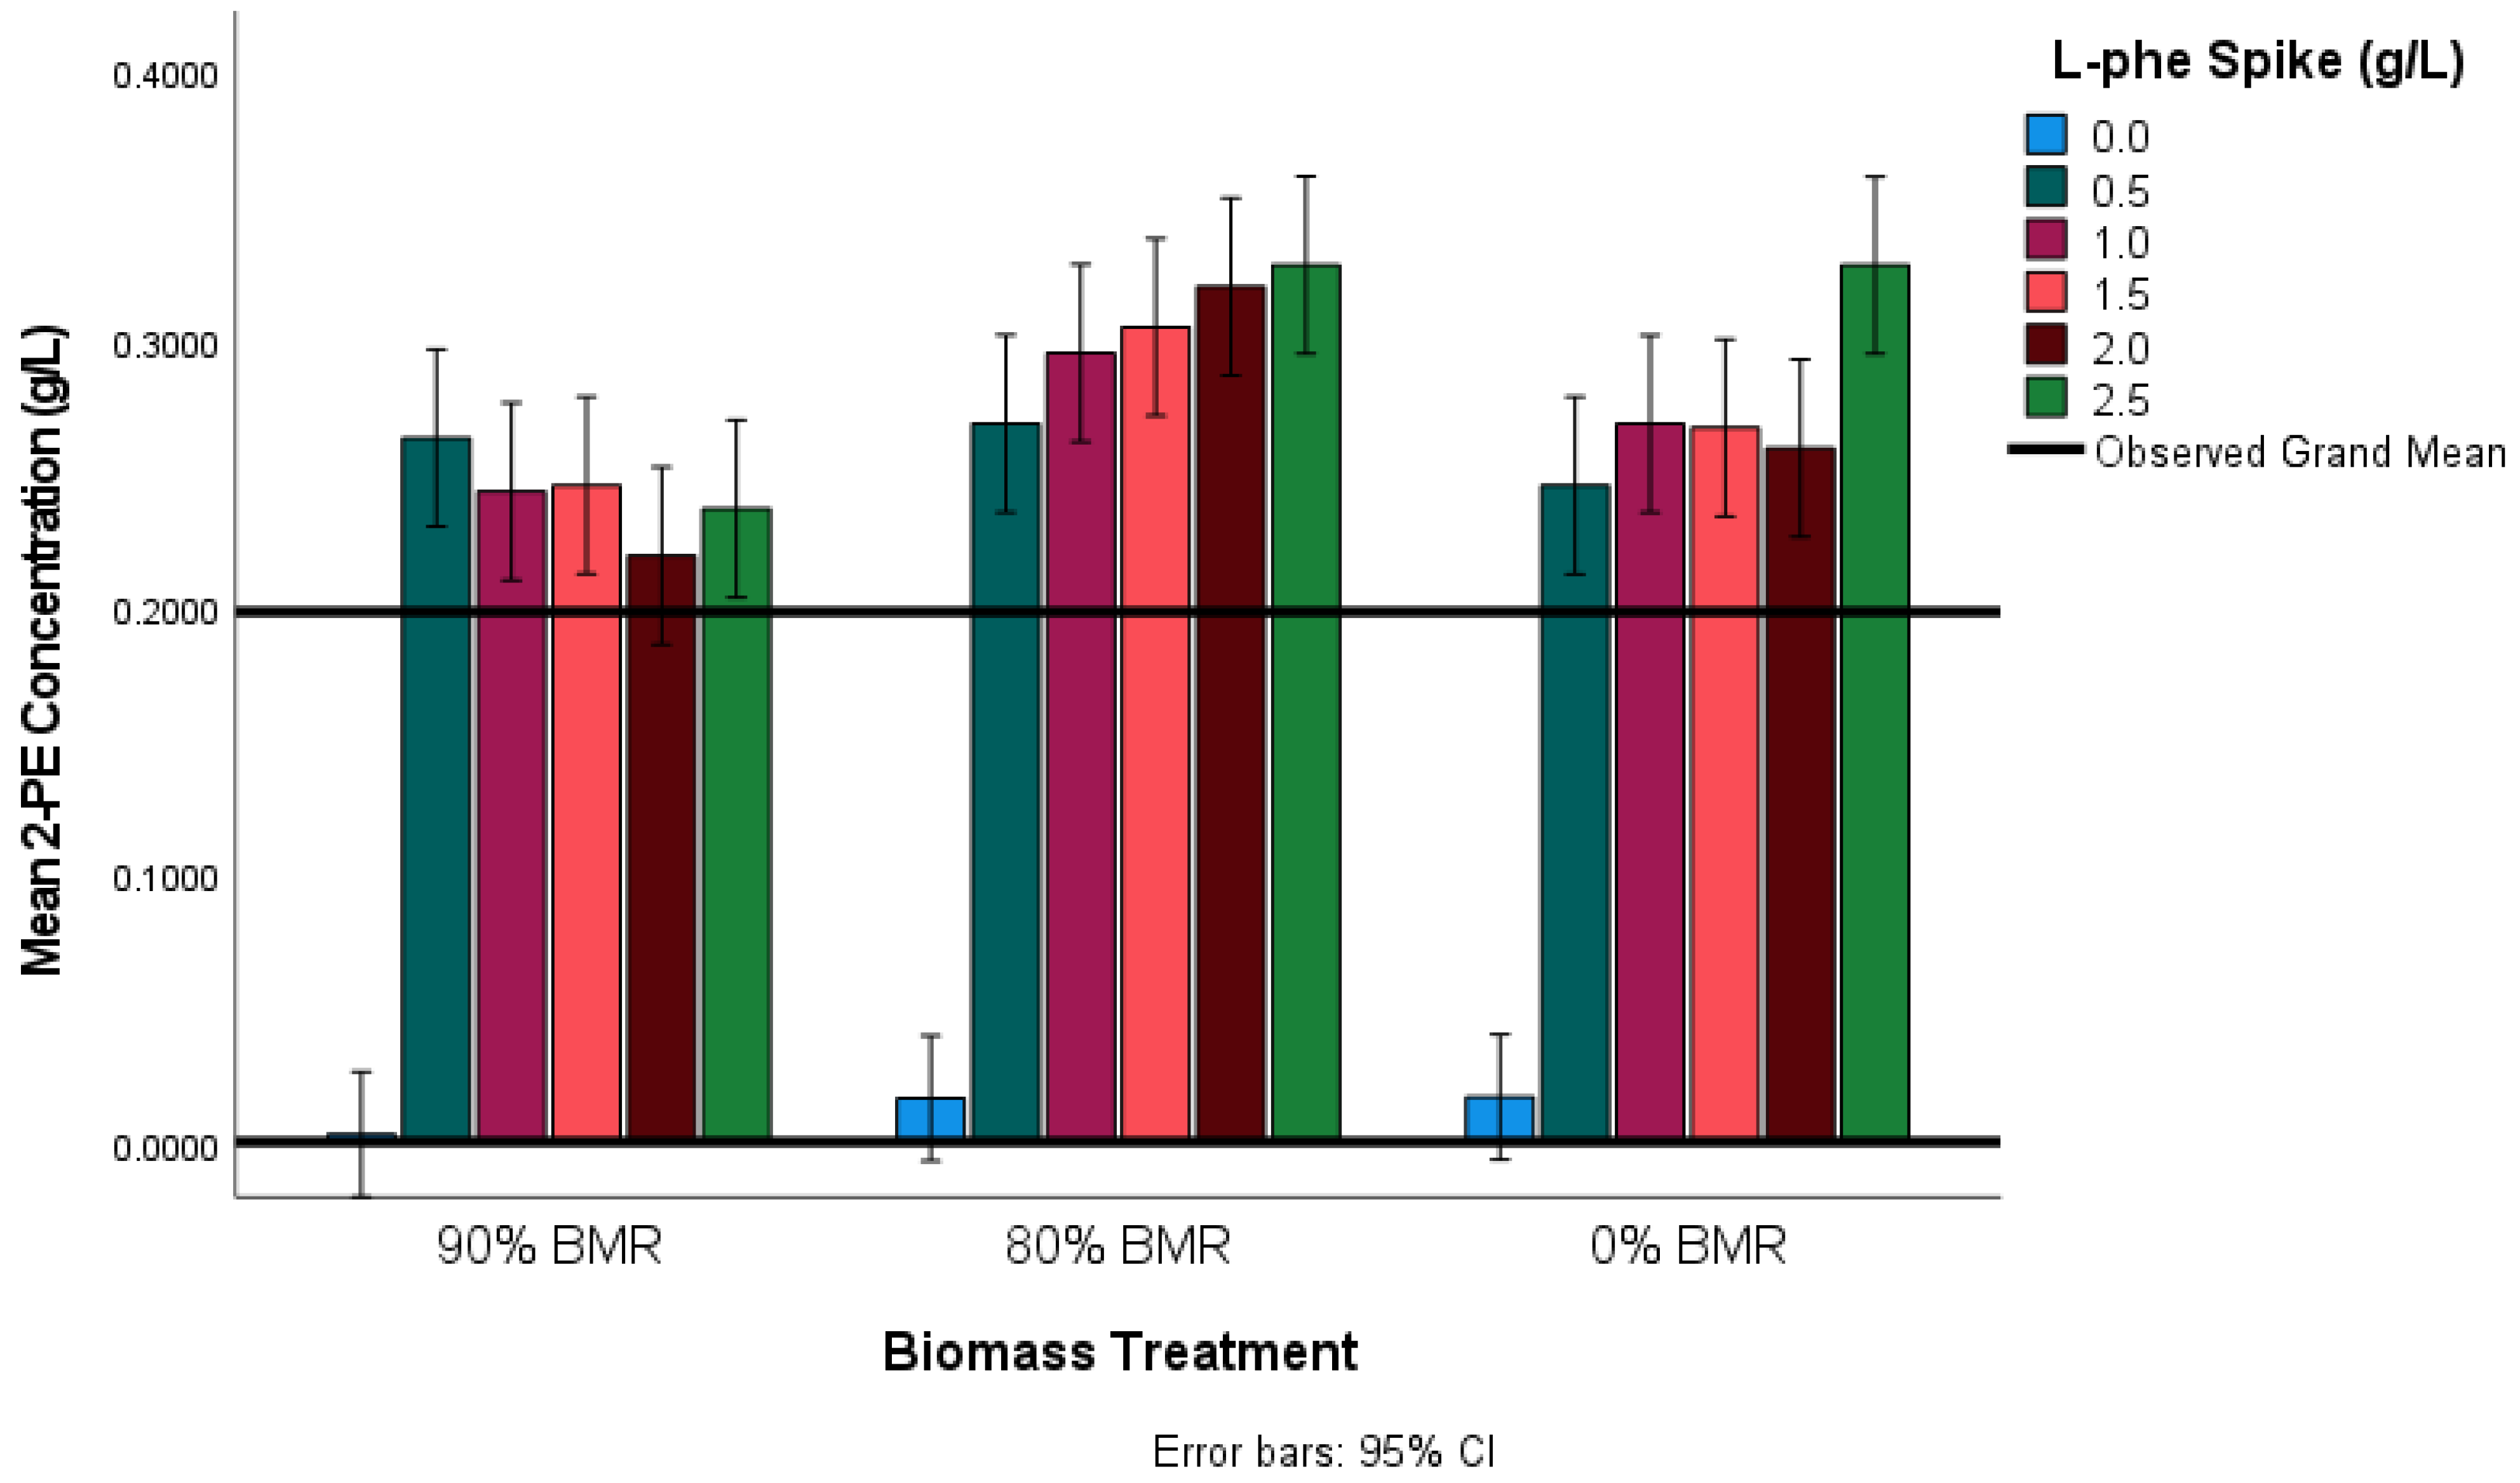
The results of Scheffe’s post hoc analysis indicated that 2-PE concentration was significantly lower in the 90% BMR (0.2411 g L−1 2-PE) treatments compared to both the 80% BMR (0.3026 g L−1 2-PE) p < 0.001, and the 0% BMR treatment (0.2732 g L−1 2-PE) p = 0.042.
However, the difference in 2-PE concentration between the 80% BMR and 0% BMR treatment was not significant (
p = 0.066). This may be due to the conservative nature of Scheffe’s post hoc analysis and its tendency to suffer from type II statistical error [
48,
49]. Nevertheless, preliminary research indicated that in the presence of excess L-phe BMR would increase the concentration of 2-PE compared to the 0% BMR treatment. Therefore, further hypothesis investigation required a more powerful planned analysis of 2-PE concentration between the 80% BMR treatment and the 0% BMR treatment.
The least significant difference (LSD) was used as it has been shown to display a high power in post hoc analysis [
47]. Results from the LSD test indicated that the 80% BMR treatment was significantly higher in 2-PE concentration than the 0% BMR treatment (
p = 0.021).
These results indicate that biomass reduction had a two-fold effect on the concentration of 2-PE in the cider fermentations. Firstly, a considerable biomass reduction (90% BMR) was detrimental to the production of 2-PE both with and without an L-phe spike. However, 2-PE production was only lower for the 80% BMR treatments in the controls, with the addition of an L-phe spike, more 2-PE was produced compared to the 0% BMR treatment. It is possible that the reduced 2-PE concentration of the 90% BMR treatment was caused by the inability of the yeast culture to recover from such a severe biomass reduction effectively. In work conducted by Eshkol et al. (2009), a positive relationship between final yeast biomass dry weight and total 2-PE production was observed [
50]. Among several
S. cerevisiae strains, the ones with greater final biomass dry weight consistently produced more 2-PE. The slight difference in the 2-PE concentrations of the 80% BMR treatments versus the 0% BMR treatments is displayed in
Figure 5. There appears to be a gradual increase in the concentration of 2-PE between the 0.5 g L
−1 spike and the 2.5 g L
−1 spikes in the 80% BMR treatment. However, the sharp increase in 2-PE in the 0% BMR treatment observed for the 2.5 g L
−1 spike is quite distinct. This likely indicates successful activation of the Ehrlich pathway at all spike levels in the 80% BMR treatment. On the other hand, no clear trend was observed in the 0% BMR treatment group. This is possibly due to the simultaneous activation of the Ehrlich pathway, cinnamate, or shikimate pathway due to the availability of a range of nitrogen sources.
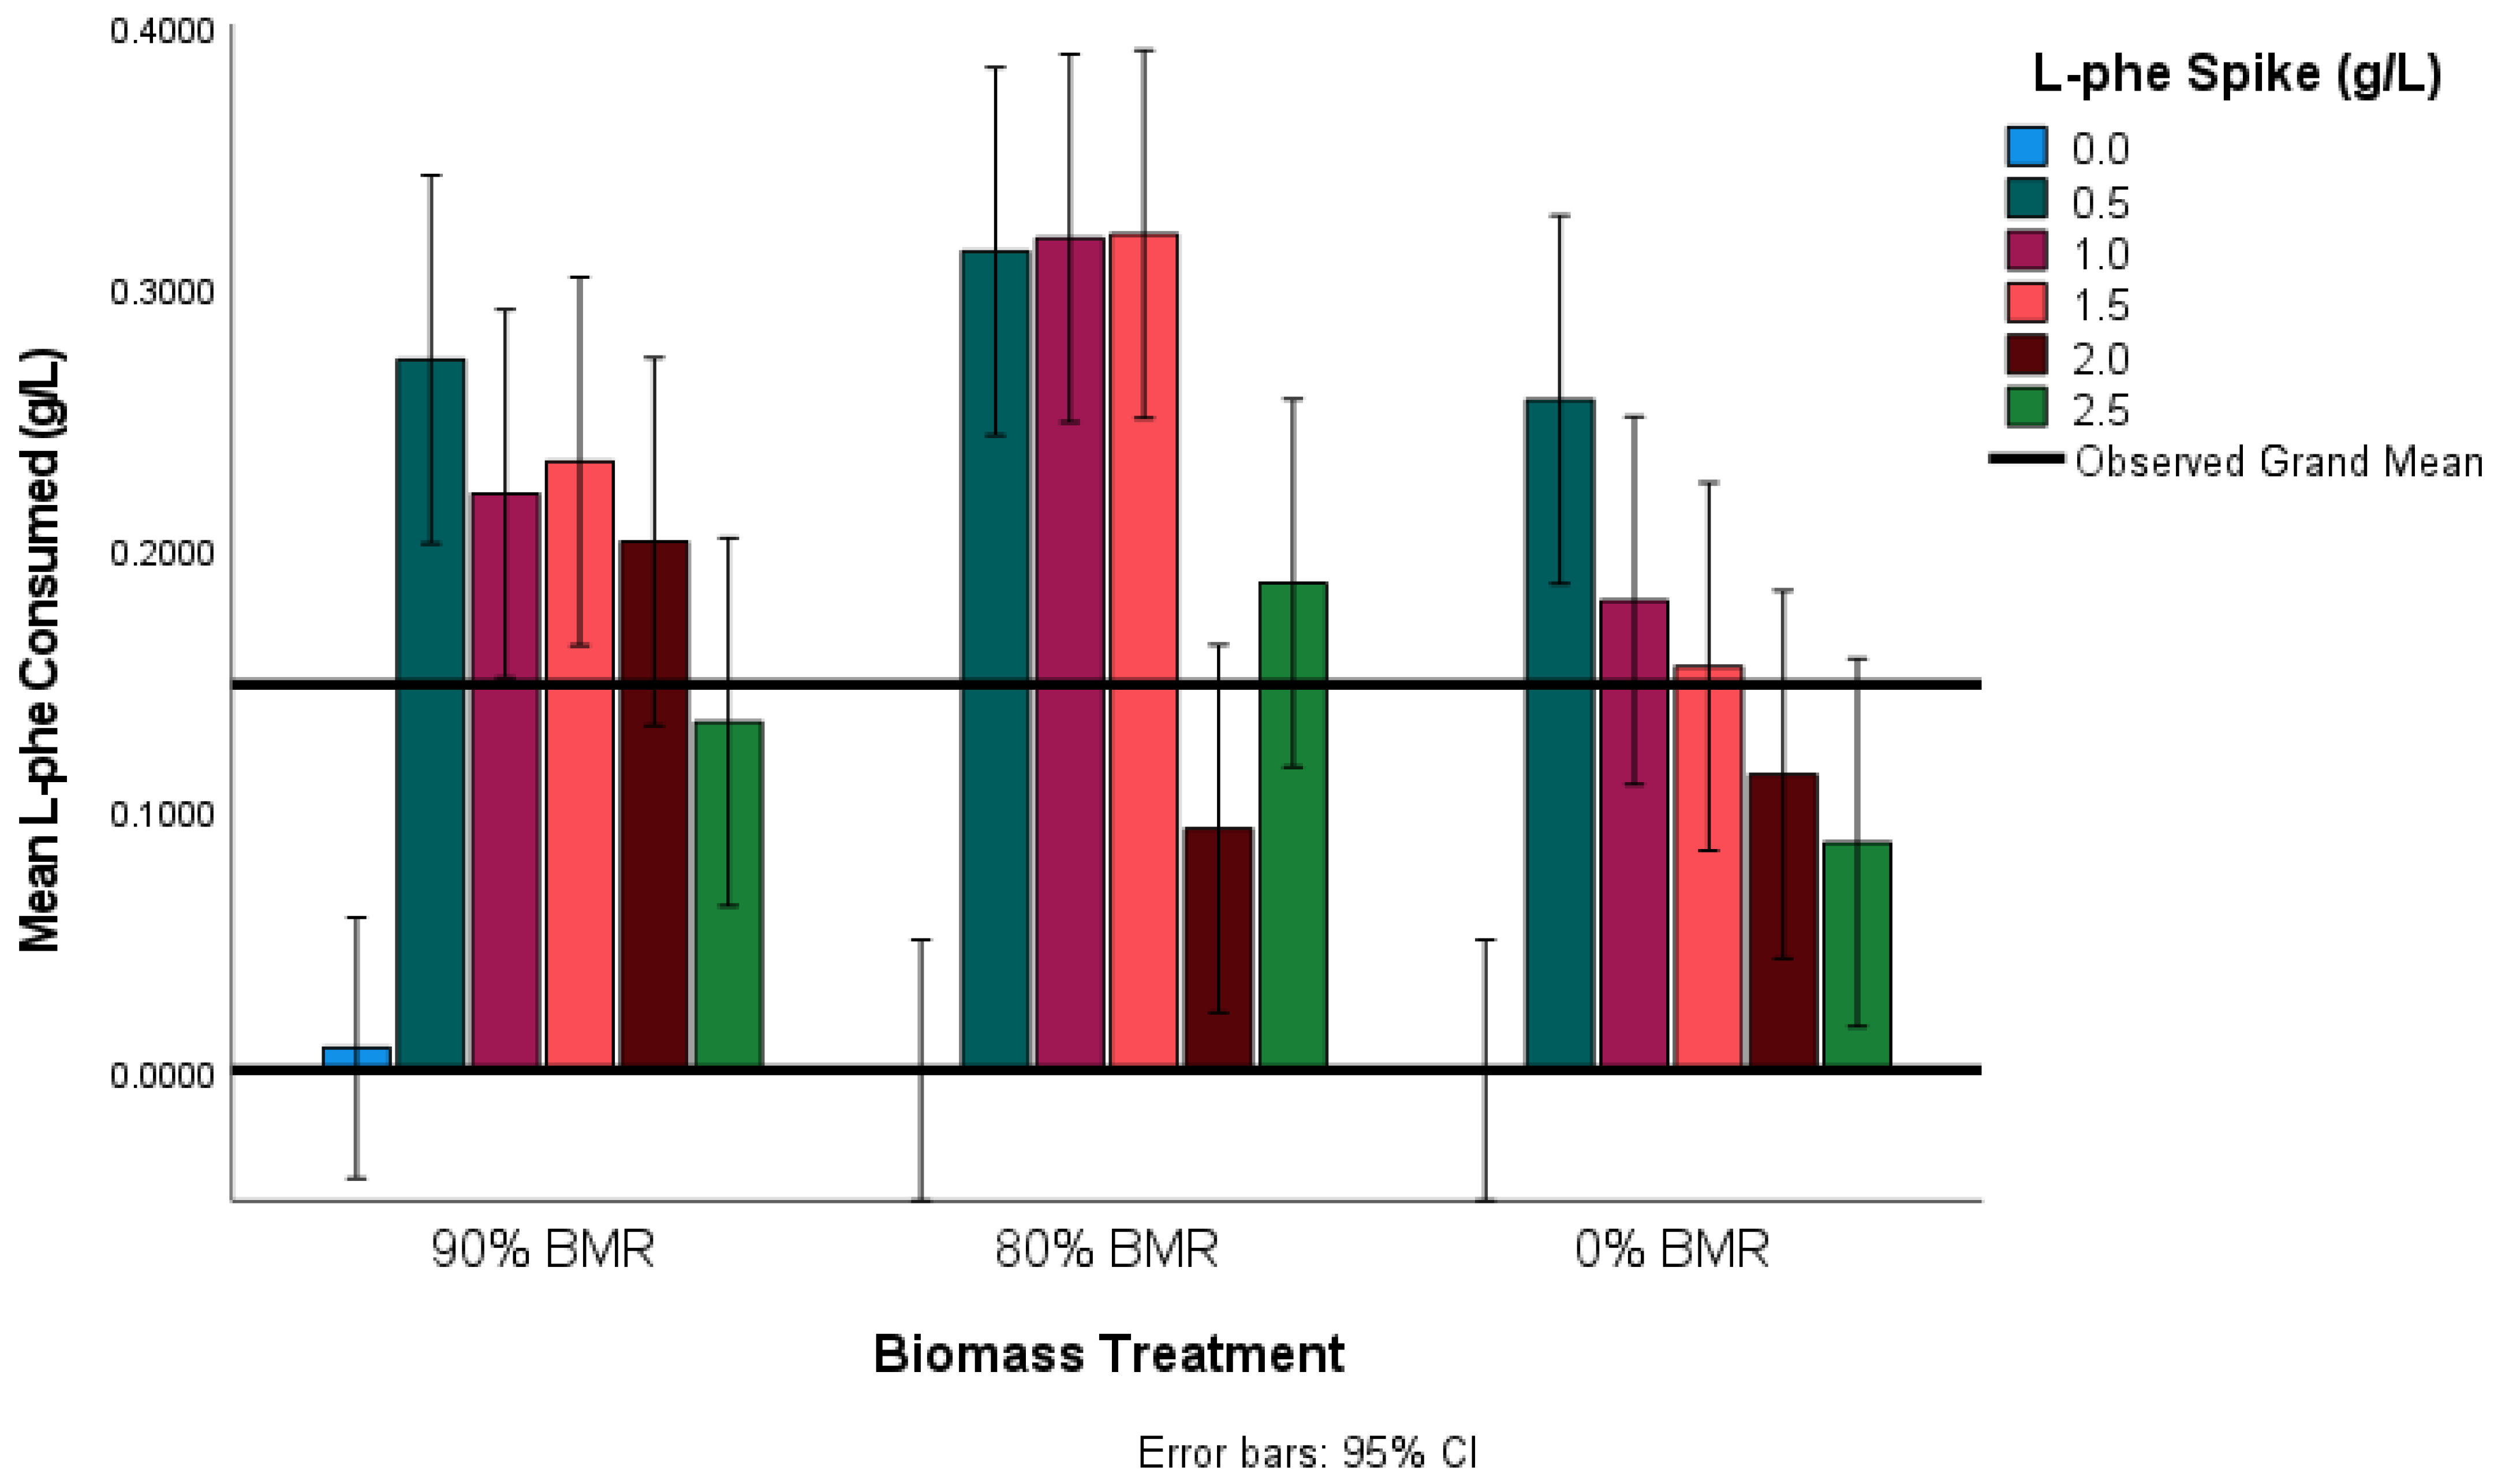
Next, the effect of BMR on L-phe consumed was explored (
Figure 6). Again, Scheffe’s method was used to conduct a series of unplanned comparisons. It was determined that L-phe consumption was statistically lower in the 0% BMR treatment compared to the 80% BMR treatment (
p = 0.011). Given that there was no specific hypothesis for the effect that BMR would have on L-phe consumption, no further planned comparisons were made to avoid the risk of type I statistical error. Finally, the effect of the L-phe spike on the consumption of L-phe was further investigated. It was determined that the 0.5 g L
−1 L-phe spikes had statistically higher absolute L-phe consumption (
p = 0.007) than both the 2.0 g L
−1 and 2.5 g L
−1 L-phe spikes, as shown in
Table 2. Therefore, this indicates that there is a saturation point of L-phe consumption at or prior to 0.5 g L
−1 L-phe and that administering greater concentrations of L-phe may be superfluous.
Further comparison of the 2-PE production and L-phe consumption of the different treatments revealed some contrasting outcomes. Firstly, the production of 2-PE and consumption of L-phe were highest in the 80% BMR condition. It is reasonable to expect that the treatment with the highest 2-PE production would also consume the most L-phe–as it is expected that 2-PE will be produced almost entirely from the Ehrlich pathway. However, when considering the 0% BMR treatments, it can be observed that while 2-PE production was almost as high as the 80% BMR treatment, the L-phe consumption was the lowest. The disparity between 2-PE production and L-phe consumption reinforces the suggestion that other L-phe metabolic pathways were activated in the 0% BMR treatments. At least part of the 2-PE produced was likely due to activation of the shikimate pathway. Due to the anaerobic conditions of fermentation, yeast will be performing glycolysis, providing phosphoenolpyruvate and erythrose-4-phosphate for biotransformation into phenylpyruvate for insertion into the Ehrlich pathway. Activation of the shikimate pathway would explain both the unusual 2-PE levels and the lack of L-phe consumption.
3.3. Ethanol Determination
It was found that the concentration of ethanol among representative samples (
n = 9) ranged from 4.14–4.98% ± 0.18% (
v/
v ethanol), which is within the expected range for apple ciders [
51]. However, a statistically significant difference between the biomass treatments was observed within the treatment groups. An one-way ANOVA demonstrated that ethanol concentration varied significantly with BMR treatment (F(2, 6) = [13.239],
p = 0.006). Further testing was conducted, and a Scheffe post hoc test was used to explore unplanned comparisons between the three BMR treatments. It was observed that, on average, the 0% BMR treatments produced more ethanol (4.91%
v/
v) compared to the 90% biomass reduction treatments (4.30%
v/
v), with a significance of
p = 0.006.
Additionally, on average, the 80% BMR treatment produced 4.63%
v/
v ethanol and was not significantly different from any other treatment. The difference in ethanol level between the 0% BMR treatment and the 90% BMR treatment strongly indicates that the biomass reduction method used was effective at 90% BMR. It is well documented in the literature that the primary effect of biomass reduction is to slow fermentation to retain the sugar content of the cider, thus decreasing ethanol production [
52].
3.4. Brix
Brix measurements were used to estimate the total sugar concentration remaining in the cider samples after fermentation. Results from a representative sample of the ciders produced (
n = 9) indicated that the Brix content of the ciders ranged from 3.81–4.62% ± 0.12% sucrose (
w/
w). The ciders produced in this study contained similar sugar content to several French ciders investigated by Symoneaux et al. (2015). These authors found a relationship that was investigated between the olfactory perception of sweetness and cider sugar content, finding that ciders with a sugar content greater than 4.00% sucrose (
w/
w) begin to have aroma-taste interactions [
53]. Additionally an ANOVA was used to determine that Brix varied significantly with biomass reduction treatments, (F(2, 6) = [6.280],
p = 0.034). Post hoc testing using Scheffe’s test indicated that the Brix measurement of the 0% BMR treatment (3.99% sucrose
w/
w) was lower than the 90% BMR treatment (4.50% sucrose
w/
w) with a significance of
p = 0.036. Additionally, the 80% BMR treatment (4.17% sucrose
w/
w) was not significantly different to any other treatment. These results further reinforce the conclusion that the 90% BMR treatment was effective, as it was expected that the greater the biomass reduction, the more residual sugars in the cider [
52].
3.5. Volatile Organic Compounds
Across the 36 samples analysed, 26 different volatiles were recorded. Of the 26 volatiles, the identity of 19 were confirmed by both a suitable LRI and NIST14s GC-MS library similarity search, while six were tentatively identified, and one volatile was not able to be identified. The volatiles were organised into different compound classes, as seen in
Table 3. The volatile profile of the ciders was predominated by acids, followed by alkanes, phenolics, aromatic hydrocarbons, and esters. In previous work, esters were the predominant chemical class in commercial ciders [
2]. Esters are primarily formed through the esterification of alcohols and fatty acids during prolonged fermentation [
54] and maturation [
10]. It is likely that the short fermentation time (due to environmental temperature) and the absence of a maturation period drastically reduced the ester content of the experimental ciders compared to commercial products.
Additionally, the experimental ciders appeared to be less complicated than commercial ciders explored in previous work [
2]. The most likely explanation is the difference in the quality of fermentation stock. This work used a simple shelf-stable apple juice, while many commercial cider breweries prefer to use pressed apple juice comprising several different apple varieties [
55], including other fruits, herbs, and spices [
2].
3.5.1. Acids
Acids typically contribute to sour and fresh flavours and sometimes rancid or cheesy odours in ciders. Produced by lipid oxidation during fermentation [
56] and naturally found in apples and other common cider ingredients [
57], acids are estimated to typically account for up to 15% of the VOC profile in cider [
58]. This work observed a large number of unique acids among the experimental ciders. Propanoic acid was the most abundant in every treatment and is a standard cider VOC [
59]. Other acids common to cider were found- butanoic acid [
27], isovaleric acid [
60], methyl valerate [
61], and hexanoic acid [
62] were detected in the majority of treatments. In contrast, pentanoic acid and heptanoic acid were only found in four and five (respectively) ciders in this work but are standard apple cider VOCs [
63,
64].
3.5.2. Alkanes
While several alkanes were found in the VOC profile of the experimental ciders, there is little evidence that these compounds have a noticeable impact on the sensory properties of cider. The alkane production potential of
S. cerevisiae is relatively low [
65], and many improvement methods are focused on genetic modification [
66]. Of the six alkanes (see
Table 3, 3-ethylhexanane has previously been reported in wine, and undecane is commonly found in apple juice. Therefore, it is likely that the occurrence of alkenes in this work only serves as an indicator of general
S. cerevisiae metabolism.
3.5.3. Phenolics
Phenolic compounds are the prime interest in this work, playing a vital role in cider quality; phenolic compounds affect apple ciders’ colour, bitterness, aroma, and astringency [
67]. Some phenolics have even been correlated with beneficial health effects- primarily through antioxidant activity [
68,
69,
70]. In this work, all ciders contained three different phenolic compounds. The main phenolic detected was 2-phenylethanol, as expected.
2,4-Di-tert-butylphenol was also identified and is commonly found in shelf-stable apple juice [
71]. Lastly, phenylacetaldehyde (P.A.) was found in nine treatments and is of distinct interest in wine research. Primarily formed by the oxidation of 2-PE, P.A. is used as a chemical indicator for oxidation levels in wine; the detection and prevention of the formation of phenylacetaldehyde are currently being researched [
72].
3.5.4. Aromatic Hydrocarbons
Three unique aromatic hydrocarbons were detected, naphthalene was detected in all samples, and naphthalene derivatives are often used as a synthetic growth regulator in apples and other fruits and vegetables [
73]. Benzothiazole is a standard yeast metabolite reported in wine [
74]. Although Methoxymethyl benzene was tentatively identified, there is no report of this compound in cider or apples. However, it is a standard VOC found in roses and may be a common volatile among the Rosaceae family of plants [
75].
3.5.5. Other Chemical Classes
Several VOCs detected did not belong to any of the major chemical classes observed. 1-Hexanol was found in all treatments, and it was the only detected alcohol in the DCM extract of the experimental cider. Known to produce nutty or fatty aromas, 1-hexanol is formed from the bioremediation of unsaturated fatty acids, and it is known to be detrimental to the organoleptic properties of cider [
76]. Two esters were detected in the experimental ciders. The first was tentatively identified as ethyl(methylthio)acetate, which is commonly found in “Gala” variety apples [
77]. Secondly, 2-Phenylethyl pivalate was also tentatively identified, primarily formed from the esterification of 2-PE and pivalate acid. This sulphur-containing ester has a detrimental impact on the quality of cider and is described as imparting a rotten aroma [
77].
A singular ketone was detected across 11 treatments, 1,3-cyclohexanedione was tentatively identified. However, there is no obvious explanation for the occurrence of this compound in the treatments. Likewise, the organosilicon; Dodecamethylcyclohexasiloxane was tentatively identified with a strong similarity search result (94%). Found commonly in soybean fermentations, Dodecamethylcyclohexasiloxane is often associated with a robust dry flavour [
78]. However, it may also be an artifact present from the silica caps used on the GC-MS vials. The final compound could not be identified due to inconclusive mass spectra similarity results and was labelled Unknown A.
3.6. Chemometric Analysis
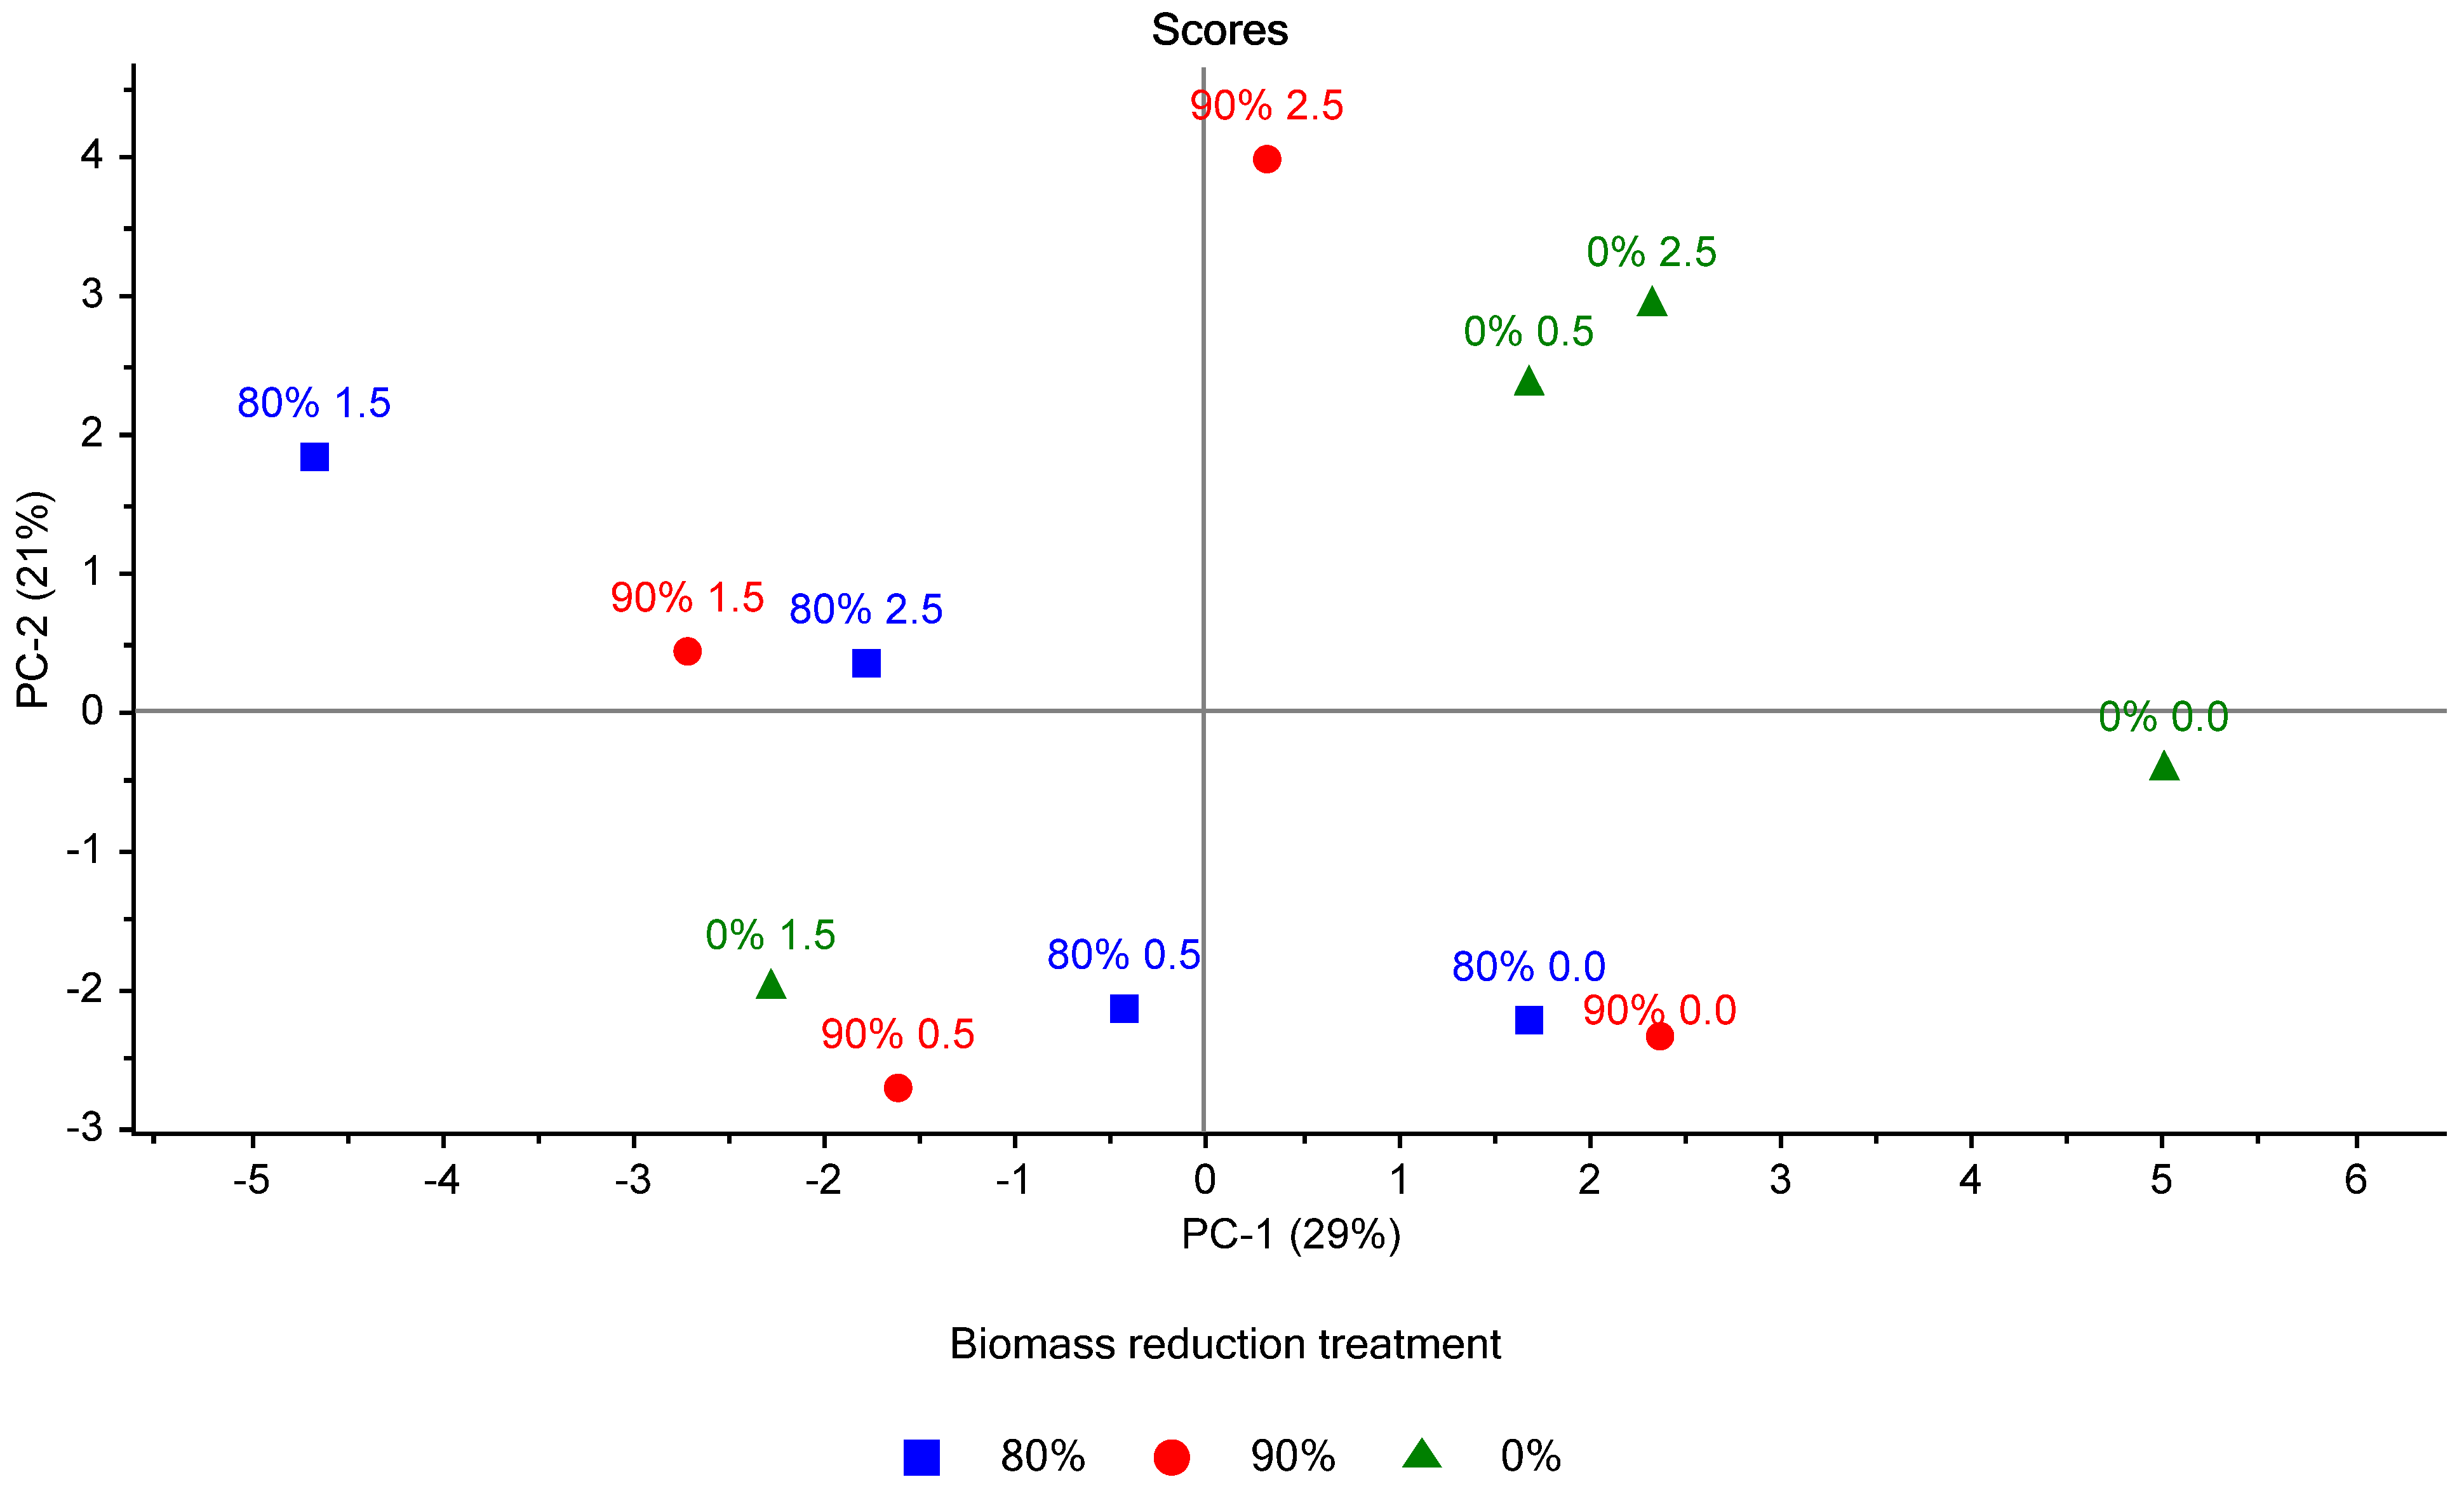
The principal component analysis performed on the volatile dataset displayed beneficial levels of data reduction, with PC-1 and PC-2 capturing 29% and 21% of the variability, respectively. In addition, the loading plot generated using PC-1 and PC-2 (
Figure 7) provided good grouping by compound class, particularly for the phenolics, alkanes, and acids. Note the distinct separation between the phenolic compounds and most acids, potentially indicating an inverse relationship between those compound classes.
When compared to the scores plot of PC-1 and PC-2 (
Figure 8), we can observe the relationship between specific compounds and treatments. It can be observed that all phenolic compounds were positively loaded on PC-1 and predominately negatively loaded on PC-2. Interestingly, the highest producer of 2-PE among the treatments was the 80% BMR, 2.5 g L
−1 L-phe (80%/2.5) and scored positive on PC-1 and negative on PC-2. Other 2.5 g L
−1 L-phe spiked treatments (90% BMR and 0% BMR) scored positivity on both PC-1 and PC-2. This indicates that the 80%/2.5 treatment was more closely correlated with the production of 2-PE but also with 2-phenylethyl pivalate and PA, both derivatives of 2-PE. It is possible that under the right circumstances, if 2-PE esterification and oxidation can be reduced, the 80%/2.5 treatment may produce an even greater concentration of 2-PE when compared to the other treatments.
Alkanes were predominately positively loaded on PC-1 and PC-2, somewhat like the acids detected. Both compound classes appear to have an inverse relationship with 2-PE and its derivatives when measured using PC-1—displaying a similarity with the control treatments, which were positively loaded on PC-1. Additionally, heptanoic acid was found to correlate strongly with the controls, being the only compound negatively loaded on PC-2; thus, indicating that the absence of an L-phe spike correlated with the production of heptanoic acid. Aromatic hydrocarbons have a similar loading on PC-1 and PC-2 to that of the phenolic compounds, indicating a similar distribution among the treatments. Possibly due to the structural similarity of the aromatic hydrocarbons and phenolic compounds.
The most substantial groupings of treatments were the control treatments, all of which were positively loaded on PC-1 and negatively loaded on PC-2, indicating that the addition of L-phe had a considerable yet variable effect on the VOC profile of the experimental ciders.
The 80% and 90% BMR treatments within the control treatments share far more similarities than the 0% BMR treatment, as observed by the separation in
Figure 8. This pattern is also observed when comparing the 0.5 and 1.5 g L
−1 L-phe spike scores. For both L-phe spike treatments, the 90% and 90% BMR treatments appear grouped, and the 0% BMR treatment is an outlier. The segregation of the 0% BMR treatments is almost certainly due to the well-established effect of biomass reduction on the volatile composition of ciders.
Hierarchical cluster analysis was also performed to investigate the relationships between the different treatments further. The resulting dendrogram (
Figure 9) further reinforced the similarities and groupings observed in the PCA plots while providing some new insight into the relationships between different treatments. The x-axis of the dendrogram indicates the “relative distance”, which represents the degree of difference between the VOC profile of the associated treatments. A shorter distance indicates a stronger similarity.
The first two clusters on the dendrogram display the segregation of the 0% BMR treatments for the 0.0 and 1.5 g L−1 spikes. There is a linkage between the 80% and 90% BMR treatments from the two spike groups at a relative distance of 7.5. While the 0% BMR treatment only links to those spike groups at a relative distance of 9.5. The largest difference in VOC profile between treatments that underwent biomass reduction and those that did not is found at the 0.0 and 1.5 g L−1 L-phe spike levels. The next notable cluster is the 80%/0.5 and 90%/0.5 treatments, which showed close similarity, as expected. However, the next closest similarity for that leg of the dendrogram is the 80%/2.5 treatment, which was unexpected given the results of the PCA.
The final leg of the dendrogram displays the similarity of 0% BMR reduction treatments irrespective of L-phe spike level. For example, 0% BMR treatments at 2.5 g L−1 and 0.5 g L−1 L-phe show close similarity in the VOC profile.
4. Conclusions
This work explored the effect of varying L-phe spikes on three different biomass reduction treatments. Concentrations of 2-PE and L-phe consumption were analysed using various statistical methods, and several conclusions were made. First, the effect of biomass reduction was significant on both 2-PE concentration and L-phe consumption. The highest production of 2-PE was achieved by the 80% BMR, producing on average 0.3026 g L−1 2-PE, followed by the 0% BMR at 0.2732 g L−1 2-PE, and finally 90% BMR at 0.2411 g L−1 2-PE. Indicating that controlling the degree of biomass reduction when using this method is essential to avoid hindering the production of 2-PE.
Additionally, it was found that even fermentations spiked with as little as 0.5 g L
−1 of L-phe produced considerably more 2-PE than fermentations without added L-phe. Moreover, once a spike has been administered to fermentation, there is no significant difference between the lowest and highest spike concentration regarding the amount of 2-PE produced. Indicating that even at low L-phe concentration the Ehrlich pathway is being activated. In work conducted by Shen et al. (2016)
S. cerevisiae which had been genetically modified to enhance the shikimate pathway (increasing de novo synthesis) produced up to 0.096 g L
−1 2-PE [
79]. Therefore, concentrations of 0.2411–0.3026 g L
−1 would be unobtainable using the shikimate pathway. This indicates that targeted biomass reduction can be used with low-concentration L-phe spiking to produce significantly more 2-PE than would be otherwise obtained.
Furthermore, the investigation of the biomass reduction methods on ethanol and sugar content (estimated using Brix %) showed that the 90% BMR treatment displayed expected results, such as lower ethanol concentration and higher residual sugars. On the other hand, the 80% BMR treatment did not show any statistical difference in ethanol or residual sugar content. Consequently, this suggests that while the 80% BMR treatment did improve 2-PE production, likely through proposed activation of the Ehrlich pathway, it did not exhibit other expected characteristics of a successful biomass reduction as strongly as the 90% BMR treatments.
Finally, the VOC profile of the experimental triplicates of twelve representative treatments underwent DCM extraction and analysis by GC-MS. Several observations were made relating to the similarities and differences in VOC profile depending on the treatment.
For example, in the 80% BMR treatments, there appeared to be a strong correlation with not only 2-PE but its derivatives PA and 2-phenylethyl pivalate. This correlation was not observed for other biomass treatments—indicating that the production of 2-PE may be further improved by modifying the conditions which lead to the oxidation and esterification of 2-PE into PA, and 2-phenylethyl pivalate, respectively. Additionally, it was observed that there is a negative relationship between acids and alkanes produced with phenolic content, possibly due to the metabolic changes experienced by S. cerevisiae under L-phe saturation conditions. Finally, it was observed that within each L-phe spike level, the 80% and 90% BMR treatments displayed far more similarity to one another than with the 0% BMR treatments, further reinforcing the importance of biomass reduction practices in apple cider production.


