
A Deep Learning Approach for Liver and Tumor Segmentation in CT Images Using ResUNet

 , , , , and
Abstract
:1. Introduction
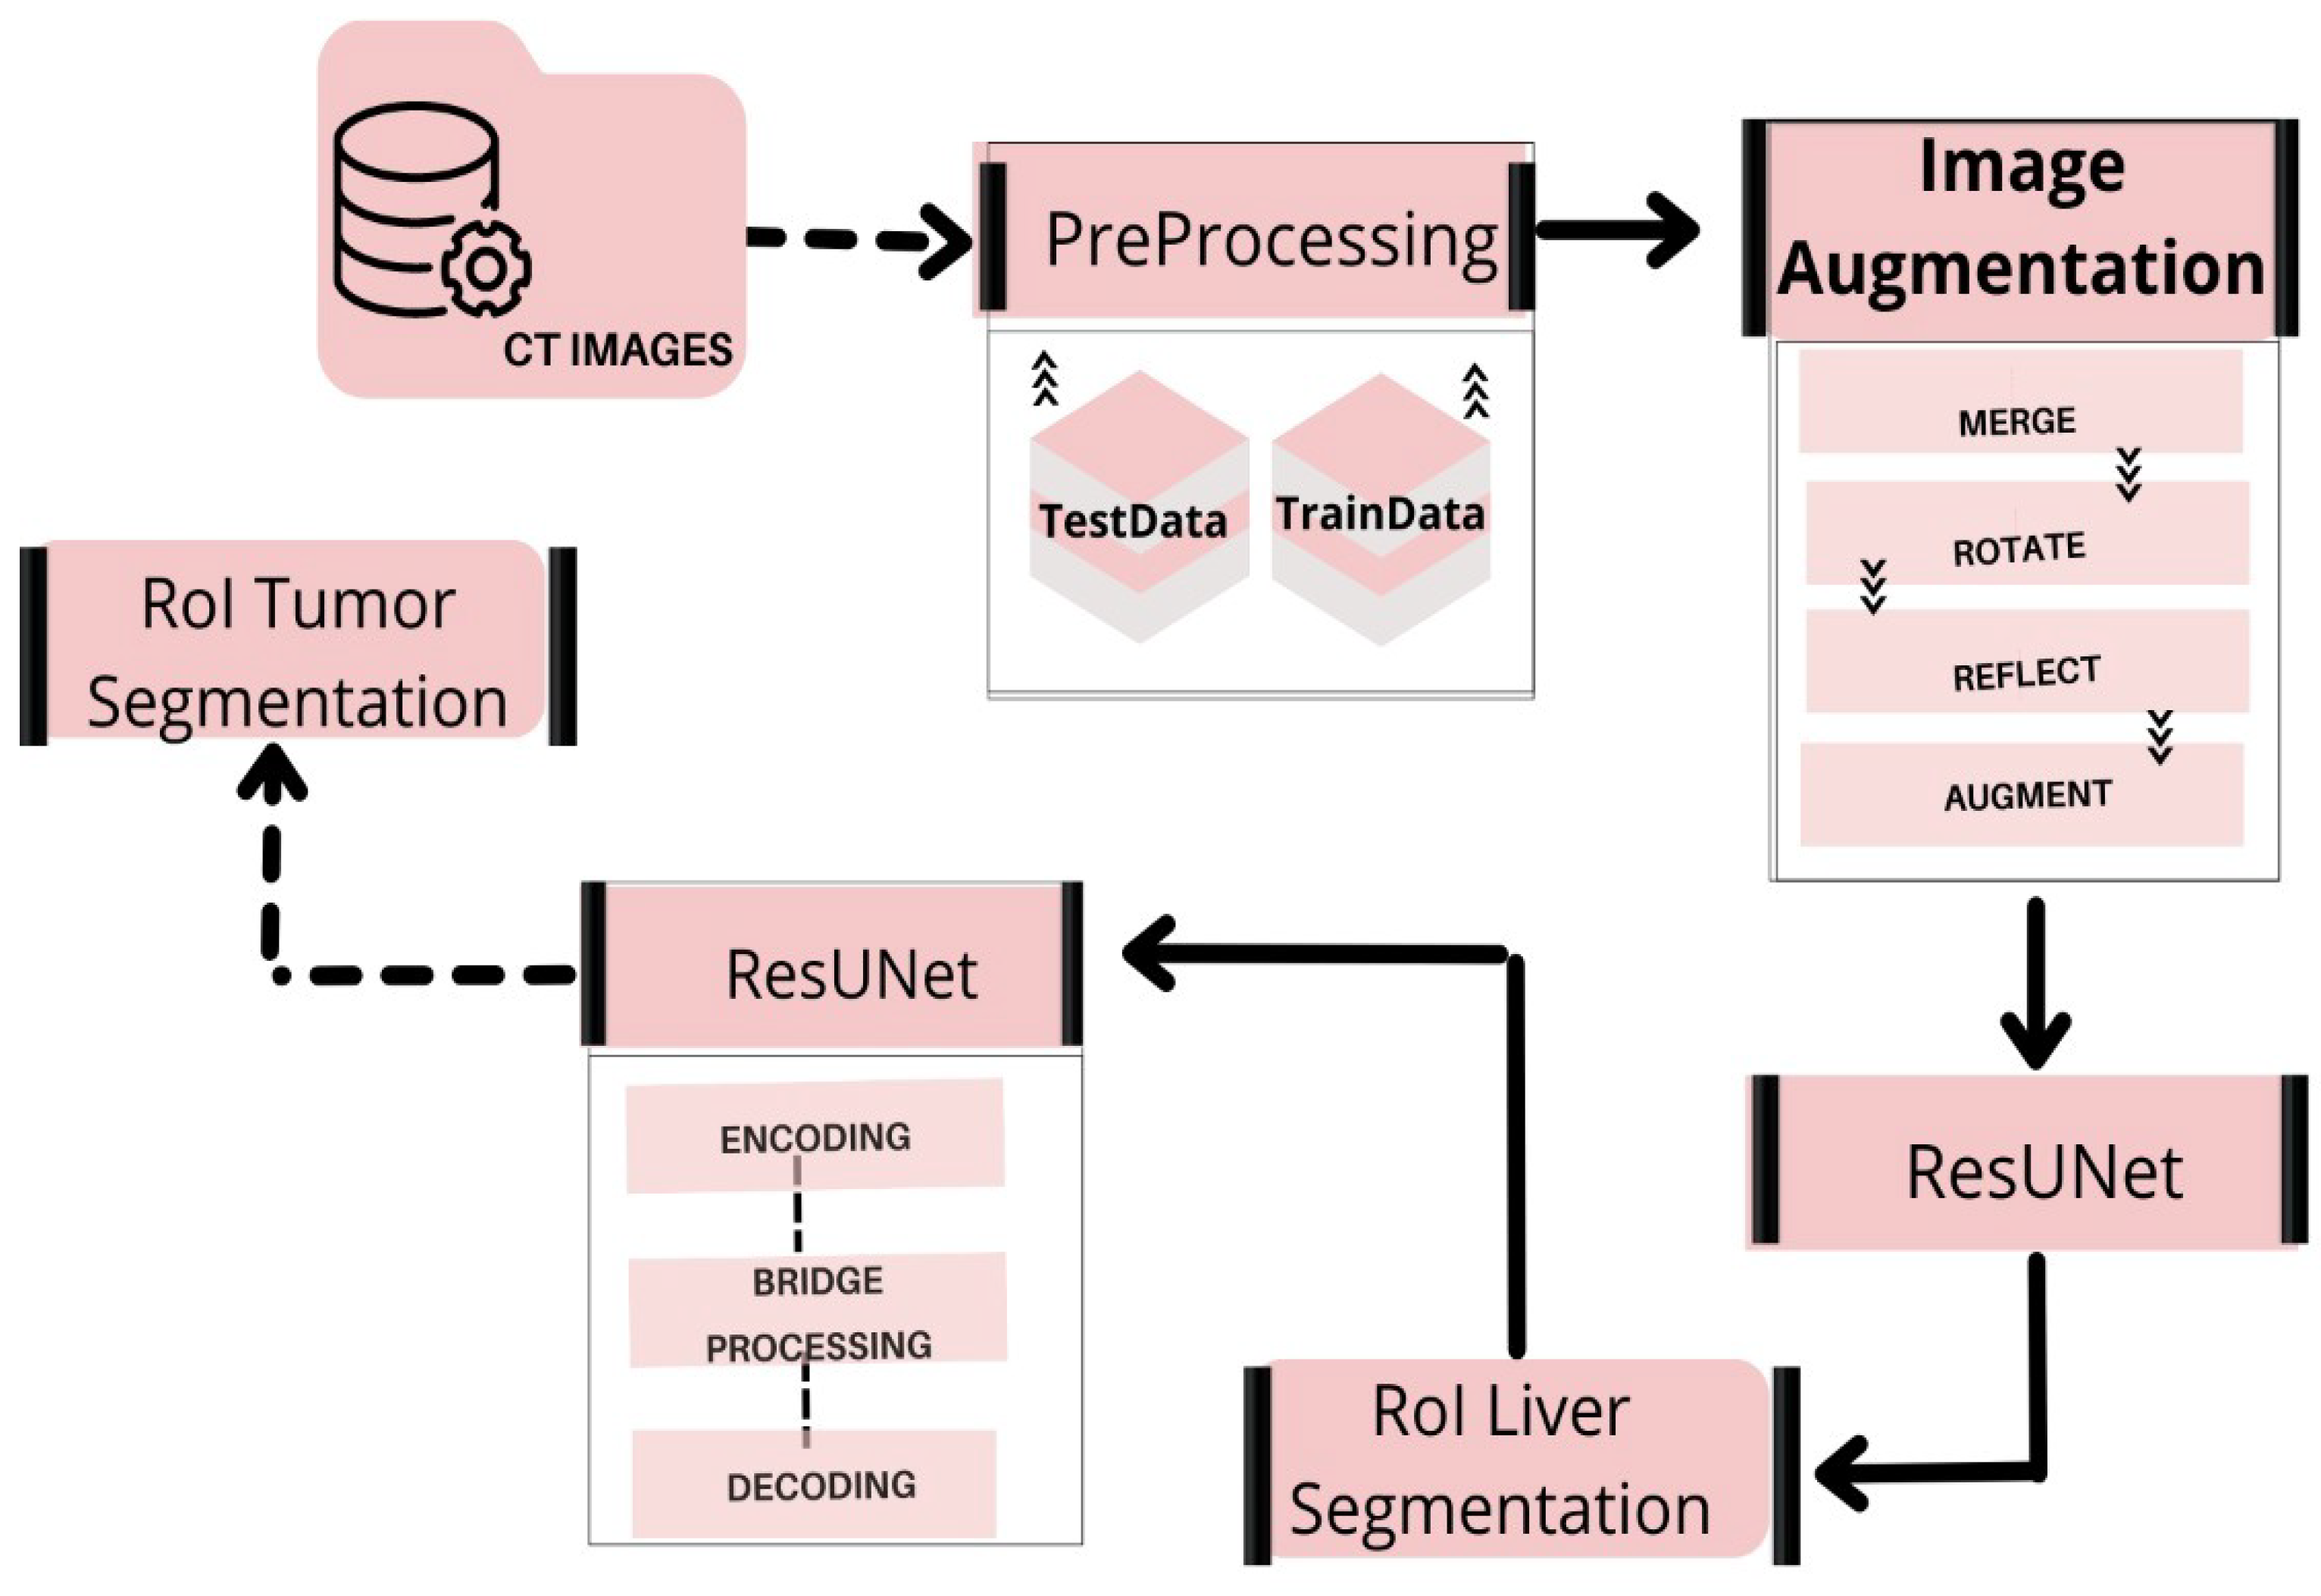
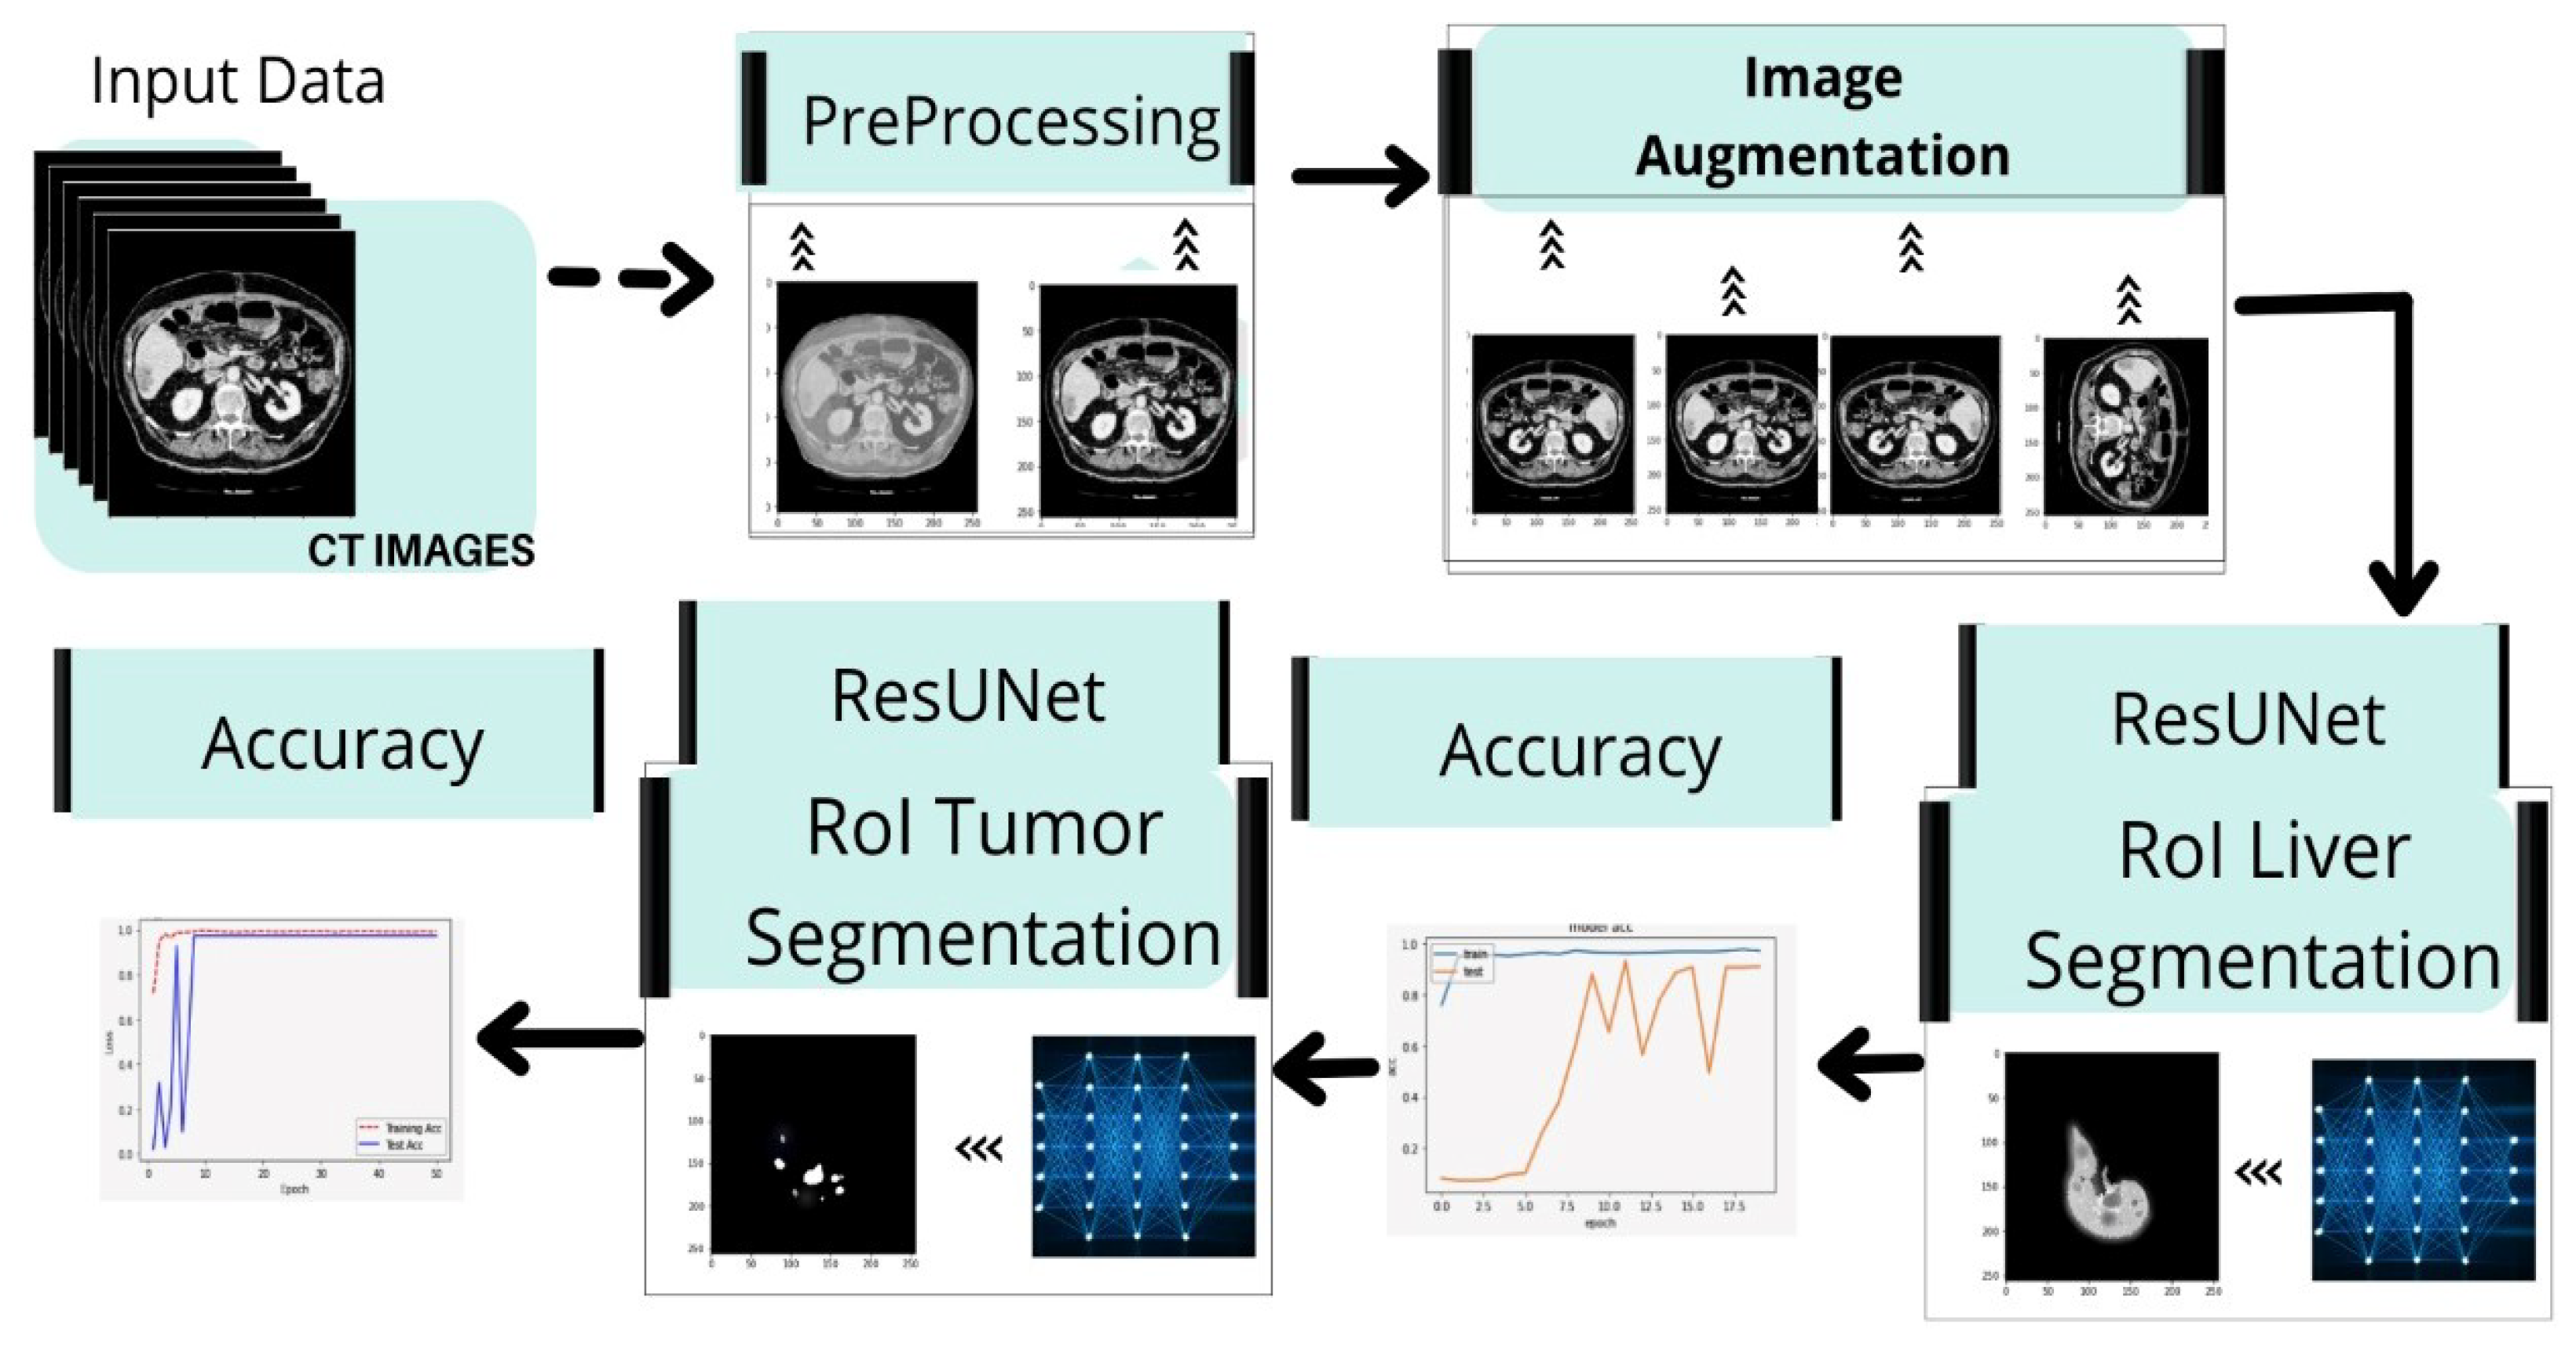
- We develop a fully automated system for segmenting liver and tumors from CT scan images in a single run.
- Based on prior studies and their shortcomings, the researchers in this study attempt to achieve 95% mIOU on HCC tumors using VGG and Inception V4 based on the deep learning models. The research technique is intended to improve accuracy and fulfill expectations in the segmentation of liver tumors.
- We propose a viable method for classifying liver and tumor cells after failing to achieve the desired results with the UNet model. Then, we develop a model that combines both ResNet and UNet, named ResUNet. This deep neural network model utilizes leftover patterns that use escape rather than simple convolutions, resulting in faster testing with few details.
- We provide a high-level overview of this technology’s results.
- We provide a general performance summary of this technique, with comparison to a few other fully automated techniques and define a scope for development based on new data and other features.
2. Literature Review
3. Method
3.1. Dataset
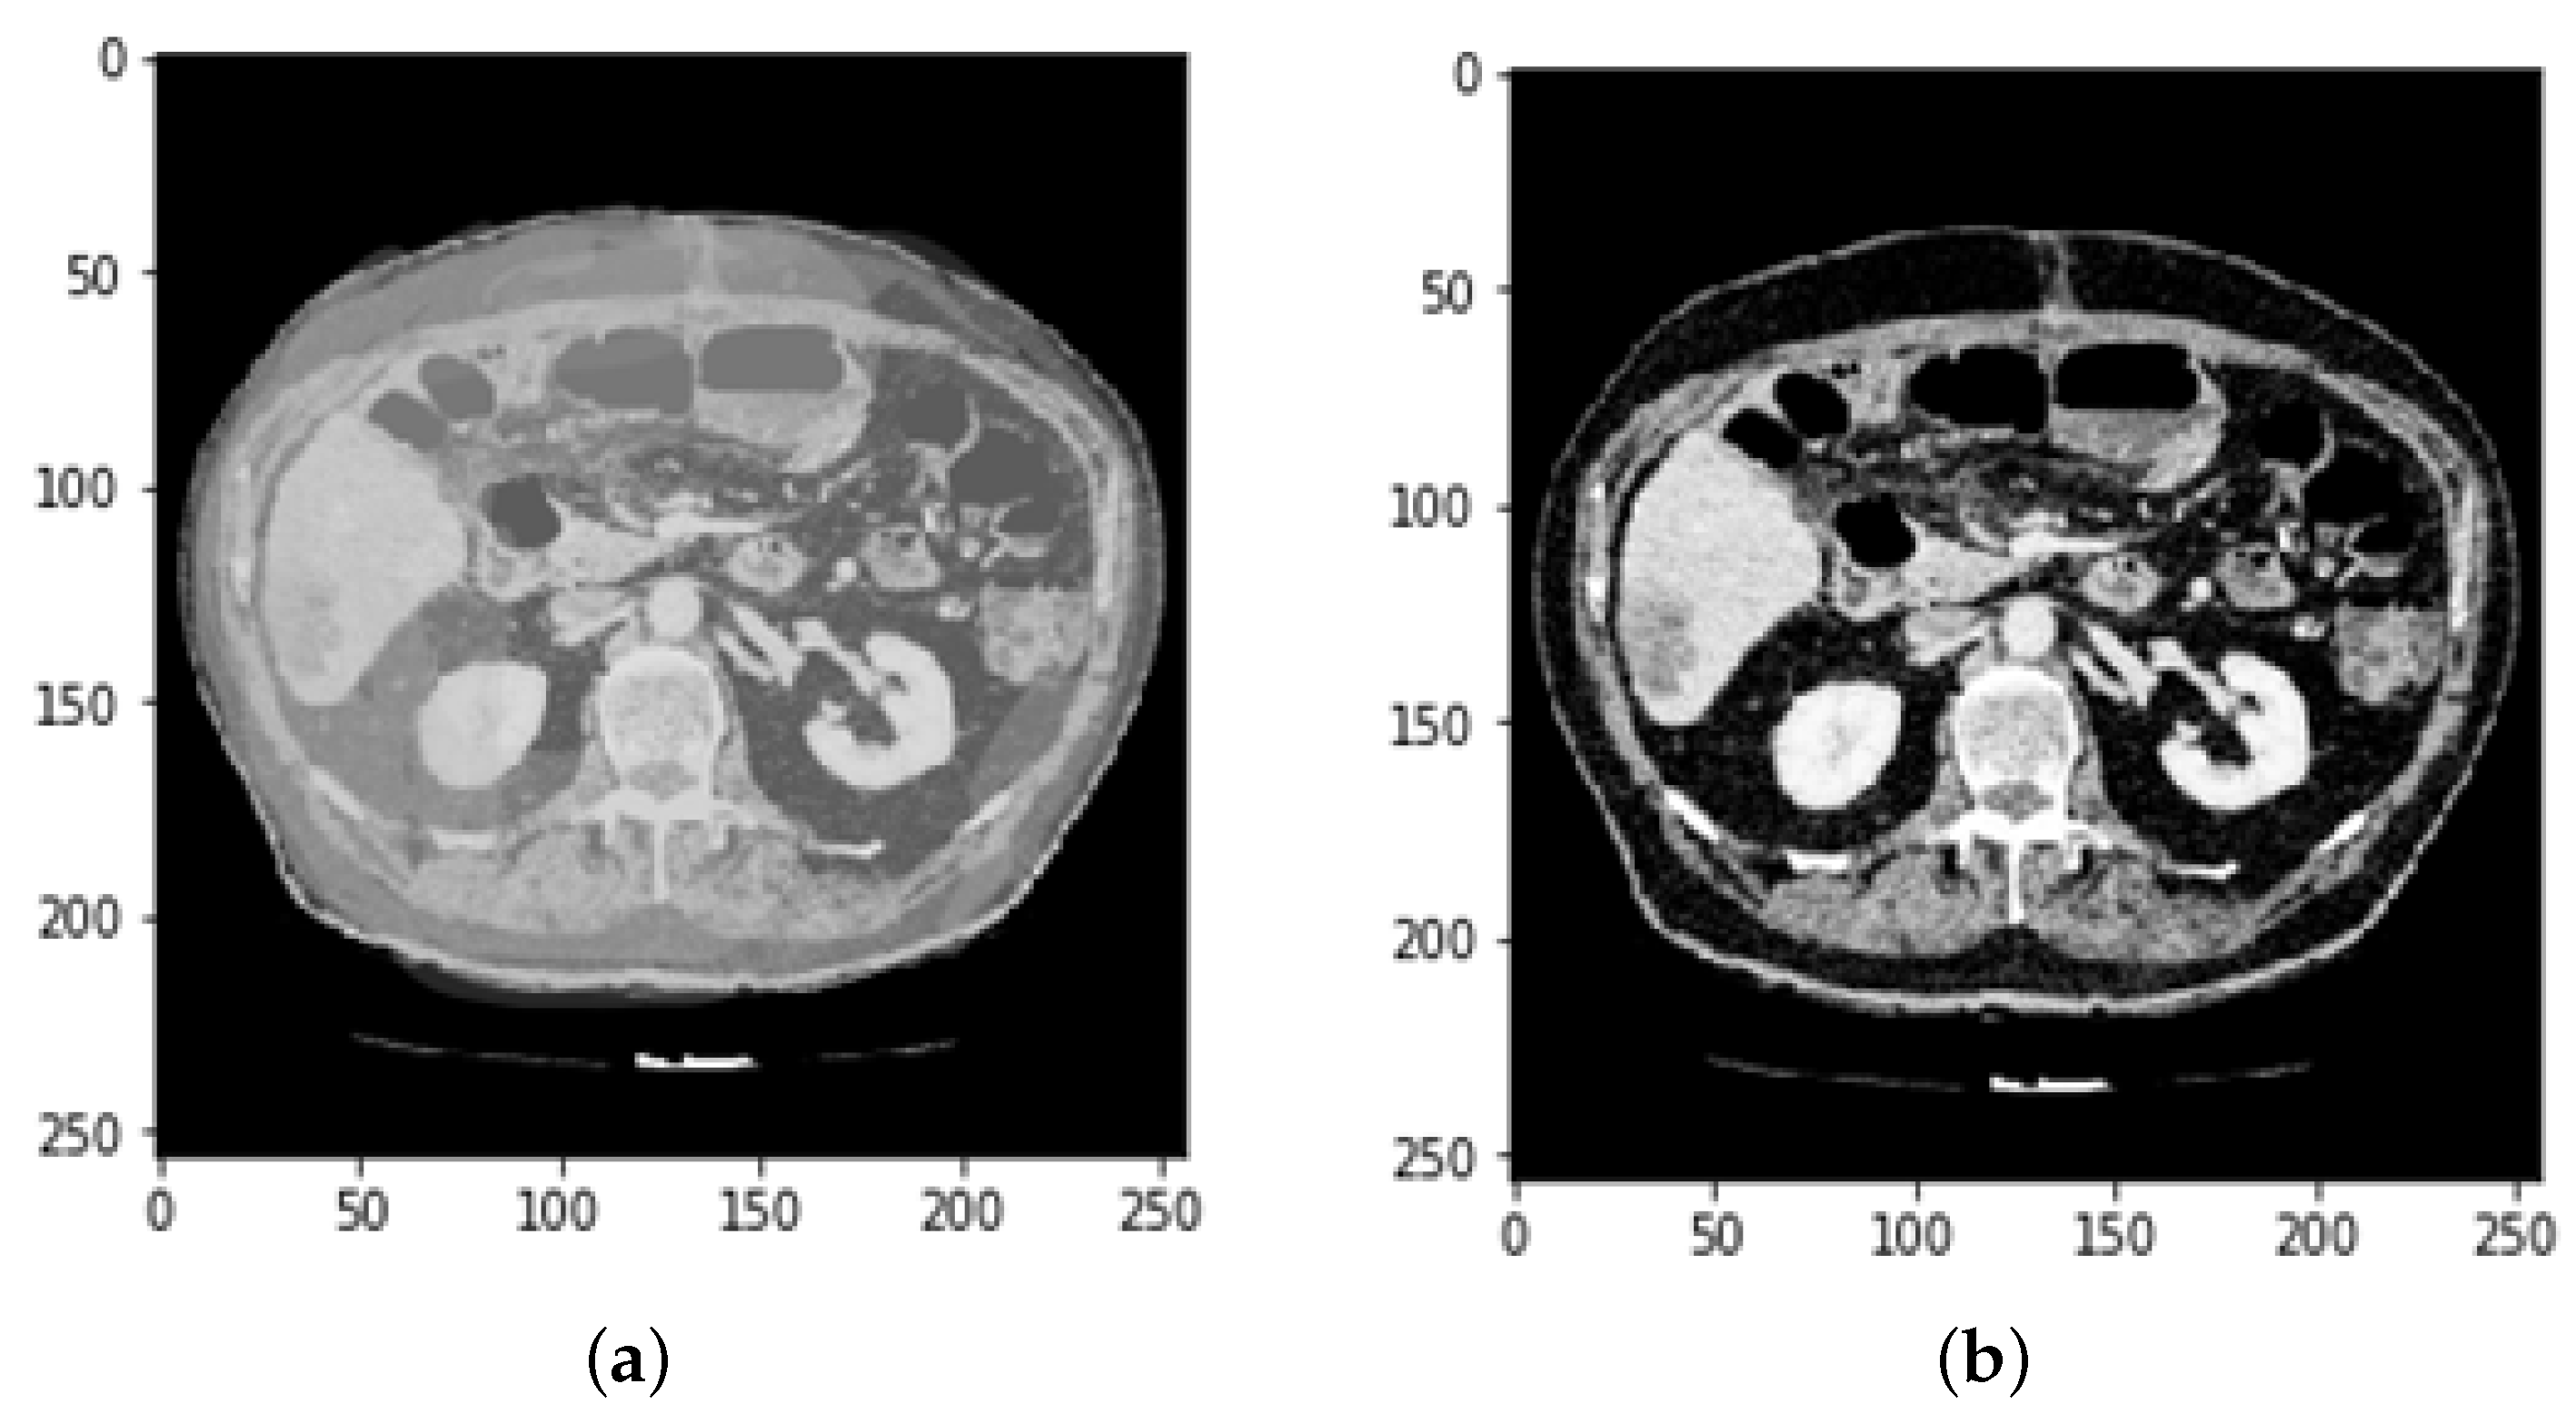
3.2. CT and MRI Images Preprocessing
3.3. Data Augmentation
3.3.1. Feature Extraction and Selection
3.3.2. Feature Selection and Merging
3.3.3. Reflection Image and Mask
3.3.4. Rotation image and mask
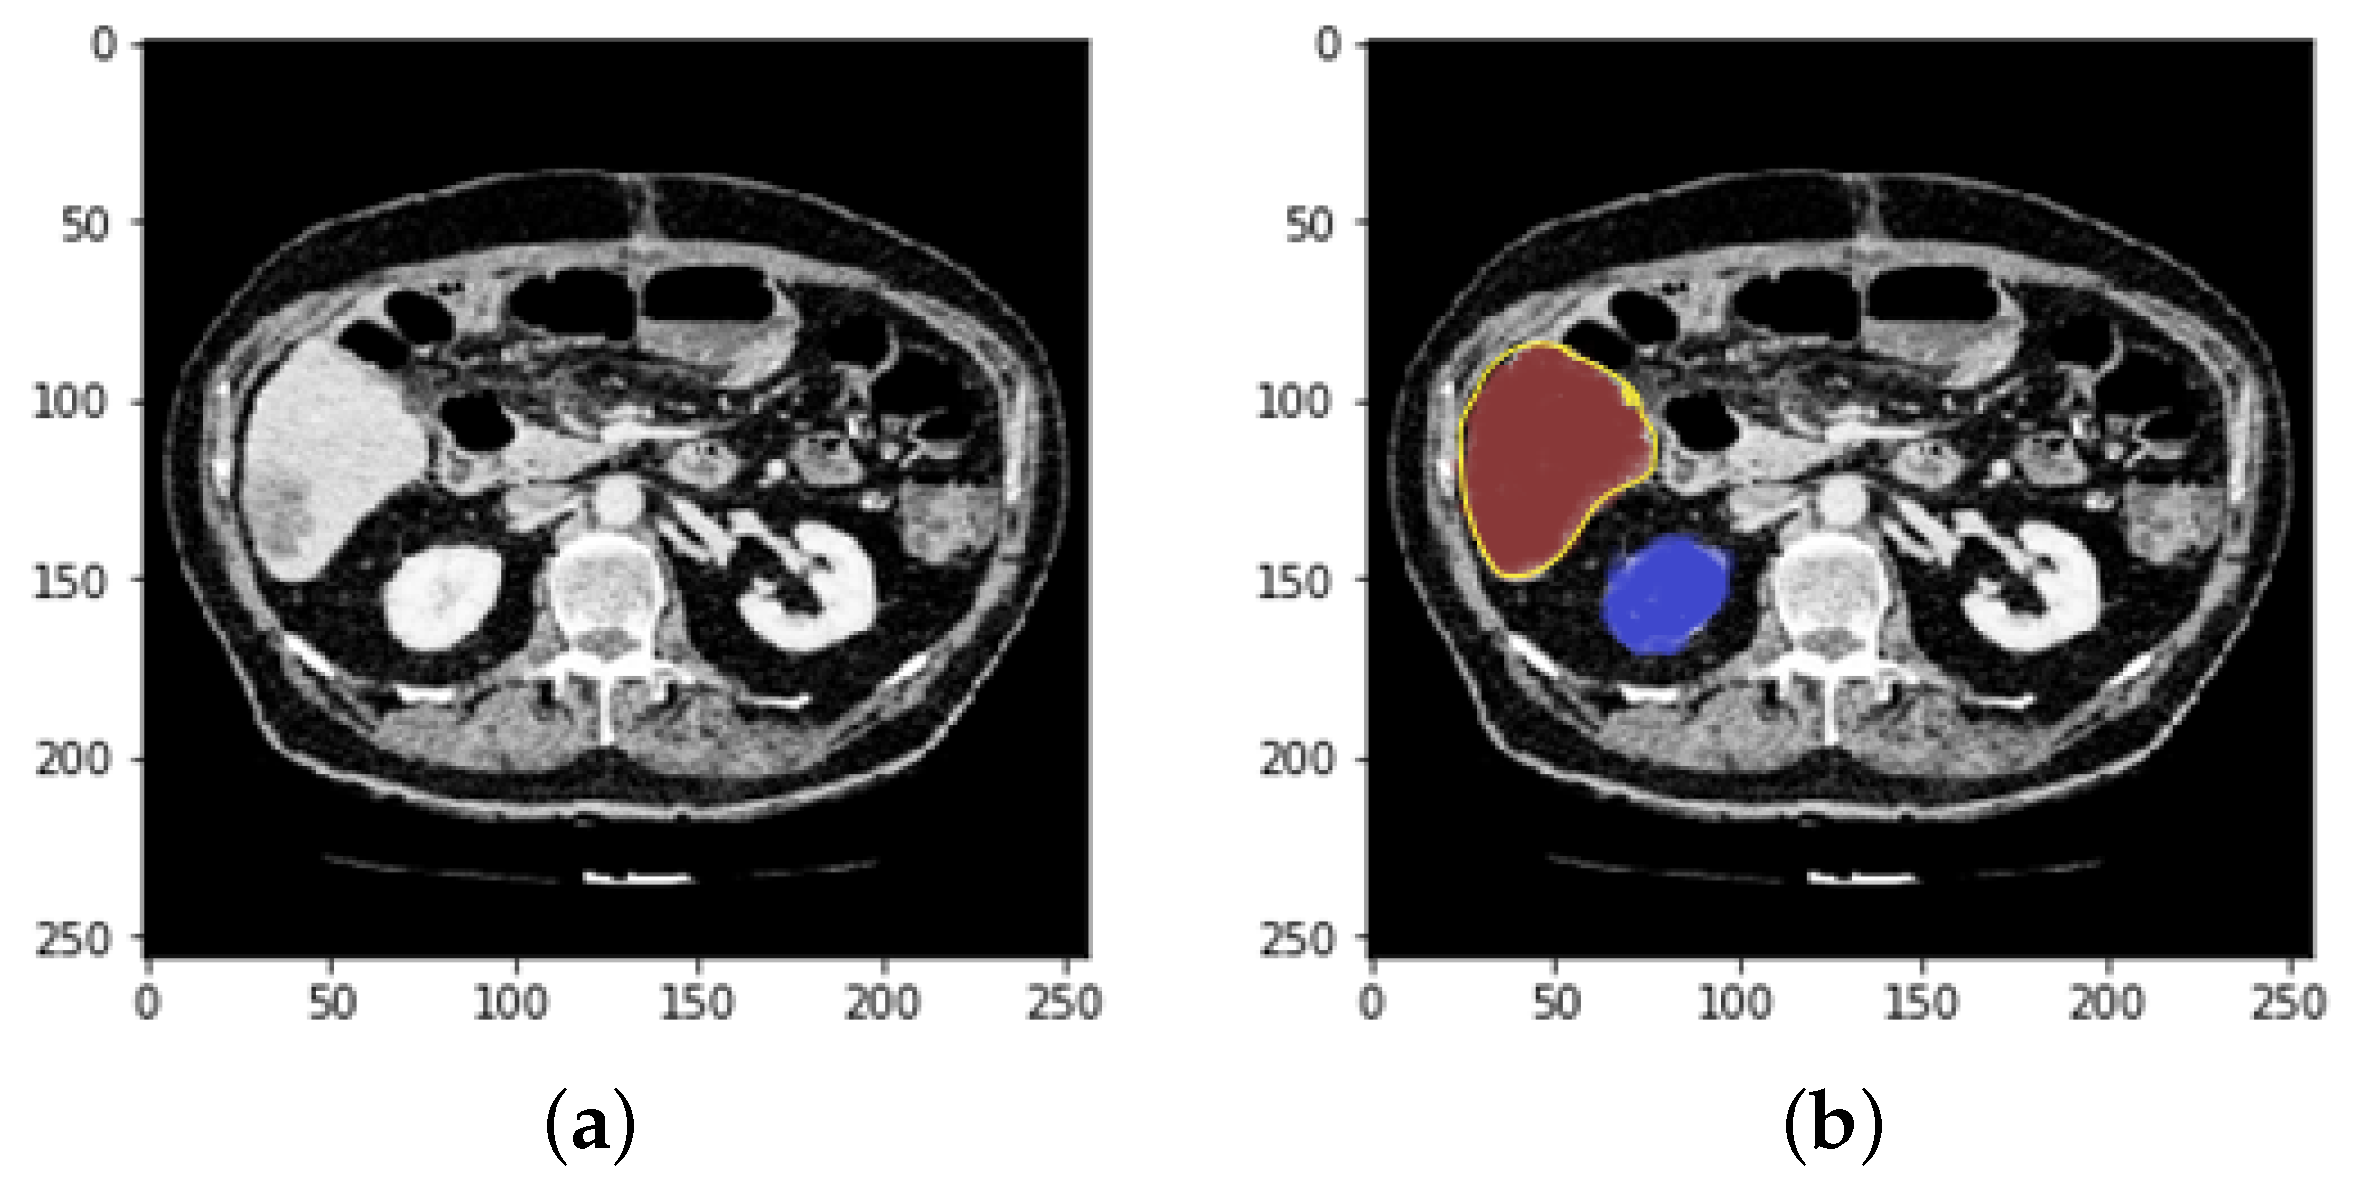
3.4. Defining Region of Interest (ROI)
4. Evaluation with ResUNeT
- Encoding route: converts the input into an accurate recognition.
- Decoding route: reverses the encoding and categorizes the representation pixel by pixel.
- Bridge processing: joins the two routes.
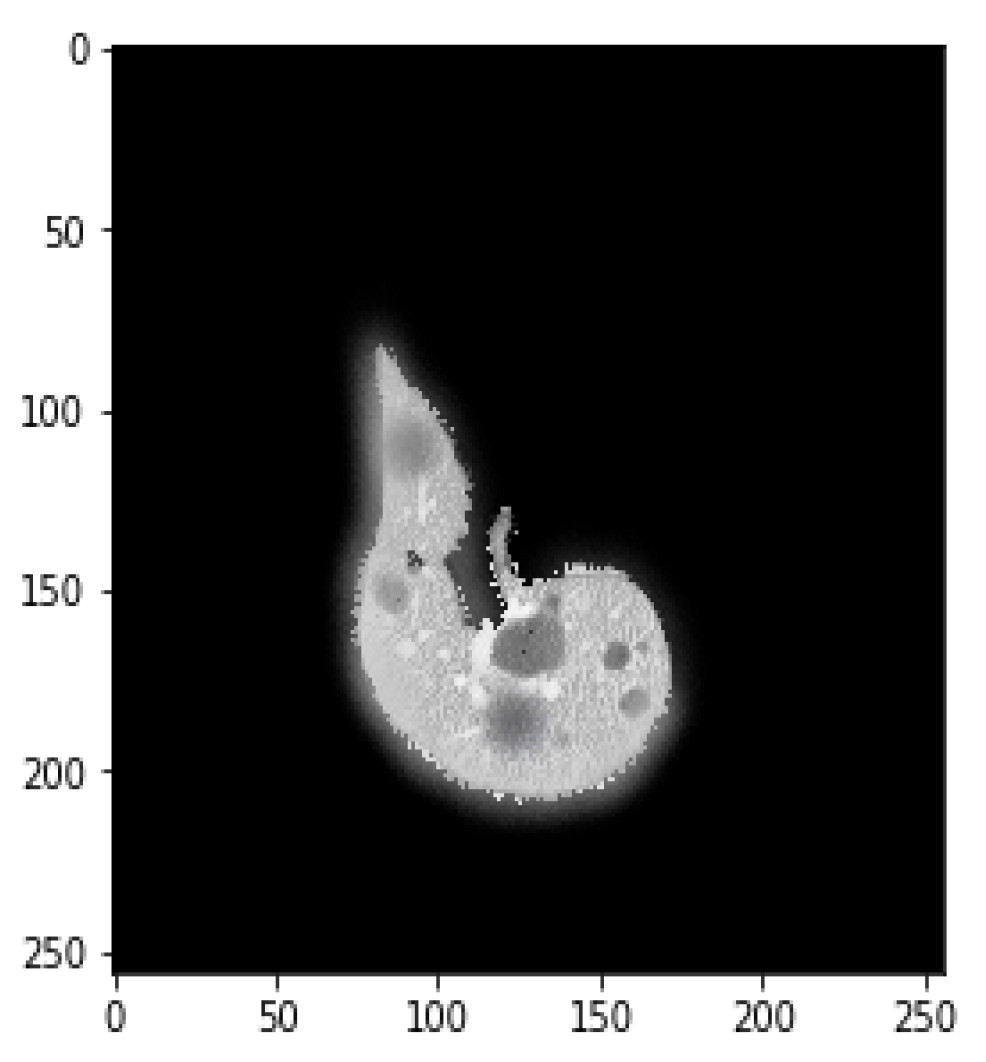
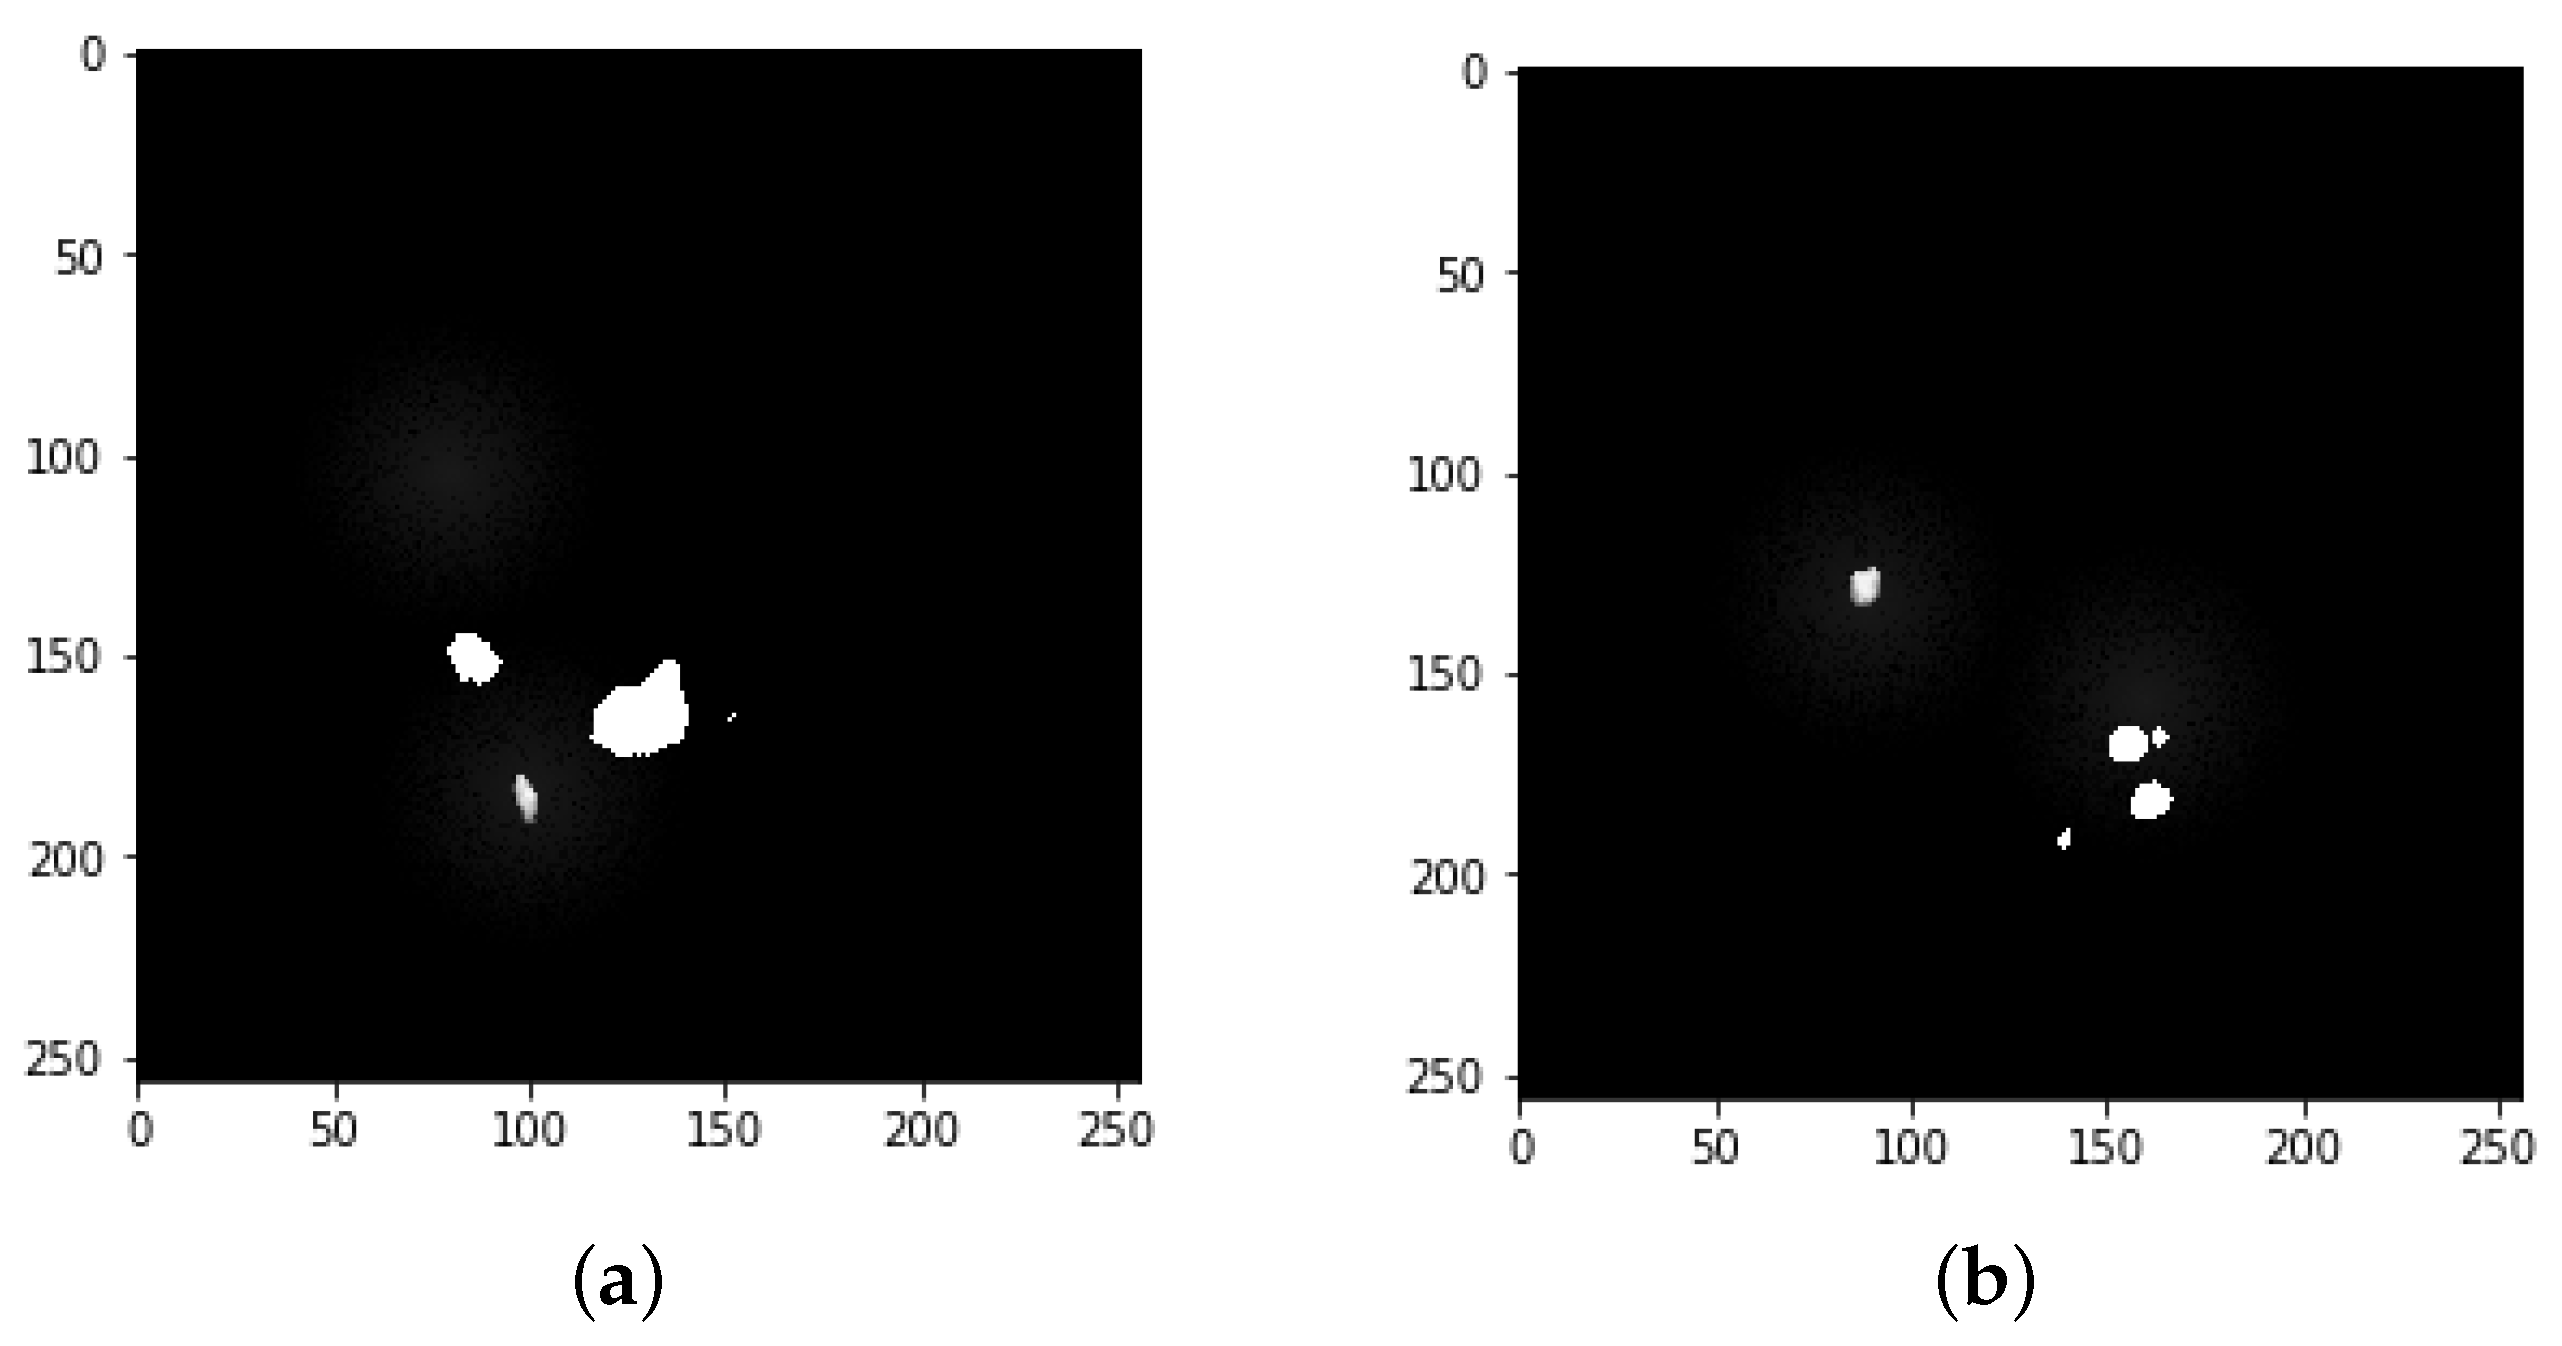
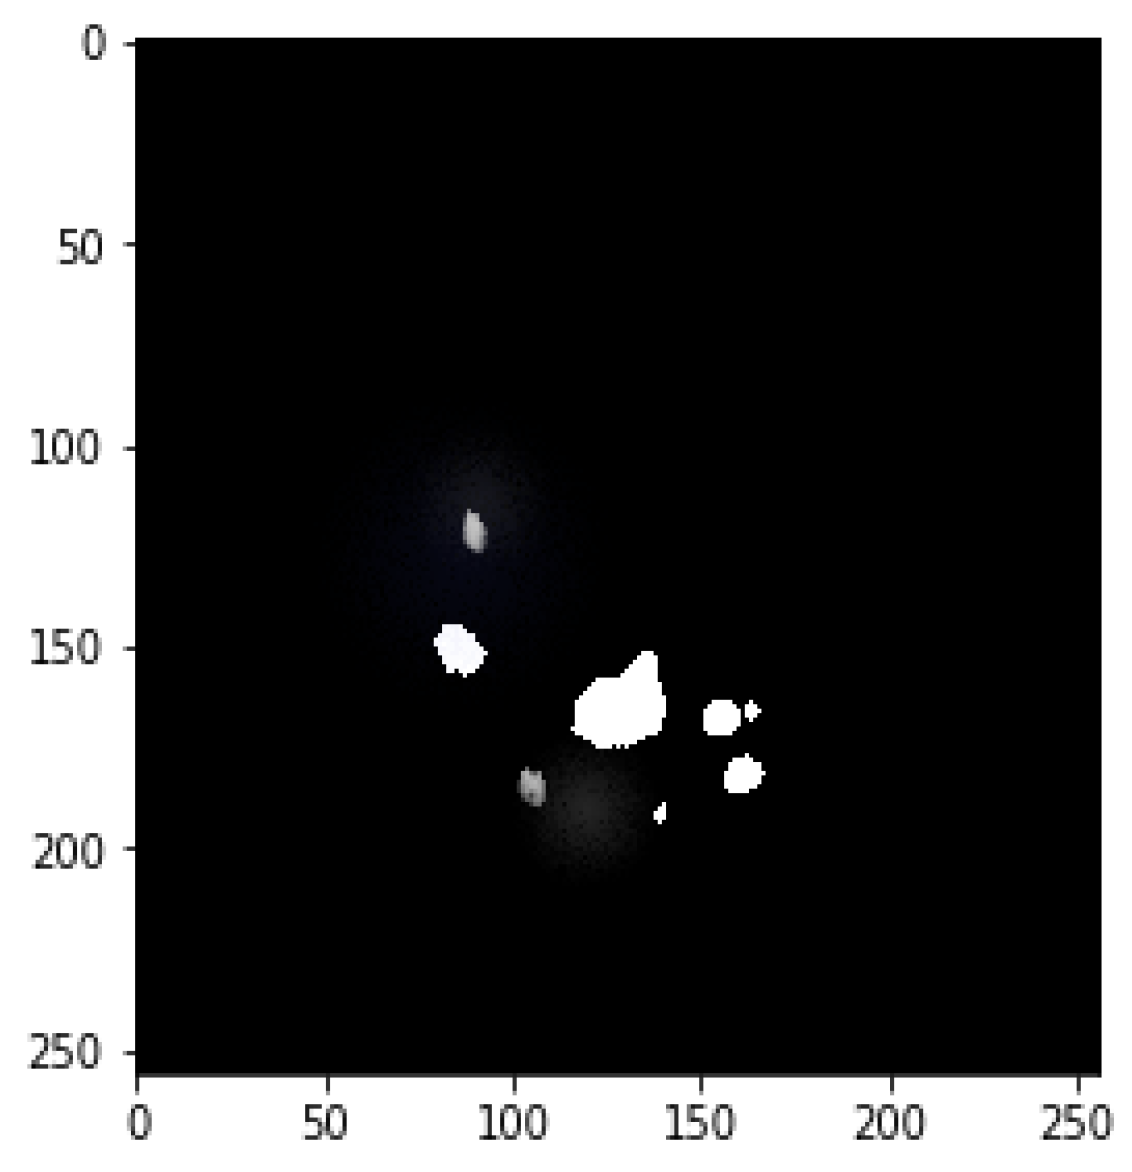
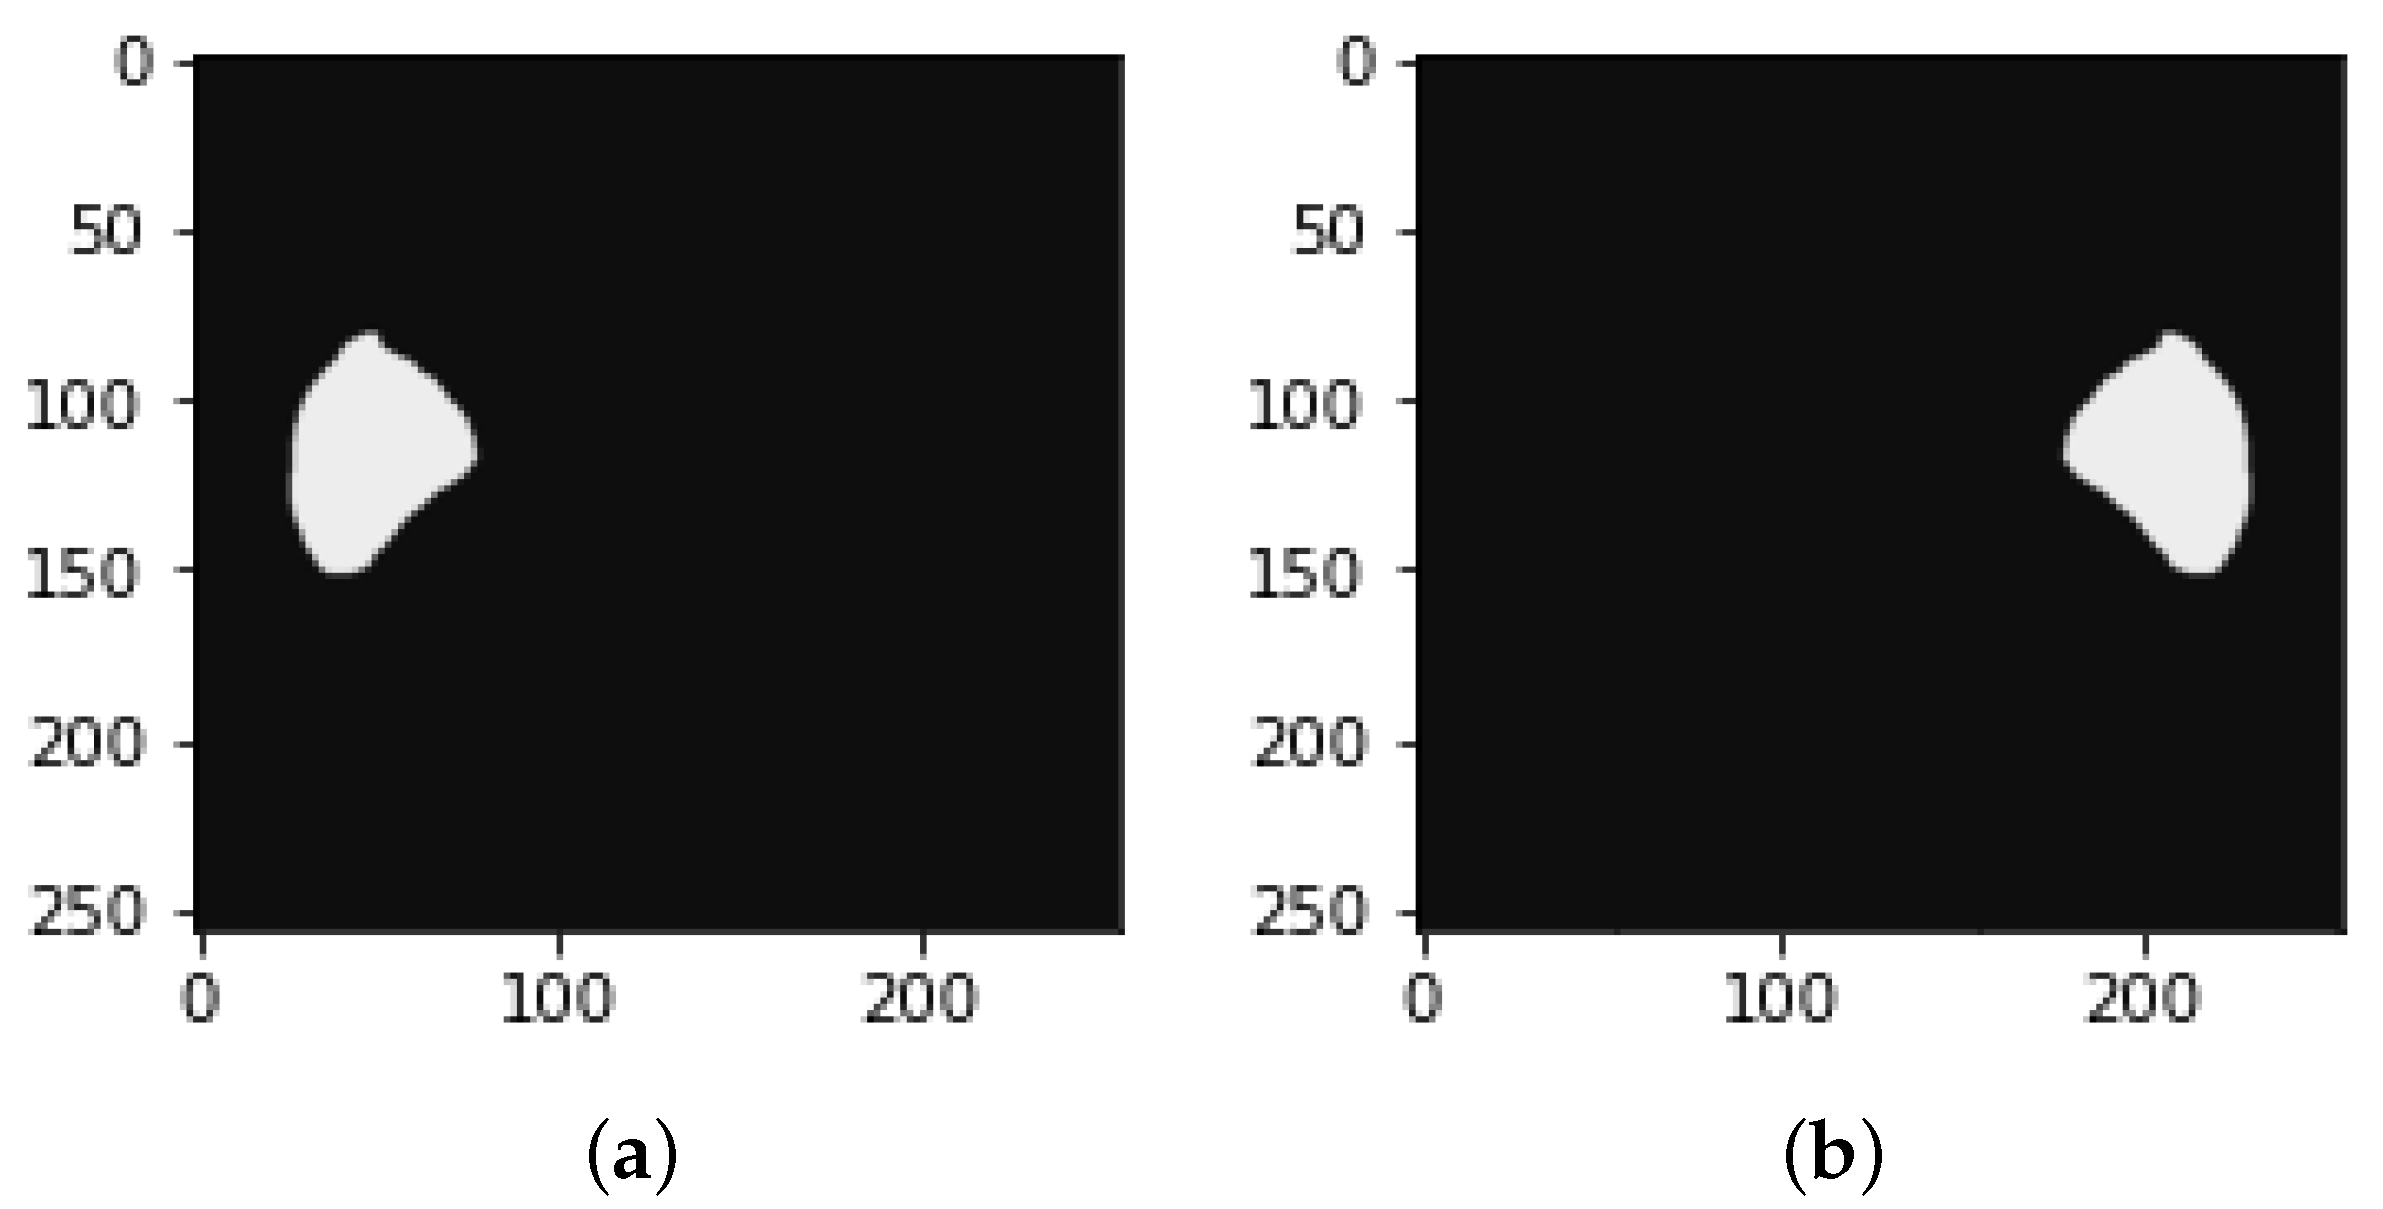
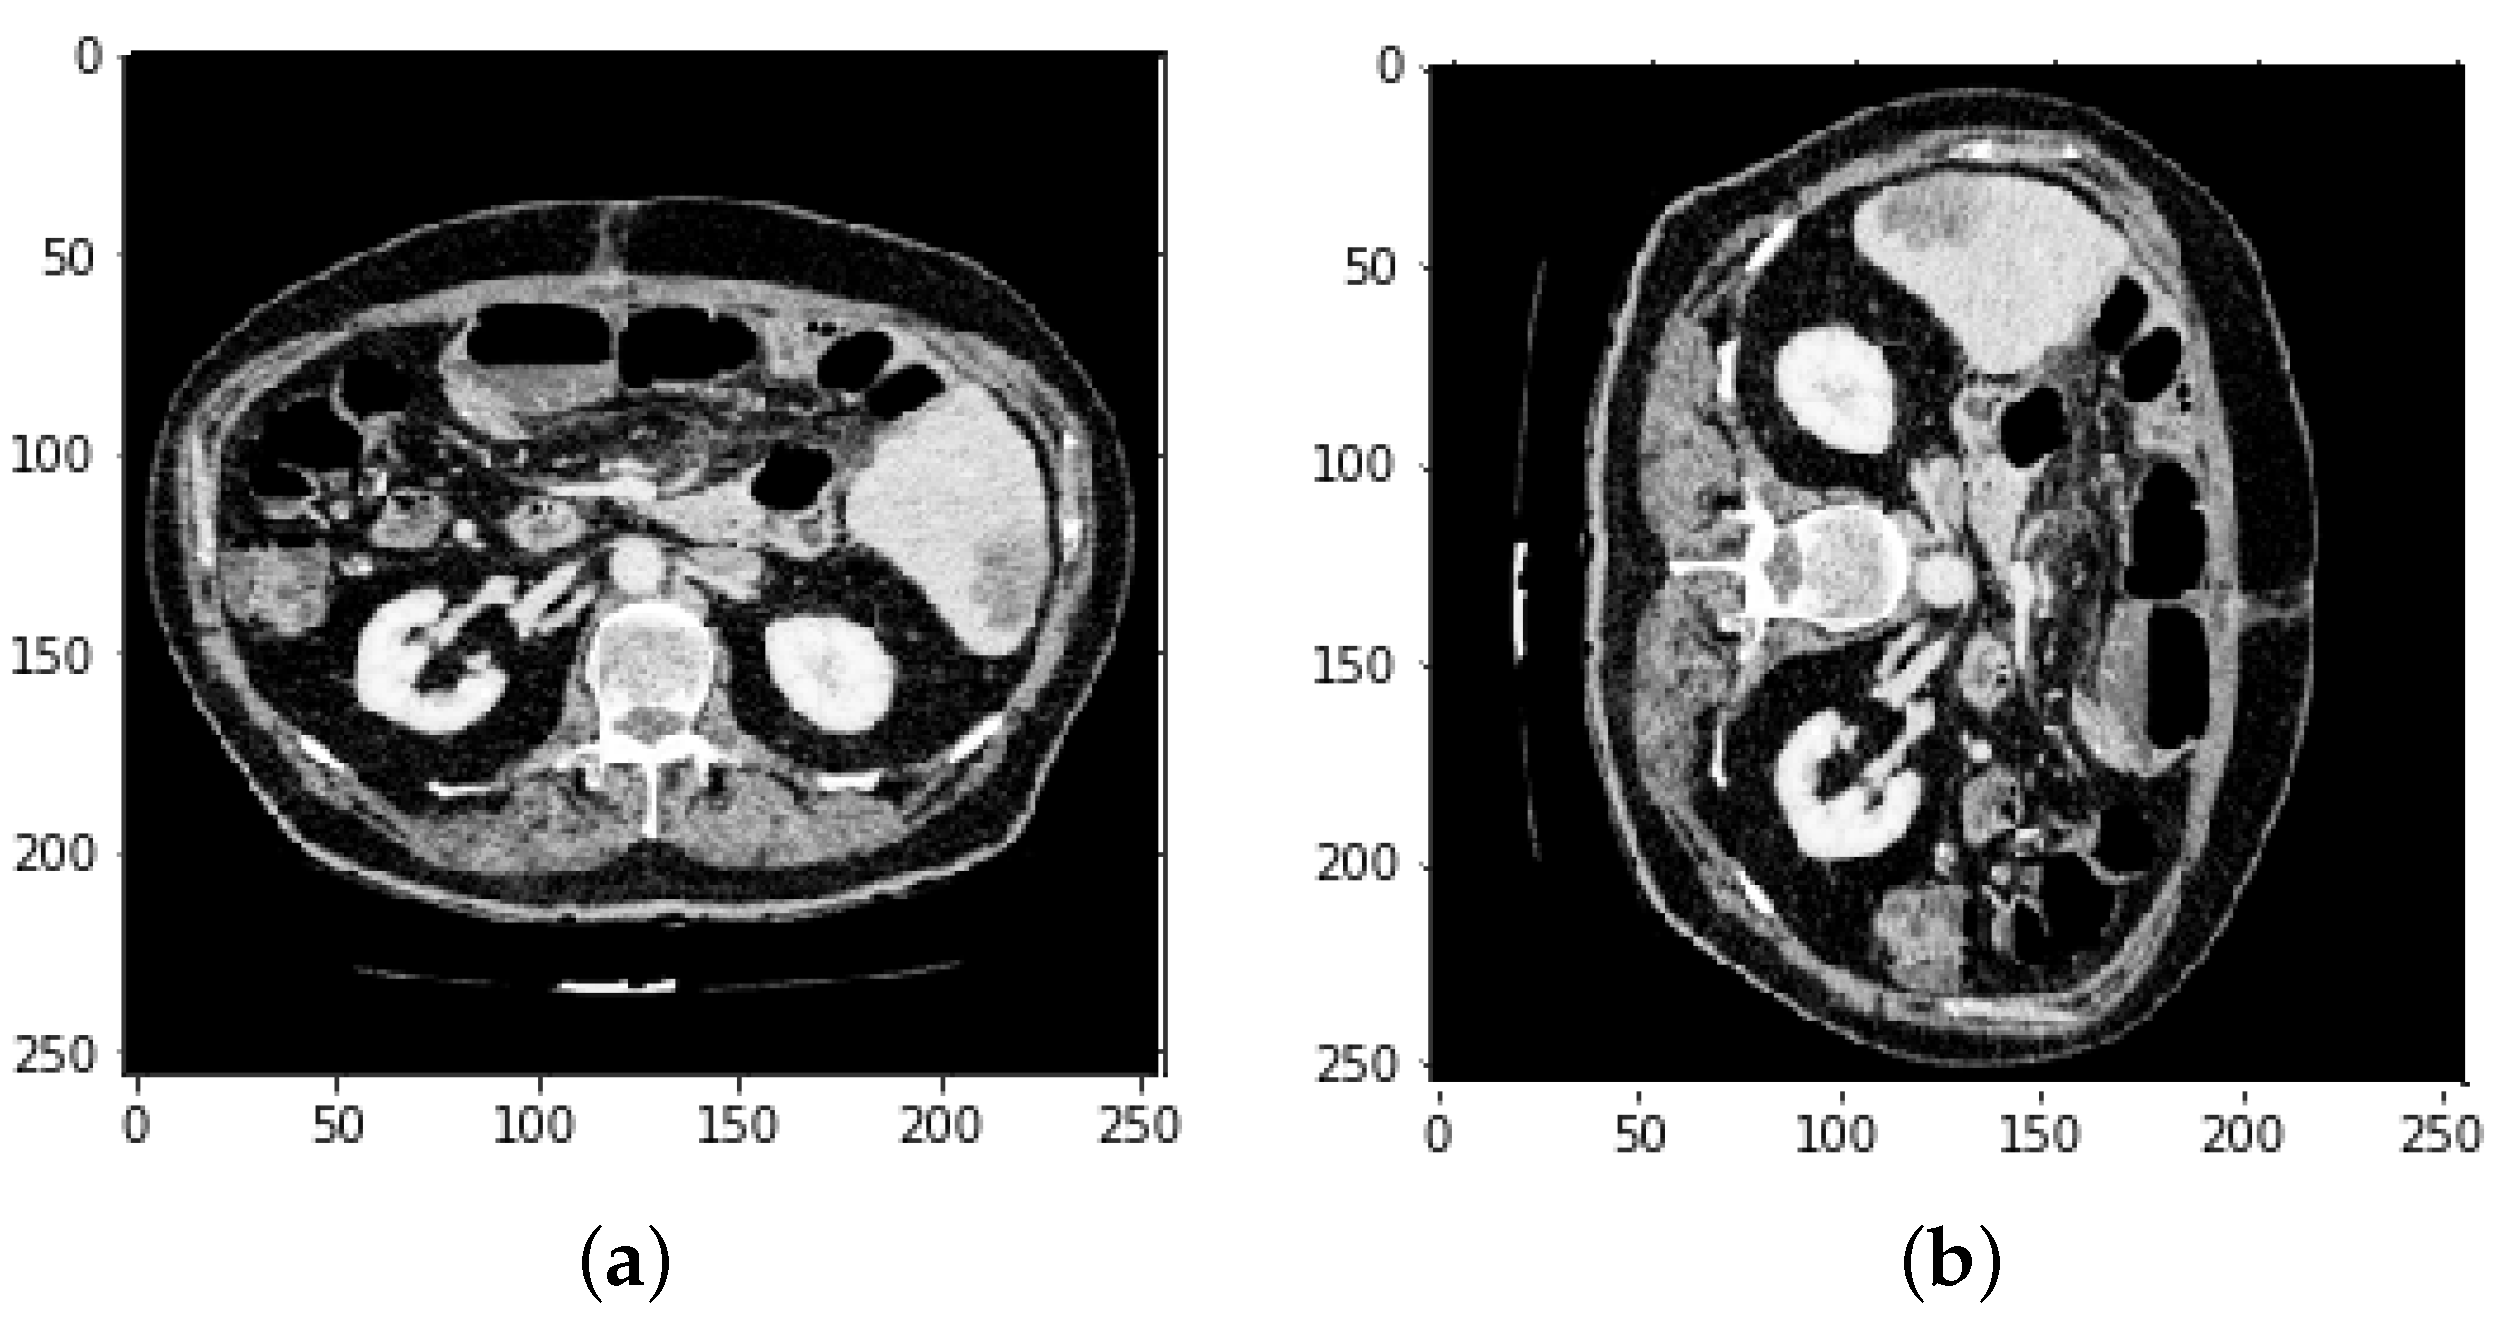
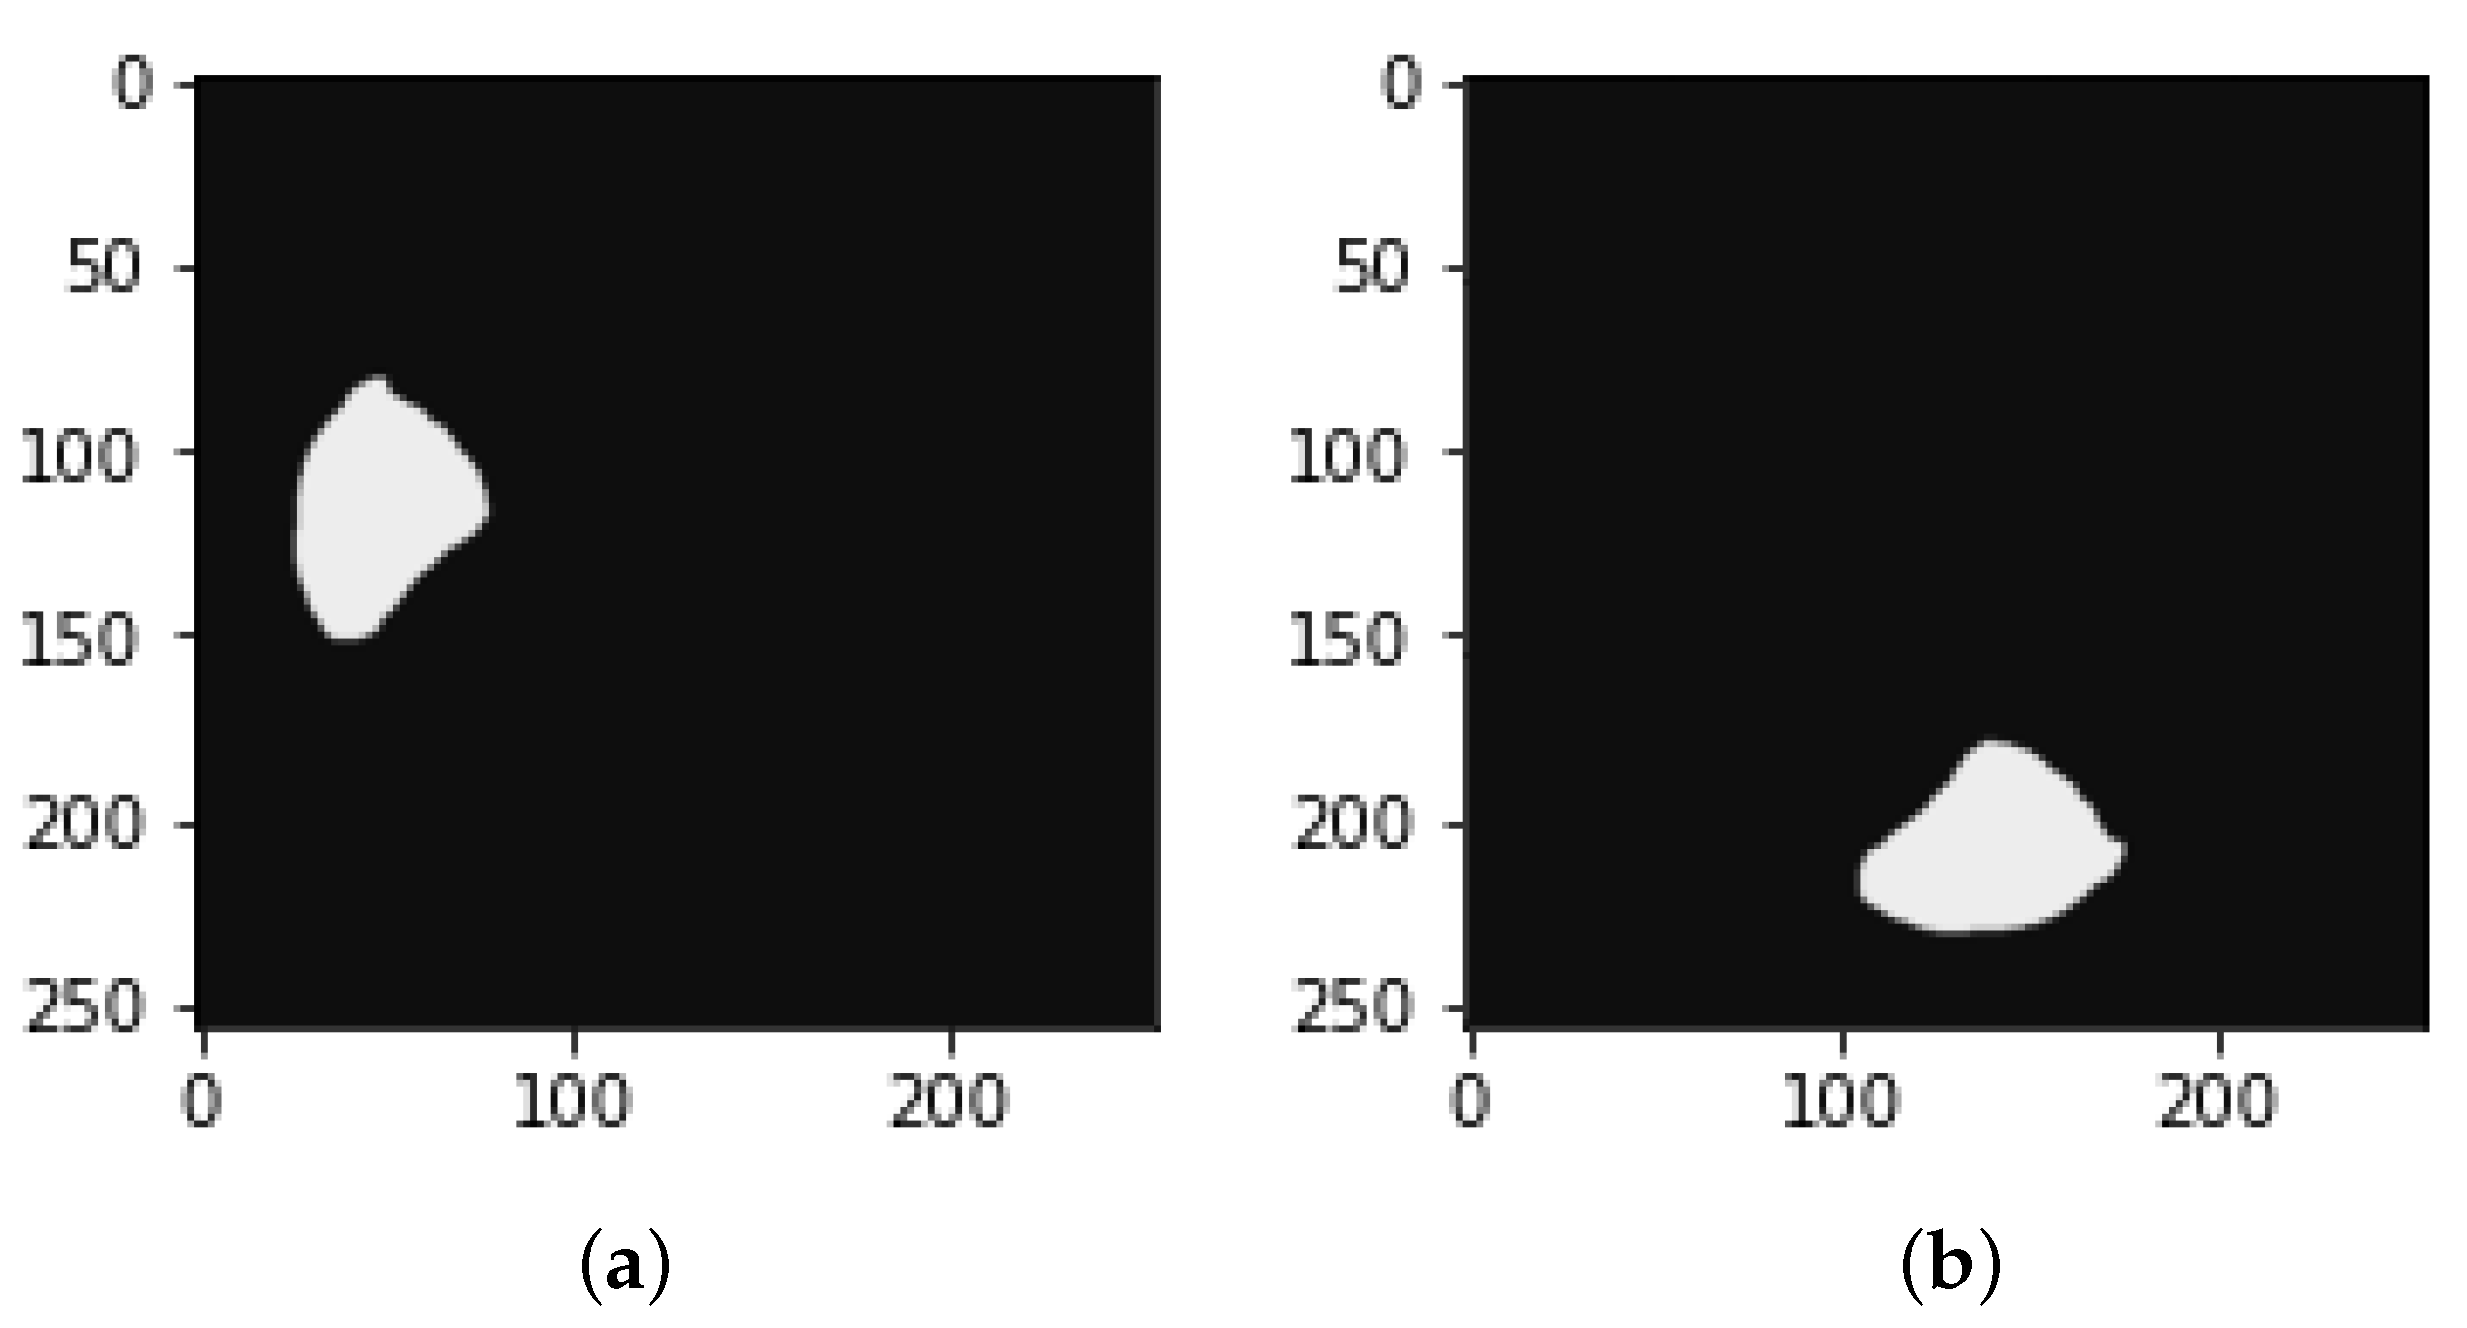
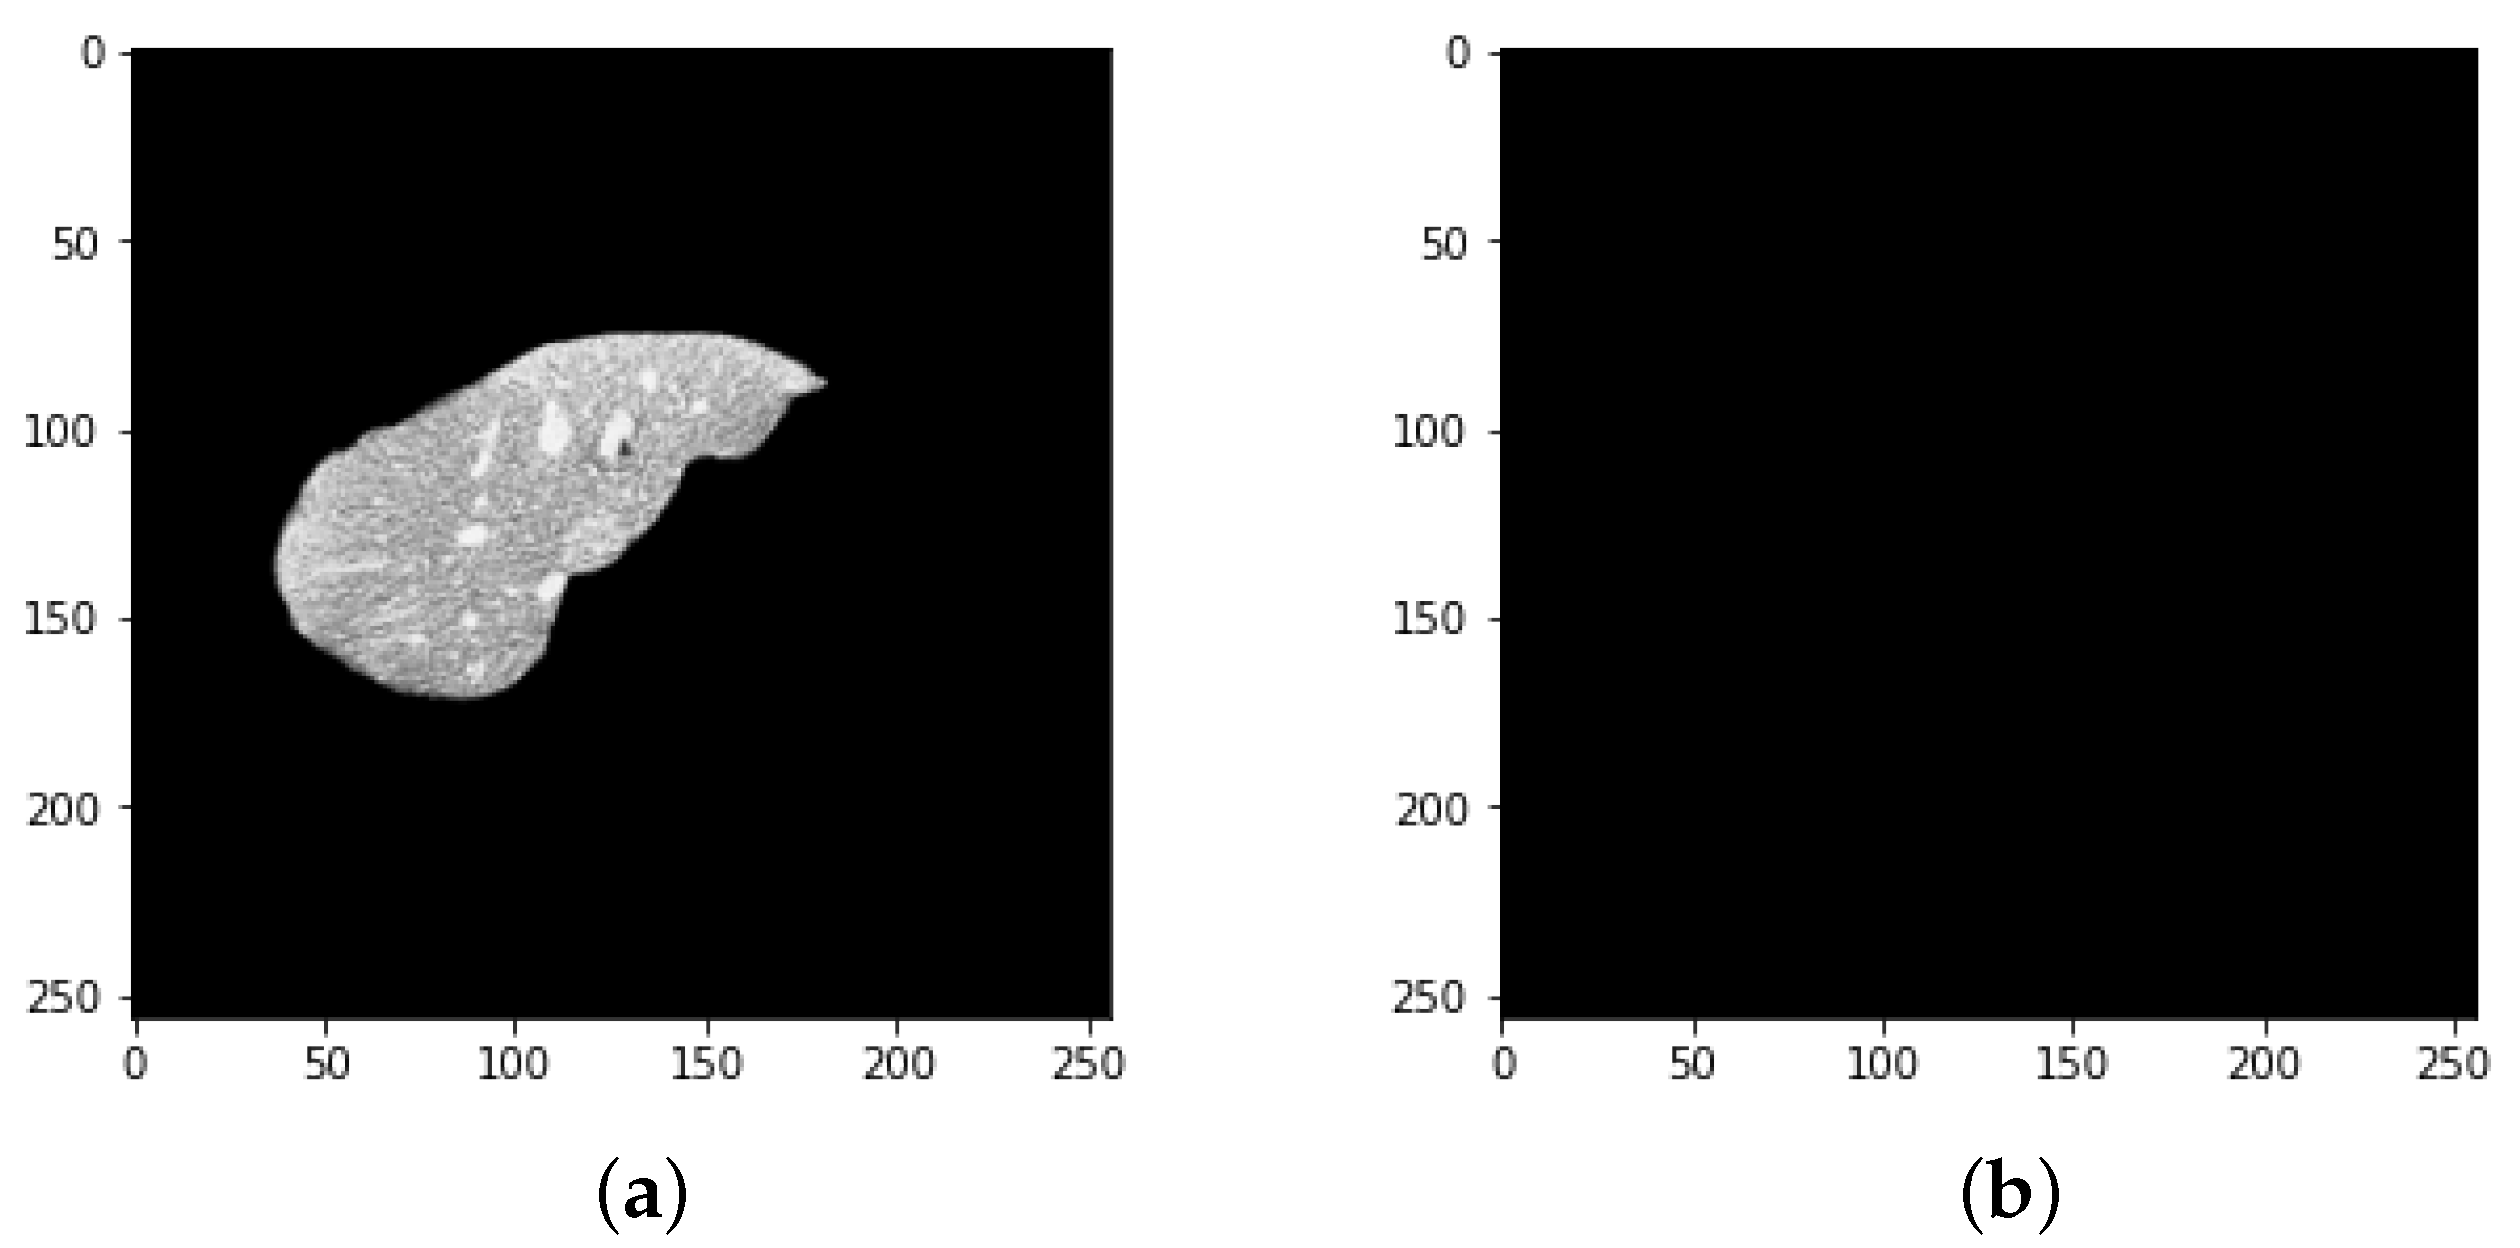
4.1. Segmentation Process of Liver and Liver Tumor
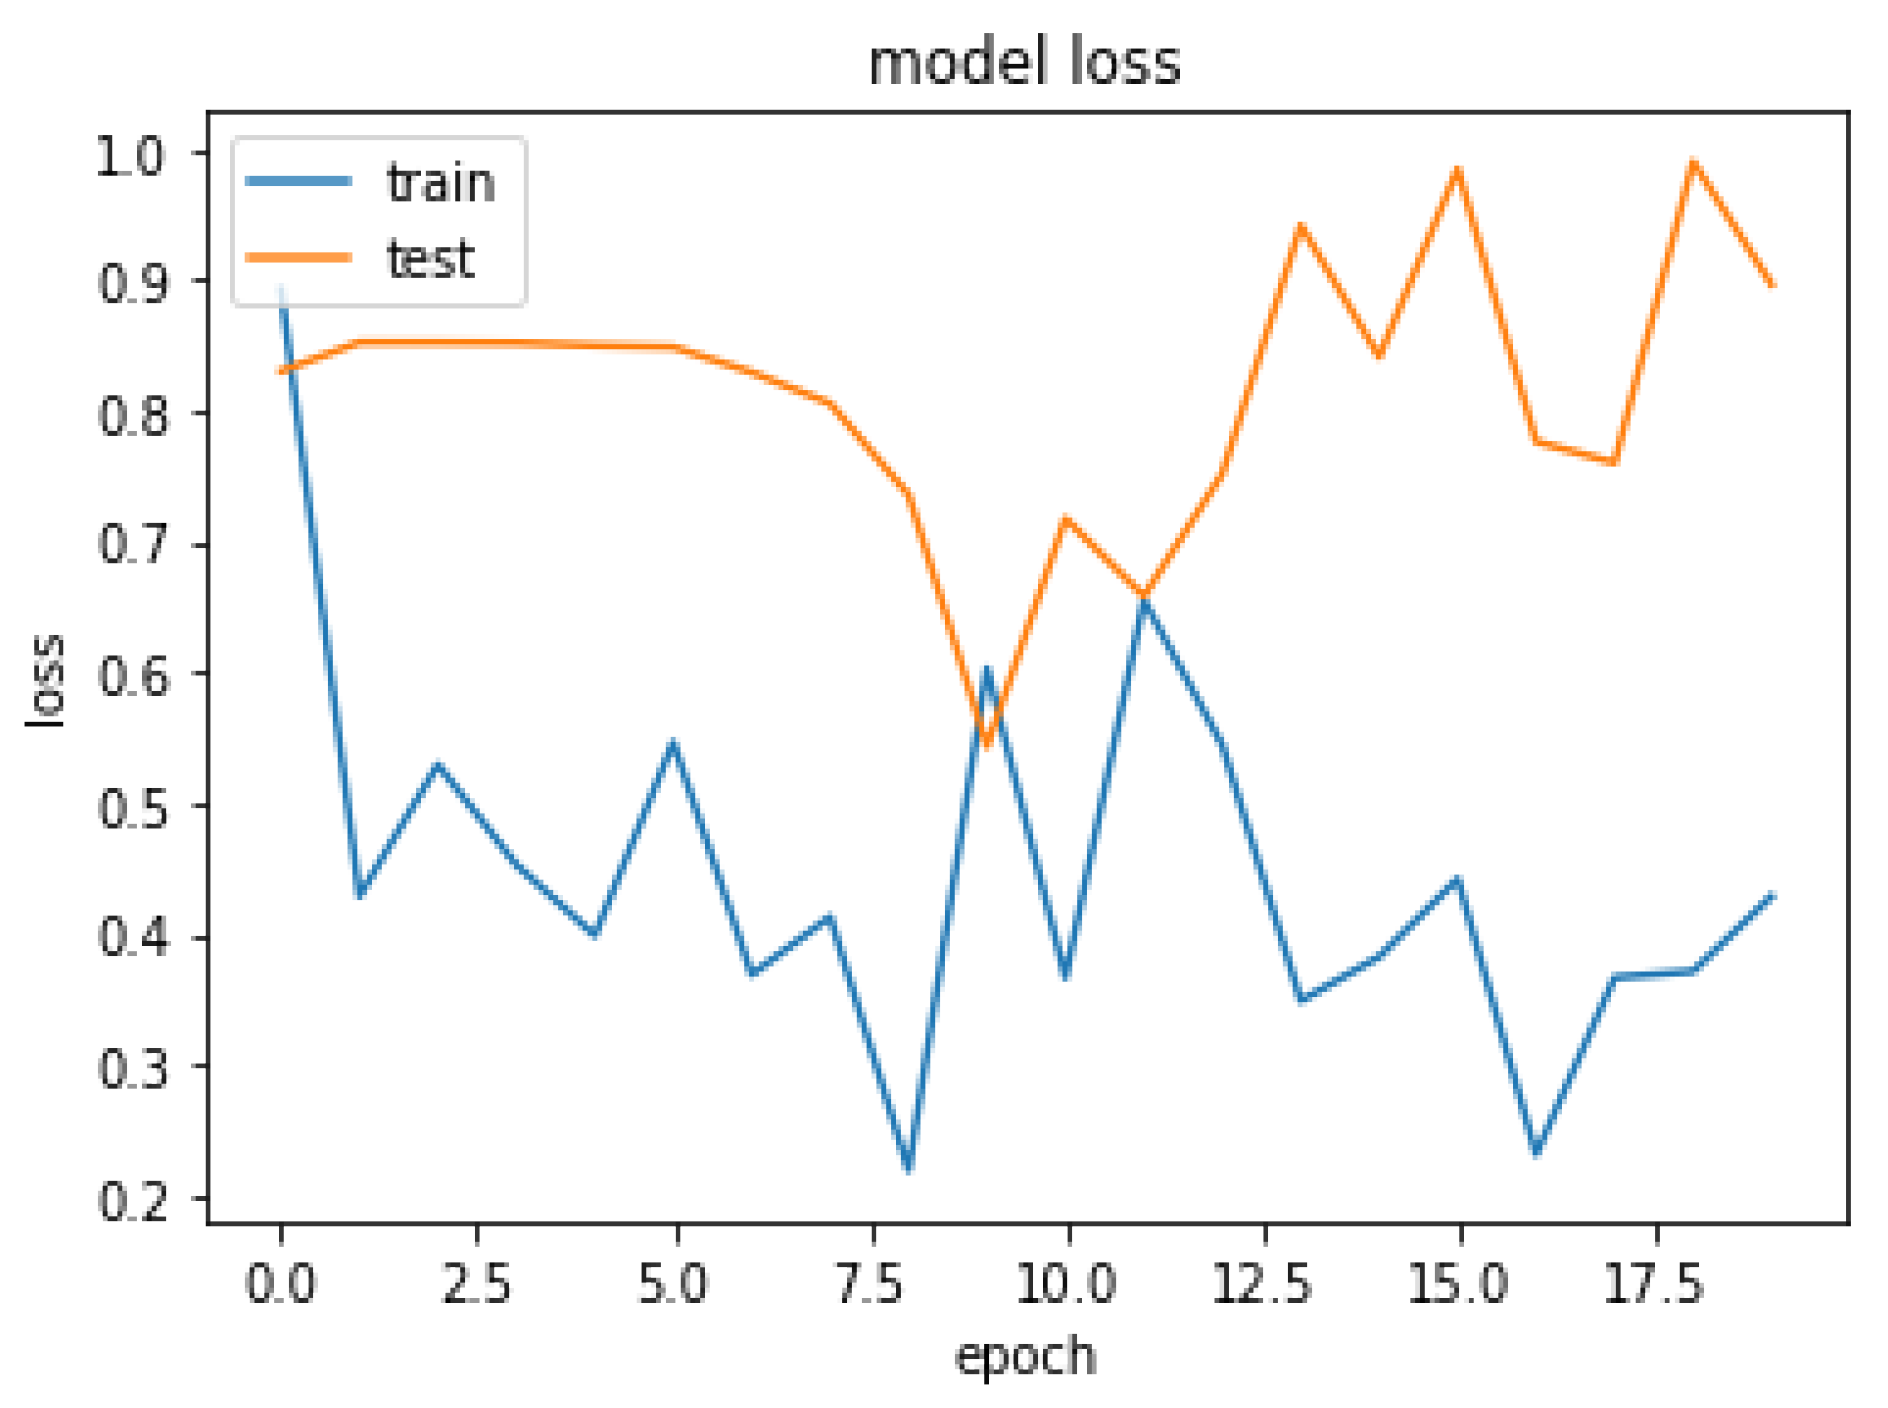
4.2. Final Results
5. Limitations of the Proposed Approach
6. Conclusions and Future Work
Author Contributions
Funding
Institutional Review Board Statement
Informed Consent Statement
Data Availability Statement
Conflicts of Interest
References
- World Health Organization. World Cancer Report. 2021. Available online: https://www.who.int/news-room/fact-sheets/detail/cancer (accessed on 25 January 2022).
- Key Statistics about Liver Cancer. 2022. Available online: https://www.cancer.org/cancer/liver-cancer/about/what-is-key-statistics.html#:~:text=The%20American%20Cancer%20Society’s%20estimates,will%20die%20of%20these%20cancers (accessed on 29 January 2022).
- Christ, P.F.; Elshaer, M.E.A.; Ettlinger, F.; Tatavarty, S.; Bickel, M.; Bilic, P.; Rempfler, M.; Armbruster, M.; Hofmann, F.; D’Anastasi, M.; et al. Automatic liver and lesion segmentation in CT using cascaded fully convolutional neural networks and 3D conditional random fields. In Proceedings of the Medical Image Computing and Computer-Assisted Intervention (MICCAI 2016), Athens, Greece, 17–21 October 2016; pp. 415–423. [Google Scholar] [CrossRef] [Green Version]
- Soler, L.; Delingette, H.; Malandain, G.; Montagnat, J.; Ayache, N.; Koehl, C.; Dourthe, O.; Malassagne, B.; Smith, M.; Mutter, D.; et al. Fully automatic anatomical, pathological, and functional segmentation from CT scans for hepatic surgery. Comput. Aided Surg. 2001, 6, 131–142. [Google Scholar] [CrossRef] [PubMed]
- Son, J.; Park, S.J.; Jung, K.H. Retinal vessel segmentation in fundoscopic images with generative adversarial networks. arXiv 2017, arXiv:1706.09318. [Google Scholar]
- Mharib, A.M.; Ramli, A.R.; Mashohor, S.; Mahmood, R.B. Survey on liver CT image segmentation methods. Artif. Intell. Rev. 2012, 37, 83–95. [Google Scholar] [CrossRef]
- Luo, S. Review on the methods of automatic liver segmentation from abdominal images. J. Comput. Commun. 2014, 2, 1. [Google Scholar] [CrossRef] [Green Version]
- Tariq, T.; Hassan, M.; Rahman, H.; Shah, A. Predictive Model for Lung Cancer Detection. LC Int. J. STEM 2020, 1, 61–74. [Google Scholar]
- Latif, J.; Xiao, C.; Imran, A.; Tu, S. Medical imaging using machine learning and deep learning algorithms: A review. In Proceedings of the 2019 2nd International Conference on Computing, Mathematics and Engineering Technologies (iCoMET), Sukkur, Pakistan, 30–31 January 2019; pp. 1–5. [Google Scholar]
- Imran, A.; Li, J.; Pei, Y.; Yang, J.J.; Wang, Q. Comparative analysis of vessel segmentation techniques in retinal images. IEEE Access 2019, 7, 114862–114887. [Google Scholar] [CrossRef]
- Tiferes, D.A.; D’Ippolito, G. Liver neoplasms: Imaging characterization. Radiol. Bras. 2008, 41, 119–127. [Google Scholar] [CrossRef] [Green Version]
- Bellver, M.; Maninis, K.K.; Pont-Tuset, J.; Giró-i Nieto, X.; Torres, J.; Van Gool, L. Detection-aided liver lesion segmentation using deep learning. arXiv 2017, arXiv:1711.11069. [Google Scholar]
- Kaluva, K.C.; Khened, M.; Kori, A.; Krishnamurthi, G. 2D-densely connected convolution neural networks for automatic liver and tumor segmentation. arXiv 2018, arXiv:1802.02182. [Google Scholar]
- Wen, Y.; Chen, L.; Deng, Y.; Zhou, C. Rethinking pre-training on medical imaging. J. Vis. Commun. Image Represent. 2021, 78, 103145. [Google Scholar] [CrossRef]
- Han, X. Automatic liver lesion segmentation using a deep convolutional neural network method. arXiv 2017, arXiv:1704.07239. [Google Scholar]
- Li, X.; Chen, H.; Qi, X.; Dou, Q.; Fu, C.W.; Heng, P.A. H-DenseUNet: Hybrid densely connected UNet for liver and tumor segmentation from CT volumes. IEEE Trans. Med. Imaging 2018, 37, 2663–2674. [Google Scholar] [CrossRef] [PubMed] [Green Version]
- Meraj, T.; Rauf, H.T.; Zahoor, S.; Hassan, A.; Lali, M.I.; Ali, L.; Bukhari, S.A.C.; Shoaib, U. Lung nodules detection using semantic segmentation and classification with optimal features. Neural Comput. Appl. 2021, 33, 10737–10750. [Google Scholar] [CrossRef]
- Yang, D.; Xu, D.; Zhou, S.K.; Georgescu, B.; Chen, M.; Grbic, S.; Metaxas, D.; Comaniciu, D. Automatic liver segmentation using an adversarial image-to-image network. In Proceedings of the International Conference on Medical Image Computing and Computer-Assisted Intervention, Quebec City, QC, Canada, 11–13 September 2017; pp. 507–515. [Google Scholar]
- Shafaey, M.A.; Salem, M.A.M.; Ebied, H.M.; Al-Berry, M.N.; Tolba, M.F. Deep learning for satellite image classification. In Proceedings of the International Conference on Advanced Intelligent Systems and Informatics, Cairo, Egypt, 1–3 September 2018; pp. 383–391. [Google Scholar]
- Chlebus, G.; Meine, H.; Moltz, J.H.; Schenk, A. Neural network-based automatic liver tumor segmentation with random forest-based candidate filtering. arXiv 2017, arXiv:1706.00842. [Google Scholar]
- Ke, Q.; Zhang, J.; Wei, W.; Damaševičius, R.; Woźniak, M. Adaptive independent subspace analysis of brain magnetic resonance imaging data. IEEE Access 2019, 7, 12252–12261. [Google Scholar] [CrossRef]
- Pan, F.; Huang, Q.; Li, X. Classification of liver tumors with CEUS based on 3D-CNN. In Proceedings of the 2019 IEEE 4th International Conference on Advanced Robotics and Mechatronics (ICARM), Toyonaka, Japan, 3–5 July 2019; pp. 845–849. [Google Scholar]
- Yasaka, K.; Akai, H.; Abe, O.; Kiryu, S. Deep learning with convolutional neural network for differentiation of liver masses at dynamic contrast-enhanced CT: A preliminary study. Radiology 2018, 286, 887–896. [Google Scholar] [CrossRef] [PubMed] [Green Version]
- Wen, Y.; Chen, L.; Deng, Y.; Ning, J.; Zhou, C. Towards better semantic consistency of 2D medical image segmentation. J. Vis. Commun. Image Represent. 2021, 80, 103311. [Google Scholar] [CrossRef]
- Goshtasby, A.; Satter, M. An adaptive window mechanism for image smoothing. Comput. Vis. Image Underst. 2008, 111, 155–169. [Google Scholar] [CrossRef]
- El-Regaily, S.A.; Salem, M.A.M.; Aziz, M.H.A.; Roushdy, M.I. Multi-view Convolutional Neural Network for lung nodule false positive reduction. Expert Syst. Appl. 2020, 162, 113017. [Google Scholar] [CrossRef]
- Mahjoub, M.A. Automatic liver segmentation method in CT images. arXiv 2012, arXiv:1204.1634. [Google Scholar]
- Kota, N.S.; Reddy, G.U. Fusion based Gaussian noise removal in the images using curvelets and wavelets with Gaussian filter. Int. J. Image Process. 2011, 5, 456–468. [Google Scholar]
- Bama, S.; Selvathi, D. Despeckling of medical ultrasound kidney images in the curvelet domain using diffusion filtering and MAP estimation. Signal Process. 2014, 103, 230–241. [Google Scholar] [CrossRef]
- Despotović, I.; Goossens, B.; Philips, W. MRI segmentation of the human brain: Challenges, methods, and applications. Comput. Math. Methods Med. 2015, 2015, 450341. [Google Scholar] [CrossRef] [PubMed] [Green Version]
- Pham, D.L.; Xu, C.; Prince, J.L. Current methods in medical image segmentation. Annu. Rev. Biomed. Eng. 2000, 2, 315–337. [Google Scholar] [CrossRef] [PubMed]
- Salem, M.A.M.; Atef, A.; Salah, A.; Shams, M. Recent survey on medical image segmentation. In Handbook of Research on Machine Learning Innovations and Trends; IGI Global: Hershey, PA, USA, 2017; pp. 424–464. [Google Scholar]
- Horn, Z.; Auret, L.; McCoy, J.; Aldrich, C.; Herbst, B. Performance of convolutional neural networks for feature extraction in froth flotation sensing. IFAC-PapersOnLine 2017, 50, 13–18. [Google Scholar] [CrossRef]
- Leondes, C.T. Medical Imaging Systems Technology—Analysis and Computational Methods; World Scientific: Singapore, 2005; Volume 1. [Google Scholar]
- Wang, D.; Hu, G.; Lyu, C. Multi-path connected network for medical image segmentation. J. Vis. Commun. Image Represent. 2020, 71, 102852. [Google Scholar] [CrossRef]
- Gadkari, D. Image Quality Analysis Using GLCM. Master’s Thesis, University of Central Florida, Orlando, FL, USA, 2004. [Google Scholar]
- Li, W.; Jia, F.; Hu, Q. Automatic Segmentation of Liver Tumor in CT Images with Deep Convolutional Neural Networks. J. Comput. Commun. 2015, 3, 720–726. [Google Scholar] [CrossRef] [Green Version]
- Pohle, R.; Toennies, K.D. Segmentation of medical images using adaptive region growing. In Proceedings of the Medical Imaging 2001, San Jose, CA, USA, 21–22 February 2001; Volume 4322, pp. 1337–1346. [Google Scholar] [CrossRef] [Green Version]
- Da, O.; Rq, F.; Mm, C. Segmentation of liver, its vessels and lesions from CT images for surgical planning. Biomed. Eng. Online 2011, 10, 30. [Google Scholar] [CrossRef] [Green Version]
- Oliveira, D.A.B.; Feitosa, R.Q.; Correia, M.M. Liver segmentation using level sets and genetic algorithms. In Proceedings of the Fourth International Conference on Computer Vision Theory and Applications, Lisboa, Portugal, 5–8 February 2009; pp. 154–159. [Google Scholar] [CrossRef]
- Yang, H.; Wang, Y.; Yang, J.; Liu, Y. A novel graph cuts based liver segmentation method. In Proceedings of the 2010 International Conference of Medical Image Analysis and Clinical Application, Guangzhou, China, 10–13 June 2010; pp. 50–53. [Google Scholar] [CrossRef]
- Massoptier, L.; Casciaro, S. Fully automatic liver segmentation through graph-cut technique. In Proceedings of the 29th Annual International Conference of the IEEE Engineering in Medicine and Biology Society, Lyon, France, 22–26 August 2007; pp. 5243–5246. [Google Scholar] [CrossRef]
- Chen, Y.W.; Tsubokawa, K.; Foruzan, A.H. Liver segmentation from low contrast open MR scans using K-means clustering and graph-cuts. In Proceedings of the International Symposium on Neural Networks, Shanghai, China, 6–9 June 2010; pp. 162–169. [Google Scholar] [CrossRef]
- Erdt, M.; Steger, S.; Kirschner, M.; Wesarg, S. Fast automatic liver segmentation combining learned shape priors with observed shape deviation. In Proceedings of the 2010 IEEE 23rd International Symposium on Computer-Based Medical Systems (CBMS), Perth, WA, Australia, 12–15 October 2010; pp. 249–254. [Google Scholar]
- Yuan, Z.; Wang, Y.; Yang, J.; Liu, Y. A novel automatic liver segmentation technique for MR images. In Proceedings of the 2010 3rd International Congress on Image and Signal Processing, Marrakesh, Morocco, 4–6 June 2010; Volume 3, pp. 1282–1286. [Google Scholar]
- Hoogi, A.; Lambert, J.W.; Zheng, Y.; Comaniciu, D.; Rubin, D.L. A fully-automated pipeline for detection and segmentation of liver lesions and pathological lymph nodes. arXiv 2017, arXiv:1703.06418. [Google Scholar]
- Chen, E.L.; Chung, P.C.; Chen, C.L.; Tsai, H.M.; Chang, C.I. An automatic diagnostic system for CT liver image classification. IEEE Trans. Biomed. Eng. 1998, 45, 783–794. [Google Scholar] [CrossRef] [Green Version]
- Deng, L.; Yu, D. Deep learning for signal and information processing. In Microsoft Research Monograph; Microsoft: Redmond, WA, USA, 2013. [Google Scholar]
- Bashar, A. Survey on evolving deep learning neural network architectures. J. Artif. Intell. 2019, 1, 73–82. [Google Scholar]
- Jones, Y. Couinaud Classification of Hepatic Segments. 2018. Available online: https://radiopaedia.org/articles/couinaud-classification-of-hepatic-segments?report=reader (accessed on 25 January 2022).
- Waqas, M.; Tu, S.; Halim, Z.; Rehman, S.U.; Abbas, G.; Abbas, Z.H. The role of artificial intelligence and machine learning in wireless networks security: Principle, practice and challenges. Artif. Intell. Rev. 2022. [Google Scholar] [CrossRef]
- Tu, S.; Waqas, M.; Rehman, S.U.; Mir, T.; Abbas, G.; Abbas, Z.H.; Halim, Z.; Ahmad, I. Reinforcement learning assisted impersonation attack detection in device-to-device communications. IEEE Trans. Veh. Technol. 2021, 70, 1474–1479. [Google Scholar] [CrossRef]
- Perez, L.; Wang, J. The effectiveness of data augmentation in image classification using deep learning. arXiv 2017, arXiv:1712.04621. [Google Scholar]
- Ronneberger, O.; Fischer, P.; Brox, T. U-net: Convolutional networks for biomedical image segmentation. In Proceedings of the International Conference on Medical Image Computing and Computer-Assisted Intervention, Munich, Germany, 5–9 October 2015; pp. 234–241. [Google Scholar]
- Maqsood, M.; Bukhari, M.; Ali, Z.; Gillani, S.; Mehmood, I.; Rho, S.; Jung, Y.A. A residual-learning-based multi-scale parallel-convolutions-assisted efficient CAD system for liver tumor detection. Mathematics 2021, 9, 1133. [Google Scholar] [CrossRef]
- Sun, C.; Guo, S.; Zhang, H.; Li, J.; Chen, M.; Ma, S.; Jin, L.; Liu, X.; Li, X.; Qian, X. Automatic segmentation of liver tumors from multiphase contrast-enhanced CT images based on FCNs. Artif. Intell. Med. 2017, 83, 58–66. [Google Scholar] [CrossRef]


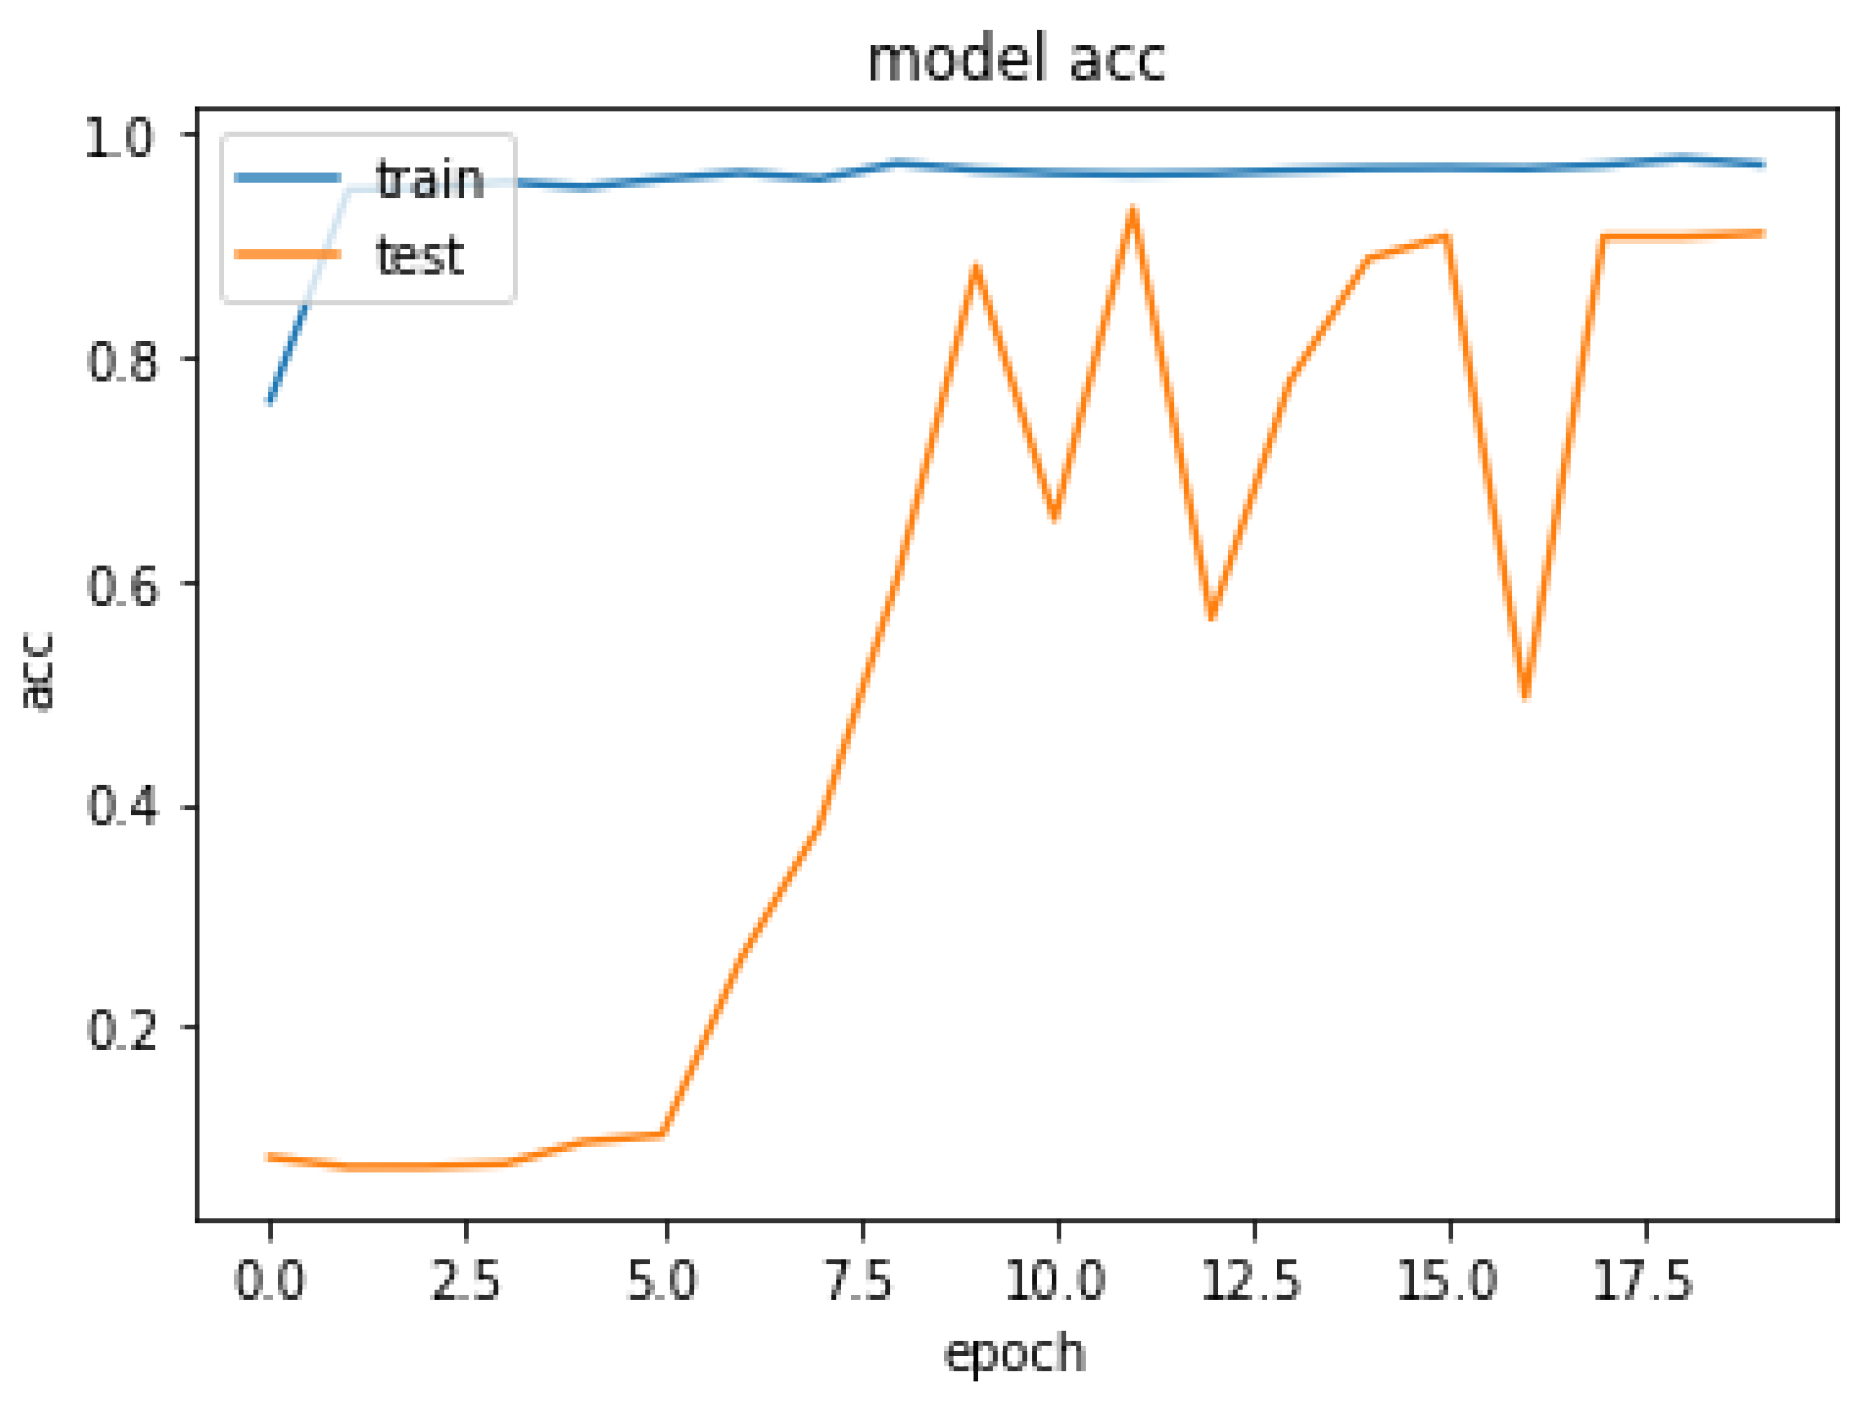
| Epoch | Loss | Acc |
|---|---|---|
| 1 | 0.3927 | 0.8608 |
| 2 | 0.4286 | 0.9696 |
| 4 | 0.4525 | 0.9867 |
| 6 | 0.5462 | 0.9593 |
| 8 | 0.4127 | 0.9794 |
| 10 | 0.2027 | 0.9673 |
| 12 | 0.6548 | 0.9632 |
| 19 | 0.3710 | 0.9776 |
| 20 | 0.4284 | 0.9923 |
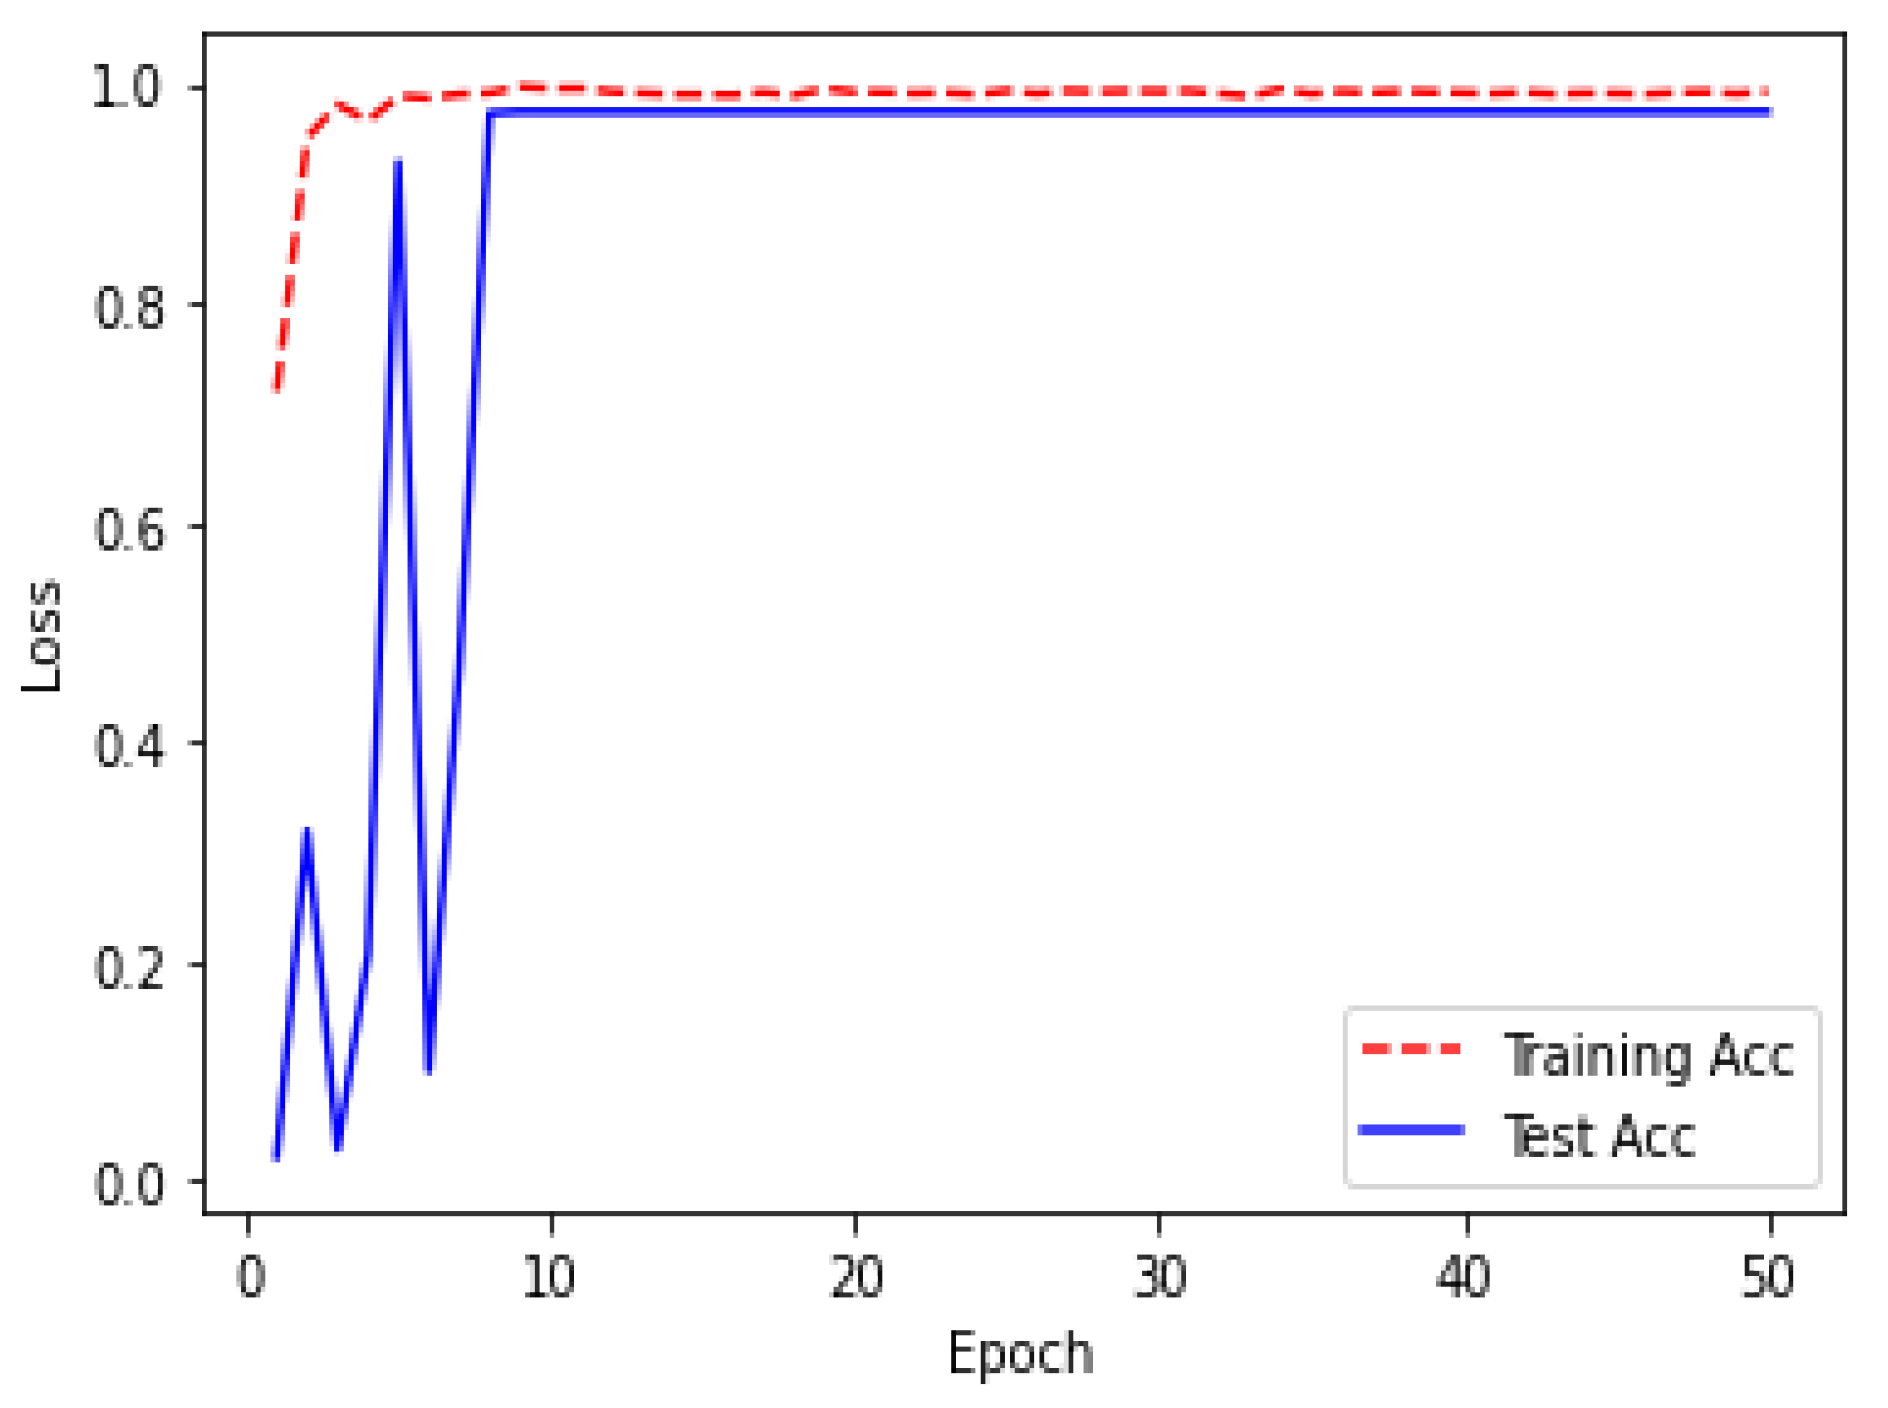
| Epoch | Loss | Acc |
|---|---|---|
| 1 | 0.2288 | 0.9196 |
| 2 | 0.5079 | 0.9504 |
| 4 | 0.7225 | 0.9660 |
| 6 | 0.6742 | 0.9864 |
| 8 | 0.8204 | 0.9913 |
| 10 | 0.3850 | 0.9953 |
| 12 | 0.4382 | 0.9924 |
| 49 | 0.5383 | 0.9906 |
| 50 | 0.2382 | 0.9927 |
Publisher’s Note: MDPI stays neutral with regard to jurisdictional claims in published maps and institutional affiliations. |
© 2022 by the authors. Licensee MDPI, Basel, Switzerland. This article is an open access article distributed under the terms and conditions of the Creative Commons Attribution (CC BY) license (https://creativecommons.org/licenses/by/4.0/).
Share and Cite
Rahman, H.; Bukht, T.F.N.; Imran, A.; Tariq, J.; Tu, S.; Alzahrani, A. A Deep Learning Approach for Liver and Tumor Segmentation in CT Images Using ResUNet. Bioengineering 2022, 9, 368. https://doi.org/10.3390/bioengineering9080368
Rahman H, Bukht TFN, Imran A, Tariq J, Tu S, Alzahrani A. A Deep Learning Approach for Liver and Tumor Segmentation in CT Images Using ResUNet. Bioengineering. 2022; 9(8):368. https://doi.org/10.3390/bioengineering9080368
Chicago/Turabian StyleRahman, Hameedur, Tanvir Fatima Naik Bukht, Azhar Imran, Junaid Tariq, Shanshan Tu, and Abdulkareeem Alzahrani. 2022. "A Deep Learning Approach for Liver and Tumor Segmentation in CT Images Using ResUNet" Bioengineering 9, no. 8: 368. https://doi.org/10.3390/bioengineering9080368