Article

Automatic Localization of Seizure Onset Zone Based on Multi-Epileptogenic Biomarkers Analysis of Single-Contact from Interictal SEEG

1
Key Laboratory of Universal Wireless Communications, Beijing University of Posts and Telecommunications, Ministry of Education, No. 10 Xitucheng Road, Haidian District, Beijing 100876, China
2
Department of Neurosurgery, Xuan Wu Hospital, Capital Medical University, No. 45 Changchun Street, Xuanwu District, Beijing 100053, China
*
Authors to whom correspondence should be addressed.
These authors contributed equally to this work.
Lead Contact: ypwang@bupt.edu.cn.
Bioengineering 2022, 9(12), 769; https://doi.org/10.3390/bioengineering9120769
Submission received: 7 November 2022 / Revised: 1 December 2022 / Accepted: 2 December 2022 / Published: 5 December 2022
(This article belongs to the Special Issue Advances of Biomedical Signal Processing)

Abstract

:
Successful surgery on drug-resistant epilepsy patients (DRE) needs precise localization of the seizure onset zone (SOZ). Previous studies analyzing this issue still face limitations, such as inadequate analysis of features, low sensitivity and limited generality. Our study proposed an innovative and effective SOZ localization method based on multiple epileptogenic biomarkers (spike and HFOs), and analysis of single-contact (MEBM-SC) to address the above problems. We extracted contacts epileptic features from signal distributions and signal energy based on machine learning and end-to-end deep learning. Among them, a normalized pathological ripple rate was designed to reduce the disturbance of physiological ripple and enhance the performance of SOZ localization. Then, a feature selection algorithm based on Shapley value and hypothetical testing (ShapHT+) was used to limit interference from irrelevant features. Moreover, an attention mechanism and a focal loss algorithm were used on the classifier to learn significant features and overcome the unbalance of SOZ/nSOZ contacts. Finally, we provided an SOZ prediction and visualization on magnetic resonance imaging (MRI). Ten patients with DRE were selected to verify our method. The experiment performed cross-validation and revealed that MEBM-SC obtains higher sensitivity. Additionally, the spike has better sensitivity while HFOs have better specificity, and the combination of these biomarkers can achieve the best performance. The study confirmed that MEBM-SC can increase the sensitivity and accuracy of SOZ localization and help clinicians to perform a precise and reliable preoperative evaluation based on interictal SEEG.

Graphical Abstract

1. Introduction

Although antiepileptic drugs can effectively control the seizures of most epilepsy patients, more than 30% cannot be cured, which is called drug-resistant epilepsy (DRE) [1]. For such DRE patients, the best treatment is to take surgical measures to remove or disconnect the epilepsy-causing brain region to reduce or prevent seizures [2,3,4,5]. Moreover, the brain region where clinical seizures are actually generated is called the seizure onset zone (SOZ) [6]. Thus, the key for successful surgery relies on accurate localization of the SOZ.
A stereo electroencephalogram (SEEG) is recorded by deep electrodes implanted in the deep brain [7], as shown in Figure 1; this differs from invasive electrocorticography (ECoG), and has been the gold standard for SOZ localization [8,9]. Specifically, clinicians place SEEG electrodes in suspicious areas which differ among patients, and bipolar conversion is required to minimize the correlation between two adjacent channels. Moreover, not only can SEEG record the electrical signal on the surface of the cerebral cortex but also the electrical data from the almond nucleus and the deep structure of the hippocampus. However, in clinical practice, clinicians usually prioritize checking the ictal period of SEEG, and its pathological information is quite limited. Patients may not even have seizures during hospitalization. In contrast, the interictal period of SEEG is easier to obtain and has much more information, ranging from a few days to even more than ten days. It is laborious, subjective, and time-consuming for clinicians to obtain further information by visually inspecting the long-range interictal SEEG [10]. Thus, an objective analysis method that can automatically estimate SOZ without the need for manual inspection of interictal SEEG has immense clinical significance [11,12,13,14,15]. Accordingly, this study aims to achieve objective and AI-based SOZ localization from interictal SEEG and to equip clinicians with trustworthy assistance for accurate preoperative evaluation.
Intelligent SOZ localization based on interictal SEEG and identification of epileptogenic contacts is typically accomplished in three steps: (1) The primary purpose is to detect potential epileptogenic markers in SEEG using algorithms such as signal filtering methods, machine learning, and deep learning; (2) Epileptogenic markers detected in the previous stage are used to extract contacts epileptogenic features; and (3) Feature selection is usually needed, and epileptogenic contacts classification is conducted based on machine learning algorithms.
In the first step of intelligent SOZ localization, epileptic markers’ detection plays a crucial role [14,16,17]. Research in recent years has suggested multiple promising biomarkers for SOZ localization, such as spikes [17], high-frequency oscillations (HFOs) (ripples (Rs), fast ripples (FRs), ripples co-occurring with FRs(R&FRs)) [8,18,19,20], and digital features of interictal epileptiform discharges [21,22,23]. Among these, for spikes detection, we demonstrated that deep learning can detect subtle changes in SEEG [24], and a more adaptive and highly interpretable SEEG-Net was then designed [25]. In addition, we have detected HFOs accurately from the filtered band-pass part and time-frequency image part, showing strong generalization ability and consistency with the gold standard [26,27]. Furthermore, for other important biomarkers, Akter et al. [22] detected the epileptic focus from interictal EEG using the information-theoretic features extracted from the high-frequency sub-bands. Klimes et al. [12] localized the SOZ in interictal SEEG by calculating multiple features of SOZ markers, such as oscillatory events and univariate spectral analysis. Therefore, improving the detection performance of epileptic biomarkers can lead to better SOZ localization and is of utmost importance. However, most studies can only determine if it is an epileptic signal, and cannot accurately trace the epileptogenic contacts and epileptogenic regions from the overall perspective of the individual patient. Thus, it was necessary to carry out a second step.
The key content of the second step is epileptogenic features extraction of contacts [13]. As using single biomarker is not enough to identify SOZ sensitively, Jacobs et al. [28] used HFOs to correct the seizure outcome of individual patients. Klimes et al. [12] proposed that the multi-feature approach is superior to the single-marker approach. It promoted the development of several markers’ combination for achieving a better identification of the SOZ. Thus, comprehensively represent the epileptogenic characteristics of contact based on multiple epileptogenic biomarkers is a future research trend. Furthermore, research shows that pathological and physiological HFOs largely overlap in their signal properties, and there is no reliable way to separate them. Physiological HFOs occur predominantly in the ripple range and can interfere with SOZ localization [17,29]. Based on this, Zweiphenning et al. [18] indicated that physiological ripple correction can enhance SOZ identification. Therefore, quantifying the pathological HFOs rate based on physiological ripple correction from the contact level to improve the performance of SOZ localization is an imperative issue for us to consider.
In the third step, effective feature selection is also challenging in SOZ classification [22,30]. In traditional clinical analysis, threshold methods are used [16,18,27]. Zweiphenning et al. [18] analysed various threshold methods, with the best method reaching 77.3% accuracy and 27% sensitivity. However, the threshold method still has problems, such as poor adaptability. In recent research combined with AI methods, Akter et al. [22] used sparse LDA to screen features and adopted machine learning classifiers such as SVM to classify SOZ contacts, achieved 52.70% sensitivity. The methods mentioned above still have shortcomings, such as lacking adaptability, and low sensitivity. In other fields, attention-based methods attracted the interest of researchers due to their advantages [24]. Therefore, designing a suitable feature selection method and classifier for SOZ identification is also crucial in our research.
Above all, we concentrated on tackling the following three issues to improve the sensitivity and comprehensive performance of SOZ localization based on the aforementioned constraints: (a) How to use end-to-end models to enhance the performance of epileptic biomarkers detection? (b) How to extract epileptic features comprehensively from the contacts level, and represent pathological ripple rate innovatively? (c) How to remove redundant features by designing a suitable feature selection method?
To overcome these issues, we present a highly sensitive and intelligent SOZ localization method based on multiple epileptogenic biomarkers analysis of single contact (MEBM-SC). Figure 2 depicts the whole MEBM-SC procedure. Specifically, (1) we calculated contacts features from two aspects, signal distribution, and signal energy. Among them, we propose a normalized pathological ripple rate of contacts based on ripple correcting [18] to minimize interference of physiological ripple and enhance performance of SOZ localization; (2) we introduced the Shapley value and hypothetical testing (ShapHT+) feature selection [31] algorithm to limit the interference from uncertain irrelevant features. (3) The attention mechanism (AM) and focal loss algorithms [32] were applied on a classifier to learn significant features and overcome the unbalance of SOZ/nSOZ contacts; and (4) To equip clinicians with dependable and interpretable assistance for precise presurgical evaluation, we provided SOZ prediction and visualization on magnetic resonance imaging (MRI).
The following is a summary of the main contributions of this study:
  • We presented a high-sensitivity SOZ localization method based on multiple epileptogenic biomarkers analysis of single contact;
  • We demonstrated that normalized pathological ripple rate with the regional +10% threshold can significantly improve the ability of SOZ identification;
  • Machine learning and deep learning algorithms, such as SEEG-Net, AM, and Focal loss, were employed in each stage of the entire process. Cross validation was performed for stronger generality and generalization;
  • Consistency was maintained with real clinical settings of preoperative DRE assessment. Individual SOZ prediction and visualization on MRI was provided to make reliable and explainable support.

2. Methods

2.1. MEBM-SC Overview

In this study, we proposed a novel and highly sensitive method for SOZ localization of DRE based on analyzing the interictal SEEG. MEBM-SC consisted of four parts: multiple epileptogenic biomarker detection; contact features extraction; contact features selection and classification; and individualized SOZ prediction and visualization. The implementation details are presented in Figure 2. The specific method is shown as follows.

2.2. Detection of Multiple Epileptogenic Biomarkers

Spike and HFOs (contain ripples (Rs) (80–250 Hz), fast ripples (FRs) (250–500 Hz) and ripples co-occurring with FR (R&FRs) (80–500 Hz)) are the main traditional and significant epileptogenic biomarkers for SOZs localization used in our study. Therefore, we use several verified models and algorithms to achieve high-sensitive detection of multiple epileptogenic biomarkers.
Specifically, our team applied three different pre-trained models and algorithms to detect spikes, both from traditional signal processing methods and deep learning models. Traditional signal processing methods include nonlinear feature extraction from the high-frequency bands [24], the specific features are presented in Table S1 in Supplementary Materials. For deep learning models, such as baseline model 1D-CNN [24] and the novel model SEEG-Net [25], we loaded the optimal parameters which had been pre-trained well to specific models. The model structure is presented in Supplementary Materials in Figures S1 and S2.
To detect HFOs, we improved the preliminary screening algorithm based on the HFOs detector [33]. Details are shown in Algorithm 1. The algorithm recognizes an incident with more than six oscillations in the specified time length, according to the amplitude of the Hilbert envelope of the band-pass filtering signal.
Algorithm 1: Preliminary Screening Algorithm
Require:
1: sigfull: original signal; sigfiltered: bandpass filtered signal
2: env: Hilbert envelope of smoothed bandpass signal
3: stdata: sigfull 81–500 Hz Stockwell transform
4: f s : Sampling frequency; x : any time; Eol: event of interest
5: threshold: ripple is 30, fastripple is 20
Ensure:
  7: p r o b = | s t d a t a | 2 f [ 81 , 500 ] log [ s t d a t a ] ▷ Relative energy, the ratio of the energy occupied by a certain frequency at that moment
  8: S = f [ 81 , 500 ] log [ p r o b ] ▷ Signal energy entropy
  9: if    t [ x , x + f s 100 ] , sigfull   0.9 S m a x & sigfiltered 10
10:   baseline     env(t); baselineFiltered     sigfiltered(t)
11:   thr     baseline experience accumulation function 95% threshold
12:   thrFilt     baselineFiltered experience accumulation function 99% threshold
13: end if
14: if    t [ x , x + 0.02 f s ] , env(t)     0.99 t h r & e n v ( t ) m a x < threshold
15:   event     env(t)
16:   number     The number of times each event crossed thrFilt
17:   if  n u m b e r   6
18:     Eol     event
19:   end if
20: end if
21: for  d i s t a n c e [ E o l 1 , E o l 2 ] < 10 m s  do
22:    E o l 1 = E o l 1 E o l 2
23: end for

2.3. Multiple Features Extraction of Contacts

To extract much more comprehensive contacts features, we calculated multiple features based on the multi-biomarkers from two aspects: signal distribution and signal energy. A total of 126 features from multiple epileptogenic biomarkers were computed in this study, as shown in Table 1. In particular, we extracted normalized pathological ripple rates from contact level to reduce the impact of physiological ripple.

2.3.1. Signal Distribution of Contact

Spike Rate

In this study, three different spike detectors were used: (1) a nonlinear feature extractor which has high accuracy and is explainable from high-frequency band; (2) 1D-CNN; and (3) SEEG-Net, which solved the problems of sample imbalance, domain shift across patients, and poor interpretability. This made it possible to detect pathological SEEG activity with high sensitivity. For a certain contact i of patient P, its spike rate S r a t e can be expressed as:
S r a t e = n S j T , j { 1 , 2 , 3 }
where n S means the count of spikes in contact i, j is the index of three models, and T is the time of calculation, it is thirty minutes in our study.

Normalized Pathological Ripples (Rs) Rate

In recent years, researchers found that the physiological ripples in HFOs have a greater impact on SOZ localization, and it is difficult to distinguish pathological and physiological ripples. Therefore, we no longer focus on distinguishing two types of signals. We extracted normalized pathological ripple rates from the contact level, which is of great significance in increasing localization sensitivity. The specific calculation is as follows:
For a certain contact i of patient P, its ripples rate R r a t e can be expressed as:
R r a t e = n R i T
where n R i   is the number of occurrences of ripples on contact i, and T is the total time of each segment was included in the study, the same as spike rate.
We noticed that normalization of the ripple substantially enhanced the capacity of ripples to identify SOZ zones, and the regional + 10% threshold (RT+10) demonstrated better performance, as in previous research [18]. Specifically, RT+10 was calculated by discarding contacts which Rs less than 10% of total number of Rs after regional correction. This was done to eliminate contacts whose HFO values were only marginally higher than physiological levels. Thus, the ripple rate after normalization R n o r m a l _ r can be expressed as follows:
R n o r m a l _ r = R r a t e R r e g i o n
R n o r m a l _ r = { R n o r m a l _ r , i f   R n o r m a l _ r   i n   q u a n t i l e ( i = 1 N c n R i , ( 0.1 , 1 ) ) 0 , i f   R n o r m a l _ r   i n   q u a n t i l e ( i = 1 N c n R i , ( 0 , 0.1 ) ) 0 , i f   R n o r m a l _ r < 0  
where R r e g i o n is a constant defined in previous studies [9] to represent different physiological ripple rates in different brain regions, the specific values of the brain regions involved in our dataset are shown in the Table 2. In addition, q u a n t i l e ( d a t a , p e r c e n t i l e ) is used to set contacts which Rs less than 10% of the total number of Rs to 0. N c is the total number of contacts for the patient.

Fast Ripples (FRs) Rate

There are few physiological fast ripples, and physiological correction did not increase the effectiveness of FRs in locating SOZ. Thus, we calculated the feature directly. For a certain contact i of patient P, its fast ripple rate F R r a t e can be expressed as:
F R r a t e = n F R i T
where n F R i   is the number of occurrences of fast ripples on contact i.

Ripples Co-Occurring with FRs(R&FRs) Rate

The same as FRs, we calculate this feature based on the count of HFOs detection results. For a certain contact i of patient P, its R&FRs rate R & F R r a t e can be expressed as:
R & F R r a t e = n R & F R i T
where n R & F R i   is the number of occurrences of R&FRs complex wave on contact i.

2.3.2. Signal Energy of Contact

Spike Energy

We calculate the spike energy of contacts based on the handcrafted feature. Since the spike segment is 5s, we use the median value of the whole spike feature vectors in thirty minutes to represent the contact. For contact i of patient P, spike strength S e n e r g y n i × n f based on media value of DWT can be expressed as:
S e n e r g y i = M 1 m e d i a n ( f n i , n [ 1 , n S i   ] ) , m [ 1 , n f   ]
where n S i   is the number of occurrences of spike on contact I, f n i is a feature vector, m is the number of feature types (e.g., Kraskov entropy, Renyi entropy).

Ripples Energy

Ripples energy of leads was extracted from three domains: (1) media value of Time; (2) median value of FT; and (3) median value of DWT. The calculation of the feature median is the same as Formula (7), and the specific feature extraction’s formula is shown in Table S2 of Supplementary Materials. Note that the length of HFOs is unfixed; we included temporal concentration in this part.

Fast Ripples Energy & R&FRs Complex Wave Energy

Since the length of fast ripples is shorter than ripples, we removed Kraskov entropy and Renyi entropy in the DWT domain. The other features in the study were precisely equated. The calculation of R&FRs complex wave energy is the same as Fast Ripples energy.

2.4. Feature Selection and Contact Classification

2.4.1. Feature Selection Based on ShapHT+

To obtain more epileptogenic attributes and characteristics of the contacts, we extracted 126 characteristics from multiple aspects in 2.3. However, among them, there are some unrelated features and redundant information. Such features have no beneficial effect on contact classification performance and even reduce the operating efficiency of the model. Therefore, feature selection is necessary.
We use a feature selection strategy based on Shapley value and hypothetical testing (ShapHT+) [31]. First, we used the tree Shap algorithm [34] to calculate local and global importance and then design the adaptive threshold to evaluate the relevant features. Second, hypothetical tests were conducted for two essential indicators to exclude irrelevant features. The detailed algorithm steps are described below:
(a)
We used the tree SHAP method to determine local importance. The algorithm is:
T ( X ( n ) ) = p 0 + i = 1 I p i ( n )
p i ( n ) = D \ x i | D | ! ( I | D | 1 ) ! I ! ( g X ( n ) ( X ( n ) x i ) g X ( n ) ( S ) )
where D presents dataset and T ( ) is a prediction model’s output value; p 0 is the expected output value, expressed as p 0 = E D ( T ( X )   ) ; and p i ( n ) denotes the contribution of feature x i in sample X ( n ) with the feature sets = { x i , i = 1 , , I } ; g X ( D ) represents the expectation of model T ( ) conditioned on feature subset D in sample X ( n ) . | p i ( n ) | , absolute value of contribution, is the local importance of feature x i in sample X ( n ) , defined as I i ( n ) .
(b)
Feature x i ’s global relevance is:
G I i = E ( I i )
where I i is the sequence of local importance I i = { I i ( n ) , n = 1 , , N } ; and E ( I i ) is the expected local importance in dataset D . G I k * represents global importance of randomized feature x k * .
(c)
We provide an adaptable threshold for assessing the relevance of features. As a result, the possibility that a feature is irrelevant is determined by computing proportion of features in sequence whose local relevance is lower than adaptive threshold. Hence, the final threshold is expressed as follows:
T r e = c l max ( G I k * ) , l = 1 , , L
where L means maximum iterations and c l denotes the l-th iteration. c l can be adaptively adjusted until it reaches the maximum value.
(d)
In addition, hypothesis tests were conducted to rule out irrelevant features. All the relevant characteristics were gathered as the initial features are sorted into relevant and irrelevant groups. The ideal feature subset had a good association with the label and little redundancy among features.

2.4.2. Contact Classification Based on AM and Focal Loss

After feature selection, we used the significant features to complete the contact identification task. In real-world scenarios, the proportions of SOZ contacts and nSOZ contacts are particularly unbalanced and will impact the final localization outcome. Therefore, we adopted an attention mechanism (AM) based on shallow neural networks and modify the loss function to focus on learning the features of SOZ contacts. We resorted to focal loss, which was provided as a method for dealing with unbalanced data in dense object detection by [32].
Figure 2 shows the detailed structure of this part. To increase the effectiveness of DNN, which is specified by the following Formulas (12)–(14), AM is developed:
u t = tanh ( W w e t + b w )
h t = e x p ( u t T u w ) t exp ( u t T u w )
v t = t h t · e t
where v t is the attention layer’s output, while W w , u w and b w represent trainable weights and bias. By multiplying e t and h t , AM selects and extracts from e t temporal and spatial information that is most important to the detection tasks.

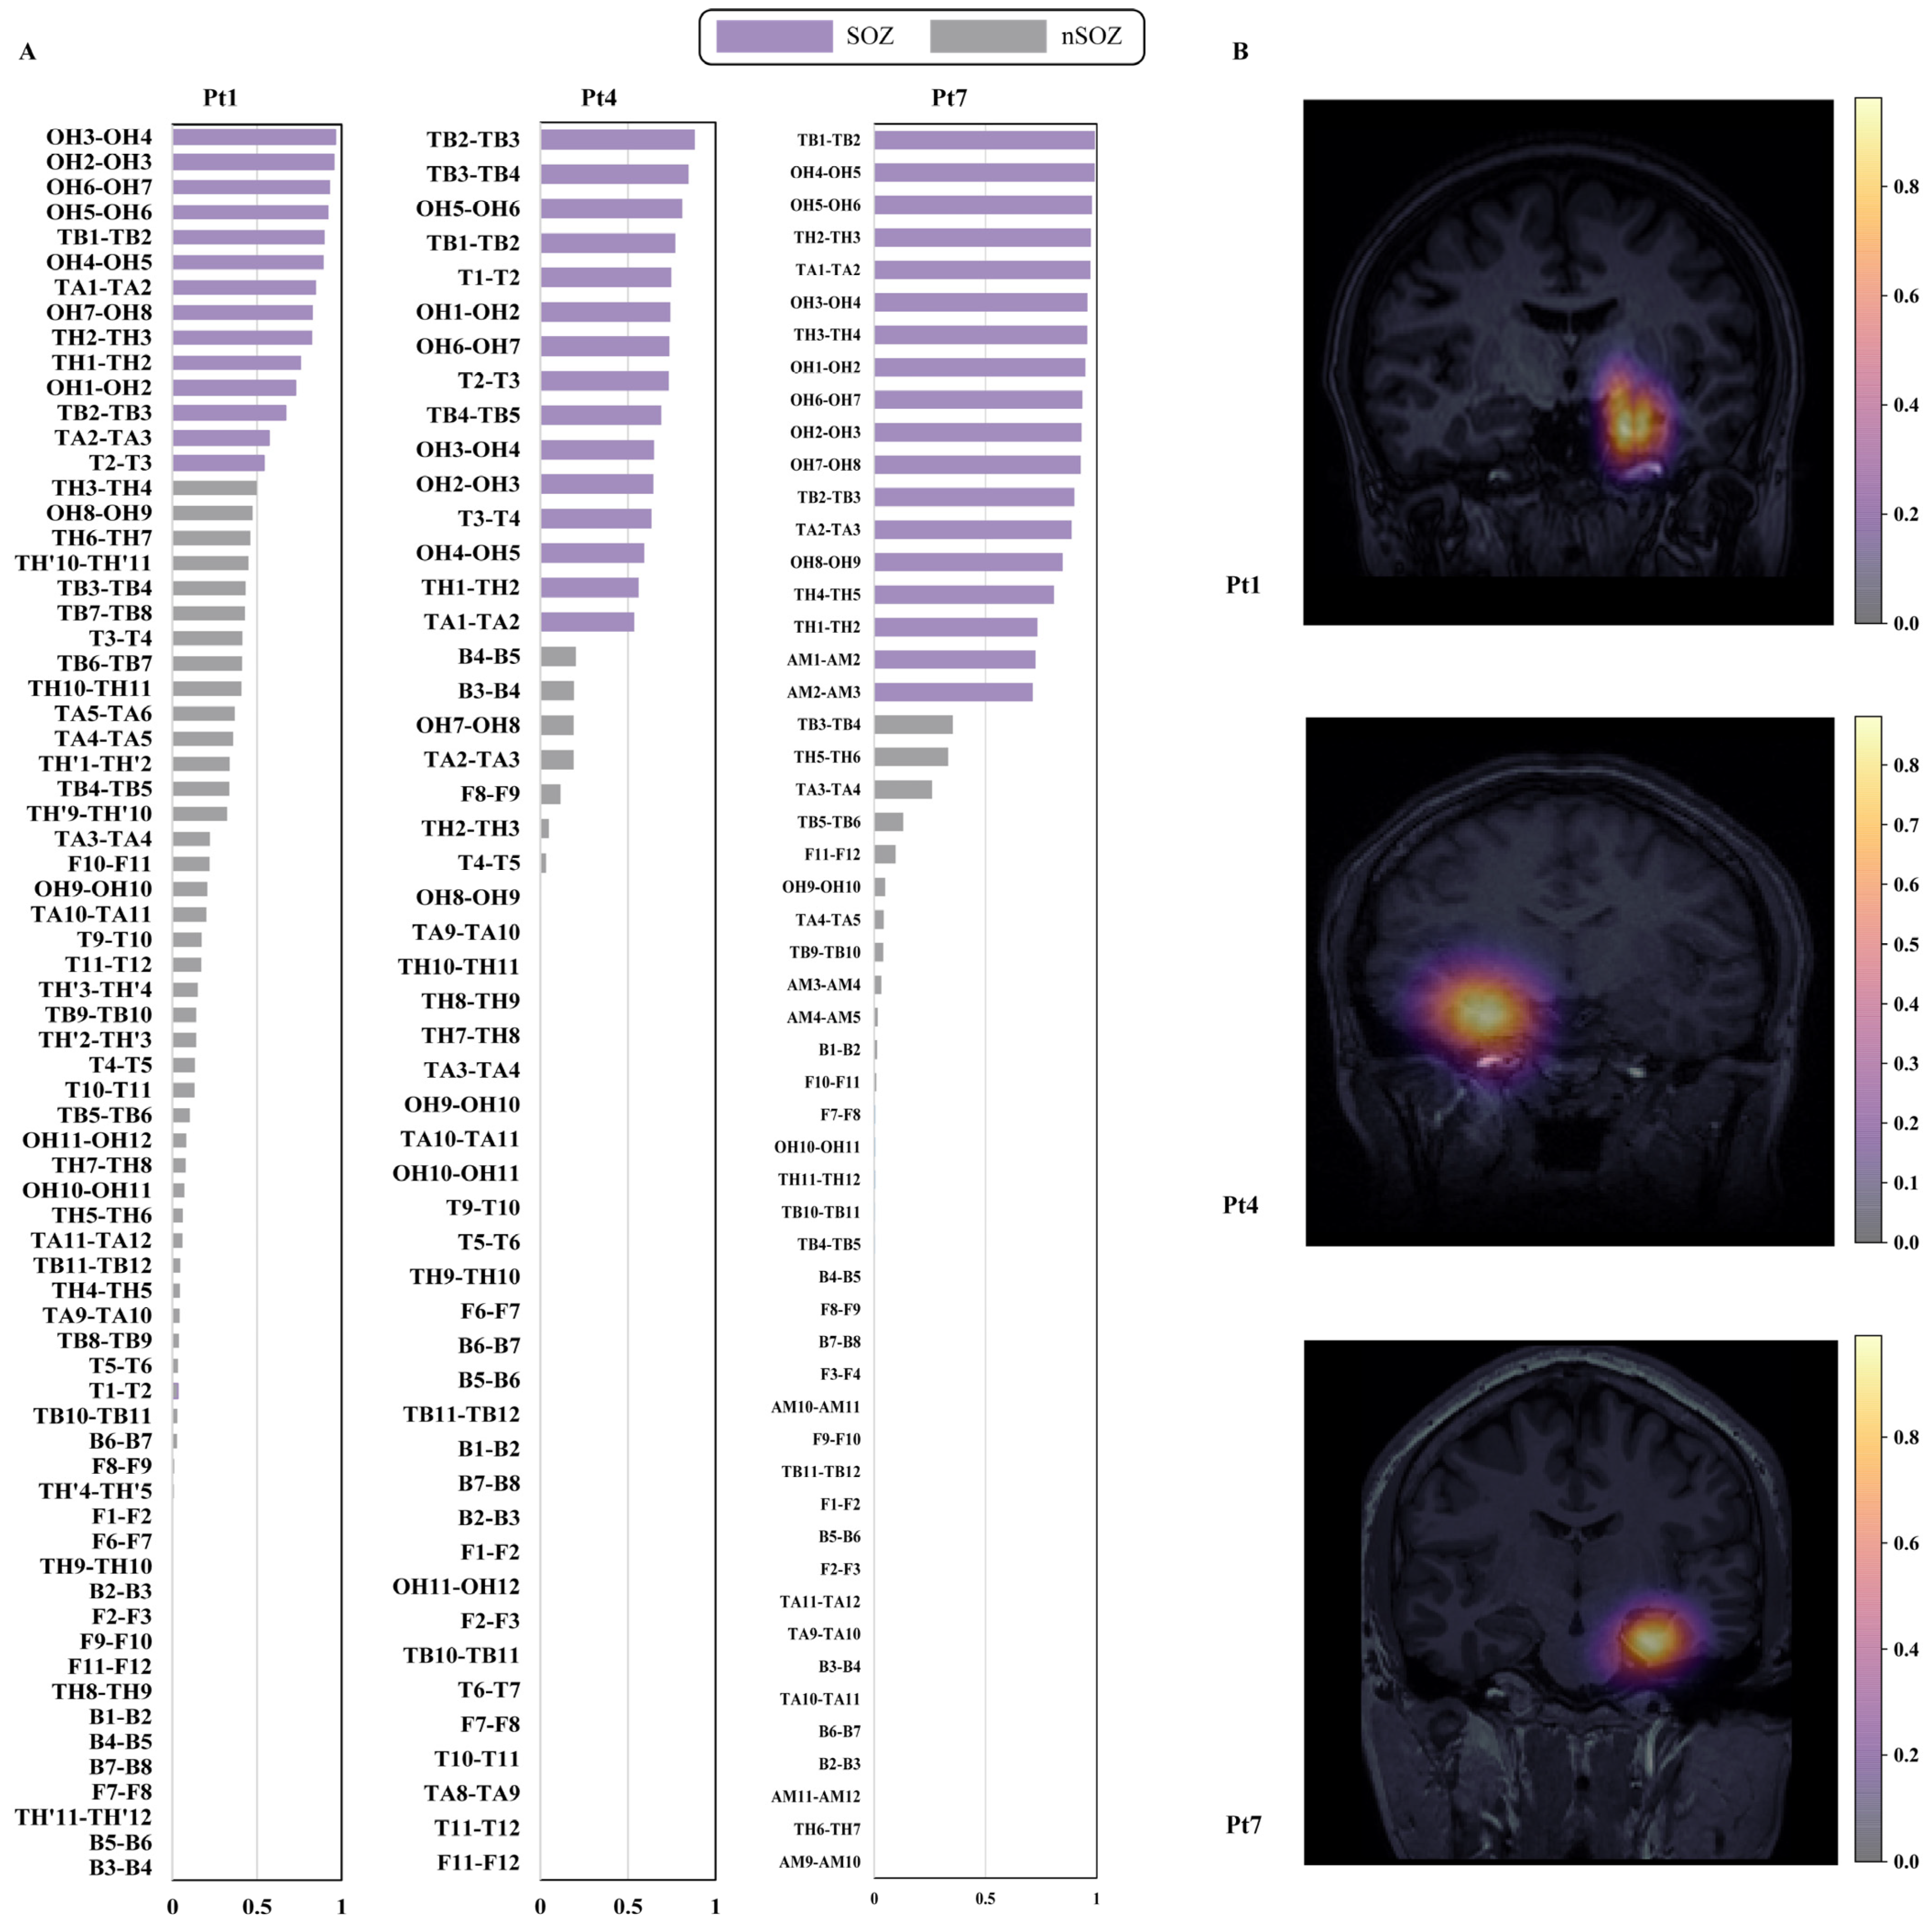
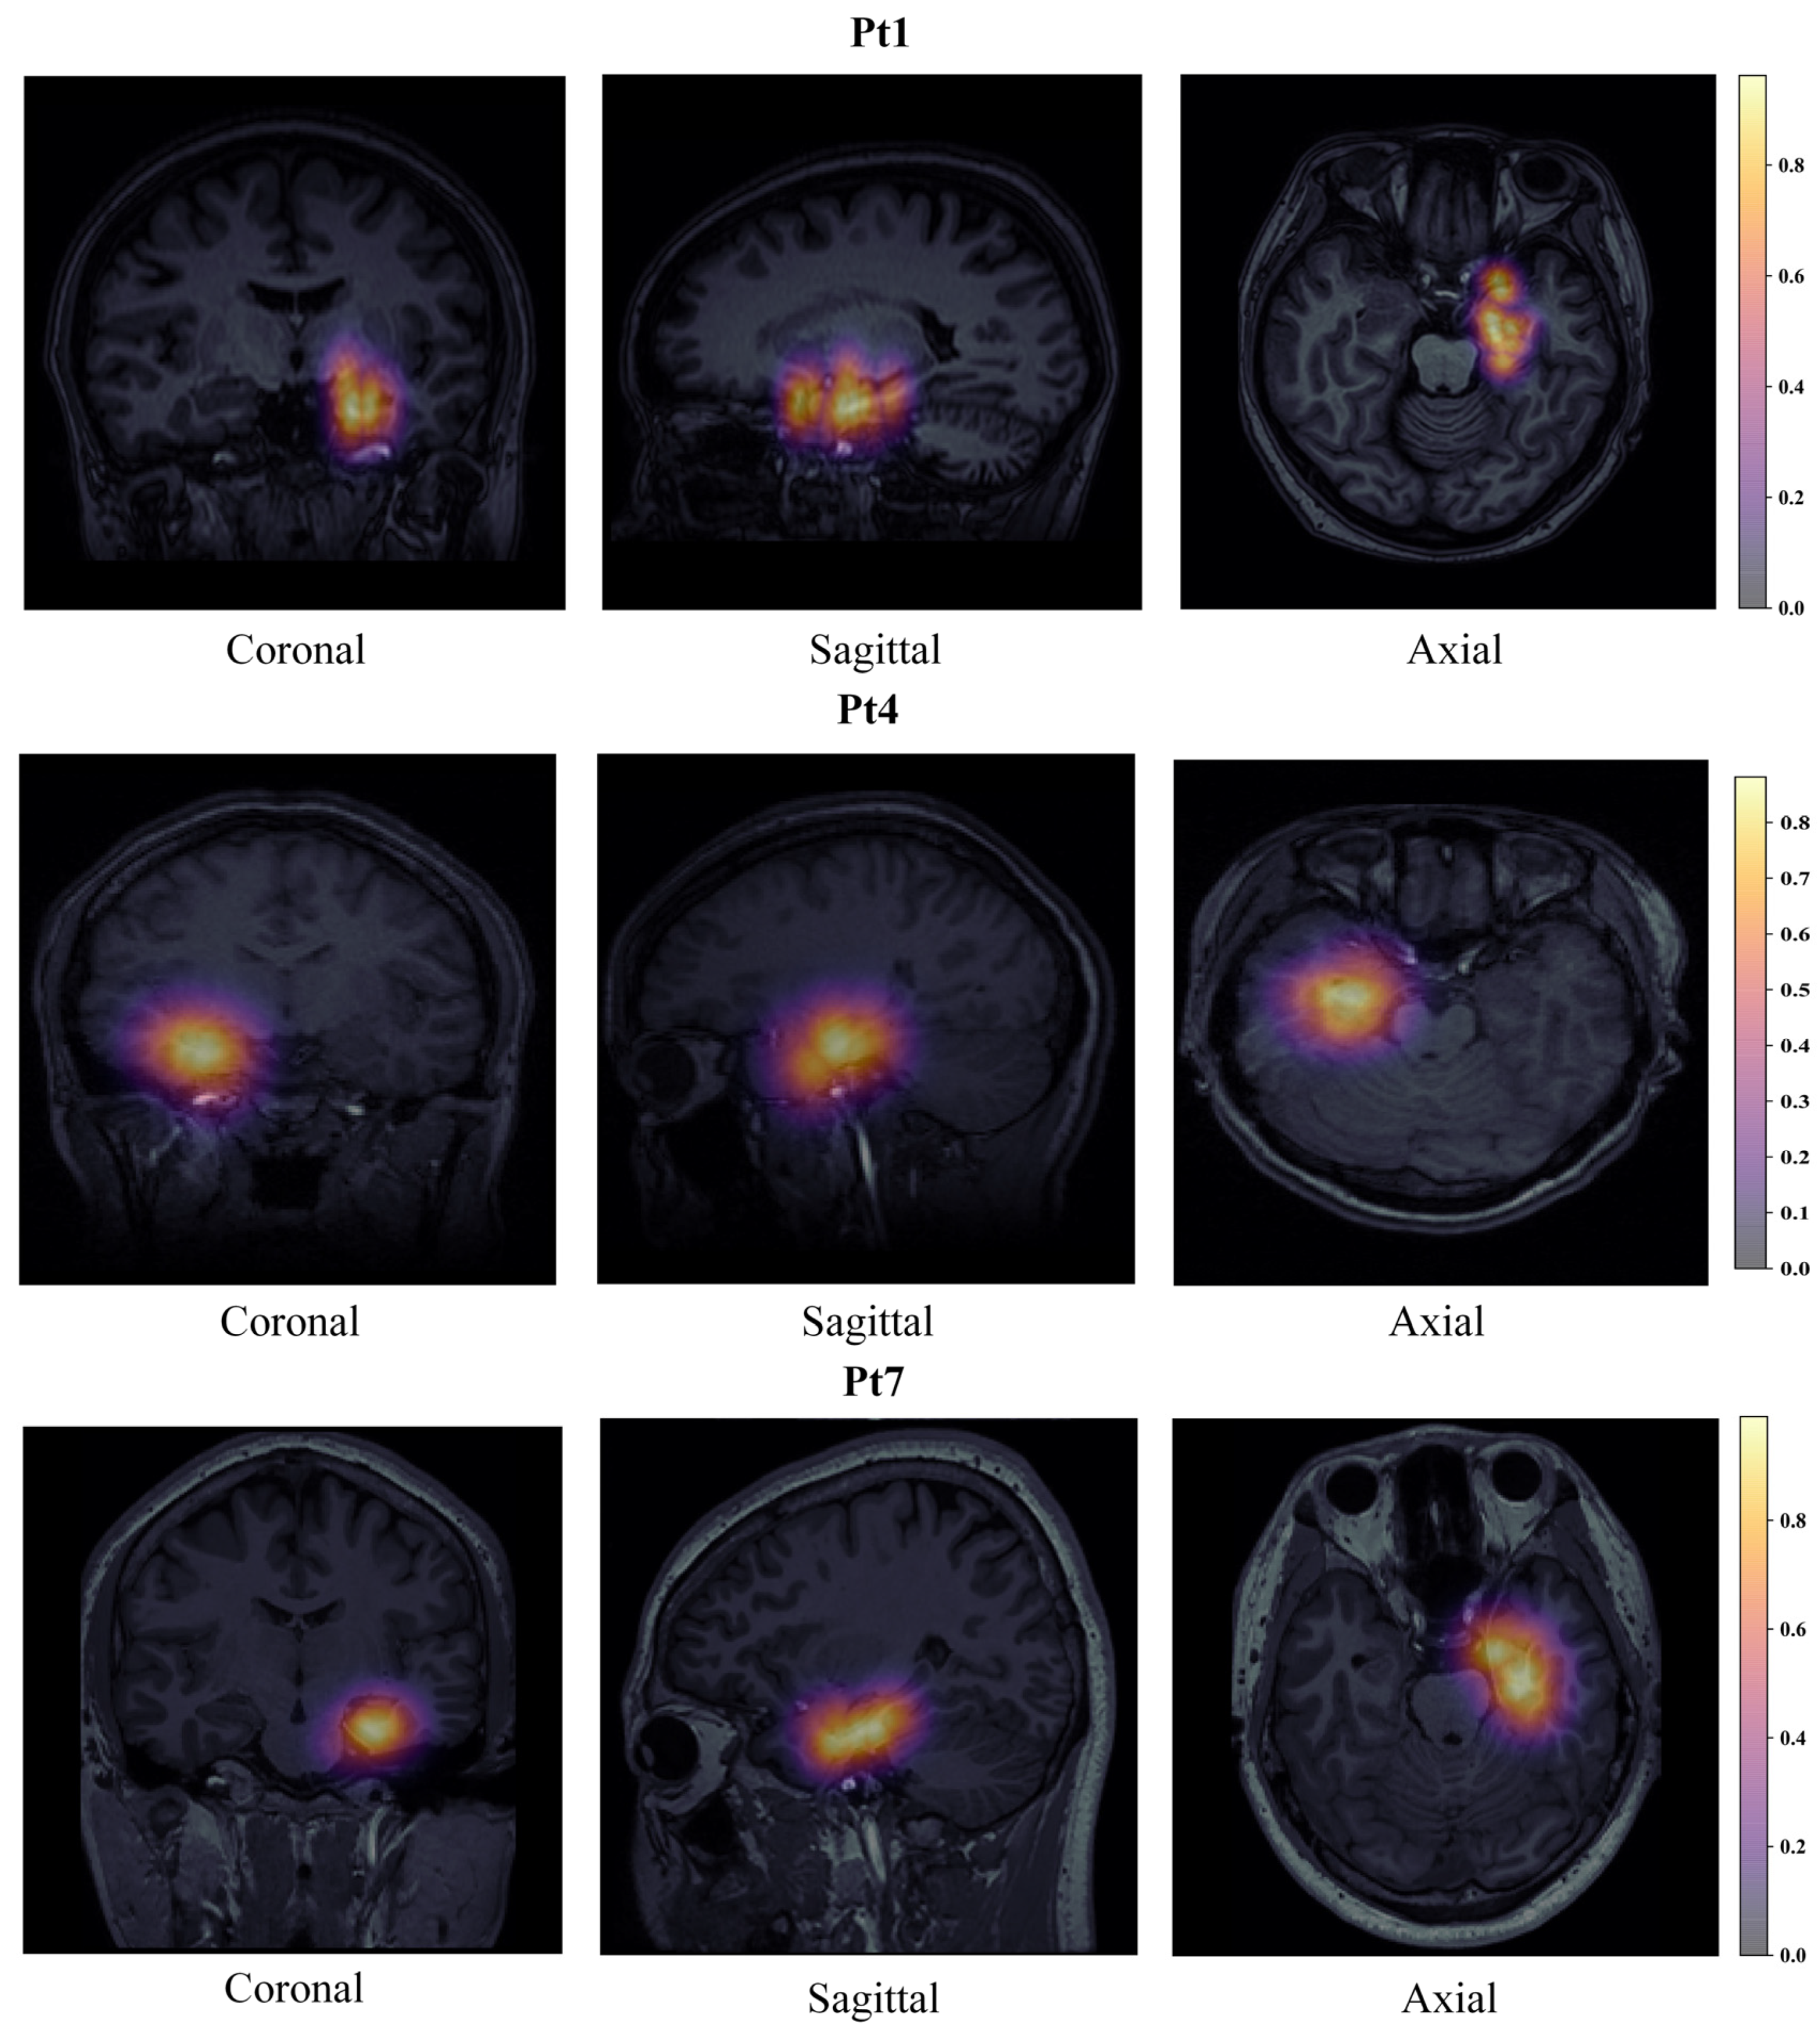
2.5. Individualized SOZ Prediction and Visualizaiton

As shown in Figure 2B, we map the predicted scores of the SOZ contacts to the patient’s personalized MRI, and the SOZ on MRI can be displayed more precise and more intuitive. The specific ideas are as follows:
  • Considering the low correlation between brain boundary voxels and SOZ, this section set brain boundary voxels to the lowest quantified value;
  • Considering the strong correlation between the SOZ surrounding voxels and SOZ contacts, we set SOZ contacts and their surrounding voxels to the predicted value corresponding to the contact;
  • To further achieve whole-brain mapping, we used a 3D Gaussian kernel method to map all other voxels in the whole brain. The other voxels’ values are between the predicted values of the SOZ surrounding voxels and the quantified values of the brain boundary voxels;
  • The predictive values of all voxels were calculated through the above interpolation method, ranging from 0 to 1. Then, we visualized the predictive values on the MRI. Thus, individualized SOZ prediction and visualization were obtained.

3. Experiments and Results

3.1. Patient Selection and Dataset Processing

We selected 10 consecutive patients receiving SEEG investigation followed by epilepsy surgery assessed at Xuanwu Hospital, China Department of Neurosurgery. The SEEG recordings are acquired with Nicolet at 2k/2048 Hz sampling rate, using depth DIXI electrodes. Table 3 provides comprehensive details on each patient.
Patients were required to meet the following criteria in this study:
(a)
the patient has focal DRE;
(b)
seizure free and outcome is Engel 1;
(c)
a curative epilepsy surgery has been conducted;
(d)
pathology is hippocampal sclerosis (HS);
(e)
long-term SEEG monitoring, and post-operative structural MRI are obtainable;
(f)
a minimum of six months of post-operative follow-up;
(g)
at least one recorded seizure exhibits rhythmic activity.
We selected the interictal sleep state of ten patients with a single acquisition time of half-hour. The collection of sleep period data based on the patient’s video recording in which relative deep sleeping and turning over occurred are light. For dataset processing, the segmentation’s criteria and signal processing steps were the same as in the previous study [25]. Peri-implantation and postsurgical images were linearly matched to preimplantation MRI, and electrode placements are recorded. We utilized the same 17 regions as MNI Open iEEG Atlas to mark contacts region-specific HFO rates. Two neurophysiologists identified SOZ contacts based on the first unambiguous visual signal alterations after seizure onset.

3.2. Experimental Protocols

3.2.1. Validation Protocols

Leave-one-out cross-patient validation method was employed to achieve a robust evaluation and fine-tune parameters. The protocol is shown in Figure 3. The training data were constructed from 8 of 10 patients, and the remaining two patients constituted validation data and testing data, respectively. The final estimation was calculated by averaging the predictions from each split.

3.2.2. Evaluation Metrics

Our study aimed to identify SOZ from the contact level. That is, this study aimed to identify SOZ/nSOZ contacts from all contacts planted in the brain, which becomes a binary classification task. Two neurophysiologists identified SOZ contacts based on the first unambiguous visual signal alterations after seizure onset. We used three overall metrics and two single-class metrics to evaluate the imbalanced classification performance for SOZ contact detection.
The specific formula is displayed as Formulas (15)–(19):
Sensitivity ( SEN ) = T P ( T P + F N )
Specificity ( S P E ) = T N ( T N + F P )
Accuracy ( ACC ) = T P + T N ( T P + F P + T N + F N )
Positive   predictve   value ( PPV ) = T P ( T P + F P )
Negative   predictive   value ( NPV ) = T N ( T N + F N )
where sensitivity (SEN) and specificity (SPE) represent the proportion of correctly identified SOZ and nSOZ contacts, respectively. Positive Predictive Value (PPV) measures the accuracy of all positive predictions. Negative Predictive Value (NPV) quantifies the proportion of accurate negative predictions when all negative predictions are included.

3.2.3. Parameter Setting

The biomarkers deep learning detector, contacts feature selector and classifier may perform differently with different parameter values. For the parameters of multiple epileptogenic biomarkers detectors, the optimal values have been presented in the previous studies [24,25,26,27], respectively. All the settings for the contacts feature selector and deep learning classifier are shown in Table 4. All experiments were conducted with the PyTorch framework on DELL PowerEdge R740 rack servers with three-block NVIDIA GeForce RTX 2080 Ti.

3.3. Results for SOZ Localization Based on Cross Validation

We evaluated SOZ localization as a binary classification task and validated the proposed method MEBM-SC in the real-world, clinical DRE dataset, as shown in the Table 5. The method performed the best outcome for SOZ identification (89.27% sensitivity, 90.37% specificity, 90.87% accuracy, 81.38% PPV, 96.58% NPV). Specifically, first, end-to-end algorithms can enhance the performance of spike and HFOs detection. Figure 4 shows multi epileptogenic biomarkers detection results. Second, ripples correction can significantly improve the ability of single-contact analysis of SOZ identification. Third, the feature selection method and classifier are essential for our method. The prediction probability of different contacts is depicted in the bar plot and MRI in Figure 5.

3.4. Ablation Study

3.4.1. Multi Biomarkers Features of Contacts

To investigate the contribution and improved performance of numerous biomarkers and normalized HFOs characteristics in our proposed MEBM-SC, we performed an ablation study. First, spike and HFOs features served as the foundational features, while the remaining features were progressively constructed as the whole feature set. Then, we integrated spike and HFOs. Moreover, pathological ripple rate was normalized. Finally, the normalized pathological ripple rate was replaced with a regional +10% threshold. In the process of conducting this ablation study, we maintained the feature selector and classifiers unchanged, the same as MEBM-SC. Particularly, the following describes the process:
  • feature a (Multiple features of spike): we utilize the pathological signal distribution and energy of spike;
  • feature b (Multiple features of HFOs): we employ the pathological signal distribution and energy of HFOs;
  • feature c (Multiple features of spike and HFOs): we add the pathological signal distribution and energy of both biomarkers;
  • feature d (Multiple features of spike and normalized pathological HFOs): add the normalization of ripples by the regional atlas threshold, based on feature c;
  • feature e/MEBM-SC (Multiple features of spike and regional+10% based on normalized pathological HFOs): add the normalization of ripples by the regional + 10% threshold, based on feature c.
Table 6 demonstrates that the significant features of our method, particularly feature e, are effective for SOZ contact identification. This ablation study indicates that: (a) in general, the more comprehensive feature extraction, the higher the performance of SOZ contact recognition; (b) as illustrated above, the accuracy and sensitivity of feature c are higher than feature a and b, indicating that the combination of spike and HFOs is more effective. Conclusion is not clear yet as to which marker is more effective, in the previous study. The specificity of feature b is higher than all methods, indicating that the error rate of high-frequency oscillation is the lowest; and (c) using the regional +10% threshold demonstrates the highest performance. Both the sensitivity and accuracy of feature e are higher than other features, indicating the effectiveness of the ripple normalization, which is also consistent with the conclusions in Zweiphenning’s study [18].

3.4.2. Feature Selection Methods

We discussed the effectiveness of the feature selection method and classifier with other methods, in this ablation study. Descriptions are as follows:
  • selection a (XGBoost): exploit XGBoost as feature selection method and classifier;
  • selection b (RFE-XGBoost): applie SVM-RFE as feature selection method and classifier;
  • selection c (ShapHT++DNN): employ a shallow deep learning model, DNN as the feature selection method and classifier;
  • selection d (ShapHT+self-AM+DNN): add self-attention machine based on selection c;
  • selection e/MEBM-SC (ShapHT+AM+DNN): add attention machine based on selection c.
Table 7 shows the performance increase observed in selection e, showing that the proposed feature selection method and classifier are essential for our pipeline. As illustrated in selection c, shapHT+ significantly outperforms the sensitivity of selection a and b. The difference between selection d and e is the self-AM. Although both have the same level of sensitivity, selection d has lower specificity due to its poor fitting performance to negative samples. In conclusion, the ablation experiment demonstrated the effectiveness of ShapHT+ and AM.

4. Discussion

This study demonstrated that our proposed MEBM-SC can detect the difference between SOZ and non-SOZ contacts and achieve AI-based, high-sensitive SOZ localization (Table 8). Specifically, we confirm that: (a) Ripples correction with the regional +10% threshold can significantly improve the ability of SOZ identification; (b) Single-contact analysis of SOZ localization based on the spikes has better sensitivity, while analysis based on HFOs has better specificity, and biomarkers combination can achieve the best performance; and (c) SOZ contacts prediction and visualization on MRI can assist the epileptologist in making a prompt medical diagnosis; and (d) Cross-validation was used to verify the robustness and enhance the clinical availability of MEBM-SC.

4.1. Comparison with Other Methods

This study developed an SOZ localization method based on multi-epileptogenic biomarkers analysis of single contact. The summary of the mean outcomes of a 10-fold cross-patient evaluation can be found in Table 8. This table demonstrates that, MEBM-SC obtains the best performance on SEN (89.27%) and ACC (90.87%). The sensitivity is higher than the existing method, showing that our method predicts the best performance of SOZ contacts and could be more sensitive to discover abnormal contacts. In addition, the accuracy rate is higher, meaning that the comprehensive evaluation performance is better. The specificity is 90.37%, indicating that it can still maintain a lower false positive rate. Although these results are not directly comparable due to their different experiment settings, such as the number of patients, division of the dataset, and data preprocessing steps), the simple and broad comparison here can still suggest some empirical observations.
It is worth noting that, machine learning and deep learning algorithms are employed at each stage of the entire process. Firstly, for the detection of epileptogenic biomarkers, we used several algorithms to complete spike detection, such as 1D-CNN, the latest model SEEG-Net, and multi-band features, which were derived from our previous research. To precisely detect HFOs, we designed a morphological detection method based on the Hilbert envelope and achieve rapid detection of Rs, FRs, and R&FRs. Secondly, in the contacts feature extraction, we calculated the signal distribution features and signal energy features of multi-biomarkers in different contacts by signal processing technology. Thus, the epileptogenicity of contact is represented adequately. Thirdly, we employed the ShapHT+ algorithm, which is based on the Shapley value and adaptive relevance evaluation for feature selection. Each candidate feature assesses its relevance using the tree SHAP strategy. An adaptive threshold is applied to determine whether or not the feature is relevant to the a priori knowledge, and then binomial hypothesis testing was utilized to select all relevant characteristics. ShapHT+ outperform other algorithms in excluding interferences and selecting relevant features, as demonstrated in 3.4.2. Finally, for SOZ contacts identification, we introduced a shallow DNN with an attention mechanism and focal loss to improve DNN’s performance by focusing on the most discriminative input feature.
In addition, we verified the entire method by cross-validation. Such training and validation methods can avoid individual differences and large deviations in the clinical scenes. For example, some patients discharge more in the interictal period, and some discharge less. Moreover, the robustness is enhanced.

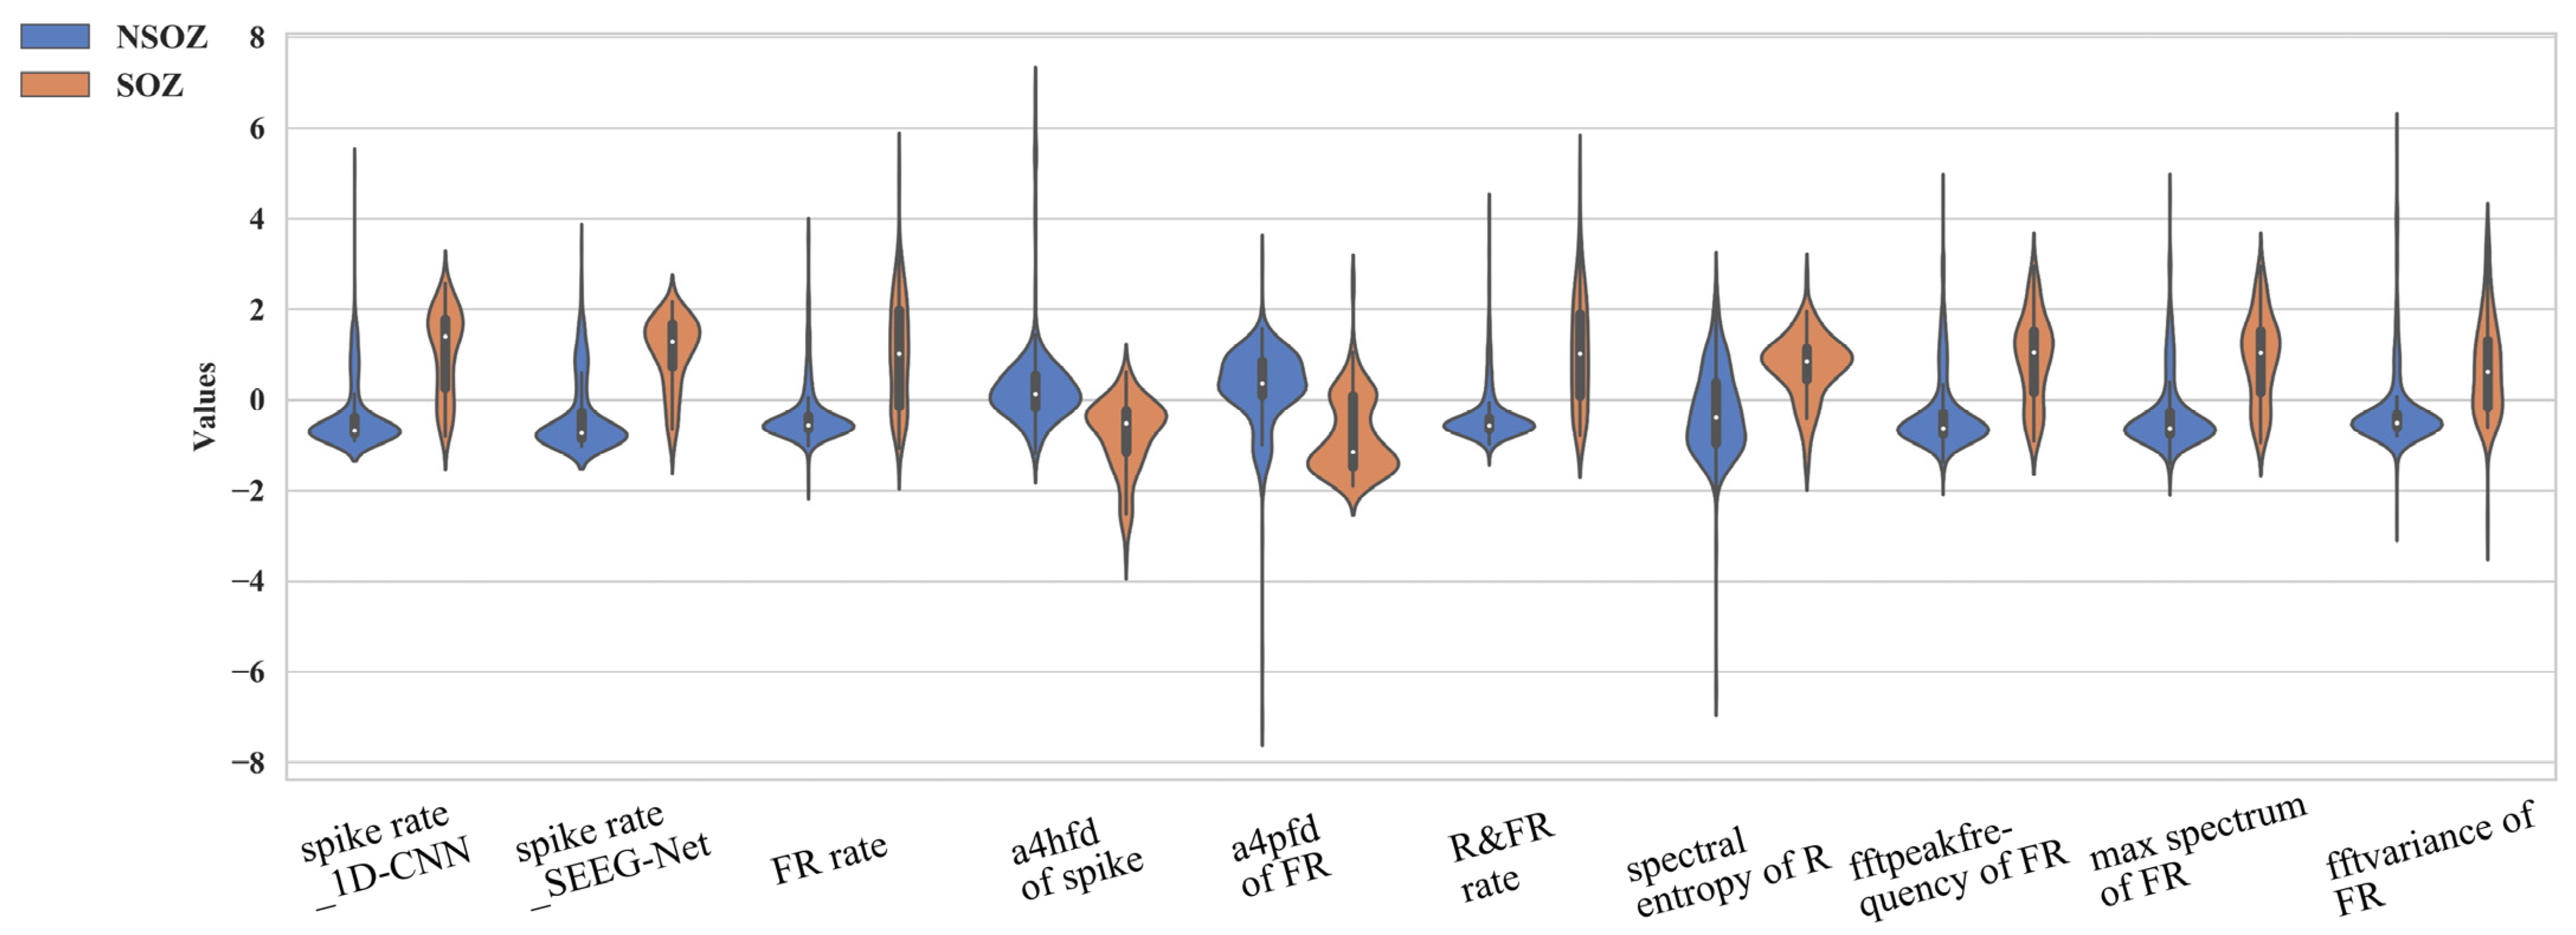
4.2. Significant Numerical Features of Epileptogenic Biomarkers

The critical part of SOZ localization is accurately representing the epileptogenicity of contact based on effective feature extraction. In this section, we analyzed the difference in significant features between SOZ and non-SOZ contacts.
The extraction of objective quantitative features of normalized pathological ripples rate from the contact level is an innovative point in this study. Normalization by the regional + 10% threshold substantially enhanced the ripples’ ability to identify the SOZ, exhibiting the best performance (3.4.1).
We utilize ShapHT+ to evaluate the significance of features and to identify significant features. As illustrated in Figure 6, we sorted the 10 most vital features. Specifically, in the contact’s signal distribution group, the spike rate from 1D-CNN and SEEG-Net, Fast Ripple rate, and R&FRS rate are more significant, representing the occurrence rate of multi biomarkers. It is possible to observe the distinction between the two classes (SOZ/nSOZ). Besides, in the contact’s signal energy group, the most prominent features are a4Hfd of the spike, spectral entropy of ripples, a4Pfd/fftpeakfrequency/maxspectrum/fftvariance of FRs. Specifically, the HFD and PFD are implementations for calculating the FD in SEEG time series data. The fftpeakfrequency means the difference between the maximum and minimum of SEEG data after fast Fourier transform. The maxspectrum means the maximum absolute value of SEEG data after fast fourier transform. The fftVariance means the variance of SEEG data after fast fourier transform. Experiments indicated that these characteristics can differentiate SOZ contacts from non-SOZ contacts.

4.3. Extraction of Normalized Pathological HFOs Rate

Evaluating HFOs effectiveness is a challenge when considering physiological HFOs. Physiological HFOs mainly occur in ripple. In the interictal period, it is related to the cognitive process or is caused by tasks or stimuli. Pathological and physiological HFOs has overlapping in the signals’ nature, and there is no reliable way to separate them. The frequency of physiological waves has a significant difference in different brain regions. In addition, physiological FRs are rare.
Therefore, for physiological ripples, our study has quantified the correction of physiological HFOs, to obtain the pathological HFOs rate in the contact level, which can improve the predictive performance of the identification of SOZ. Specifically, the pathological HFOs rates of different areas are defined as the part exceeding each region’s standard physiological HFOs rate.

4.4. Visualization of Electrodes with MRI

In this section, we provide the SOZ prediction and visualization on the MRI, which can be seen in Figure 7. We make it possible to diagnose SOZ contacts more objectively and reliably. In addition to this, it can assist epileptologists with support in making quick medical judgments based on scores of contacts that have been mapped into the brain regions through the use of MRI.

4.5. Limitations and Future Work

Our proposed method in this study has potential, but it also has limitations: (1) From the perspective of computer-aided technology, the coupling between multiple modules did not perform very well. We will enhance the coupling between signal pattern detection and contact identification in future research, and realize an end-to-end identification method from raw SEEG to auxiliary diagnostic results (SOZ/nSOZ); (2) From the perspective of improving diagnostic performance, SOZ identification of single contact from interictal SEEG is of great significance. However, if brain network-based connectivity quantification can be taken into account, it would be helpful not only to have a significant performance improvement but also for the comprehension and application of intelligent-assisted SOZs localization; (3) From the perspective of comprehensive preoperative evaluation, it is also critical to locate SOZ of DRE based on the non-invasive images. In subsequent research, we will consider adding multi-modal data for analysis, such as (MRI, PET, etc.).

5. Conclusions

An AI-based and highly sensitive SOZ localization method, MEBM-SC, for diagnosing drug-resistant epilepsy utilizing interictal SEEG was proposed in this study. We focused on multi-epileptogenic biomarkers analysis of single-contact, such as spike and HFOs (Rs, FRs, and R&FRS). First, we extracted contacts features from two aspects, signal distribution and signal energy. Among these, we presented a normalized pathological ripple rate from the contact level. Second, we utilized the ablation study to demonstrate that integrating normalized pathological ripple rate, the combination of multi-biomarkers, and feature selection algorithms is available and suitable. Furthermore, cross-validation on clinical DRE databases indicated that MEBM-SC provides better results. Last, in order to supply clinicians with dependable and intelligible assistance for precise presurgical assessment, we provided the SOZ prediction and visualization on MRI, which can illustrate the possible SOZ contacts much easier and reliably.

Supplementary Materials

The following supporting information can be downloaded at: https://www.mdpi.com/article/10.3390/bioengineering9120769/s1, Table S1: High-frequency band(80-250Hz) features; Figure S1: The structure of 1D-CNN; Table S2: The structure of SEEG-Net; Table S2: Feature extraction of unfixed-length signal segment.

Author Contributions

Y.W. and Y.Y. conceived the research and experiments and drafted the manuscript. Our ideas were enhanced by the contributions of S.L., Z.S. and J.G. The clinical surgery was done by Y.Y. and P.W., who also labeled the clinical SEEG and SOZ contact. G.Z., G.K. and J.H. revised the manuscript. All authors have read and agreed to the published version of the manuscript.

Funding

This study was funded by Fundamental Research Funds for the Central Universities (2020XD-A06-1), State Key Program of the National Natural Science Foundation of China (82030037), National Natural Science Foundation of China (62203063), and BUPT Excellent Ph.D. Students Foundation (CX2021206).

Institutional Review Board Statement

The Ethics Committee at Xuanwu Hospital, Capital Medical University, Beijing, China, reviewed and approved the research involving human volunteers. The participant’s legal guardian or next of kin gave written informed consent to participate in this study. Written informed consent was acquired from the individual(s) and minor(s) legal guardian(s)/next of kin for the publication of any potentially identifying photos or data contained in this article.

Informed Consent Statement

Written informed consent has been obtained from the patient(s) to publish this paper.

Data Availability Statement

The clinical dataset supporting the conclusions of this study is accessible from the authors upon reasonable request.

Conflicts of Interest

The authors declare no conflict of interest.

Abbreviations

CNN = convolution neural network; DL = Deep Learning; DRE = drug-resistant epilepsy; HFO = high-frequency oscillations; ML = Machine Learning; MRI = magnetic resonance imaging; SF = Seizure free; NSF = None seizure free; SEEG = stereoelectroencephalography.

References

  1. Thijs, R.D.; Surges, R.; O’Brien, T.J.; Sander, J.W. Epilepsy in adults. Lancet 2019, 393, 689–701. [Google Scholar] [CrossRef] [PubMed]
  2. Dalic, L.; Cook, M.J. Managing drug-resistant epilepsy: Challenges and solutions. Neuropsychiatr. Dis. Treat. 2016, 12, 2605. [Google Scholar] [CrossRef] [PubMed] [Green Version]
  3. Wu, M.; Wan, T.; Wan, X.; Fang, Z.; Du, Y. A new localization method for epileptic seizure onset zones based on time-frequency and clustering analysis. Pattern Recognit. 2021, 111, 107687. [Google Scholar] [CrossRef]
  4. de Borman, A.; Vespa, S.; Tahry, R.E.; Absil, P.A. Estimation of seizure onset zone from ictal scalp EEG using independent component analysis in extratemporal lobe epilepsy. J. Neural. Eng. 2022, 19, 026005. [Google Scholar] [CrossRef]
  5. Foldes, S.T.; Munter, B.T.; Appavu, B.L.; Kerrigan, J.F.; Adelson, P.D. Shift in electrocorticography electrode locations after surgical implantation in children. Epilepsy Res. 2020, 167, 106410. [Google Scholar] [CrossRef]
  6. Pellegrino, G.; Hedrich, T.; Chowdhury, R.; Hall, J.A.; Lina, J.M.; Dubeau, F.; Kobayashi, E.; Grova, C. Source localization of the seizure onset zone from ictal EEG/MEG data. Hum. Brain Mapp. 2016, 37, 2528–2546. [Google Scholar] [CrossRef] [Green Version]
  7. McGonigal, A.; Bartolomei, F.; Regis, J.; Guye, M.; Gavaret, M.; Trebuchon-Da Fonseca, A.; Dufour, H.; Figarella-Branger, D.; Girard, N.; Peragut, J.C.; et al. Stereoelectroencephalography in presurgical assessment of MRI-negative epilepsy. Brain 2007, 130, 3169–3183. [Google Scholar] [CrossRef]
  8. Zhao, B.; Hu, W.; Zhang, C.; Wang, X.; Wang, Y.; Liu, C.; Mo, J.; Yang, X.; Sang, L.; Ma, Y.; et al. Integrated Automatic Detection, Classification and Imaging of High Frequency Oscillations With Stereoelectroencephalography. Front. Neurosci. 2020, 14, 546. [Google Scholar] [CrossRef]
  9. Frauscher, B.; von Ellenrieder, N.; Zelmann, R.; Rogers, C.; Nguyen, D.K.; Kahane, P.; Dubeau, F.; Gotman, J. High-Frequency Oscillations in the Normal Human Brain. Ann. Neurol. 2018, 84, 374–385. [Google Scholar] [CrossRef]
  10. Johnson, G.W.; Cai, L.Y.; Doss, D.J.; Jiang, J.W.; Negi, A.S.; Narasimhan, S.; Paulo, D.L.; González, H.F.J.; Roberson, S.W.; Bick, S.K.; et al. Localizing temporal lobe seizure onset zones using deep learning on SEEG cortico-cortical evoked potentials. bioRxiv 2022. [Google Scholar] [CrossRef]
  11. Jiang, H.; Kokkinos, V.; Ye, S.; Urban, A.; Bagić, A.; Richardson, M.; He, B. Interictal SEEG resting-state connectivity localizes seizure onset zone and predicts seizure outcome. Adv. Sci. 2022, 9, 2200887. [Google Scholar] [CrossRef] [PubMed]
  12. Klimes, P.; Cimbalnik, J.; Brazdil, M.; Hall, J.; Dubeau, F.; Gotman, J.; Frauscher, B. NREM sleep is the state of vigilance that best identifies the epileptogenic zone in the interictal electroencephalogram. Epilepsia 2019, 60, 2404–2415. [Google Scholar] [CrossRef] [PubMed]
  13. Xiao, L.; Li, C.; Wang, Y.; Chen, J.; Si, W.; Yao, C.; Li, X.; Duan, C.; Heng, P.-A. Automatic Localization of Seizure Onset Zone From High-Frequency SEEG Signals: A Preliminary Study. IEEE J. Transl. Eng. Health Med. 2021, 9, 1–10. [Google Scholar] [CrossRef]
  14. Li, J.; Grinenko, O.; Mosher, J.C.; Gonzalez-Martinez, J.; Leahy, R.M.; Chauvel, P. Learning to define an electrical biomarker of the epileptogenic zone. Hum. Brain Mapp. 2020, 41, 429–441. [Google Scholar] [CrossRef] [PubMed] [Green Version]
  15. Martinkovic, L.; Hecimovic, H.; Sulc, V.; Marecek, R.; Marusic, P. Modern techniques of epileptic focus localization. Int. Rev. Neurobiol. 2014, 114, 245–278. [Google Scholar] [CrossRef]
  16. Liu, S.; Sha, Z.; Sencer, A.; Aydoseli, A.; Bebek, N.; Abosch, A.; Henry, T.; Gurses, C.; Ince, N.F. Exploring the time-frequency content of high frequency oscillations for automated identification of seizure onset zone in epilepsy. J. Neural. Eng. 2016, 13, 026026. [Google Scholar] [CrossRef]
  17. Grinenko, O.; Li, J.; Mosher, J.C.; Wang, I.Z.; Bulacio, J.C.; Gonzalez-Martinez, J.; Nair, D.; Najm, I.; Leahy, R.M.; Chauvel, P. A fingerprint of the epileptogenic zone in human epilepsies. Brain 2018, 141, 117–131. [Google Scholar] [CrossRef] [Green Version]
  18. Zweiphenning, W.; von Ellenrieder, N.; Dubeau, F.; Martineau, L.; Minotti, L.; Hall, J.A.; Chabardes, S.; Dudley, R.; Kahane, P.; Gotman, J.; et al. Correcting for physiological ripples improves epileptic focus identification and outcome prediction. Epilepsia 2021, 63, 483–496. [Google Scholar] [CrossRef]
  19. Krikid, F.; Karfoul, A.; Chaibi, S.; Kachenoura, A.; Nica, A.; Kachouri, A.; Jeannès, R.L.B. Classification of High Frequency Oscillations in intracranial EEG signals based on coupled time-frequency and image-related features. Biomed. Signal Process. Control 2022, 73, 103418. [Google Scholar] [CrossRef]
  20. Wan, X.; Fang, Z.; Wu, M.; Du, Y. Automatic detection of HFOs based on singular value decomposition and improved fuzzy c-means clustering for localization of seizure onset zones. Neurocomputing 2020, 400, 1–10. [Google Scholar] [CrossRef]
  21. Cimbalnik, J.; Klimes, P.; Sladky, V.; Nejedly, P.; Jurak, P.; Pail, M.; Roman, R.; Daniel, P.; Guragain, H.; Brinkmann, B.; et al. Multi-feature localization of epileptic foci from interictal, intracranial EEG. Clin. Neurophysiol. 2019, 130, 1945–1953. [Google Scholar] [CrossRef] [PubMed]
  22. Akter, M.S.; Islam, M.R.; Iimura, Y.; Sugano, H.; Fukumori, K.; Wang, D.; Tanaka, T.; Cichocki, A. Multiband entropy-based feature-extraction method for automatic identification of epileptic focus based on high-frequency components in interictal iEEG. Sci. Rep. 2020, 10, 7044. [Google Scholar] [CrossRef]
  23. An, N.; Ye, X.; Liu, Q.; Xu, J.; Zhang, P. Localization of the epileptogenic zone based on ictal stereo-electroencephalogram: Brain network and single-channel signal feature analysis. Epilepsy Res. 2020, 167, 106475. [Google Scholar] [CrossRef]
  24. Wang, Y.; Dai, Y.; Liu, Z.; Guo, J.; Cao, G.; Ouyang, M.; Liu, D.; Shan, Y.; Kang, G.; Zhao, G. Computer-Aided Intracranial EEG Signal Identification Method Based on a Multi-Branch Deep Learning Fusion Model and Clinical Validation. Brain Sci. 2021, 11, 615. [Google Scholar] [CrossRef] [PubMed]
  25. Wang, Y.; Yang, Y.; Cao, G.; Guo, J.; Wei, P.; Feng, T.; Dai, Y.; Huang, J.; Kang, G.; Zhao, G. SEEG-Net: An explainable and deep learning-based cross-subject pathological activity detection method for drug-resistant epilepsy. Comput. Biol. Med. 2022, 148, 105703. [Google Scholar] [CrossRef] [PubMed]
  26. Liu, Z.; Wei, P.; Wang, Y.; Yang, Y.; Dai, Y.; Cao, G.; Kang, G.; Shan, Y.; Liu, D.; Xie, Y. Automatic Detection of High-Frequency Oscillations Based on an End-to-End Bi-Branch Neural Network and Clinical Cross-Validation. Comput. Intell. Neurosci. 2021, 2021, 7532241. [Google Scholar] [CrossRef]
  27. Liu, Z. Localization of Epileptic Seizure Onset Zone Based on High Frequency Oscillations Signal Detection; Beijing University of Post and Telecommunications: Beijing, China, 2021. [Google Scholar]
  28. Jacobs, J.; Wu, J.Y.; Perucca, P.; Zelmann, R.; Mader, M.; Dubeau, F.; Mathern, G.W.; Schulze-Bonhage, A.; Gotman, J. Removing high-frequency oscillations: A prospective multicenter study on seizure outcome. Neurology 2018, 91, e1040–e1052. [Google Scholar] [CrossRef]
  29. Liu, S.; Parvizi, J. Cognitive refractory state caused by spontaneous epileptic high-frequency oscillations in the human brain. Sci. Transl. Med. 2019, 11, eaax7830. [Google Scholar] [CrossRef]
  30. Miao, Y.; Iimura, Y.; Sugano, H.; Fukumori, K.; Shoji, T.; Tanaka, T. Seizure Onset Zone Identification Based on Phase-Amplitude Coupling of Interictal Electrocorticogram. In Proceedings of the 2021 43rd Annual International Conference of the IEEE Engineering in Medicine & Biology Society (EMBC), Guadalajara, Mexico, 1–5 November 2021; pp. 587–590. [Google Scholar]
  31. Yin, D.; Chen, D.; Tang, Y.; Dong, H.; Li, X. Adaptive feature selection with shapley and hypothetical testing: Case study of EEG feature engineering. Inf. Sci. 2022, 586, 374–390. [Google Scholar] [CrossRef]
  32. Lin, T.Y.; Goyal, P.; Girshick, R.; He, K.; Dollár, P. Focal loss for dense object detection. In Proceedings of the IEEE international Conference on Computer Vision, Venice, Italy, 22–29 October 2017; pp. 2980–2988. [Google Scholar]
  33. Burnos, S.; Frauscher, B.; Zelmann, R.; Haegelen, C.; Sarnthein, J.; Gotman, J. The morphology of high frequency oscillations (HFO) does not improve delineating the epileptogenic zone. Clin. Neurophysiol. 2016, 127, 2140–2148. [Google Scholar] [CrossRef]
  34. Lundberg, S.M.; Erion, G.; Chen, H.; DeGrave, A.; Prutkin, J.M.; Nair, B.; Katz, R.; Himmelfarb, J.; Bansal, N.; Lee, S.-I. From local explanations to global understanding with explainable AI for trees. Nat. Mach. Intell. 2020, 2, 56–67. [Google Scholar] [CrossRef] [PubMed]
  35. Murphy, P.M.; von Paternos, A.J.; Santaniello, S. A novel HFO-based method for unsupervised localization of the seizure onset zone in drug-resistant epilepsy. In Proceedings of the 2017 39th Annual International Conference of the IEEE Engineering in Medicine and Biology Society (EMBC), Jeju, Republic of Korea, 11–15 July 2017; pp. 1054–1057. [Google Scholar]
  36. Fang, Z.; Wan, X.; Wan, T. Fast automatic localization of epileptic seizure onset zones using complex Morlet wavelet transform-based singular value decomposition. In Proceedings of the 2018 37th Chinese Control Conference (CCC), Wuhan, China, 25–27 July 2018; pp. 4330–4334. [Google Scholar]
Figure 1. (A) is an intraoperative photo of electrodes after implantation, and the red frame contains a single electrode. Right side shows details of an SEEG electrode. The red points on the SEEG electrode are contacts. (B) depicts SEEG electrodes implanted in a whole 3D brain.
Bioengineering 09 00769 g001
Figure 2. The pipeline of SOZ localization method: MEBM-SC: (A) the work scheme contains SEEG recording, multiple epileptogenic biomarkers detection, contact features’ extraction, feature selection and contact’s classification; and (B) interpolation of prediction scores onto patient’s individual MRI. Note: SOZ, seizure onset zone; nSOZ, non-seizure onset zone; FRs, fast ripples; FT, fourier transform; DWT, discrete wavelet transformation.
Bioengineering 09 00769 g002
Figure 3. Leave-one-out cross-patient validation.
Bioengineering 09 00769 g003
Figure 4. Raw interictal SEEG and multi epileptogenic biomarkers detection results plot in SOZ and nSOZ contacts for patient (Pt1).
Bioengineering 09 00769 g004
Figure 5. Bar-plot and MRI prediction probability for three patients: (A) bar-plot of contact prediction probability. X-axis and y-axis show prediction probability and contact name. Purple contacts are SOZ, while gray contacts are nSOZ; and (B) three patients’ predictive MRI.
Bioengineering 09 00769 g005
Figure 6. The ranking of the top ten most important features for patients.
Bioengineering 09 00769 g006
Figure 7. The SOZ prediction and visualization result with MRI from multiple axes.
Bioengineering 09 00769 g007
Table 1. Different features of contacts from two aspects: signal distribution and signal energy.
Multiple
Features
Signal DistributionSignal Energy
Biomarkers
SpikesRate/min (Feature based,1D-CNN,
SEEG-Net)
Media value of DWT (Kraskov entropy, Renyi entropy, Permutation entropy, Sample entropy, Shannon entropy, Energy, SVD entropy, Petrosan Fractal Dimension (PFD), Katz Fractal Dimension (KFD), Higuchi Fractal Dimension (HFD)
HfosRipplesRate/min
Normalized pathological ripples rate/min
Media value of Time (Energy, Time)
Media value of FT (Maximum, Mean, Minimum, Peak frequency, Power, Power spectral density (Psd), Spectral entropy, Spectrum, Variance)
Media value of DWT (Kraskov entropy, Renyi entropy, Permutation entropy, Sample entropy, Shannon entropy, Energy, SVD entropy, PFD, KFD, HFD)
Fast RipplesRate/minSame as ripples
Ripples co-occurring with FRsRate/minMedia value of Time (Energy, Time)
Media value of FT (Maximum, Mean, Minimum, Peak frequency, Power, Power spectral density (Psd), Spectral entropy, Spectrum, Variance)
Media value of DWT (Permutation entropy, Sample entropy, Shannon entropy, Energy, SVD entropy, PFD, KFD, HFD)
Table 2. Different ripple rate in different region.
IndexRegion95th Percentile
2Medial and basal temporal region19.5
7Superior, middle, and orbital frontal gyri and anterior part of inferior frontal gyrus3.5
8Middle and inferior temporal gyrus, temporal pole, and planum polare2.7
9Anterior and middle cingulate2
Table 3. The clinical dataset’s patient characteristics.
Patient IdAgeSexNumber of SEEG ElectrodesSurgery TypeOutcome (Engel)Follow-Up (Months)Number
of SOZ
Contacts
Number
of nSOZ
Contacts
138F8RF-TCI331555
235M7RF-TCI321345
334F8RF-TCI161143
427F7RF-TCI121536
522M7ATLI12429
620F6RF-TCI91434
734M6RF-TCI91440
822F6RF-TCI91218
930M7RF-TCI12826
1021F7RF-TCI181423
Total------120349
Note: RF-TC, radiofrequency thermocoagulation; ATL, anterior temporal lobectomy.
Table 4. Parameters values in this study.
Random ForestNum of EstimatorsMax DepthLearning RateClass Weight
10030.1Balanced
DNN classifierLayerInOutDropout
Fully Connected (FC)1Feature num1280.3
FC2128128-
FC31281280.3
FC4128Class num-
Training EpochsBatch SizeOptimizerLearning Rate
Trainer204NAdam1 × 10−4
Table 5. Individual patient experimental results using the proposed method MEBM-SC.
Patient IDTraining & Valid/Testing IDTPTN FP FNSEN [%]SPE [%]ACC [%]PPV [%]NPV [%]
Pt1Pt2-10/Pt114550193.3310098.5710098.21
Pt2Pt1,3-10/Pt213396010086.6789.6668.42100
Pt3Pt1-2,4-10/Pt38421372.7397.6792.5988.8993.33
Pt4Pt1-3,5-10/Pt414333193.3391.6792.1682.3597.06
Pt5Pt1-4,6-10/Pt5329017510096.9710096.67
Pt6Pt1-5,7-10/Pt614277010079.4185.4266.67100
Pt7Pt1-6,8-10/Pt71436401009092.5977.78100
Pt8Pt1-7,9-10/Pt810153283.3383.3383.3376.9288.24
Pt9Pt1-8,10/Pt9624227592.3188.247592.31
Pt10Pt1-9/Pt1014194010082.6189.1977.78100
Mean ----89.2790.3790.8781.3896.58
Table 6. The ablation study demonstrates that the features in our pipeline are efficient for detecting SOZ contacts.
Multi
Biomarkers Features
SpikeHFOsPathological HFOsRegional+10% Based Pathological HFOsSEN [%]SPE [%]ACC [%]PPV [%]NPV [%]
feature a 78.8089.9587.7472.8993.37
feature b 74.9191.2288.3468.7493.08
feature c 82.8989.6688.9373.8295.21
feature d 87.9389.9290.7171.4393.18
feature e/
MEBM-SC
89.2790.3790.8781.3896.58
Table 7. The ablation study shows the effectiveness of the feature selection method and classifier with other methods.
Feature Selection MethodsSEN [%]SPE [%]ACC [%]PPV [%]NPV [%]
XGBoost56.5295.8984.9171.6386.13
RFE-XGBoost65.8195.0287.8979.7589.54
ShapHT++DNN86.9189.6489.6375.9795.64
ShapHT++self-AM+DNN88.9486.1388.2072.3296.25
MEBM-SC (ShapHT++AM+DNN)89.2790.3790.8781.3896.58
Table 8. Cross-subject validation of MEBM-SC and state-of-the-art methods.
AuthorsMethodsSEN [%]SPE [%]ACC [%]PPV [%]NPV [%]
Mruphy et al. [35]HFOs-based contact ranking index--70--
Su Liu et al. [16]HFOs-based clinical analyses81 82.2---
Zelin Fang et al. [36]HFOs-Based Quantity Deviation
and Semi-Maximum
60.0 96.3---
Jian Li et al. [14]“fingerprint”, fast activity and SVM13.5999.6476.3889.3675.84
Zweiphenning et al. [18]physiological ripples correction
and thresholds
2797.177.380.678.2
ProposedDL-based multi biomarkers detection and contact classification89.2790.3790.8781.3896.58
Publisher’s Note: MDPI stays neutral with regard to jurisdictional claims in published maps and institutional affiliations.

