
Artificial Intelligence for Detecting and Quantifying Fatty Liver in Ultrasound Images: A Systematic Review

Abstract
:
1. Introduction
1.1. Background
1.2. Research Problem and Aim
2. Methods
2.1. Overview
2.2. Protocol and Registration
2.3. Search Sources
2.4. Search Terms
2.5. Study Eligibility Criteria
2.6. Study Selection
2.7. Data Extraction and Synthesis
2.8. Risk of Bias in Individual Studies
2.9. Data Checking Task
3. Results
3.1. Search Results
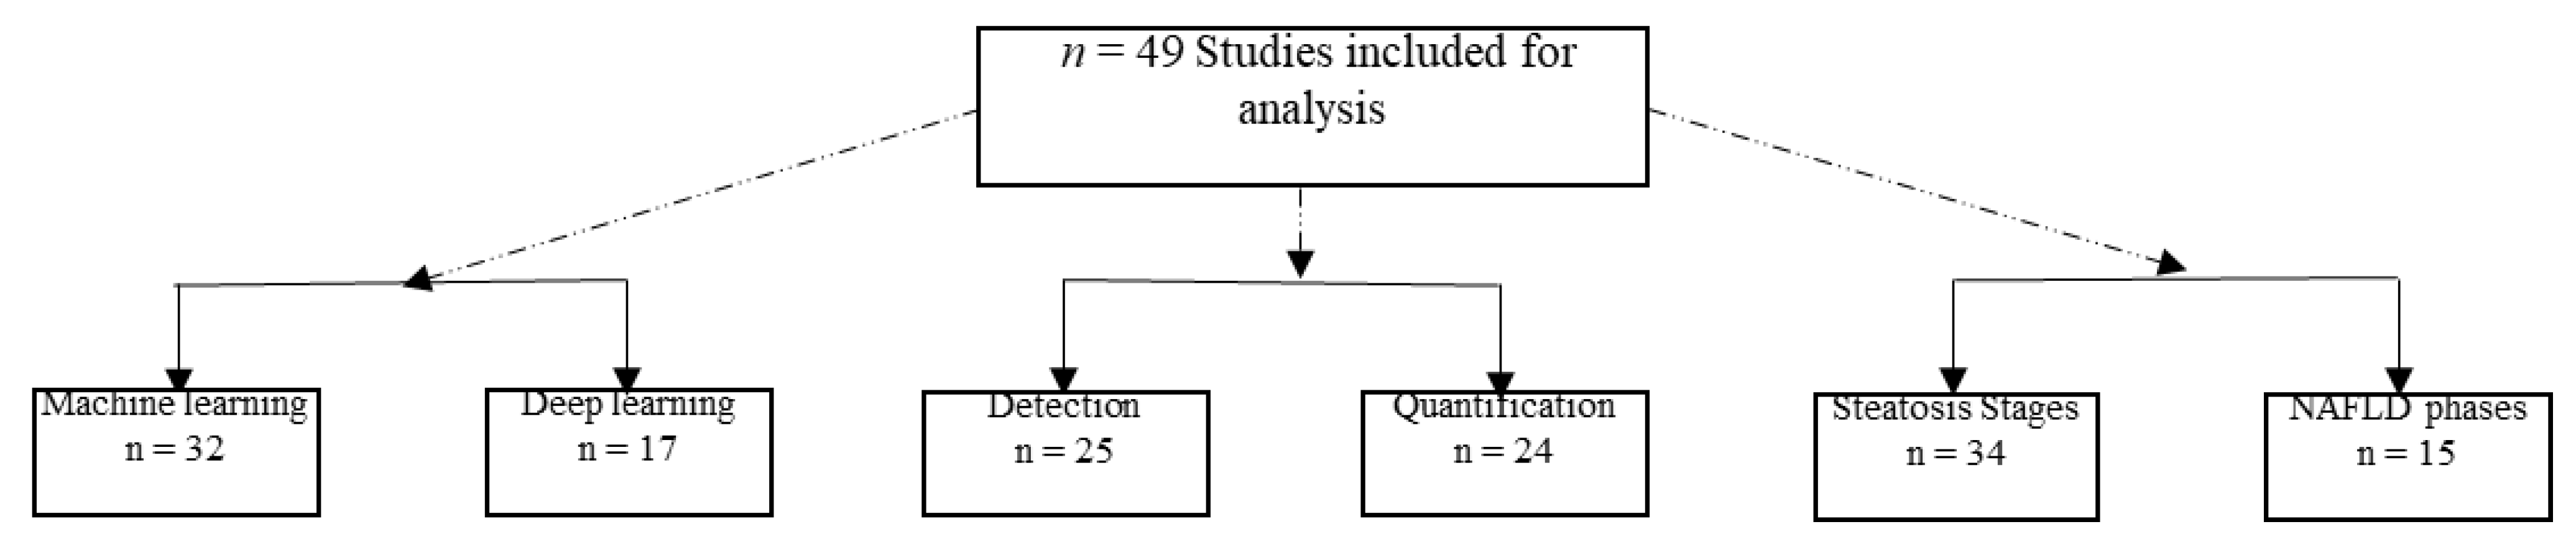
3.2. Description of the Included Studies
3.3. Study Characteristics
3.4. Definition of Result Themes
3.4.1. Evaluation of Modalities
3.4.2. Evaluation of Image Pre-Processing
3.4.3. Evaluation of Features
3.4.4. Cross-Validation and Data Splitting
3.4.5. Evaluation of Classification Models
3.4.6. Explanation of the Performance Measure

| Ref. No. | Patients Categories | Total no. of Images | AI Classifier | AUC | Sensitivity | Accuracy | Specificity | Main Findings |
|---|---|---|---|---|---|---|---|---|
| [36] | 1- normal 2- abnormal | 100 | Fuzzy Sugeno (FS) | Unknown | 100% | 100% | 100% | An automated diagnosis based on RT and DCT coefficients was used to classify a normal liver and a liver affected by fatty liver disease (FLD). Using only two features, the FS classifier presented the highest accuracy, sensitivity, and specificity, at 100%. Moreover, using just two elements, FLDI discriminated between normal and FLD. |
| [51] | 1- Normal 2- Mild 3- Moderate 4- Severe | 3200 | Inception v3 | Unknown | 99.78% | 99.91% | 100% | The final neural network, SteatosisNet, used clipped L-K sections (using transfer learning and a second neural network) to categorize the severity of FLD. The experimental findings show that the suggested model may predict FLD effectively, comparable to the usual conclusions noted by medical professionals. |
| [69] | 1- Normal 2- mild 3- moderate 4- severe | 820 | VGG-16 | for B Modes Images: Mild = 0.71 Moderate = 0.75 Severe = 0.88 for Entropy Images: Mild = 0.68 Moderate = 0.85 Severe = 0.90 | for B Modes Images: Mild = 73.18% Moderate = 63.25% Severe = 85.23% for Entropy Images: Mild = 64.10% Moderate = 70% Severe = 78.82% | for B Modes Images: Mild = 70% Moderate = 80% Severe = 97% for Entropy Images: Mild = 68% Moderate = 80% Severe = 83% | for B Modes Images: Mild = 60% Moderate = 74.82% Severe = 84.12% for Entropy Images: Mild = 70.16% Moderate = 86.54% Severe = 93.30% | When identifying mild and severe hepatic steatosis, there was no discernible difference between the VGG-16 model and entropy imaging. However, when it came to detecting moderate hepatic steatosis, ultrasonic entropy imaging performed better than the VGG-16 model. Interestingly, a physics-based analysis technique was as effective as DL and performed better at spotting mild to severe hepatic steatosis. |
| [44] | 1- Fatty liver 2- Not Fatty liver | 905 | CNN | unknown | 0.886 | 92.30% | 95.30% | Diagnosing NAFLD by US was compared to radiologists’ performance. Cloud AutoML Vision Beta allowed the creation of custom models trained on uploaded images using a CNN pre-trained through transfer learning. The model accurately detected NAFLD on US. |
| [47] | 1- normal 2- fatty 3- cirrhotic | 150 | Fuzzy neural network | unknown | unknown | Normal = 80% Fatty = 88% Cirrhosis = 80% Total = 82,67% | unknown | Through this work, proximity-based methods for building fuzzy neural classifiers in greater detail can be assessed, and more effective strategies for generating soft decisions can be learned. |
| [75] | 1- Normal 2- Mild 3- Moderate 4- Severe | 120 | Random forest | Unknown | Unknown | 90.84% | Unknown | Without using any features, RF had superior or comparable accuracy to SVM when classifying the severity of steatosis. In addition, human intra-observer and inter-observer agreement rates were outperformed by RF-based steatosis rating and SVM classification. |
| [37] | 1- normal 2- FLD 3- cirrhosis | 150 | probabilistic neural network | 0.98 | 96% | 97.33% | 100% | This work proposed a unique method for automatically distinguishing between a normal, FLD, and cirrhotic liver using US images. The technique combines CT, entropy features, and LSDA feature reduction. The suggested approach achieved high performance using a PNN classifier. |
| [45] | 1- healthy 2- mild 3- moderate 4- severe | Unknown | ResNet-18 | mild = 0.85, moderate = 0.90, severe = 0.93, | Unknown | Unknown | Unknown | The DL algorithm offers a trustworthy quantitative steatosis assessment across views and scanners in two multi-scanner cohorts. High diagnostic performance was achieved, matching or exceeding that of FibroScan. |
| [59] | 1- normal 2- fatty | 550 | support vector machine | 0.977 | 100% | 96.30% | 88.20% | This study used a steatosis level assessment utilizing B-mode US images via a CNN-based method. The method was effective and did not rely on an operator. Additionally, it performed better than both HI- and GLCM-based classifications. |
| [76] | 1- normal 2- fatty | 100 | Probabilistic Neural Network | Unknown | Unknown | Normal = 85% Fatty = 87.25% | Unknown | To automatically classify and recognize fatty and normal liver, five joint statistical feature parameters [mean, variance, contrast, ASM, and entropy] retrieved from three approaches [grey histogram statistic, GLDS, and GLCM] achieved good results when utilized as the input of a PNN. |
| [77] | S0: H-MRS index < 3.12%, S1: H-MRS index > 3.12% and < 8.77% S2: H-MRS index > 8.77% and < 13.69% S3: H-MRS index > 13.69% | 31,702 | CNN | Unknown | Unknown | 90% | Unknown | A high number of US images were used to train 5-layer CNNs. Results showed a good correlation with state-of-the-art magnetic resonance spectroscopy measurements. |
| [60] | 1- Susceptible to FL [Steatosis > 5%] 2- normal people [<5%] | 550 | support vector machine | 0.9999 | 97.20% | 98.64% | 100% | This method displayed and contrasted the outcomes of various DL algorithms based on how well they performed. The findings of this study demonstrated that the suggested pre-trained CNN could categorize US images of the liver as normal or fatty with excellent accuracy. |
| [78] | 1- normal 2- diseased | Unknown | Fuzzy Classifier | Unknown | Unknown | 100% | Unknown | This study identified how to automatically classify and recognize focal and diffuse liver diseases [including fatty and normal liver]. Advanced image processing methods such as MLPND and MI were used. Five features [contrast, cluster prominence, auto-correlation, cluster shade, and ASM] retrieved by the Haralick approaches achieved excellent results when utilized as the input of a fuzzy classifier. |
| [61] | 1- Does not have steatosis 2- has steatosis | 550 | CNN | Unknown | Unknown | 87.49% | Unknown | Using an 18-layer CNN with four convolutional layers resulted in an accuracy of 87.49%. Better image processing and dataset splitting techniques must be used for better results. |
| [73] | 1- normal 2- fatty 3- cirrhotic | 120 | Single-Layer Perceptron Network | Unknown | For Cirrhotic: 91.7% For Fatty: 96.7% | Unknown | 88.30% | Some features [mean grey level, first percentile, grey level co-occurrence matrix, contrast, entropy, correlation, ASM, attenuation and backscattering parameters, and scatterer separation distance] retrieved from GLCM approaches achieved good results for classifying fatty and cirrhotic liver when utilized as an input of a single-layer perceptron network with a functional link. |
| [41] | 1- normal 2- fatty liver | 100 | Decision Tree | 0.933 | 88.9% | 93.3% | 100% | This study had excellent performance results for classifying normal and fatty liver using three highly discriminatory noteworthy features [texture homogeneity, texture run percentage, and short-run emphasis] to train and build two supervised-learning-based classifiers [decision tree]. |
| [79] | 1- healthy 2- steatotic | 75 | Bayes | Unknown | normal = 95.83% steatosis = 85.71% | 93.54% | Unknown | This study’s key finding was that the AR coefficients obtained from a multi-scale Haar wavelet decomposition were relevant for classifying hepatic steatosis using US images. The results of global and local assessments of liver tissue defined by the Bayes factor can give doctors valuable information about the classification’s confidence and the classification itself. |
| [42] | 1- normal 2- abnormal | CNN | 1 | 100% | 100% | 100% | To reduce dimensionality and DL network speed without raising computational expenses, the system in this study used the inception model. First, the background of the original liver images was removed from the optimized images by stripping the border. When removing 15% of the background, the findings showed remarkable accuracy. | |
| [84] | 1- normal patient 2- fatty liver patient | 629 | Inception-v3 | 0.93 | 89.90% | 93.23% | 96.60% | This study used the Inception-v3 to detect steatosis and classify normal and fatty liver images, yielding an excellent test performance. |
| [48] | 1- normal 2- fatty 3- cirrhosis 4- hepatoma | unknown | K-nearest neighbour | Unknown | Unknown | 80% | Unknown | Using GLDS, RUNL, SGLDM, and FDTA algorithms, this study used a method created for computer-assisted liver tissue characterization. It was anticipated that it would be challenging to distinguish cirrhosis, fatty, and diffused diseases from normal, but the preliminary outcomes seemed incredibly good. |
| [53] | 1- normal 2- fatty | 100 | Self Organising Map | Unknown | Unknown | Unknown | Unknown | This study found representative feature vectors using a one-dimensional self-organizing map [SOM]. The most distinctive components were “maximum probability” and “uniformity.” The plots for normal and fatty liver superimposed images indicate distinct groups with little to no overlap. |
| [72] | 1- normal 2- mild 3- moderate 4- severe | 852 | CNN | 0.958 | Unknown | 95.45% | Unknown | In the NAFLD diagnosis stages, envelope signal and grayscale values were essential components of this study. However CNN showed the highest sensitivity and specificity when determining the severity of NAFLD. In addition, the deep-learning index had the best diagnostic performance in differentiating between mild and severe NAFLD (AUC = 0.958). |
| [55] | 1- normal 2- fatty 3- heterogeneous | 88 | SVM | Unknown | Heterogeneous= 100% Fatty= 93.3% Normal= 86.4% | 91% | Unknown | In this study, a suggested algorithm distinguished between normal, fatty, and heterogeneous liver images. Two steps make up the proposed algorithm’s operation. Without the aid of a medical specialist, the first stage automatically chooses a few ROIs from a liver US image. Then, the wavelet packet transform [WPT] was applied to chosen ROIs as a multi-scale texture analyser to extract some statistical features. A hierarchical binary classification method with an SVM classifier was used in the second stage. |
| [49] | 1- fatty 2- cirrhosis 3- normal | 90 | K-Nearest Neighbour | Unknown | Unknown | 82.2% | Unknown | The FDTA and the SGLDM were the texture analysis methods employed in this study. On three sets of liver US images—fatty, cirrhotic, and normal—algorithms were used. A 32 × 32 pixel ROI was used to extract textural features. A kNN classifier was used to categorize the results. Together, the FDTA and SGLDM provided an accuracy of 82.2%. |
| [74] | 1- normal 2- fatty 3- cirrhotic | 140 | Fuzzy logic | unknown | cirrhosis = 94% Fatty = 96% | Unknown | 92% | In this study, features such as the mean grey level, 10th percentile, contrast, ASM, entropy, correlation, attenuation, and speckle separation, produced good results when used as the input of fuzzy logic to build an automated categorization of cirrhosis, fatty, and normal liver. The findings of this research demonstrated the potential benefit of taking fuzzy reasoning into account during the “quantitative tissue characterization” of diffused liver diseases. |
| [80] | 1- Normal liver 2- abnormal liver [cirrhosis, fatty liver, hepatomegaly] | 60 | ANN | Unknown | 95% | 95% | Unknown | In this study, the feature set employed, training samples chosen, and the classifier’s ability to learn from the training examples all impacted how accurate the ANN classifier was. A comparison strategy indicated that the GLRLM and the mixed-feature set demonstrated high accuracy during both training and testing. |
| [62] | 1- normal 2- diseased | 550 | multi-scale two-dimensional mid-fusion residual neural network | Unknown | abnormal: 95.37% normal: 82.40% | 91.31% | abnormal: 92.42% normal: 88.99% | The study proposed a multi-scale two-dimensional mid-fusion residual neural network for improving NAFLD classification from US data and a GAN-based network for image synthesis to enlarge the training dataset (instead of using patch images). The study showed that fusing B-mode US features, local phase features, and radial symmetry features at a mid-stage outperform early and late fusion, which indicates a strong correlation among unique features obtained after convolution operation. |
| [50] | 1- normal 2- abnormal | 157 | VGG16 | 0.96 | 95% | 90.60% | 85% | The study suggested DL, transfer learning, and fine-tuning as methods for identifying fatty liver in US pictures with comparable performance to other similar studies. |
| [56] | 1- Normal 2- Fatty 3- Heterogeneous | 88 | ν-linear support vector | Unknown | Fatty = 93.3% Normal = 97.4% Heterogeneous = 94.7% | 95.40% | Unknown | The diagnosis of FLD and heterogeneous liver utilizing textural analysis of liver US images is a unique method presented in this research. First, a WPT was used to examine the ROI, and from each of the WPT sub-images, several statistical features were collected (median, standard deviation, and interquartile range). The classification was then performed using a “v-linear support vector” classifier. The suggested approach provided an overall accuracy of approximately 95%, demonstrating the system’s effectiveness. |
| [81] | 1- Normal 2- Mild 3- Moderate 4- Severe | 21,855 | ResNet-50 v2 | Normal =0985 Mild = 0.974 Moderate = 0.971 Severe = 0.981 | 0.838 | 0.841 | 0.948 | In this study, ResNet-50 v2 was trained and evaluated on many images and, as a result, performed relatively well compared to invasive diagnostic techniques for fatty liver. |
| [54] | 1- normal 2- fatty | 340 | probabilistic neural network | Unknown | 100% | 99% | 97% | This study revealed that it is possible to differentiate between normal and fatty liver images using the anisotropy feature supplied to PNN. |
| [82] | 1- normal 2- steatosis 3- hepatitis 4- cirrhosis | Unknown | k-nearest neighbour | Unknown | Unknown | normal = 86% steatosis = 90% hepatitis = 85% cirrhosis = 50% | Unknown | In this study, to automatically classify and recognize diffused liver diseases, three features (for steatosis: mean grey value, and for cirrhosis: mean grey value, texture energy, entropy) were retrieved from the GLCM approach. The approach achieved satisfactory results (except for cirrhosis) when utilized as a kNN input. |
| [57] | 1- normal 2- fatty 3- heterogeneous | 88 | support vector machine | Unknown | 98.84% | 98.86% | Unknown | In this work, feature fusion techniques were used to create a computer-aided diagnostic system for the hierarchical classification of normal, fatty, and heterogeneous liver US images. The prominent features of the parallel- and serial-fused feature spaces were chosen after features were extracted (energy, energy deviation, median, standard deviation, and interquartile range). Using the LOOCV technique and the SVM classifier, serial and parallel feature fusion modes, achieved maximum classification accuracies of 100% and 98.86%, respectively. |
| [71] | 1- healthy 2- diseased | 16,551 | A Binary Logistic Regression (BLR) | 0.986 | 95.45% | 95.74% | 96.00% | According to the findings, US images are more dependable than CT imaging for detecting hepatic steatosis. In addition, when ten features from a co-occurrence matrix were loaded into a BLR, it performed pretty well at differentiating between healthy and diseased fatty liver. |
| [68] | 1- normal 2- fatty 3- cancerous | 114 | logistic regression + support vector machine | Normal = 0.959 fatty = 0.956 cancer = 0.985 | Unknown | 87.50% | Unknown | The goal of this study was to examine the performance of a hybrid classifier (SVM and LR) in the diagnosis of liver steatosis utilizing a variety of US image features that were retrieved, including mean, SD, arithmetic mean, geometric mean, and skew. |
| [63] | 1- malignant fatty livers 2- benign fatty livers | 550 | Inception-ResNet-v2 | 0.992 | Unknown | 98.50% | 92% | The study results showed that the Inception-ResNet-v2 architecture-based model is more helpful in classifying medical images. In addition, the study showed that it performs better than classical methods regarding accuracy and AUC. |
| [38] | 1- normal 2- abnormal | 63 | single layer feed forward neural network [SLFFNN] | 0.97 | 97.59% | 96.75% | unknown | This study built an extreme learning machine (ELM) on a single-layer feed-forward neural network. Only hidden-to-output weights were taught, and input-to-hidden layer weights were created randomly to reduce computing costs. As a result, the results were more accurate with fewer features. |
| [58] | 1- Normal 2-Steatotic | 177 | Support Vector Machine | 0.88 | Unknown | 79.77% | Unknown | The results of this study indicated that the SVM was the most applicable for the discrimination of pathologic tissues in clinical practice, having better performance than the kNN and ANN. |
| [65] | 1- Fatty liver 2- Normal liver | 30 | Fisher’s linear discriminative analysis | Unknown | 100% | 92% | Unknown | This paper suggested a quantitative metric for the characterisation of the liver based on texture analysis. This process was motivated by the visual criteria used by radiologists. |
| [67] | 1- fibrosis 2- activity 3- steatosis | 144 | adaptive boosting, random forest, support vector machine | adaptive boosting = 085 random forest = 085 support vector machine = 0.85 | adaptive boosting = 87.5% random forest = 87,5% support vector machine = 93.8% | adaptive boosting = 85% random forest = 85% support vector machine = 85% | adaptive boosting = 76.9% random forest = 76.9% support vector machine = 69.2% | In this study, three different image types were utilized to extract features, and the analysis and classification results were satisfactory. |
| [66] | 1- Fatty liver 2- Normal liver | 180 | Z-score | Unknown | 100% | 95% | 90% | In this study, the best textural characteristics for classifying livers were found. A novel classification approach employing information fusion was suggested. It consisted of a linear combination of features weighted according to how well they could separate classes. |
| [43] | 1- Normal 2- Mild 3- Moderate 4- Severe | unknown | regression tree model | 0.93 | 87.50% | 90% | 92.86% | This study suggested that an existing learning-based model may perform well by combining US and shear wave features (shear wave attenuation, shear wave absorption, elasticity, dispersion slope, and echo attenuation). Furthermore, it supports that the target tissue may be identified and distinguished from other targets in the high-dimensional space established by the suggested ultrasonic parameter set. |
| [39] | 1- Normal 2- Fatty | 100 | probabilistic neural network | 0.9674 | 96% | 98% | 100% | GIST descriptors were used in this study to extract features. A marginal fisher analysis (MFA) data reduction method reduced many elements to the top seventeen. The Wilcoxon signed-rank test was used to create effective and reliable classifiers to rank a set of characteristics. Using eighteen features, the proposed approach identified all normal classes as normal (specificity was 100%). To train the classifiers, 10-fold stratified cross-validation was employed. The PNN classifier produced results with the highest classification accuracy of 98%, sensitivity of 96%, specificity, and PPV of 100%. |
| [40] | 1- normal 2-abnormal [fatty liver, hepatomegaly, cirrhosis] | 62 | Levenberg–Marquardt back propagation neural network | Unknown | 0.9808 | 0.9758 | 0.9722 | The proposed system was successfully able to detect and classify the FLD. |
| [46] | 1- S0 (none), 2- S1 (mild), 3- S2 (moderate), 4- S3 (severed) | 300 | Deep Convolutional Neural Network | Unknown | Unknown | 87.50% | Unknown | The outcomes demonstrate the power of deep convolutional neural networks (DCNN) and the higher information richness of RF data over B-mode for NAFLD staging. |
| [52] | 1- Normal 2- Mild 3- Moderate 4- Severe | 53 | support vector machine | Unknown | Unknown | 85.4% | Unknown | In this study, classifying normal, mild, moderate, and severe liver images was objectified using medical domain knowledge to diagnose the severity of fatty liver images. Findings demonstrated that the classification accuracy for a given feature category, such as run-length matrix (RLM), may be improved by appending feature sets. |
| [83] | 1- normal liver 2- low-grade fatty liver 3- moderate grade fatty liver 4- severe fatty liver | 500 | convolution neural network | Unknown | 83% | 90% | 95% | The study covered the impact of network width on a model. The study found that correctly expanding the network model’s width increased the model’s accuracy. “Skip connection” expedites network convergence while preserving the image’s original features. |
| [70] | 1- normal 2- positive | 744 | Support Vector Machine + Multi-Layered Perceptron Neural Net + Extreme Gradient Boost | Training set = 0.978 Testing set = 0.951 Validation set = 0.937 | Unknown | Unknown | Unknown | In this study, twenty-eight features were retrieved from US images using Mazda software after wavelet transforms were applied to process images. Features were used to distinguish between a healthy liver and NAFLD in paediatric individuals using an ML-based predictive analytic model [ensemble model]. The model did well in classification. |
| [64] | 1- Fatty 2- Normal | 550 | Fourier Convolutional Neural Networks | Unknown | Unknown | 84.40% | Unknown | This study suggested that to increase the classification speed of medical images, Fourier layers are more feasible. |
4. Discussion
- to overcome problems that currently exist in some classifiers, such as speckle noise, semantic gap, computational time, dimensionality reduction, and accuracy of images retrieved from a large dataset;
- to examine the effect of every parameter to improve the performance of the model;
- to use a more extensive dataset acquired by different operators from different patients;
- to consider a multipolar hospital;
- to consider more diseases stages;
- to use more advanced techniques to improve images before analysis;
- to automate all steps as much as possible;
- to examine more sophisticated features; and
- to implement classification models in the hardware and transfer the technology to a clinical setting.
4.1. Clinical Implications
- US powered by AI can be used to integrate an index in place of the H-MRS index of the biopsy method, which is invasive, expensive, scarcely available, and unsettling for patients [36,44,77]. US powered by AI also lessens the workload and the need for biopsy since it is considered a preliminary test for selecting patients eligible for biopsy [39,81].
- In the future, DL might be used to quantify NAFLD with the combined use of pathologic and laboratory tests [72].
- Future US devices will include functionalities for tissue analysis that are easier to implement in hardware [73].
4.2. Strengths
4.3. Limitations
5. Conclusions and Future Work
Author Contributions
Funding
Conflicts of Interest
References
- Younossi, Z.; Tacke, F.; Arrese, M.; Sharma, B.C.; Mostafa, I.; Bugianesi, E.; Wong, V.W.-S.; Yilmaz, Y.; George, J.; Fan, J.; et al. Global Perspectives on Nonalcoholic Fatty Liver Disease and Nonalcoholic Steatohepatitis. Hepatology 2019, 69, 2672–2682. [Google Scholar] [CrossRef] [PubMed] [Green Version]
- Li, J.; Zou, B.; Yeo, Y.H.; Feng, Y.; Xie, X.; Lee, D.H.; Fujii, H.; Wu, Y.; Kam, L.Y.; Ji, F.; et al. Prevalence, incidence, and outcome of non-alcoholic fatty liver disease in Asia, 1999–2019: A systematic review and meta-analysis. Lancet Gastroenterol. Hepatol. 2019, 4, 389–398. [Google Scholar] [CrossRef] [PubMed]
- Mantovani, A.; Scorletti, E.; Mosca, A.; Alisi, A.; Byrne, C.D.; Targher, G. Complications, morbidity and mortality of nonalcoholic fatty liver disease. Metabolism 2020, 111, 154170. [Google Scholar] [CrossRef] [PubMed]
- Alswat, K.; Aljumah, A.A.; Sanai, F.M.; Abaalkhail, F.; Alghamdi, M.; Al Hamoudi, W.K.; Al Khathlan, A.; Al Quraishi, H.; Al Rifai, A.; Al Zaabi, M.; et al. Nonalcoholic fatty liver disease burden–Saudi Arabia and United Arab Emirates, 2017–2030. Saudi J. Gastroenterol. Off. J. Saudi Gastroenterol. Assoc. 2018, 24, 211. [Google Scholar]
- Romero-Gómez, M.; Zelber-Sagi, S.; Trenell, M. Treatment of NAFLD with diet, physical activity and exercise. J. Hepatol. 2017, 67, 829–846. [Google Scholar] [CrossRef] [Green Version]
- Altamirano, J.; Miquel, R.; Katoonizadeh, A.; Gonzalez-Abraldes, J.; Duarte-Rojo, A.; Louvet, A.; Augustin, S.; Mookerjee, R.; Michelena, J.; Smyrk, T.C.; et al. A Histologic Scoring System for Prognosis of Patients with Alcoholic Hepatitis. Gastroenterology 2014, 146, 1231–1239.e6. [Google Scholar] [CrossRef]
- Wong, V.W.; Chan, W.K.; Chitturi, S.; Chawla, Y.; Dan, Y.Y.; Duseja, A.; Fan, J.; Goh, K.-L.; Hamaguchi, M.; Hashimoto, E.; et al. Asia–Pacific Working Party on Non-alcoholic Fatty Liver Disease guidelines 2017—Part 1: Definition, risk factors and assessment. J. Gastroenterol. Hepatol. 2018, 33, 70–85. [Google Scholar] [CrossRef] [Green Version]
- Phisalprapa, P.; Supakankunti, S.; Charatcharoenwitthaya, P.; Apisarnthanarak, P.; Charoensak, A.; Washirasaksiri, C.; Srivanichakorn, W.; Srivanichakorn, W. Cost-effectiveness analysis of ultrasonography screening for nonalcoholic fatty liver disease in metabolic syndrome patients. Medicine 2017, 96, e6585. [Google Scholar] [CrossRef]
- Piccinino, F.; Sagnelli, E.; Pasquale, G.; Giusti, G.; Battocchia, A.; Bernardi, M.; Bertolazzi, R.; Bianchi, F.; Brunelli, E.; Budillon, G.; et al. Complications following percutaneous liver biopsy: A multicentre retrospective study on 68 276 biopsies. J. Hepatol. 1986, 2, 165–173. [Google Scholar] [CrossRef]
- Middleton, M.S.; Van Natta, M.L.; Heba, E.R.; Alazraki, A.; Trout, A.T.; Masand, P.; Brunt, E.M.; Kleiner, D.E.; Doo, E.; Tonascia, J.; et al. Diagnostic accuracy of magnetic resonance imaging hepatic proton density fat fraction in pediatric nonalcoholic fatty liver disease. Hepatology 2018, 67, 858–872. [Google Scholar] [CrossRef] [Green Version]
- Zhou, L.-Q.; Wang, J.-Y.; Yu, S.-Y.; Wu, G.-G.; Wei, Q.; Deng, Y.-B.; Wu, X.-L.; Cui, X.-W.; Dietrich, C.F. Artificial intelligence in medical imaging of the liver. World J. Gastroenterol. 2019, 25, 672–682. [Google Scholar] [CrossRef] [PubMed]
- Colom, R.; Karama, S.; Jung, R.E.; Haier, R.J. Human intelligence and brain networks. Dialog. Clin. Neurosci. 2010, 12, 489–501. [Google Scholar] [CrossRef] [PubMed]
- Ben-Israel, I. Towards Regulation of AI Systems: Global Perspectives on the Development of a Legal Framework on Artificial Intelligence [AI] Systems Based on the Council of Europe’s Standards on Human Rights, Democracy and the Rule of Law; Council of Europe: London, UK, 2020. [Google Scholar]
- Masuzaki, R.; Kanda, T.; Sasaki, R.; Matsumoto, N.; Nirei, K.; Ogawa, M.; Moriyama, M. Application of artificial intelligence in hepatology: Minireview. Artif. Intell. Gastroenterol. 2020, 1, 5–11. [Google Scholar] [CrossRef]
- LeCun, Y.; Bengio, Y.; Hinton, G. Deep learning. Nature 2015, 521, 436–444. [Google Scholar] [CrossRef] [PubMed]
- Sutton, R.S.; Barto, A.G. Reinforcement Learning: An Introduction, 2nd ed.; The MIT Press: Cambridge, MA, USA, 2017. [Google Scholar]
- Jamshidi, M.B.; Roshani, S.; Talla, J.; Lalbakhsh, A.; Peroutka, Z.; Roshani, S.; Parandin, F.; Malek, Z.; Daneshfar, F.; Niazkar, H.R.; et al. A Review of the Potential of Artificial Intelligence Approaches to Forecasting COVID-19 Spreading. AI 2022, 3, 493–511. [Google Scholar] [CrossRef]
- Jamshidi, M.B.; Heydari, M.; Talla, J.; Peroutka, Z.; Ahmadi, M.; Mehraeen, E.; Abdollahi, H.; Karimi, A. A comprehensive review of radiology smartphone applications. In Artificial Intelligence Strategies for Analyzing COVID-19 Pneumonia Lung Imaging; IOP Publishing Ltd.: Bristol, UK, 2022; Volume 1, p. 4. [Google Scholar]
- Alzubaidi, M.; Zubaydi, H.D.; Bin-Salem, A.A.; Abd-Alrazaq, A.A.; Ahmed, A.; Househ, M. Role of deep learning in early detection of COVID-19: Scoping review. Comput. Methods Programs Biomed. Updat. 2021, 1, 100025. [Google Scholar] [CrossRef] [PubMed]
- Biswas, M.R.; Alzubaidi, M.S.; Shah, U.; Abd-Alrazaq, A.A.; Shah, Z. A scoping review to find out worldwide COVID-19 vaccine hesitancy and its underlying determinants. Vaccines 2021, 9, 1243. [Google Scholar] [CrossRef] [PubMed]
- Srivastava, V.; Kumar, D.; Roy, S. A median based quadrilateral local quantized ternary pattern technique for the classification of dermatoscopic images of skin cancer. Comput. Electr. Eng. 2022, 102, 108259. [Google Scholar] [CrossRef]
- Pal, D.; Reddy, P.B.; Roy, S. Attention UW-Net: A fully connected model for automatic segmentation and annotation of chest X-ray. Comput. Biol. Med. 2022, 150, 106083. [Google Scholar] [CrossRef]
- Piscaglia, F.; Cucchetti, A.; Benlloch, S.; Vivarelli, M.; Berenguer, J.; Bolondi, L.; Pinna, A.D.; Berenguer, M. Prediction of significant fibrosis in hepatitis C virus infected liver transplant recipients by artificial neural network analysis of clinical factors. Eur. J. Gastroenterol. Hepatol. 2006, 18, 1255–1261. [Google Scholar] [CrossRef]
- Zhen, S.H.; Cheng, M.; Tao, Y.B.; Wang, Y.F.; Juengpanich, S.; Jiang, Z.Y.; Jiang, Y.K.; Yan, Y.Y.; Lu, W.; Lue, J.M.; et al. Deep learning for accurate diagnosis of liver tumor based on magnetic resonance imaging and clinical data. Front. Oncol. 2020, 10, 680. [Google Scholar] [CrossRef] [PubMed]
- Vanderbeck, S.; Bockhorst, J.; Komorowski, R.; Kleiner, D.E.; Gawrieh, S. Automatic classification of white regions in liver biopsies by supervised machine learning. Hum. Pathol. 2013, 45, 785–792. [Google Scholar] [CrossRef] [PubMed]
- Naganawa, S.; Enooku, K.; Tateishi, R.; Akai, H.; Yasaka, K.; Shibahara, J.; Ushiku, T.; Abe, O.; Ohtomo, K.; Kiryu, S. Imaging prediction of nonalcoholic steatohepatitis using computed tomography texture analysis. Eur. Radiol. 2018, 28, 3050–3058. [Google Scholar] [CrossRef]
- Lee, H.W.; Sung, J.J.Y.; Ahn, S.H. Artificial intelligence in liver disease. J. Gastroenterol. Hepatol. 2021, 36, 539–542. [Google Scholar] [CrossRef] [PubMed]
- Le Berre, C.; Sandborn, W.J.; Aridhi, S.; Devignes, M.D.; Fournier, L.; Smail-Tabbone, M.; Danese, S.; Peyrin-Biroulet, L. Application of artificial intelligence to gastroenterology and hepatology. Gastroenterology 2020, 158, 76–94. [Google Scholar] [CrossRef] [PubMed] [Green Version]
- Spann, A.; Yasodhara, A.; Kang, J.; Watt, K.; Wang, B.; Goldenberg, A.; Bhat, M. Applying machine learning in liver disease and transplantation: A comprehensive review. Hepatology 2020, 71, 1093–1105. [Google Scholar] [CrossRef] [PubMed]
- Wong, G.L.; Yuen, P.; Ma, A.J.; Chan, A.W.; Leung, H.H.; Wong, V.W. Artificial intelligence in prediction of non-alcoholic fatty liver disease and fibrosis. J. Gastroenterol. Hepatol. 2021, 36, 543–550. [Google Scholar] [CrossRef]
- Lupsor-Platon, M.; Serban, T.; Silion, A.; Tirpe, G.; Tirpe, A.; Florea, M. Performance of Ultrasound Techniques and the Potential of Artificial Intelligence in the Evaluation of Hepatocellular Carcinoma and Non-Alcoholic Fatty Liver Disease. Cancers 2021, 13, 790. [Google Scholar] [CrossRef]
- Popa, S.L.; Ismaiel, A.; Cristina, P.; Cristina, M.; Chiarioni, G.; David, L.; Dumitrascu, D.L. Nonalcoholic fatty liver disease: Implementing complete automated diagnosis and staging. A systematic review. Diagnostics 2021, 11, 1078. [Google Scholar] [CrossRef]
- Decharatanachart, P.; Chaiteerakij, R.; Tiyarattanachai, T.; Treeprasertsuk, S. Application of artificial intelligence in chronic liver diseases: A systematic review and meta-analysis. BMC Gastroenterol. 2021, 21, 10. [Google Scholar] [CrossRef]
- Ouzzani, M.; Hammady, H.; Fedorowicz, Z.; Elmagarmid, A. Rayyan—A web and mobile app for systematic reviews. Syst. Rev. 2016, 5, 210. [Google Scholar] [CrossRef] [PubMed]
- Flick, U. The SAGE Handbook of Qualitative Data Collection; Sage: Thousand Oaks, CA, USA, 2018. [Google Scholar] [CrossRef]
- Acharya, U.R.; Fujita, H.; Sudarshan, V.K.; Mookiah, M.R.; Koh, J.E.; Tan, J.H.; Hagiwara, Y.; Chua, C.K.; Junnarkar, S.P.; Vijayananthan, A.; et al. An integrated index for identification of fatty liver disease using radon transform and discrete cosine transform features in ultrasound images. Inf. Fusion 2016, 31, 43–53. [Google Scholar] [CrossRef]
- Acharya, U.R.; Raghavendra, U.; Fujita, H.; Hagiwara, Y.; Koh, J.E.; Hong, T.J.; Sudarshan, V.K.; Vijayananthan, A.; Yeong, C.H.; Gudigar, A.; et al. Automated characterization of fatty liver disease and cirrhosis using curvelet transform and entropy features extracted from ultrasound images. Comput. Biol. Med. 2016, 79, 250–258. [Google Scholar] [CrossRef] [PubMed]
- Kuppili, V.; Biswas, M.; Sreekumar, A.; Suri, H.S.; Saba, L.; Edla, D.R.; Marinhoe, R.T.; Sanches, J.; Suri, J.S. Extreme Learning Machine Framework for Risk Stratification of Fatty Liver Disease Using Ultrasound Tissue Characterization. J. Med. Syst. 2017, 41, 152. [Google Scholar] [CrossRef] [PubMed]
- Acharya, U.R.; Fujita, H.; Bhat, S.; Raghavendra, U.; Gudigar, A.; Molinari, F.; Vijayananthan, A.; Ng, K.H. Decision support system for fatty liver disease using GIST descriptors extracted from ultrasound images. Inf. Fusion 2016, 29, 32–39. [Google Scholar] [CrossRef]
- Saba, L.; Dey, N.; Ashour, A.; Samanta, S.; Nath, S.S.; Chakraborty, S.; Sanches, J.; Kumar, D.; Marinho, R.; Suri, J.S. Automated stratification of liver disease in ultrasound: An online accurate feature classification paradigm. Comput. Methods Programs Biomed. 2016, 130, 118–134. [Google Scholar] [CrossRef]
- Acharya, U.R.; Sree, S.V.; Ribeiro, R.; Krishnamurthi, G.; Marinho, R.; Sanches, J.; Suri, J.S. Data mining framework for fatty liver disease classification in ultrasound: A hybrid feature extraction paradigm. Med. Phys. 2012, 39, 4255–4264. [Google Scholar] [CrossRef] [Green Version]
- Biswas, M.; Kuppili, V.; Edla, D.R.; Suri, H.S.; Saba, L.; Marinhoe, R.T.; Sanches, J.; Suri, J.S. Symtosis: A liver ultrasound tissue characterization and risk stratification in optimized deep learning paradigm. Comput. Methods Programs Biomed. 2018, 155, 165–177. [Google Scholar] [CrossRef]
- Shi, X.; Ye, W.; Liu, F.; Zhang, R.; Hou, Q.; Shi, C.; Yu, j.; Shi, Y. Ultrasonic liver steatosis quantification by a learning-based acoustic model from a novel shear wave sequence. BioMed. Eng. OnLine 2019, 18, 121. [Google Scholar] [CrossRef] [Green Version]
- Gummadi, S.; Nirmal, P.; Naringrekar, H.; Needleman, L.; Lyshchik, A.; O’Kane, P.; Civan, J.; Eisenbrey, J.R. Automated Machine Learning in the Sonographic Diagnosis of Non-alcoholic Fatty Liver Disease. Adv. Ultrasound Diagn. Ther. 2020, 4, 176. [Google Scholar] [CrossRef]
- Li, B.; Tai, D.-I.; Yan, K.; Chen, Y.-C.; Chen, C.-J.; Huang, S.-F.; Hsu, T.-H.; Yu, W.-T.; Xiao, J.; Le, L.; et al. Accurate and generalizable quantitative scoring of liver steatosis from ultrasound images via scalable deep learning. World J. Gastroenterol. 2022, 28, 2494–2508. [Google Scholar] [CrossRef]
- Sanabria, S.J.; Dahl, J.; Pirmoazen, A.; Kamaya, A.; ElKaffas, A. Learning steatosis staging with two-dimensional Convolutional Neural Networks: Comparison of accuracy of clinical B-mode with a co-registered spectrogram representation of RF Data. In Proceedings of the 2020 IEEE International Ultrasonics Symposium (IUS), Las Vegas, NV, USA, 7–11 September 2020; pp. 1–4. [Google Scholar] [CrossRef]
- Pavlopoulos, S.; Kyriacou, E.; Koutsouris, D.; Blekas, K.; Stafylopatis, A.; Zoumpoulis, P. Fuzzy neural network-based texture analysis of ultrasonic images. IEEE Comput. Graph. Appl. 2000, 19, 39–47. [Google Scholar] [CrossRef]
- Kyriacou, E.; Pavlopoulos, S.; Koutsouris, D.; Zoumpoulis, P.; Theotokas, I. Computer assisted characterization of liver tissue using image texture analysis techniques on B-scan images. In Proceedings of the 19th Annual International Conference of the IEEE Engineering in Medicine and Biology Socie-ty. ‘Magnificent Milestones and Emerging Opportunities in Medical Engineering’ [Cat. No. 97CH36136], Chicago, IL, USA, 30 October–2 September 1997; pp. 806–809. [Google Scholar]
- Kyriacou, E.; Pavlopoulos, S.; Konnis, G.; Koutsouris, D.; Zoumpoulis, P.; Theotokas, L. Computer assisted characterization of diffused liver disease using image texture analysis techniques on B-scan images. In Proceedings of the 1997 IEEE Nuclear Science Symposium Conference Record, Albuquerque, NM, USA, 9–15 November 1997. [Google Scholar] [CrossRef]
- Reddy, D.S.; Bharath, R.; Rajalakshmi, P. A Novel Computer-Aided Diagnosis Framework Using Deep Learning for Classification of Fatty Liver Disease in Ultrasound Imaging. In Proceedings of the 2018 IEEE 20th International Conference on e-Health Networking, Applications and Services (Healthcom), Ostrava, Czech Republic, 17–20 September 2018; pp. 1–5. [Google Scholar] [CrossRef]
- Rhyou, S.-Y.; Yoo, J.-C. Cascaded Deep Learning Neural Network for Automated Liver Steatosis Diagnosis Using Ultrasound Images. Sensors 2021, 21, 5304. [Google Scholar] [CrossRef]
- Subramanya, M.B.; Kumar, V.; Mukherjee, S.; Saini, M. A CAD system for B-mode fatty liver ultrasound images using texture features. J. Med. Eng. Technol. 2014, 39, 123–130. [Google Scholar] [CrossRef]
- Mukherjee, S.; Chakravorty, A.; Ghosh, K.; Roy, M.; Adhikari, A.; Mazumdar, S. Corroborating the Subjective Classification of Ultrasound Images of Normal and Fatty Human Livers by the Radiologist through Texture Analysis and SOM. In Proceedings of the 15th International Conference on Advanced Computing and Communications (ADCOM 2007), Guwahati, India, 18–21 December 2007; pp. 197–202. [Google Scholar] [CrossRef]
- Neogi, N.; Adhikari, A.; Roy, M. Use of a novel set of features based on texture anisotropy for identification of liver steatosis from ultrasound images: A simple method. Multimedia Tools Appl. 2018, 78, 11105–11127. [Google Scholar] [CrossRef]
- Owjimehr, M.; Danyali, H.; Helfroush, M.S. An improved method for liver diseases detection by ultrasound image analysis. J. Med. Signals Sens. 2015, 5, 21–29. [Google Scholar] [CrossRef] [PubMed]
- Minhas, F.u.A.A.; Sabih, D.; Hussain, M. Automated Classification of Liver Disorders using Ultrasound Images. J. Med. Syst. 2011, 36, 3163–3172. [Google Scholar] [CrossRef] [PubMed]
- Alivar, A.; Danyali, H.; Helfroush, M.S. Hierarchical classification of normal, fatty and heterogeneous liver diseases from ultrasound images using serial and parallel feature fusion. Biocybern. Biomed. Eng. 2016, 36, 697–707. [Google Scholar] [CrossRef]
- Andrade, A.; Silva, J.S.; Santos, J.; Belo-Soares, P. Classifier Approaches for Liver Steatosis using Ultrasound Images. Procedia Technol. 2012, 5, 763–770. [Google Scholar] [CrossRef] [Green Version]
- Byra, M.; Styczynski, G.; Szmigielski, C.; Kalinowski, P.; Michałowski, Ł.; Paluszkiewicz, R.; Ziarkiewicz-Wróblewska, B.; Zieniewicz, K.; Sobieraj, P.; Nowicki, A. Transfer learning with deep convolutional neural network for liver steatosis assessment in ultrasound images. Int. J. Comput. Assist. Radiol. Surg. 2018, 13, 1895–1903. [Google Scholar] [CrossRef] [Green Version]
- Zamanian, H.; Mostaar, A.; Azadeh, P.; Ahmadi, M. Implementation of Combinational Deep Learning Algorithm for Non-alcoholic Fatty Liver Classification in Ultrasound Images. J. Biomed. Phys. Eng. 2021, 11, 73–84. [Google Scholar] [CrossRef] [PubMed]
- Simion, G.; Caleanu, C.; Barbu, P.A. Ultrasound liver steatosis diagnosis using deep convolutional neural networks. In Proceedings of the 2021 IEEE 27th International Symposium for Design and Technology in Electronic Packaging [SIITME], Timisoara, Romania, 27–30 October 2021; pp. 326–329. [Google Scholar]
- Che, H. Improved Nonalcoholic Fatty Liver Disease Diagnosis from Ultrasound Data Based on Deep Learning. Master’s Thesis, Rutgers, The State University of New Jersey, New Brunswick, NJ, USA, 2021. [Google Scholar]
- Mohammad, U.F.; Almekkawy, M. Automated Detection of Liver Steatosis in Ultrasound Images Using Convolutional Neural Networks. In Proceedings of the 2021 IEEE International Ultrasonics Symposium (IUS), Xi’an, China, 11–16 September 2021; pp. 1–4. [Google Scholar] [CrossRef]
- Mohammad, U.F.; Almekkawy, M. A Substitution of Convolutional Layers by FFT Layers—A Low Computational Cost Version. In Proceedings of the 2021 IEEE International Ultrasonics Symposium (IUS), Xi’an, China, 11–16 September 2021; pp. 1–3. [Google Scholar] [CrossRef]
- Singh, M.; Singh, S.; Gupta, S. A New Quantitative Metric for Liver Classification from Ultrasound Images. Int. J. Comput. Electr. Eng. 2012, 4, 605–607. [Google Scholar] [CrossRef] [Green Version]
- Singh, M.; Singh, S.; Gupta, S. An information fusion based method for liver classification using texture analysis of ultrasound images. Inf. Fusion 2014, 19, 91–96. [Google Scholar] [CrossRef]
- Li, W.; Huang, Y.; Zhuang, B.-W.; Liu, G.-J.; Hu, H.-T.; Li, X.; Liang, J.-Y.; Wang, Z.; Huang, X.-W.; Zhang, C.-Q.; et al. Multiparametric ultrasomics of significant liver fibrosis: A machine learning-based analysis. Eur. Radiol. 2018, 29, 1496–1506. [Google Scholar] [CrossRef]
- Chen, C.-I.; Chen, T.-B.; Lu, N.-H.; Du, W.-C.; Liang, C.-Y.; Liu, K.-I.; Hsu, S.-Y.; Lin, L.W.; Huang, Y.-H. Classification for liver ultrasound tomography by posterior attenuation correction with a phantom study. Proc. Inst. Mech. Eng. Part H J. Eng. Med. 2019, 233, 1100–1112. [Google Scholar] [CrossRef]
- Chen, J.-R.; Chao, Y.-P.; Tsai, Y.-W.; Chan, H.-J.; Wan, Y.-L.; Tai, D.-I.; Tsui, P.-H. Clinical Value of Information Entropy Compared with Deep Learning for Ultrasound Grading of Hepatic Steatosis. Entropy 2020, 22, 1006. [Google Scholar] [CrossRef]
- Das, A.; Connell, M.; Khetarpal, S. Digital image analysis of ultrasound images using machine learning to diagnose pediatric nonalcoholic fatty liver disease. Clin. Imaging 2021, 77, 62–68. [Google Scholar] [CrossRef]
- Rivas, E.C.; Moreno, F.; Benitez, A.; Morocho, V.; Vanegas, P.; Medina, R. Hepatic Steatosis detection using the co-occurrence matrix in tomography and ultrasound images. In Proceedings of the 20th Symposium on Signal Processing, Images and Computer Vision (STSIVA), Bogota, Colombia, 2–4 September 2015; pp. 1–7. [Google Scholar] [CrossRef] [Green Version]
- Cao, W.; An, X.; Cong, L.; Lyu, C.; Zhou, Q.; Guo, R. Application of Deep Learning in Quantitative Analysis of 2-Dimensional Ultrasound Imaging of Nonalcoholic Fatty Liver Disease. J. Ultrasound Med. 2019, 39, 51–59. [Google Scholar] [CrossRef]
- Kadah, Y.M.; Farag, A.A.; Zurada, J.M.; Badawi, A.M.; Youssef, A.M. Classification algorithms for quantitative tissue characterization of diffuse liver disease from ultrasound images. IEEE Trans. Med. Imaging 1996, 15, 466–478. [Google Scholar] [CrossRef]
- Badawi, A.M.; Derbala, A.S.; Youssef, A.-B.M. Fuzzy logic algorithm for quantitative tissue characterization of diffuse liver diseases from ultrasound images. Int. J. Med. Inform. 1999, 55, 135–147. [Google Scholar] [CrossRef]
- Mihailescu, D.M. Computer aided diagnosis method for steatosis rating in ultrasound images using random forests. Med. Ultrason. 2013, 15, 184–190. [Google Scholar] [CrossRef] [PubMed] [Green Version]
- Huang, Y.; Han, X.; Tian, X.; Zhao, Z.; Zhao, J.; Hao, D. Texture analysis of ultrasonic liver images based on spatial domain methods. In Proceedings of the 2010 3rd International Congress on Image and Signal Processing, Yantai, China, 16–18 October 2010; Volume 2, pp. 562–565. [Google Scholar] [CrossRef]
- Colantonio, S.; Salvati, A.; Caudai, C.; Bonino, F.; De Rosa, L.; Pascali, M.A.; Germanese, D.; Brunetto, M.R.; Faita, F. A Deep Learning Approach for Hepatic Steatosis Estimation from Ultrasound Imaging. In Proceedings of the International Conference on Computational Collective Intelligence, Kallithea, Rhodes, Greece, 29 September–1 October 2021; Springer: Cham, Switzerland; pp. 703–714. [Google Scholar] [CrossRef]
- Suganya, R.; Kirubakaran, R.; Rajaram, S. Classification and Retrieval of Focal and Diffuse Liver from Ultrasound Images Using Machine Learning Techniques. In Proceedings of the First International Symposium on Signal Processing and Intelligent Recognition Systems (SIRS-2014), Trivandrum, India, 13–15 March 2014; Volume 264, pp. 253–261. [Google Scholar] [CrossRef]
- Ribeiro, R.; Marinho, R.; Sanches, J. Global and local detection of liver steatosis from ultrasound. In Proceedings of the Annual International Conference of the IEEE Engineering in Medicine and Biology Society, San Diego, CA, USA, 28 August–1 September 2012; pp. 6547–6550. [Google Scholar]
- Kalyan, K.; Jakhia, B.; Lele, R.D.; Joshi, M.; Chowdhary, A. Artificial Neural Network Application in the Diagnosis of Disease Conditions with Liver Ultrasound Images. Adv. Bioinform. 2014, 2014, 708279. [Google Scholar] [CrossRef] [PubMed] [Green Version]
- Chou, T.-H.; Yeh, H.-J.; Chang, C.-C.; Tang, J.-H.; Kao, W.-Y.; Su, I.-C.; Li, C.-H.; Chang, W.-H.; Huang, C.-K.; Sufriyana, H.; et al. Deep learning for abdominal ultrasound: A computer-aided diagnostic system for the severity of fatty liver. J. Chin. Med. Assoc. 2021, 84, 842–850. [Google Scholar] [CrossRef]
- Mitrea, D.; Nedevschi, S.; Cenan, C.; Platon, M.L. Exploring texture-based parameters for noninvasive detection of diffuse liver diseases and liver cancer from ultrasound images. In Proceedings of the 8th WSEAS International Conference on Mathematical Methods and Computational Techniques in Electrical Engineering, Bucharest, Romania, 16–18 October 2006. [Google Scholar]
- Zhang, L.; Zhu, H.; Yang, T. Deep Neural Networks for fatty liver ultrasound images classification. In Proceedings of the 2019 Chinese Control and Decision Conference (CCDC), Nanchang, China, 3–5 June 2019; pp. 4641–4646. [Google Scholar] [CrossRef]
- Constantinescu, E.C.; Udriștoiu, A.-L.; Udriștoiu, C.; Iacob, A.V.; Gruionu, L.G.; Gruionu, G.; Săndulescu, L.; Săftoiu, A. Transfer learning with pre-trained deep convolutional neural networks for the automatic assessment of liver steatosis in ultrasound images. Med. Ultrason. 2020, 23, 135–139. [Google Scholar] [CrossRef]
- Anderson, D.R.; Sweeney, D.J.; Williams, T.A.; Camm, J.D.; Cochran, J.J. Statistics for Business & Economics; Cengage Learning: Belmont, CA, USA, 2016. [Google Scholar]
- Sokolova, M.; Lapalme, G. A systematic analysis of performance measures for classification tasks. Inf. Process. Manag. 2009, 45, 427–437. [Google Scholar] [CrossRef]


| Parameters | Inclusion Criteria | Exclusion Criteria |
|---|---|---|
| Population | Patients with Hepatic Steatosis (NAFLD) and developed stages. | - Alcoholic fatty liver disease (AFLD) includes simple AFLD and alcoholic steatohepatitis (ASH). - Patients suffering from liver illnesses other than steatosis (e.g.,: tumors). |
| Intervention | AI that used ultrasound images to detect and quantify hepatic steatosis. | Non-AI-based technologies and AI technologies used other types of imaging (MRI, X-ray, etc.) |
| Comparator | N/A | N/A |
| Outcome | Detection and quantification of hepatic steatosis. | Any other outcome that is not mentioned in the inclusion criteria |
| Performance measures | The metrics to be measured are accuracy, sensitivity (recall), specificity, or AUC. | Any other measures that are not mentioned in the inclusion criteria |
| Study Type | Peer-reviewed articles, theses, dissertations, and reports. | Reviews, conference abstracts, and proposals. |
| Study Design | Empirical studies. | Any other study design that is not mentioned in the inclusion criteria |
| Study language | English | Studies written in any language other than English. |
| Study time frame | No limitation | No limitation |
| Age, Gender, Ethnicity | No limitation | No limitation |
| Country | Total Number of Studies | Studies with Deep Learning Classifying Approach | Studies with Machine Learning Classifying Approach | Publication Period * |
|---|---|---|---|---|
| India | 8 (≈16%) | 1 | 7 | 2007 → 2019 |
| USA | 7 (≈16%) | 5 | 2 | 1996 → 2021 |
| China | 5 (≈10%) | 2 | 3 | 2010 → 2020 |
| Portugal | 5 (≈10%) | 1 | 4 | 2012 ← 2018 |
| Romania | 4 (≈8%) | 2 | 2 | 2006 → 2021 |
| Taiwan | 4 (≈8%) | 3 | 1 | 2019 → 2021 |
| Greece | 3 (≈6%) | 0 | 3 | 1997 ← 2000 |
| Iran | 3 (≈6%) | 0 | 3 | 2015 ← 2021 |
| Malaysia | 3 (≈6%) | 0 | 3 | 2016 |
| Italy | 2 (≈4%) | 1 | 1 | 2016–2021 |
| Egypt | 1 (≈2%) | 0 | 1 | 1999 |
| Korea | 1 (≈2%) | 1 | 0 | 2021 |
| Pakistan | 1 (≈2%) | 0 | 1 | 2012 |
| Poland | 1 (≈2%) | 1 | 0 | 2018 |
| Venezuela | 1 (≈2%) | 0 | 1 | 2015 |
| Total | 49 | 17 (≈35%) | 32 (≈56%) | 1996 → 2021 |
| Modality Manufacturer | Modalities Model | Average Frequencies in MHz | Studies Reference Number |
|---|---|---|---|
| Philips | CX 50 | 3.5 | [36,37,38,39,40] |
| CX c50 | 3 | [41,42] | |
| EPIQ | 40 | [43] | |
| EPIQ 7G | 3 | [44,45,46] | |
| HD15 | - | [45] | |
| IU22 | - | [44,45] | |
| Siemens | ACUSON 128XP/10 | 3.5 | [47,48,49] |
| ACUSON S1000 | - | [50] | |
| ACUSON S2000 | - | [45] | |
| ACUSON sequoia 512 | 4.5 | [51] | |
| ACUSON X300 | - | [52] | |
| Sonoline Versa Plus | 3.5 | [53,54] | |
| Toshiba | SSA-700A | - | [45] |
| SSA 550 | 5 | [55,56,57] | |
| Xario | - | [45] | |
| TUS-A300 | - | [45] | |
| GE | Logic E9 | 4 | [44,45,58] |
| Vivid E9 | 2.5 | [59,60,61,62,63,64] | |
| Voluson 730 Pro | 3.5 | [65,66] | |
| Logic S8 | - | [45] | |
| Canon | Aplio 500 | 3.5 | [44,67] |
| i800 | - | [44] | |
| Hitachi | Avius | - | [45] |
| Preirus | - | [45] | |
| CIRS | 040GSE | - | [68] |
| Burlington | Terason 3000 | 3.5 | [69] |
| Sonosite | M-Turbo | 3 | [70] |
| ESAOTE | MyLab 50 | - | [71] |
| Mindray | Resona 7 | 5 | [72] |
| KRETZ | SA 3200 | 4 | [73,74] |
| Unknown | Unknown | - | [75,76,77,78,79,80,81,82,83] |
| In | AI learning Type | Ref. No. |
|---|---|---|
| ≈50%, 50%, 0% | machine learning | [43,48,78] |
| ≈56%, 44%, 0% | Machine learning | [82] |
| ≈60%, 20%, 20% | Machine learning | [45] |
| ≈60%, 40%, 0% | Deep learning | [77] |
| ≈60%, 40%, 0% | machine learning | [81] |
| ≈70%, 30%, 0% | Deep learning | [71] |
| ≈70%, 30%, 0% | machine learning | [44,51] |
| ≈75%, 25%, 0% | Deep learning | [72] |
| ≈78%, 28%, 0% | Deep learning | [69] |
| ≈79%, 21%, 0% | Deep learning | [70] |
| ≈80%, 10%, 10% | machine learning | [84] |
| ≈80%, 20%, 0% | Deep learning | [60,62] |
| ≈80%, 20%, 0% | machine learning | [59,63] |
| ≈80%, 9%, 11% | Deep learning | [61] |
| ≈84%, 16%, 0% | Deep learning | [64] |
| ≈88%, 12%, 0% | Deep learning | [83] |
| ≈92%, 18%, 0% | Deep learning | [54] |
| ≈94%, 6%, 0% | Deep learning | [46] |
Publisher’s Note: MDPI stays neutral with regard to jurisdictional claims in published maps and institutional affiliations. |
© 2022 by the authors. Licensee MDPI, Basel, Switzerland. This article is an open access article distributed under the terms and conditions of the Creative Commons Attribution (CC BY) license (https://creativecommons.org/licenses/by/4.0/).
Share and Cite
Alshagathrh, F.M.; Househ, M.S. Artificial Intelligence for Detecting and Quantifying Fatty Liver in Ultrasound Images: A Systematic Review. Bioengineering 2022, 9, 748. https://doi.org/10.3390/bioengineering9120748
Alshagathrh FM, Househ MS. Artificial Intelligence for Detecting and Quantifying Fatty Liver in Ultrasound Images: A Systematic Review. Bioengineering. 2022; 9(12):748. https://doi.org/10.3390/bioengineering9120748
Chicago/Turabian StyleAlshagathrh, Fahad Muflih, and Mowafa Said Househ. 2022. "Artificial Intelligence for Detecting and Quantifying Fatty Liver in Ultrasound Images: A Systematic Review" Bioengineering 9, no. 12: 748. https://doi.org/10.3390/bioengineering9120748