

A Survey on Physiological Signal-Based Emotion Recognition

Abstract
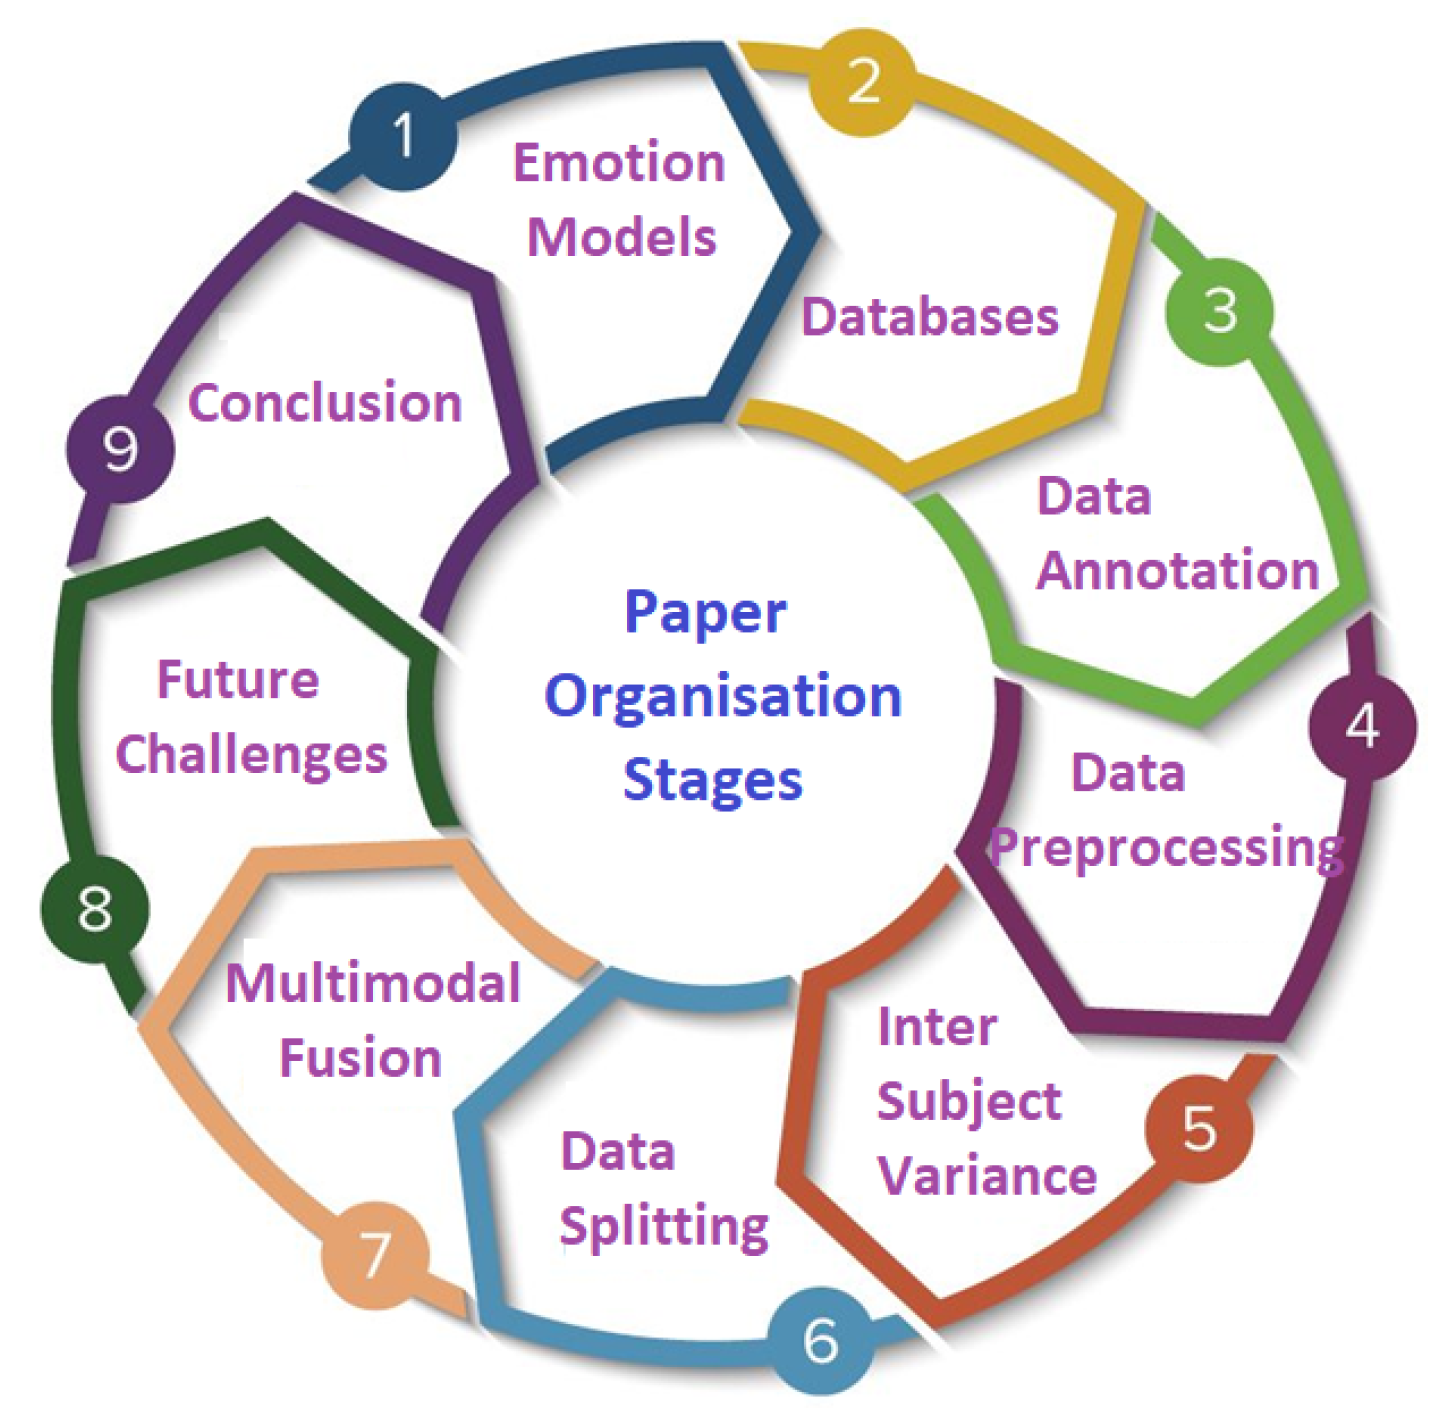
:1. Introduction
- feature extraction and selection techniques;
- generic data pre-processing techniques for physiological signals;
- different types of classifiers and machine learning techniques used for emotion recognition;
- databases for emotion recognition;
- assessment and performance evaluation parameters for ML models such as calculation of accuracy, recall, precision and score from confusion matrix.
- The problems faced during data annotation of physiological signals are not elaborated.
- The data pre-processing techniques are bundled together and presented as generic techniques for any physiological signal. In our opinion, each physiological signal presents its own unique set of challenges when it comes to pre-processing, and the pre-processing steps should be discussed separately.
- Inter-subject data variability has a huge impact on emotion recognition. The existing reviews neither discuss this effect nor provide recommendations to reduce inter-subject variability.
- A comparison of data splitting techniques, such as subject-independent and subject-dependent, is not provided for better emotion recognition and generalization of the trained classification models.
- The comparison and advantages of different multimodal fusion methods are not provided in these review papers.
- different kinds of data annotation methods for emotion recognition and advantages/disadvantages of each method;
- data pre-processing techniques that are specific for each physiological signal;
- effect of inter-subject data variance on emotion recognition;
- data splitting techniques for improving the generalization of emotion recognition models;
- different multimodal fusion techniques and their comparison.
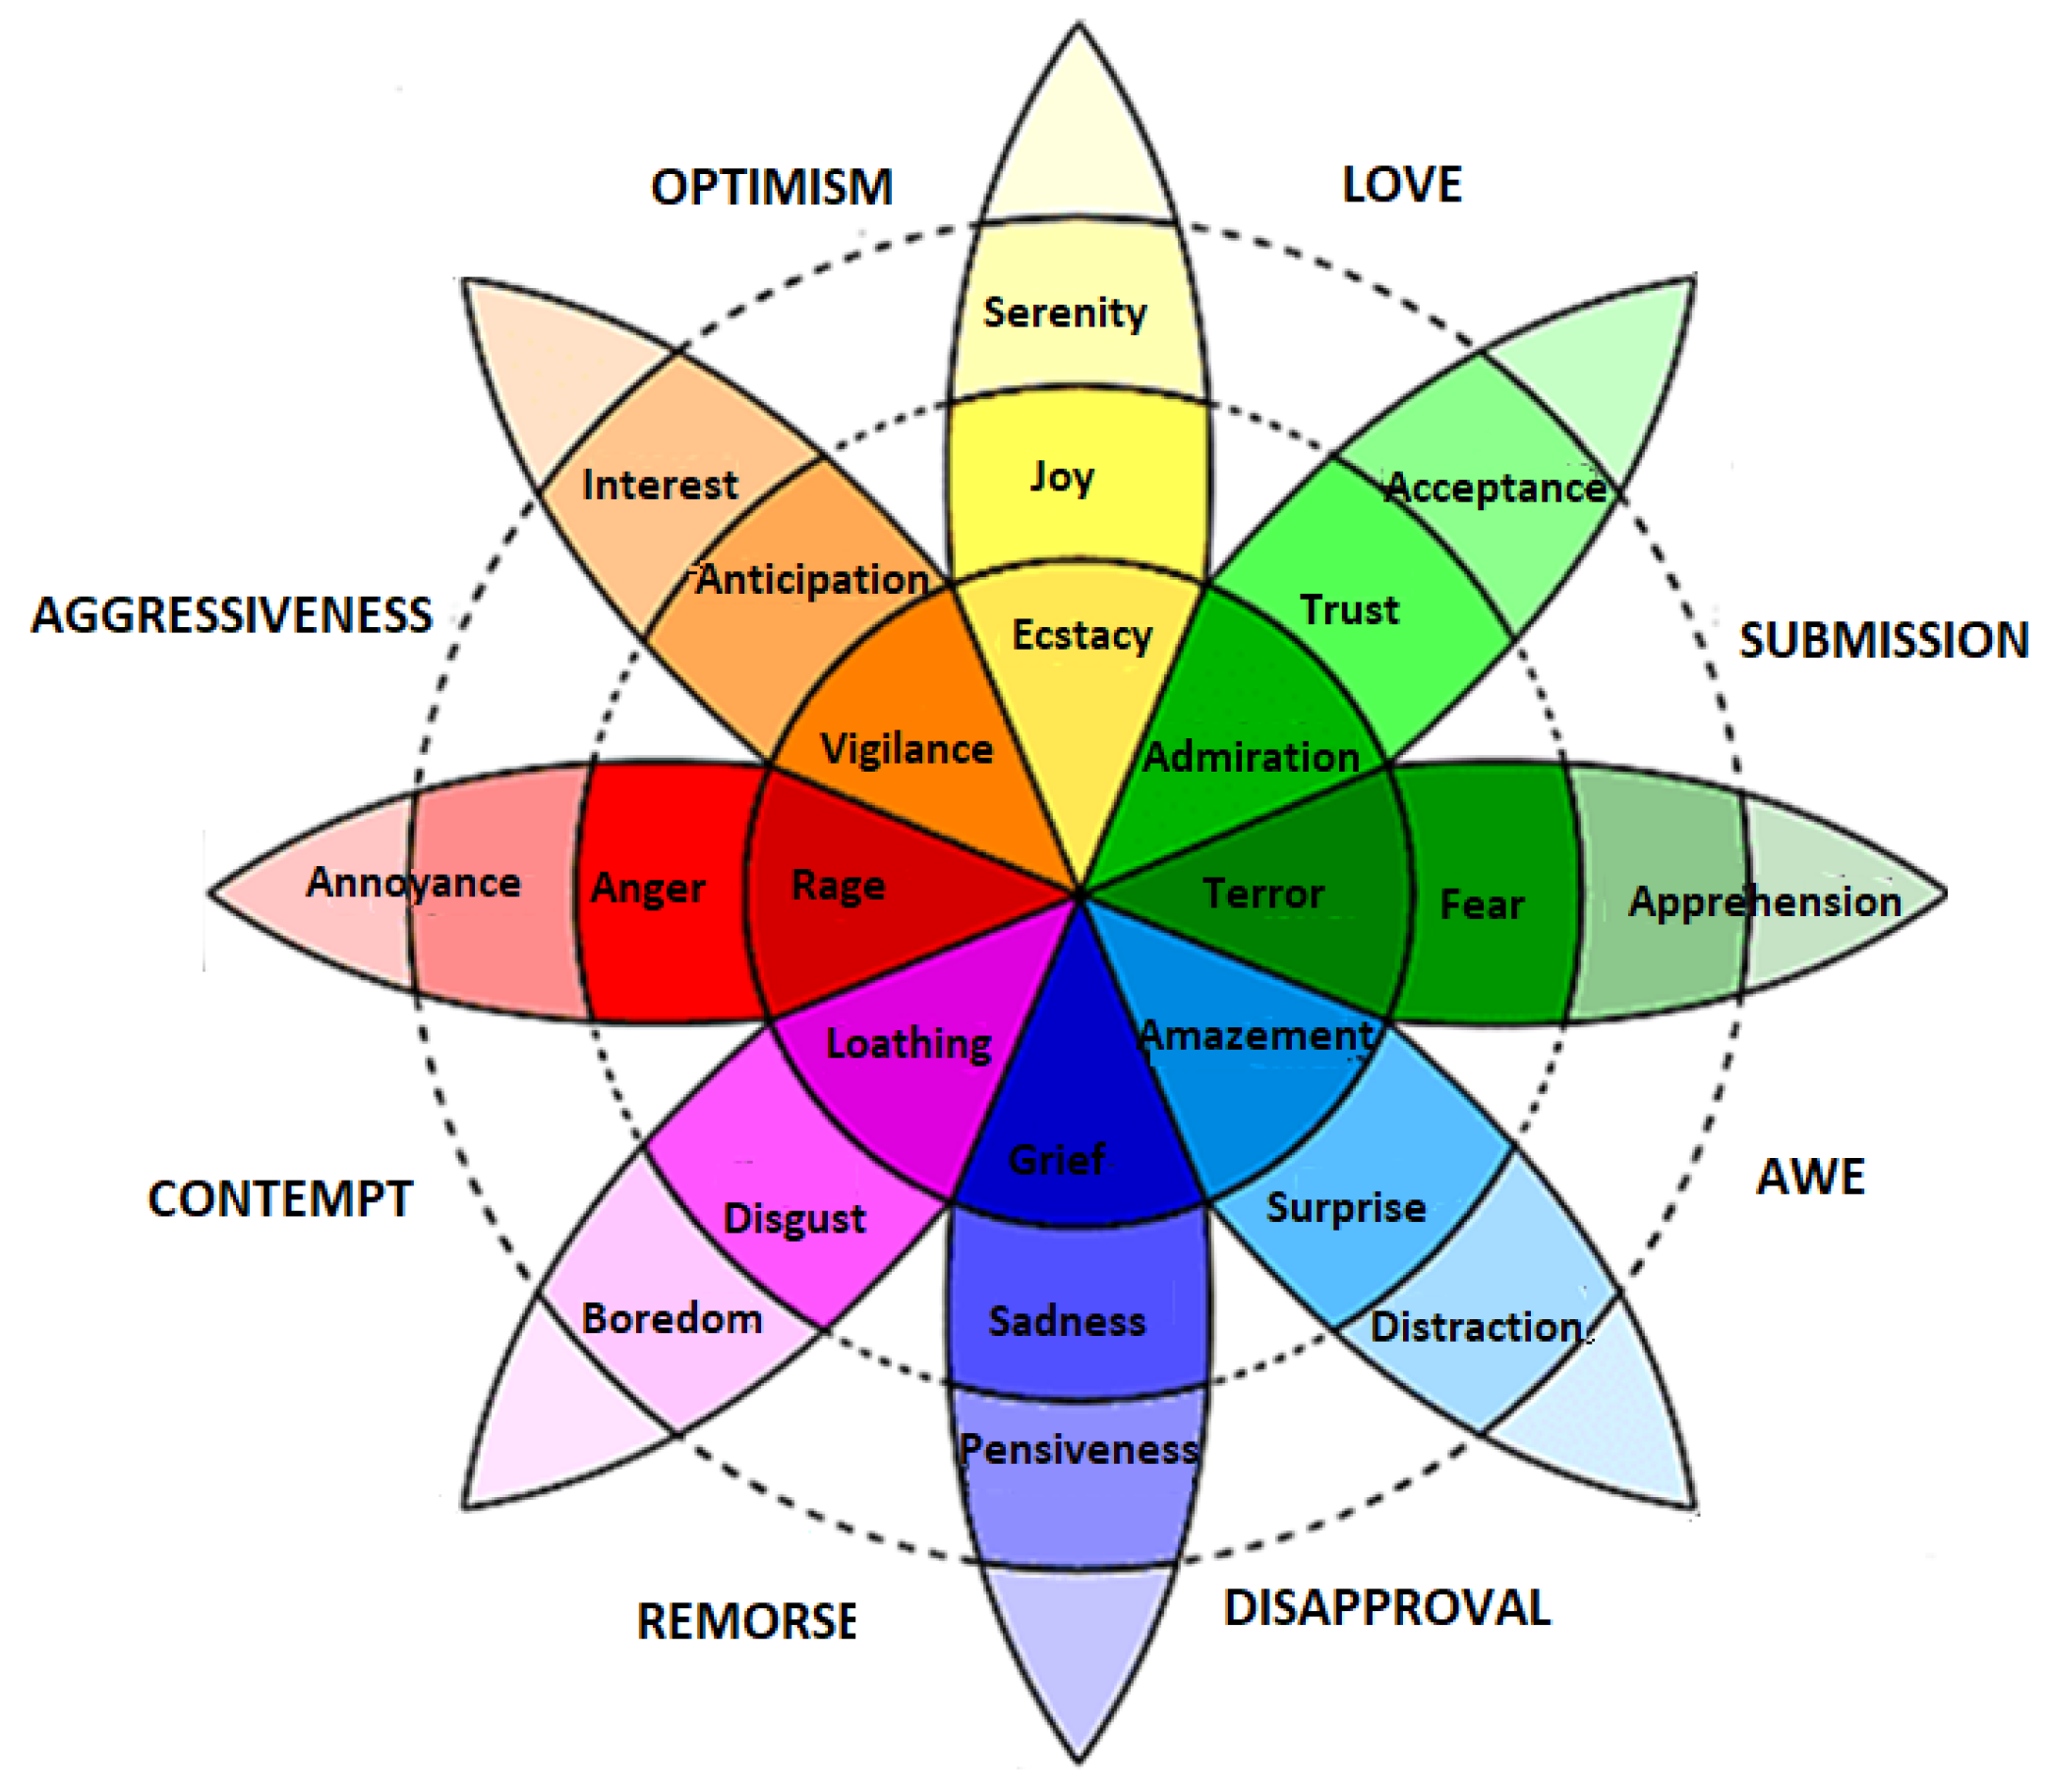
2. Emotion Models
2.1. Discrete or Categorical Models
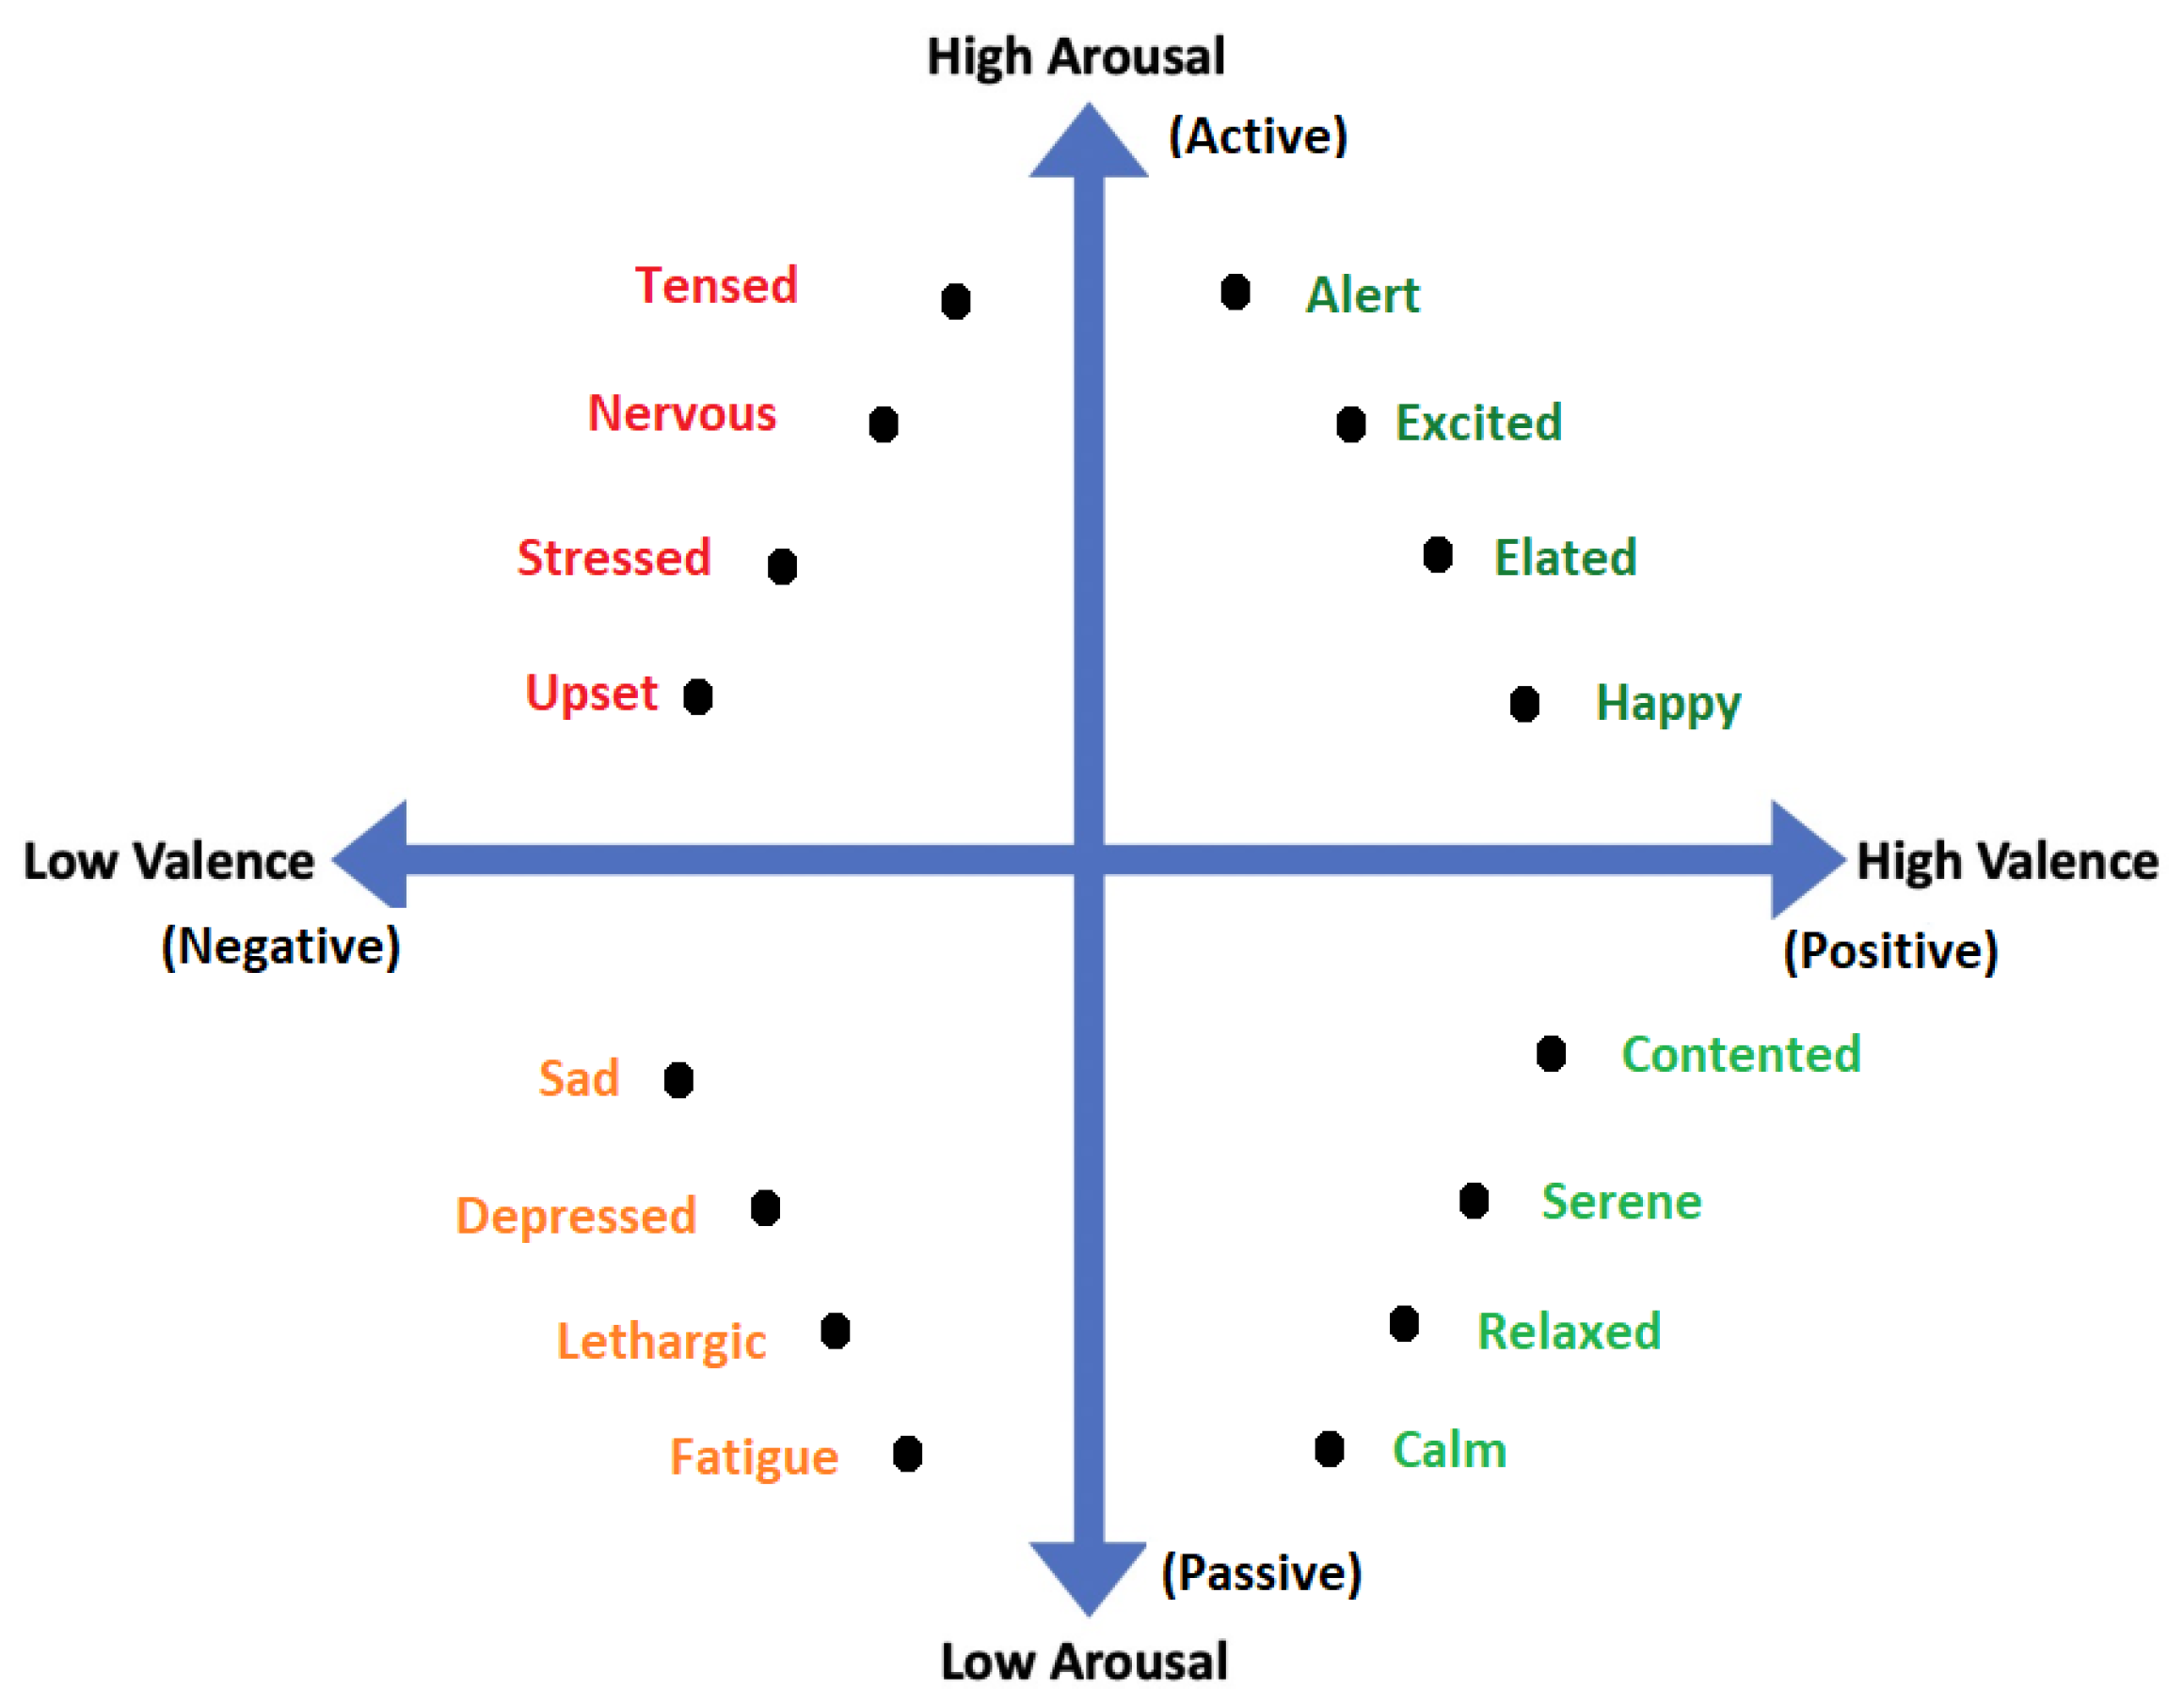
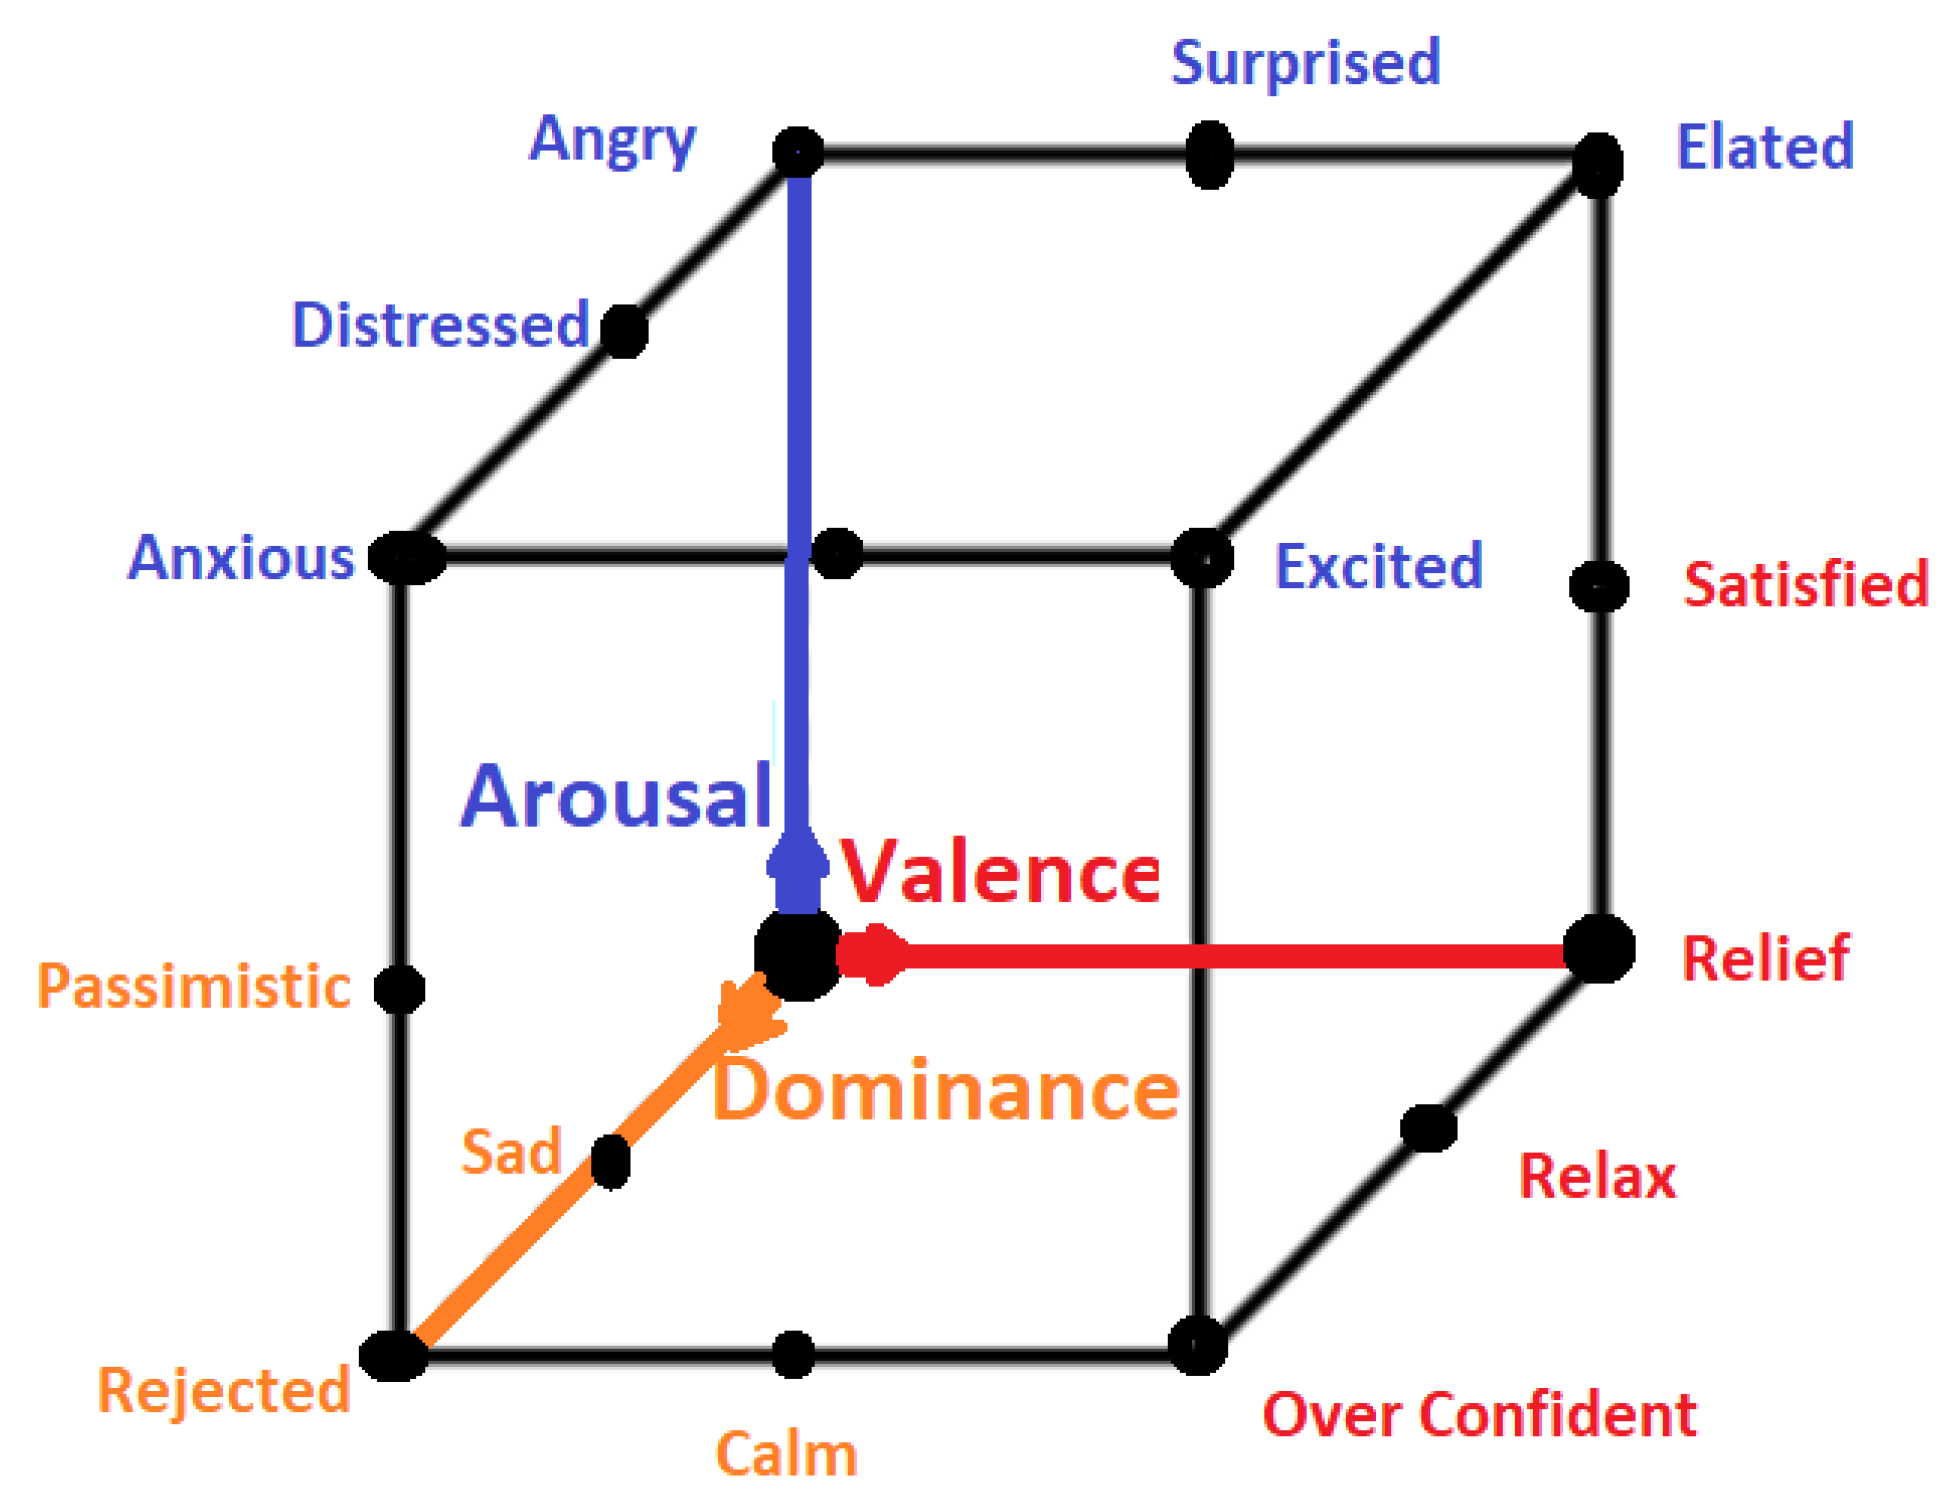
2.2. Continuous or Multidimensional Models
3. Databases
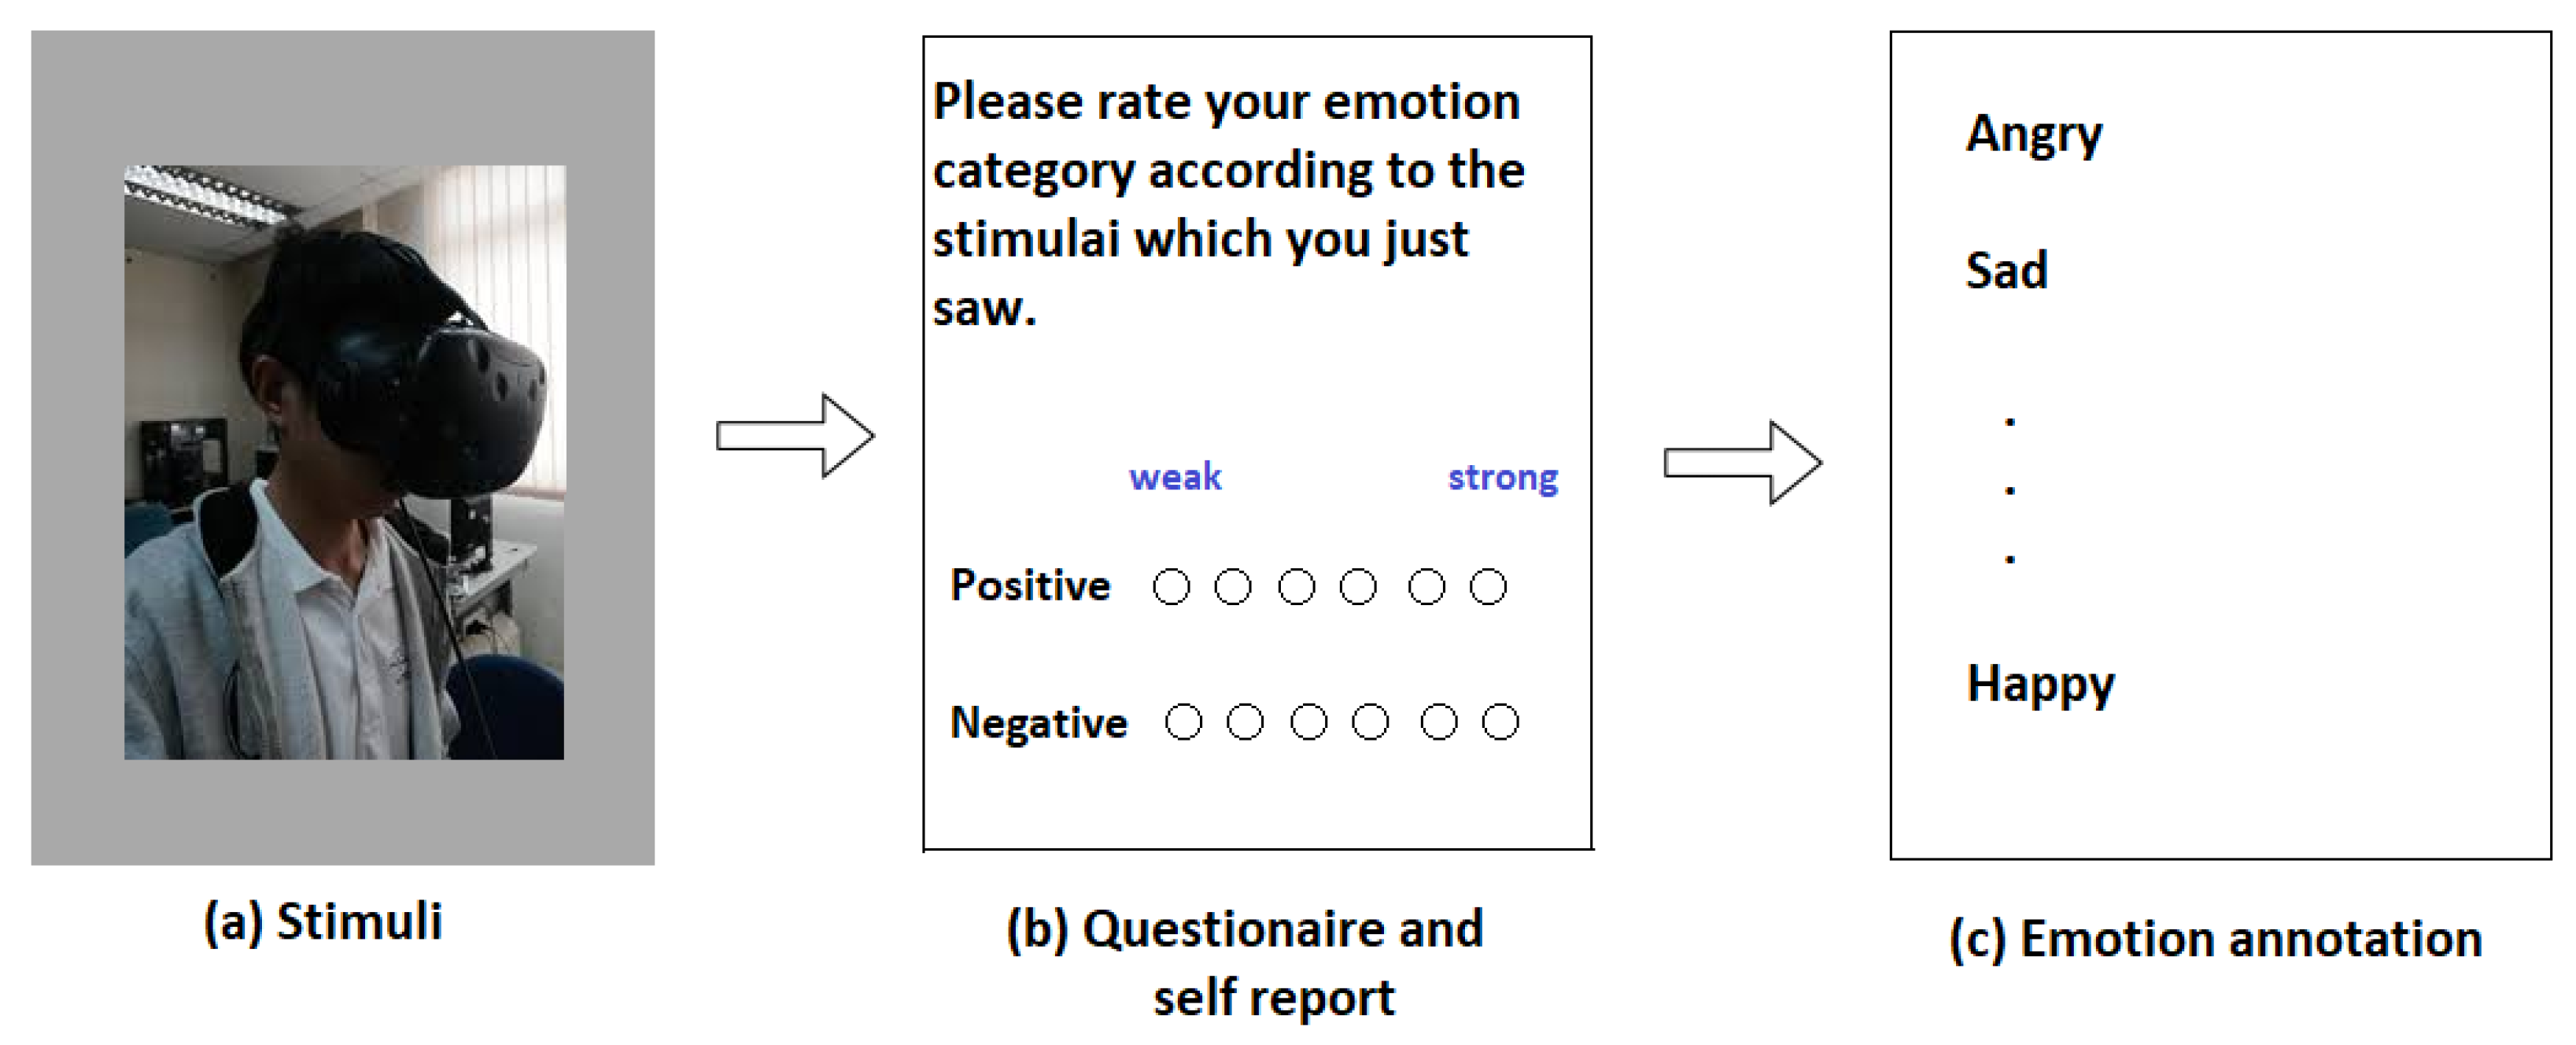
4. Data Annotation
4.1. Discrete Annotation
4.2. Continuous Annotation
4.3. Summary of the Section
5. Data Pre-Processing
5.1. EEG Pre-Processing
5.1.1. Rejection Method
5.1.2. Linear Filtering
5.1.3. Linear Regression
5.1.4. Independent Component Analysis
5.2. ECG Pre-Processing
5.2.1. Filtering
5.2.2. Normalization
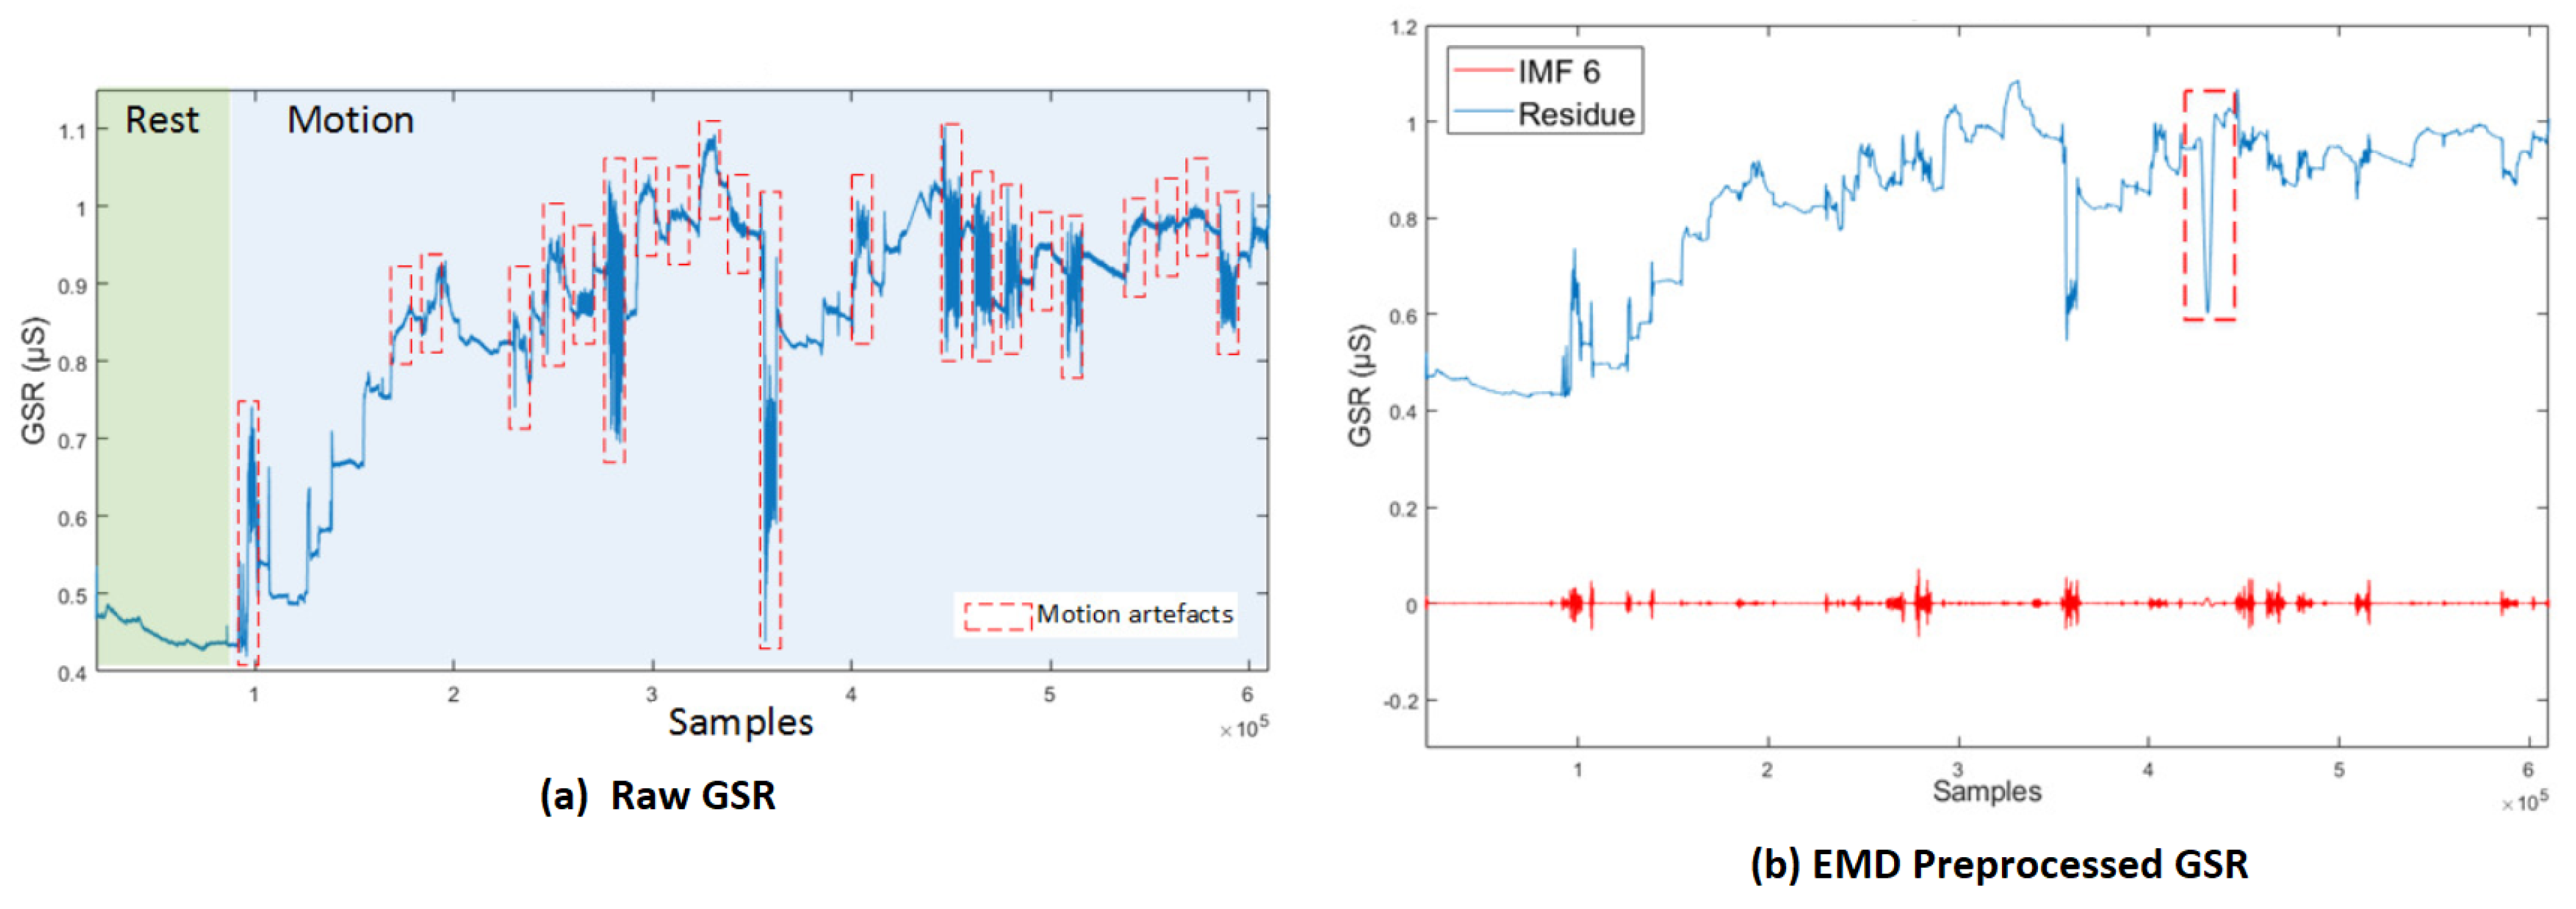
5.3. GSR Pre-Processing
5.3.1. Empirical Mode Decomposition
5.3.2. Kalman Filtering
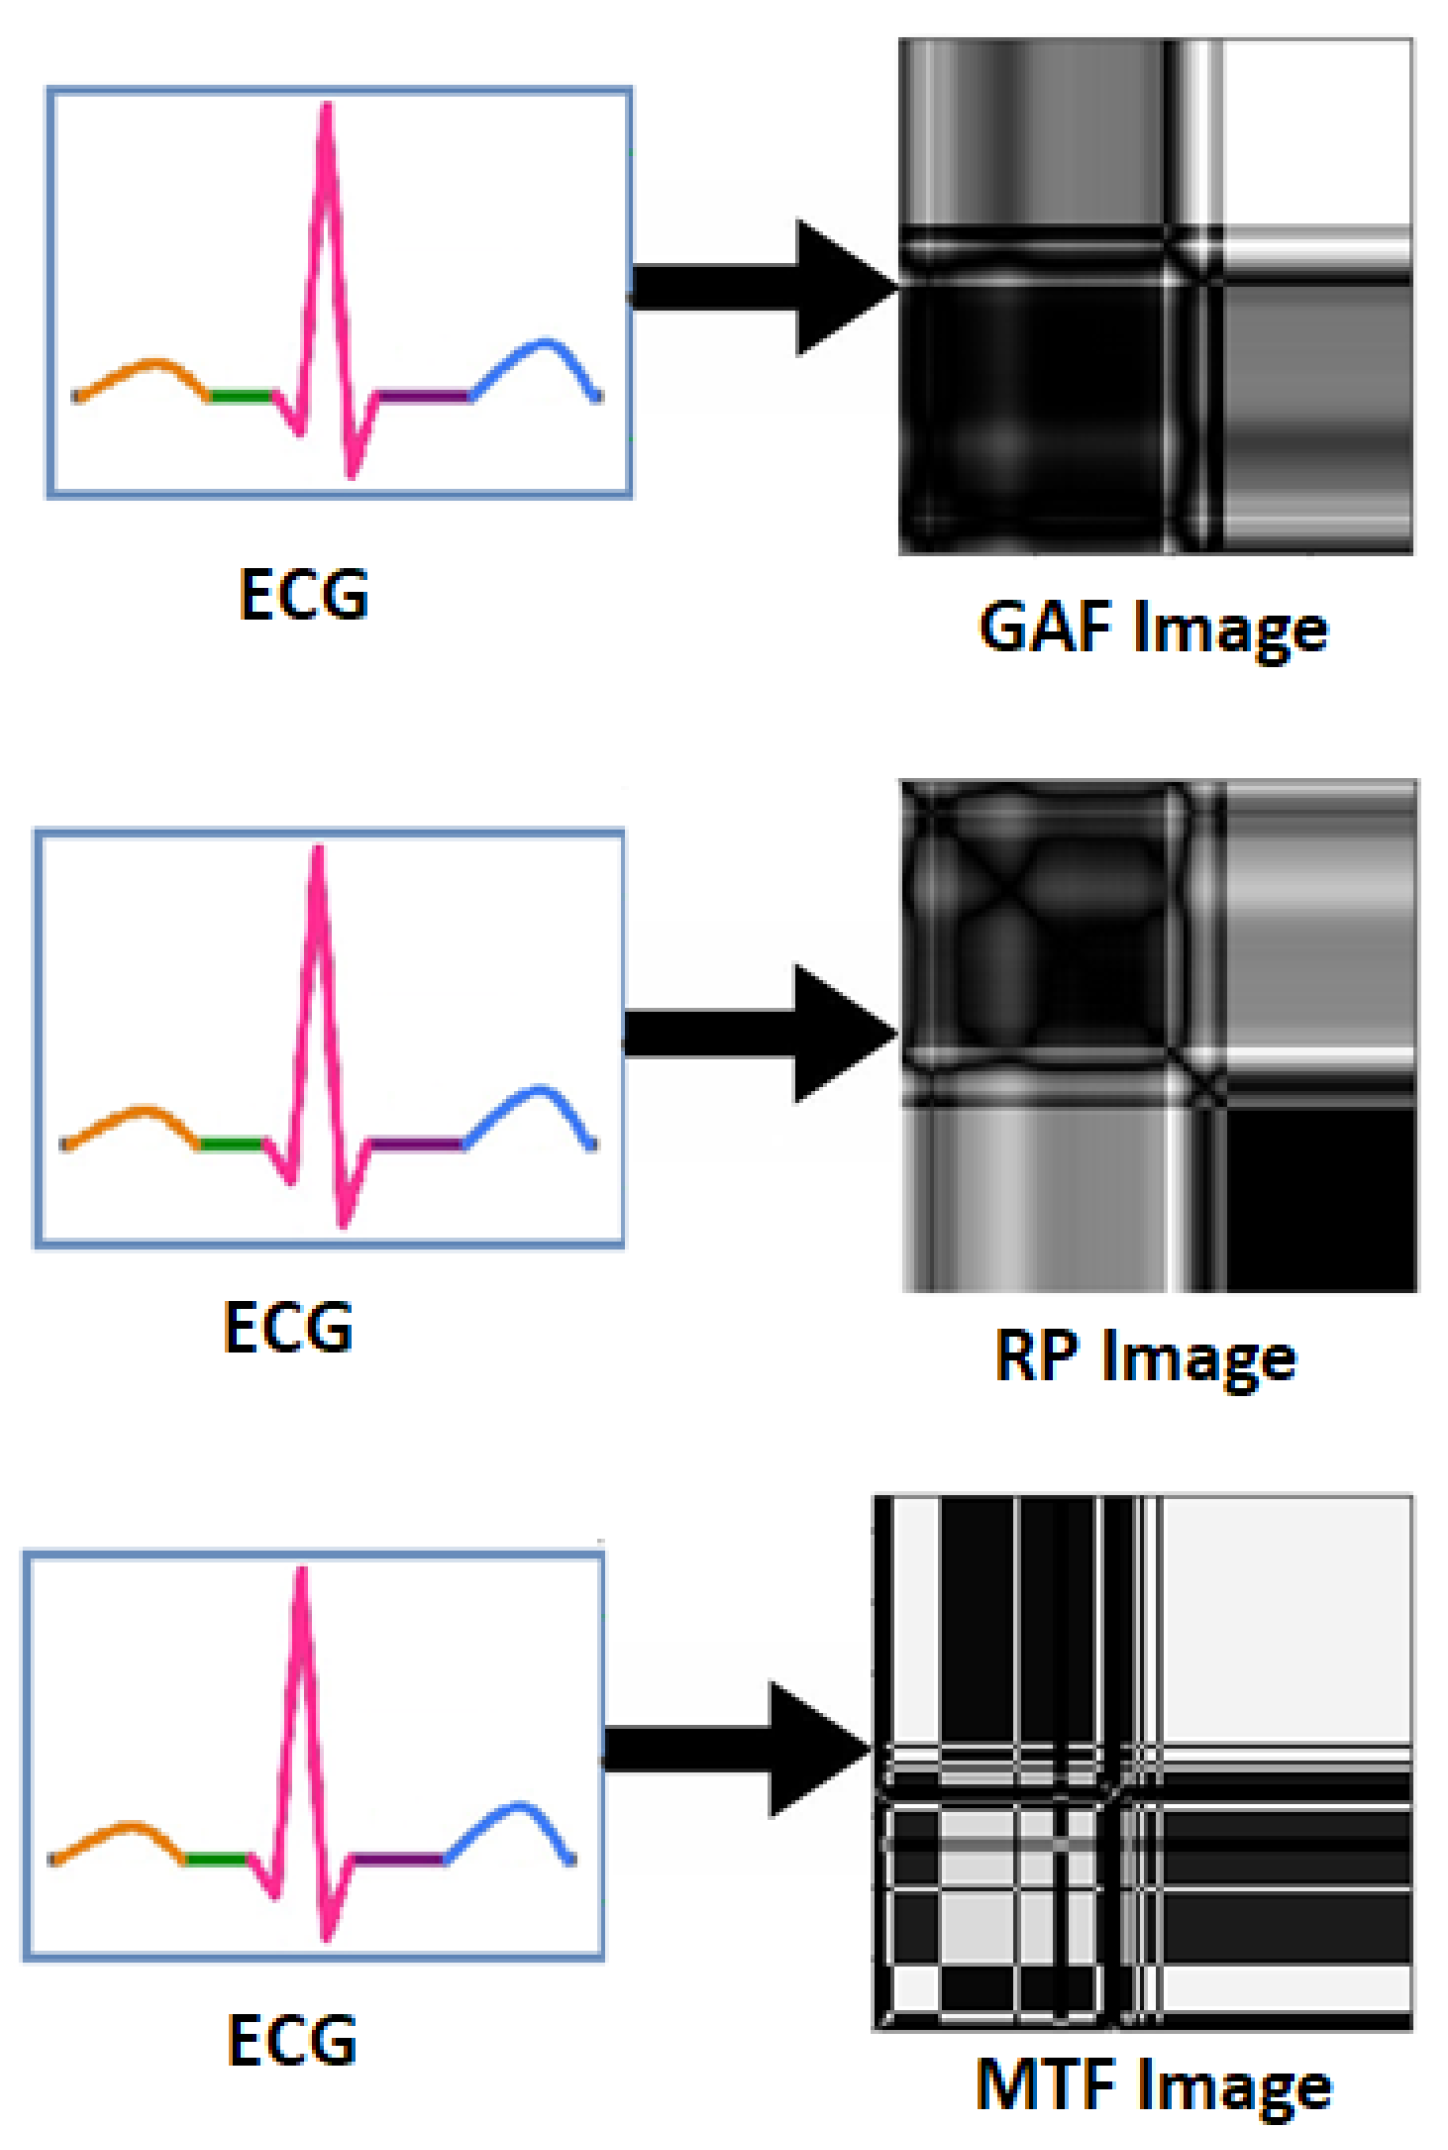
5.4. 1D to 2D Conversion
5.5. Summary of the Section
6. Inter-Subject Data Variance
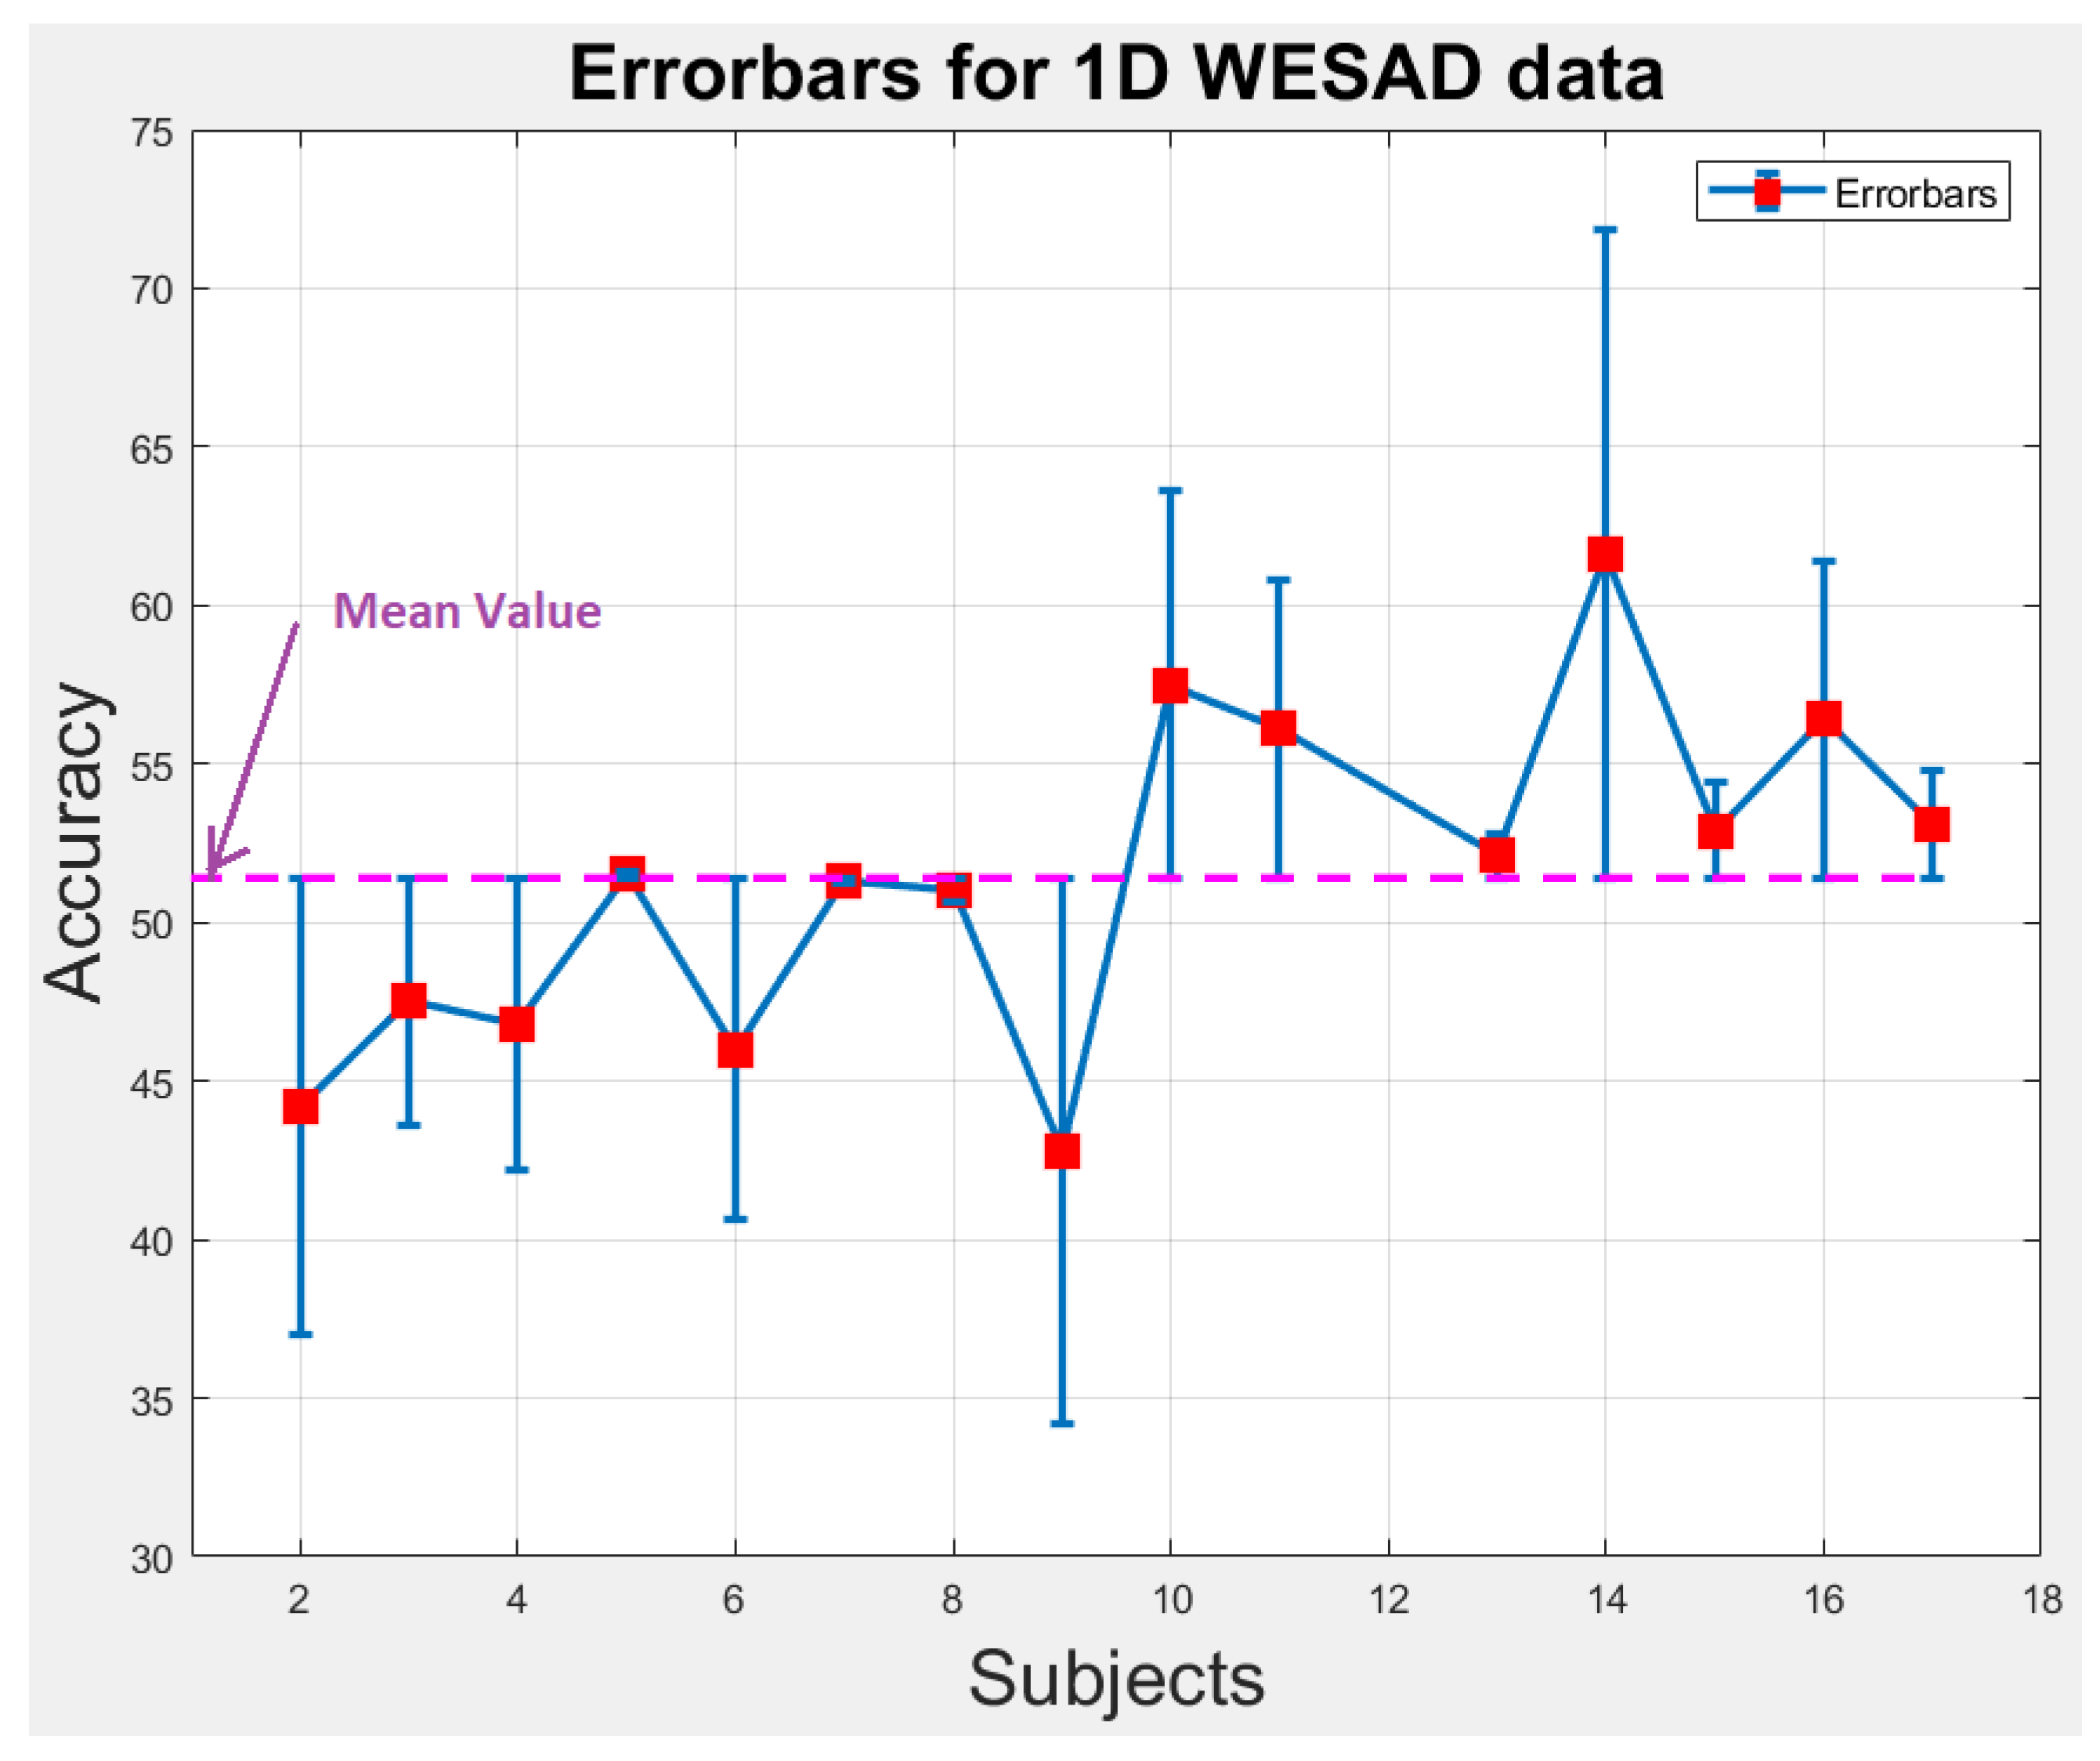
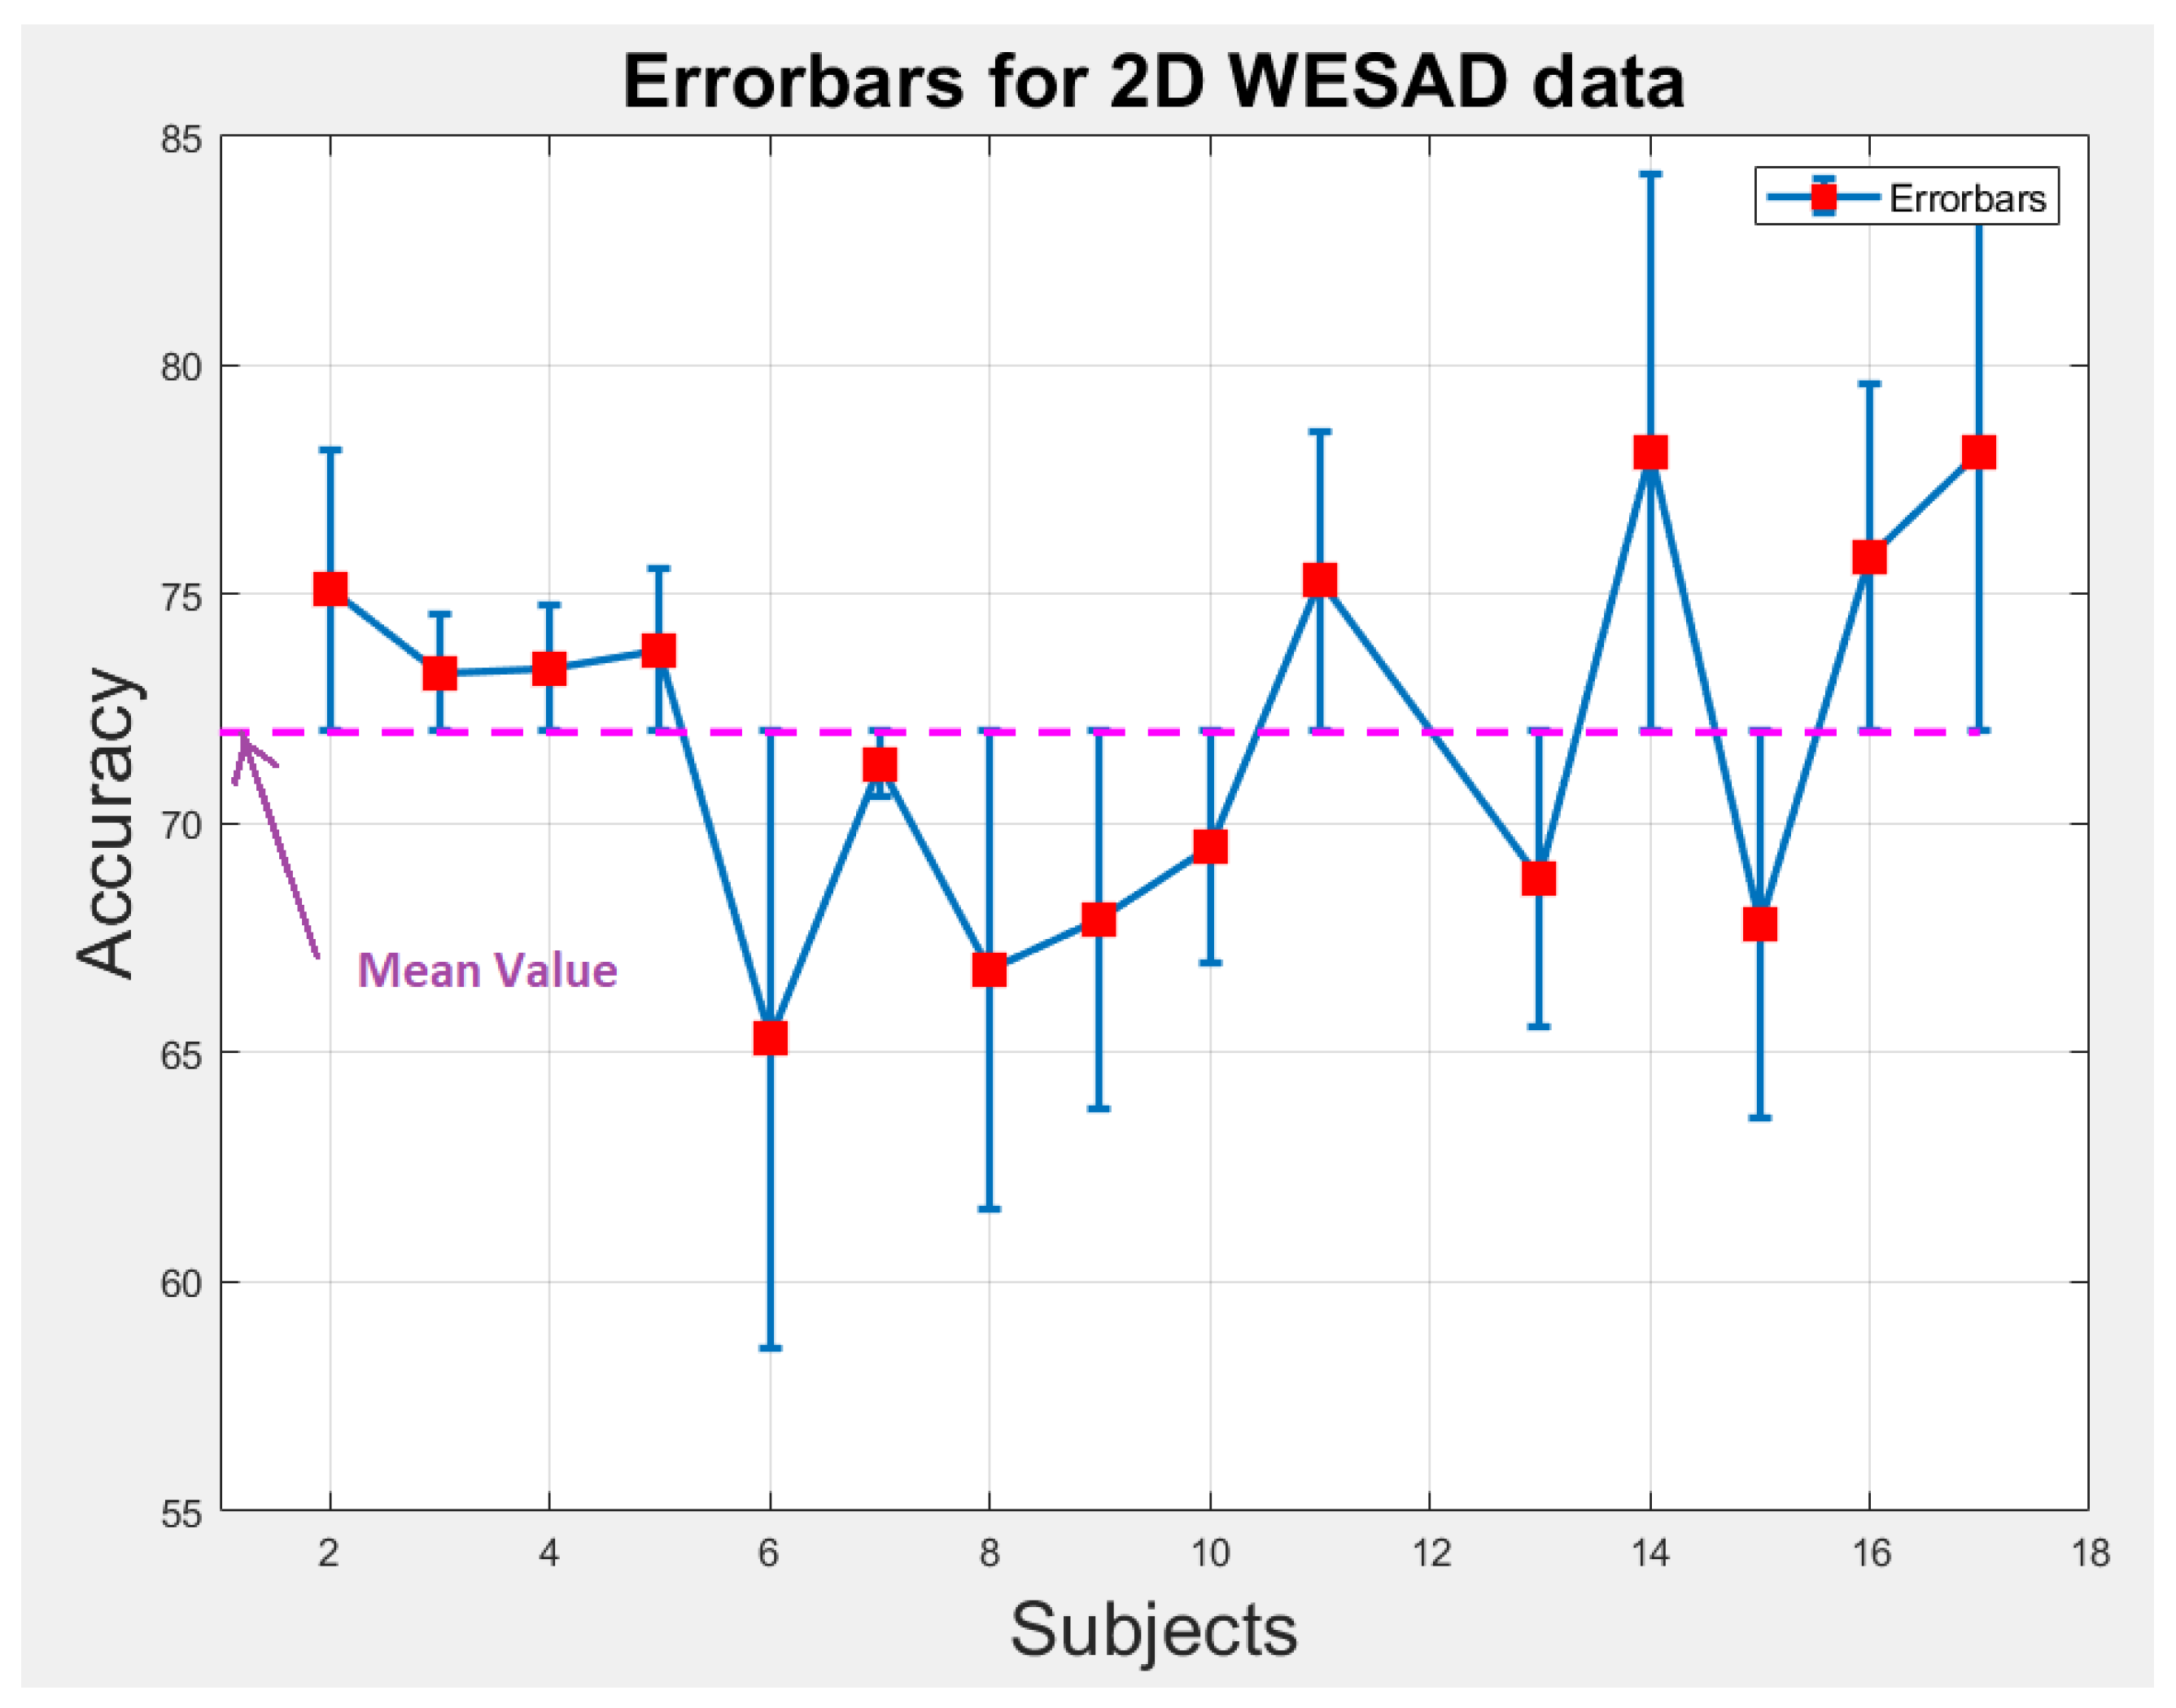
6.1. Statistical Analysis
6.2. Reasons of Inter-Subject Data Variance
- Some users feel uncomfortable when wearing a sensor on their bodies and behave unnaturally and unexpectedly during data collection.
- Body movements during data collection adversely effect the quality of recorded data. For instance, head and eyeball movement during EEG data collection and hand movement during EMG data collection are the sources of degradation of these data.
- An intra-variance subject is also caused due to the placement of electrodes on different areas of the body. For example, during chest-based ECG collection, electrodes are placed on different areas of the chest and during collection of EEG data, the electrodes are placed on all over the scalp, i.e., from left side to right side through the center of the head.
- Different users respond differently to the same stimuli. This difference in their response depends on their mental strength and physical stability. For instance, a movie clip can instill fear in some users while other users may feel excitement while watching it.
- The length of the collected data is also amongst the major reasons of creating subject diversity. A long video is more likely to elicit diverse emotional states [98], while the data with limited samples will create problem during the training of the model and classification of the affective states.
- Experimental environment and quality of sensors/equipment are also the reasons of variance in data. For instance, uncalibrated sensors may create errors at different stages of data collection.
6.3. Reducing Inter-Subject Data Variance
- The collected sample size for each subject should be same. The length of the data should be set carefully to avoid variance in the data.
- The users or subjects should be trained to remain calm and behave normally during data collection or wearing a sensor.
- Different channels of the data collecting equipment should be calibrated against the same standards so that the intra-variance in the data for the subject can be reduced.
- In [99], statistics-based unsupervised domain adaptation algorithm was proposed for reducing the inter-subject variance. A new baseline model was introduced to tackle the classification task, and then two novel domain adaptation objective functions, cluster-aligning loss and cluster-separating loss were presented to mitigate the negative impacts caused by domain shifts.
- A state-of-the-art attention-based parallelizable deep learning model called transformer was introduced in [100] for language modelling. This model uses multihead attention to focus more on relevant features for improved language modelling and translational task. A similar kinds of attention-based deep learning models should be developed for physiological signals for reducing intersubject variability.
6.4. Summary of the Section
- Inter-subject data variance depends on the behavior of the user during data collection, calibration of the sensors and experimental environment.
- By performing experiments, we prove that inter-subject data variance could be reduced by data pre-processing, i.e., by transforming the raw ECG data (1D) into spectrograms (2D). Transforming data from 1D to 2D enables ResNet-18 to extract those relevant features that are more specific to emotions.
- We believe more research in the area of domain adaptation and developing attention-based models could help tackle inter-subject data variability.
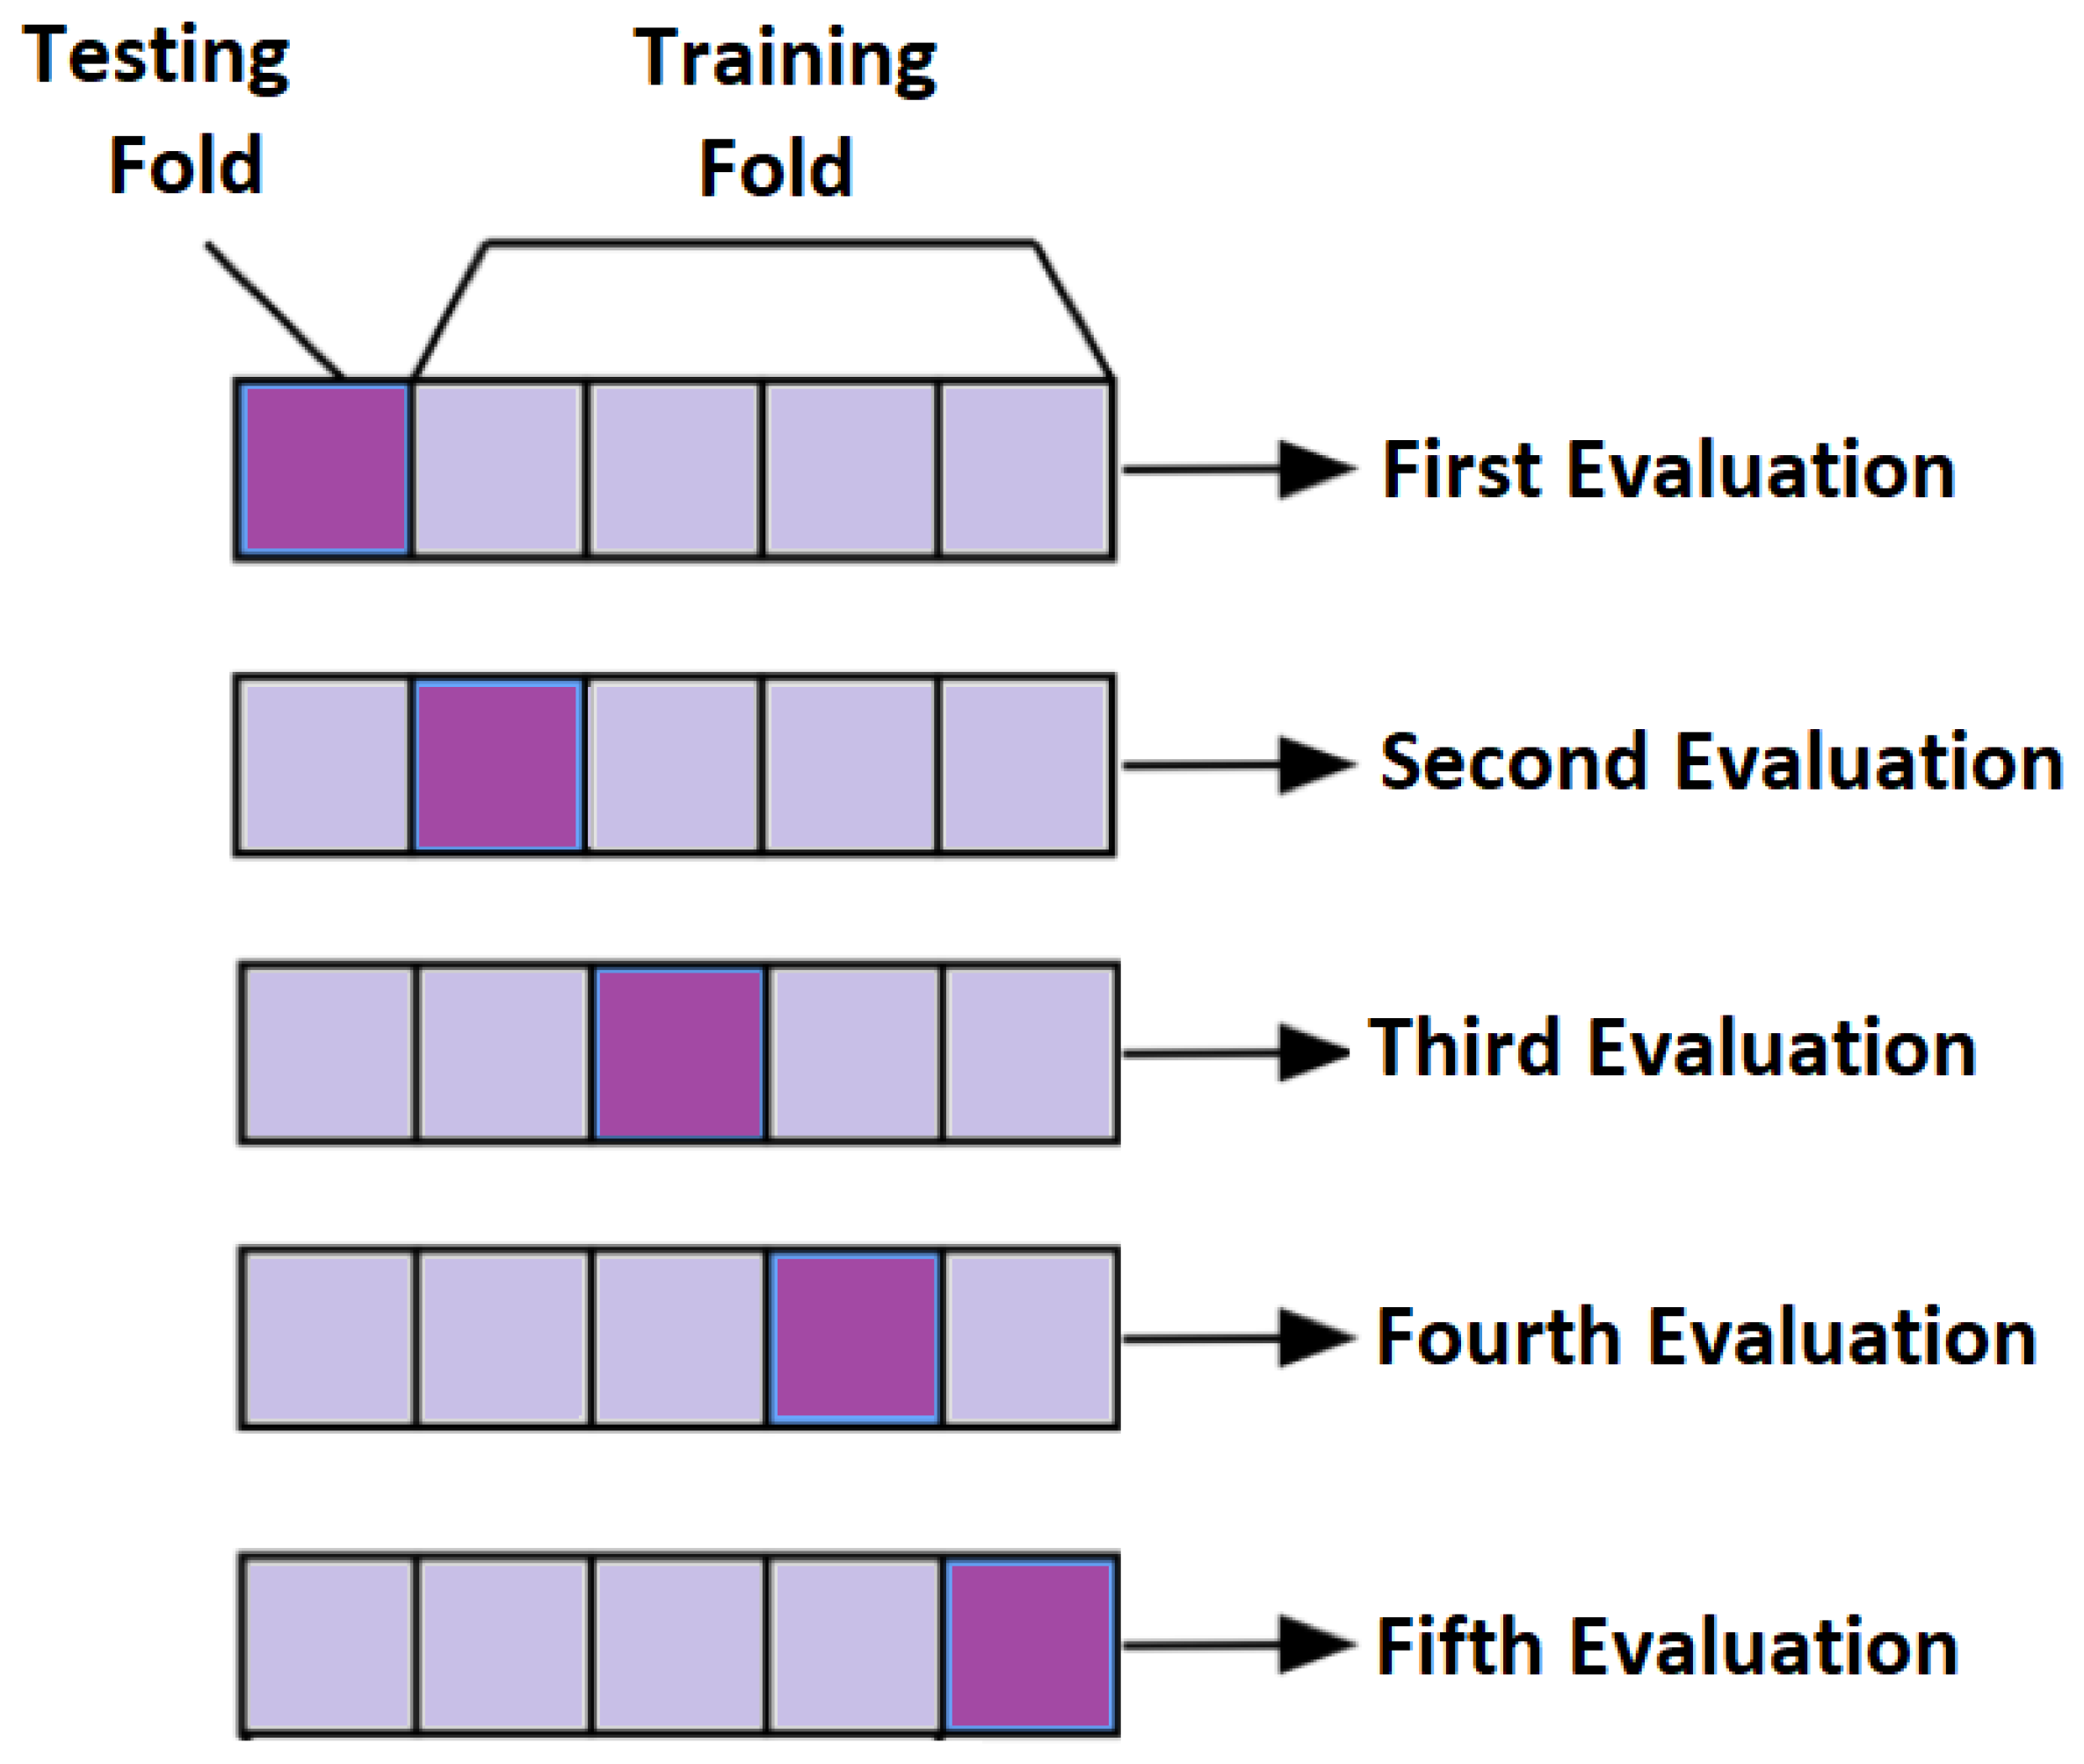
7. Data Splitting
7.1. Subject-Independent Splitting
7.2. Subject-Dependent Splitting
7.3. Summary of the Section
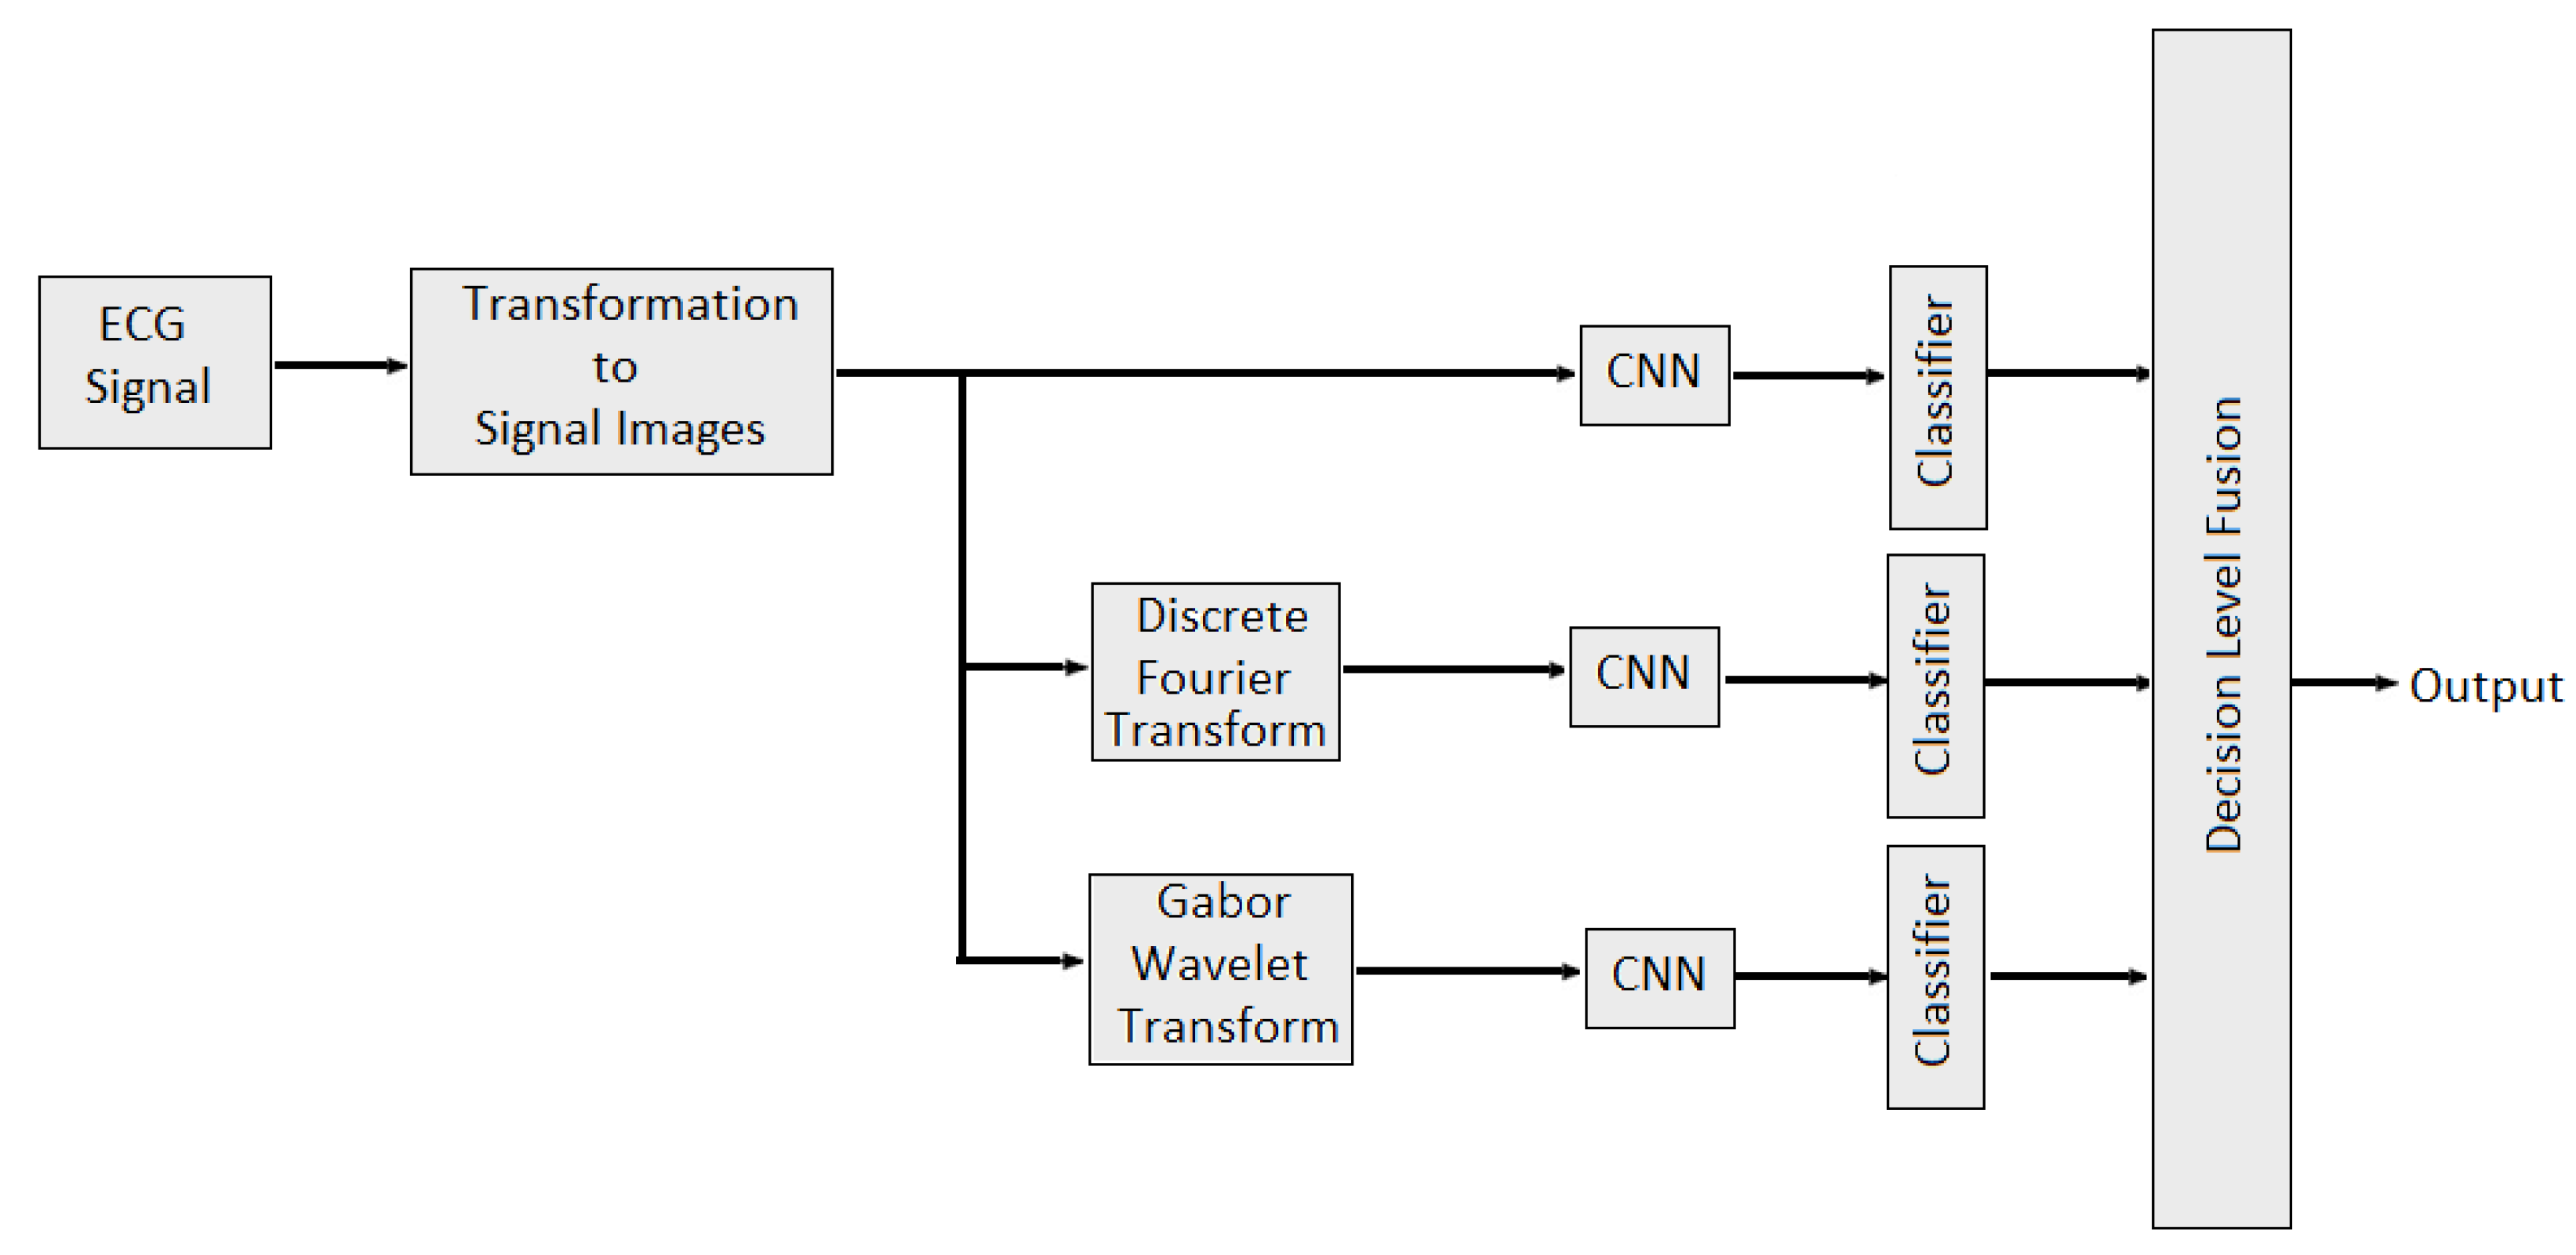
8. Multimodal Fusion
Summary of the Section
9. Future Challenges
9.1. Data Acquisition
9.2. Data Annotation
9.3. Feature Extraction and Fusion
9.4. Generalization of Models
9.5. Modern Machine Learning Methods
10. Conclusions
Author Contributions
Funding
Institutional Review Board Statement
Informed Consent Statement
Data Availability Statement
Conflicts of Interest
References
- Phillips, L.H.; MacLean, R.D.; Allen, R. Age and the understanding of emotions: Neuropsychological and sociocognitive perspectives. J. Gerontol. Ser. B Psychol. Sci. Soc. Sci. 2002, 57, P526–P530. [Google Scholar] [CrossRef] [PubMed] [Green Version]
- Giordano, M.; Tirelli, P.; Ciarambino, T.; Gambardella, A.; Ferrara, N.; Signoriello, G.; Paolisso, G.; Varricchio, M. Screening of Depressive Symptoms in Young–Old Hemodialysis Patients: Relationship between Beck Depression Inventory and 15-Item Geriatric Depression Scale. Nephron Clin. Pract. 2007, 106, c187–c192. [Google Scholar] [CrossRef] [PubMed]
- Schluter, P.J.; Généreux, M.; Hung, K.K.; Landaverde, E.; Law, R.P.; Mok, C.P.Y.; Murray, V.; O’Sullivan, T.; Qadar, Z.; Roy, M. Patterns of suicide ideation across eight countries in four continents during the COVID-19 pandemic era: Repeated cross-sectional study. JMIR Public Health Surveill. 2022, 8, e32140. [Google Scholar] [CrossRef] [PubMed]
- De Nadai, S.; D’Incà, M.; Parodi, F.; Benza, M.; Trotta, A.; Zero, E.; Zero, L.; Sacile, R. Enhancing safety of transport by road by on-line monitoring of driver emotions. In Proceedings of the 2016 11th System of Systems Engineering Conference (SoSE), Kongsberg, Norway, 12–16 June 2016; pp. 1–4. [Google Scholar]
- Ertin, E.; Stohs, N.; Kumar, S.; Raij, A.; Al’Absi, M.; Shah, S. AutoSense: Unobtrusively wearable sensor suite for inferring the onset, causality, and consequences of stress in the field. In Proceedings of the 9th ACM Conference on Embedded Networked Sensor Systems, Seattle, WA, USA, 1–4 November 2011; pp. 274–287. [Google Scholar]
- Kołakowska, A. Towards detecting programmers’ stress on the basis of keystroke dynamics. In Proceedings of the 2016 Federated Conference on Computer Science and Information Systems (FedCSIS), Gdańsk, Poland, 11–14 September 2016; pp. 1621–1626. [Google Scholar]
- Kołakowska, A.; Landowska, A.; Szwoch, M.; Szwoch, W.; Wróbel, M.R. Emotion recognition and its application in software engineering. In Proceedings of the 2013 6th International Conference on Human System Interactions (HSI), Piscataway, NJ, USA, 6–8 June 2013; IEEE: Manhattan, NY, USA, 2013; pp. 532–539. [Google Scholar]
- Szwoch, M.; Szwoch, W. Using Different Information Channels for Affect-Aware Video Games-A Case Study. In Proceedings of the International Conference on Image Processing and Communications; Springer: Berlin/Heidelberg, Germany, 2018; pp. 104–113. [Google Scholar]
- Muhammad, G.; Hossain, M.S. Emotion recognition for cognitive edge computing using deep learning. IEEE Internet Things J. 2021, 8, 16894–16901. [Google Scholar] [CrossRef]
- Siddharth, S.; Jung, T.P.; Sejnowski, T.J. Impact of affective multimedia content on the electroencephalogram and facial expressions. Sci. Rep. 2019, 9, 16295. [Google Scholar] [CrossRef] [PubMed] [Green Version]
- Wang, S.H.; Phillips, P.; Dong, Z.C.; Zhang, Y.D. Intelligent facial emotion recognition based on stationary wavelet entropy and Jaya algorithm. Neurocomputing 2018, 272, 668–676. [Google Scholar] [CrossRef]
- Yang, D.; Alsadoon, A.; Prasad, P.C.; Singh, A.K.; Elchouemi, A. An emotion recognition model based on facial recognition in virtual learning environment. Procedia Comput. Sci. 2018, 125, 2–10. [Google Scholar] [CrossRef]
- Zhang, Y.D.; Yang, Z.J.; Lu, H.M.; Zhou, X.X.; Phillips, P.; Liu, Q.M.; Wang, S.H. Facial emotion recognition based on biorthogonal wavelet entropy, fuzzy support vector machine, and stratified cross validation. IEEE Access 2016, 4, 8375–8385. [Google Scholar] [CrossRef]
- Gunes, H.; Shan, C.; Chen, S.; Tian, Y. Bodily expression for automatic affect recognition. In Emotion Recognition: A Pattern Analysis Approach; John Wiley & Sons Inc.: Hoboken, NJ, USA, 2015; pp. 343–377. [Google Scholar]
- Piana, S.; Staglianò, A.; Odone, F.; Camurri, A. Adaptive body gesture representation for automatic emotion recognition. ACM Trans. Interact. Intell. Syst. TiiS 2016, 6, 1–31. [Google Scholar] [CrossRef] [Green Version]
- Noroozi, F.; Corneanu, C.A.; Kamińska, D.; Sapiński, T.; Escalera, S.; Anbarjafari, G. Survey on emotional body gesture recognition. IEEE Trans. Affect. Comput. 2018, 12, 505–523. [Google Scholar] [CrossRef]
- Zheng, H.; Yang, Y. An improved speech emotion recognition algorithm based on deep belief network. In Proceedings of the 2019 IEEE International Conference on Power, Intelligent Computing and Systems (ICPICS), Shenyang, China, 12–14 July 2019; IEEE: Manhattan, NY, USA, 2019; pp. 493–497. [Google Scholar]
- Latif, S.; Rana, R.; Khalifa, S.; Jurdak, R.; Qadir, J.; Schuller, B.W. Survey of deep representation learning for speech emotion recognition. IEEE Trans. Affect. Comput. 2021. [Google Scholar] [CrossRef]
- Akçay, M.B.; Oğuz, K. Speech emotion recognition: Emotional models, databases, features, pre-processing methods, supporting modalities, and classifiers. Speech Commun. 2020, 116, 56–76. [Google Scholar] [CrossRef]
- Li, W.; Zhang, Z.; Song, A. Physiological-signal-based emotion recognition: An odyssey from methodology to philosophy. Measurement 2021, 172, 108747. [Google Scholar] [CrossRef]
- Suhaimi, N.S.; Mountstephens, J.; Teo, J. EEG-based emotion recognition: A state-of-the-art review of current trends and opportunities. Comput. Intell. Neurosci. 2020, 2020, 8875426. [Google Scholar] [CrossRef] [PubMed]
- Hsu, Y.L.; Wang, J.S.; Chiang, W.C.; Hung, C.H. Automatic ECG-based emotion recognition in music listening. IEEE Trans. Affect. Comput. 2017, 11, 85–99. [Google Scholar] [CrossRef]
- Sarkar, P.; Etemad, A. Self-supervised learning for ecg-based emotion recognition. In Proceedings of the ICASSP 2020-2020 IEEE International Conference on Acoustics, Speech and Signal Processing (ICASSP), Barcelona, Spain, 4–8 May 2020; pp. 3217–3221. [Google Scholar]
- Zhang, Q.; Lai, X.; Liu, G. Emotion recognition of GSR based on an improved quantum neural network. In Proceedings of the 2016 8th International Conference on Intelligent Human-Machine Systems and Cybernetics (IHMSC), Hangzhou, China, 27–28 August 2016; Volume 1, pp. 488–492. [Google Scholar]
- Pentland, A.; Heibeck, T. Honest Signals; MIT Press: Cambridge, MA, USA, 2008. [Google Scholar]
- Shu, L.; Xie, J.; Yang, M.; Li, Z.; Li, Z.; Liao, D.; Xu, X.; Yang, X. A review of emotion recognition using physiological signals. Sensors 2018, 18, 2074. [Google Scholar] [CrossRef] [Green Version]
- Wijasena, H.Z.; Ferdiana, R.; Wibirama, S. A Survey of Emotion Recognition using Physiological Signal in Wearable Devices. In Proceedings of the 2021 International Conference on Artificial Intelligence and Mechatronics Systems (AIMS), Delft, The Netherlands, 12–16 July 2021; pp. 1–6. [Google Scholar]
- Joy, E.; Joseph, R.B.; Lakshmi, M.; Joseph, W.; Rajeswari, M. Recent survey on emotion recognition using physiological signals. In Proceedings of the 2021 7th International Conference on Advanced Computing and Communication Systems (ICACCS), Coimbatore, India, 19–20 March 2021; Volume 1, pp. 1858–1863. [Google Scholar]
- Fan, X.; Yan, Y.; Wang, X.; Yan, H.; Li, Y.; Xie, L.; Yin, E. Emotion Recognition Measurement based on Physiological Signals. In Proceedings of the 2020 13th International Symposium on Computational Intelligence and Design (ISCID), Hangzhou, China, 12–13 December 2020; pp. 81–86. [Google Scholar]
- Bota, P.J.; Wang, C.; Fred, A.L.; Da Silva, H.P. A review, current challenges, and future possibilities on emotion recognition using machine learning and physiological signals. IEEE Access 2019, 7, 140990–141020. [Google Scholar] [CrossRef]
- Dalvi, C.; Rathod, M.; Patil, S.; Gite, S.; Kotecha, K. A Survey of AI-Based Facial Emotion Recognition: Features, ML & DL Techniques, Age-Wise Datasets and Future Directions. IEEE Access 2021, 9, 165806–165840. [Google Scholar]
- Pepa, L.; Spalazzi, L.; Capecci, M.; Ceravolo, M.G. Automatic emotion recognition in clinical scenario: A systematic review of methods. IEEE Trans. Affect. Comput. 2021. [Google Scholar] [CrossRef]
- Saganowski, S.; Perz, B.; Polak, A.; Kazienko, P. Emotion Recognition for Everyday Life Using Physiological Signals from Wearables: A Systematic Literature Review. IEEE Trans. Affect. Comput. 2022, 1, 1–21. [Google Scholar] [CrossRef]
- Li, X.; Zhang, Y.; Tiwari, P.; Song, D.; Hu, B.; Yang, M.; Zhao, Z.; Kumar, N.; Marttinen, P. EEG based Emotion Recognition: A Tutorial and Review. ACM Comput. Surv. CSUR 2022. [Google Scholar] [CrossRef]
- Danala, G.; Maryada, S.K.; Islam, W.; Faiz, R.; Jones, M.; Qiu, Y.; Zheng, B. Comparison of Computer-Aided Diagnosis Schemes Optimized Using Radiomics and Deep Transfer Learning Methods. Bioengineering 2022, 9, 256. [Google Scholar] [CrossRef] [PubMed]
- Ponsiglione, A.M.; Amato, F.; Romano, M. Multiparametric investigation of dynamics in fetal heart rate signals. Bioengineering 2021, 9, 8. [Google Scholar] [CrossRef] [PubMed]
- Bizzego, A.; Gabrieli, G.; Esposito, G. Deep neural networks and transfer learning on a multivariate physiological signal Dataset. Bioengineering 2021, 8, 35. [Google Scholar] [CrossRef]
- Ekman, P. An argument for basic emotions. Cogn. Emot. 1992, 6, 169–200. [Google Scholar] [CrossRef]
- Plutchik, R. The nature of emotions: Human emotions have deep evolutionary roots, a fact that may explain their complexity and provide tools for clinical practice. Am. Sci. 2001, 89, 344–350. [Google Scholar] [CrossRef]
- Russell, J.A. A circumplex model of affect. J. Personal. Soc. Psychol. 1980, 39, 1161. [Google Scholar] [CrossRef]
- Miranda-Correa, J.A.; Abadi, M.K.; Sebe, N.; Patras, I. Amigos: A dataset for affect, personality and mood research on individuals and groups. IEEE Trans. Affect. Comput. 2018, 12, 479–493. [Google Scholar] [CrossRef] [Green Version]
- Subramanian, R.; Wache, J.; Abadi, M.K.; Vieriu, R.L.; Winkler, S.; Sebe, N. ASCERTAIN: Emotion and personality recognition using commercial sensors. IEEE Trans. Affect. Comput. 2016, 9, 147–160. [Google Scholar] [CrossRef]
- Zhang, L.; Walter, S.; Ma, X.; Werner, P.; Al-Hamadi, A.; Traue, H.C.; Gruss, S. “BioVid Emo DB”: A multimodal database for emotion analyses validated by subjective ratings. In Proceedings of the 2016 IEEE Symposium Series on Computational Intelligence (SSCI), Athens, Greece, 6–9 December 2016; pp. 1–6. [Google Scholar]
- Koelstra, S.; Muhl, C.; Soleymani, M.; Lee, J.S.; Yazdani, A.; Ebrahimi, T.; Pun, T.; Nijholt, A.; Patras, I. Deap: A database for emotion analysis; using physiological signals. IEEE Trans. Affect. Comput. 2011, 3, 18–31. [Google Scholar] [CrossRef] [Green Version]
- Katsigiannis, S.; Ramzan, N. DREAMER: A database for emotion recognition through EEG and ECG signals from wireless low-cost off-the-shelf devices. IEEE J. Biomed. Health Inform. 2017, 22, 98–107. [Google Scholar] [CrossRef] [PubMed]
- Soleymani, M.; Lichtenauer, J.; Pun, T.; Pantic, M. A multimodal database for affect recognition and implicit tagging. IEEE Trans. Affect. Comput. 2011, 3, 42–55. [Google Scholar] [CrossRef] [Green Version]
- Song, T.; Zheng, W.; Lu, C.; Zong, Y.; Zhang, X.; Cui, Z. MPED: A multi-modal physiological emotion database for discrete emotion recognition. IEEE Access 2019, 7, 12177–12191. [Google Scholar] [CrossRef]
- Zheng, W.L.; Lu, B.L. Investigating critical frequency bands and channels for EEG-based emotion recognition with deep neural networks. IEEE Trans. Auton. Ment. Dev. 2015, 7, 162–175. [Google Scholar] [CrossRef]
- Xue, T.; El Ali, A.; Zhang, T.; Ding, G.; Cesar, P. CEAP-360VR: A Continuous Physiological and Behavioral Emotion Annotation Dataset for 360 VR Videos. IEEE Trans. Multimed. 2021, 14. [Google Scholar] [CrossRef]
- Watson, D.; Clark, L.A.; Tellegen, A. Development and validation of brief measures of positive and negative affect: The PANAS scales. J. Personal. Soc. Psychol. 1988, 54, 1063. [Google Scholar] [CrossRef]
- Bradley, M.M.; Lang, P.J. Measuring emotion: The self-assessment manikin and the semantic differential. J. Behav. Ther. Exp. Psychiatry 1994, 25, 49–59. [Google Scholar] [CrossRef]
- Gross, J.J.; Levenson, R.W. Emotion elicitation using films. Cogn. Emot. 1995, 9, 87–108. [Google Scholar] [CrossRef]
- Yang, K.; Wang, C.; Gu, Y.; Sarsenbayeva, Z.; Tag, B.; Dingler, T.; Wadley, G.; Goncalves, J. Behavioral and Physiological Signals-Based Deep Multimodal Approach for Mobile Emotion Recognition. In IEEE Trans. Affect. Comput. 2021. [Google Scholar] [CrossRef]
- Althobaiti, T.; Katsigiannis, S.; West, D.; Ramzan, N. Examining human-horse interaction by means of affect recognition via physiological signals. IEEE Access 2019, 7, 77857–77867. [Google Scholar] [CrossRef]
- Russell, J.A.; Mehrabian, A. Evidence for a three-factor theory of emotions. J. Res. Personal. 1977, 11, 273–294. [Google Scholar] [CrossRef]
- Hinkle, L.B.; Roudposhti, K.K.; Metsis, V. Physiological measurement for emotion recognition in virtual reality. In Proceedings of the 2019 2nd International Conference on Data Intelligence and Security (ICDIS), South Padre Island, TX, USA, 28–30 June 2019; pp. 136–143. [Google Scholar]
- Posner, J.; Russell, J.A.; Peterson, B.S. The circumplex model of affect: An integrative approach to affective neuroscience, cognitive development, and psychopathology. Dev. Psychopathol. 2005, 17, 715–734. [Google Scholar] [CrossRef] [PubMed]
- Romeo, L.; Cavallo, A.; Pepa, L.; Berthouze, N.; Pontil, M. Multiple instance learning for emotion recognition using physiological signals. IEEE Trans. Affect. Comput. 2019, 13, 389–407. [Google Scholar] [CrossRef]
- Fredrickson, B.L.; Kahneman, D. Duration neglect in retrospective evaluations of affective episodes. J. Personal. Soc. Psychol. 1993, 65, 45. [Google Scholar] [CrossRef]
- Nagel, F.; Kopiez, R.; Grewe, O.; Altenmüller, E. EMuJoy: Software for continuous measurement of perceived emotions in music. Behav. Res. Methods 2007, 39, 283–290. [Google Scholar] [CrossRef]
- Schubert, E. Measuring emotion continuously: Validity and reliability of the two-dimensional emotion-space. Aust. J. Psychol. 1999, 51, 154–165. [Google Scholar] [CrossRef]
- Soleymani, M.; Asghari-Esfeden, S.; Fu, Y.; Pantic, M. Analysis of EEG signals and facial expressions for continuous emotion detection. IEEE Trans. Affect. Comput. 2015, 7, 17–28. [Google Scholar] [CrossRef]
- Mariooryad, S.; Busso, C. Analysis and compensation of the reaction lag of evaluators in continuous emotional annotations. In Proceedings of the 2013 Humaine Association Conference on Affective Computing and Intelligent Interaction, Geneva, Switzerland, 2–5 September 2013; pp. 85–90. [Google Scholar]
- McKeown, G.; Valstar, M.; Cowie, R.; Pantic, M.; Schroder, M. The semaine database: Annotated multimodal records of emotionally colored conversations between a person and a limited agent. IEEE Trans. Affect. Comput. 2011, 3, 5–17. [Google Scholar] [CrossRef] [Green Version]
- Cowie, R.; Douglas-Cowie, E.; Savvidou, S.; McMahon, E.; Sawey, M.; Schröder, M. ‘FEELTRACE’: An instrument for recording perceived emotion in real time. In Proceedings of the ISCA Tutorial and Research Workshop (ITRW) on Speech and Emotion, Newcastle, UK, 5–7 September 2000. [Google Scholar]
- Girard, J.M.; C Wright, A.G. DARMA: Software for dual axis rating and media annotation. Behav. Res. Methods 2018, 50, 902–909. [Google Scholar] [CrossRef] [Green Version]
- Xu, W.; Chen, Y.; Sundaram, H.; Rikakis, T. Multimodal archiving, real-time annotation and information visualization in a biofeedback system for stroke patient rehabilitation. In Proceedings of the 3rd ACM workshop on Continuous Archival and Retrival of Personal Experences, New York, NY, USA, 28 October 2006; pp. 3–12. [Google Scholar]
- Muthukumaraswamy, S. High-frequency brain activity and muscle artifacts in MEG/EEG: A review and recommendations. Front. Hum. Neurosci. 2013, 7, 138. [Google Scholar] [CrossRef] [Green Version]
- Fatourechi, M.; Bashashati, A.; Ward, R.K.; Birch, G.E. EMG and EOG artifacts in brain computer interface systems: A survey. Clin. Neurophysiol. 2007, 118, 480–494. [Google Scholar] [CrossRef] [PubMed]
- Gratton, G. Dealing with artifacts: The EOG contamination of the event-related brain potential. Behav. Res. Methods Instrum. Comput. 1998, 30, 44–53. [Google Scholar] [CrossRef]
- Ramoser, H.; Muller-Gerking, J.; Pfurtscheller, G. Optimal spatial filtering of single trial EEG during imagined hand movement. IEEE Trans. Rehabil. Eng. 2000, 8, 441–446. [Google Scholar] [CrossRef] [PubMed] [Green Version]
- Croft, R.J.; Chandler, J.S.; Barry, R.J.; Cooper, N.R.; Clarke, A.R. EOG correction: A comparison of four methods. Psychophysiology 2005, 42, 16–24. [Google Scholar] [CrossRef]
- Bigirimana, A.D.; Siddique, N.; Coyle, D. A hybrid ICA-wavelet transform for automated artefact removal in EEG-based emotion recognition. In Proceedings of the 2016 IEEE International Conference on Systems, Man, and Cybernetics (SMC), Budapest, Hungary, 9–12 October 2016; pp. 004429–004434. [Google Scholar]
- Venkatesan, C.; Karthigaikumar, P.; Paul, A.; Satheeskumaran, S.; Kumar, R. ECG signal pre-processing and SVM classifier-based abnormality detection in remote healthcare applications. IEEE Access 2018, 6, 9767–9773. [Google Scholar] [CrossRef]
- Alcaraz, R.; Sandberg, F.; Sörnmo, L.; Rieta, J.J. Classification of paroxysmal and persistent atrial fibrillation in ambulatory ECG recordings. IEEE Trans. Biomed. Eng. 2011, 58, 1441–1449. [Google Scholar] [CrossRef]
- Patro, K.K.; Jaya Prakash, A.; Jayamanmadha Rao, M.; Rajesh Kumar, P. An efficient optimized feature selection with machine learning approach for ECG biometric recognition. IETE J. Res. 2022, 68, 2743–2754. [Google Scholar] [CrossRef]
- Cordeiro, R.; Gajaria, D.; Limaye, A.; Adegbija, T.; Karimian, N.; Tehranipoor, F. Ecg-based authentication using timing-aware domain-specific architecture. IEEE Trans.-Comput.-Aided Des. Integr. Syst. 2020, 39, 3373–3384. [Google Scholar] [CrossRef]
- Surawicz, B.; Knilans, T. Chou’s Electrocardiography in Clinical Practice: Adult and Pediatric; Elsevier Health Sciences: Amsterdam, The Netherlands, 2008. [Google Scholar]
- Saechia, S.; Koseeyaporn, J.; Wardkein, P. Human identification system based ECG signal. In Proceedings of the TENCON 2005—2005 IEEE Region 10 Conference, Melbourne, Australia, 21–24 November 2005; pp. 1–4. [Google Scholar]
- Wei, J.J.; Chang, C.J.; Chou, N.K.; Jan, G.J. ECG data compression using truncated singular value decomposition. IEEE Trans. Inf. Technol. Biomed. 2001, 5, 290–299. [Google Scholar]
- Tawfik, M.M.; Selim, H.; Kamal, T. Human identification using time normalized QT signal and the QRS complex of the ECG. In Proceedings of the 2010 7th International Symposium on Communication Systems, Networks & Digital Signal Processing (CSNDSP 2010), Newcastle Upon Tyne, UK, 21–23 July 2010; pp. 755–759. [Google Scholar]
- Odinaka, I.; Lai, P.H.; Kaplan, A.D.; O’Sullivan, J.A.; Sirevaag, E.J.; Kristjansson, S.D.; Sheffield, A.K.; Rohrbaugh, J.W. ECG biometrics: A robust short-time frequency analysis. In Proceedings of the 2010 IEEE International Workshop on Information Forensics and Security, Seattle, WA, USA, 12–15 December 2010; pp. 1–6. [Google Scholar]
- Huang, N.E.; Shen, Z.; Long, S.R.; Wu, M.C.; Shih, H.H.; Zheng, Q.; Yen, N.C.; Tung, C.C.; Liu, H.H. The empirical mode decomposition and the Hilbert spectrum for nonlinear and non-stationary time series analysis. Proc. R. Soc. Lond. Ser. A Math. Phys. Eng. Sci. 1998, 454, 903–995. [Google Scholar] [CrossRef]
- Gautam, A.; Sim oes-Capela, N.; Schiavone, G.; Acharyya, A.; De Raedt, W.; Van Hoof, C. A data driven empirical iterative algorithm for GSR signal pre-processing. In Proceedings of the 2018 26th European Signal Processing Conference (EUSIPCO), Rome, Italy, 3–7 September 2018; pp. 1162–1166. [Google Scholar]
- Haug, A.J. Bayesian Estimation and Tracking: A Practical Guide; John Wiley & Sons: Hoboken, NJ, USA, 2012. [Google Scholar]
- Tronstad, C.; Staal, O.M.; Sælid, S.; Martinsen, Ø.G. Model-based filtering for artifact and noise suppression with state estimation for electrodermal activity measurements in real time. In Proceedings of the 2015 37th Annual International Conference of the IEEE Engineering in Medicine and Biology Society (EMBC), Milan, Italy, 25–29 August 2015; pp. 2750–2753. [Google Scholar]
- Ahmad, Z.; Tabassum, A.; Guan, L.; Khan, N. Ecg heart-beat classification using multimodal image fusion. In Proceedings of the ICASSP 2021—2021 IEEE International Conference on Acoustics, Speech and Signal Processing (ICASSP), Toronto, ON, Canada, 6–11 June 2021; pp. 1330–1334. [Google Scholar]
- Ahmad, Z.; Tabassum, A.; Guan, L.; Khan, N.M. ECG heartbeat classification using multimodal fusion. IEEE Access 2021, 9, 100615–100626. [Google Scholar] [CrossRef]
- Rahim, A.; Sagheer, A.; Nadeem, K.; Dar, M.N.; Rahim, A.; Akram, U. Emotion Charting Using Real-time Monitoring of Physiological Signals. In Proceedings of the 2019 International Conference on Robotics and Automation in Industry (ICRAI), Rawalpindi, Pakistan, 21–22 October 2019; pp. 1–5. [Google Scholar]
- Elalamy, R.; Fanourakis, M.; Chanel, G. Multi-modal emotion recognition using recurrence plots and transfer learning on physiological signals. In Proceedings of the 2021 9th International Conference on Affective Computing and Intelligent Interaction (ACII), Nara, Japan, 28 September–1 October 2021; pp. 1–7. [Google Scholar]
- Gupta, V.; Chopda, M.D.; Pachori, R.B. Cross-subject emotion recognition using flexible analytic wavelet transform from EEG signals. IEEE Sens. J. 2018, 19, 2266–2274. [Google Scholar] [CrossRef]
- Yao, H.; He, H.; Wang, S.; Xie, Z. EEG-based emotion recognition using multi-scale window deep forest. In Proceedings of the 2019 IEEE Symposium Series on Computational Intelligence (SSCI), Xiamen, China, 6–9 December 2019; pp. 381–386. [Google Scholar]
- Wickramasuriya, D.S.; Tessmer, M.K.; Faghih, R.T. Facial expression-based emotion classification using electrocardiogram and respiration signals. In Proceedings of the 2019 IEEE Healthcare Innovations and Point of Care Technologies,(HI-POCT), Bethesda, MD, USA, 20–22 November 2019; pp. 9–12. [Google Scholar]
- Kim, S.; Yang, H.J.; Nguyen, N.A.T.; Prabhakar, S.K.; Lee, S.W. Wedea: A new eeg-based framework for emotion recognition. IEEE J. Biomed. Health Inform. 2021, 26, 264–275. [Google Scholar] [CrossRef] [PubMed]
- Schmidt, P.; Reiss, A.; Duerichen, R.; Marberger, C.; Van Laerhoven, K. Introducing wesad, a multimodal dataset for wearable stress and affect detection. In Proceedings of the 20th ACM International Conference on Multimodal Interaction, Boulder, CO, USA, 16–20 October 2018; pp. 400–408. [Google Scholar]
- Ahmad, Z.; Khan, N.M. Multi-level stress assessment using multi-domain fusion of ECG signal. In Proceedings of the 2020 42nd Annual International Conference of the IEEE Engineering in Medicine & Biology Society (EMBC), Montreal, QC, Canada, 20–24 July 2020; pp. 4518–4521. [Google Scholar]
- He, K.; Zhang, X.; Ren, S.; Sun, J. Deep residual learning for image recognition. In Proceedings of the IEEE Conference on Computer Vision and Pattern Recognition, Las Vegas, NV, USA, 27–30 June 2016; pp. 770–778. [Google Scholar]
- Santamaria-Granados, L.; Munoz-Organero, M.; Ramirez-Gonzalez, G.; Abdulhay, E.; Arunkumar, N. Using deep convolutional neural network for emotion detection on a physiological signals dataset (AMIGOS). IEEE Access 2018, 7, 57–67. [Google Scholar] [CrossRef]
- Chen, M.; Wang, G.; Ding, Z.; Li, J.; Yang, H. Unsupervised domain adaptation for ECG arrhythmia classification. In Proceedings of the 2020 42nd Annual International Conference of the IEEE Engineering in Medicine & Biology Society (EMBC), Montreal, QC, Canada, 20–24 July 2020; pp. 304–307. [Google Scholar]
- Vaswani, A.; Shazeer, N.; Parmar, N.; Uszkoreit, J.; Jones, L.; Gomez, A.N.; Kaiser, Ł.; Polosukhin, I. Attention is all you need. Adv. Neural Inf. Process. Syst. 2017, 30. [Google Scholar] [CrossRef]
- Zhang, X.; Liu, J.; Shen, J.; Li, S.; Hou, K.; Hu, B.; Gao, J.; Zhang, T. Emotion recognition from multimodal physiological signals using a regularized deep fusion of kernel machine. IEEE Trans. Cybern. 2020, 51, 4386–4399. [Google Scholar] [CrossRef]
- Ullah, H.; Uzair, M.; Mahmood, A.; Ullah, M.; Khan, S.D.; Cheikh, F.A. Internal emotion classification using EEG signal with sparse discriminative ensemble. IEEE Access 2019, 7, 40144–40153. [Google Scholar] [CrossRef]
- Chang, E.J.; Rahimi, A.; Benini, L.; Wu, A.Y.A. Hyperdimensional computing-based multimodality emotion recognition with physiological signals. In Proceedings of the 2019 IEEE International Conference on Artificial Intelligence Circuits and Systems (AICAS), Hsinchu, Taiwan, 18–20 March 2019; pp. 137–141. [Google Scholar]
- Yang, C.J.; Fahier, N.; He, C.Y.; Li, W.C.; Fang, W.C. An ai-edge platform with multimodal wearable physiological signals monitoring sensors for affective computing applications. In Proceedings of the 2020 IEEE International Symposium on Circuits and Systems (ISCAS), Seville, Spain, 12–14 October 2020; pp. 1–5. [Google Scholar]
- Vijayakumar, S.; Flynn, R.; Murray, N. A comparative study of machine learning techniques for emotion recognition from peripheral physiological signals. In Proceedings of the 2020 31st Irish Signals and Systems Conference (ISSC), Letterkenny, Ireland, 11–12 June 2020; pp. 1–6. [Google Scholar]
- Chao, H.; Dong, L. Emotion recognition using three-dimensional feature and convolutional neural network from multichannel EEG signals. IEEE Sens. J. 2020, 21, 2024–2034. [Google Scholar] [CrossRef]
- Zhao, W.; Zhao, Z.; Li, C. Discriminative-CCA promoted By EEG signals for physiological-based emotion recognition. In Proceedings of the 2018 First Asian Conference on Affective Computing and Intelligent Interaction (ACII Asia), Beijing, China, 20–22 May 2018; pp. 1–6. [Google Scholar]
- Fabiano, D.; Canavan, S. Emotion recognition using fused physiological signals. In Proceedings of the 2019 8th International Conference on Affective Computing and Intelligent Interaction (ACII), Cambridge, UK, 3–6 September 2019; pp. 42–48. [Google Scholar]
- Li, X.; Zhang, X.; Yang, H.; Duan, W.; Dai, W.; Yin, L. An EEG-based multi-modal emotion database with both posed and authentic facial actions for emotion analysis. In Proceedings of the 2020 15th IEEE International Conference on Automatic Face and Gesture Recognition (FG 2020), Buenos Aires, Argentina, 16–20 November 2020; pp. 336–343. [Google Scholar]
- Cimtay, Y.; Ekmekcioglu, E.; Caglar-Ozhan, S. Cross-subject multimodal emotion recognition based on hybrid fusion. IEEE Access 2020, 8, 168865–168878. [Google Scholar] [CrossRef]
- Xie, J.; Xu, X.; Shu, L. WT feature based emotion recognition from multi-channel physiological signals with decision fusion. In Proceedings of the 2018 First Asian Conference on Affective Computing and Intelligent Interaction (ACII Asia), Beijing, China, 20–22 May 2018; pp. 1–6. [Google Scholar]
- Khateeb, M.; Anwar, S.M.; Alnowami, M. Multi-domain feature fusion for emotion classification using DEAP dataset. IEEE Access 2021, 9, 12134–12142. [Google Scholar] [CrossRef]
- Pinto, J.; Fred, A.; da Silva, H.P. Biosignal-based multimodal emotion recognition in a valence-arousal affective framework applied to immersive video visualization. In Proceedings of the 2019 41st Annual International Conference of the IEEE Engineering in Medicine and Biology Society (EMBC), Berlin, Germany, 23–27 July 2019; pp. 3577–3583. [Google Scholar]
- Xing, B.; Zhang, H.; Zhang, K.; Zhang, L.; Wu, X.; Shi, X.; Yu, S.; Zhang, S. Exploiting EEG signals and audiovisual feature fusion for video emotion recognition. IEEE Access 2019, 7, 59844–59861. [Google Scholar] [CrossRef]
- Yasemin, M.; Sarıkaya, M.A.; Ince, G. Emotional state estimation using sensor fusion of EEG and EDA. In Proceedings of the 2019 41st Annual International Conference of the IEEE Engineering in Medicine and Biology Society (EMBC), Berlin, Germany, 23–27 July 2019; pp. 5609–5612. [Google Scholar]
- Hssayeni, M.D.; Ghoraani, B. Multi-modal physiological data fusion for affect estimation using deep learning. IEEE Access 2021, 9, 21642–21652. [Google Scholar] [CrossRef]


| Database | Modalities | Stimulai | Subjects | Sampling Rate | Emotion States |
|---|---|---|---|---|---|
| AMIGOS [41] | EEG, ECG, EDA | Video clips | 40 | Not Provided | Anger, Fear, Sadness, Disgust, Neutrality, Surprise, Happiness |
| ASCERTAIN [42] | EEG, ECG, EDA | Movie clips | 58 | EDA at 100 Hz EEG at 32 Hz | Valence (–3–3), Arousal (0–6) |
| BIO-VID-EMO DB [43] | ECG, EMG, SC | Film clips | 86 | 512 Hz | Valence, Arousal, Amusement, Sadness, Anger, Disgust, Fear |
| DEAP [44] | EEG, EDA, EMG, PPG, EOG, RSP | Music Videos | 32 | 512 Hz | Valence (1–9), Arousal (1–9), Dominance (1–9), Liking (1–9), Familiarity (1–5) |
| DREAMER [45] | EEG, ECG | Film clips | 23 | Not Provided | Anger, Fear, Sadness, Disgust, Calmness, Surprise, Amusement, Happiness, Excitement |
| MAHNOB-HCI [46] | EEG, ECG, EDA, RSP, SKT | Video clips | 27 | 256 Hz | Anger, Anxiety, Fear, Sadness, Disgust, Neutrality, Surprise, Amusement, Joy |
| MPED [47] | EEG, ECG, EDA, RSP | Video clips | 23 | 1000 Hz | Anger, Fear, Sadness, Disgust. Neutrality, Funny, Joy |
| SEED [48] | EEG | Film clips | 15 | 1000 Hz | Negativity, Neutrality, Positivity |
| Testing Sub | Accuracy | Precision | Recall | Score |
|---|---|---|---|---|
| 2 | 44.2 | 47.3 | 44.2 | 40.8 |
| 3 | 47.5 | 47.9 | 47.5 | 45.6 |
| 4 | 46.8 | 55.4 | 46.8 | 43.8 |
| 5 | 51.5 | 51.3 | 51.5 | 49 |
| 6 | 46 | 45.7 | 46 | 43.9 |
| 7 | 51.3 | 47 | 51.3 | 46 |
| 8 | 51 | 51.4 | 51 | 50.6 |
| 9 | 42.8 | 41.5 | 42.8 | 41 |
| 10 | 57.6 | 56.1 | 57.6 | 53.4 |
| 11 | 56.1 | 57.5 | 56.1 | 57.4 |
| 13 | 52.1 | 51.6 | 52.1 | 50.6 |
| 14 | 61.6 | 60 | 61.6 | 55.4 |
| 15 | 52.9 | 52.1 | 52.9 | 50.6 |
| 16 | 56.4 | 52.5 | 56.4 | 52 |
| 17 | 53.1 | 50.7 | 53.1 | 50.9 |
| Average | 51.4 | 51.2 | 51.4 | 48.7 |
| Testing Sub | Accuracy | Precision | Recall | Score |
|---|---|---|---|---|
| 2 | 75.1 | 75.3 | 75.1 | 75.2 |
| 3 | 73.3 | 75.6 | 73.3 | 73.8 |
| 4 | 73.4 | 76.7 | 73.4 | 73.8 |
| 5 | 73.8 | 77.4 | 73.8 | 74.4 |
| 6 | 65.3 | 67.7 | 65.3 | 65.7 |
| 7 | 71.3 | 76 | 71.3 | 72 |
| 8 | 66.8 | 70.4 | 66.8 | 67.7 |
| 9 | 67.9 | 72.9 | 67.9 | 68.4 |
| 10 | 69.5 | 71.8 | 69.5 | 70 |
| 11 | 75.3 | 78.4 | 75.3 | 75.7 |
| 13 | 68.8 | 73 | 68.8 | 69.3 |
| 14 | 78.1 | 80.1 | 78.1 | 78.4 |
| 15 | 67.8 | 70.6 | 67.8 | 68.7 |
| 16 | 75.8 | 79 | 75.8 | 76.1 |
| 17 | 78.1 | 81.6 | 78.1 | 78.2 |
| Average | 72 | 75.1 | 72 | 72.5 |
| Testing Sub | Accuracy | Precision | Recall | Score |
|---|---|---|---|---|
| 2 | 58.9 | 60.9 | 58.9 | 58.6 |
| 3 | 65.4 | 66.4 | 65.4 | 65.4 |
| 4 | 59.3 | 59.4 | 59.3 | 58.9 |
| 5 | 64.7 | 64.2 | 64.7 | 63.2 |
| 11 | 45.3 | 48.8 | 45.3 | 38 |
| 12 | 69.6 | 72.6 | 69.6 | 69.1 |
| 13 | 70.6 | 76.3 | 70.6 | 70.3 |
| 14 | 66.7 | 69 | 66.7 | 67.2 |
| 16 | 64.8 | 67.2 | 64.8 | 64.1 |
| Average | 62.8 | 62.5 | 62.8 | 61.6 |
| Testing Sub | Accuracy | Precision | Recall | Score |
|---|---|---|---|---|
| 2 | 72.1 | 74.87 | 72.1 | 72.25 |
| 3 | 71.3 | 75.6 | 71.25 | 71.17 |
| 4 | 60.7 | 58.65 | 60.7 | 56.06 |
| 5 | 62.5 | 63.3 | 62.5 | 62.54 |
| 11 | 49.3 | 37.6 | 49.3 | 39.35 |
| 12 | 61.11 | 63.48 | 61.11 | 61.25 |
| 13 | 76.1 | 83.7 | 76.15 | 76.22 |
| 14 | 64 | 66.13 | 64 | 63.59 |
| 16 | 70.3 | 73.28 | 70.3 | 70.8 |
| Average | 65.34 | 66.2 | 65.34 | 63.7 |
Publisher’s Note: MDPI stays neutral with regard to jurisdictional claims in published maps and institutional affiliations. |
© 2022 by the authors. Licensee MDPI, Basel, Switzerland. This article is an open access article distributed under the terms and conditions of the Creative Commons Attribution (CC BY) license (https://creativecommons.org/licenses/by/4.0/).
Share and Cite
Ahmad, Z.; Khan, N. A Survey on Physiological Signal-Based Emotion Recognition. Bioengineering 2022, 9, 688. https://doi.org/10.3390/bioengineering9110688
Ahmad Z, Khan N. A Survey on Physiological Signal-Based Emotion Recognition. Bioengineering. 2022; 9(11):688. https://doi.org/10.3390/bioengineering9110688
Chicago/Turabian StyleAhmad, Zeeshan, and Naimul Khan. 2022. "A Survey on Physiological Signal-Based Emotion Recognition" Bioengineering 9, no. 11: 688. https://doi.org/10.3390/bioengineering9110688