
A Novel Hybrid Parametric and Non-Parametric Optimisation Model for Average Technical Efficiency Assessment in Public Hospitals during and Post-COVID-19 Pandemic

 ,
,  , ,
, ,
Abstract
:1. Introduction
- i.
- Following the optimisation mentioned above, the statistical evaluation and comparison of three suggested models are applied, and the most efficient model is introduced. This statistical evaluation shows the positive and negative correlation between profit risk and efficiency.
- ii.
- Considering multiple inputs and outputs based on the translog function, the VRS-CRS model is one of the current study’s novelties, which has not been studied in the previous research. The previous related papers merely consider CRS or VRS.
- iii.
- Another novel aspect of the current study is the use of error-free unreplicated linear functional relationship (ULFR) to remove missing data and to present the least and the most efficient hospitals.
- iv.
- The superior model and hospital are introduced after employing the novel combined optimisation approach. As a result, the findings of this study can assist decision-makers in eliminating irrelevant data and conducting more effective processes.
2. Literature Review
3. Materials and Methods
3.1. Dataset Description
3.2. Research Methodology
3.3. The Non-Parametric Model
3.4. The Parametric Model
3.5. The Proposed VRS-CRS-SFA (VCS) Model
3.6. Linear Regression Assessment or Profit-Risk Evaluator
3.7. ULFR Model
4. Results and Discussion
4.1. Technical Efficiency Assessment Based on BCC-CCR, SFA, and VCS Models
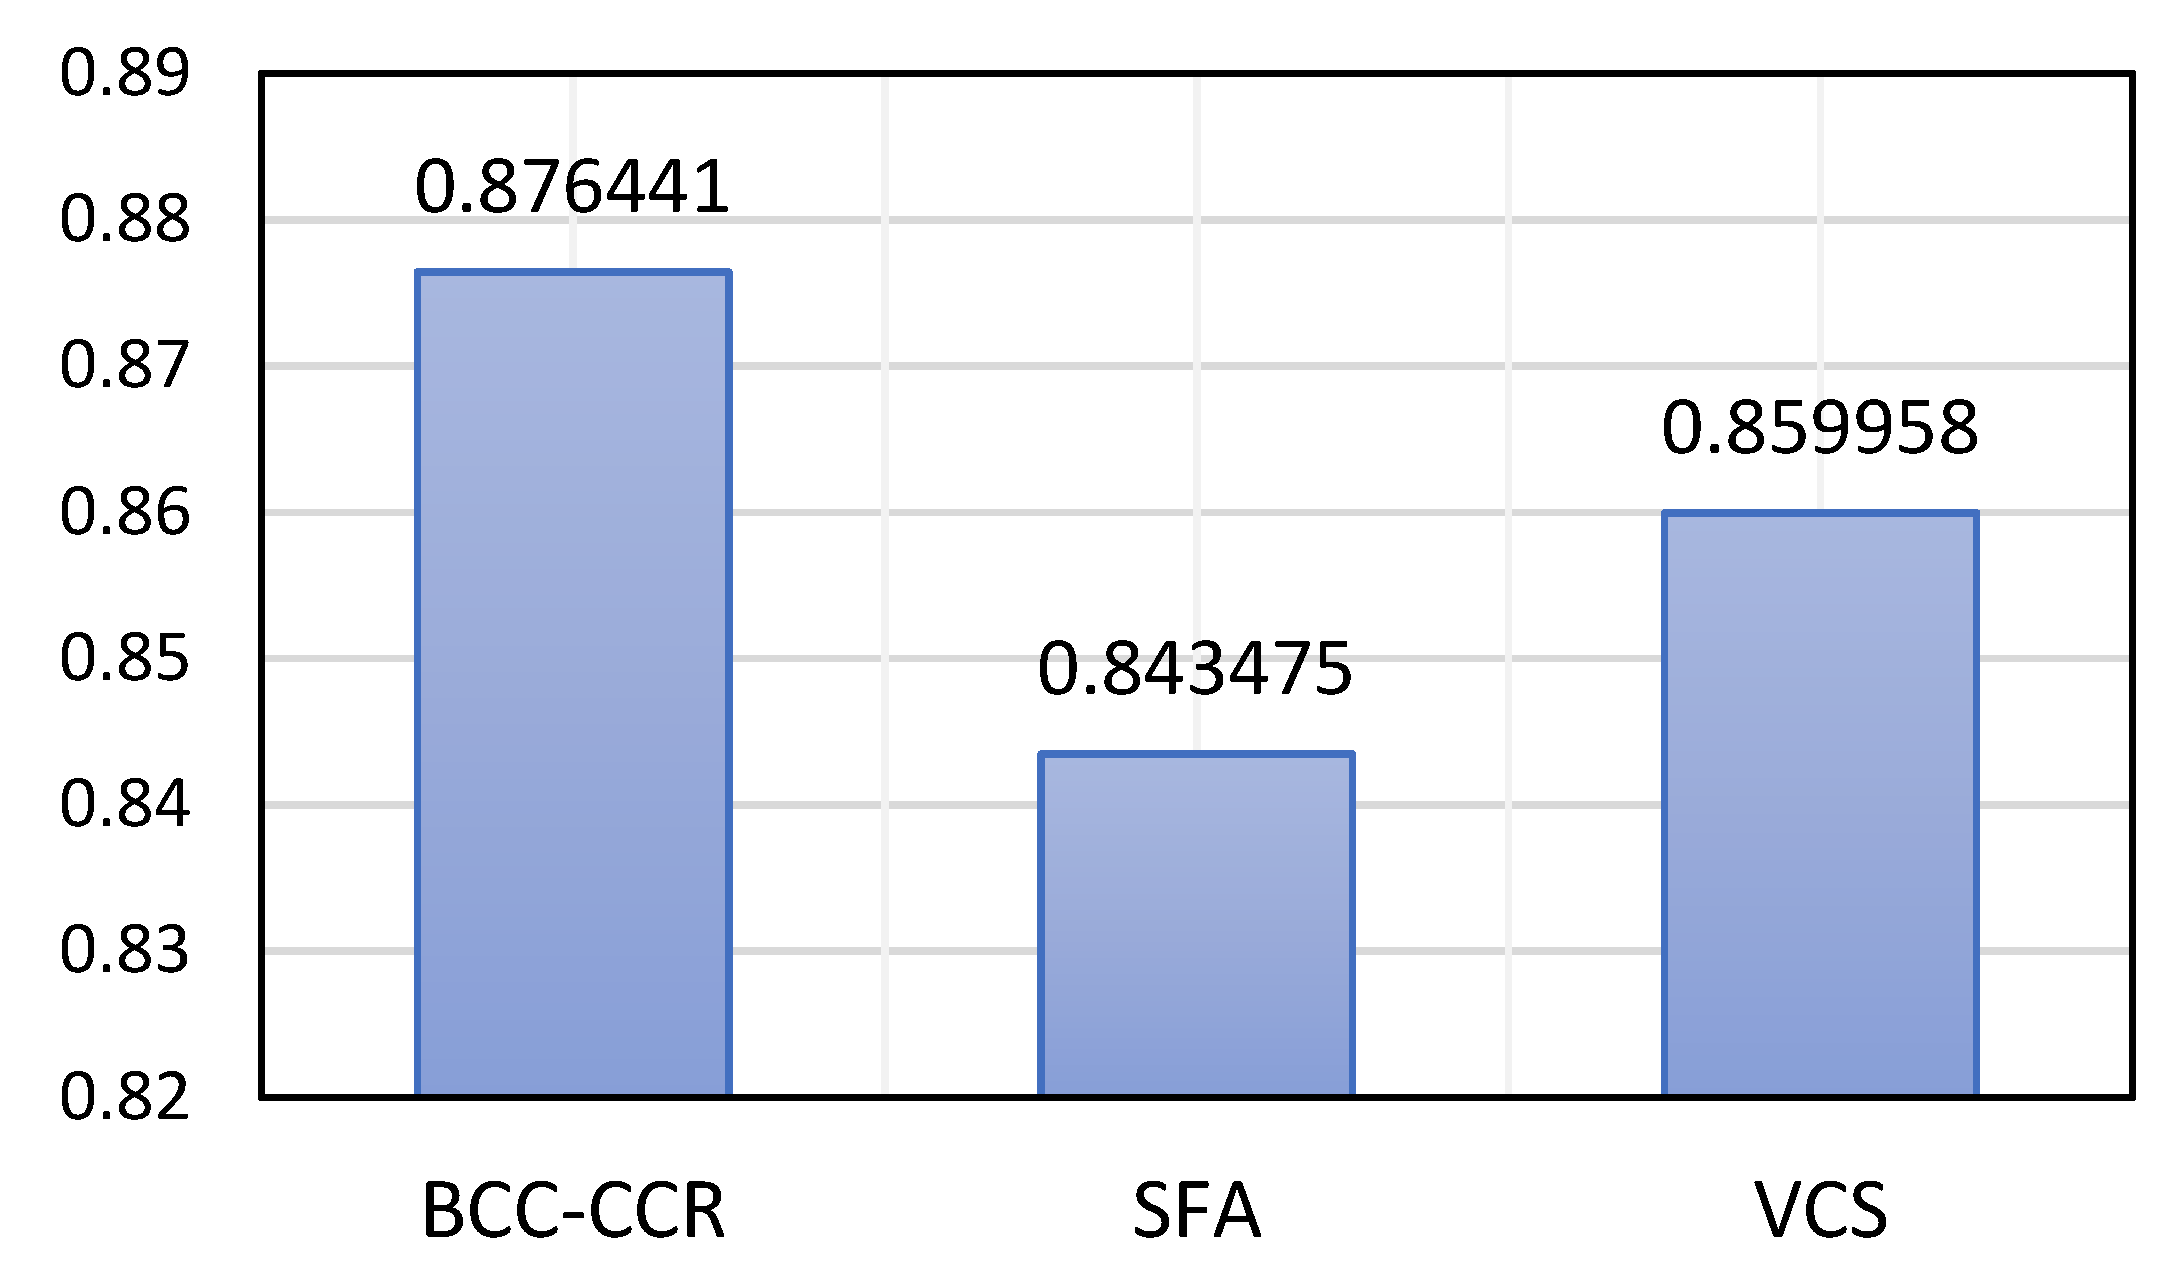
4.2. ATE Evaluation for BCC-CCR, SFA, and VCS
4.3. Evaluation of Regression and ULFR
4.4. VCS Assessment after ULFR Evaluation
5. Conclusions and Future Works
Author Contributions
Funding
Institutional Review Board Statement
Informed Consent Statement
Data Availability Statement
Conflicts of Interest
References
- Aghapour, A.H.; Yazdani, M.; Jolai, F.; Mojtahedi, M. Capacity planning and reconfiguration for disaster-resilient health infrastructure. J. Build. Eng. 2019, 26, 100853. [Google Scholar] [CrossRef]
- Yazdani, M.; Mojtahedi, M.; Loosemore, M.; Sanderson, D.; Dixit, V. Hospital evacuation modelling: A critical literature review on current knowledge and research gaps. Int. J. Disaster Risk Reduct. 2021, 66, 102627. [Google Scholar] [CrossRef]
- Wei, W.; Mojtahedi, M.; Yazdani, M.; Kabirifar, K. The Alignment of Australia’s National Construction Code and the Sendai Framework for Disaster Risk Reduction in Achieving Resilient Buildings and Communities. Buildings 2021, 11, 429. [Google Scholar] [CrossRef]
- Porter, M.E.; Kaplan, R.S.; Frigo, M.L. Managing healthcare costs and value. Strateg. Financ. 2017, 98, 24. [Google Scholar]
- Katharaki, M. Approaching the management of hospital units with an operation research technique: The case of 32 Greek obstetric and gynaecology public units. Health Policy 2008, 85, 19–31. [Google Scholar] [CrossRef]
- Apornak, A.; Raissi, S.; Keramati, A.; Khalili-Damghani, K. Optimizing human resource cost of an emergency hospital using multi-objective Bat algorithm. Int. J. Healthc. Manag. 2020, 14, 1–7. [Google Scholar] [CrossRef]
- Khalili, S.M.; Babagolzadeh, M.; Yazdani, M.; Saberi, M.; Chang, E. A bi-objective model for relief supply location in post-disaster management. In Proceedings of the 2016 International Conference on Intelligent Networking and Collaborative Systems (INCoS), Ostrave, Czech Republic, 7–9 September 2016; pp. 428–434. [Google Scholar]
- Yazdani, M.; Jolai, F. A genetic algorithm with modified crossover operator for a two-agent scheduling problem. J. Syst. Manag. 2015, 1, 743–752. [Google Scholar]
- Yazdani, M.; Ghodsi, R. Invasive weed optimization algorithm for minimizing total weighted earliness and tardiness penalties on a single machine under aging effect. Int. Robot. Autom. J. 2017, 2, 1–5. [Google Scholar] [CrossRef] [Green Version]
- Ghafourian, K.; Kabirifar, K.; Mahdiyar, A.; Yazdani, M.; Ismail, S.; Tam, V.W. A Synthesis of Express Analytic Hierarchy Process (EAHP) and Partial Least Squares-Structural Equations Modeling (PLS-SEM) for Sustainable Construction and Demolition Waste Management Assessment: The Case of Malaysia. Recycling 2021, 6, 73. [Google Scholar] [CrossRef]
- Yazdani, M.; Jolai, F.; Taleghani, M.; Yazdani, R. A modified imperialist competitive algorithm for a two-agent single-machine scheduling under periodic maintenance consideration. Int. J. Oper. Res. 2018, 32, 127–155. [Google Scholar] [CrossRef]
- Kohl, S.; Schoenfelder, J.; Fügener, A.; Brunner, J.O. Correction to: The use of Data Envelopment Analysis (DEA) in healthcare with a focus on hospitals. Health Care Manag. Sci. 2020, 23, 170. [Google Scholar] [CrossRef] [Green Version]
- Yang, C.-C. Measuring health indicators and allocating health resources: A DEA-based approach. Health Care Manag. Sci. 2017, 20, 365–378. [Google Scholar] [CrossRef] [PubMed]
- Ferrier, G.D.; Rosko, M.D.; Valdmanis, V.G. Analysis of uncompensated hospital care using a DEA model of output congestion. Health Care Manag. Sci. 2006, 9, 181–188. [Google Scholar] [CrossRef] [PubMed]
- Jacobs, R. Alternative methods to examine hospital efficiency: Data envelopment analysis and stochastic frontier analysis. Health Care Manag. Sci. 2001, 4, 103–115. [Google Scholar] [CrossRef] [PubMed]
- Azadeh, A.; Ghaderi, S.F.; Mirjalili, M.; Moghaddam, M. A DEA approach for ranking and optimisation of technical and management efficiency of a large bank based on financial indicators. Int. J. Oper. Res. 2010, 9, 160–187. [Google Scholar] [CrossRef]
- Azadeh, A.; Javanmardi, L.; Saberi, M. The impact of decision-making units features on efficiency by integration of data envelopment analysis, artificial neural network, fuzzy C-means and analysis of variance. Int. J. Oper. Res. 2010, 7, 387–411. [Google Scholar] [CrossRef]
- Emrouznejad, A.; Thanassoulis, E. Measurement of productivity index with dynamic DEA. Int. J. Oper. Res. 2010, 8, 247–260. [Google Scholar] [CrossRef]
- Pannu, H.; Dinesh Kumar, U.; Farooquie, J.A. Efficiency and productivity analysis of Indian pharmaceutical industry using data envelopment analysis. Int. J. Oper. Res. 2011, 10, 121–136. [Google Scholar] [CrossRef]
- Agarwal, S.; Yadav, S.P.; Singh, S. A new slack DEA model to estimate the impact of slacks on the efficiencies. Int. J. Oper. Res. 2011, 12, 241–256. [Google Scholar] [CrossRef]
- Dharmapala, P.S. Adding value in healthcare service by improving operational efficiency using data envelopment analysis. Int. J. Oper. Res. 2009, 5, 73–88. [Google Scholar] [CrossRef]
- Ramanathan, R.; Ramanathan, U. A performance measurement framework combining DEA and balanced scorecard for the UK health sector. Int. J. Oper. Res. 2011, 12, 257–278. [Google Scholar] [CrossRef]
- Mariani, M.M.; Visani, F. Embedding eWOM into efficiency DEA modelling: An application to the hospitality sector. Int. J. Hosp. Manag. 2019, 80, 1–12. [Google Scholar] [CrossRef]
- Gong, B.-H.; Sickles, R.C. Finite sample evidence on the performance of stochastic frontiers and data envelopment analysis using panel data. J. Econom. 1992, 51, 259–284. [Google Scholar] [CrossRef]
- Mortimer, D. A Systematic Review of Direct DEA vs. SFA/DFA Comparisons. Available online: https://core.ac.uk/download/pdf/36962976.pdf (accessed on 29 November 2021).
- Mortimer, D.S. Methods for the Measurement of Hospital Efficiency: A Comparison of Frontier Estimation Techniques in a Sample of Victorian Public Hospitals; Monash University: West Heidelberg, Australia, 2001. [Google Scholar]
- Mutter, R.L.; Rosko, M.D.; Greene, W.H.; Wilson, P.W. Translating Frontiers into Practice: Taking the Next Steps toward Improving Hospital Efficiency; SAGE Publications: Los Angeles, CA, USA, 2011. [Google Scholar]
- Mirmozaffari, M.; Shadkam, E.; Khalili, S.M.; Yazdani, M. Developing a Novel Integrated Generalised Data Envelopment Analysis (DEA) to Evaluate Hospitals Providing Stroke Care Services. Bioengineering 2021, 8, 207. [Google Scholar] [CrossRef] [PubMed]
- Yazdani, M.; Kabirifar, K.; Frimpong, B.E.; Shariati, M.; Mirmozaffari, M.; Boskabadi, A. Improving construction and demolition waste collection service in an urban area using a simheuristic approach: A case study in Sydney, Australia. J. Clean. Prod. 2021, 280, 124138. [Google Scholar] [CrossRef]
- Yazdani, M.; Aleti, A.; Khalili, S.M.; Jolai, F. Optimizing the sum of maximum earliness and tardiness of the job shop scheduling problem. Comput. Ind. Eng. 2017, 107, 12–24. [Google Scholar] [CrossRef]
- Yazdani, M.; Khalili, S.M.; Jolai, F. A parallel machine scheduling problem with two-agent and tool change activities: An efficient hybrid metaheuristic algorithm. Int. J. Comput. Integr. Manuf. 2016, 29, 1075–1088. [Google Scholar] [CrossRef]
- Yazdani, M.; Mojtahedi, M.; Loosemore, M. Enhancing evacuation response to extreme weather disasters using public transportation systems: A novel simheuristic approach. J. Comput. Des. Eng. 2020, 7, 195–210. [Google Scholar] [CrossRef]
- Morasaei, A.; Ghabussi, A.; Aghlmand, S.; Yazdani, M.; Baharom, S.; Assilzadeh, H. Simulation of steel—Concrete composite floor system behavior at elevated temperatures via multi-hybrid metaheuristic framework. Eng. Comput. 2021. [Google Scholar] [CrossRef]
- Yazdani, M.; Kabirifar, K.; Fathollahi-Fard, A.M.; Mojtahedi, M. Production scheduling of off-site prefabricated construction components considering sequence dependent due dates. Environ. Sci. Pollut. Res. 2021. [Google Scholar] [CrossRef]
- Yazdani, M.; Khalili, S.M.; Babagolzadeh, M.; Jolai, F. A single-machine scheduling problem with multiple unavailability constraints: A mathematical model and an enhanced variable neighborhood search approach. J. Comput. Des. Eng. 2017, 4, 46–59. [Google Scholar] [CrossRef] [Green Version]
- Babagolzadeh, M.; Shrestha, A.; Abbasi, B.; Zhang, Y.; Woodhead, A.; Zhang, A. Sustainable cold supply chain management under demand uncertainty and carbon tax regulation. Transp. Res. Part D Transp. Environ. 2020, 80, 102245. [Google Scholar] [CrossRef]
- Chen, Y.; Yazdani, M.; Mojtahedi, M.; Newton, S. The impact on neighbourhood residential property valuations of a newly proposed public transport project: The Sydney Northwest Metro case study. Transp. Res. Interdiscip. Perspect. 2019, 3, 100070. [Google Scholar] [CrossRef]
- Yazdani, M.; Babagolzadeh, M.; Kazemitash, N.; Saberi, M. Reliability estimation using an integrated support vector regression—Variable neighborhood search model. J. Ind. Inf. Integr. 2019, 15, 103–110. [Google Scholar] [CrossRef]
- Mohammadi, M.; Gheibi, M.; Fathollahi-Fard, A.M.; Eftekhari, M.; Kian, Z.; Tian, G. A hybrid computational intelligence approach for bioremediation of amoxicillin based on fungus activities from soil resources and aflatoxin B1 controls. J. Environ. Manag. 2021, 299, 113594. [Google Scholar] [CrossRef]
- Sohani, A.; Naderi, S.; Torabi, F. Comprehensive comparative evaluation of different possible optimization scenarios for a polymer electrolyte membrane fuel cell. Energy Convers. Manag. 2019, 191, 247–260. [Google Scholar] [CrossRef]
- Babagolzadeh, M.; Pirayesh, M.; Shrestha, A. Optimal delivery and replenishment policies for perishable products considering lost sale cost: An efficient hybrid algorithm. Int. J. Ind. Syst. Eng. 2021, 37, 306–333. [Google Scholar] [CrossRef]
- Naderi, S.; Banifateme, M.; Pourali, O.; Behbahaninia, A.; MacGill, I.; Pignatta, G. Accurate capacity factor calculation of waste-to-energy power plants based on availability analysis and design/off-design performance. J. Clean. Prod. 2020, 275, 123167. [Google Scholar] [CrossRef]
- Gheibi, M.; Eftekhari, M.; Tabrizi, M.; Fathollahi-Fard, A.; Tian, G. Mechanistic evaluation of cationic dyes adsorption onto low-cost calcinated aerated autoclaved concrete wastes. Int. J. Environ. Sci. Technol. 2021, 1–16. [Google Scholar] [CrossRef]
- Wang, W.; Tian, G.; Zhang, T.; Jabarullah, N.H.; Li, F.; Fathollahi-Fard, A.M.; Wang, D.; Li, Z. Scheme selection of design for disassembly (DFD) based on sustainability: A novel hybrid of interval 2-tuple linguistic intuitionistic fuzzy numbers and regret theory. J. Clean. Prod. 2021, 281, 124724. [Google Scholar] [CrossRef]
- Mirmozaffari, M.; Yazdani, M.; Boskabadi, A.; Ahady Dolatsara, H.; Kabirifar, K.; Amiri Golilarz, N. A novel machine learning approach combined with optimization models for eco-efficiency evaluation. Appl. Sci. 2020, 10, 5210. [Google Scholar] [CrossRef]
- Kontodimopoulos, N.; Papathanasiou, N.D.; Flokou, A.; Tountas, Y.; Niakas, D. The impact of non-discretionary factors on DEA and SFA technical efficiency differences. J. Med. Syst. 2011, 35, 981–989. [Google Scholar] [CrossRef] [PubMed]
- Lampe, H.W.; Hilgers, D. Trajectories of efficiency measurement: A bibliometric analysis of DEA and SFA. Eur. J. Oper. Res. 2015, 240, 1–21. [Google Scholar] [CrossRef]
- Veen, S. Comparative Efficiency Analysis from the Perspective of the Dutch Health Care Insurer. Determining the Usefulness of Efficiency Measures for Contracting Primary Care Organizations. Master’s Thesis, The Erasmus University, Rotterdam, The Netherlands, 2012. [Google Scholar]
- Nedelea, I.C.; Fannin, J.M. Efficiency Analysis of Rural Hospitals Parametric and semi-parametric approaches. In Proceedings of the Annual Meeting, Birmingham, AL, USA, 2–7 February 2012. [Google Scholar]
- Ippoliti, R.; Falavigna, G. Efficiency of the medical care industry: Evidence from the Italian regional system. Eur. J. Oper. Res. 2012, 217, 643–652. [Google Scholar] [CrossRef]
- Chirikos, T.N.; Sear, A.M. Measuring hospital efficiency: A comparison of two approaches. Health Serv. Res. 2000, 34, 1389–1408. [Google Scholar]
- Noorizadeh, A.; Mahdiloo, M.; Saen, R.F. A new approach for considering a dual-role factor in data envelopment analysis. Int. J. Oper. Res. 2012, 14, 135–155. [Google Scholar] [CrossRef]
- Linna, M. Measuring hospital cost efficiency with panel data models. Health Econ. 1998, 7, 415–427. [Google Scholar] [CrossRef]
- Assaf, A.; Matawie, K.M. Cost efficiency modeling in health care foodservice operations. Int. J. Hosp. Manag. 2008, 27, 604–613. [Google Scholar] [CrossRef]
- Desai, A.; Ratick, S.J.; Schinnar, A.P. Data envelopment analysis with stochastic variations in data. Socio-Econo. Plan. Sci. 2005, 39, 147–164. [Google Scholar] [CrossRef]
- Lee, R.H.; Bott, M.J.; Gajewski, B.; Taunton, R.L. Modeling efficiency at the process level: An examination of the care planning process in nursing homes. Health Serv. Res. 2009, 44, 15–32. [Google Scholar] [CrossRef] [Green Version]
- Smith, P.C.; Street, A. Measuring the efficiency of public services: The limits of analysis. J. R. Stat. Soc. Series A (Stat. Soc.) 2005, 168, 401–417. [Google Scholar] [CrossRef]
- Ahmadzade, M.; Fazli, S.; Khosroanjom, D.; Mavi, R.K. Utilising data envelopment analysis for selecting stock and benchmark firms in Tehran stock exchange. Int. J. Oper. Res. 2011, 12, 446–463. [Google Scholar] [CrossRef]
- Cooper, W.; Ruefli, T.W.; Deng, H.; Wu, J.; Zhang, Z. Are state-owned banks less efficient? A long-vs. short-run data envelopment analysis of Chinese banks. Int. J. Oper. Res. 2008, 3, 533–556. [Google Scholar] [CrossRef]
- Dharmapala, P.S.; Edirisuriya, P. A classification method for banks’ profitability using revised Thompson–Thrall profit ratios in DEA and cluster analysis with an application to South Asian banks. Int. J. Oper. Res. 2012, 15, 147–169. [Google Scholar] [CrossRef]
- Ho, C.-T.B. Performance measurement using data envelopment analysis and financial statement analysis. Int. J. Oper. Res. 2007, 2, 26–38. [Google Scholar] [CrossRef]
- Boďa, M.; Zimková, E. A DEA model for measuring financial intermediation. Econ. Chang. Restruct. 2020, 52, 339–370. [Google Scholar] [CrossRef]
- Azadi, M.; Saen, R.F. Developing a new chance-constrained DEA model for suppliers selection in the presence of undesirable outputs. Int. J. Oper. Res. 2012, 13, 44–66. [Google Scholar] [CrossRef]
- Mulwa, R.; Emrouznejad, A.; Muhammad, L. Economic efficiency of smallholder maize producers in Western Kenya: A DEA meta-frontier analysis. Int. J. Oper. Res. 2009, 4, 250–267. [Google Scholar] [CrossRef]
- Raut, R.D.; Bhasin, H.V.; Kamble, S.S. Supplier selection using integrated multi-criteria decision-making methodology. Int. J. Oper. Res. 2012, 13, 359–394. [Google Scholar] [CrossRef]
- Omrani, H.; Amini, M.; Alizadeh, A. An integrated group best-worst method—Data envelopment analysis approach for evaluating road safety: A case of Iran. Measurement 2020, 152, 107330. [Google Scholar] [CrossRef]
- Peykani, P.; Mohammadi, E.; Saen, R.F.; Sadjadi, S.J.; Rostamy-Malkhalifeh, M. Data envelopment analysis and robust optimization: A review. Expert Syst. 2020, 37, e12534. [Google Scholar] [CrossRef]
- De Witte, K.; Marques, R.C. Incorporating heterogeneity in non-parametric models: A methodological comparison. Int. J. Oper. Res. 2010, 9, 188–204. [Google Scholar] [CrossRef]
- Newhouse, J.P. Frontier estimation: How useful a tool for health economics? J. Health Econ. 1994, 13, 317–322. [Google Scholar] [CrossRef]
- Simar, L.; Wilson, P.W. Estimation and inference in two-stage, semi-parametric models of production processes. J. Econ. 2007, 136, 31–64. [Google Scholar] [CrossRef]
- Hollingsworth, B. The measurement of efficiency and productivity of health care delivery. Health Econ. 2008, 17, 1107–1128. [Google Scholar] [CrossRef]
- Hollingsworth, B.; Parkin, D. Efficiency and productivity change in the English National Health Service: Can data envelopment analysis provide a robust and useful measure? J. Health Serv. Res. Policy 2003, 8, 230–236. [Google Scholar] [CrossRef]
- Jacobs, R.; Smith, P.C.; Street, A. Measuring Efficiency in Health Care: Analytic Techniques and Health Policy; Cambridge University Press: Cambridge, UK, 2006. [Google Scholar]
- Choi, J.H.; Fortsch, S.M.; Park, I.; Jung, I. Efficiency of US hospitals between 2001 and 2011. Manag. Decis. Econ. 2017, 38, 1071–1081. [Google Scholar] [CrossRef]
- Keshtkar, L.; Rashwan, W.; Abo-Hamad, W.; Arisha, A. A hybrid system Dynamics-Discrete Event Simulation and Data Envelopment Analysis to investigate boarding patients in acute hospitals. Oper. Res. Health Care 2020, 26, 100266. [Google Scholar] [CrossRef]
- Zhang, X.; Wang, J.; Wang, T.; Jiang, R.; Xu, J.; Zhao, L. Robust Feature Learning for Adversarial Defense via Hierarchical Feature Alignment. Inf. Sci. 2020, 560, 256–270. [Google Scholar] [CrossRef]
- Zhang, X.; Wang, T.; Luo, W.; Huang, P. Multi-level Fusion and Attention-guided CNN for Image Dehazing. IEEE Trans. Circuits Syst. Video Technol. 2020, 31, 4160–4173. [Google Scholar] [CrossRef]
- Zhang, X.; Fan, M.; Wang, D.; Zhou, P.; Tao, D. Top-k Feature Selection Framework Using Robust 0-1 Integer Programming. IEEE Trans. Neural Netw. Learn. Syst. 2020, 32, 3005–3019. [Google Scholar] [CrossRef]
- Zhang, X.; Wang, D.; Zhou, Z.; Ma, Y. Robust low-rank tensor recovery with rectification and alignment. IEEE Trans. Pattern Anal. Mach. Intell. 2019, 43, 238–255. [Google Scholar] [CrossRef] [Green Version]
- Zhang, X.; Jiang, R.; Wang, T.; Wang, J. Recursive Neural Network for Video Deblurring. IEEE Trans. Circuits Syst. Video Technol. 2020, 31, 3025–3036. [Google Scholar] [CrossRef]
- Zhang, X.; Wang, T.; Wang, J.; Tang, G.; Zhao, L. Pyramid Channel-based Feature Attention Network for image dehazing. Comput. Vis. Image Underst. 2020, 197–198, 103003. [Google Scholar] [CrossRef]
- Ghadami, N.; Gheibi, M.; Kian, Z.; Faramarz, M.G.; Naghedi, R.; Eftekhari, M.; Fathollahi-Fard, A.M.; Dulebenets, M.A.; Tian, G. Implementation of solar energy in smart cities using an integration of artificial neural network, photovoltaic system and classical Delphi methods. Sustain. Cities Soc. 2021, 74, 103149. [Google Scholar] [CrossRef]
- Shahsavar, M.M.; Akrami, M.; Gheibi, M.; Kavianpour, B.; Fathollahi-Fard, A.M.; Behzadian, K. Constructing a smart framework for supplying the biogas energy in green buildings using an integration of response surface methodology, artificial intelligence and petri net modelling. Energy Convers. Manag. 2021, 248, 114794. [Google Scholar] [CrossRef]
- Sohani, A.; Naderi, S.; Torabi, F.; Sayyaadi, H.; Golizadeh Akhlaghi, Y.; Zhao, X.; Talukdar, K.; Said, Z. Application based multi-objective performance optimization of a proton exchange membrane fuel cell. J. Clean. Prod. 2020, 252, 119567. [Google Scholar] [CrossRef]
- Mirmozaffari, M.; Shadkam, E.; Khalili, S.M.; Kabirifar, K.; Yazdani, R.; Gashteroodkhani, T.A. A novel artificial intelligent approach: Comparison of machine learning tools and algorithms based on optimization DEA Malmquist productivity index for eco-efficiency evaluation. Int. J. Energy Sect. Manag. 2021, 15, 523–550. [Google Scholar] [CrossRef]
- Mirmozaffari, M.; Alinezhad, A. Ranking of Heart Hospitals Using cross-efficiency and two-stage DEA. In Proceedings of the 2017 7th International Conference on Computer and Knowledge Engineering (ICCKE), Online, 26–27 October 2017; pp. 217–222. [Google Scholar]
- Mirmozaffari, M.; Yazdani, R.; Shadkam, E.; Tavassoli, L.S.; Massah, R. VCS and CVS: New combined parametric and non-parametric operation research models. Sustain. Oper. Comput. 2021, 2, 36–56. [Google Scholar] [CrossRef]
- Mirmozaffari, M.; Alinezhad, A. Window analysis using two-stage DEA in heart hospitals. In Proceedings of the 10th International Conference on Innovations in Science, Engineering, Computers and Technology (ISECT-2017), Dubai, United Arab Emirates, 17–19 October 2017; pp. 44–51. [Google Scholar]


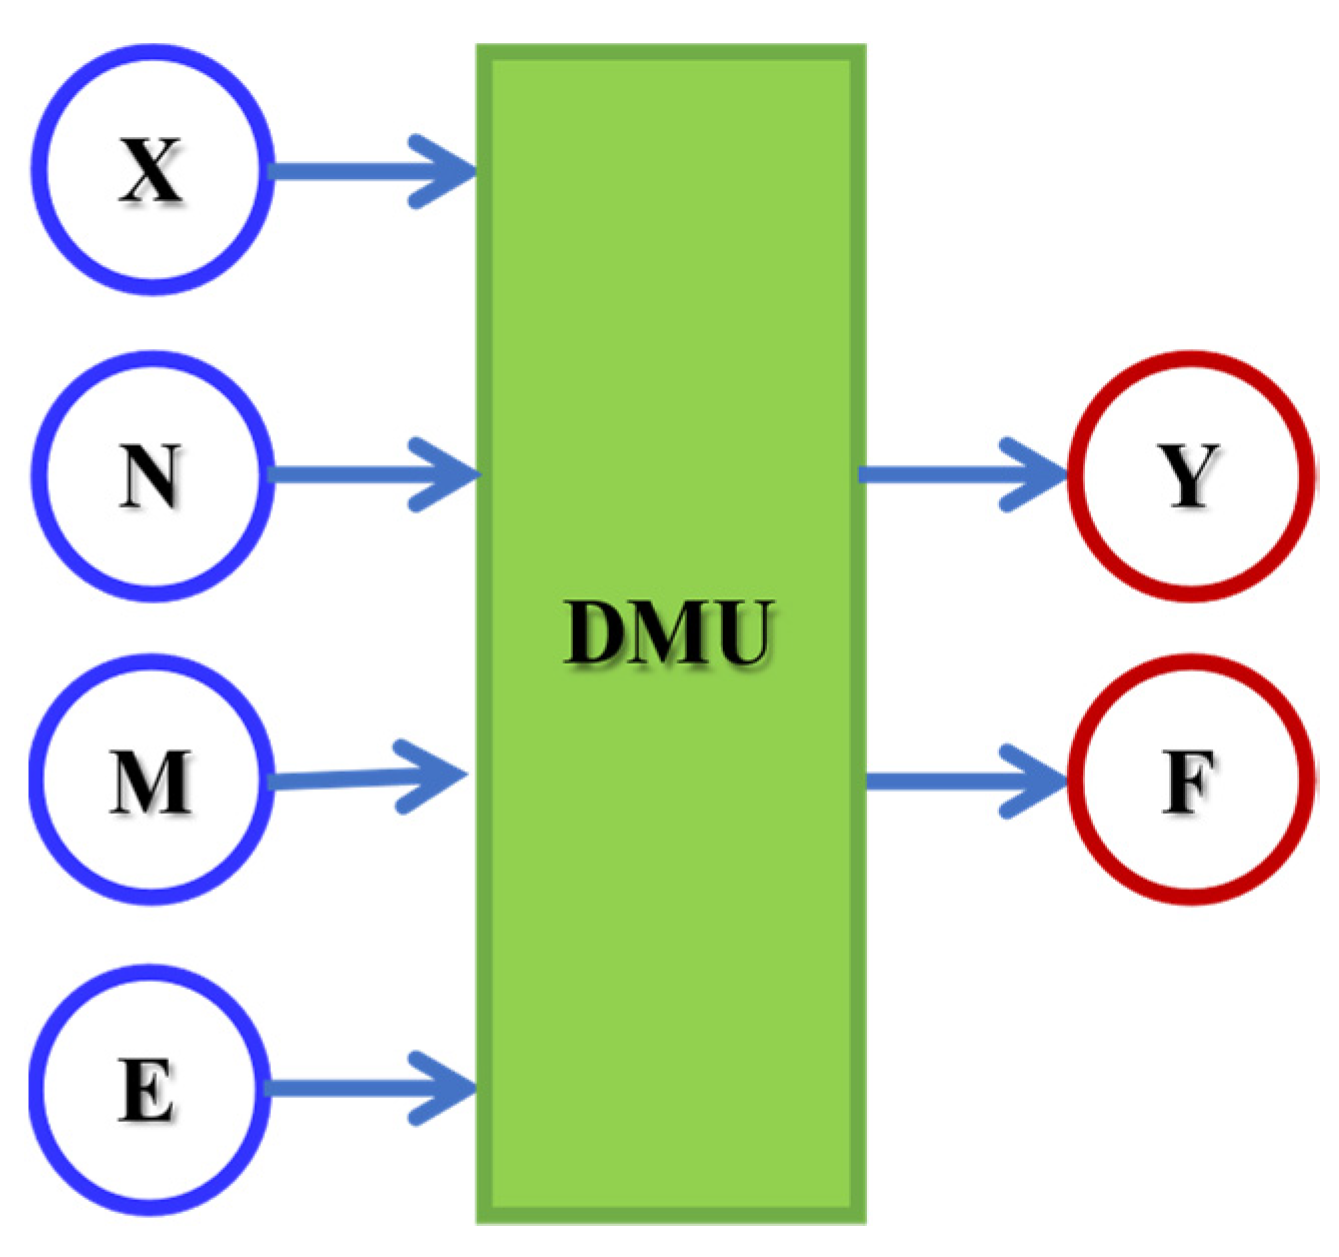
| Stat: February–July 2020 | Description | Mean | SD |
|---|---|---|---|
| X | The total number of physicians | 449 | 131 |
| N | The total number of other personnel | 1062 | 300 |
| M | The total number of beds | 574 | 168 |
| E | The total operating costs | 62,549.651 | 29,769.91 |
| Y | The total number of inpatient admissions | 7144 | 35,799 |
| F | The total number of outpatient visits | 49,574 | 175,240 |
| Dimensionless Parameter | Description |
|---|---|
| Non-negative individual value (dual variables categorise the benchmarks for inefficient parts) for the ith DMU | |
| jth completion of the input variable X (total number of physicians) for the ith DMU | |
| cth completion of the input variable N (total number of other personnel) for the ith DMU | |
| hth completion of the input variable M (total number of beds) for the ith DMU | |
| tth completion of the input variable E (total of operating costs) for the ith DMU | |
| rth completion of the output variable Y (total number of inpatient admissions) for the ith DMU | |
| zth completion of the output variable F (total number of outpatient visits) for the ith DMU | |
| Free of sign individual value for variable return to scale | |
| The weight designated to input Xji | |
| The weight designated to input Nci | |
| The weight designated to input Mhi | |
| The weight designated to input Eti | |
| The weight designated to output Yri | |
| The weight designated to output Fzi | |
| Individual value and real primal-variable demonstrating the value of efficiency | |
| Individual value and real dual-variable demonstrating the value of efficiency | |
| Free of sign dual individual value for the fixed pth DMU | |
| jth completion of the dual input variable X (total number of physicians) for the fixed pth DMU | |
| cth completion of the dual input variable N (total number of other personnel) for the fixed pth DMU | |
| hth completion of the dual input variable M (total number of beds) for the fixed pth DMU | |
| tth completion of the dual input variable E (total of operating costs) for the fixed pth DMU | |
| rth completion of the dual output variable Y (total number of inpatient admissions) for the fixed pth DMU | |
| zth completion of the dual output variable F (total number of outpatient visits) for the fixed pth DMU |
| Index | Description |
|---|---|
| n | Total number of DMUs |
| m | Total number of completions observed for the input variable X (total number of physicians) |
| k | Total number of completions observed for the input variable N (total number of other personnel) |
| d | Total number of completions observed for the input variable M (total number of beds) |
| v | Total number of completions observed for the input variable E (total of operating costs) |
| s | Total number of completions observed for the output variable Y (total number of inpatient admissions) |
| q | Total number of completions observed for the output variable F (total number of outpatient visits) |
| i | Index of the generic DMU, DMUi; i = 1, …, n |
| p | Index of the fixed pth DMU, DMUp |
| j | Index of a completion observed for the input variable X; j = 1, …, m |
| c | Index of a completion observed for the input variable N; c = 1, …, k |
| h | Index of a completion observed for the input variable M; h = 1, …, d |
| t | Index of a completion observed for the input variable E; t = 1, …, v |
| r | Index of a completion observed for the output variable Y; r = 1, …, s |
| z | Index of a completion observed for the output variable F; z = 1, …, q |
| Dimensionless Parameter | Description |
|---|---|
| hospital for the period t | |
| hospital for the period t | |
| hospital for the period t | |
| hospital for the period t | |
| hospital for the period t | |
| hospital for the period t | |
| Non-negative random variable (or technical inefficiency) for the hospital for the period t | |
| hospital for the period t | |
| hospital for the period t | |
| hospital for the period t | |
| hospital for the period t | |
| hospital for the period t | |
| Intercept or constant term | |
| First-order result of the inverse of natural exponent for the first input Xit | |
| First-order result of the inverse of natural exponent for the second input Nit | |
| First-order result of the inverse of natural exponent for the third input Mit | |
| First-order result of the inverse of natural exponent for the fourth input Eit | |
| Second-order direct result of the inverse of natural exponent for the first input Xit | |
| Second-order direct result of the inverse of natural exponent for the second input Nit | |
| Second-order direct result of the inverse of natural exponent for the third input Mit | |
| Second-order direct result of the inverse of natural exponent for the fourth input Eit | |
| Second-order cross result of the product of the inverse of natural exponents of the first and second inputs for the hospital for the period t | |
| Second-order cross result of the product of the inverse of natural exponents of the first and third inputs for the hospital for the period t | |
| Second-order cross result of the product of the inverse of natural exponents of the first and fourth inputs for the hospital for the period t | |
| Second-order cross result of the product of the inverse of natural exponents of the second and third inputs for the hospital for the period t | |
| Second-order cross result of the product of the inverse of natural exponents of the second and fourth inputs for the hospital for the period t | |
| Second-order cross result of the product of the inverse of natural exponents of the third and fourth inputs for the hospital for the period t |
| Model | Coefficients () | Coefficient Determination of Simple Linear Regression () | Coefficient Determination of ULFR () | p-Value |
|---|---|---|---|---|
| BCC-CCR | 0.4783 | 0.2283 | 0.9965 | 0.0156 |
| SFA | 0.2971 | 0.0825 | 0.9941 | 0.1943 |
| VCS | 0.5629 | 0.2991 | 0.9998 | 0.0021 |
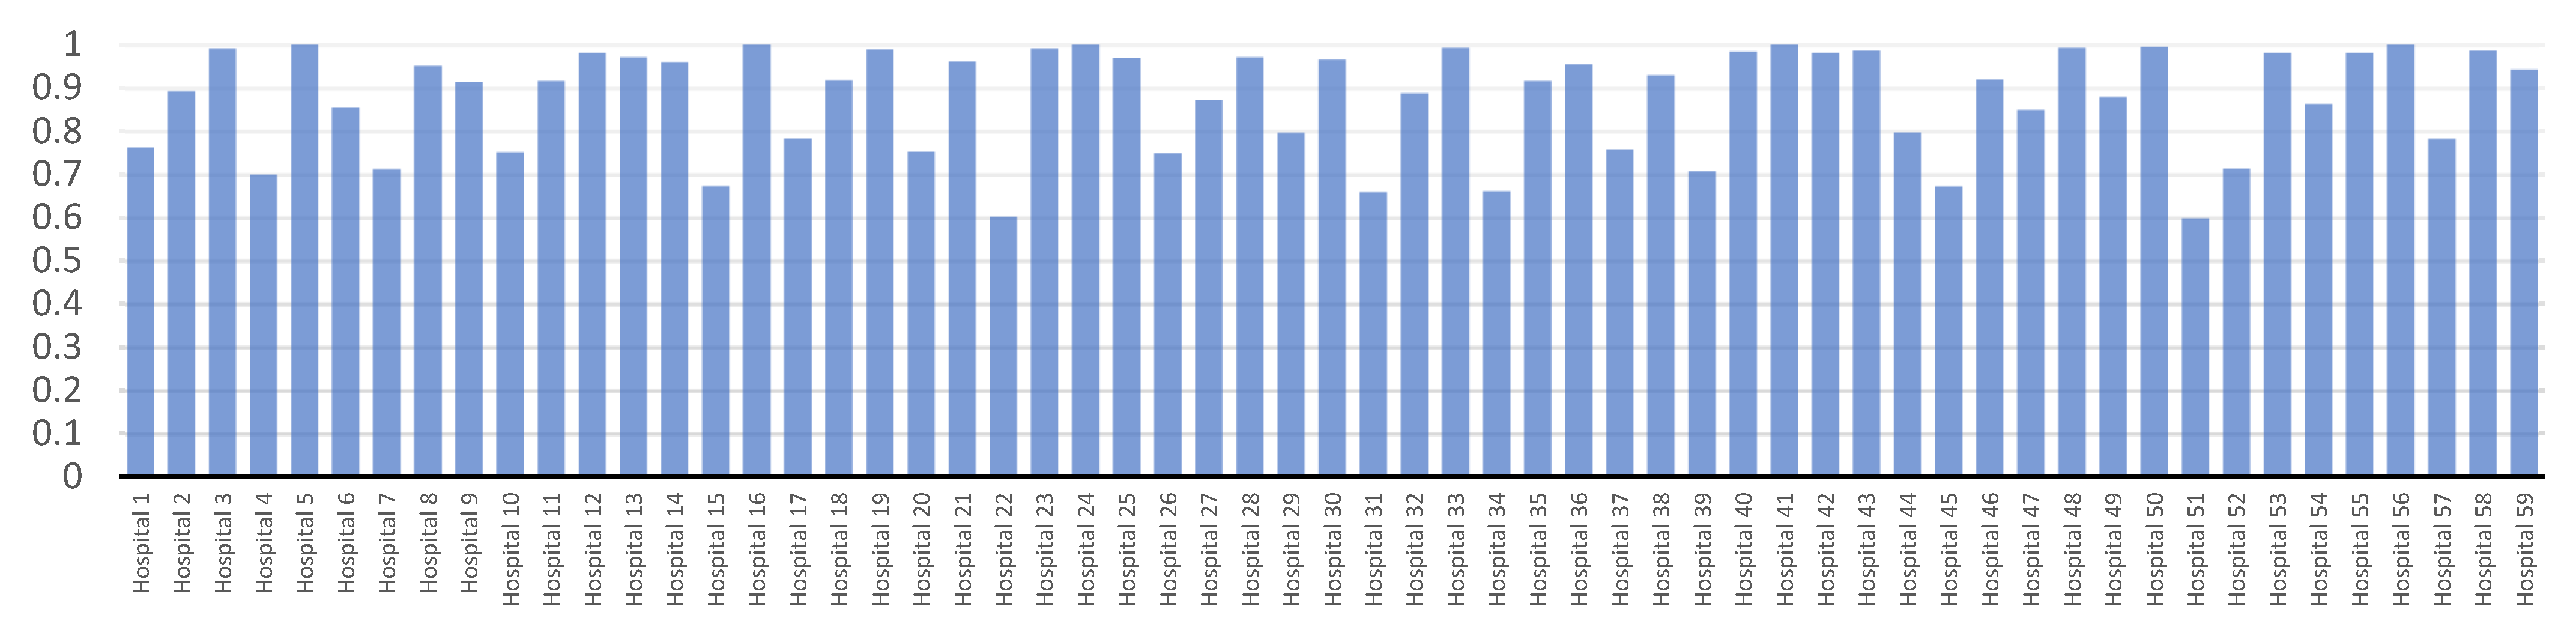
| Hospitals | Before ULFR | After ULFR | Ranking | Hospitals | Before ULFR | After ULFR | Ranking |
|---|---|---|---|---|---|---|---|
| 1 | 0.772 | 0.774 | 43 | 31 | 0.643 | 0.658 | 56 |
| 3 | 0.951 | 0.965 | 14 | 33 | 0.995 | 0.998 | 2 |
| 4 | 0.700 | 0.702 | 48 | 34 | 0.671 | 0.682 | 54 |
| 5 | 0.975 | 0.982 | 8 | 35 | 0.907 | 0.914 | 28 |
| 6 | 0.863 | 0.852 | 38 | 36 | 0.963 | 0.980 | 9 |
| 7 | 0.681 | 0.692 | 53 | 37 | 0.728 | 0.694 | 52 |
| 8 | 0.946 | 0.941 | 20 | 38 | 0.916 | 0.933 | 22 |
| 9 | 0.919 | 0.911 | 29 | 39 | 0.730 | 0.712 | 45 |
| 10 | 0.736 | 0.700 | 49 | 40 | 0.941 | 0.979 | 10 |
| 11 | 0.918 | 0.924 | 26 | 41 | 0.962 | 0.955 | 17 |
| 12 | 0.954 | 0.943 | 19 | 42 | 0.949 | 0.991 | 4 |
| 13 | 0.974 | 0.983 | 7 | 43 | 0.941 | 0.904 | 30 |
| 14 | 0.929 | 0.936 | 21 | 44 | 0.812 | 0.842 | 37 |
| 15 | 0.687 | 0.665 | 55 | 45 | 0.683 | 0.699 | 50 |
| 16 | 0.953 | 0.967 | 13 | 46 | 0.911 | 0.895 | 33 |
| 17 | 0.787 | 0.771 | 44 | 47 | 0.860 | 0.813 | 39 |
| 18 | 0.866 | 0.878 | 35 | 48 | 0.982 | 0.995 | 3 |
| 19 | 0.945 | 0.964 | 15 | 49 | 0.890 | 0.888 | 34 |
| 20 | 0.689 | 0.641 | 57 | 50 | 0.950 | 0.928 | 24 |
| 21 | 0.912 | 0.902 | 31 | 51 | 0.584 | 0.513 | 59 |
| 22 | 0.613 | 0.599 | 58 | 52 | 0.715 | 0.697 | 51 |
| 23 | 0.953 | 0.987 | 5 | 53 | 0.947 | 0.962 | 16 |
| 24 | 0.964 | 0.985 | 6 | 54 | 0.877 | 0.845 | 41 |
| 25 | 0.973 | 0.977 | 11 | 55 | 0.936 | 0.972 | 12 |
| 26 | 0.733 | 0.705 | 47 | 56 | 0.933 | 0.900 | 32 |
| 27 | 0.885 | 0.873 | 36 | 57 | 0.702 | 0.710 | 46 |
| 28 | 0.916 | 0.931 | 23 | 58 | 0.987 | 0.999 | 1 |
| 29 | 0.788 | 0.799 | 42 | 59 | 0.948 | 0.947 | 18 |
| 30 | 0.939 | 0.926 | 25 |
Publisher’s Note: MDPI stays neutral with regard to jurisdictional claims in published maps and institutional affiliations. |
© 2021 by the authors. Licensee MDPI, Basel, Switzerland. This article is an open access article distributed under the terms and conditions of the Creative Commons Attribution (CC BY) license (https://creativecommons.org/licenses/by/4.0/).
Share and Cite
Mirmozaffari, M.; Yazdani, R.; Shadkam, E.; Khalili, S.M.; Tavassoli, L.S.; Boskabadi, A. A Novel Hybrid Parametric and Non-Parametric Optimisation Model for Average Technical Efficiency Assessment in Public Hospitals during and Post-COVID-19 Pandemic. Bioengineering 2022, 9, 7. https://doi.org/10.3390/bioengineering9010007
Mirmozaffari M, Yazdani R, Shadkam E, Khalili SM, Tavassoli LS, Boskabadi A. A Novel Hybrid Parametric and Non-Parametric Optimisation Model for Average Technical Efficiency Assessment in Public Hospitals during and Post-COVID-19 Pandemic. Bioengineering. 2022; 9(1):7. https://doi.org/10.3390/bioengineering9010007
Chicago/Turabian StyleMirmozaffari, Mirpouya, Reza Yazdani, Elham Shadkam, Seyed Mohammad Khalili, Leyla Sadat Tavassoli, and Azam Boskabadi. 2022. "A Novel Hybrid Parametric and Non-Parametric Optimisation Model for Average Technical Efficiency Assessment in Public Hospitals during and Post-COVID-19 Pandemic" Bioengineering 9, no. 1: 7. https://doi.org/10.3390/bioengineering9010007