
The Power of ECG in Semi-Automated Seizure Detection in Addition to Two-Channel behind-the-Ear EEG
 , , ,
, , ,
Abstract
:
1. Introduction
2. Materials and Methods
2.1. Dataset
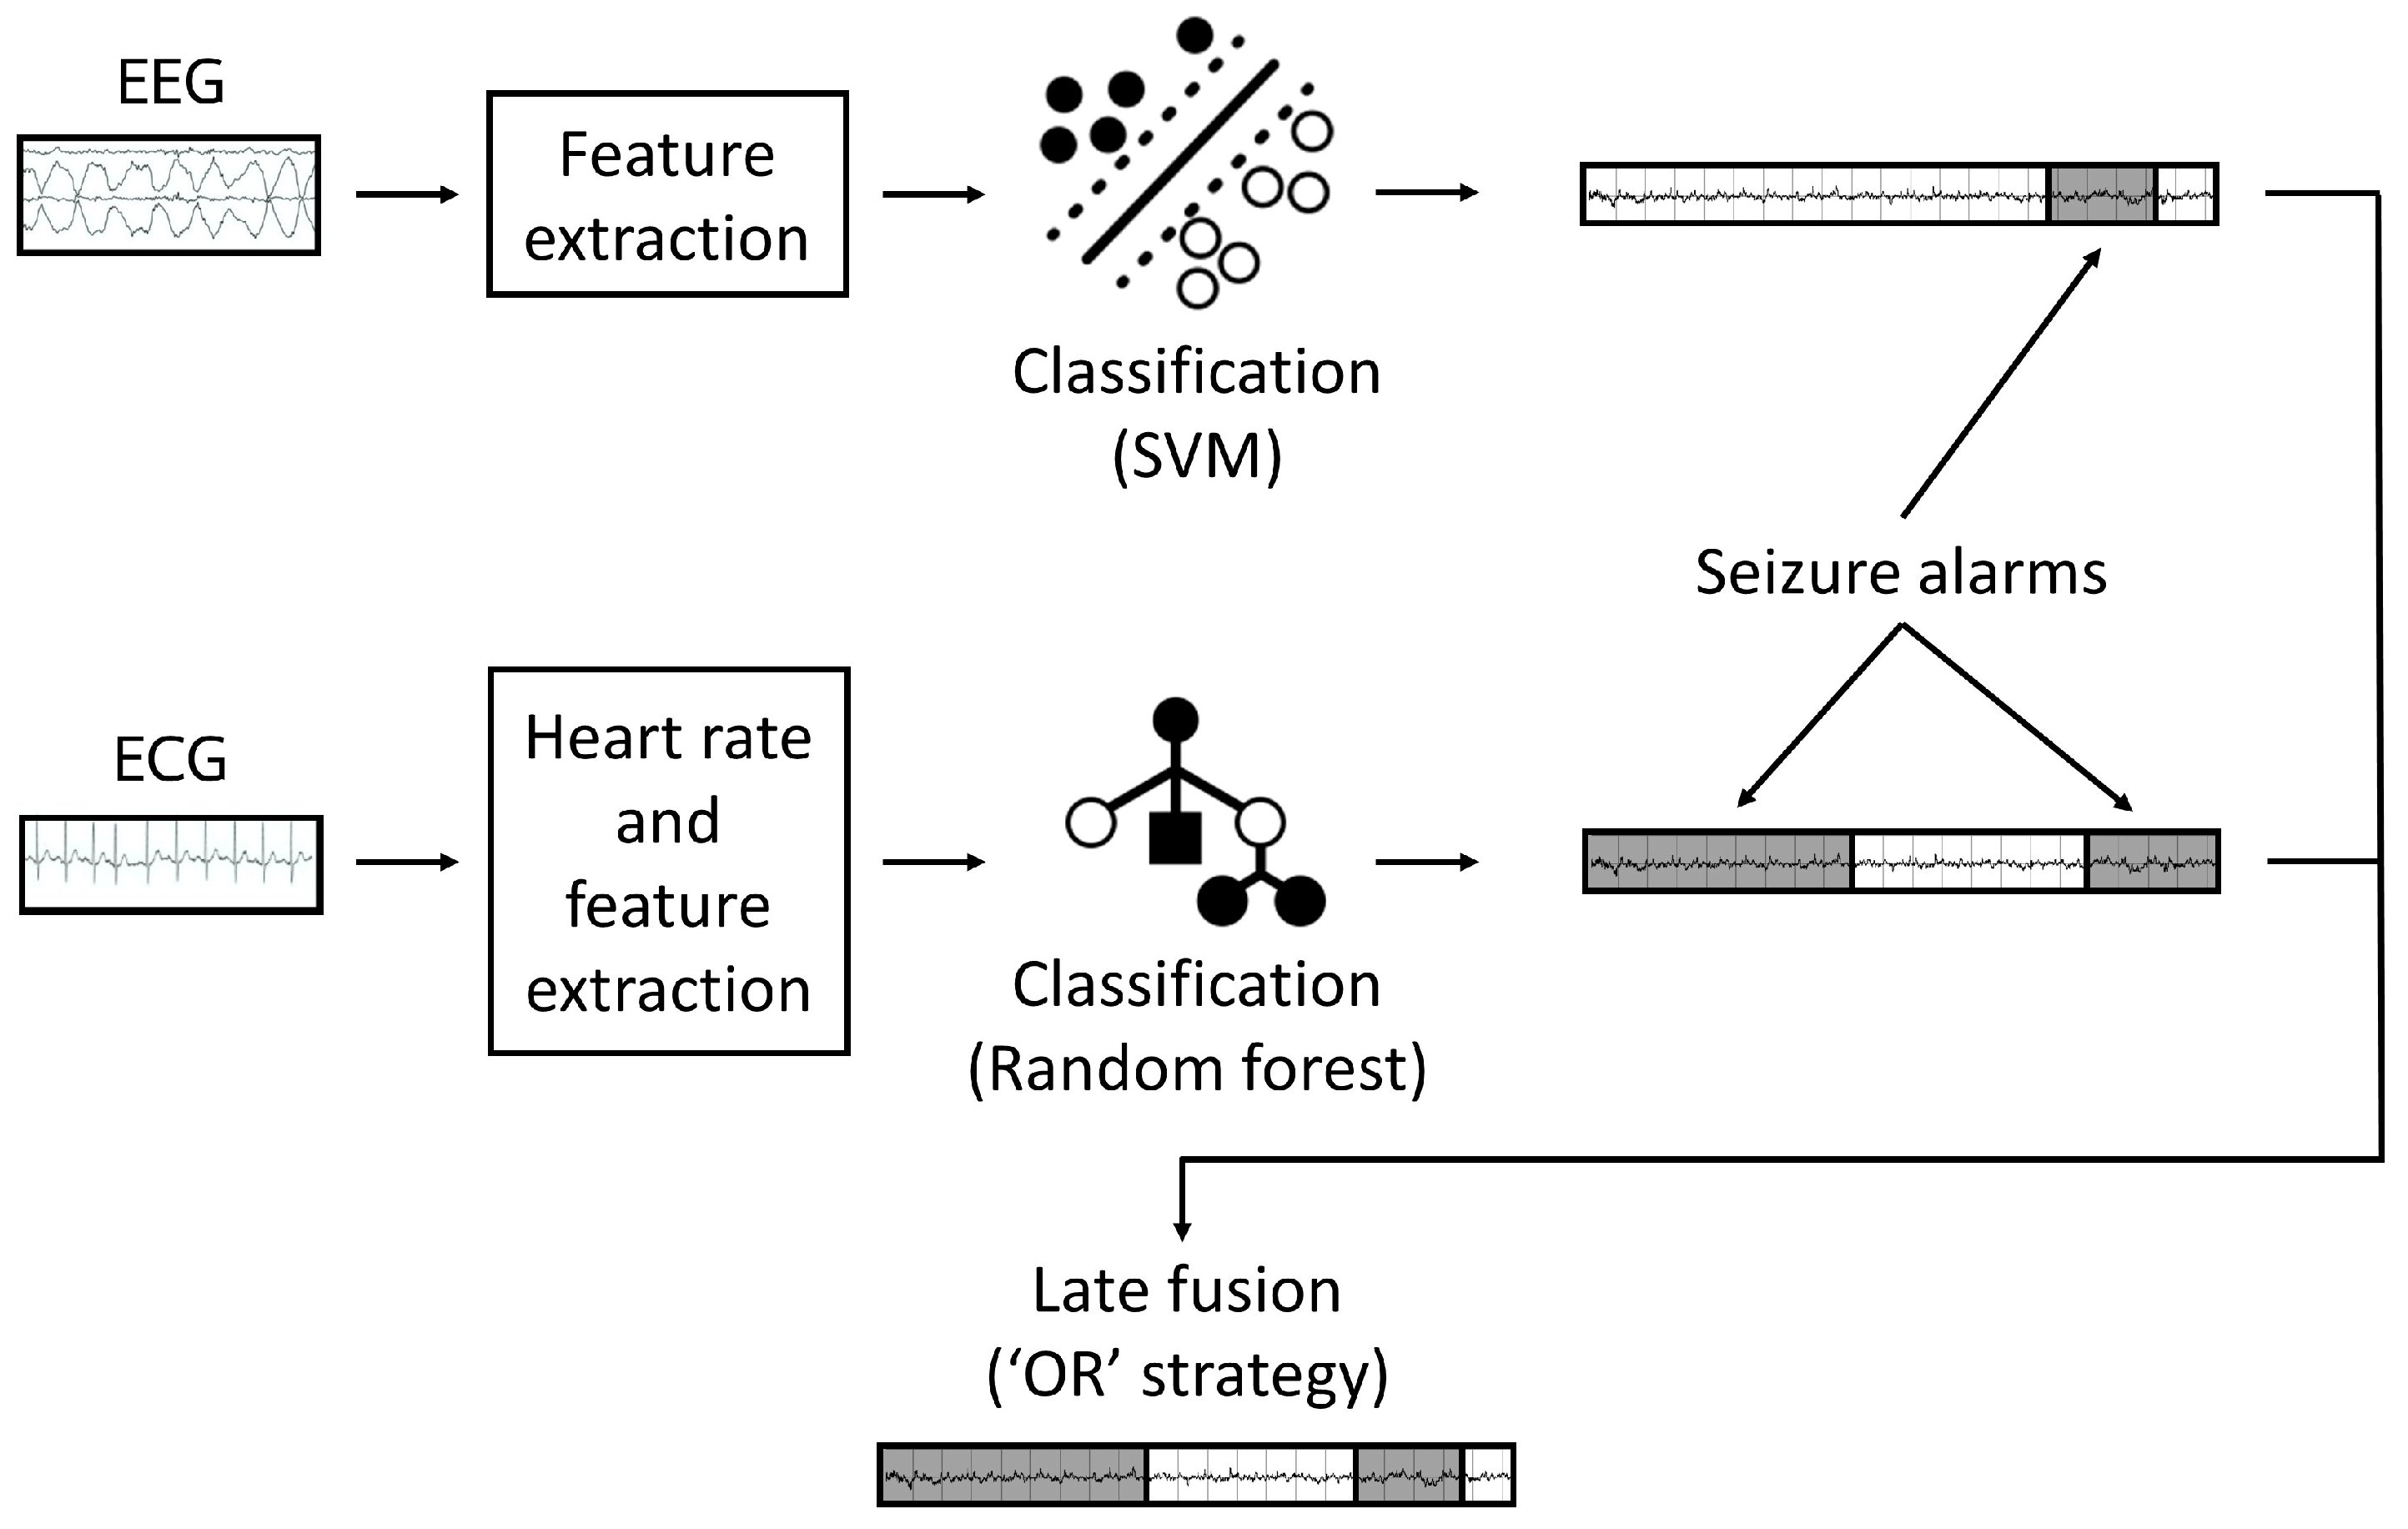
2.2. Automated Seizure Detection
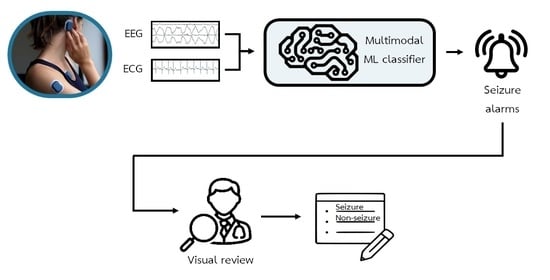
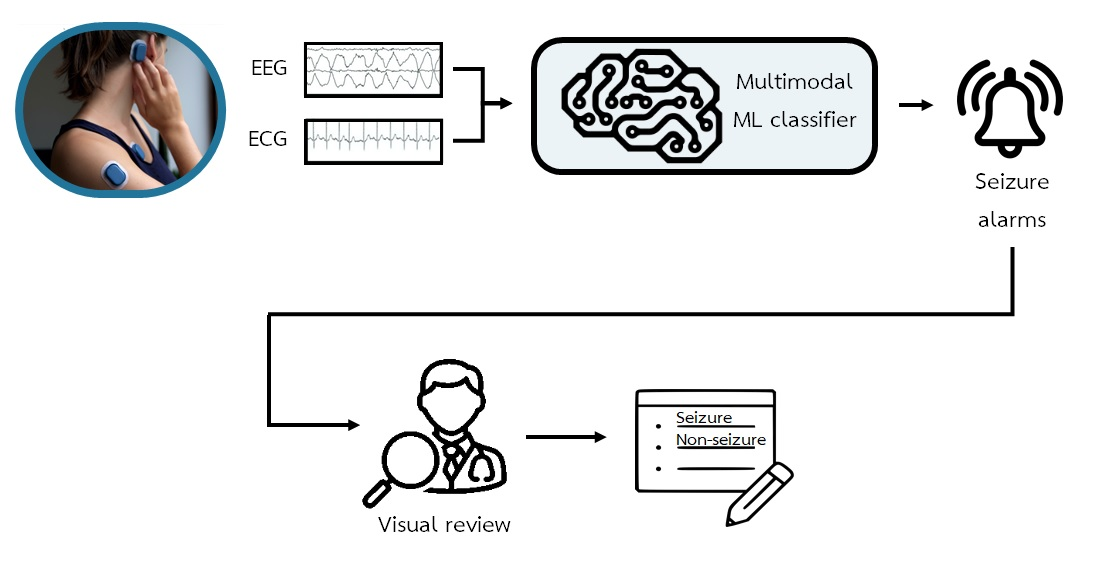
2.3. Semi-Automated Seizure Detection
2.3.1. Data Preparation
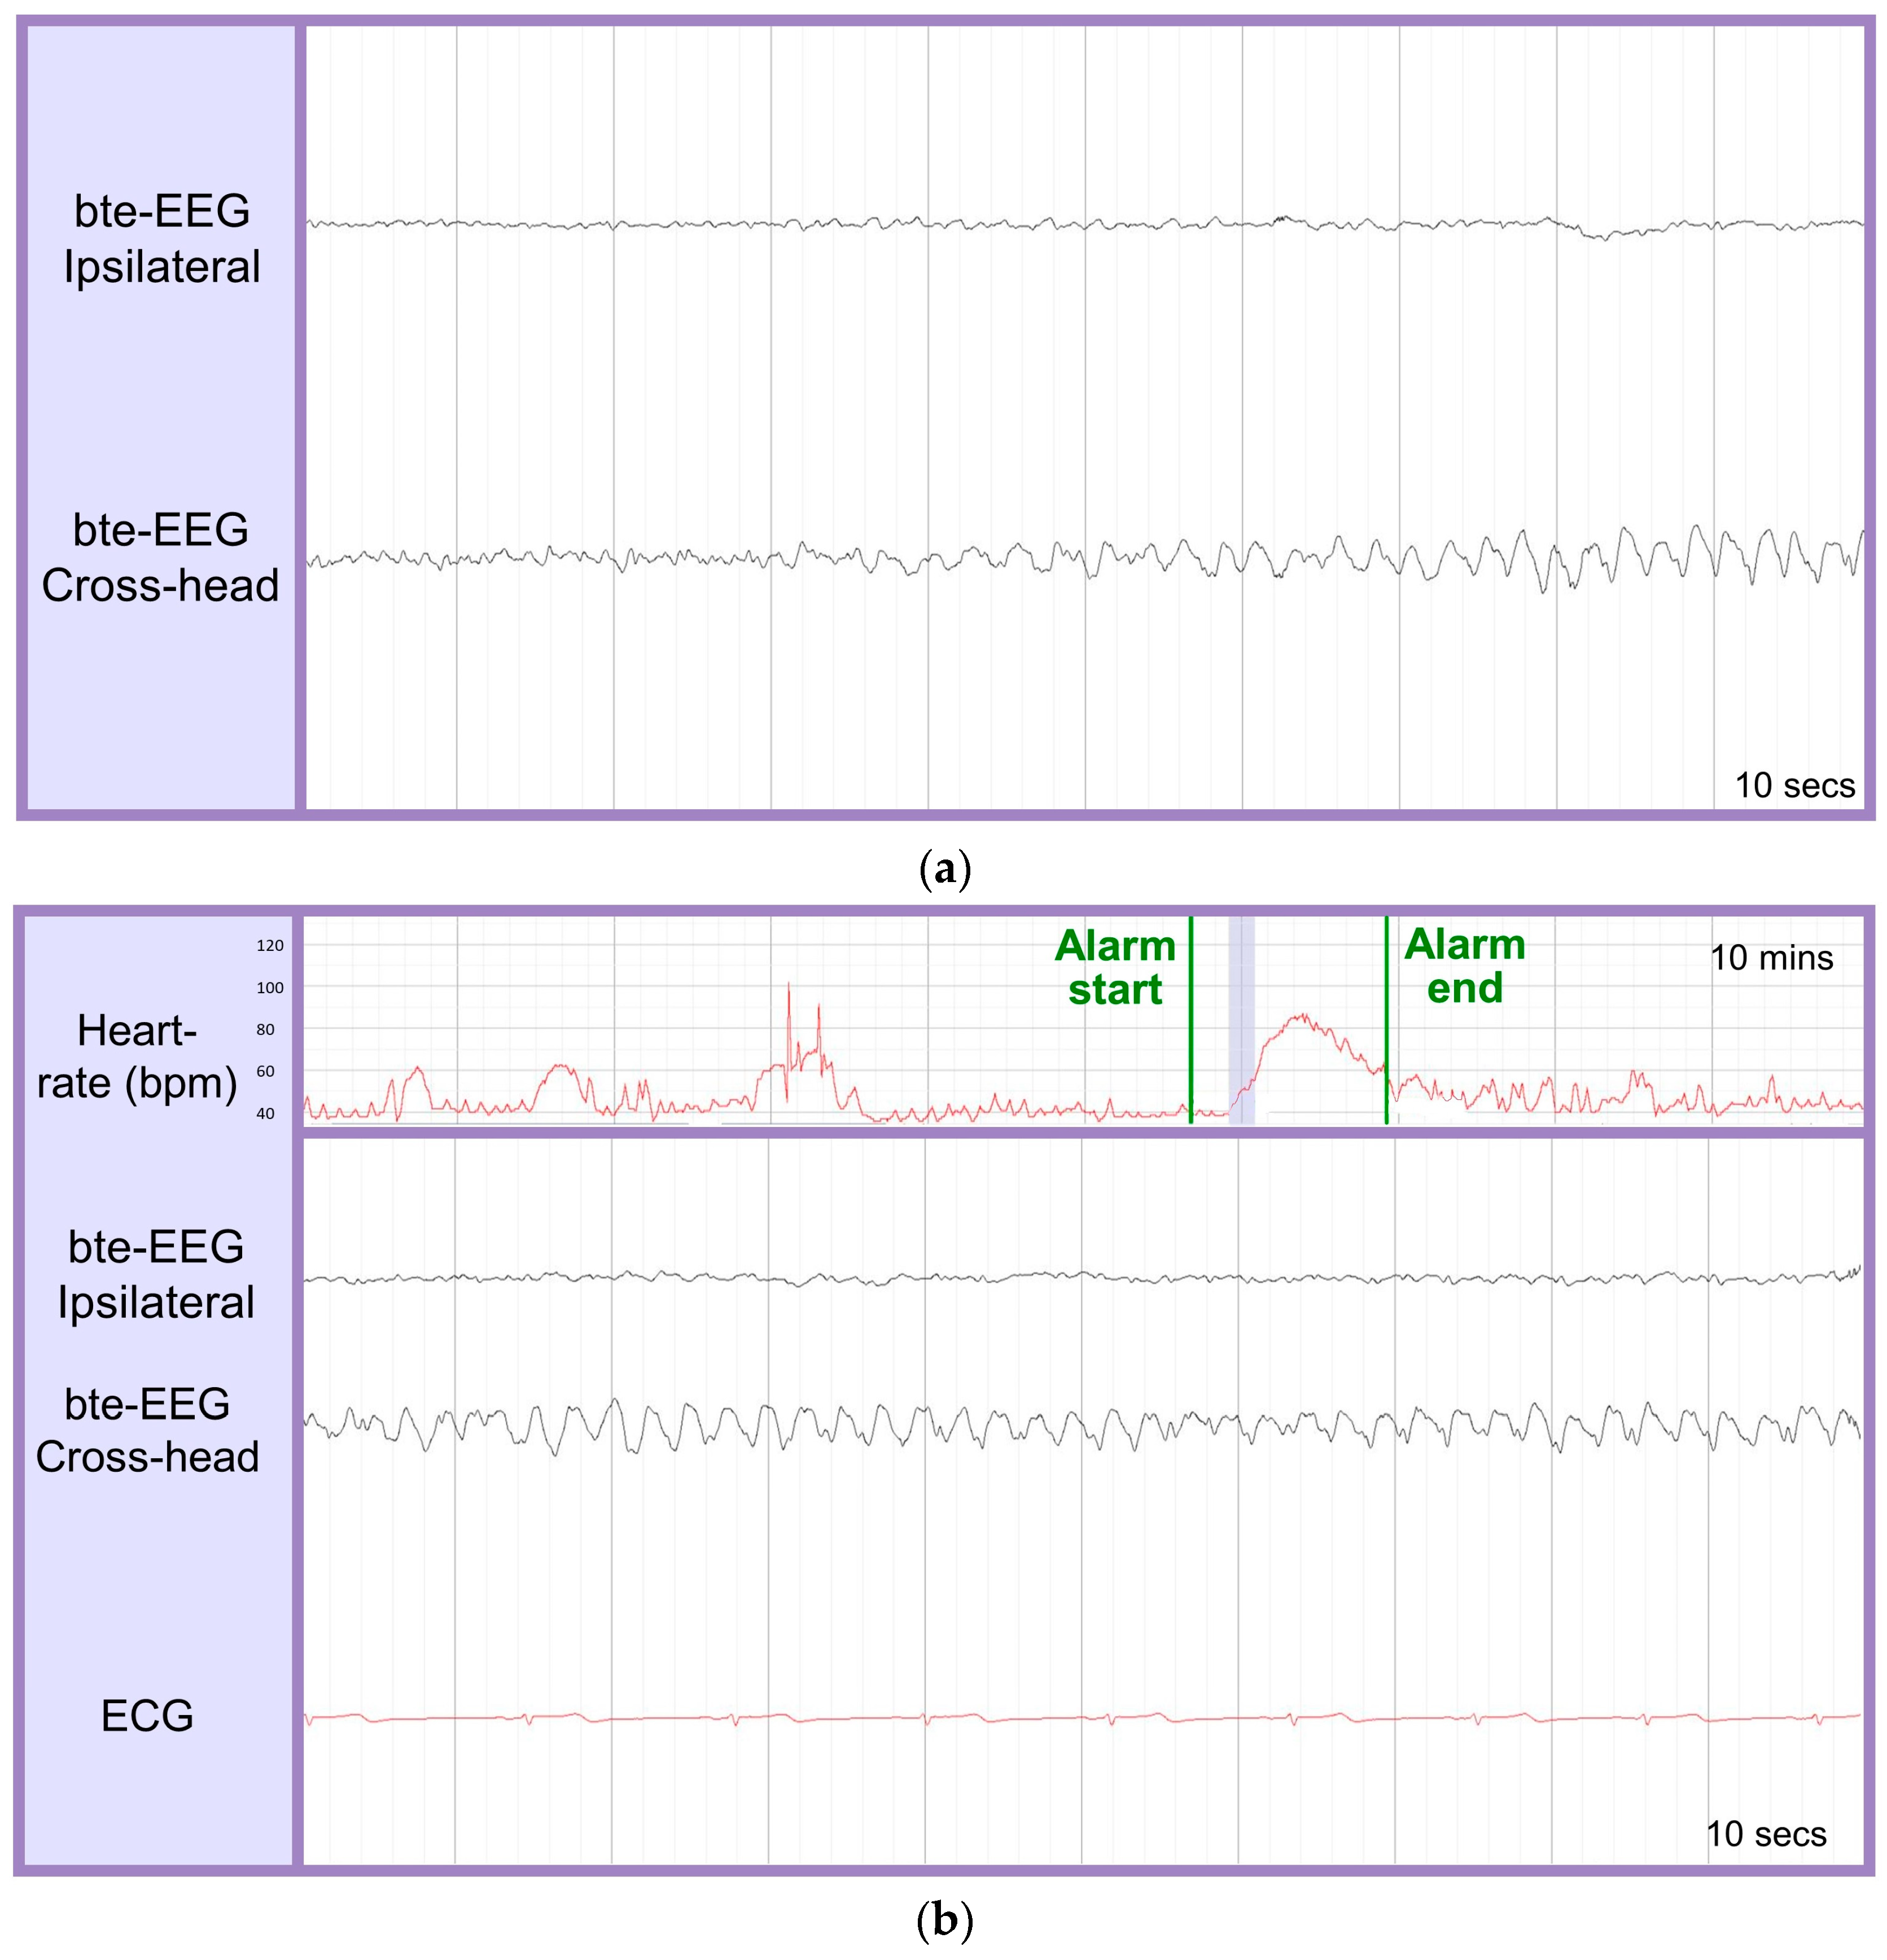
2.3.2. Visual Experiment
2.3.3. Performance Evaluation
- -
- Sensitivity: TP/(TP + FN)
- -
- False detection rate per 24 h (FD/24 h): 3600 × 24 × FP/Drecordings, where D is the duration of the recordings in seconds
- -
- Positive predictive value (PPV): TP/(TP + FP)
- -
- F1-score: 2 × (Sensitivity × PPV)/(Sensitivity + PPV)
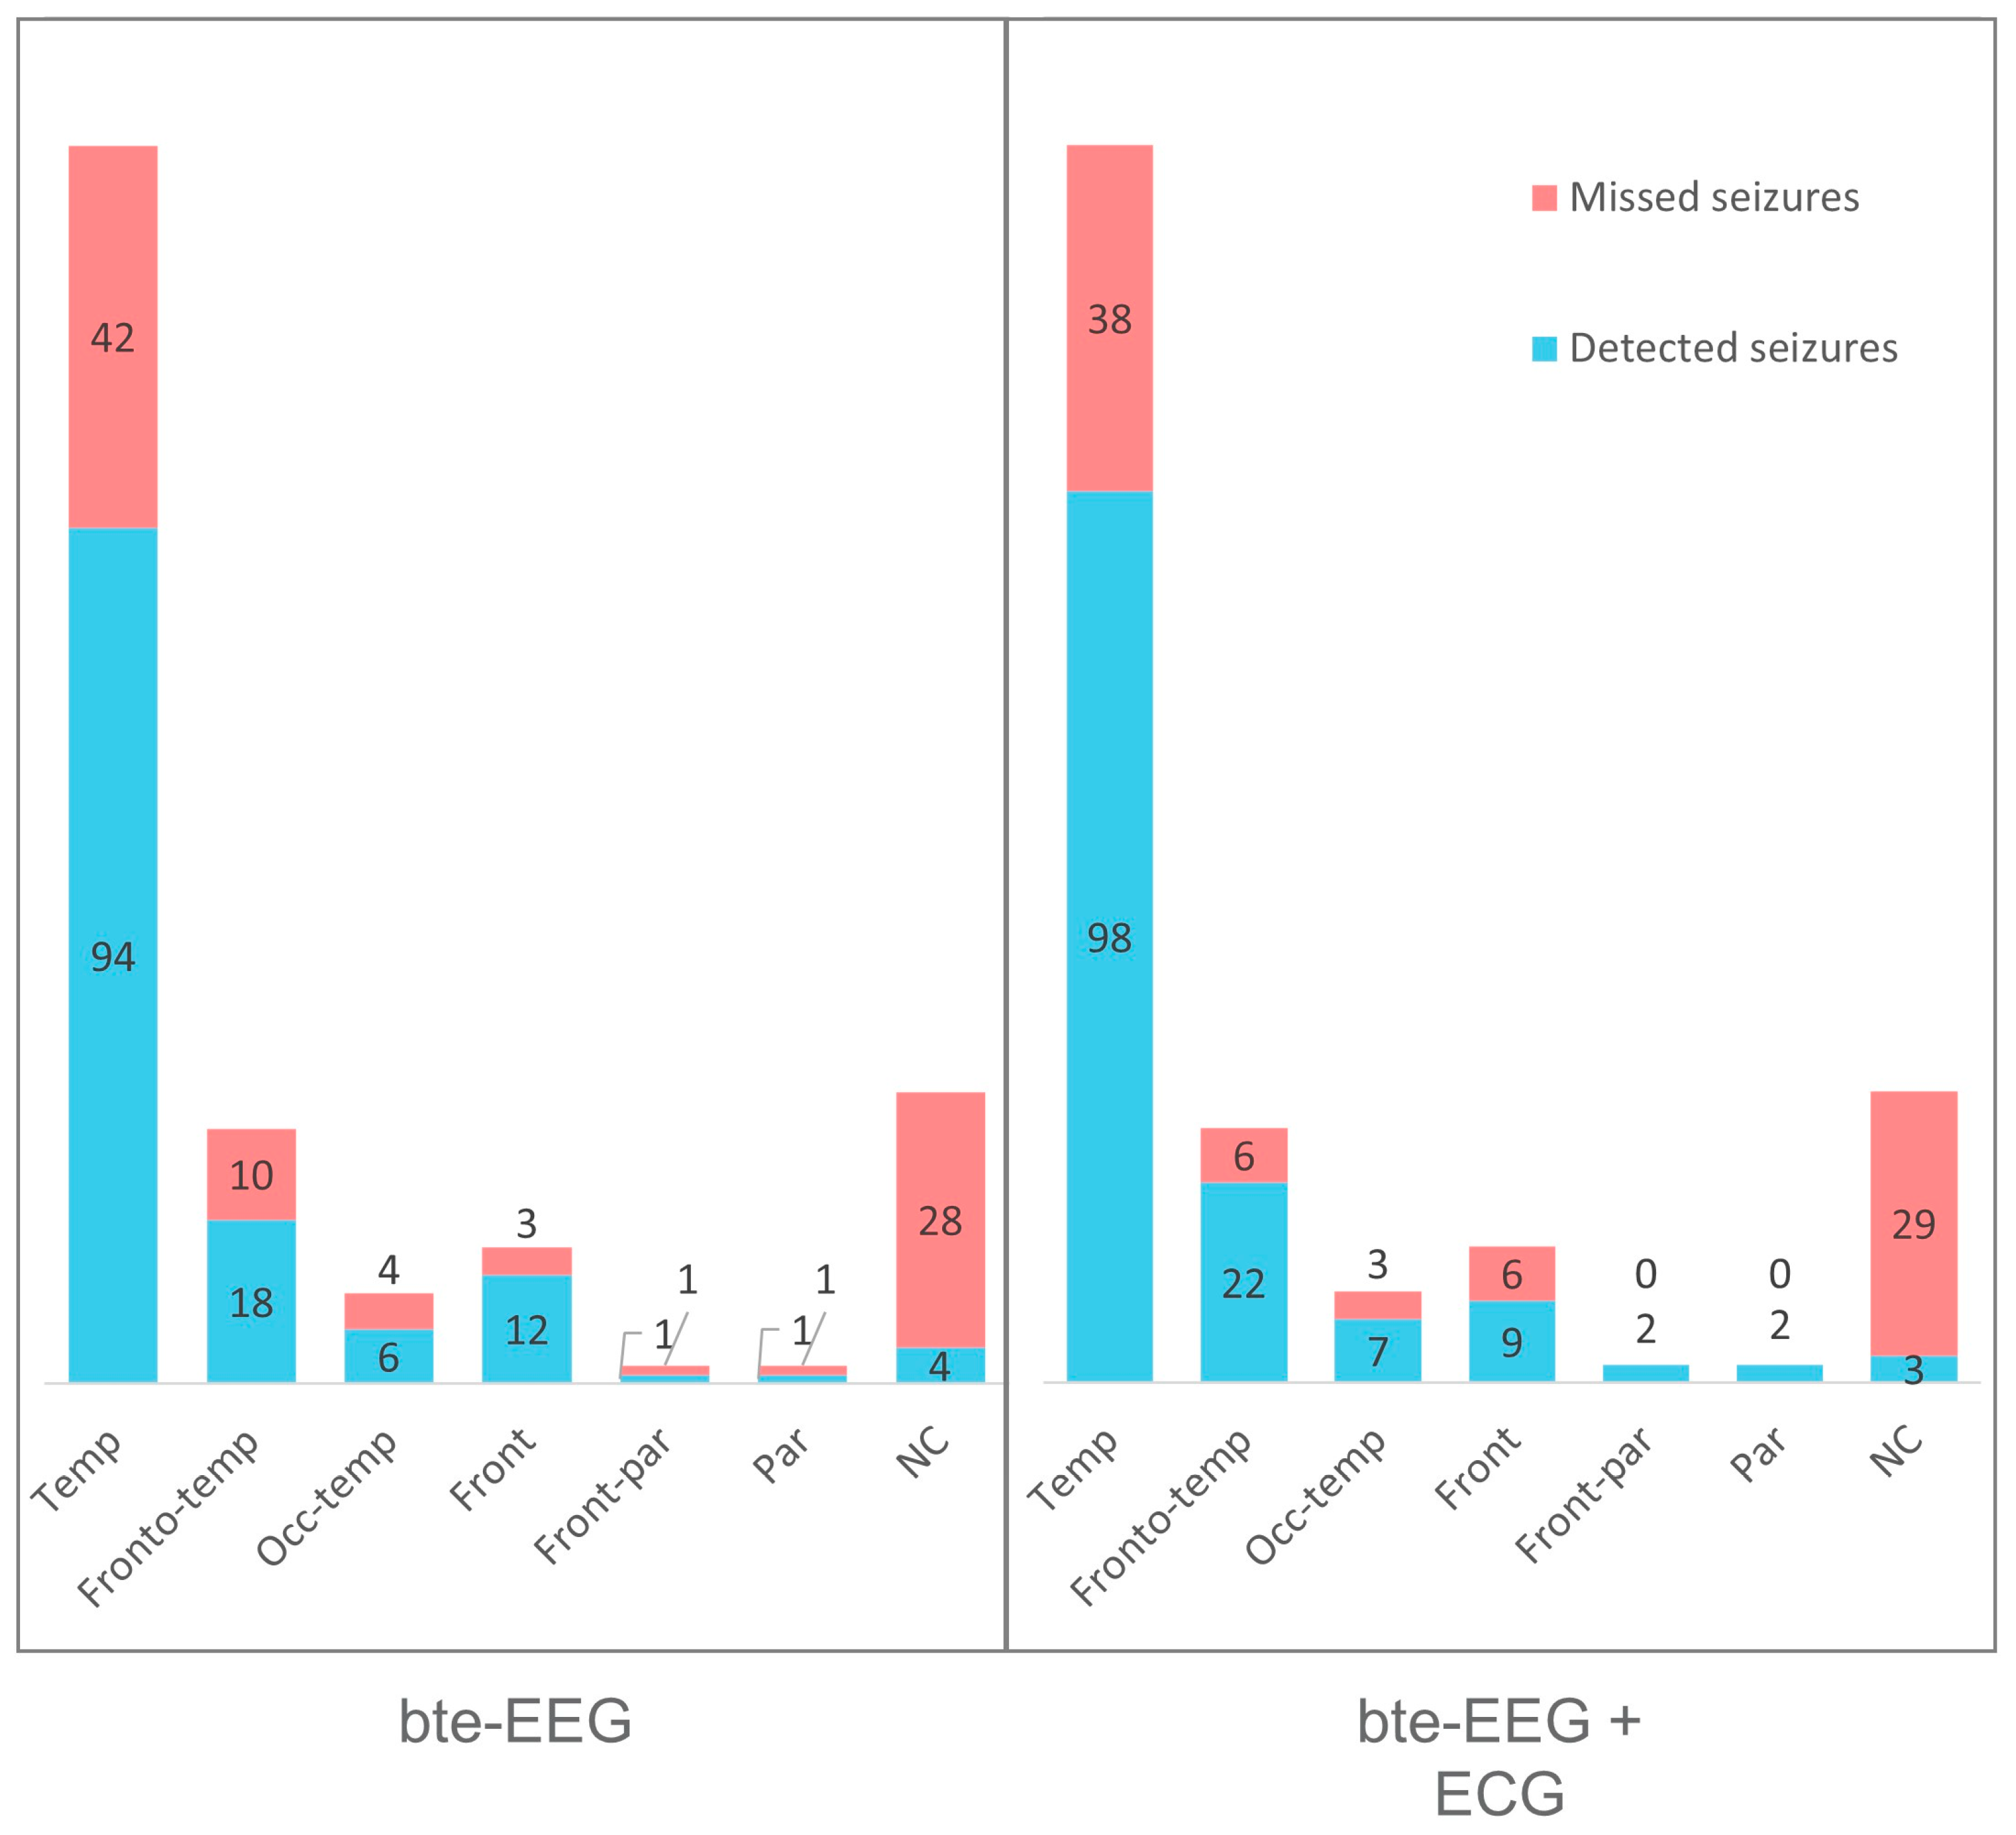
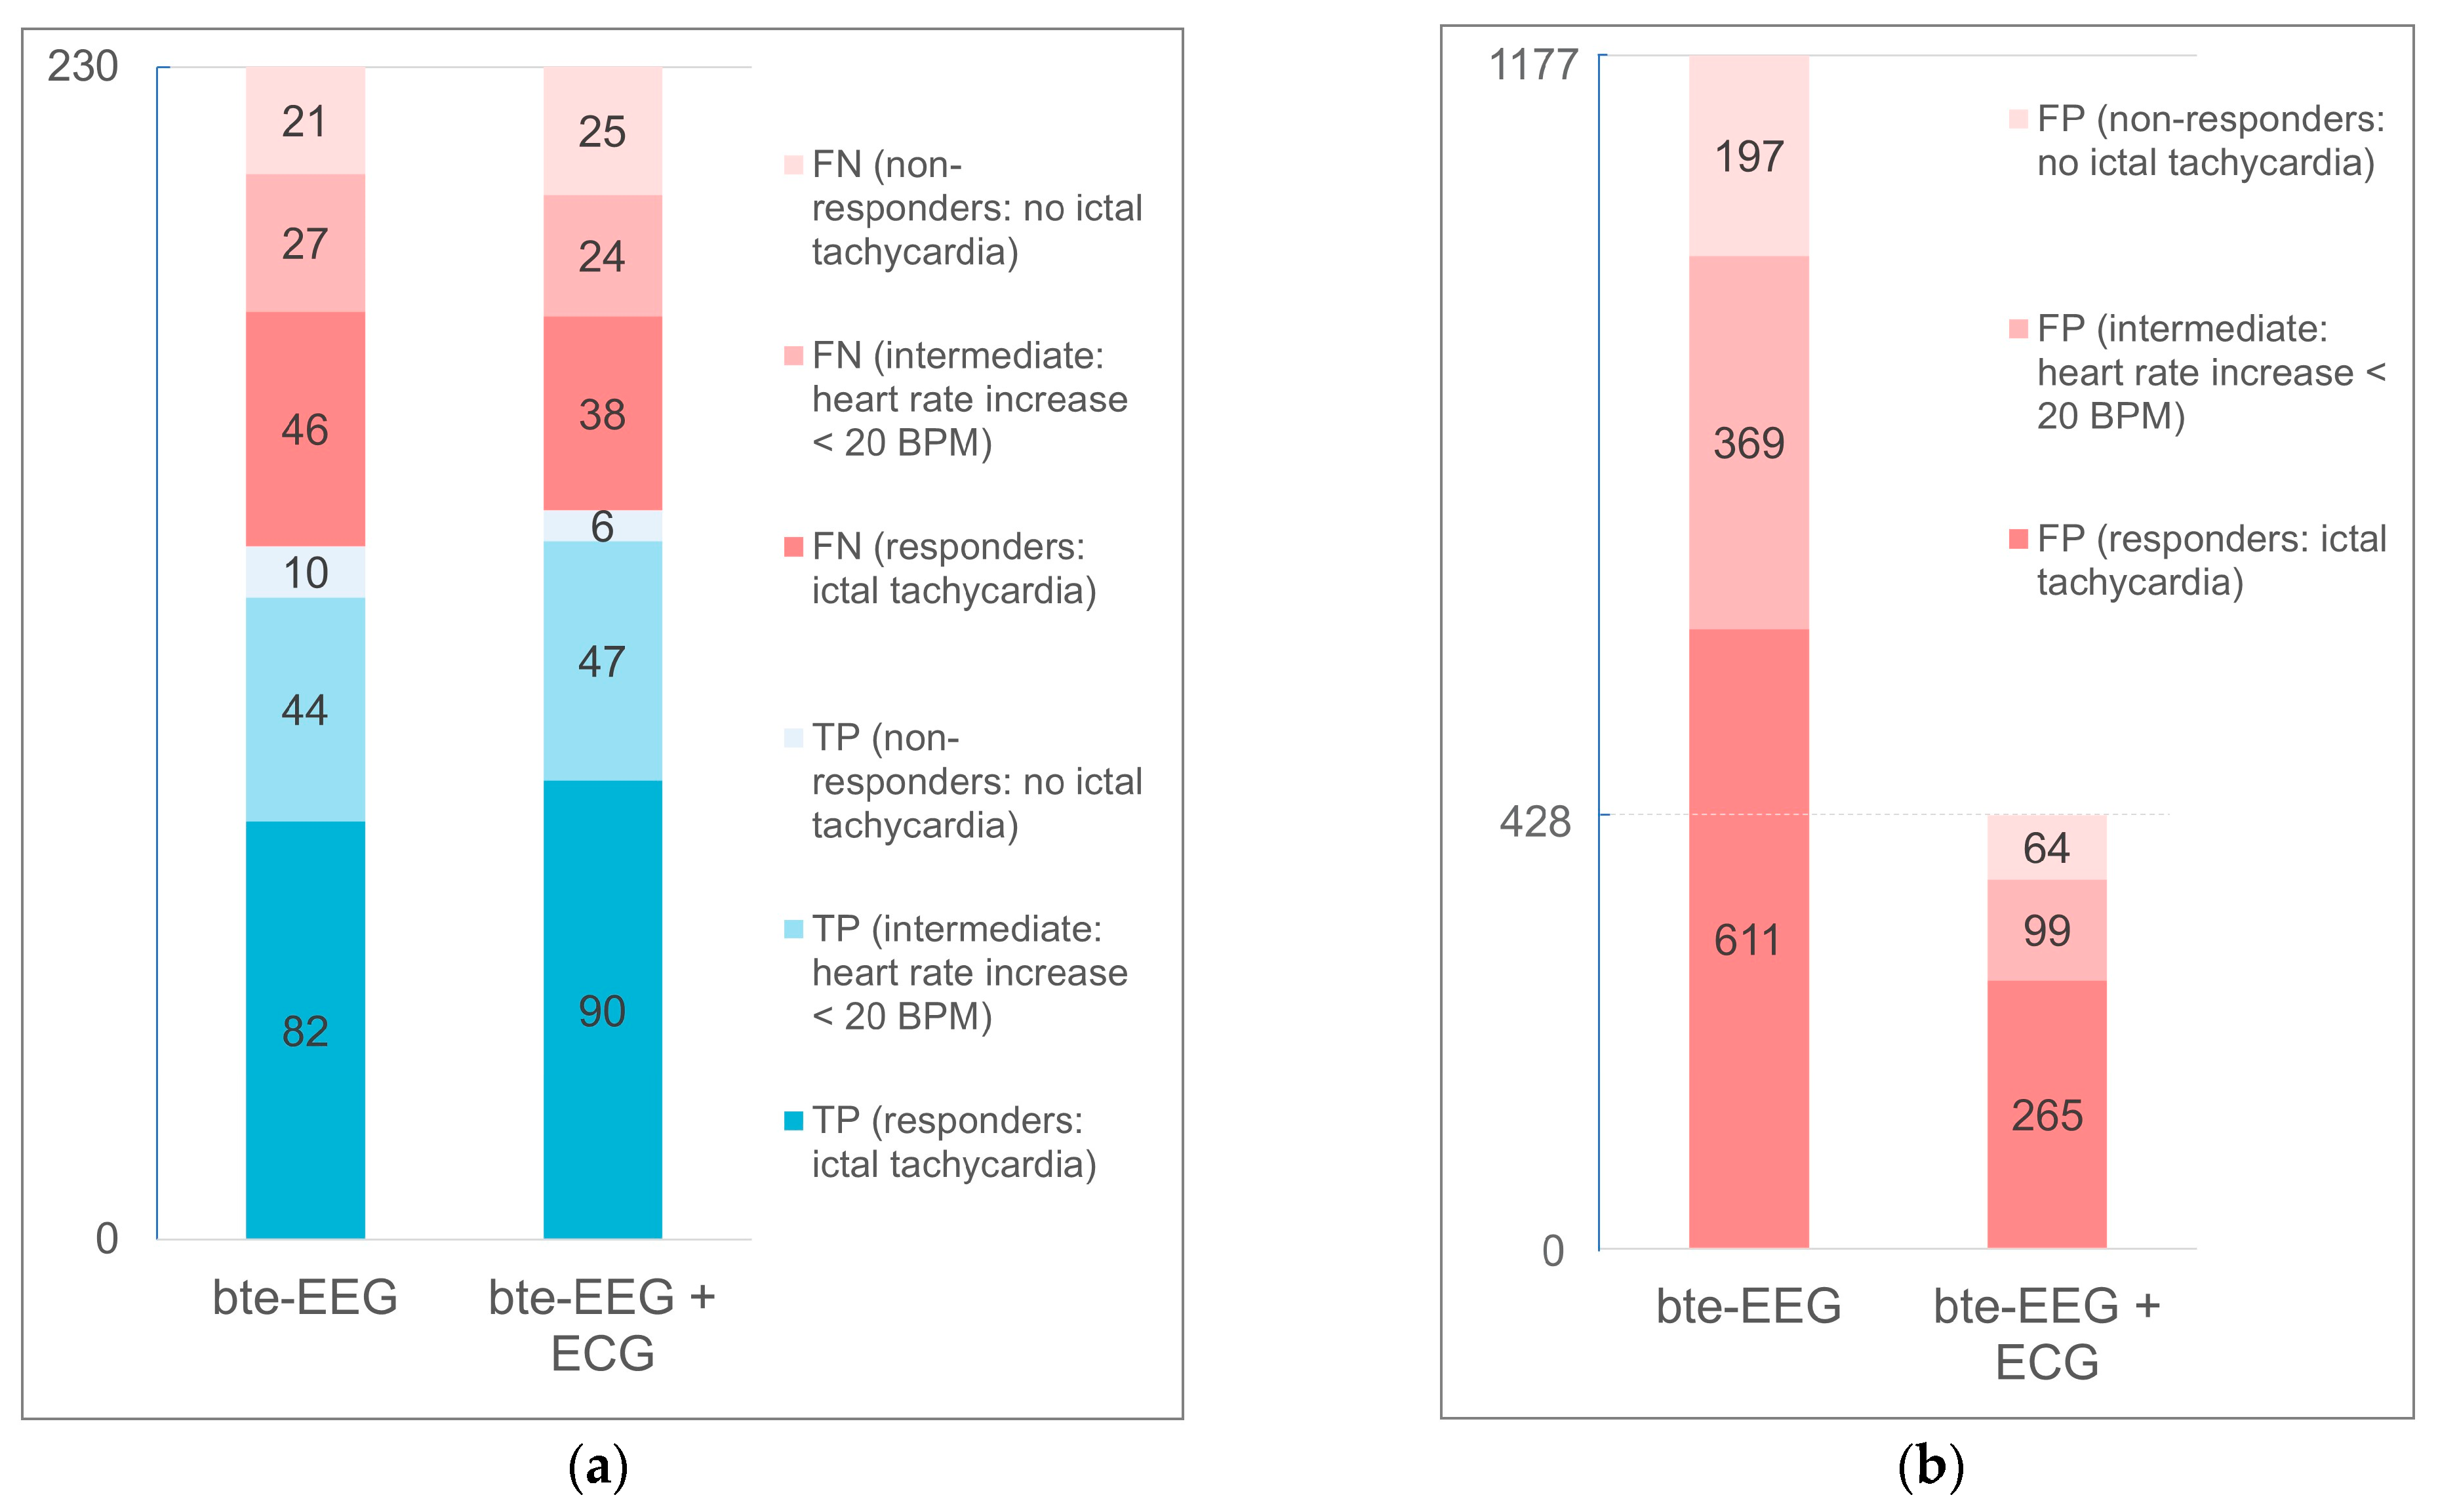
3. Results
4. Discussion
5. Conclusions
Author Contributions
Funding
Institutional Review Board Statement
Informed Consent Statement
Data Availability Statement
Conflicts of Interest
References
- World Health Organization. Epilepsy: A Public Health Imperative. Available online: https://apps.who.int/iris/bitstream/handle/10665/325293/9789241515931-eng.pdf (accessed on 25 January 2023).
- Goldenberg, M.M. Overview of Drugs Used for Epilepsy and Seizures: Etiology, Diagnosis, and Treatment. Pharm. Ther. 2010, 35, 392–415. [Google Scholar]
- Laxer, K.D.; Trinka, E.; Hirsch, L.J.; Cendes, F.; Langfitt, J.; Delanty, N.; Resnick, T.; Benbadis, S.R. The Consequences of Refractory Epilepsy and Its Treatment. Epilepsy Behav. 2014, 37, 59–70. [Google Scholar] [CrossRef]
- Sveinsson, O.; Andersson, T.; Mattsson, P.; Carlsson, S.; Tomson, T. Clinical Risk Factors in SUDEP: A Nationwide Population-Based Case-Control Study. Neurology 2020, 94, e419–e429. [Google Scholar] [CrossRef]
- Salas-Puig, X.; Iniesta, M.; Abraira, L.; Puig, J.; QUIN-GTC study group Accidental Injuries in Patients with Generalized Tonic-Clonic Seizures. A Multicenter, Observational, Cross-Sectional Study (QUIN-GTC Study). Epilepsy Behav. 2019, 92, 135–139. [Google Scholar] [CrossRef] [PubMed]
- Shih, J.J.; Fountain, N.B.; Herman, S.T.; Bagic, A.; Lado, F.; Arnold, S.; Zupanc, M.L.; Riker, E.; Labiner, D.M. Indications and Methodology for Video-electroencephalographic Studies in the Epilepsy Monitoring Unit. Epilepsia 2018, 59, 27–36. [Google Scholar] [CrossRef] [PubMed]
- Fisher, R.S.; Blum, D.E.; DiVentura, B.; Vannest, J.; Hixson, J.D.; Moss, R.; Herman, S.T.; Fureman, B.E.; French, J.A. Seizure Diaries for Clinical Research and Practice: Limitations and Future Prospects. Epilepsy Behav. 2012, 24, 304–310. [Google Scholar] [CrossRef]
- Hoppe, C.; Poepel, A.; Elger, C.E. Epilepsy: Accuracy of Patient Seizure Counts. Arch. Neurol. 2007, 64, 1595–1599. [Google Scholar] [CrossRef]
- Hubbard, I.; Beniczky, S.; Ryvlin, P. The Challenging Path to Developing a Mobile Health Device for Epilepsy: The Current Landscape and Where We Go from Here. Front. Neurol. 2021, 12, 740743. [Google Scholar] [CrossRef]
- Siddiqui, M.K.; Morales-Menendez, R.; Huang, X.; Hussain, N. A Review of Epileptic Seizure Detection Using Machine Learning Classifiers. Brain Inform. 2020, 7, 5. [Google Scholar] [CrossRef]
- Boonyakitanont, P.; Lek-uthai, A.; Chomtho, K.; Songsiri, J. A Review of Feature Extraction and Performance Evaluation in Epileptic Seizure Detection Using EEG. Biomed. Signal Process. Control 2020, 57, 101702. [Google Scholar] [CrossRef]
- Aayesha; Qureshi, M.B.; Afzaal, M.; Qureshi, M.S.; Fayaz, M. Machine Learning-Based EEG Signals Classification Model for Epileptic Seizure Detection. Multimed. Tools Appl. 2021, 80, 17849–17877. [Google Scholar] [CrossRef]
- Zarei, A.; Asl, B.M. Automatic Seizure Detection Using Orthogonal Matching Pursuit, Discrete Wavelet Transform, and Entropy Based Features of EEG Signals. Comput. Biol. Med. 2021, 131, 104250. [Google Scholar] [CrossRef] [PubMed]
- Fraiwan, M.A.; Alafeef, M. Multiclass Epilepsy Classification Using Wavelet Decomposition, Direct Quadrature, and Shannon Entropy. J. Eng. Sci. Technol. 2022, 17, 781–797. [Google Scholar]
- Roy, Y.; Banville, H.; Albuquerque, I.; Gramfort, A.; Falk, T.H.; Faubert, J. Deep Learning-Based Electroencephalography Analysis: A Systematic Review. J. Neural Eng. 2019, 16, 051001. [Google Scholar] [CrossRef] [PubMed]
- Zhou, M.; Tian, C.; Cao, R.; Wang, B.; Niu, Y.; Hu, T.; Guo, H.; Xiang, J. Epileptic Seizure Detection Based on EEG Signals and CNN. Front. Neuroinform. 2018, 12, 95. [Google Scholar] [CrossRef] [PubMed]
- Ullah, I.; Hussain, M.; Qazi, E.-U.-H.; Aboalsamh, H. An Automated System for Epilepsy Detection Using EEG Brain Signals Based on Deep Learning Approach. Expert Syst. Appl. 2018, 107, 61–71. [Google Scholar] [CrossRef]
- Yuan, Y.; Xun, G.; Jia, K.; Zhang, A. A Multi-View Deep Learning Method for Epileptic Seizure Detection Using Short-Time Fourier Transform. In Proceedings of the 8th ACM International Conference on Bioinformatics, Computational Biology, and Health Informatics, Boston, MA, USA, 20 August 2017; ACM: New York, NY, USA, 2017. [Google Scholar]
- Yuvaraj, R.; Thomas, J.; Kluge, T.; Dauwels, J. A Deep Learning Scheme for Automatic Seizure Detection from Long-Term Scalp EEG. In Proceedings of the 2018 52nd Asilomar Conference on Signals, Systems, and Computers, Pacific Grove, CA, USA, 28–31 October 2018. [Google Scholar]
- Vandecasteele, K.; De Cooman, T.; Dan, J.; Cleeren, E.; Van Huffel, S.; Hunyadi, B.; Van Paesschen, W. Visual Seizure Annotation and Automated Seizure Detection Using Behind-the-ear Electroencephalographic Channels. Epilepsia 2020, 61, 766–775. [Google Scholar] [CrossRef]
- Vandecasteele, K.; De Cooman, T.; Chatzichristos, C.; Cleeren, E.; Swinnen, L.; Ortiz, J.M.; Van Huffel, S.; Dümpelmann, M.; Schulze-Bonhage, A.; De Vos, M.; et al. The Power of ECG in Multimodal Patient-specific Seizure Monitoring: Added Value to an EEG-based Detector Using Limited Channels. Epilepsia 2021, 62, 2333–2343. [Google Scholar] [CrossRef]
- Sevcencu, C.; Struijk, J.J. Autonomic Alterations and Cardiac Changes in Epilepsy. Epilepsia 2010, 51, 725–737. [Google Scholar] [CrossRef]
- Zijlmans, M.; Flanagan, D.; Gotman, J. Heart Rate Changes and ECG Abnormalities during Epileptic Seizures: Prevalence and Definition of an Objective Clinical Sign. Epilepsia 2002, 43, 847–854. [Google Scholar] [CrossRef]
- Cooman, T.D.; De Cooman, T.; Varon, C.; Hunyadi, B.; Van Paesschen, W.; Lagae, L.; Van Huffel, S. Online Automated Seizure Detection in Temporal Lobe Epilepsy Patients Using Single-Lead ECG. Int. J. Neural Syst. 2017, 27, 1750022. [Google Scholar] [CrossRef] [PubMed]
- Swinnen, L.; Chatzichristos, C.; Jansen, K.; Lagae, L.; Depondt, C.; Seynaeve, L.; Vancaester, E.; Van Dycke, A.; Macea, J.; Vandecasteele, K.; et al. Accurate Detection of Typical Absence Seizures in Adults and Children Using a Two-channel Electroencephalographic Wearable behind the Ears. Epilepsia 2021, 62, 2741–2752. [Google Scholar] [CrossRef]
- Beniczky, S.; Ryvlin, P. Standards for Testing and Clinical Validation of Seizure Detection Devices. Epilepsia 2018, 59 (Suppl. S1), 9–13. [Google Scholar] [CrossRef] [PubMed]
- Vandecasteele, K.; De Cooman, T.; Gu, Y.; Cleeren, E.; Claes, K.; Van Paesschen, W.; Van Huffel, S.; Hunyadi, B. Automated Epileptic Seizure Detection Based on Wearable ECG and PPG in a Hospital Environment. Sensors 2017, 17, 2338. [Google Scholar] [CrossRef]
- Li, C.; Zheng, C.; Tai, C. Detection of ECG Characteristic Points Using Wavelet Transforms. IEEE Trans. Biomed. Eng. 1995, 42, 21–28. [Google Scholar] [PubMed]
- Varon, C.; Caicedo, A.; Testelmans, D.; Buyse, B.; Van Huffel, S. A Novel Algorithm for the Automatic Detection of Sleep Apnea From Single-Lead ECG. IEEE Trans. Biomed. Eng. 2015, 62, 2269–2278. [Google Scholar] [CrossRef]
- Varon, C.; Jansen, K.; Lagae, L.; Van Huffel, S. Can ECG Monitoring Identify Seizures? J. Electrocardiol. 2015, 48, 1069–1074. [Google Scholar] [CrossRef]
- Byteflies. Available online: https://byteflies.com/ (accessed on 25 May 2022).
- Vertes, G. SeizeIT2. Available online: https://eithealth.eu/project/seizeit2/ (accessed on 25 May 2022).
- Cohen, J. Weighted Kappa: Nominal Scale Agreement with Provision for Scaled Disagreement or Partial Credit. Psychol. Bull. 1968, 70, 213–220. [Google Scholar] [CrossRef]
- Téllez-Zenteno, J.F.; Hernández-Ronquillo, L. A Review of the Epidemiology of Temporal Lobe Epilepsy. Epilepsy Res. Treat. 2012, 2012, 630853. [Google Scholar] [CrossRef]
- Rubin, M.N.; Jeffery, O.J.; Fugate, J.E.; Britton, J.W.; Cascino, G.D.; Worrell, G.A.; Hocker, S.E.; Wijdicks, E.F.; Rabinstein, A.A. Efficacy of a Reduced Electroencephalography Electrode Array for Detection of Seizures. Neurohospitalist 2014, 4, 6–8. [Google Scholar] [CrossRef]
- Tacke, M.; Janson, K.; Vill, K.; Heinen, F.; Gerstl, L.; Reiter, K.; Borggraefe, I. Effects of a Reduction of the Number of Electrodes in the EEG Montage on the Number of Identified Seizure Patterns. Sci. Rep. 2022, 12, 4621. [Google Scholar] [CrossRef] [PubMed]
- de Curtis, M.; Avoli, M. Initiation, Propagation, and Termination of Partial (Focal) Seizures. Cold Spring Harb. Perspect. Med. 2015, 5, a022368. [Google Scholar] [CrossRef] [PubMed]
- Gu, Y.; Cleeren, E.; Dan, J.; Claes, K.; Van Paesschen, W.; Van Huffel, S.; Hunyadi, B. Comparison between Scalp EEG and Behind-the-Ear EEG for Development of a Wearable Seizure Detection System for Patients with Focal Epilepsy. Sensors 2017, 18, 29. [Google Scholar] [CrossRef] [PubMed]
- McKenzie, E.D.; Lim, A.S.P.; Leung, E.C.W.; Cole, A.J.; Lam, A.D.; Eloyan, A.; Nirola, D.K.; Tshering, L.; Thibert, R.; Garcia, R.Z.; et al. Validation of a Smartphone-Based EEG among People with Epilepsy: A Prospective Study. Sci. Rep. 2017, 7, 45567. [Google Scholar] [CrossRef] [PubMed]
- Epitel. Available online: https://www.epitel.com/ (accessed on 3 June 2022).
- Zibrandtsen, I.C.; Kidmose, P.; Christensen, C.B.; Kjaer, T.W. Ear-EEG Detects Ictal and Interictal Abnormalities in Focal and Generalized Epilepsy—A Comparison with Scalp EEG Monitoring. Clin. Neurophysiol. 2017, 128, 2454–2461. [Google Scholar] [CrossRef] [PubMed]


| Patient | Nr. Seizures | Seizure Type | Localization | Lateralization | Ictal Tachycardia |
|---|---|---|---|---|---|
| 1 | 6 | FIA | Temp | R (1) and bi (5) | Yes |
| 2 | 9 | FIA | Fronto-temp | R | Yes |
| 3 | 2 | FIA | Temp | R | Yes |
| 4 | 8 | FIA | Temp | R | Yes |
| 5 | 3 | FIA | Temp | L | No |
| 6 | 2 | FIA | Temp | L | Yes |
| 7 | 17 | NC | NC | NC | Yes |
| 8 | 2 | FIA | Temp | R | Intermediate |
| 9 | 2 | FA | NC | NC | No |
| 10 | 2 | FIA | Fronto-par | R (1) and bi (1) | Yes |
| 11 | 5 | FIA | Temp | L | Intermediate |
| 12 | 6 | FIA | Temp | L | Intermediate |
| 13 | 5 | FIA | Temp (3) and NC (2) | R (3) and NC (2) | Intermediate |
| 14 | 2 | FIA | Temp | L | Yes |
| 15 | 2 | FA (1) and FIA (1) | Temp (1) and NC (1) | R (1) and NC (1) | No |
| 16 | 2 | FA | Temp (1) and NC (1) | R (1) and NC (1) | Yes |
| 17 | 3 | NC | NC | NC | Intermediate |
| 18 | 6 | FA | NC | NC | No |
| 19 | 3 | FIA | Temp | L | Yes |
| 20 | 5 | FIA | Temp | L (3) and R (2) | Intermediate |
| 21 | 15 | FIA | Frontal | NC | Yes |
| 22 | 3 | FIA | Temp | R | Intermediate |
| 23 | 7 | FIA | Temp | L | No |
| 24 | 5 | FIA | Temp | L | Yes |
| 25 | 4 | FIA | Temp | L | Yes |
| 26 | 22 | FA (14) and FIA (8) | Temp (12) and Fronto-temp (10) | L (3) and R (19) | Intermediate |
| 27 | 9 | FIA | Temp | L (4), R (3), and bi (2) | No |
| 28 | 3 | FA (2) and F-BTC (1) | Temp (1) and Par (2) | R | Yes |
| 29 | 2 | FIA | Temp | R | Yes |
| 30 | 3 | FIA | Fronto-temp | L | Yes |
| 31 | 2 | FIA | Occipito-temp | L | Intermediate |
| 32 | 6 | FIA | Temp | R | Intermediate |
| 33 | 8 | FIA | Temp (1) and Occipito-temp (7) | R | Yes |
| 34 | 5 | FIA | Fronto-temp | L | Intermediate |
| 35 | 5 | FIA | Temp | L | Yes |
| 36 | 6 | FIA | Temp | R | Yes |
| 37 | 5 | FIA | Temp | R | Yes |
| 38 | 2 | FIA | Temp | L | Intermediate |
| 39 | 2 | FIA | Temp | bi | Intermediate |
| 40 | 5 | FIA | Temp | R | Yes |
| 41 | 2 | FIA | Temp | L | Yes |
| 42 | 8 | FIA | Temp | L (3), R (1), and bi (4) | Yes |
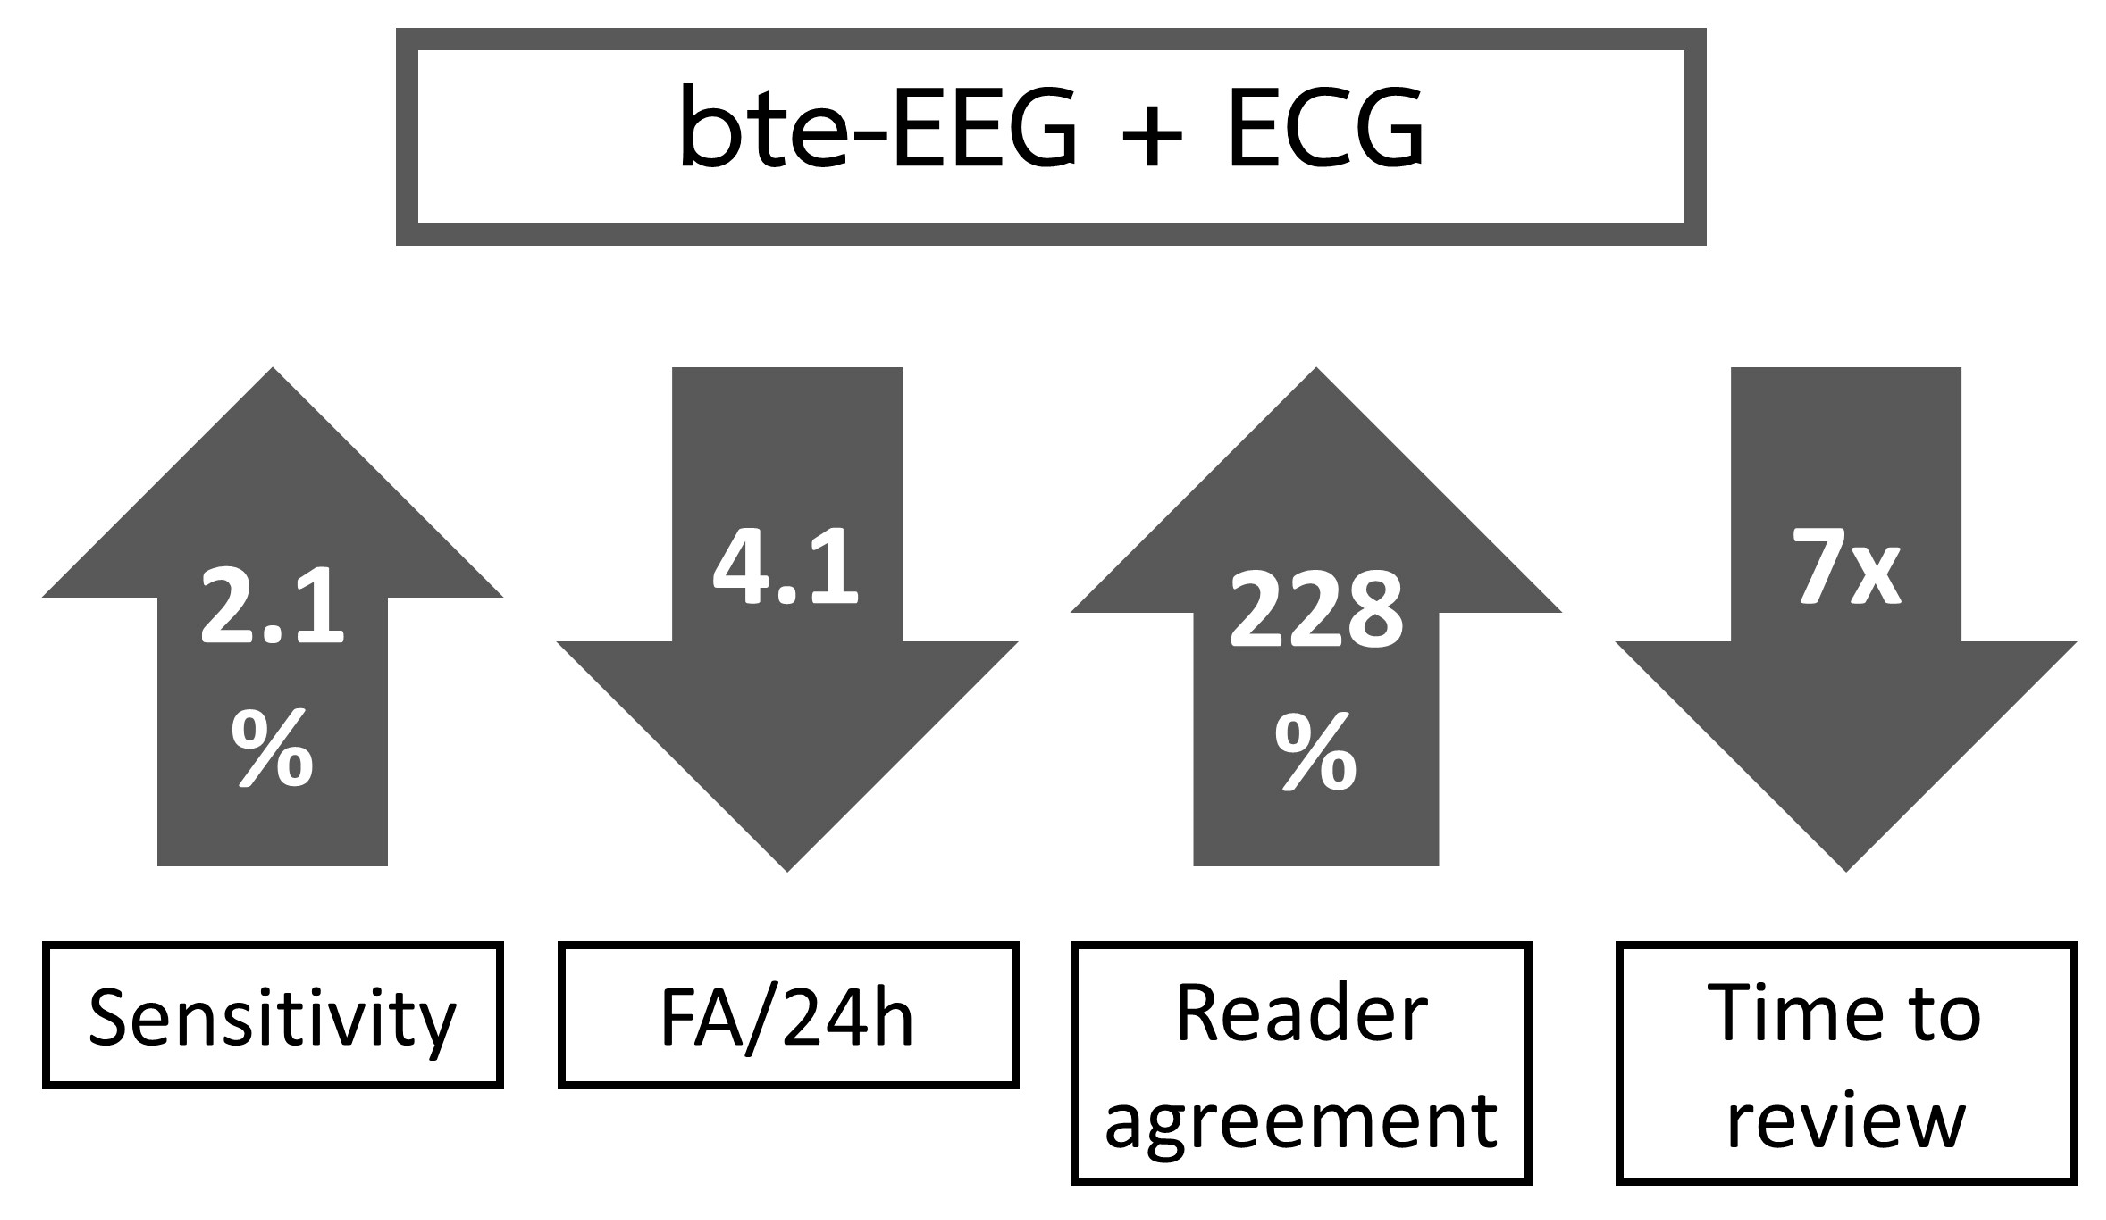
| Sensitivity (%) | FA/24 h | PPV (%) | F1-Score | Time to Review/24 h | |
|---|---|---|---|---|---|
| Multimodal algorithm | 90.6 | 43.4 | 2.9 | 0.06 | - |
| bte-EEG | 59.1 (63.0–55.2) | 6.5 (10.1–3.0) | 13.4 (7.49–19.04) | 0.2 (0.1–0.3) | 8.9 min (8.4–9.5) |
| bte-EEG and ECG | 62.2 (63.0–61.3) | 2.4 (2.9–1.9) | 25.7 (21.8–29.7) | 0.4 (0.3–0.4) | 7.6 min (7.2–8.0) |
| Inter-Rater Variability (Cohen’s Kappa) | |
|---|---|
| bte-EEG | 0.21 |
| bte-EEG and ECG | 0.48 |
Disclaimer/Publisher’s Note: The statements, opinions and data contained in all publications are solely those of the individual author(s) and contributor(s) and not of MDPI and/or the editor(s). MDPI and/or the editor(s) disclaim responsibility for any injury to people or property resulting from any ideas, methods, instructions or products referred to in the content. |
© 2023 by the authors. Licensee MDPI, Basel, Switzerland. This article is an open access article distributed under the terms and conditions of the Creative Commons Attribution (CC BY) license (https://creativecommons.org/licenses/by/4.0/).
Share and Cite
Bhagubai, M.; Vandecasteele, K.; Swinnen, L.; Macea, J.; Chatzichristos, C.; De Vos, M.; Van Paesschen, W. The Power of ECG in Semi-Automated Seizure Detection in Addition to Two-Channel behind-the-Ear EEG. Bioengineering 2023, 10, 491. https://doi.org/10.3390/bioengineering10040491
Bhagubai M, Vandecasteele K, Swinnen L, Macea J, Chatzichristos C, De Vos M, Van Paesschen W. The Power of ECG in Semi-Automated Seizure Detection in Addition to Two-Channel behind-the-Ear EEG. Bioengineering. 2023; 10(4):491. https://doi.org/10.3390/bioengineering10040491
Chicago/Turabian StyleBhagubai, Miguel, Kaat Vandecasteele, Lauren Swinnen, Jaiver Macea, Christos Chatzichristos, Maarten De Vos, and Wim Van Paesschen. 2023. "The Power of ECG in Semi-Automated Seizure Detection in Addition to Two-Channel behind-the-Ear EEG" Bioengineering 10, no. 4: 491. https://doi.org/10.3390/bioengineering10040491