1. Introduction
Nearly 600 million people are living in river delta areas worldwide [
1,
2,
3], of which about 17 million live in the Mekong Delta (MKD) [
4]. River deltas are important for human civilization, as they are major agricultural production and population centers. Different natural and human-related activities led to enormous changes to the hydrogeological processes in delta areas, which are described in the following sections.
Vietnam is a country with a long coastline consisting of Quaternary sediments. Two large rivers transport sediments from the Himalayas toward Vietnam and discharge into the Pacific Ocean via the Red River Delta (RRD) and the MKD. Geomorphologically, the mouths of both rivers form typical deltas. Both deltas have witnessed transgression and regression phases and consist of complex sediment structures. More than the RRD, the MKD is of geopolitical concern, since it forms sediment bodies expanding southwards into the free ocean and extends the exclusive economic zone 200 miles from the coast toward the open sea, determining the borders of Vietnam.
The southernmost part of the MKD, the Ca Mau peninsula, is under intensive stress in terms of erosion processes. The coastline is eroded up to 50 m each year [
5], and intensive erosion occurs along the banks of the rivers and channels. One driver of this erosion is the change in land use since coastline-stabilizing mangroves were replaced by intensive agricultural activities such as rice and shrimp farming [
6]. Another stress driver is the intensive land subsidence of up to 3 cm each year due to a lack of sediments from monsoon flooding, which is no longer occurring due to dam-based flood management. Nguyen et al. [
7] used the MODFLOW model to simulate shallow aquifers on Tay Island in the Mekong River (Dong Thap province, near Hong Ngu city). The authors showed that the groundwater flow system is strongly affected by the interannual variation of the water levels in the Mekong River, especially by floodwater during the rainy season. The Ca Mau peninsula formerly was a mangrove area. Now, the management and the saltwater policy have decreased the mangrove population. Many dams are built to keep out saline water and freshen the ecosystem. In addition to this, many hydropower plants upstream of the Mekong are built against the natural streamflow. In former times, much more sediment was deposited during floods. The amount of sediment deposited due to floods every year is reduced by the aforementioned measures, and sedimentation almost no longer exists.
An additional stress driver for land subsidence is the intensive overexploitation of groundwater resources from the different confined aquifers in this region. Thus, overexploitation is one of the most relevant drivers of land subsidence. Numerous privately installed groundwater wells pump groundwater from the different aquifers without any supervision. According to the report of the project “Statistical and assessment of the current status of groundwater exploitation in the Ca Mau peninsula” [
8], the whole Ca Mau peninsula comprises a total of 521,911 household wells and 1632 pumping stations, of which 3200 wells are damaged or abandoned.
Minderhoud et al. [
9] used the open-source MODFLOW to set up a model for the large MKD area on a regional scale, within a grid size of 1 × 1 km. The results showed that their groundwater model is able to simulate the processes of land subsidence dependent on overexploitation with high accuracy in comparison to in situ measurements from space. Minderhoud et al. [
10] projected extraction-induced subsidence and elevation of the MKD for the 21st century. The model result showed that the largest abrupt change in the subsidence rate happens in scenario M4, where the subsidence rate drops sharply from 8.9 (range: 5.5–12.5) to 1.6 (range: −1.3–4.9) mm/year because of the abrupt stop of all groundwater extraction. With current overexploitation, the amount of groundwater extraction in the delta is about twice the amount of recharge. The maximum recovery of the hydraulic heads in the MKD’s aquifer system is achieved when extraction is completely stopped (scenario M4).
This overexploitation not only results in land subsidence processes but also has the potential to promote the salinization of groundwater aquifers. Due to unstable aquifers, conditions with high-density saline water on top of deep freshwater aquifers, and the general drop of hydraulic heads, saline water may infiltrate from the ocean, channels and river systems, and shallow saline Holocene aquifers [
11]. Contaminated surface water may infiltrate the groundwater and cause pollution. Saline water cannot be used for living purposes (salinization), such as cooking, drinking, or washing. Freshwater sources are mainly rainwater and groundwater. The overexploitation [
12] of freshwater for domestic use and saltwater for aquaculture has depressed the groundwater levels, causing land subsidence [
10] and saline intrusion [
13]. Thus, overexploitation reduces the hydraulic pressure and contributes to the compaction of the sediment layers, resulting in land subsidence [
14]. During the period 2010–2015, Vuong et al. [
13] researched salinity intrusion into the MKD by GMS-MODFLOW with a grid size of 2 × 2 km and calibrated groundwater monitoring data from 2000 to 2010. The climate change scenario together with an increase in estimated exploitation of groundwater until 2100 shows that the saline intrusion occurs strongly under the impact of climate change and overexploitation. Many other authors deal with salinity modeling in the MKD, such as Thu et al. [
15], Hoan [
16], and Trung [
17], with special adaptations to different issues.
These studies mainly focus on land subsidence and saline intrusions due to groundwater extraction. Additionally, the models do not show hydrogeological windows or complex geological structure (with many fine-grained lenses, coarse grains intercropped with powdered clay) due to the limitation of hydraulic conductivity data. Moreover, the majority of relevant studies conducted in Vietnam, as well as internationally, concern hydrogeological strata, and hydrogeological parameters have not been collected fully and reliably. Along with that, with only a few monitoring wells in a large area with many aquifers, it will be difficult to accurately assess the water balance of the study area.
In order to manage for sustainable exploitation of water resources, the government of Vietnam has installed a national monitoring network for groundwater, with up to [
18] 457 monitoring stations (941 observation wells in aquifers). In southern Vietnam, there are 50 monitoring locations (including 223 observation wells), and in the Ca Mau peninsula, there are 22 locations.
Sustainable groundwater protection needs a comprehensive scientific understanding of the complex processes and structures of the sediment layers acting as aquifers, aquitards, and aquicludes. The process of land subsidence in a delta is a complex process, having different causes and taking place in different hydrogeological structures (aquifers). These processes and the detailed processes of salinization on a local scale are unknown.
Thus, a well-founded model of the groundwater bodies is urgently needed, since until now, only a rudimentary understanding of the sediment body has been available. This is the basis of our study. Based on available new drilling data, a finite element FLOW (FEFLOW) approach was used to develop a model for groundwater in the complex structures of the sediment bodies of the Ca Mau peninsula. Therefore, a detailed high-resolution hydrogeological model for the Ca Mau peninsula must be set up to investigate the different processes on a local scale in different aquifers. In this paper, we describe the setup and calibration of this new model, FEFLOW, with an extension of the boundary to the sea. In the future, this model will be adapted to salinity and land subsidence modeling.
2. Study Area
2.1. Location and Situation
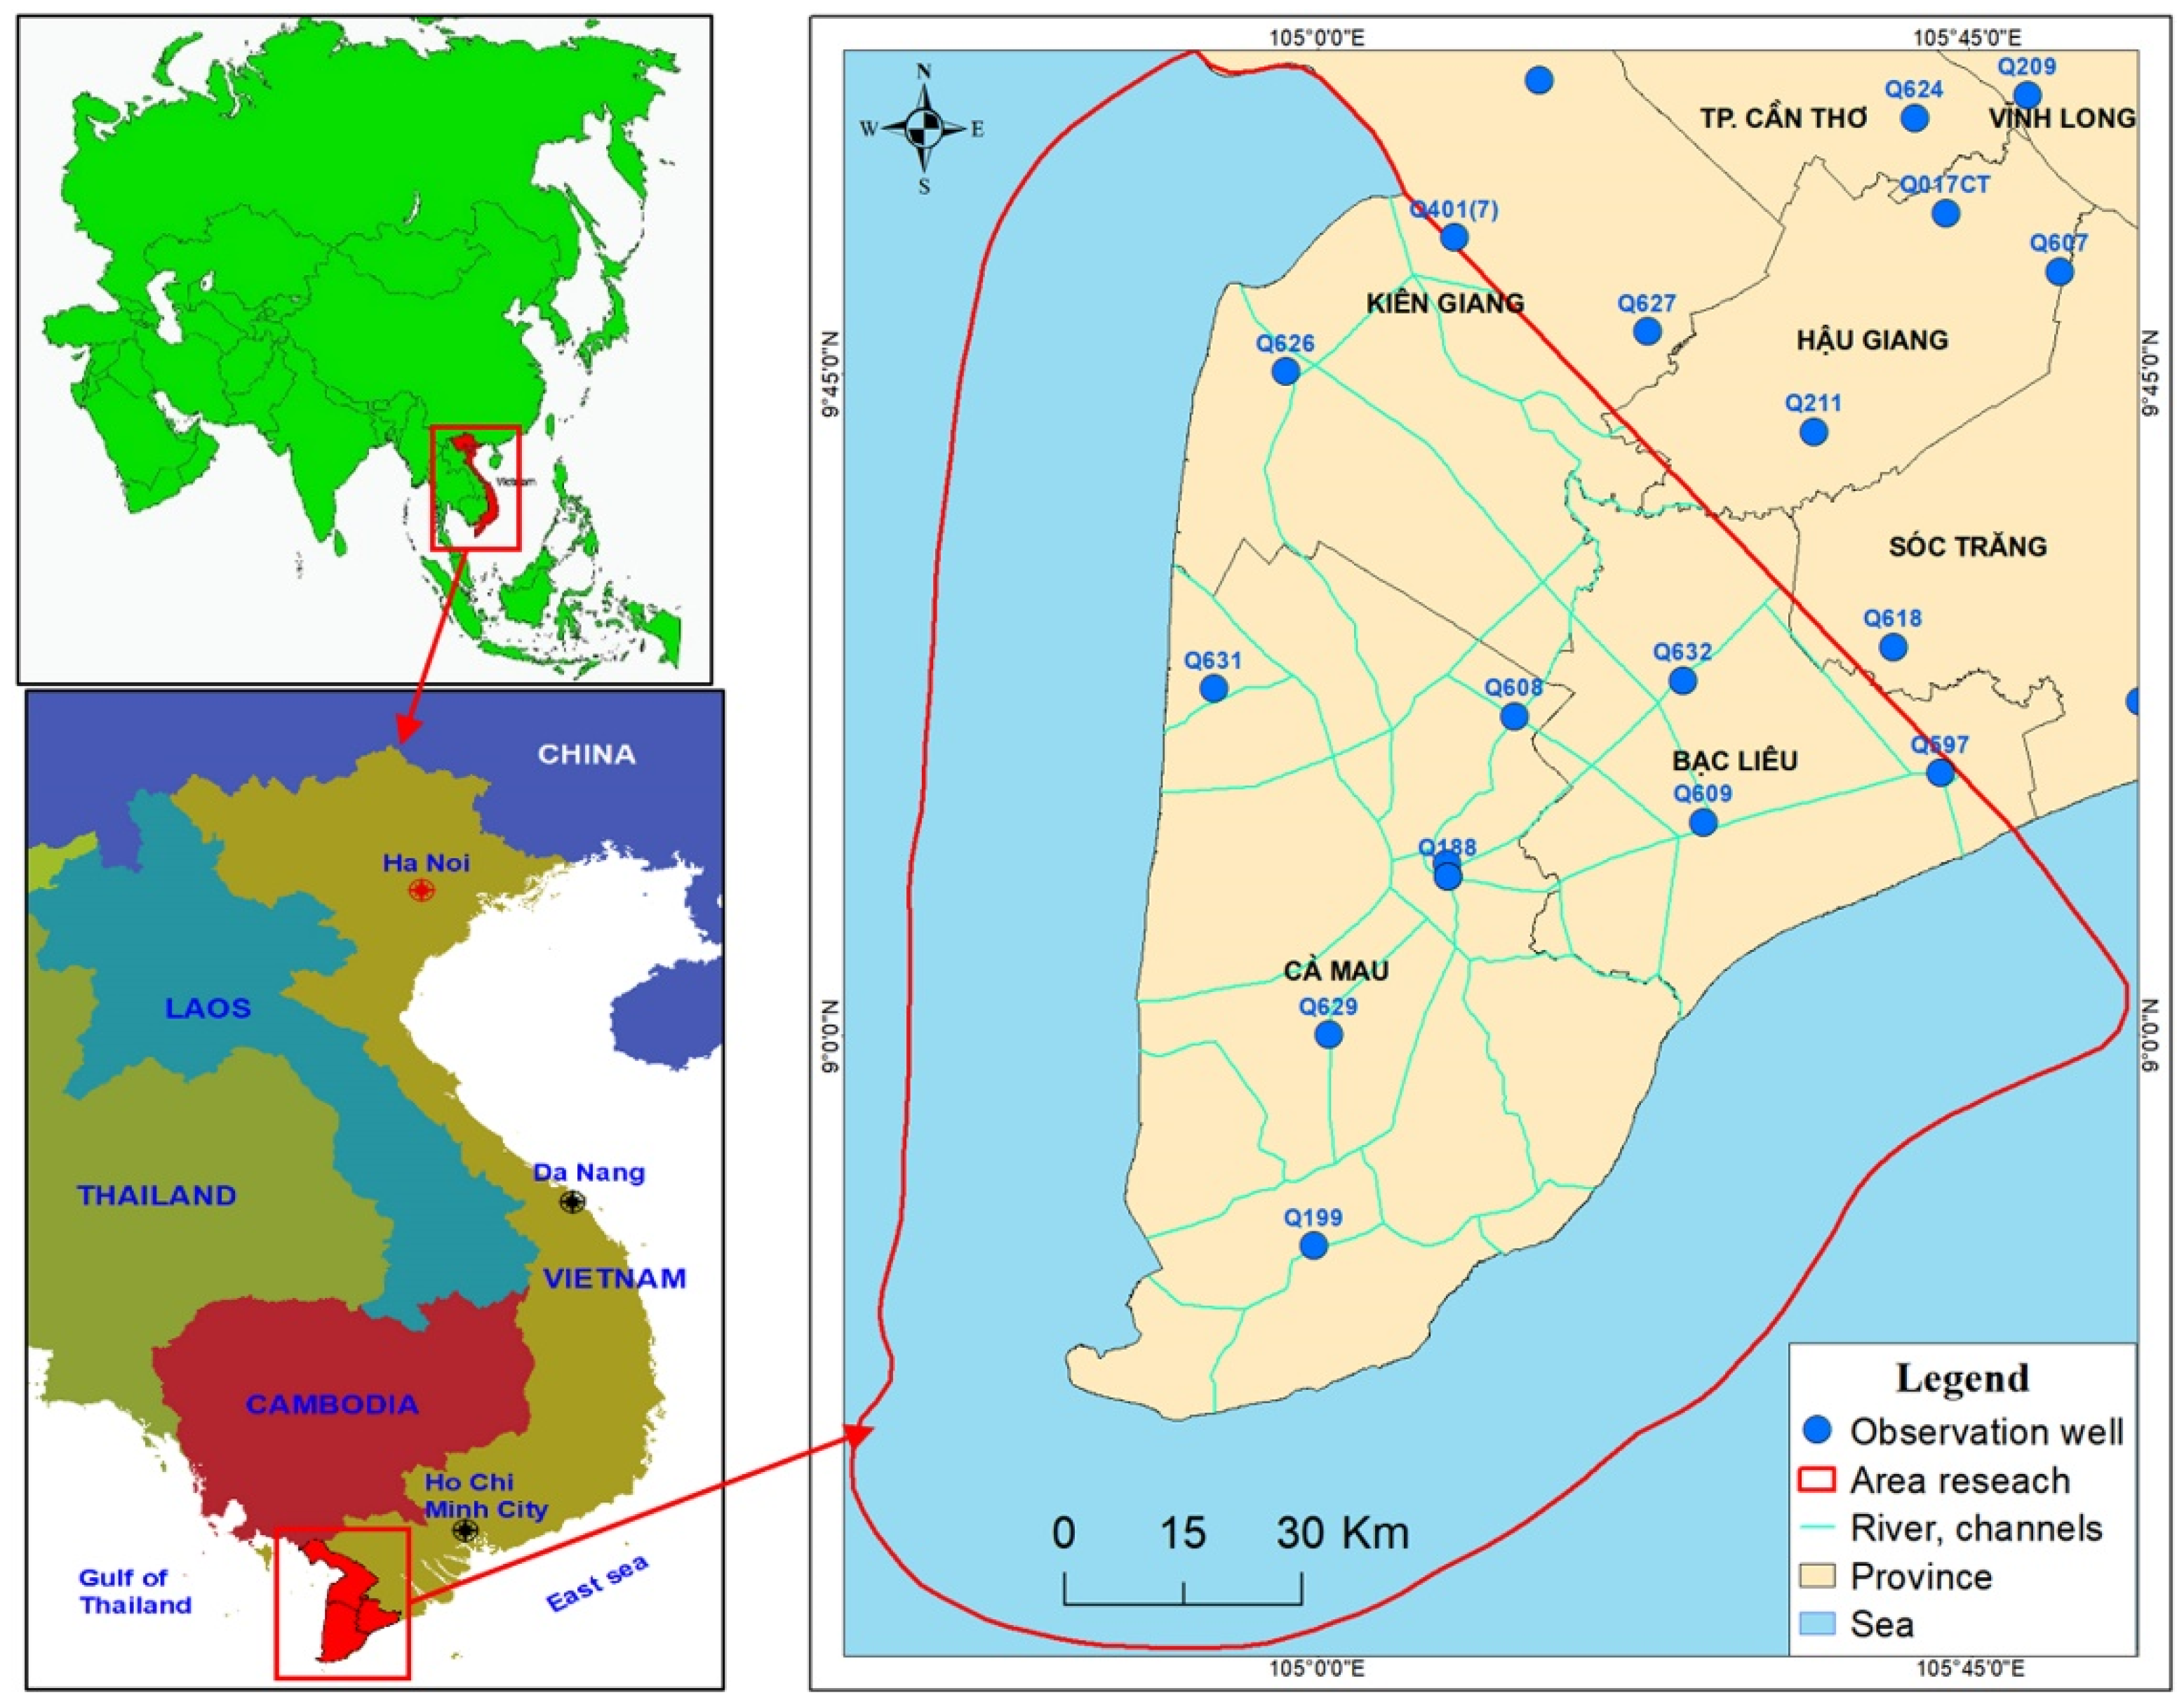
Ca Mau, Bac Lieu, and Kien Giang are located in the southern MKD region (Vietnam, see
Figure 1). The terrain is low and flat with many rivers and canals. Most of the area has a low elevation, between 0.4 and 2.0 m.s.l. The terrain gradually slopes from north to south and from the northeast to the southwest. The Ca Mau peninsula has an interlacing river and canal system, which facilitates the exchange between surface water and groundwater of the shallow aquifers.
The tidal system in the Ca Mau peninsula is affected by the irregular semi-diurnal tidal regime of the East Sea, with an amplitude change of about 3.5 m, and the irregular diurnal tidal system of the West Sea (Gulf of Thailand), with an amplitude change of only 1 m [
19].
The hydrological regime is directly affected by the tidal system with broad river mouths leading to the sea. Moving inland, the effect of the tides is reduced gradually, which causes the tidal amplitude and the propagation speed in the river to decrease. The systems of interlaced rivers and canals form a wetland that is suitable for agriculture. Saltwater intrusion into the surface water of the Ca Mau peninsula river system occurs during the dry season due to reduced freshwater flow in the canals and is directly related to the sea tides [
20].
2.2. Climatic Situation in Ca Mau Peninsula
According to the statistics of Ca Mau station 2015–2019 [
4], the Ca Mau peninsula has a high average temperature (28 °C); the average temperature of the whole area is relatively homogeneous. The highest average temperature is in April (29.6 °C) and the lowest is in January (26.9 °C).
The annual average comparative relative humidity is from 82.2% to 87.2%. In September and October, the highest relative humidity levels occur (86–89%). In January and February, the relative humidity levels are the lowest (75.6–83.2%).
The area of research has two seasons: the rainy season, which lasts from May to November, and the dry season, from December to April. The total annual rainfall is about 2008–2304 mm/year. The rainfall is concentrated mainly in the rainy season, accounting for about 90–92% of total annual rainfall.
The evaporation level in the research area is substantial, with an annual average above 1000 mm (Picher-mm). In the dry season, due to the extensive sunshine and low humidity levels, the evaporation is the highest, particularly in March–April, with 130 mm. In the rainy season, the evaporation is lower, and October has the lowest evaporation level of 60 mm.
2.3. Hydrogeology
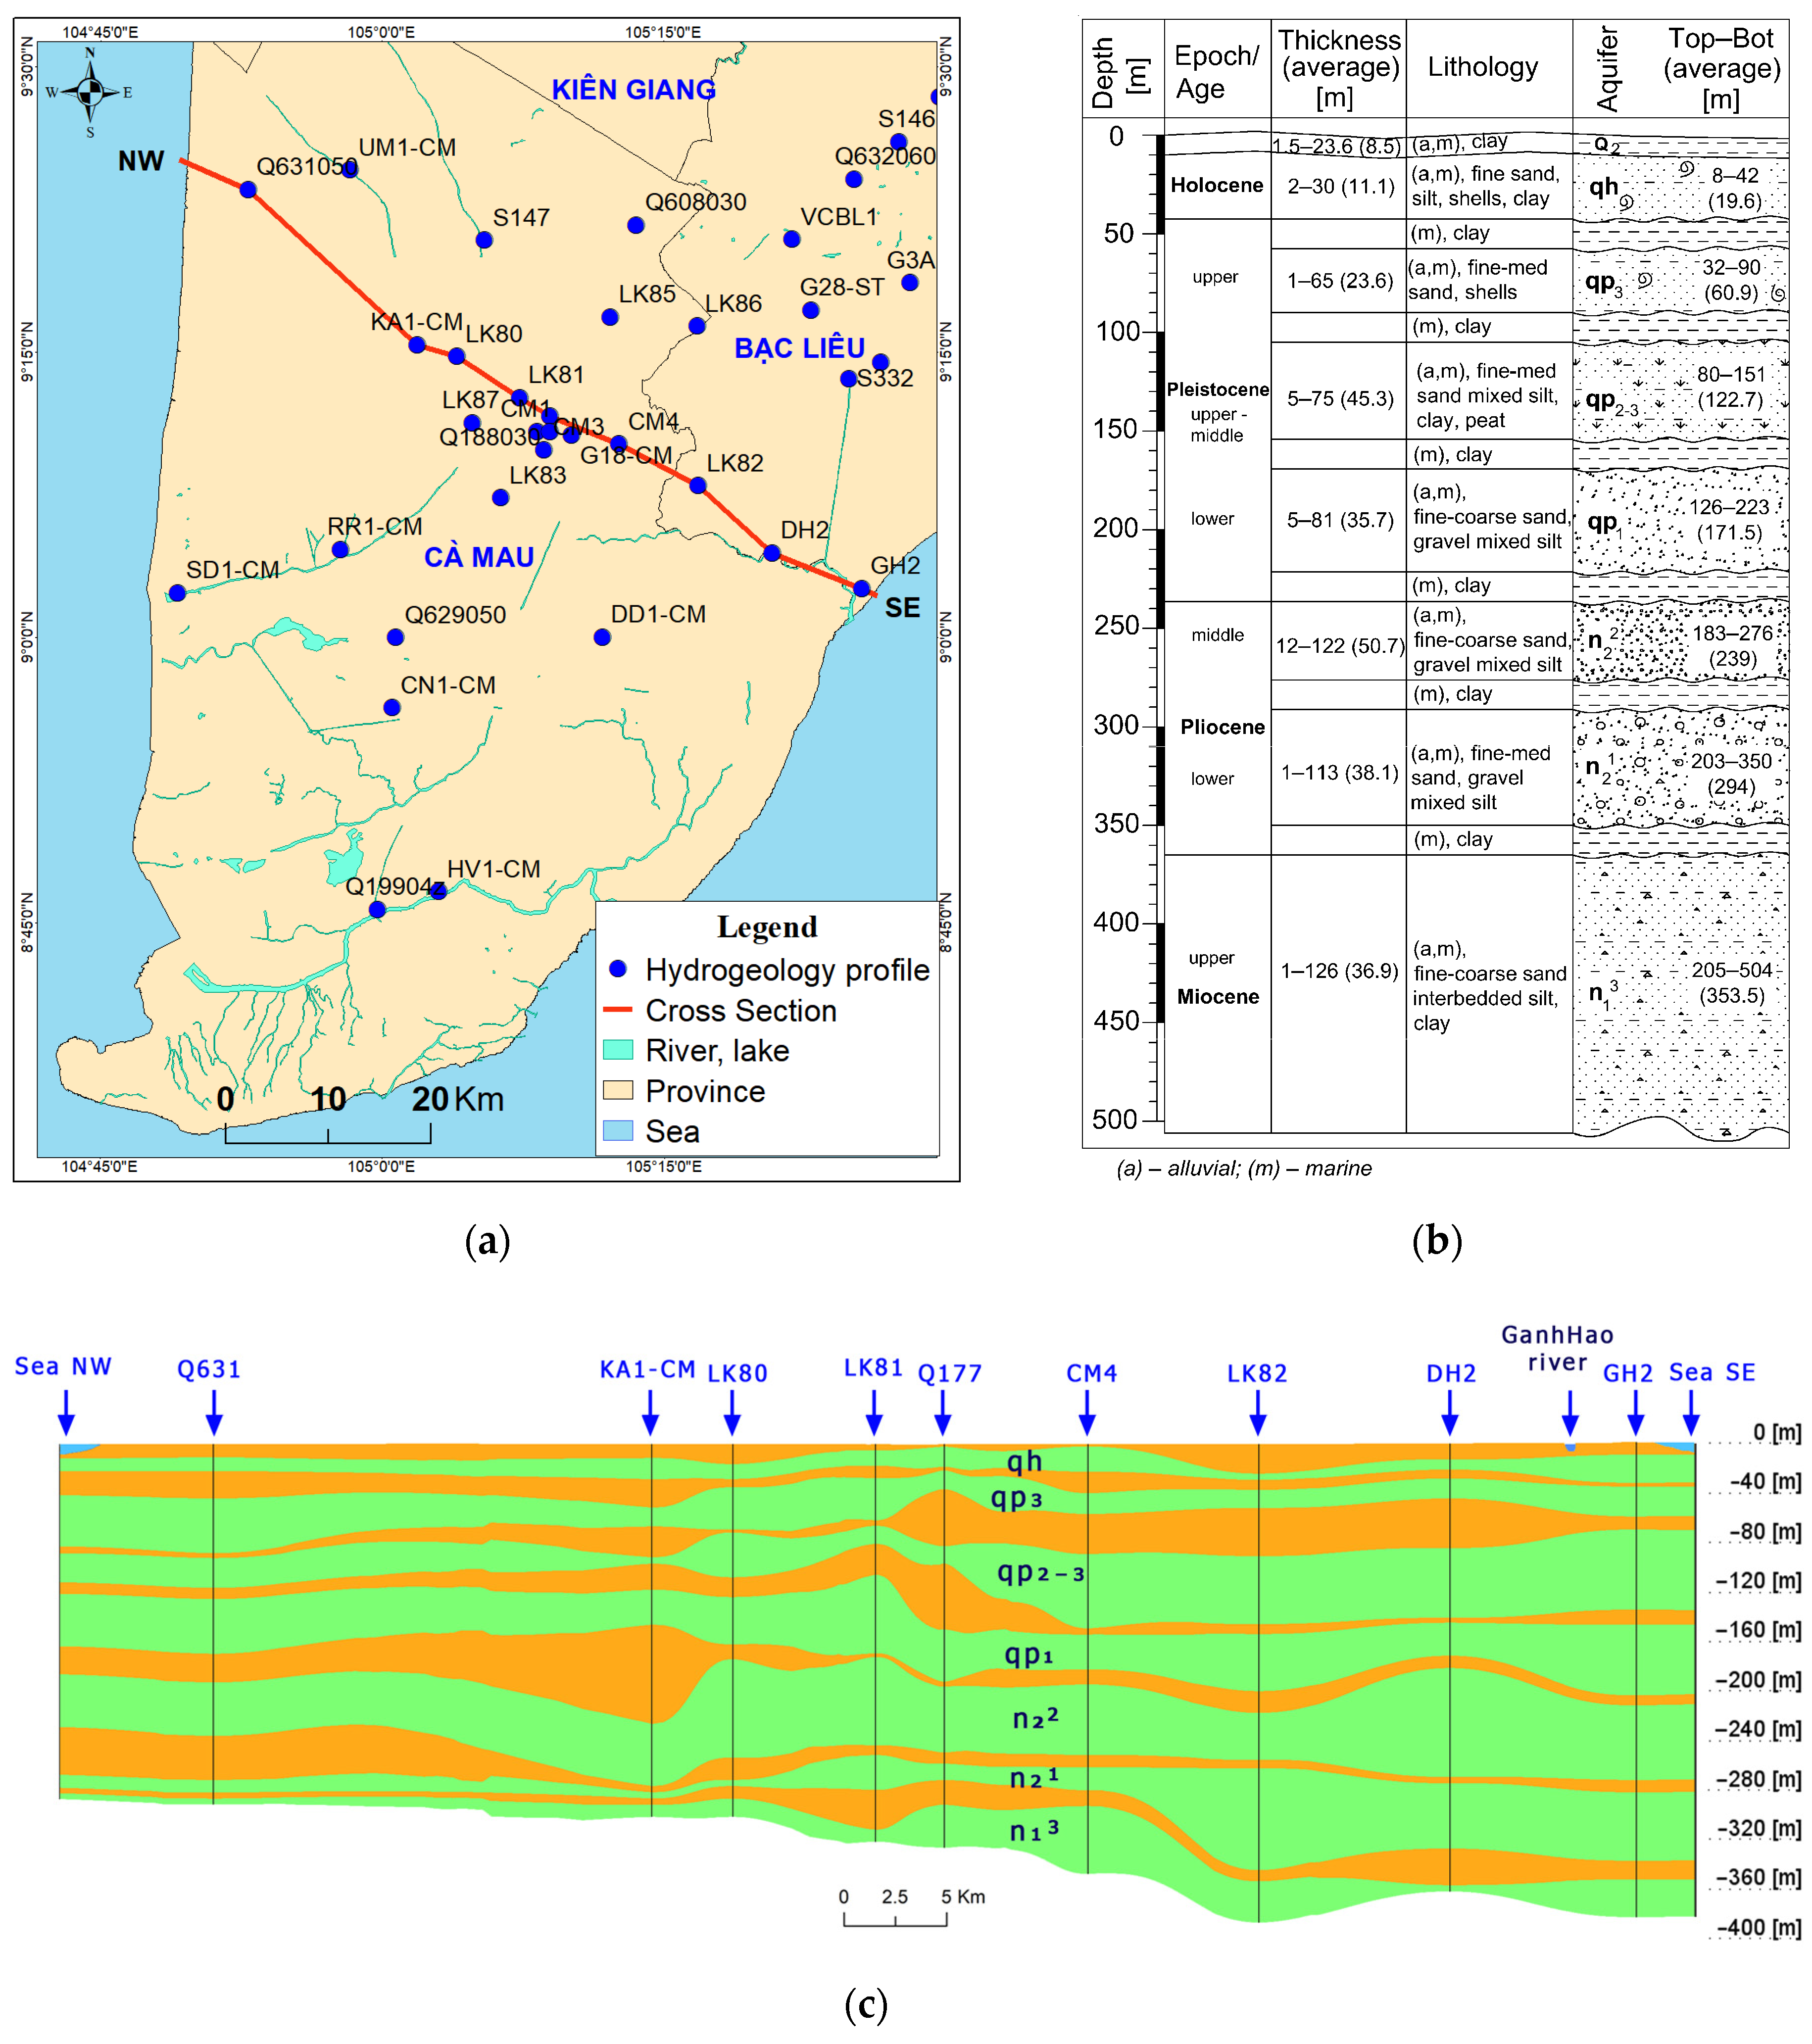
In the MKD, a series of unconsolidated Cenozoic sediments (marine transgression cycles) cover a Mesozoic basement. In the Ca Mau peninsula, these Cenozoic deposits are 300–400 m thick on average. The subsidence of the Ca Mau peninsula in the Neogene was caused by the uplift of the Himalayan orogenesis, with high erosion rates in the mountains that provided large amounts of debris transported by the Mekong River to its delta, where it formed, due to sedimentation, the Ca Mau peninsula. Several cycles of marine transgression and regression during the Pleistocene led to a stratification of marine and alluvial faces. The change between high sea levels, which caused saltwater intrusion into the Ca Mau peninsula sediments, and the low sea levels during the glacial events, which caused the freshwater lenses, comprised the hydrogeological situation (
Figure 2b). The mostly fine-grained Holocene sediments protected the deeper layers against recent salinization. The situation is described in
Figure 2b. There are seven aquifers (Holocene—qh, upper Pleistocene—qp
3, upper-middle Pleistocene—qp
2–3, lower Pleistocene—qp
1, middle Pliocene—n
22, lower Pliocene—n
21, and upper Miocene—n
13) and seven aquitards (
Figure 2c).
2.4. Groundwater Exploitation
The exploitation of groundwater in the Ca Mau peninsula mainly supplies domestic use in urban areas as well as rural areas, industrial parks, and services. In addition, groundwater (including saline water) is used for aquaculture, agriculture, and other purposes. A summary of data collected in six provinces shows that the total amount of groundwater exploited in the whole region is 453,850 m
3/day [
8]. In the research area, the exploitation of the various aquifers is very different, depending on the area. Households (unlicensed wells) mainly concentrate on shallow aquifers such as qp
3 (Kien Giang) and qp
2–3 (Kien Giang, Ca Mau, Bac Lieu). Licensed exploitation wells are concentrated mainly in deeper aquifers, such as qp
2–3 (Kien Giang), qp
1 (Ca Mau, Bac Lieu), and n
22 (Ca Mau). Based on data collected starting in 2010 by the ViWaT project, Ca Mau groundwater exploitation is mainly concentrated in the n
22 aquifer with a flow of 40,000 m
3/day; in part of the Kien Giang area, with concentrated exploitation of the qp
2–3 aquifers of 12,600 m
3/day; and Bac Lieu, with concentrated exploitation of the qp
2–3 aquifers of 56,300 m
3/day.
3. Data Collection
For the Ca Mau peninsula study area, many data from previous projects are available. The quality and accuracy of the data collected depend primarily on the responsible organizations (DONRE’s Ca Mau, MONRE, and NAWAPI) and officials who conduct their surveys and report on their results. Although some of the projects were conducted in the same research area, they produced different results about the groundwater extraction volume due to the estimation of the source from households [
22]. In the research area, for the exploitation data, we rely on DONRE’s licensed exploitation data. The unregistered extraction volume data from households is interpolated when calibrating the model.
The following data were collected for the evaluation of the hydrogeological model:
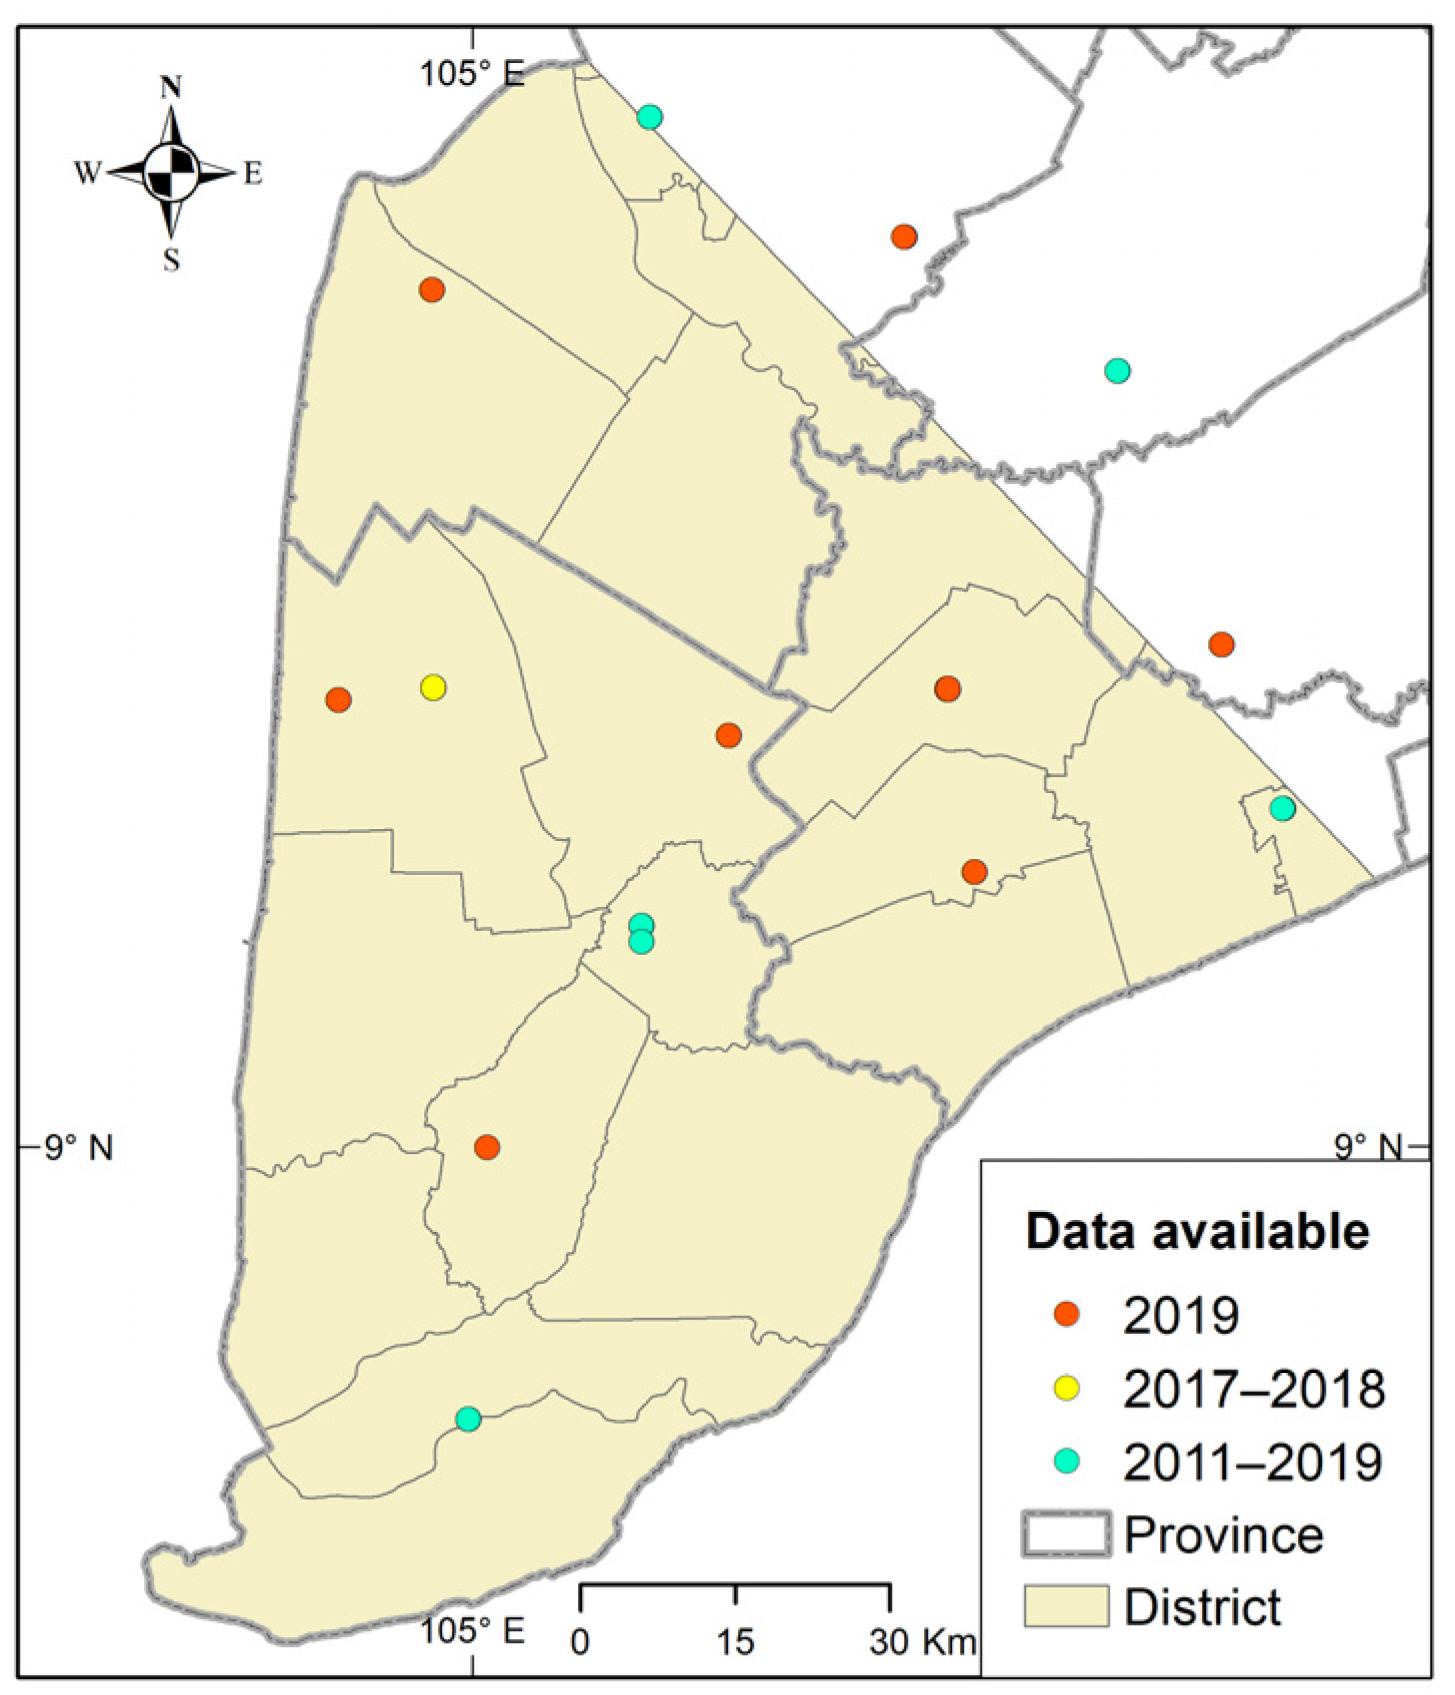
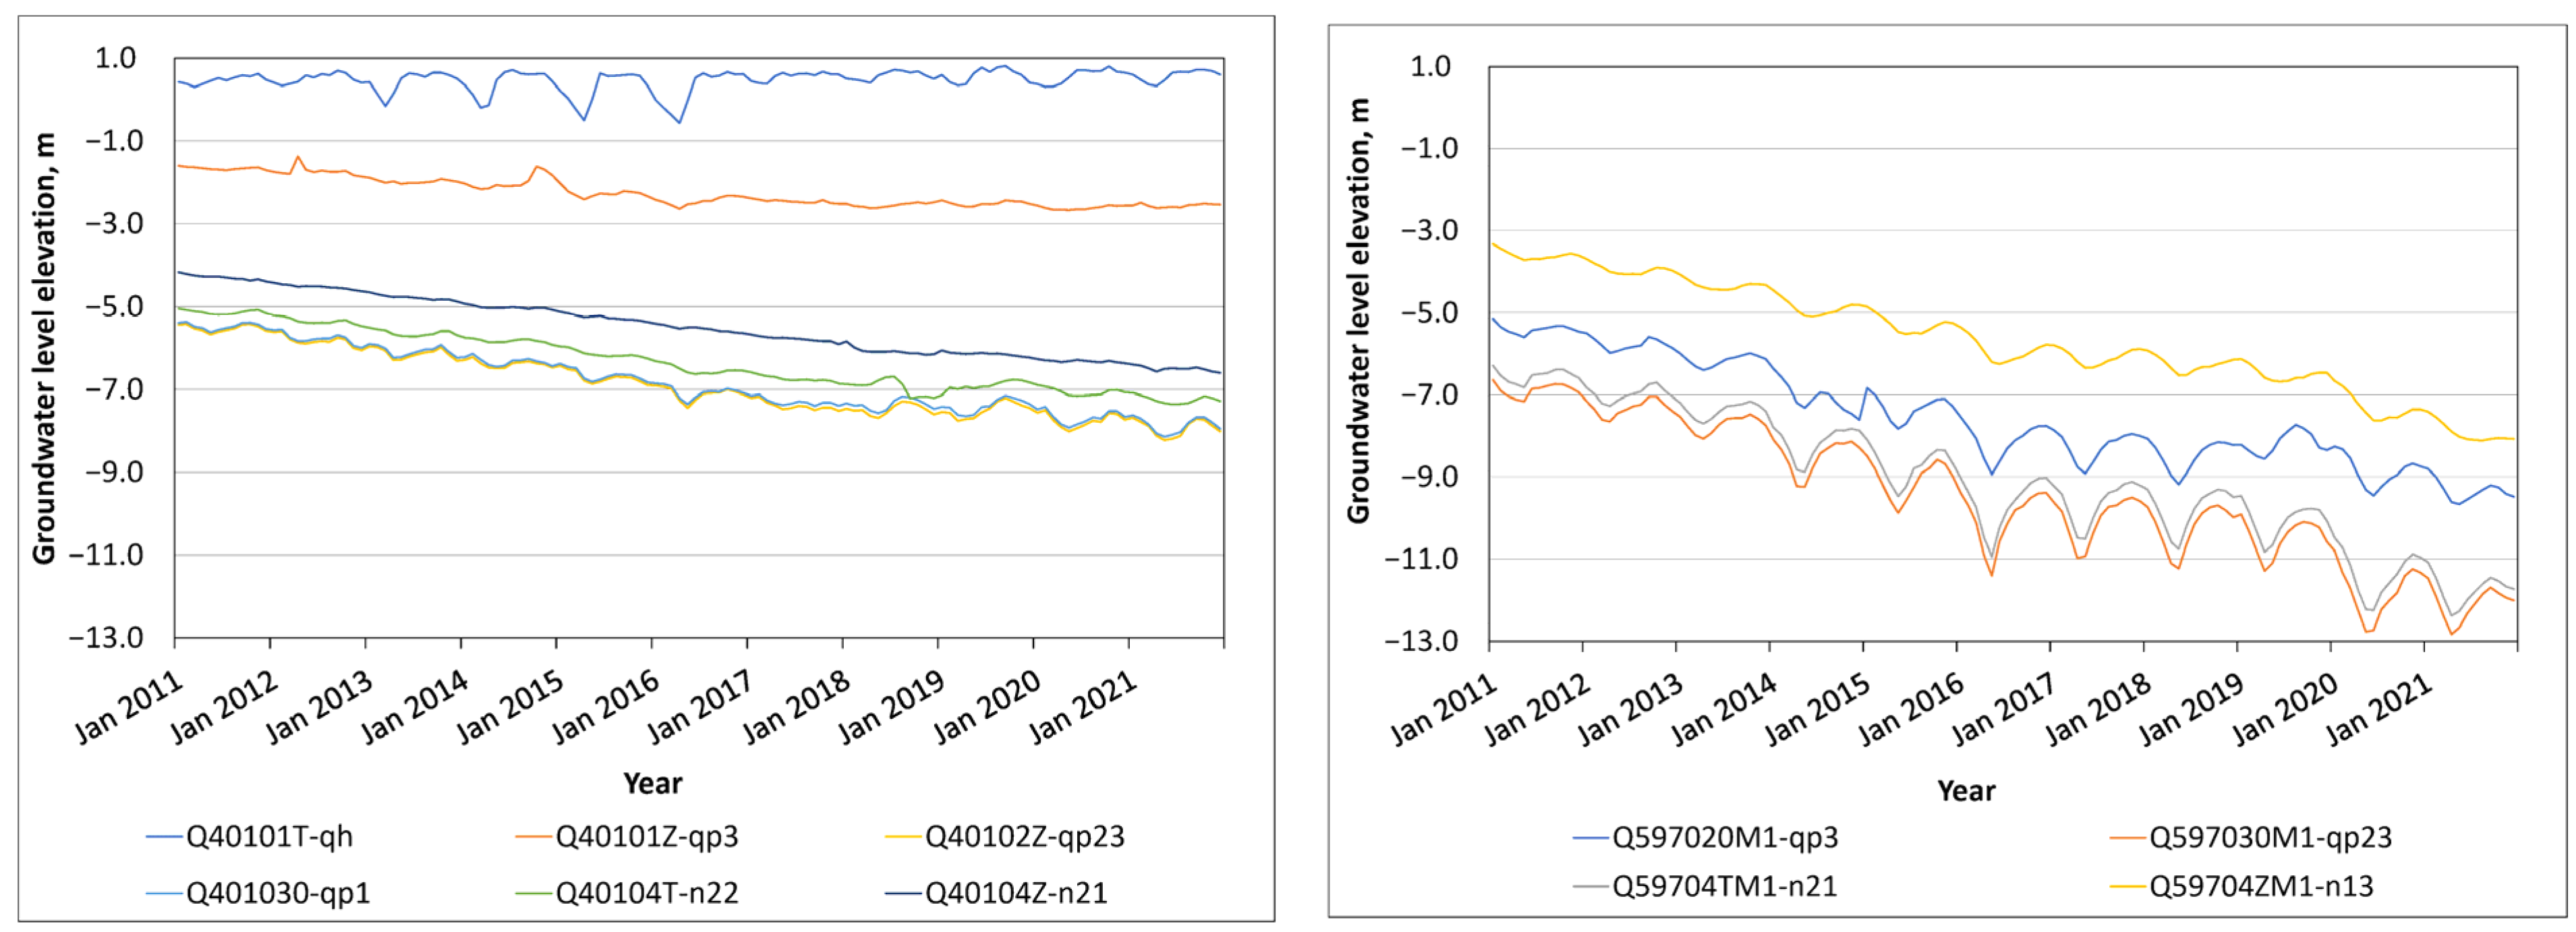
The monthly hydraulic heads were taken over the period January 2011 to December 2019 with a total of 74 observation wells (16 locations with well groups collecting data from different aquifers) from the National Center for Water Resources Planning and Investigation [
21] and BGR projects [
22]. Forty-one observation wells in the model area and eight locations started recording data from 2019 onward. The information on the observation well groups is shown in
Figure 3. For the long period, two locations (Q410 and Q597) with 10 wells were used for the boundary condition, and three locations (Q177, Q188, and Q199) were used in which there are some monitoring wells with a full validation period from January 2011 to December 2019.
4. Methodology
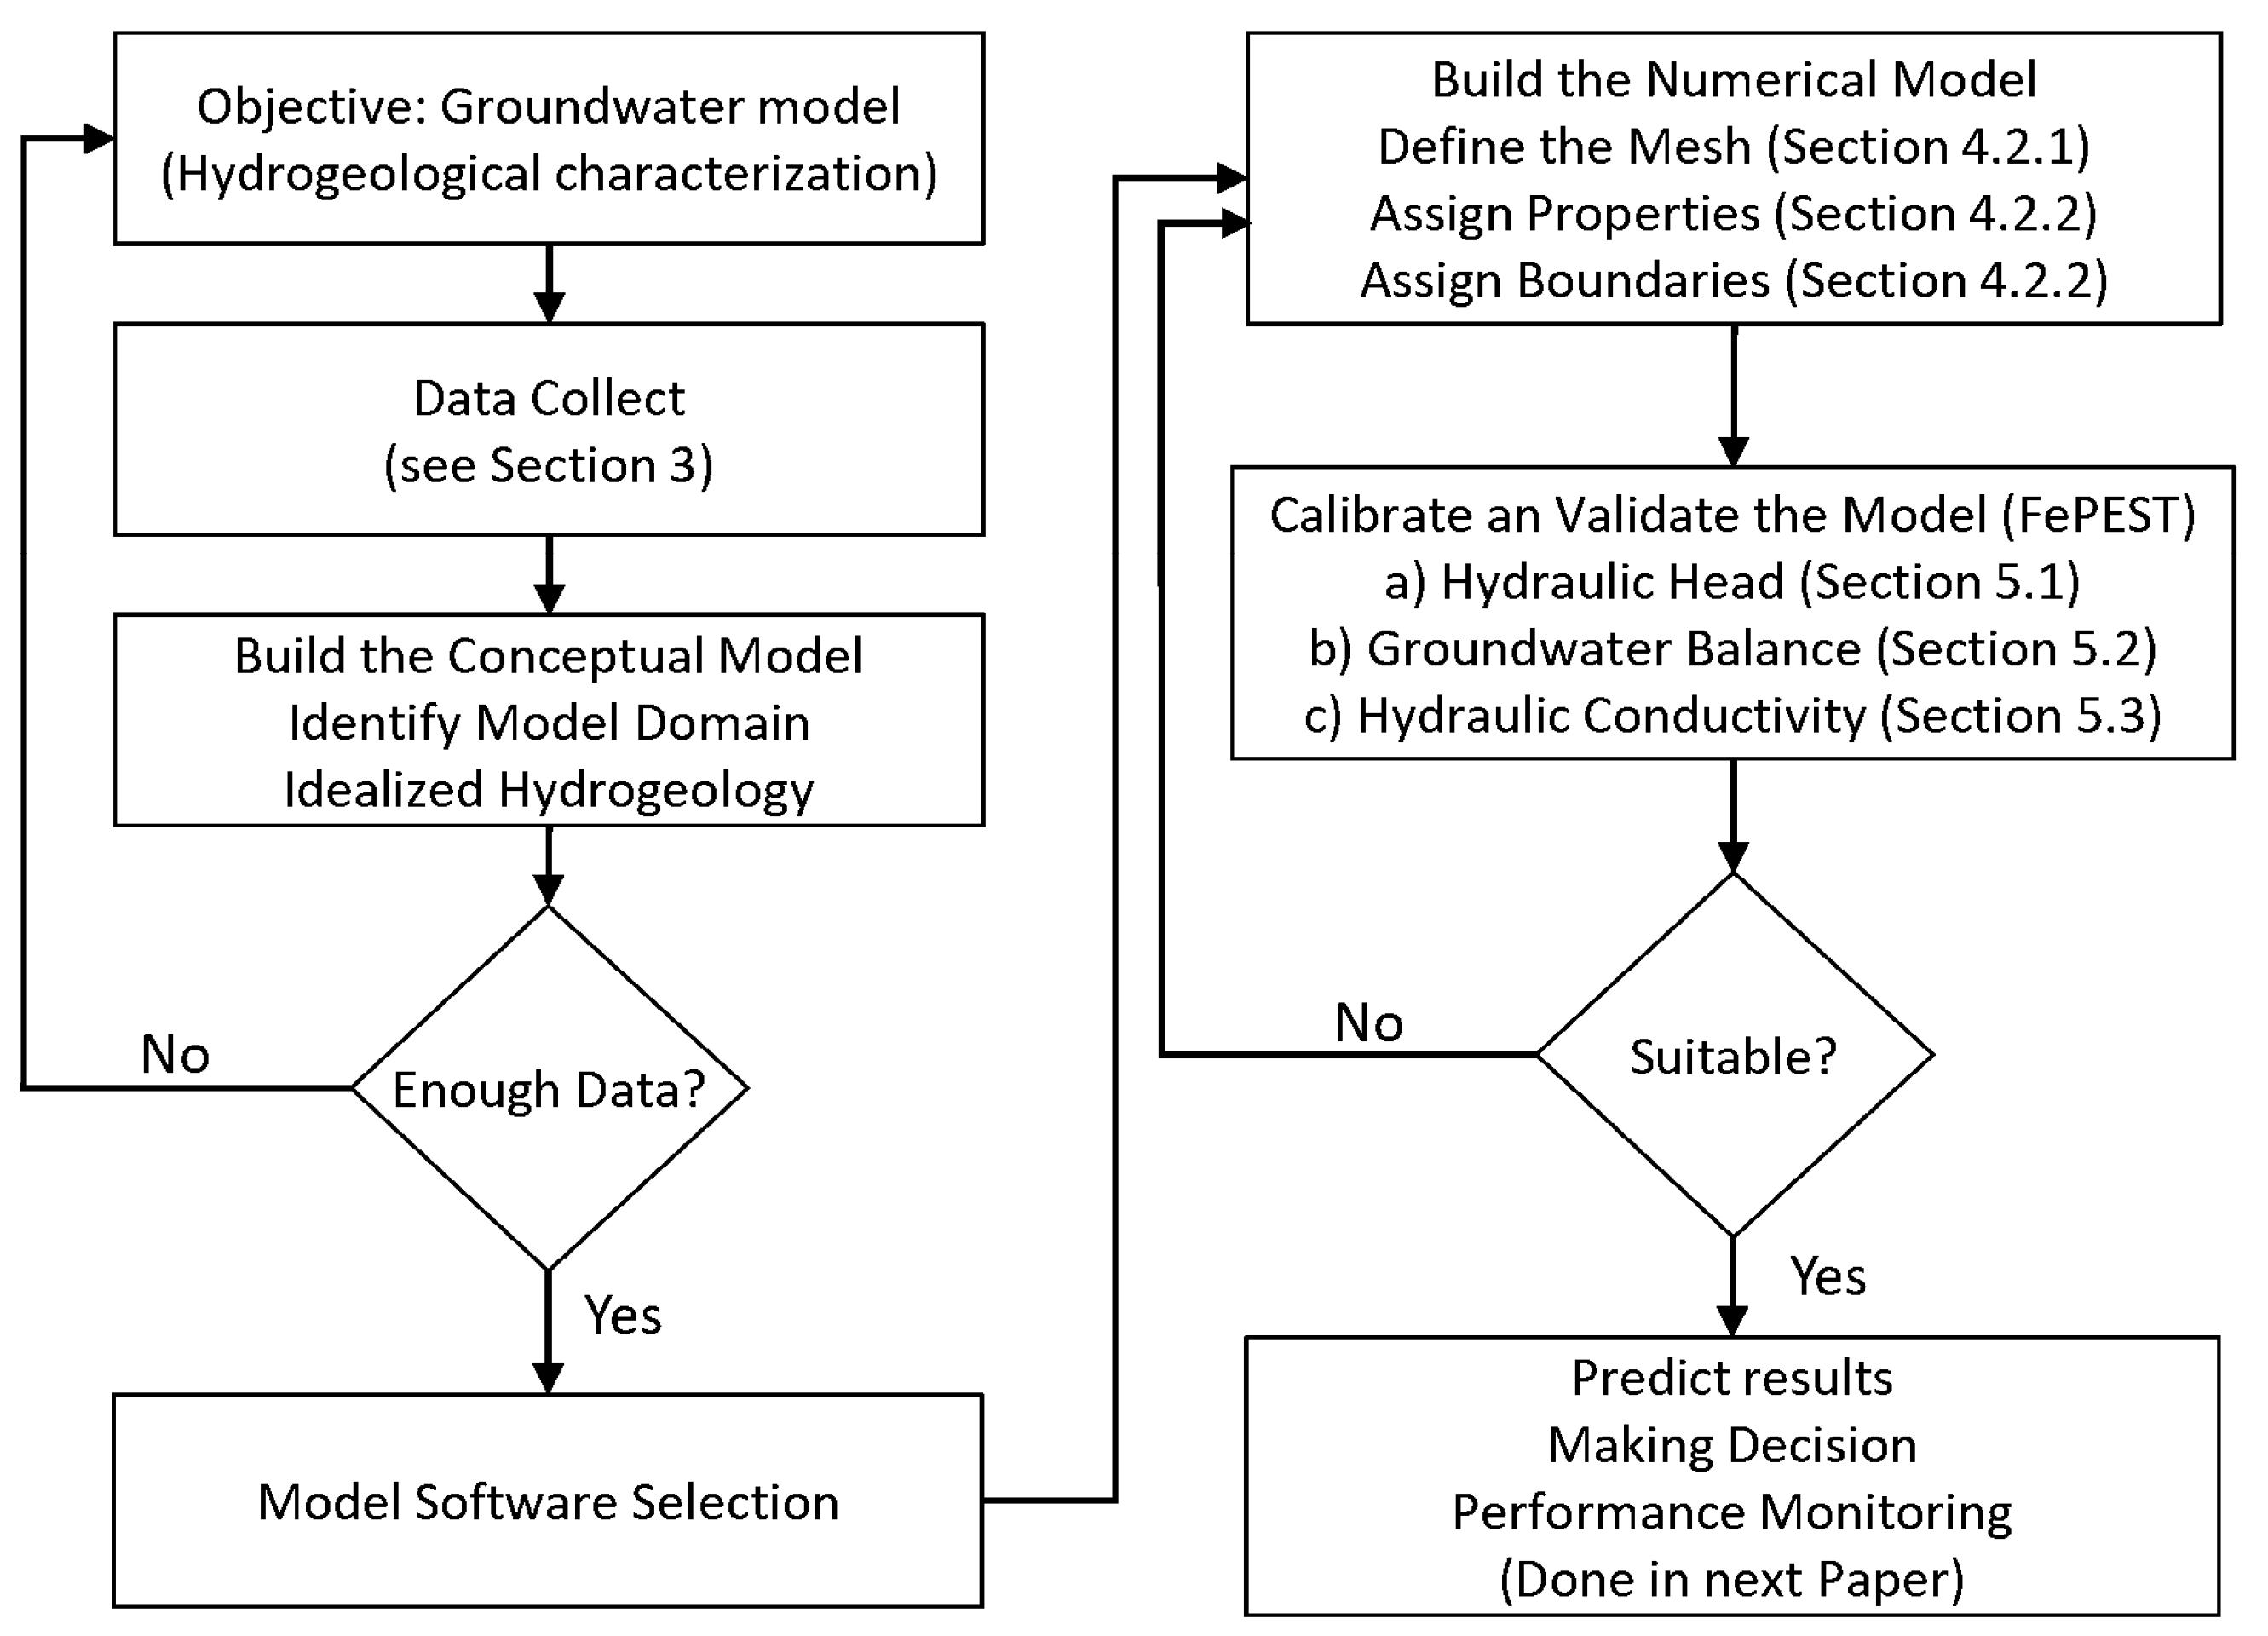
The modeling process starts with planning, which focuses on gaining clarity on the intended use of the model, the questions at hand, the modeling objectives, and the type of model needed to meet the project objectives. The next stage involves using all available data and knowledge of the region of interest to develop the conceptual model (conceptualization), which is a description of the known physical features and the groundwater flow processes within the area of interest. Then, a mathematical model must be selected with the consistency of mesh, hydrodynamic characteristics, and boundary conditions. Afterward, the initial model will be calibrated by trial and error to understand the response of the model to parameter changes. FePest [
24] with the zoning approach was used to achieve optimum calibrations using observation wells as control points. The ongoing procedure is shown on the right side of the flowchart (
Figure 4) and is described in detail in the following subsections.
4.1. Model
The MODFLOW model of MKD for an area of approximately 43,000 km
2 was built by DWRPIS [
13] in the GMS environment. The model simulates the situation from 2000 to 2010 and focuses on accessing the influences of climate change and sea level rise. In 2017, Minderhoud et al. [
9] used MODFLOW based on environment iMOD (image processing, modeling) [
25]. They extended the Mekong model to Ho Chi Minh city and focused on land subsidence. The purpose of the development of a groundwater model in this paper is to design an early warning system for groundwater level depletion and saline intrusion into the aquifers of the Ca Mau peninsula. In the study area, a 3D hydrogeology model was built using the finite element method to simulate the groundwater flow in the Ca Mau peninsula.
Different from using the finite difference method in MODFLOW, the finite element method in FEFLOW [
24] shows more advantages in calculating speed and the ability to construct aquifers that are more complex. FEFLOW can create layer-based, partially unstructured, or fully unstructured meshes in 3D and produces precise spatial representations of complex diversity and geometrical settings such as rivers, fractures, pipes, tunnels, and well locations (
www.mikepoweredbydhi.com (10 February 2022)). Finite element methods provide a better representation of anisotropy, whereas MODFLOW requires conductivity to be perpendicular to the faces of the finite difference cells [
26].
4.2. Model Setup and Calibration
4.2.1. The Modeling Framework
The model area covers the Ca Mau province and parts of the provinces Soc Trang, Bac Lieu, and Kien Giang. A three-dimensional numerical hydrogeological model with finite elements (FEFLOW) was developed to simulate groundwater flow and fluctuations in hydraulic heads over the past 10 years (2011–2020) applying monthly time steps. The modeling area is about 19,900 km
2, of which the mainland is about 9600 km
2, with 1,963,276 nodes and 1,056,390 elements (
Figure 5b). The finite element meshes are created together with the wells, monitoring points, and rivers. The distance between elements is approximately 10 m to 2.5 km depending on the area.
The Ca Mau peninsula subsurface is divided into seven main hydrogeological units using 78 hydrogeological profiles (
Figure 5a) and additional information provided by the “Division for Geological Mapping for the South of Vietnam” (governmental organization). Each hydrological profile consists of a permeable bottom layer and the tops for seven aquifers and seven aquitards (
Figure 5b). This information was used to create the 3D subsurface model using the linear interpolation method. This resulted in 14 layers comprising the subsurface model, representing seven aquifers, six aquitards, and a phreatic (Q
2) top layer (
Figure 2c and
Figure 5).
Average hydraulic conductivity (K) values are depicted in
Table 1. In addition, the most important rivers are included in the model to calculate the interaction between surface water and the aquifers qh and qp
3. The river widths and river depths were derived from surface water profiles.
To set up the model, the groundwater model must be parametrized by horizontal and vertical K, and by porosity and specific storage for each aquifer and aquitard. According to collected data, the average horizontal conductivity (vertical conductivity is taken as one-tenth [
27] of the horizontal conductivity) and specific storage (Ss) are shown in
Table 1. These values were interpolated using the inverse distance method to import the model.
4.2.2. Model Boundary Conditions
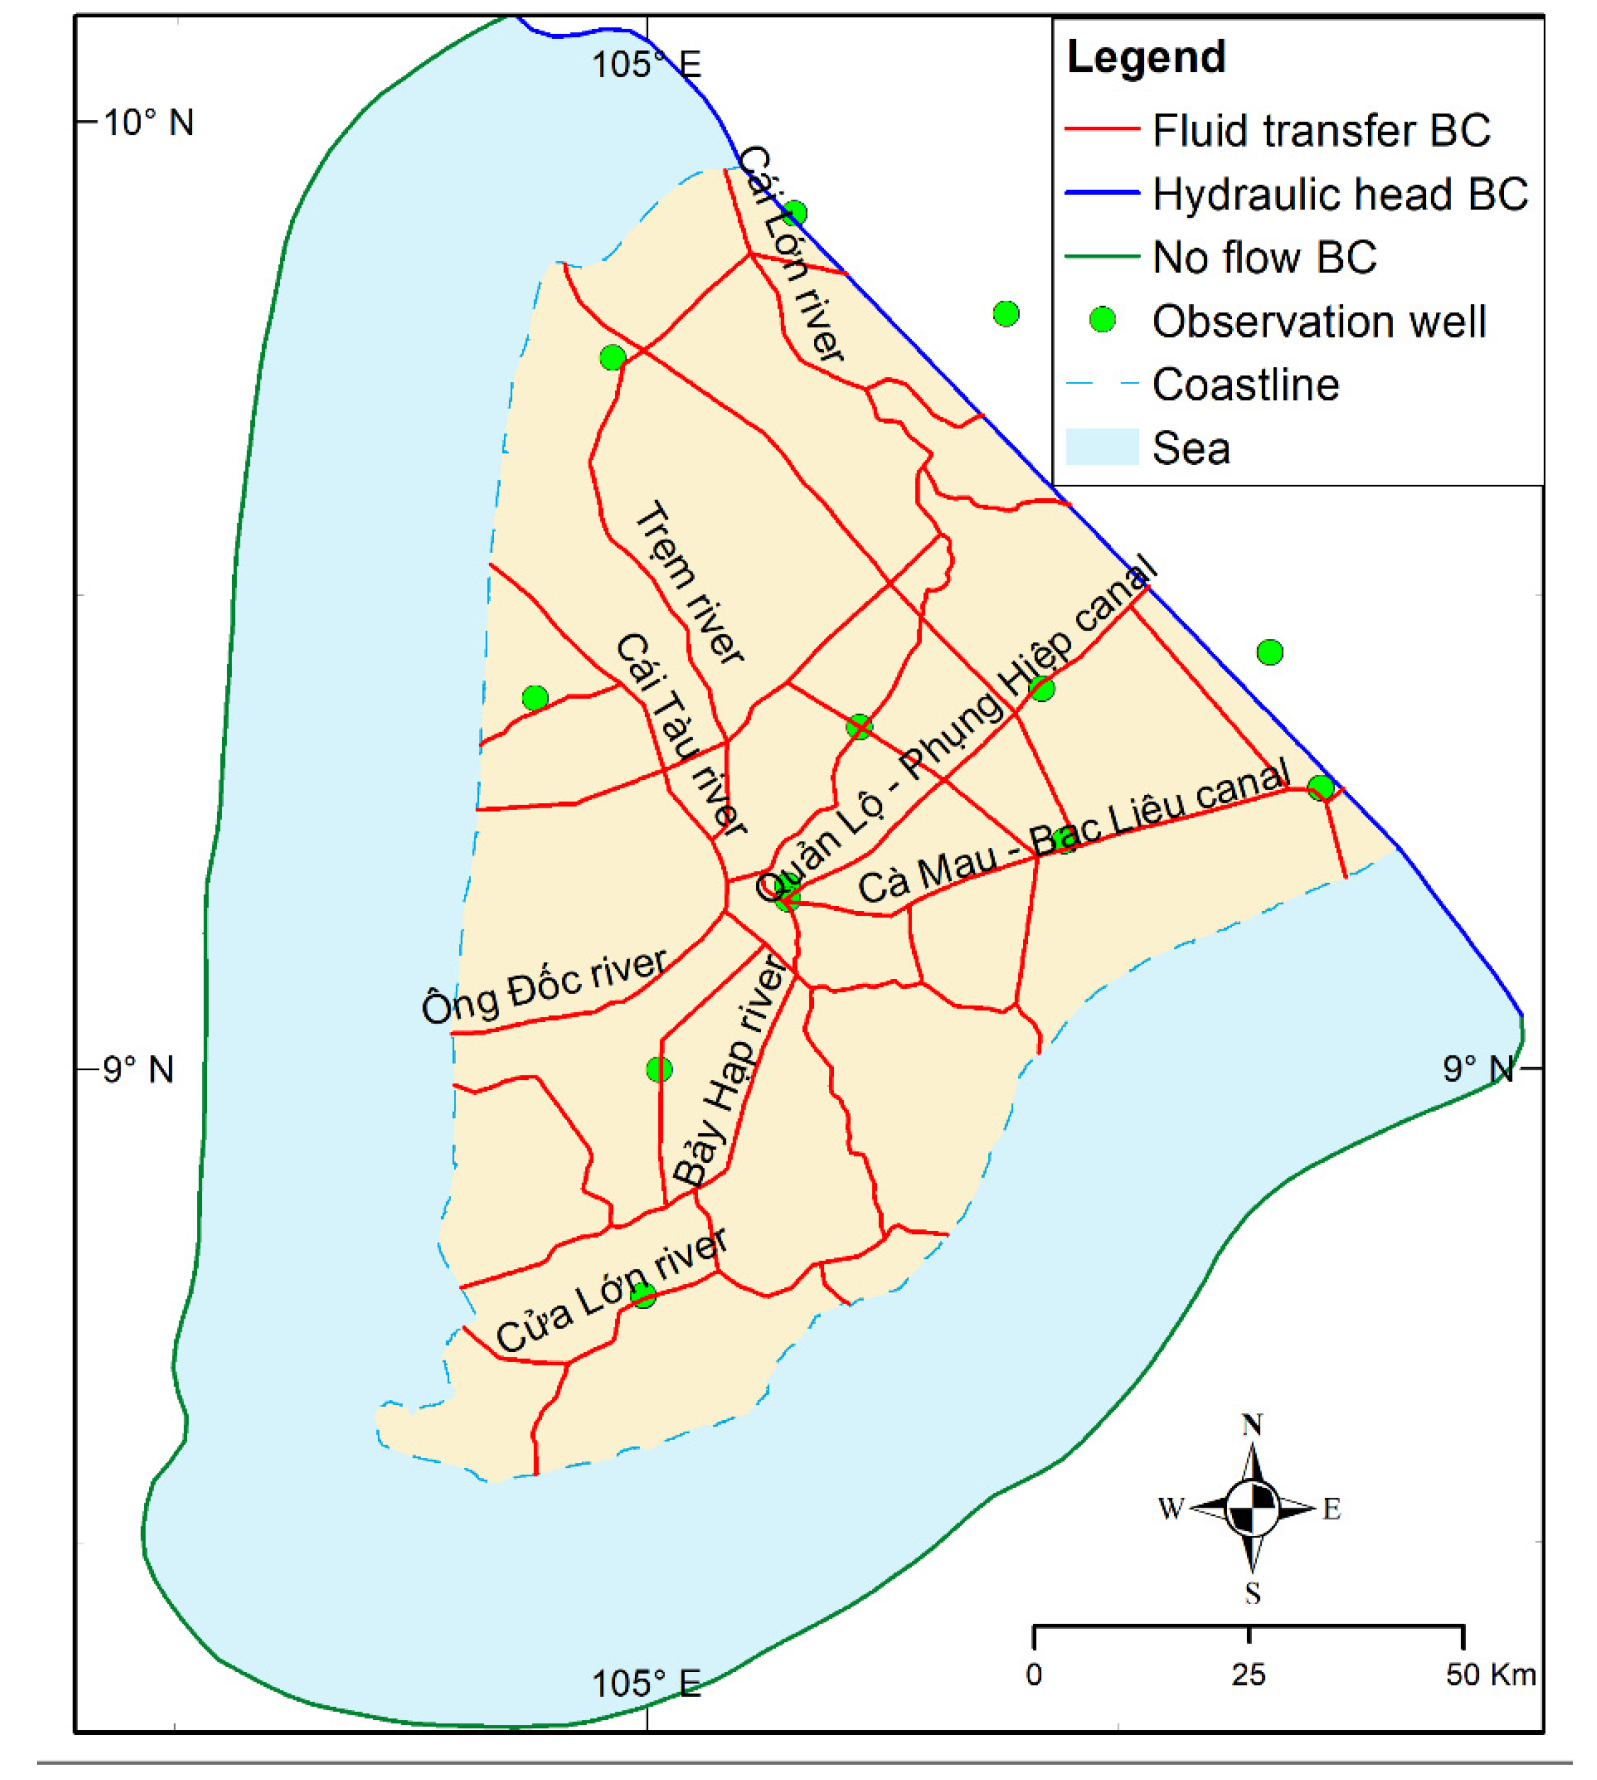
The boundary conditions (BCs) that are critical for the groundwater flow model of the Ca Mau peninsula are the flow from the northern boundary and the ocean and the surface water levels from the river and channel system. In addition, the recharge from rainfall and the pumping rates are included in the model. The boundary conditions are shown in
Figure 6.
Along the northern boundary of the model, the first type of hydraulic head BC was assigned. The hydraulic head on the northern boundary was determined based on the interpolation of two well groups along the northern line (Q597 and Q401), and for each aquifer, a monthly value from January 2011 to December 2019 was used. The boundary conditions are shown in
Figure 7.
Figure 6 shows the hydraulic heads for different aquifers. In most of the aquifers, a depletion of the hydraulic head can be seen with an interannual variation. The depletion is caused by an extraordinary increase in exploitation during the past 11 years (
Table 2), totaling nearly 30%.
To reduce the influence of the outer boundary on groundwater flow in the mainland, extending the border offshore is a good solution. Its southwest and southeast borders are artificial boundaries in offshore areas where hydraulic heads were assigned no-flow boundary conditions. For the river/canal, fluid transfer BC was chosen as the third kind/Cauchy BC [
24]. This flow (infiltration/exfiltration) depends on the water level difference between surface water and groundwater. The boundaries are assigned to phreatic layer 1 and layer 2 (aquifer qh), representing the main rivers/canals and the area around the coast. According to different authors [
25], recharge from the river system to the aquifers in the downstream part of the Ca Mau peninsula is expected to be limited due to the presence of a thick, largely impermeable, Holocene aquitard near the surface, effectively sealing off the aquifers below.
Considering recharge from rainfall, the thick aquitard strata at the surface separate the deeper aquifers from the surface water system and may prevent direct aquifer recharge [
22]. Moreover, the very dense river and canal network quickly discharges the intensive runoff generated by frequently occurring heavy rainfalls. Therefore, the recharge from rainfall is very small. In the model, initial recharge input amounts to 1% of the mean monthly rainfall (based on two Ca Mau and Bac Lieu stations, in the model divided into three recharge zones).
Regarding pumping from 2011 to 2019, the licensed exploitation of Ca Mau city has increased by 66%. This increase is similar within Bac Lieu province. Unregistered extraction wells grow at an annual rate of 2.5% based on estimates of extraction increase by DWRPIS [
10]. The following pumping rates (
Table 2) were calculated from the licensed wells for the different aquifers. An interannual variation of the pumping rates is assumed.
5. Results of Model Calibration and Validation
Ahmed Hassan [
28] discusses groundwater model validation in detail. He distinguished between scientific, philosophical, operational, and confidence-building views of model validation. The scientific view implies that the model is representing reality. Jackson et al. [
29] demand, for specific models, “validation that one might reasonably expect someone with relevant technical knowledge to consider the model acceptable”. From the operational view of model validation, Flavelle [
30] argues that most of the validation definitions available in the literature make explicit reference to the need to demonstrate that a model is a good, correct, or sufficient representation of reality and that “these definitions require subjective interpretation”. In addition to this, from the confidence-building view, Davis and Goodrich [
31] postulated two acceptance criteria for an existing model: “The first is a measure of the adequacy of the model structure (conceptual model, mathematical model) in describing the system behavior and the second is a measure of the accuracy of the model input parameters relative to experimental results and field observations.” This leads to the following criteria, which are commonly accepted by groundwater modelers as criteria for an integrated view of a scientific, operational, and confidence-building view of model validation.
To validate a groundwater model, different aspects should be validated:
Does the model represent reality (scientific and confidence-building validation)?
Best fit to measured and calibrated hydraulic head (confidence-building validation);
Validate the groundwater balance (scientific validation);
Validate hydrogeological parameters such as conductivity and porosity (scientific and confidence-building validation).
After consideration of the availability, credibility, and distribution in each aquifer/area of the Ca Mau peninsula, 46 monitoring wells were selected for validation. Groundwater model calibration is performed by systematically adapting the model parameters of conductivity, specific storage, leakage factor, and porosity to the measured groundwater levels and the measured discharge in the river system to a plausible estimate of discharge at the hydraulic head boundaries and to a plausible groundwater balance. This results in the error value (positive or negative), which must be minimized during the process of calibration.
The calibration of the model is limited by three different conditions:
Interpolation of unregistered extraction wells with an increase in annual growth of 2.5% from 2011 to 2019. Licensed exploitations were compared with the actual licensed exploitation in 2018 from Ca Mau DONRE, in total by 65.7%, so in the model, the corresponding increase was 6.5%/year.
Based on the data collected, the transient calibration phase is from January 2011 to December 2019.
A reduced information base of groundwater monitoring data for the period January 2011 to December 2019 (only three stations are available: Q199, Q188, and Q177). Since the beginning of 2019, more groundwater measurement stations have been available (
Figure 1 and
Figure 3).
5.1. Model Validation of Hydraulic Head
The quality of the model is tested in space and time for different aquifers according to Davis and Goodrich’s [
31] second point mentioned at the beginning of this section.
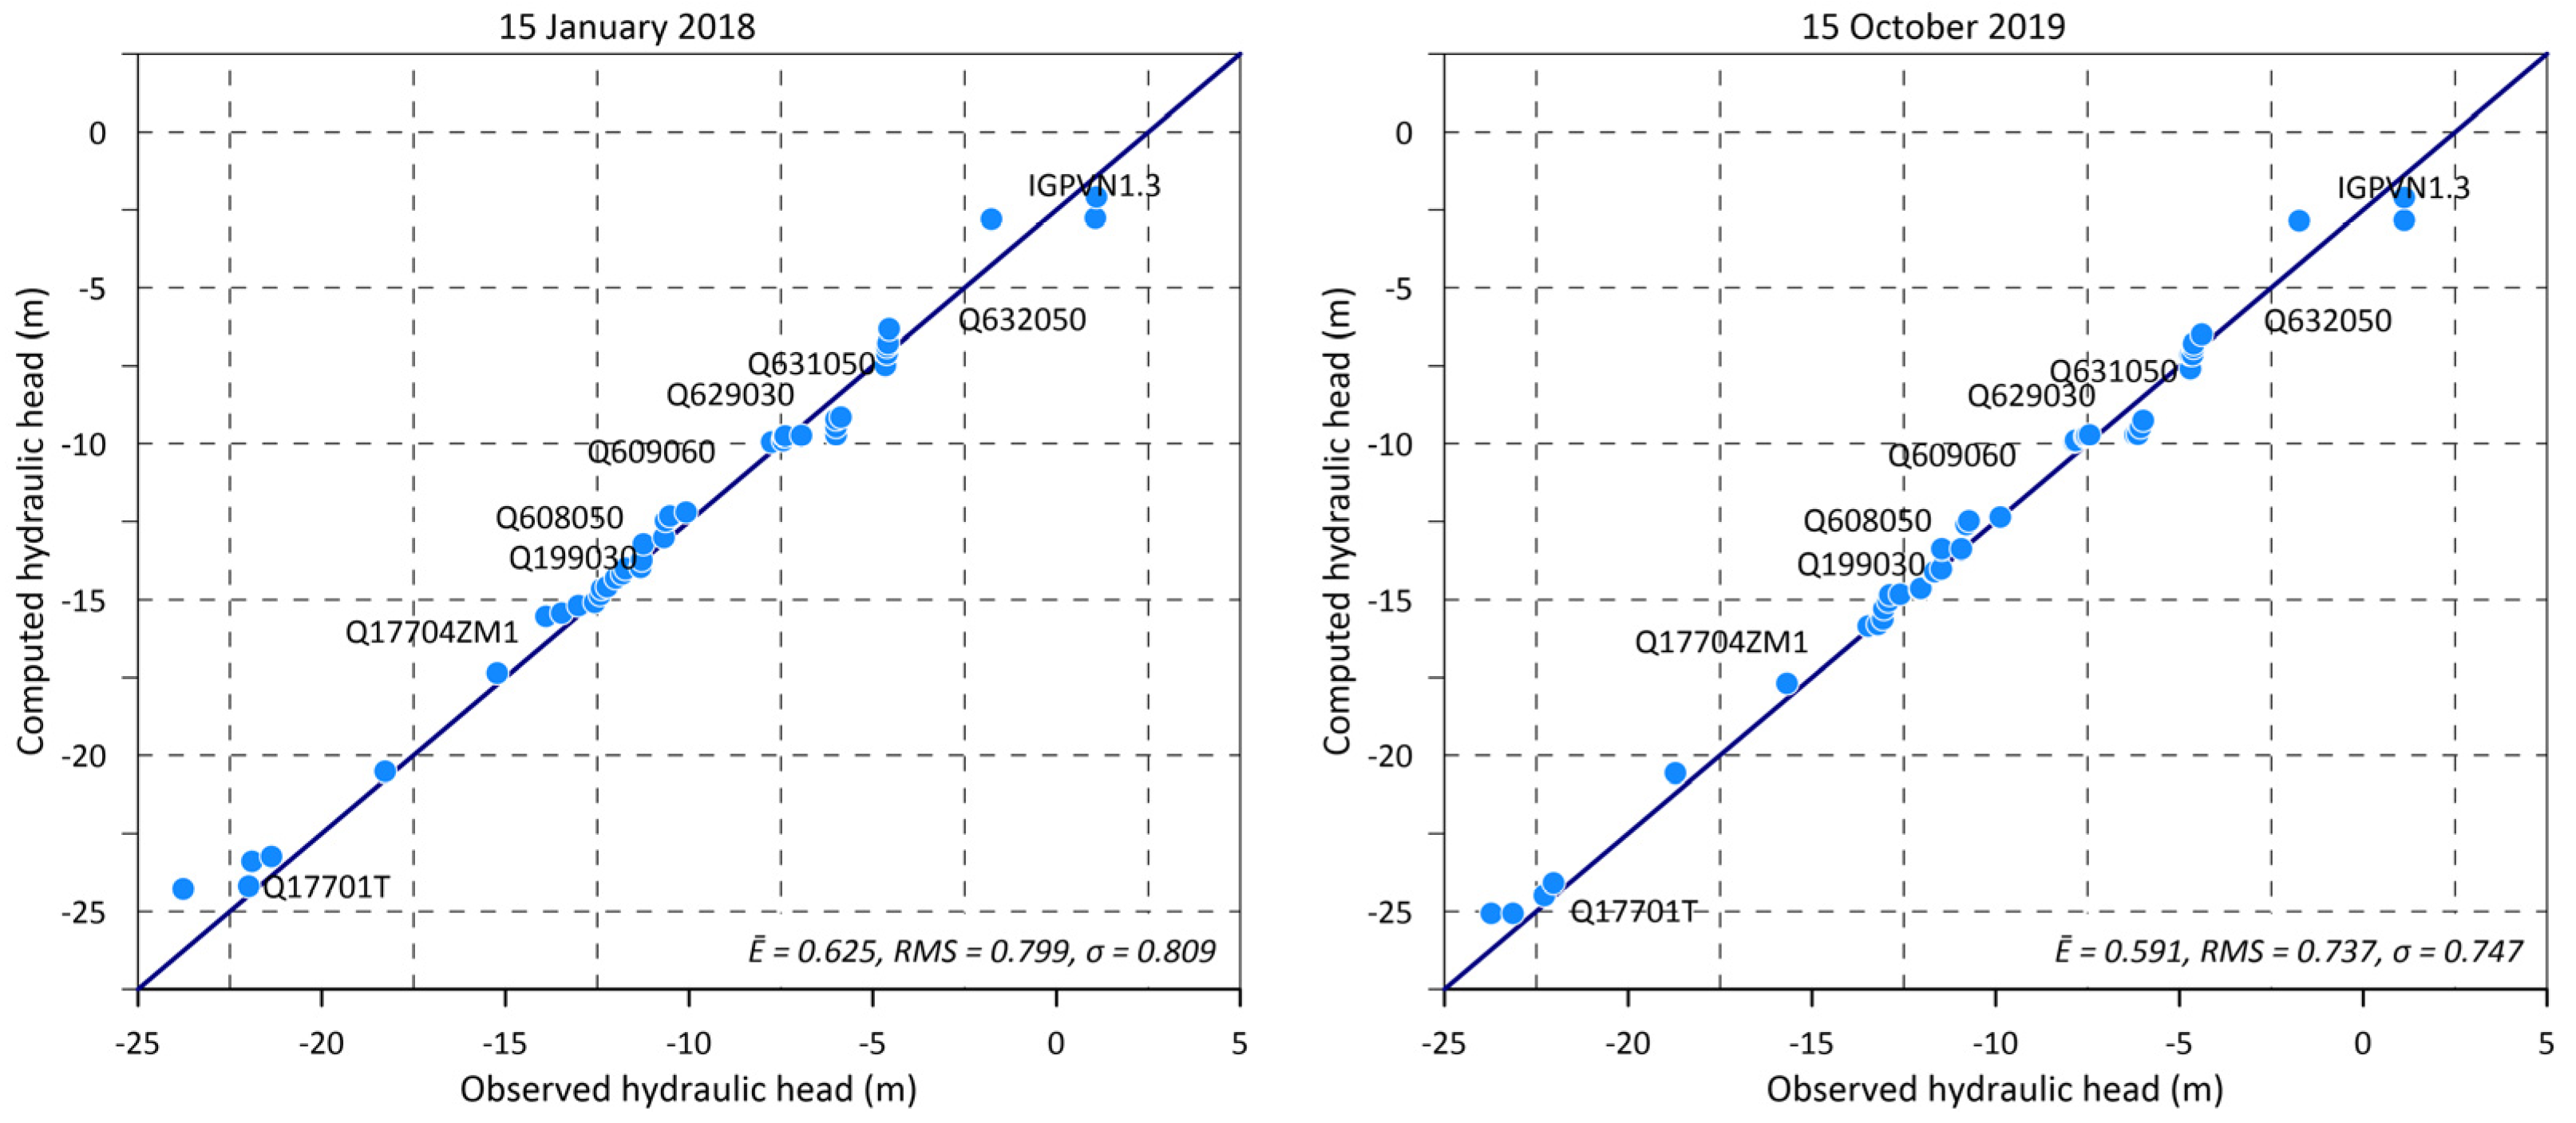
A usual model test in groundwater modeling can be performed using scatter data plots. These are shown for 46 monitoring wells for two different time steps in
Figure 8. In addition to this, the 1:1 line is shown. For January 2018 (dry period) and October 2019 (rain period), values are shown for all the aquifers. The computed hydraulic head is consistent with the measured data. The absolute error E, the root mean square (RMS), and the standard deviation (sigma) values are very small; the correlation coefficient is very high in both cases.
Another methodology for testing the model in space is the use of groundwater isohypses, which were used within the error between the measured and calculated hydraulic head points for different well groups. A confidential error of 1.5 m is chosen to verify the quality of model, taking into account the fluctuations of groundwater level during the day and the influence of tides. The difference due to these influences is about 1.5 m and can be up to 2.5 m [
14].
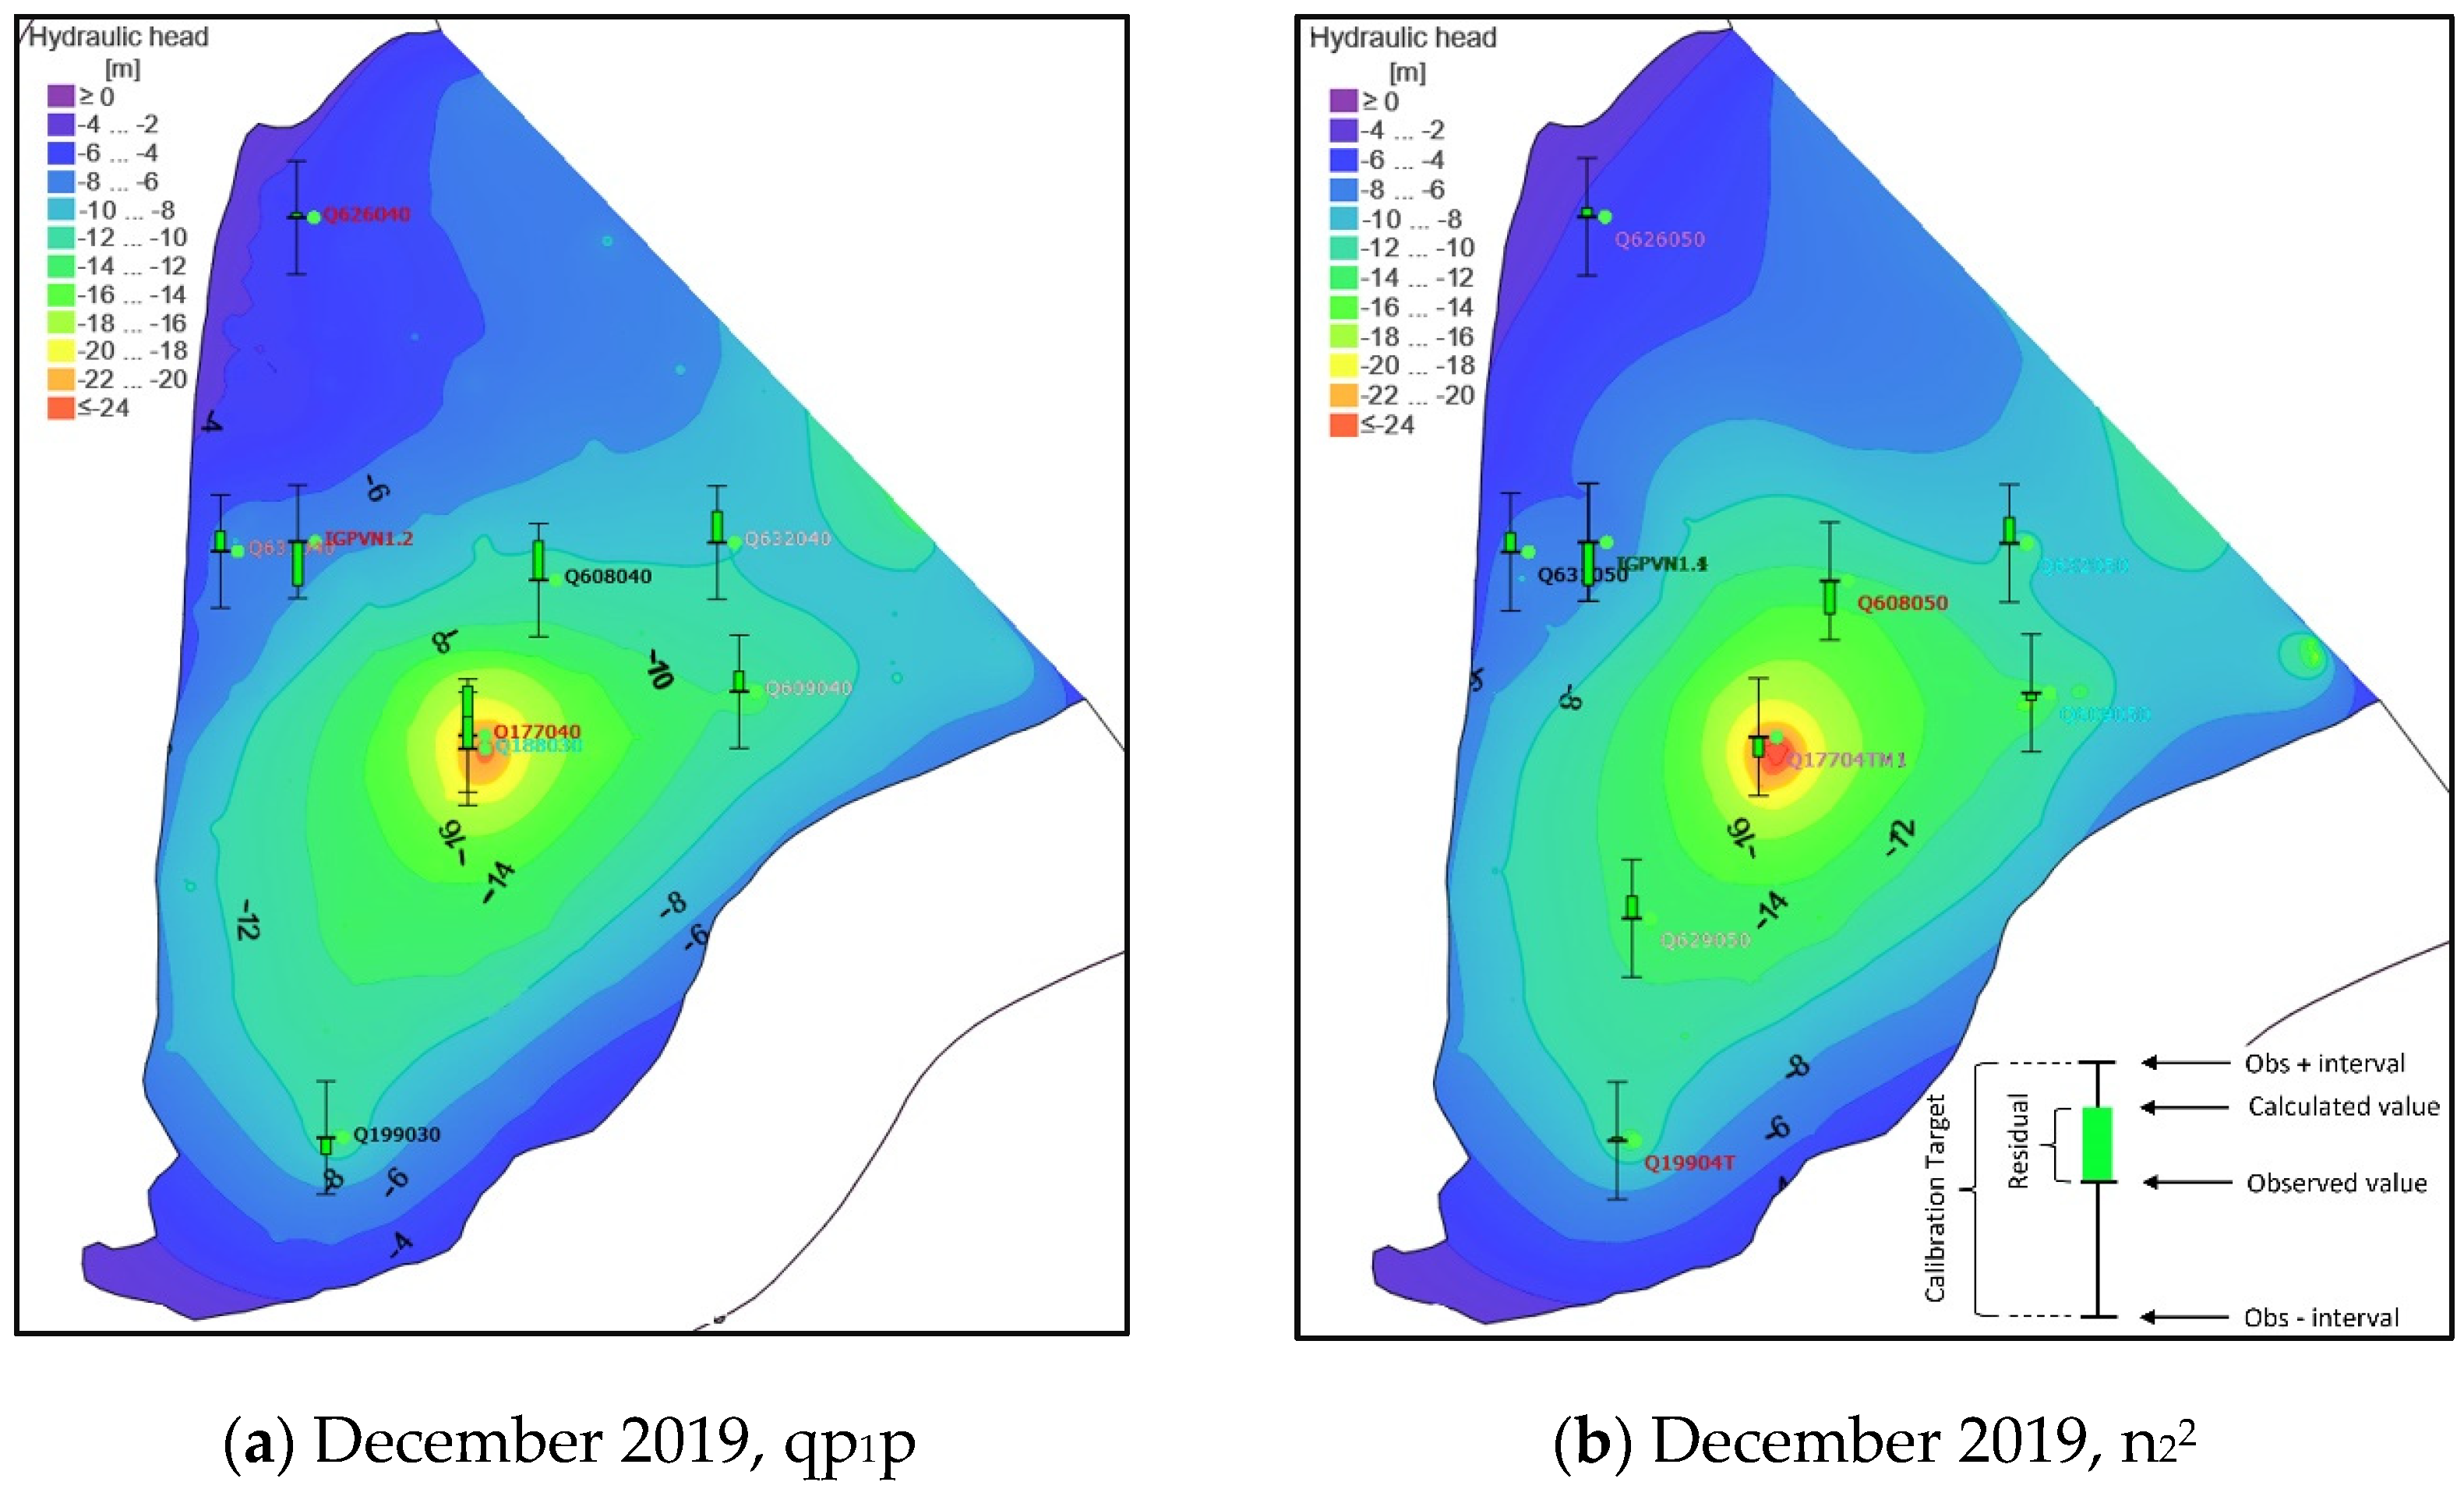
In
Figure 9, the simulated hydraulic heads from December 2019 for qp
1 and n
22 are shown. The green marked error bars show the confidential error for observation wells, and the center of the target corresponds to the observed value. From the isohypses, the continuous hydraulic head in space is shown. The deepest hydraulic heads for both aquifers are shown in the city of Ca Mau, caused by large pumping rates. With a longer period calibrated, Q177 has an important role in the groundwater-monitoring network in the city of Ca Mau with large exploitation.
In
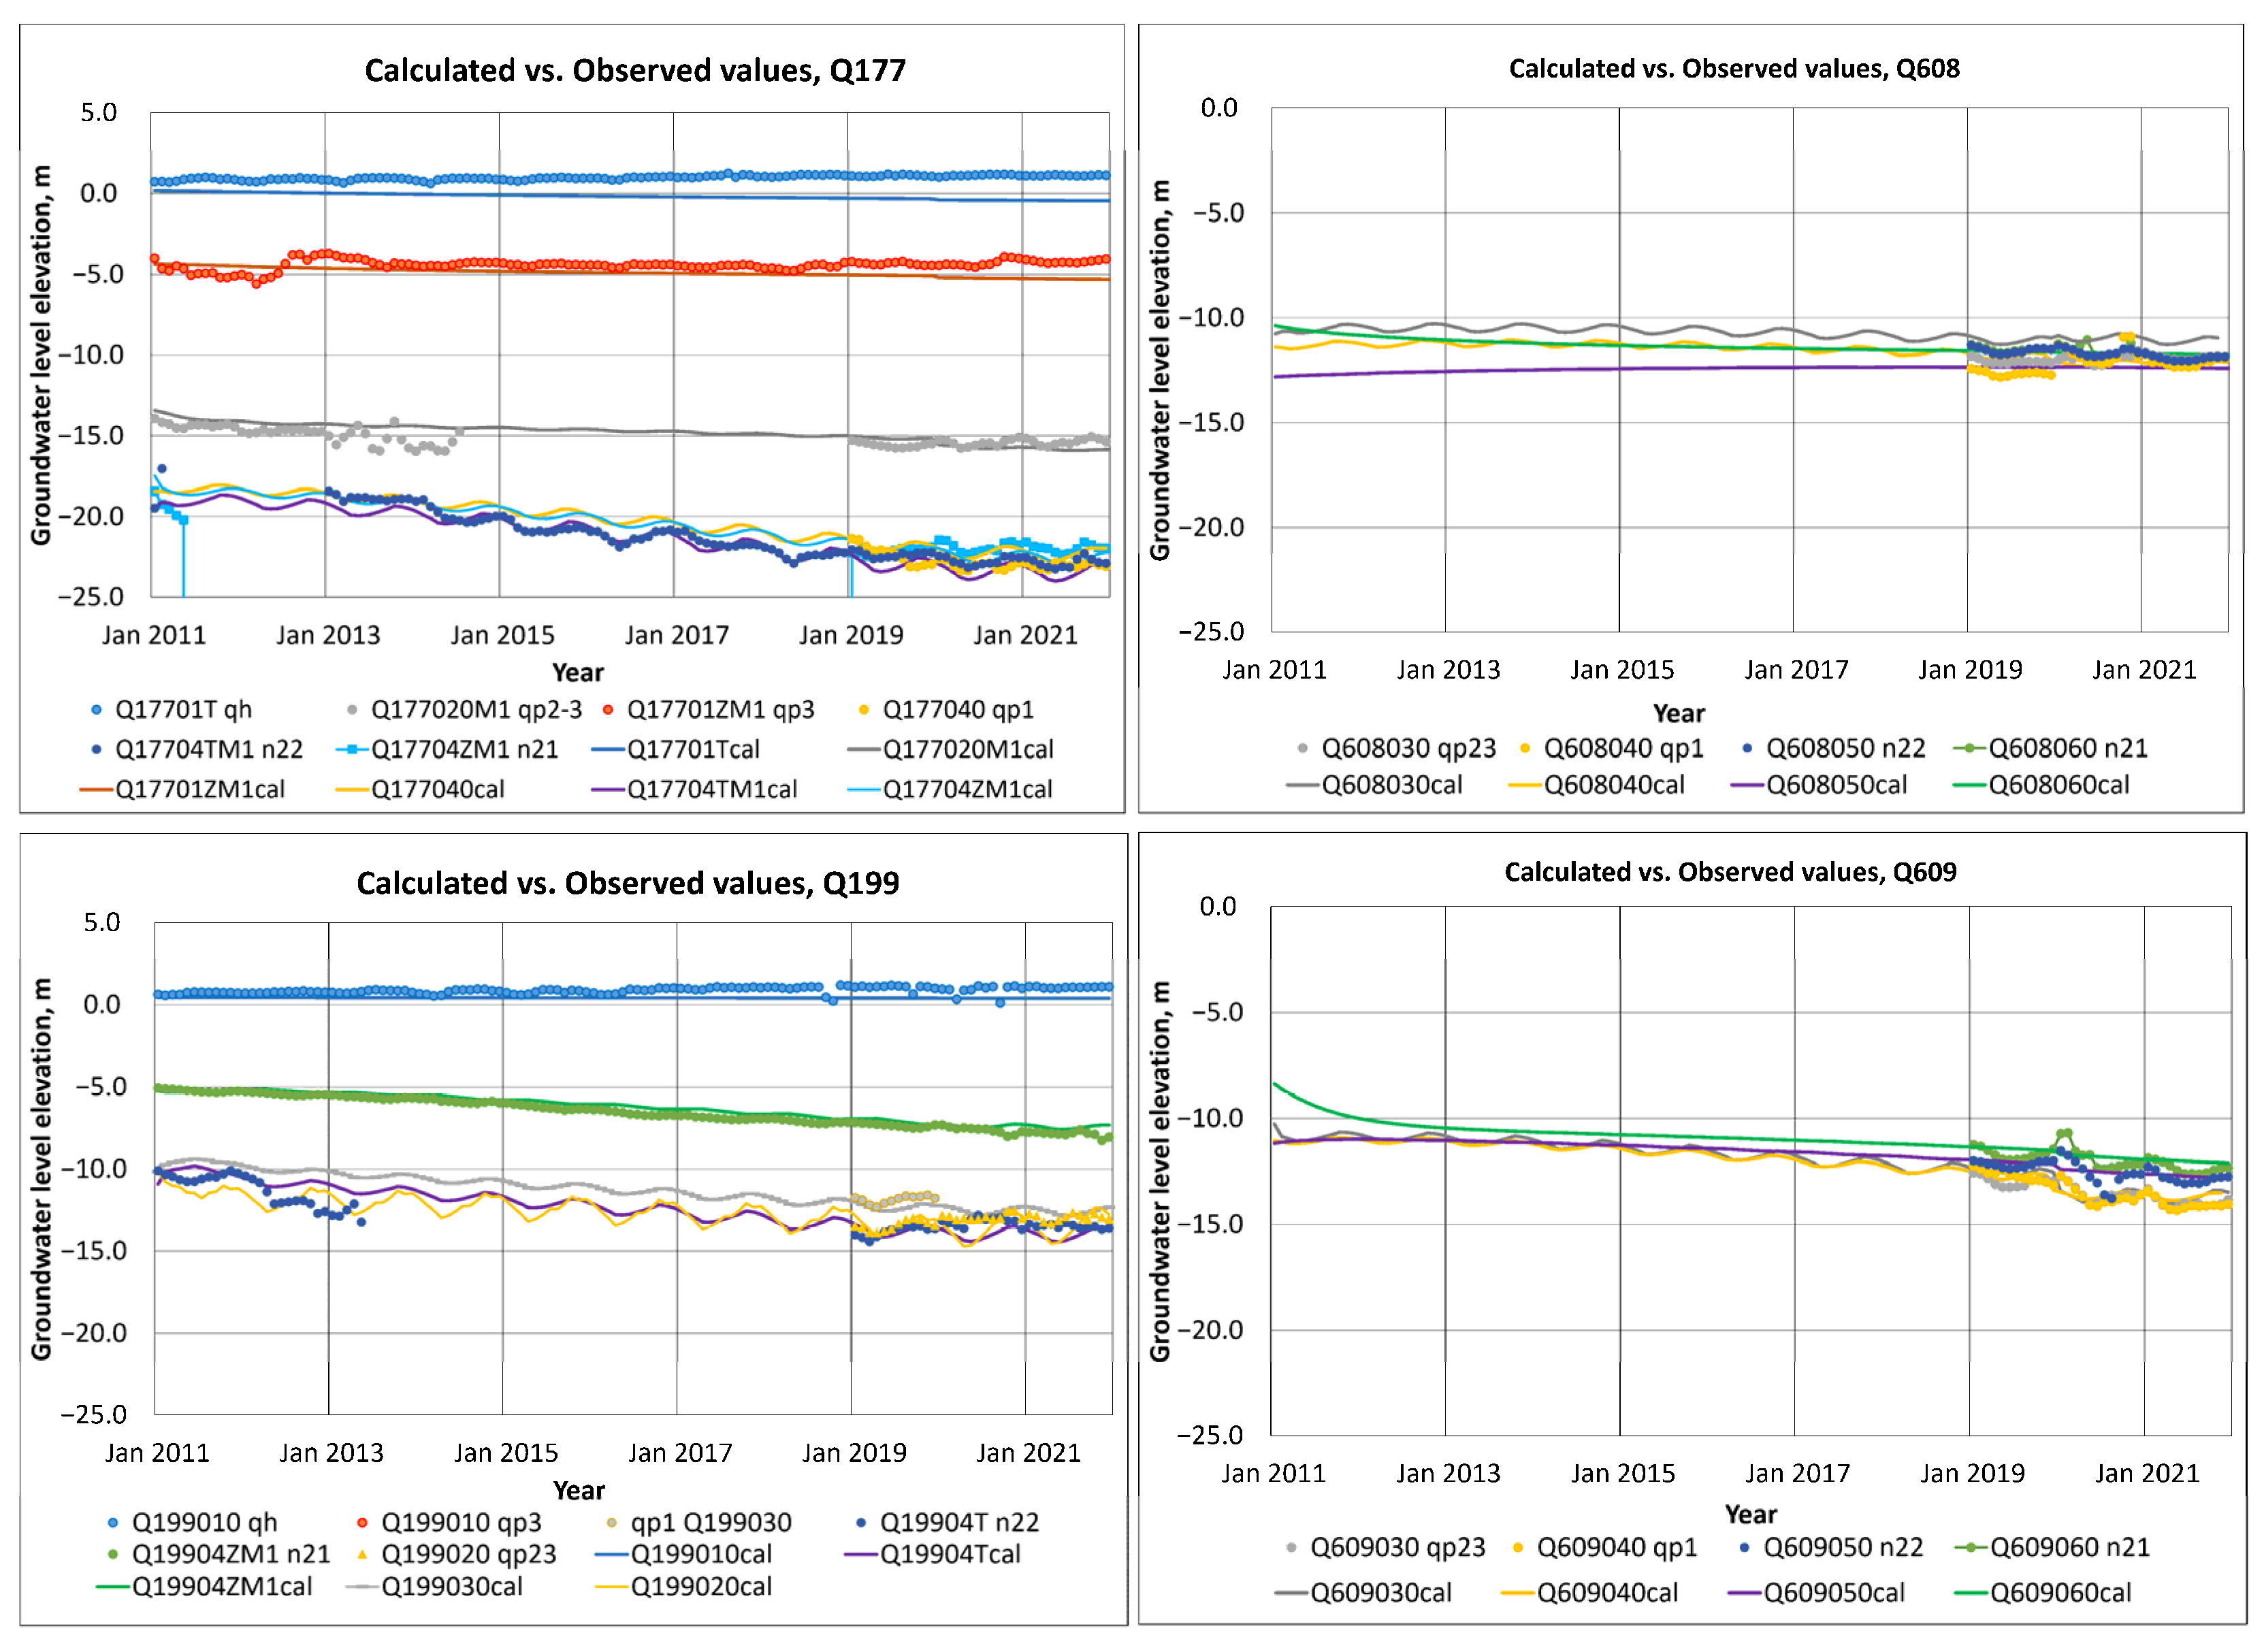
Figure 10, the monthly measured and calculated groundwater levels are shown as a time series. Q177 and Q199 (
Figure 10, left side) show the measured and calculated values with the best fits in the model. The aquifers qh and qp
3 show that the fluctuation of the water level tends to be stable, while the qp
1 and n
22 layers are influenced by groundwater exploitation and the dry and rainy seasons of the MKD.
Figure 10 (right side) shows simulated (Q608 and Q609) groundwater level trends and captures the groundwater system behavior for a one-year validation period in the complicated exploitation setting.
As a common result of the criteria detailed in the beginning of
Section 5, the system behavior described for the hydraulic head is accepted in a confidence-building view of model validation, because the calculated hydraulic head is validated against point measurement hydraulic head data in time and space. This leads to the second criterion for the operational view of model validation, “that a good, correct, or sufficient representation of reality” in time and space (
Figure 9 and
Figure 10) can be assumed. Moreover, according to the scientific view of validation, which is mentioned above, the authors considered the model as acceptable, considering the knowledge of the hydrogeological situation in the Ca Mau peninsula.
5.2. Valuation of Groundwater Balance
Another important model of quality control is the groundwater balance, which should be plausible. According to the different mentioned criteria for model validation, only the operational and scientific view of model validation occurred, given the fact that underground flow along huge boundaries could not be measured. In
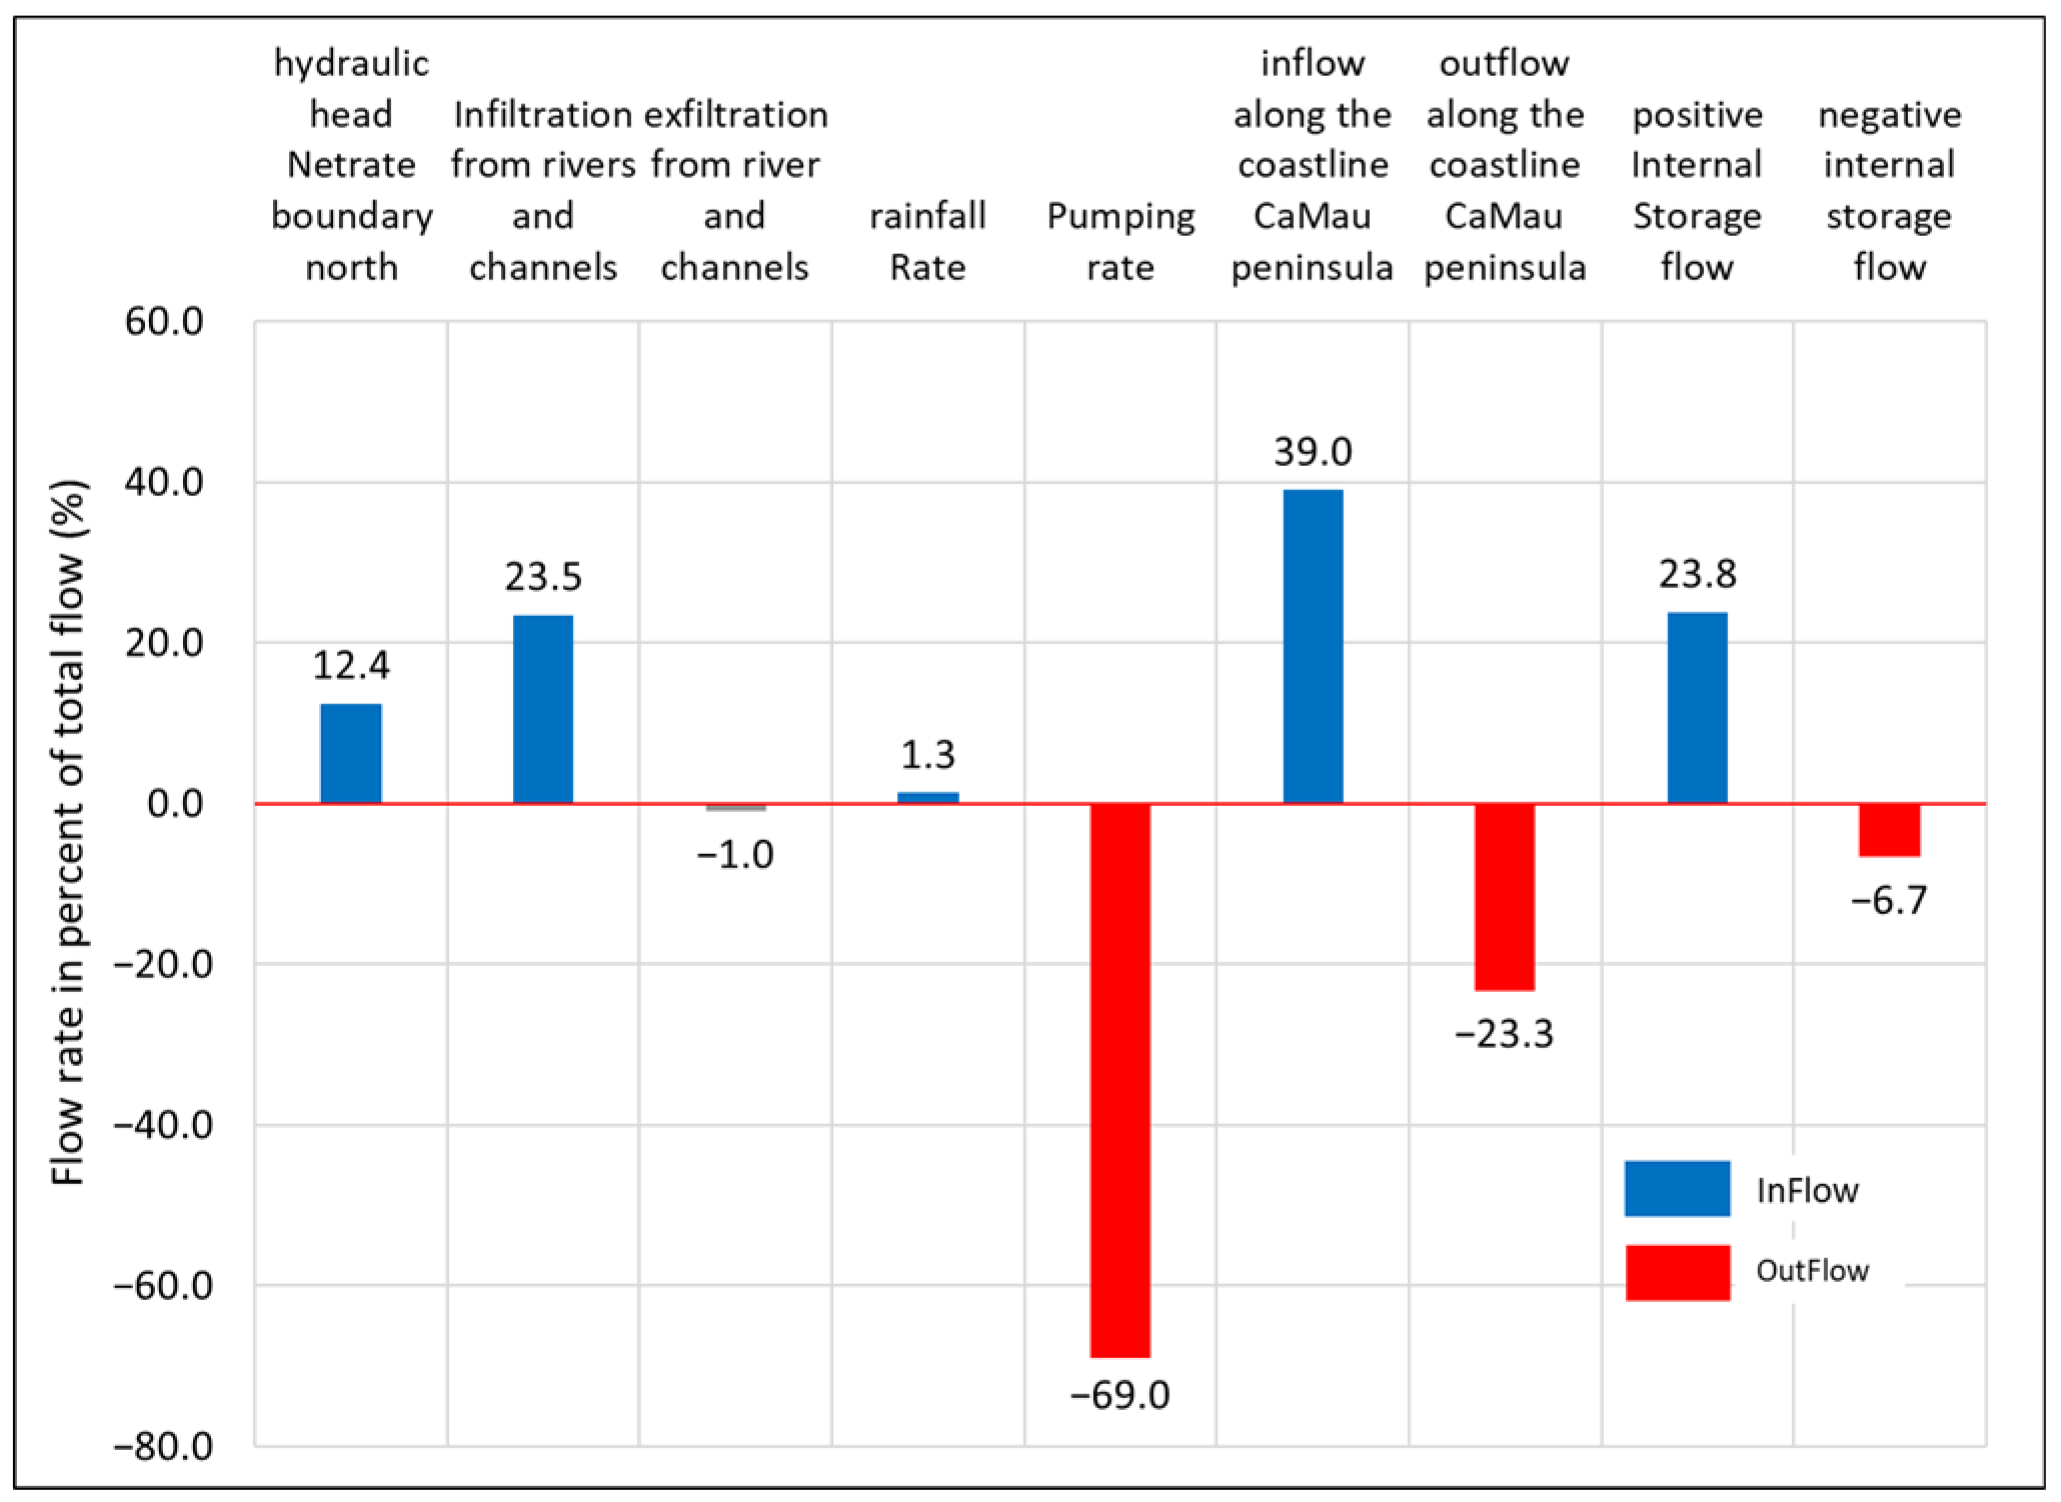
Figure 11, the different components are shown for the Ca Mau peninsula. The overall averaged
total sum (January 2011 to December 2019) in the Ca Mau peninsula is 742,876 m
3/day, and the
total sum out is 742,979 m
3/day. The parts of the different components are shown in
Figure 11. The
flow in from the hydraulic head net rate boundary north (see
Figure 6) is about 12%, and the inflow along the coastline of the Ca Mau peninsula is about 39%. One important part (approximately 23%) is also the exfiltration from the huge river and channel system. The interaction takes place in the two upper layers. The rainfall (or groundwater recharge) is negligible. Nearly 24% of the
total sum is part of the positive internal storage flow inside the Ca Mau peninsula.
The biggest export out of the model area is the pumping rate, with 69% of the total outflow; approximately 23% is the total outflow flow rate along the coastline of the Ca Mau peninsula into the sea. The exfiltration from the river and channel system is negligible. The negative internal storage flow inside of the model is about 6.5% of the total outflow. To sum up these results, exploitation takes place in the deeper aquifers with nearly 70% of the flow. The filling up of the groundwater system is caused by the positive hydraulic head net rate boundary north, the infiltration from the channel system, and the inflow along the coastline of the Ca Mau peninsula from the ocean, especially for the upper aquifers.
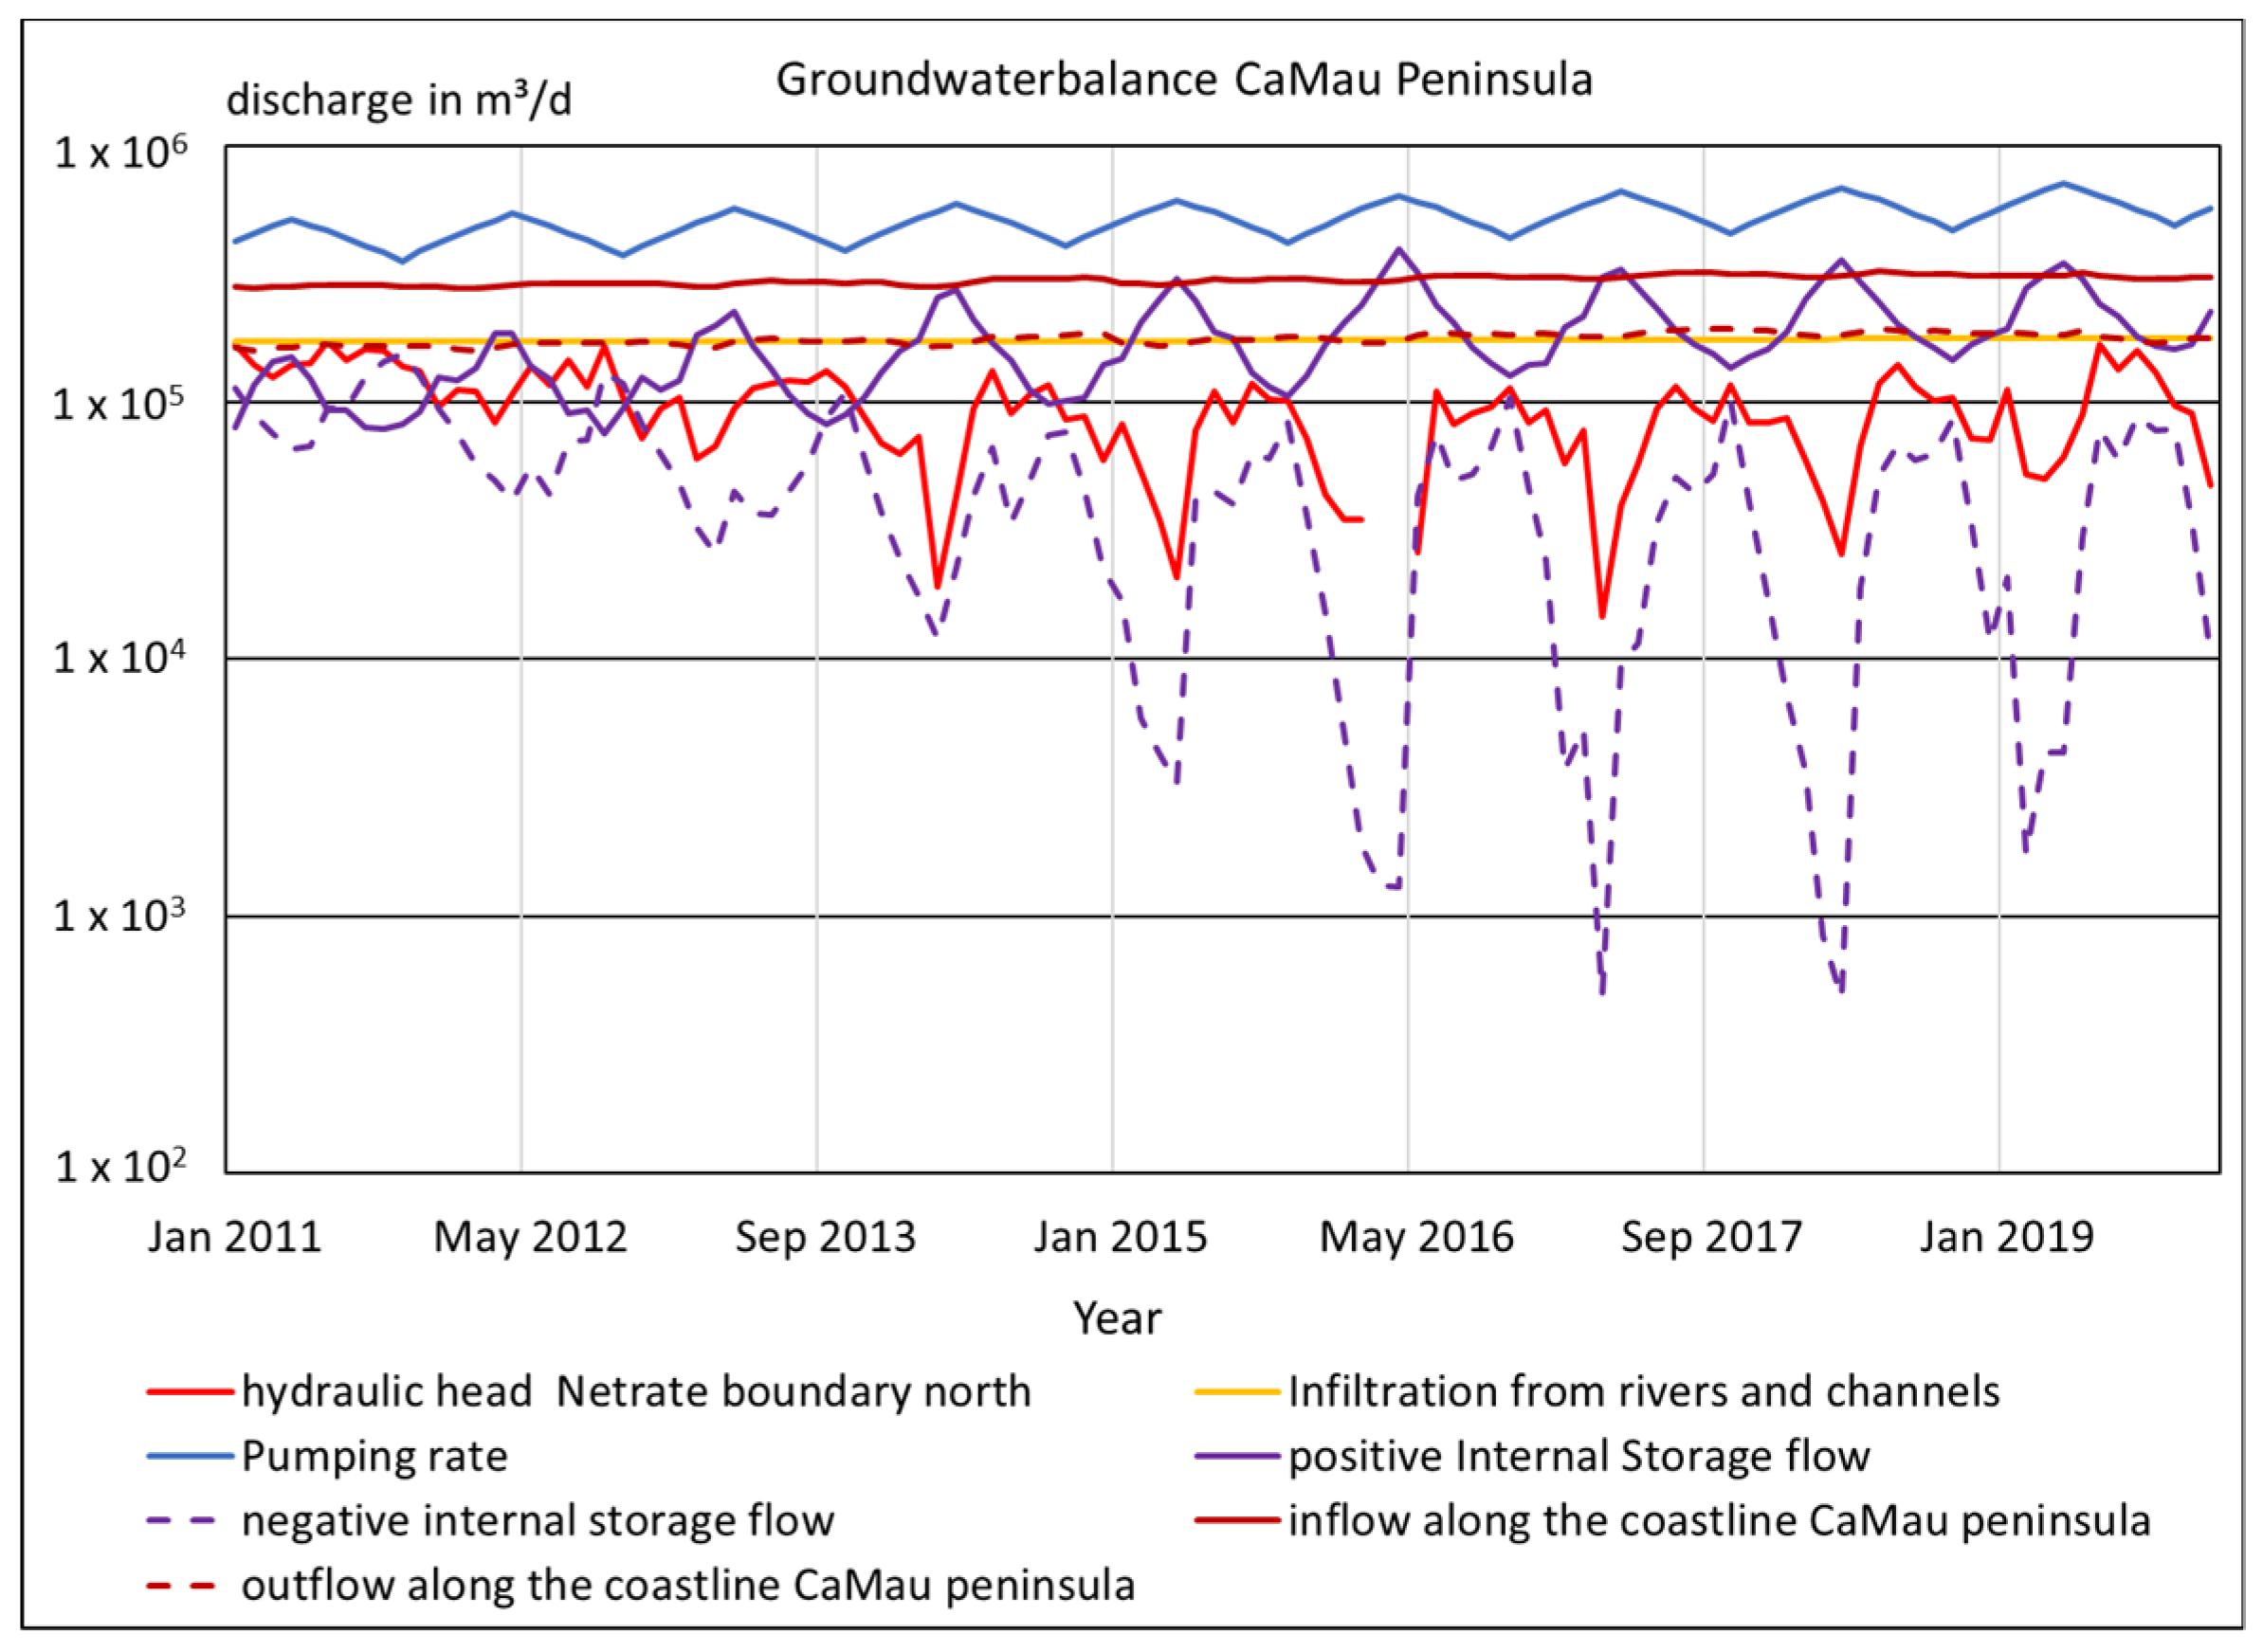
The overall analysis of the groundwater components can be seen on a timescale with variation from January 2011 to December 2019 in
Figure 12. There are notable differences in the components. The vertical axis is shown on a logarithmic scale. The most significant component is the pumping rate, within a seasonal variation and an increase from 2011 to 2019. The inflow along the coastline of the Ca Mau peninsula is nearly constant. The hydraulic head net rate boundary north inflow has a high interannual variation, mostly caused by pumping along the northern boundary. In addition, the exfiltration from the river and channel system is assumed constant. There is an interannual variation in the storage, as shown in positive internal storage flow and negative internal storage flow within an increase in the maximum and minimum in the past nine years, which is also caused by pumping.
To conclude, the knowledge of the components of the groundwater balance and their seasonal variation is highly important for groundwater management. Thus, the groundwater balance is considered acceptable from the scientific view of model validation, given the authors’ detailed hydrogeological knowledge of the Ca Mau peninsula based on previous studies [
9,
12,
13,
32]. The groundwater balance is not mentioned in any known publication.
5.3. Valuation of Hydraulic Conductivity
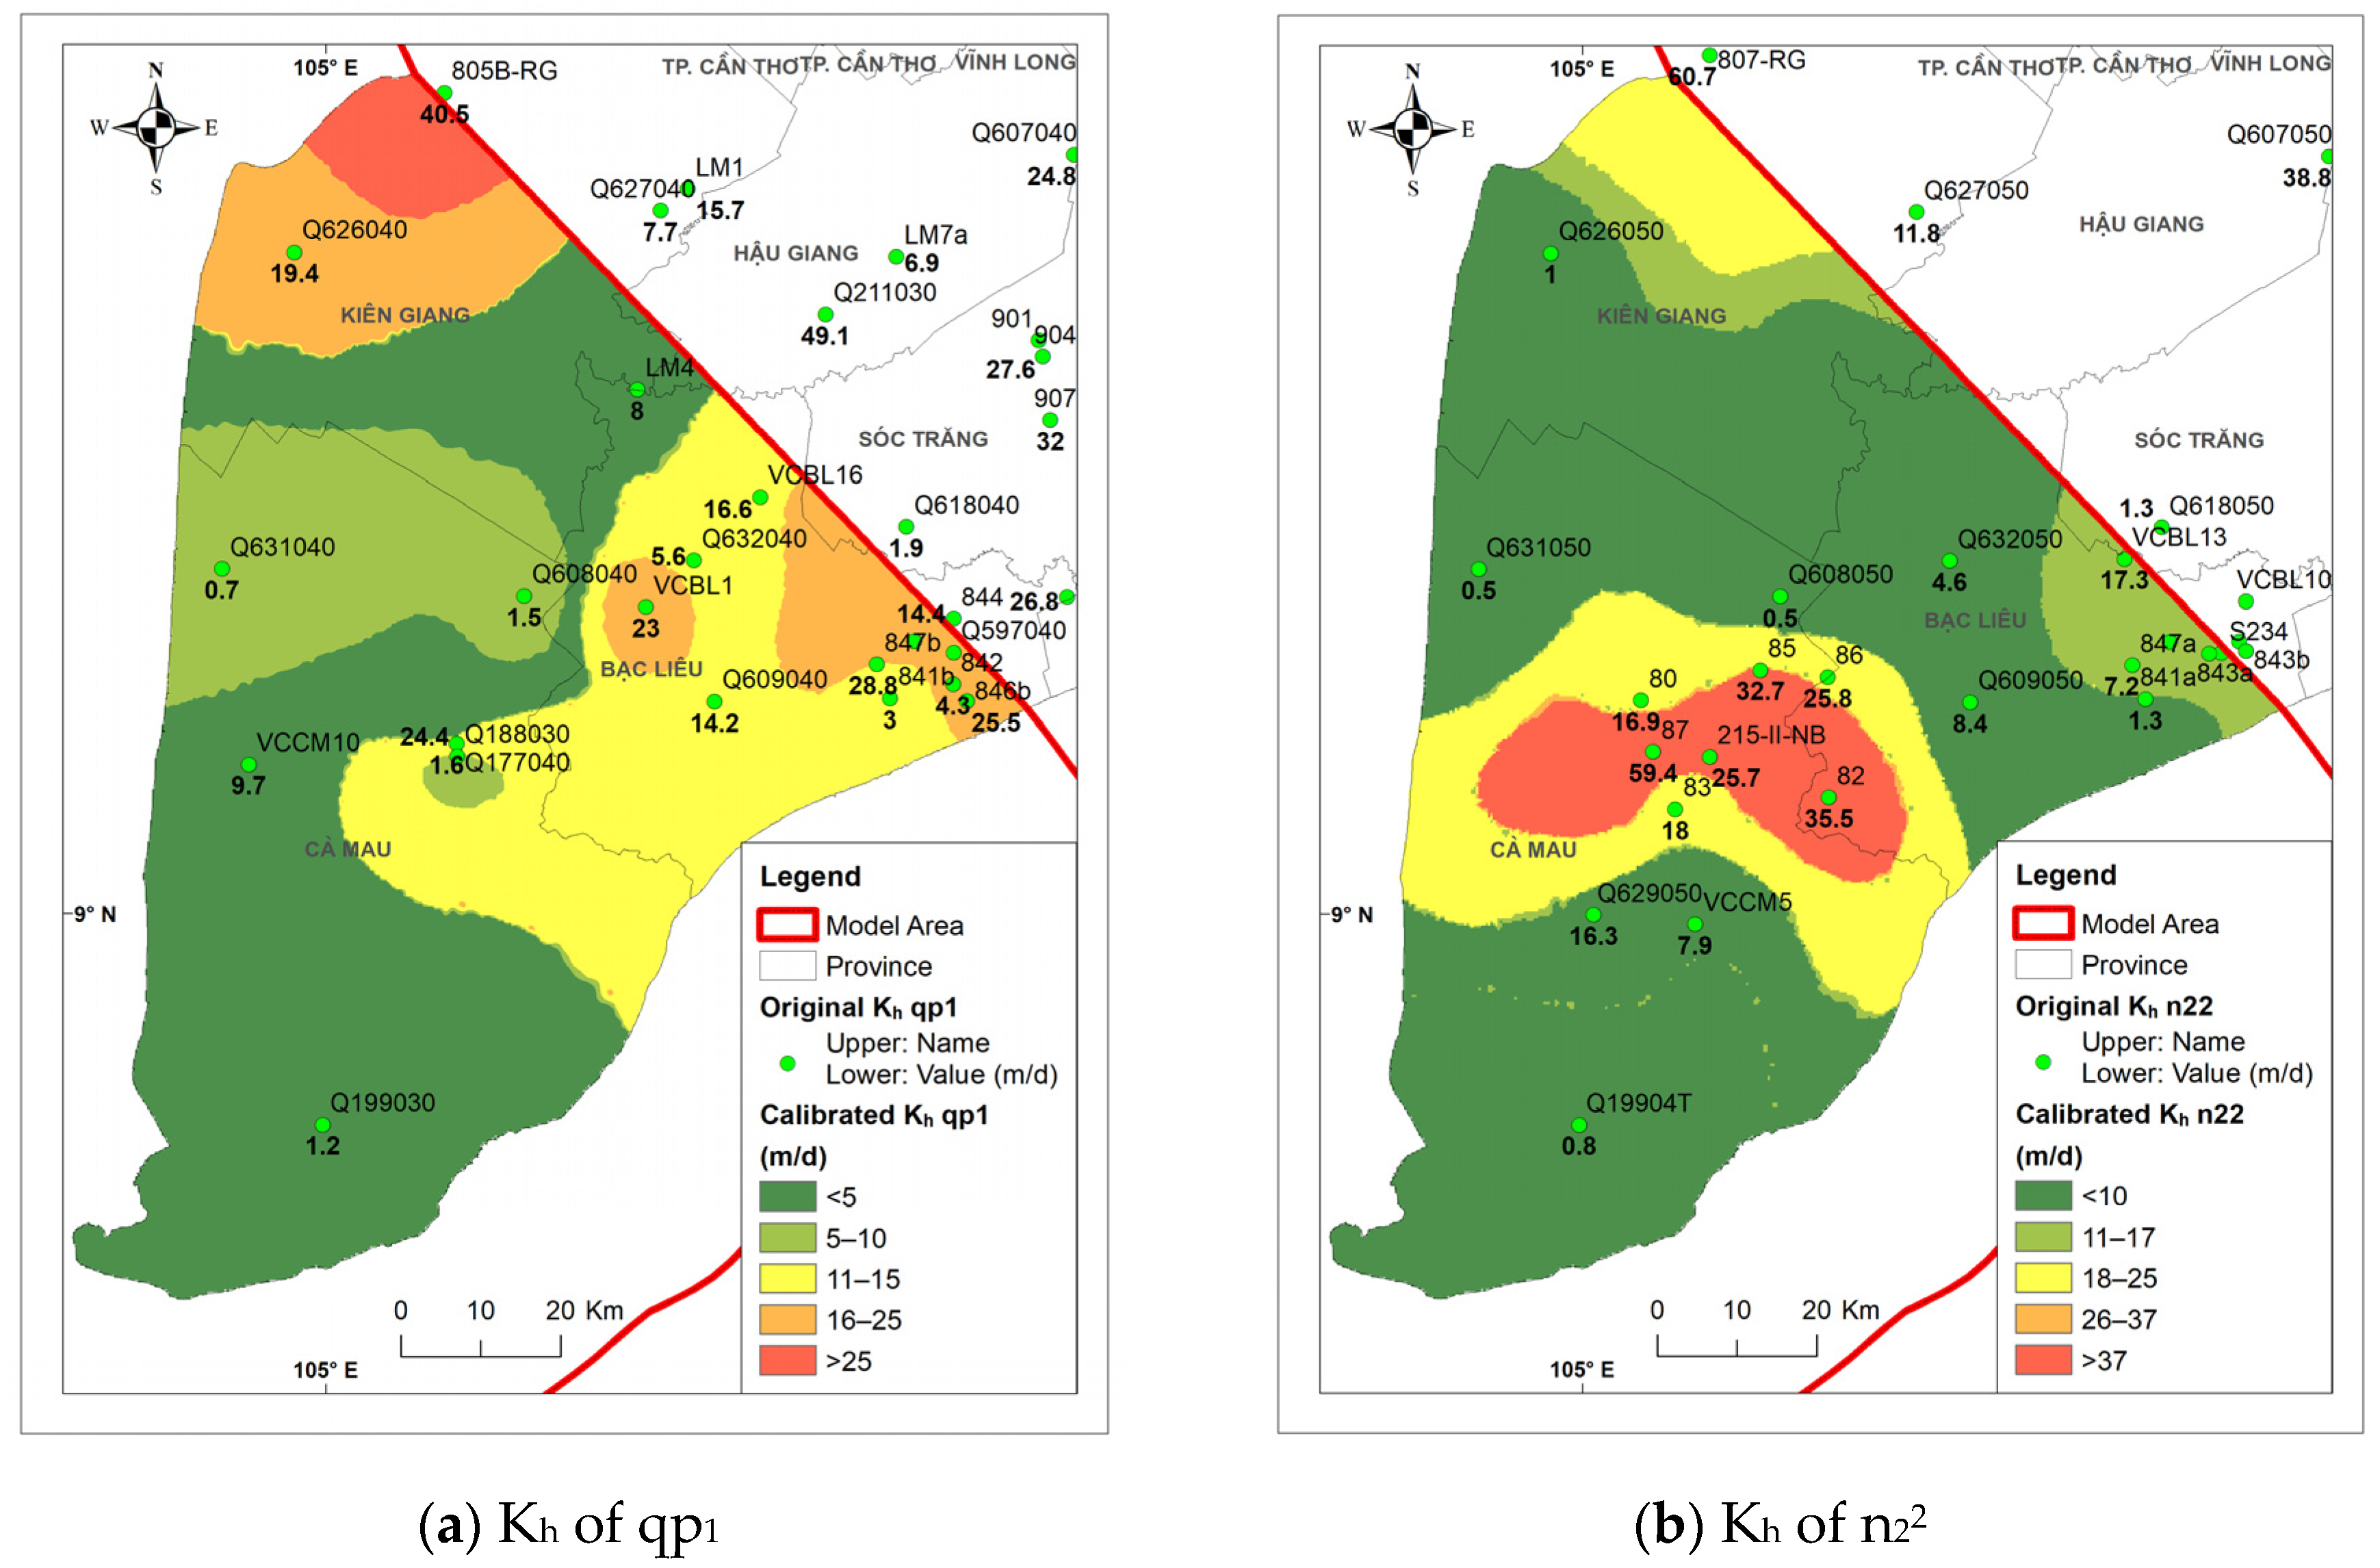
Another possible method of validating the hydrogeological model is comparing the “measured hydraulic conductivities” with the “calibrated hydraulic conductivities”. As an example, the results for the aquifers n
22 and qp
1 are shown in
Figure 13.
For the aquifer qp1, the horizontal hydraulic conductivity (Kh) varies between 1.0 and 40 m/day. The highest Kh is located in the northwest in Kien Giang province. The regions with Kh higher than 25 m/day are located at the northern border. The regions with lower Kh (green regions) stretch from the middle of the northern border along the west coast, including the southern part of the Ca Mau peninsula. The comparison of the measured K to the calibrated K shows an overall good correlation.
For the aquifer n22, the Kh varies between 1.0 and 60 m/day. The highest Kh is located in the surrounding area of Ca Mau city. Moreover, the regions with a Kh higher than 37 m/day (red regions) are located here. The regions with lower Kh (green regions) are located in the north and in the south part of Ca Mau peninsula. Additionally, in this aquifer, the comparison of the “measured K” to the calibrated K shows an overall good correlation.
Shrestha et al. [
32] and Nguyen et al. [
7] developed groundwater models for the whole MKD and the Tay Island Region (Dong Thap province). The calibrated hydraulic conductivities used in these models are presented in
Table 3 together with those of this study. The values for the K for groundwater layers qh, qp
3, qp
2–3, qp
1, and n
13 of Shrestha et al. [
32] are similar to those of the recent presentation. The K values from Nguyen et al. [
7] are smaller for all aquifers because of limited hydrogeological data collected for the small study area. Both authors did not present a spatially distributed comparison of calibrated and measured K.
6. Discussion
The results presented in this paper are discussed according to the following questions:
The first question is important when considering model calibration and model uncertainty. As described in
Section 5.2, the groundwater model is calibrated assuming the correctness of the estimated pump rates. Thus, the pump rates (approved by the maximum delivery quantities of the licensed abstraction wells) have an influence on the hydrogeological model parameters of permeability coefficient and storage coefficient. In order to validate the used pumping rates inside the groundwater model, we compared different literature sources for the groundwater exploitation (
Table 4).
To compare the used pumping rates (
Table 2), a plausibility check of the pumping rates can be performed using the daily water consumption per inhabitant. These results vary between 108 L/person/day in [
13] and 297 L/person/day in the BGR Report 2017 [
19] for 2010. In the model presented here, a water consumption rate of 144 L/person/day was used.
The current average urban water use standard (including water loss) is 100 L/person/day; it was 120 L/person/day in 2015 and 130 L/person/day in 2020 and will be 130 L/person/day in 2025 [
8].
The total sum of groundwater exploitation for industrial use in Ca Mau province was estimated by DWRM to be approximately 13,000 m
3/day in 2014 [
8]. This means an amount of approximately 10 L/person/day (13,000 m
3/1,217,822 persons). For the year 2010, the estimation for the unlicensed wells was (1/3 of 100 L/person/day = 34 L/person/day). These three components are summed as follows:
+ 100 L/person/day (from statistics)
+ 10 L/person/day (industrial use)
+ 34 L/person/day from unlicensed wells
= 144 L/person/day from Ca Mau that is used in the actual model.
Comparable values for industrial water use exist in DWRM [
8] for Bac Lieu (15 L/person/day), Kien Giang (4 L/person/day), Soc Trang (20 L/person/day), and Hau Giang (2.5 L/person/day).
The total flow of groundwater exploitation in 2019 in the study area was 567,364 m3/day. The groundwater flow is unevenly exploited in the study area as well as in the aquifers, depending on the real pumping location. The most exploited aquifers are qp2–3, and n22, accounting for 63.7% and 29.7%, respectively; other significantly exploited aquifers are qp1 and n21, accounting for 5.9% and 0.3%, respectively.
Table 5 shows the results of calculating the horizontal net flow transfer in cubic meters per day, which mainly occurred from the sea, and the net flow transfer in cubic meters per day from the upper and lower aquitards. For the aquifers qp
2–3 and n
22, with the largest pumping rates, the horizontal and vertical net flows are the biggest (q
h = 39,000 m
3/day and q
v = 49,892 m
3/day for qp
2–3 and q
h = 27,100 m
3/day and q
v = 36,464 m
3/day for n
22), because these are the ones exploited the most in the study area. The vertical and horizontal net flows in the deepest aquifer, n
13, are the smallest.
The change in storage is only negative in the aquifers qp2–3 and n22, with the highest exploitation rate. In the other aquifers, the change in storage is positive.
The storage changes in layers 1 and 2 (Q2 and qh) are positive. These shallow aquifers are important layers in the system of aquifers in the Ca Mau peninsula and receive recharge from rainfall as well as leakage from rivers and channels.
The model shows that the groundwater level decline is mainly due to an increase in the pumping rate. However, the groundwater level from qh and qp
3 aquifers mostly tended to stabilize (
Figure 10). For the time of the model run, from January 2011 until December 2019, the flow of unregistered extraction wells in the aquifer qp
2–3 increased in total by 23%. The pumping rate of licensed exploitation wells in the n
22 aquifer increased in total by 61% (
Table 2). The assumed pumping rates show a realistic estimate for the water exploitation in the Ca Mau peninsula.
In this study, the first groundwater balance for the Ca Mau peninsula is published in detail for the total area. The results are available for all aquifers. Unlike previous studies by Minderhoud et al. [
9,
10,
14], Vuong et al. [
13], and Shrestha et al. [
32], which mainly assessed land subsidence and climate change, this study focused on assessing water balance, using newly updated detailed data on groundwater extraction in the period from 2010 to 2018 and a higher number of nine monitoring points (46 monitoring wells all together). The use of homogeneity K for aquitards in previous studies [
13,
30] has limited the leakage of aquifers. The model area was only developed inland, so the coastal boundary conditions needed to be interpolated. All these results lead to an inaccurate water balance assessment. In contrast to the former studies mentioned in this paper, the aquitards are open in some regions, so that more realistic water exchange between aquifers is possible. Therefore, the model boundary was enlarged to 30 km outside of the mainland. No interpolation of the boundary conditions along the coastline was necessary. This led to a more realistic estimate of the groundwater balance.
According to the international standard of groundwater model validation (see
Section 5), the scientific, operational, and confidence-building views of validation are guaranteed in the presented groundwater model.
7. Conclusions
A new 3D hydrogeological structure groundwater model with the latest available information (hydrogeological information from 78 wells, pumping rates from nearly 700 licensed wells, and 40 wells for groundwater measurements) with a high-resolution triangular mesh was built.
The model was calibrated in a way that the differences between the measured and calculated hydraulic heads were consistent with the uncertainties of the measured heads. The increase in a more accurate calibration required additional changes to the K field. These changes led to a more realistic understanding of the hydrogeological situation in the Ca Mau peninsula.
The main aquifers qp1 and n22 supply groundwater to Ca Mau city, Kien Giang, and Bac Lieu, but the exploitation status increases rapidly. The increased exploitation is examined in a realistic way and validated against the water use of the inhabitants.
Due to the large exploitation volume of the study area (567,000 m3/day, 2019), recharge from outside the study area is not enough to compensate extraction, leading to declining groundwater levels.
In particular, this article calculated and analyzed the water balance according to the aquifers and identified the sources of reserves (inflow along the coastline, inflow from the north) between offshore and mainland areas.
The reserves were calculated based on the model. However, reserves include both saltwater and freshwater; this study has not calculated the total potential exploitable reserves of freshwater. In the next studies, these results will be confirmed by field studies as well as adapting a saline intrusion model.
These research results show that the model has contributed to promoting the development and innovation of water resources research using the finite element method. With the current exploitation, the groundwater level is continuing to tend to decrease. In addition, the inflow along the coastline to the mainland is 39% of the total inflow. Therefore, groundwater resource managers need to investigate the coastal saltwater sources in detail; develop an early warning system for depletion and saltwater intrusion; protect zones and reduce groundwater exploitation; and increase the use of other water sources, such as artificial groundwater recharge, rainwater harvesting, using surface water, and transporting water from other places, as alternatives to groundwater.
Author Contributions
Conceptualization, T.V.H., S.N. and K.-G.R.; methodology, T.V.H., K.-G.R., N.B. and J.B.; software, DHI WASY; validation, formal analysis, and investigation, T.V.H. and K.-G.R.; resources, N.T.H. and S.N.; writing—original draft preparation, T.V.H. and K.-G.R.; writing—review and editing, T.V.H., S.N., K.-G.R., N.T.H., N.B. and J.B.; supervision, S.N. and N.T.H.; funding acquisition, S.N. All authors have read and agreed to the published version of the manuscript.
Funding
This work is part of the ViWaT Engineering project, funded by the German Federal Ministry of Education and Research (BMBF) under grant No. 02WCL1474A/E. Additional financial support was provided by the Catholic Academic Exchange Service (KAAD) and the Karlsruhe Institute of Technology (KIT).
Institutional Review Board Statement
Not applicable.
Informed Consent Statement
Not applicable.
Data Availability Statement
The data provided in this paper are available on the request from the corresponding author. A permission letter (18.3.2022) from NAWAPI for collecting 78 hydrogeology profiles, surface water profiles, rainfall data, surface water level data, and water exploitation data is available.
Conflicts of Interest
No conflict of interest.
References
- Tessler, Z.D.; Vörösmarty, C.J.; Grossberg, M.; Gladkova, I.; Aizenman, H. A global empirical typology of anthropogenic drivers of environmental change in deltas. Sustain. Sci. 2016, 11, 525–537. [Google Scholar] [CrossRef] [PubMed] [Green Version]
- Higgins, S.A. Review: Advances in delta-subsidence research using satellite methods. Hydrogeol. J. 2016, 24, 587–600. [Google Scholar] [CrossRef]
- Ericson, J.P.; Vörösmarty, C.J.; Dingman, S.L.; Ward, L.G.; Meybeck, M. Effective sea-level rise and deltas: Causes of change and human dimension implications. Glob. Planet. Chang. 2006, 50, 63–82. [Google Scholar] [CrossRef]
- General Statistics Office of Vietnam. Available online: https://www.gso.gov.vn/ (accessed on 9 February 2021).
- Marchesiello, P.; Nguyen, N.M.; Gratiot, N.; Loisel, H.; Anthony, E.J.; Dinh, C.S.; Nguyen, T.; Almar, R.; Kestenare, E. Erosion of the coastal Mekong delta: Assessing natural against man induced processes. Cont. Shelf Res. 2019, 181, 72–89. [Google Scholar] [CrossRef]
- Tong, P.H.S.; Auda, Y.; Populus, J.; Aizpuru, M.; Al Habshi, A.; Blasco, F. Assessment from space of mangroves evolution in the Mekong Delta, in relation to extensive shrimp farming. Int. J. Remote Sens. 2004, 25, 4795–4812. [Google Scholar] [CrossRef] [Green Version]
- Nguyen, T.T.; Tsujimura, M.; Naoaki, S. Groundwater Flow Modeling: Considering Water use in Tay Island, Dong Thap Province, Southwest Vietnam. Procedia Environ. Sci. 2013, 17, 211–220. [Google Scholar] [CrossRef] [Green Version]
- Department of Water Resources Management (DWRM). Statistical and Assessment of the Current Status of Groundwater Exploitation in the Ca Mau Peninsula; Department of Water Resources Management (DWRM): Hanoi, Vietnam, 2014; unpublished.
- Minderhoud, P.S.J.; Erkens, G.; Pham, V.H.; Bui, V.T.; Erban, L.; Kooi, H.; Stouthamer, E. Impacts of 25 years of groundwater extraction on subsidence in the Mekong delta, Vietnam. Environ. Res. Lett. 2017, 12, 064006. [Google Scholar] [CrossRef]
- Minderhoud, P.S.J.; Middelkoop, H.; Erkens, G.; Stouthamer, E. Groundwater extraction may drown mega-delta: Projections of extraction-induced subsidence and elevation of the Mekong delta for the 21st century. Environ. Res. Commun. 2020, 2, 011005. [Google Scholar] [CrossRef]
- Bauer, J.; Börsig, N.; Pham, V.C.; Hoan, T.V.; Nguyen, H.T.; Norra, S. Geochemistry and evolution of groundwater resources in the context of salinization and freshening in the southernmost Mekong Delta, Vietnam. J. Hydrol. Reg. Stud. 2022, 40, 101010. [Google Scholar] [CrossRef]
- Erban, L.E.; Gorelick, S.M.; Zebker, H.A. Groundwater extraction, land subsidence, and sea-level rise in the Mekong Delta, Vietnam. Environ. Res. Lett. 2014, 9, 084010. [Google Scholar] [CrossRef]
- Vuong, B.T.; Chan, N.D.; Nam, L.H.; Bach, T.V.; Long, P.N.; Van Hung, P. Report on Construction of Model of Groundwater Flow and Models of Saline—Fresh Groundwater Interface Movement for Mekong Delta. HoChiMinh 2014, unpublished. [Google Scholar]
- Minderhoud, P.S.J.; Coumou, L.; Erban, L.E.; Middelkoop, H.; Stouthamer, E.; Addink, E.A. The relation between land use and subsidence in the Vietnamese Mekong delta. Sci. Total Environ. 2018, 634, 715–726. [Google Scholar] [CrossRef] [PubMed]
- Thu, T.H.; Trung, N.N.; Minh, L.H.; Van Manh, V. Application of hydrogeological modelling methods in forecasting seawater intrusion of Pleistocene aquifer in Thai Binh area. In Proceedings of the 28th EnviroInfo 2014 Conference, Oldenburg, Germany, 10–12 September 2014. [Google Scholar]
- Van Hoan, H. Research Groundwater Salinization Quaternary Sediments in Nam Dinh Area. Hanoi, Vietnam. 2014; unpublished. [Google Scholar]
- Trung, D.T. Report ‘Study and Apply the Principle of Flow Depending on the Density of Water and SEAWAT Model to Assess and Predict the Salinization Process of Coastal Aquifers. Pilot in Soc Trang’ Province. Hanoi, Vietnam. 2015; unpublished. [Google Scholar]
- National Center for Water Resources Planning and Investigation (NAWAPI). Newsletter: Announcement, Forecast and Warning of Groundwater Resources in the Mekong River Basin. 2021. Available online: http://nawapi.gov.vn/index.php?option=com_content&view=section&layout=blog&id=8&Itemid=29&lang=vi (accessed on 15 March 2022).
- Jenn, F.; Hanh, H.T.; Nam, L.H.; Pechstein, A.; Thu, N.T.A. Baseline Study Ca Mau Review of Studies on Groundwater Resources in Cà Mau Province. Technical Report No III-2 of Technical Cooperation Project ‘Improving Groundwater Protection in the Mekong Delta’; National Centre for Water Resources Planning and Investigation (NAWAPI), Vietnam & Federal Institute for Geosciences and Natural Resources (BGR): Hanoi, Vietnam, 2017. [Google Scholar]
- Thi Nhung, T.; Le Vo, P.; Van Nghi, V.; Quoc Bang, H. Salt intrusion adaptation measures for sustainable agricultural development under climate change effects: A case of Ca Mau Peninsula, Vietnam. Clim. Risk Manag. 2019, 23, 88–100. [Google Scholar] [CrossRef]
- NAWAPI. Report Phase I, Upgrade and Build Groundwater Monitoring Network in the Mekong Delta in the Context of Climate Change; NAWAPI: Hanoi, Vietnam, 2018; unpublished. [Google Scholar]
- Pechstein, A.; Hoang, H.T.; Orilski, J.; Nam, L.H.; Van Manh, L. Detailed Investigations on the Hydrogeological Situation in Ca Mau Province, Mekong Delta, Vietnam. Technical Report No III-5 of Technical Cooperation Project ‘Improving Groundwater Protection in the Mekong Delta’; Federal Ministry for Economic Cooperation and Development: Hanoi, Vietnam, 2018. [Google Scholar]
- Division for Water Resource Planning and Investigation for the South of Vietnam (DWRPIS). Editing—Mapping Groundwater Resources for Every Province in Vietnam, Scale 1:200,000. Implementation Area: Southern Region; Division for Water Resource Planning and Investigation for the South of Vietnam (DWRPIS): Hochiminh city, Vietnam, 2018; unpublished. [Google Scholar]
- Diersch, H.-J.G. Hydrogeology; Springer: Berlin/Heidelberg, Germany, 2013. [Google Scholar]
- Vermeulen, P.; Quan, N.H.; Nam, N.D.G.; van Hung, P.; Tung, N.T.; Thanh, T.V.; Dam, R. Groundwater modeling for the Mekong Delta using iMOD. In Proceedings of the 20th International Congress on Modelling and Simulation, Adelaide, Australia, 1–6 December 2013; pp. 2499–2505. [Google Scholar]
- Kumar, C.P. An Overview of Commonly Used Groundwater Modelling Software. Int. J. Adv. Sci. Eng. Technol. 2019, 6, 7854–7865. [Google Scholar]
- Todd, D. Groundwater Hydrology, 2nd ed; John Wiley & Sons: New York, NY, USA, 1980; 535p. [Google Scholar]
- Hassan, A. A Validation Process for the Groundwater Flow and Transport Model of the Faultless Nuclear Test at Central Nevada Test Area; Nevada Site Office, National Nuclear Security Administration, U.S. Department of Energy: Las Vegas, NV, USA, 2003. [Google Scholar]
- Jackson, C.P.; Lever, D.A.; Sumner, P.J. Validation of transport models for use in repository performance assessments: A view illustrated for INTRAVAL test case 1b. Adv. Water Resour. 1992, 15, 33–45. [Google Scholar] [CrossRef]
- Flavelle, P. A quantitative measure of model validation and its potential use for regulatory purposes. Adv. Water Resour. 1992, 15, 5–13. [Google Scholar] [CrossRef]
- Davis, M.T.; Goodrich, P.A. A Proposed Strategy for the Validation of Ground-Water Flow and Solute Transport Models; Sandia National Lab.: Albuquerque, NM, USA, 1990.
- Shrestha, S.; Bach, T.V.; Pandey, V.P. Climate change impacts on groundwater resources in Mekong Delta under representative concentration pathways (RCPs) scenarios. Environ. Sci. Policy 2016, 61, 1–13. [Google Scholar] [CrossRef]
| Publisher’s Note: MDPI stays neutral with regard to jurisdictional claims in published maps and institutional affiliations. |
© 2022 by the authors. Licensee MDPI, Basel, Switzerland. This article is an open access article distributed under the terms and conditions of the Creative Commons Attribution (CC BY) license (https://creativecommons.org/licenses/by/4.0/).


 ,
, 


