
The Boron Budget in Waters of the Mono Basin, California
by
 , and
, and
Mengqu Han
1, 
E. Troy Rasbury
2,*,
N. Gary Hemming
2,3,
Sidney R. Hemming
3,4 and
Paul B. Tomascak
5 1
Department of Geography, Texas A&M University, College Station, TX 77843, USA
2
Department of Geosciences, Stony Brook University, Stony Brook, NY 11794, USA
3
Lamont Doherty Earth Observatory, Columbia University, Palisades, NY 10964, USA
4
Department of Earth and Environmental Sciences, Columbia University, New York, NY 10027, USA
5
College of Liberal Arts and Sciences, SUNY Oswego, Oswego, NY 13126, USA
*
Author to whom correspondence should be addressed.
Hydrology 2023, 10(6), 122; https://doi.org/10.3390/hydrology10060122
Submission received: 29 April 2023
/
Revised: 23 May 2023
/
Accepted: 27 May 2023
/
Published: 28 May 2023
(This article belongs to the Special Issue Advances in Isotope Investigations of Groundwater Resources)
Abstract
:Mono Lake in eastern California has the highest natural boron concentrations measured in a natural water body. Inputs to Mono Lake are from creeks that drain from the Sierra Nevada, accounting for over 80% of the total water input, and springs account for most of the rest of the water budget. We measured boron concentrations and isotope compositions of water sources in the lake and lake water collected over several seasons. The δ11B offset of at least +2.5‰ between Mono Lake water compared to its inputs suggests that, like seawater, the boron isotopic composition of the lake is influenced by the removal of light boron by coprecipitation and/or sorption of borate. Given the alkalinity of the lake, boron fractionation likely occurs before or as the water sources enter the lake. The famous tufa towers around the lake are a physical representation of a ‘chemical delta’ that alters the boron isotopic composition of the source fluids as they enter the lake. Based on different combinations of the measured end members, the residence time of boron in Mono Lake is estimated to be within the range of 5~80 ka.
1. Introduction
Mono Lake is a closed saline-alkaline lake in the hydrographically closed and volcanically active Mono Basin [1]. It is an excellent example of an anthropogenically altered system. The diversion of streams in 1941 to supply Los Angles with water caused a dramatic fall in lake level and resulted in a substantial increase in salinity from about 50% to 97% [2]. This was followed by decreased diversion and a rapid rise in lake water after 1994 [3].
Various aspects of the Mono Basin have been investigated, including hydrogeology [4,5,6,7,8], geochemistry [9,10,11,12,13], geologic history [4], sedimentology [14], and limnology [3]. Several systematic isotope studies have considered some elements’ sources and residence times in Mono Lake. For instance, the variety of radiogenic strontium isotope ratios (87Sr/86Sr) indicated water sources of Mono Lake originate from different rock types [7]. However, the 87Sr/86Sr composition of the lake water represents the ratios in Sierra Nevada creek inputs exclusively, without evidence of a ratio contribution from the groundwater springs [7]. The Ca budget and δ44Ca in Mono Lake show a major control by mineral formation [15]. The δ44Ca of lake water is heavier than lake water inputs and precipitated carbonates due to the fractionation of light Ca isotopes into the solid phase. Calcium has an extremely short residence time (~5 yr) and shows strong spatial and temporal variability in the lake water [15,16]. Radiogenic strontium isotopes of the lake shore carbonate precipitates provided a means to determine the fraction of lake water versus fresh water responsible for mineral precipitation, providing a framework showing that greater lake water influence results in more extreme Ca isotope fractionation [15].
A study of lithium isotopes (δ7Li) of Mono Basin waters found that creeks are more than ten times more dilute than springs concerning Li concentrations [16]. Cold springs have δ7Li heavier than lake water, whereas thermal springs have δ7Li lighter than lake water. The lithium budget in the Mono Basin was characterized using end-member analysis that suggested that springs (i.e., cold and thermal springs) provide over half of the lithium to the lake even though they represent only about 3% of the total water flux into the lake [16]. The lake water has δ7Li lighter than seawater (~+19.5‰ vs. ~+32‰) and has a residence time of about 28 ka [16].
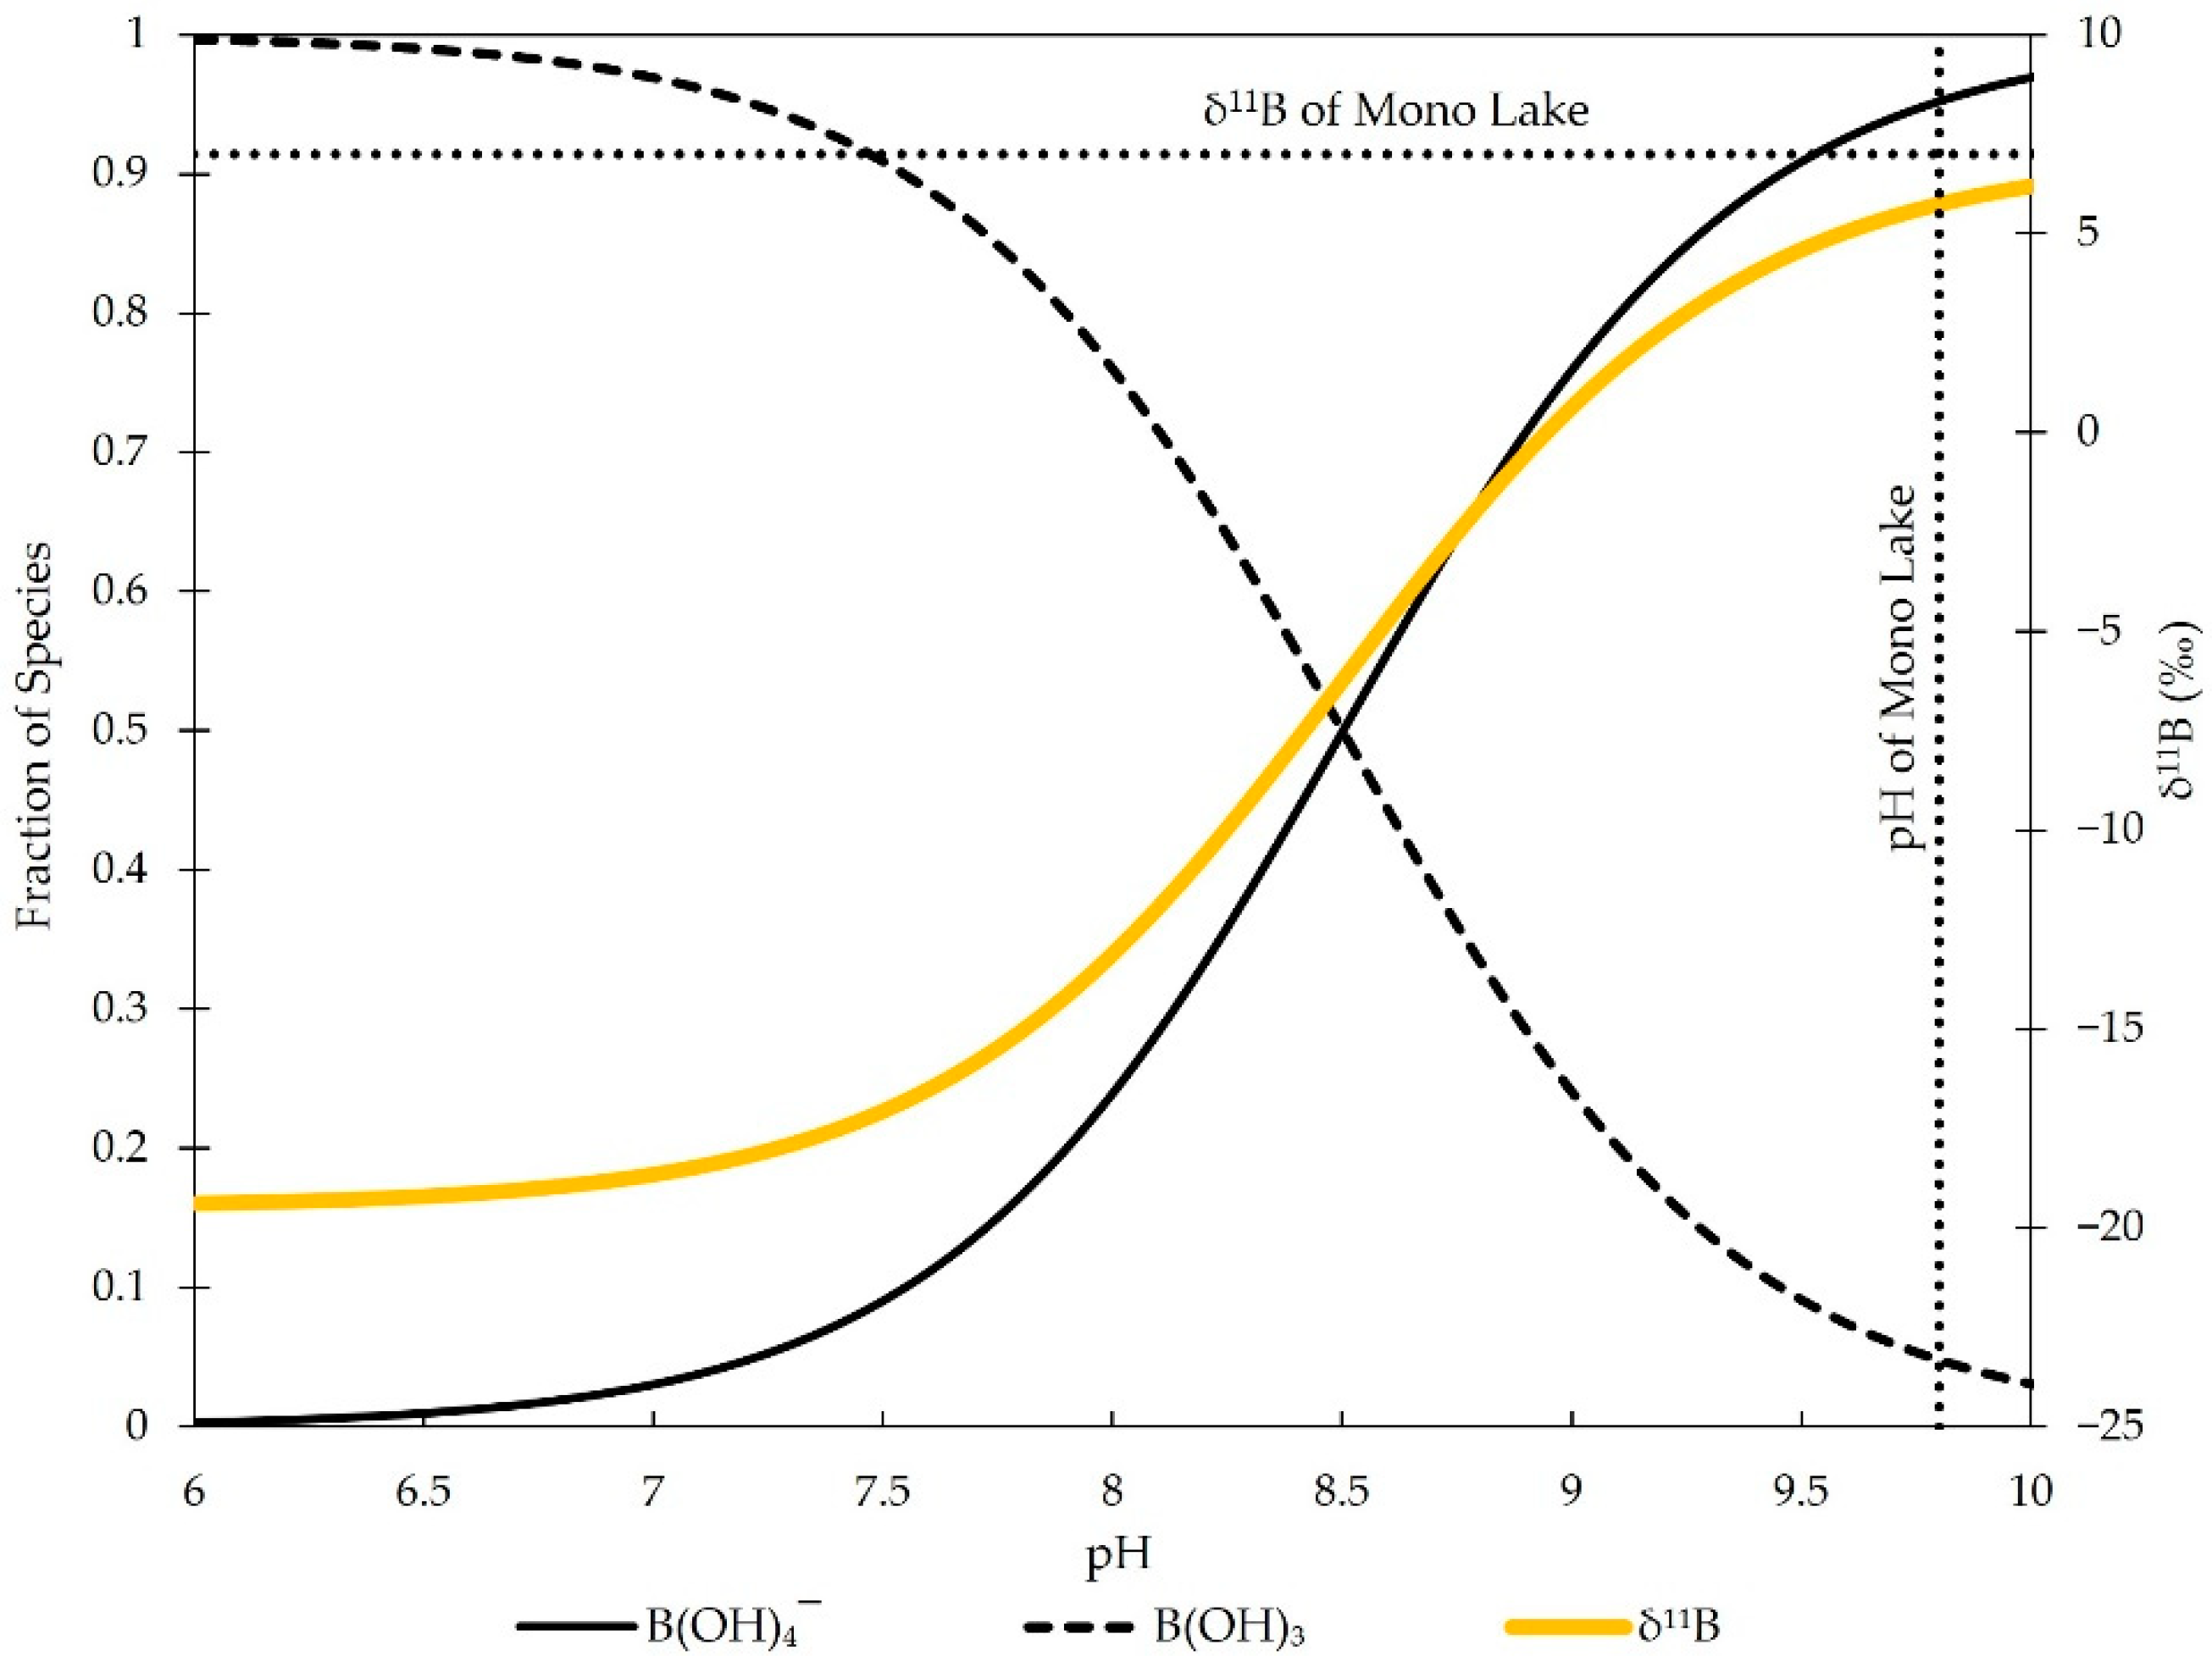
Boron (B) and Li are often studied together. Even though boron (B) concentrations in Mono Lake are known to be the highest of any natural body of water on Earth [17], no boron isotope (δ11B) work has been published. Boron is well suited for use as a source tracer owing to its high solubility and generally conservative behavior in aqueous solutions. It is also a powerful proxy for many aqueous processes due to a pH control on its speciation and an isotope fractionation between species and propensity for borate to coprecipitate into [18] or sorb onto authigenic minerals [19]. Boron has two stable isotopes, 11B and 10B, making up 80.1% and 19.9% of the total boron. The proportion of the two dominant species, boric acid B(OH)3 and borate is highly dependent on pH (Figure 1). The dissociation reaction is given by:
and the isotope exchange reaction between these two species is described by:
The different properties of the two boron species and the large relative mass difference (~10%) between 11B and 10B result in the significant isotopic fractionation of boron. Boron isotope fractionation in nature spans a wide range of −70‰ [23] to +75‰ [24] relative to the boric acid standard NIST SRM 951 (formerly NBS SRM 951 of the National Bureau of Standards, U.S.A.). Negative δ11B values have generally been found in non-marine evaporite borate minerals [25,26,27]. On the other hand, positive δ11B values are commonly found in saline lake brines and evaporated seawater [28,29,30,31,32,33,34,35]. Modern seawater has a boron concentration of about 4.45 mg/L and an isotopic composition of +39.61 ± 0.04‰ [36]. However, the composition of boron in river water and terrestrial groundwater [24,37,38,39,40,41], is mostly significantly lighter than that in seawater.
The isotope exchange reaction (Equation (2)) has an equilibrium constant < 1, such that trigonal B(OH)3 is preferentially enriched in the heavier isotope 11B. In contrast, tetrahedral is enriched in the lighter isotope 10B (Figure 1). The equilibrium constant is not strongly dependent on temperature (11−10KB = 0.9735 at 25 °C and 11−10KB = 0.9738 at 40 °C) [22]. Since is isotopically lighter and is preferentially adsorbed onto flocculated clay and/or other active surfaces in the marine environment, the isotopically heavier B(OH)3 species are left in the host water [19,42,43]. This explains why the δ11B of seawater is much heavier than river input [37,38]. Similar processes are expected in the Mono Basin system.
With an average pH of 9.8, represents about 90% of the total dissolved boron in Mono Lake (Figure 1). The high alkalinity of Mono Lake makes it an ideal location to examine controls on boron isotopes. In this paper, we evaluate the boron budget of the Mono Basin to learn more about the modern system and to provide a framework for future paleoenvironmental studies.
2. Study Area
2.1. General Features
The Mono Basin is a northeast-trending basin located on the eastern side of the Sierra Nevada in eastern California. It lies within the western edge of the arid Great Basin. Mono Lake is located on the western side of this basin with an area of about 155 km2 (Figure 2). As a much-reduced relic of Pleistocene Lake Russell [10], this terminal lake is one of the oldest perennial lakes in North America. Mono Basin has developed over the past 3~4 Ma [44,45] and became hydrologically closed at least 1 Ma ago [6]. The wetness of the Mono Basin started contemporaneously with the inception of the last glaciation (MIS5-4 boundary) [46], and it became much drier following the Younger Dryas [47].
2.2. Geological Features
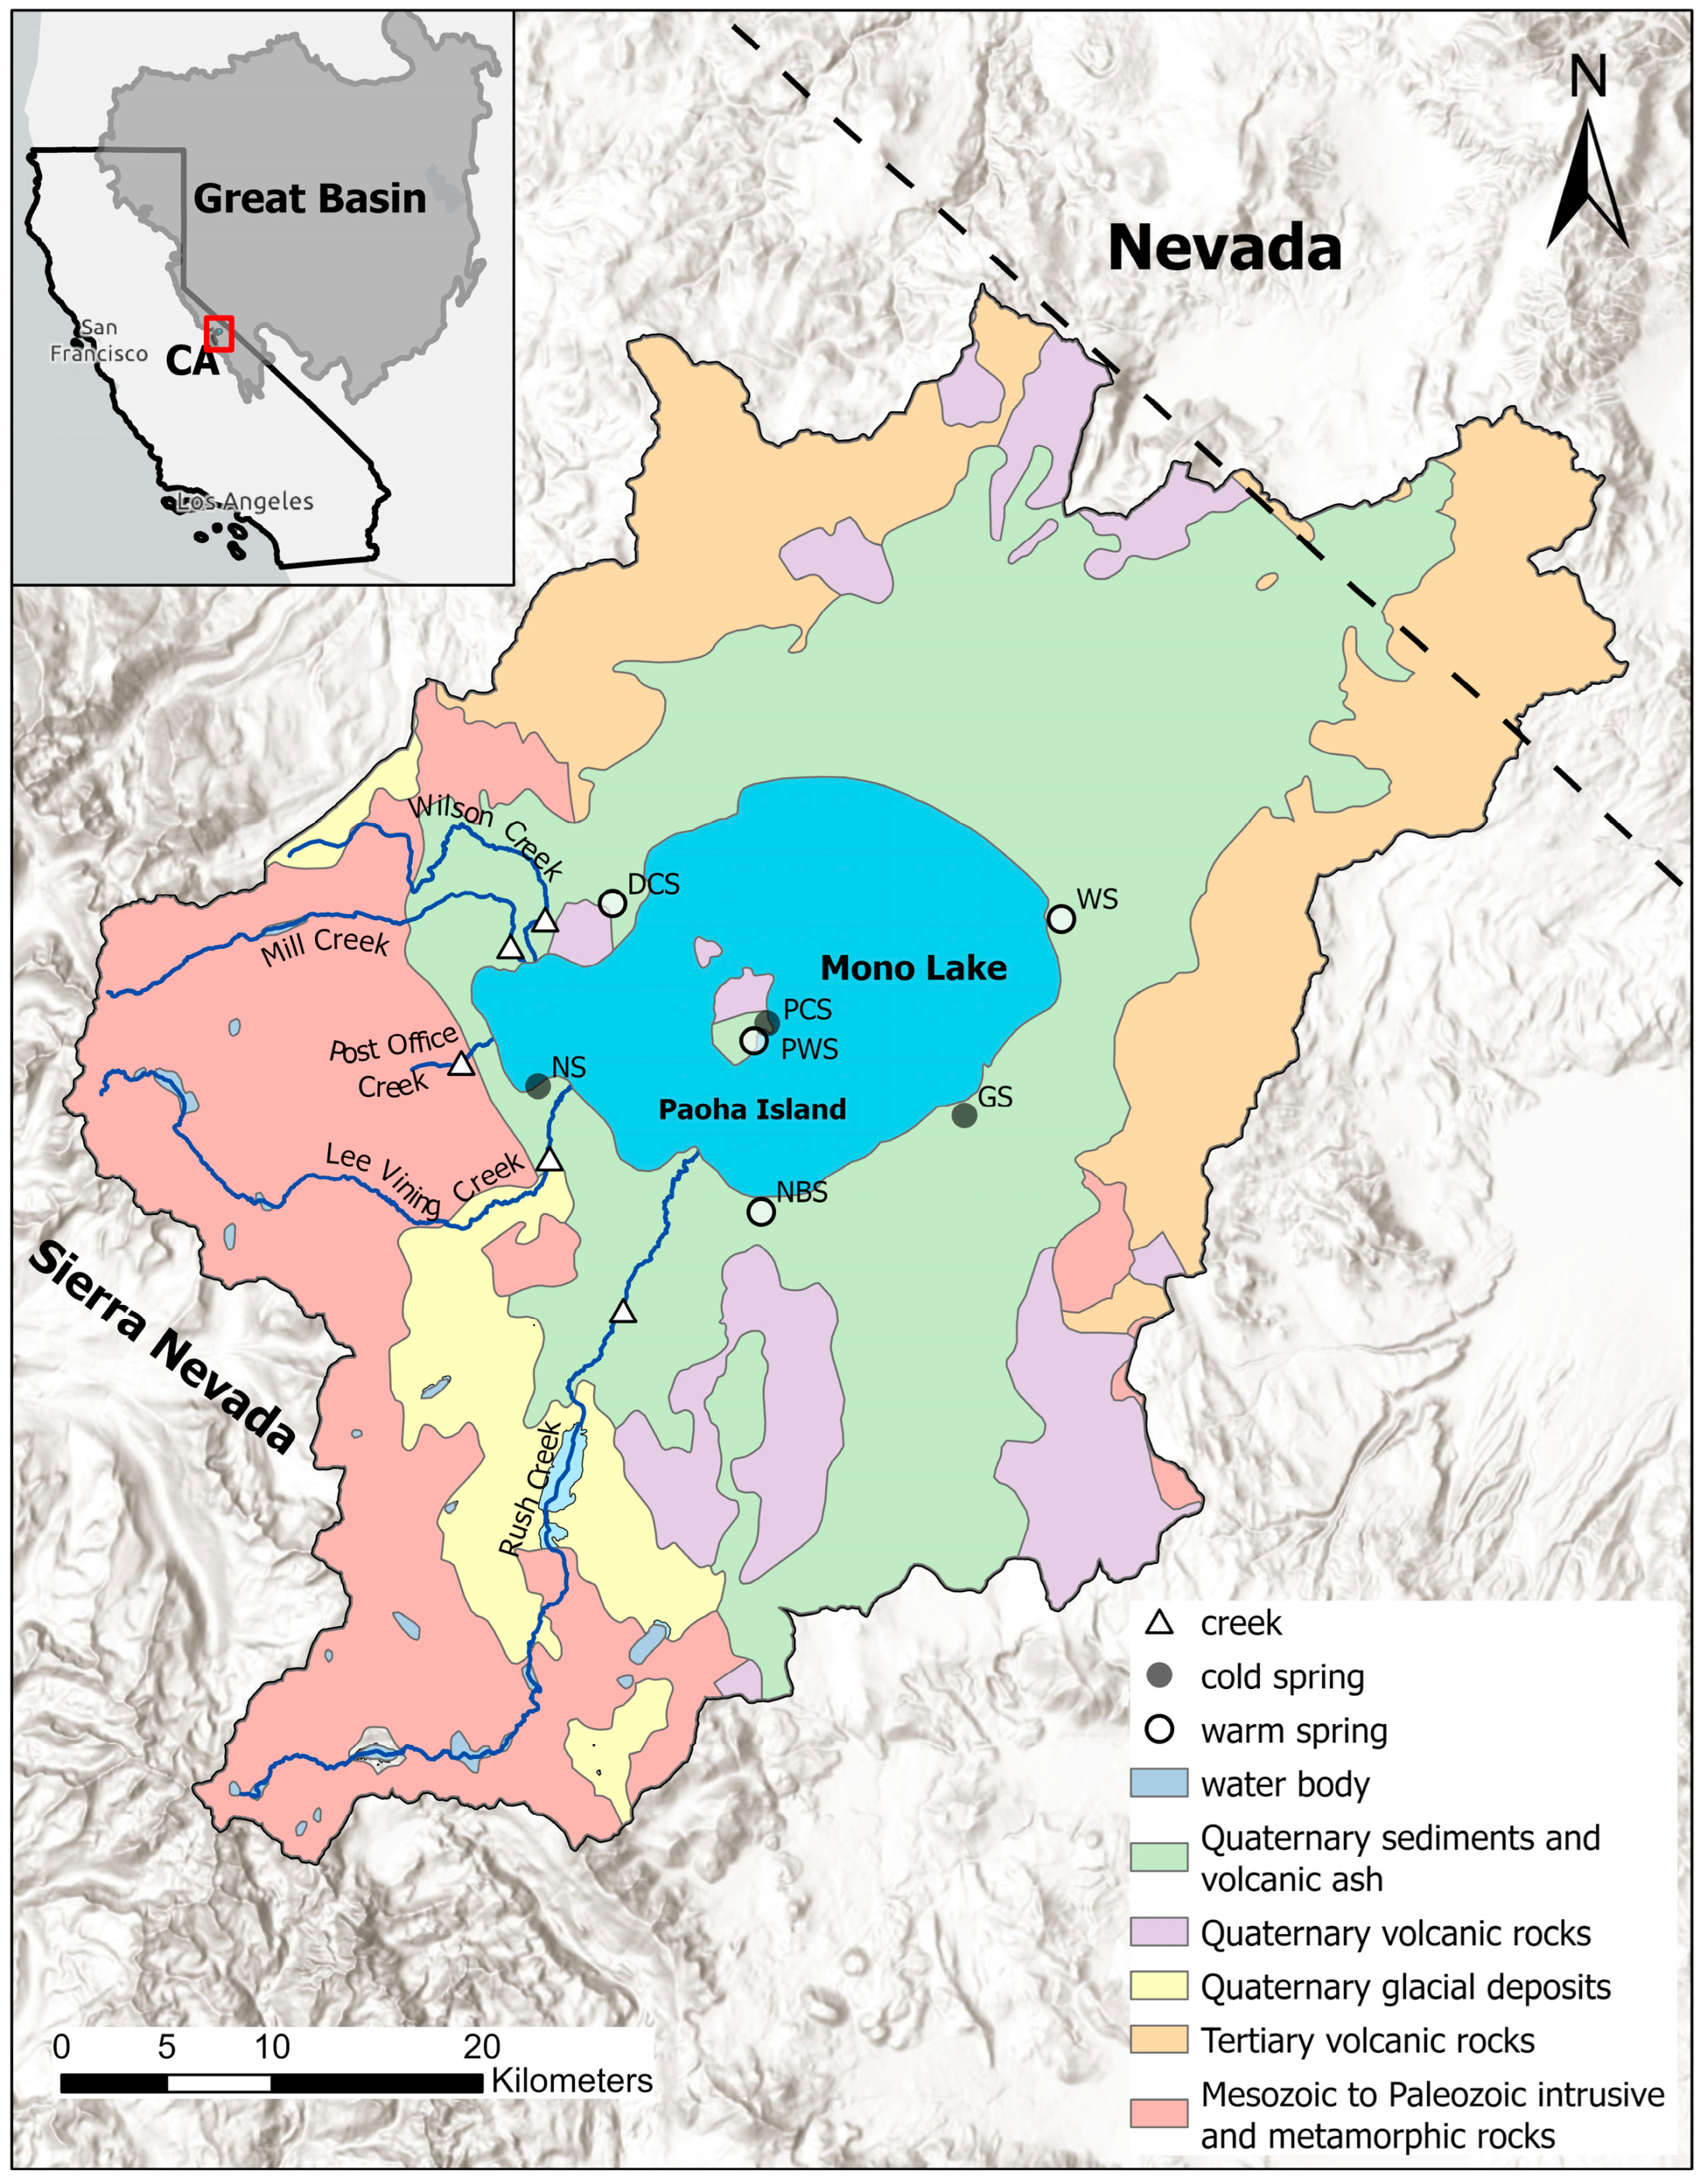
The Mono Basin is filled with interfingering Quaternary sediments and volcanic ash, Pleistocene glacial deposits, Quaternary volcanic rocks, Tertiary volcanic rocks and sediments, and Mesozoic and Paleozoic intrusive and metamorphic rocks [7] (Figure 2). The basin fill is dominantly alluvium from Quaternary felsic to mafic volcanic materials [16]. Creeks drain granitic rocks and metamorphic terrains with radiogenic 87Sr/86Sr ratios (~0.7097), indicating preferential mineral weathering in granitic rocks [7]. There is a large normal fault along the eastern front of the Sierra Nevada, which bounds the west side of the Mono Basin [44]. As a result, the western shoreline is dominated by fluvial gravels and sands from the uplifted Sierra Nevada [7]. Semi-confined to confined aquifers created by various deposits, sediments and rocks are recharged by creeks through fractures and gravels [7].
2.3. Hydrological Features
Mono Lake has a relatively simple water budget controlled by inputs from streams, groundwater springs, and limited precipitation, and outputs entirely through evaporation as the lake is hydrographically closed [7,9]. Among the inputs, direct precipitation is low and can be neglected as it is insignificant to the trace element budget of the lake [4,7,16,48]. Snowmelt from the eastern Sierra Nevada forms streams (creeks) that terminate at Mono Lake, accounting for 85% of the total inflow volume. Of these, 75% of the creek water volume is carried by Lee Vining and Rush Creeks [5,7,16]. Infiltrating groundwater springs include springs and wells (referred to herein as “cold springs”) in the sediment-filled part of the basin, mostly close to the lake shore, which appear to be associated with the shallow water table. Warm springs also occur proximal to the lake and have temperatures up to 66 °C [7,10,16]. Paoha Island, located near the center of Mono Lake, has both cold and warm springs close to each other.
Radiogenic strontium isotope has been used to study the water source in Mono Basin. Cold springs along the western shoreline show 87Sr/86Sr ratios similar to but smaller than creeks, indicating water flows through fractures in Sierra Nevada granitic bedrocks and then flows into alluvial materials and lake sediments; on the other hand, cold springs along the eastern shoreline show input from volcanic terrains [7]. Thermal springs also have less radiogenic 87Sr/86Sr than lake water and could be sourced from the Paleozoic limestones or young volcanic at depth [7].
In November 1940, the Los Angeles Department of Water and Power (LADWP) began diverting water from Mono Basin, mainly from Rush Creek and Lee Vining Creek. From 1941 to 1982, almost 50% of the source water was diverted for domestic and municipal use, resulting in a water level decline of about 14 m (1956 m above sea level to 1942 m above sea level [3], a more than half decrease of volume, and a doubling of the salinity [6,7,9]. In 1994, the Mono Lake Committee, an organization formed to protect the Mono Basin, won a lawsuit against the LADWP, limiting the amount of water diverted from Mono Lake. As a result, the State Water Resources Control Board of California (SWRCBC) issued Decision 1631 to restrict water diversion and set the management level to 1948.3 m above sea level for the lake’s ecological health restoration. However, the target level is still well below pre-diversion (1956 m). The current lake level is 1944.6 m above sea level. In this study, all samples were collected post-diversion.
Large water volumes of creeks and groundwater springs discharging into the lake via faults, seeps, and dispersed conduits are responsible for creating the tufa towers that are now exposed along the southern and western shorelines [10]. These striking depositional structures are up to 10 m in diameter and made of calcite, and they show concentric layering, with finely laminated dense bands alternating with thick porous ones [10]. In addition, carbonate-rich lake bottom sediments are formed by CaCO3 (perhaps initially a hydrated form such as ikaite or vaterite) precipitation from the lake water column because lake water is remarkably supersaturated with carbonate minerals [15].
The limnological conditions of Mono Lake have been a focus of several studies [3,49,50,51]. Mono Lake is mostly a monomictic lake which means lake water completely mixes from the surface to the bottom once each year. For present-day Mono Lake, the turnover time is November. However, there have been five meromictic periods (i.e., lake water being stratified and do not intermix) recorded in the last 50 years, where complete mixing did not occur for significant intervals: in 1983–1988, in 1996–2004, in 2006–2008, in 2011–2012, and 2017–2020 [3,51,52,53]. The pycnocline is at ~10 to 20 m depth in the deepest part of Mono Lake (about 35 m) [16].
3. Methods
3.1. Sampling
Our research team visited the site multiple times from 1996 to 2007 to collect samples (Table 1, Figure 2). Some samples were from the same collection location during several field surveys, aiming to see if there is any temporal variability. Some samples were named with digits and letters to indicate the collection date. For example, 99s meant spring in 1999. It should be noted that some spring water samples may contain some proportion of incorporated lake water since those springs discharge water directly to Mono Lake, making it difficult to obtain a pure end-member sample. Samples were filtered at the collection and stored in pre-cleaned polyethene bottles at room temperature.
3.2. Analysis
Na, Li and B concentrations were measured using a quadrupole inductively coupled plasma mass spectrometer (Agilent 7500cx ICP-MS). Blanks and multiple dilutions of a seawater standard (CASS-5 and CASS-6) (1/100,000, 1/20,000, 1/10,000, 1/2000, 1/1000, 1/100, 1/10) were tested throughout the runs to create a calibration line with R-squared values for all elements better than 0.999.
The boron ion exchange separation for isotopic analysis has been slightly modified from previously published methods [38,54,55]. We used a multi-channel peristaltic pump (Watson Marlow 205U pump, 16 channels) with 0.12 mm tubing attached to columns made from 1.5 mL pipette tips fitted with a cellulose frit. Approximately 50 µL of disaggregated and sieved to 63~125 µm Amberlite IRA 743 resin was used in each column for ion chromatography. Water samples were adjusted to pH 9 (if needed), and all other ions were washed through the columns with 1 mL of adjusted DI water (pH = 9). Boron was eluted in 1.2 mL of 2% nitric acid. About 200 ng of boron was typically separated from collected water samples to make multiple runs at 50 ppb (50–200 ng B per analysis) possible. Several seawater samples adjusted to pH 9 were put through as a standard with every batch of column chemistry to test the reliability of the procedure for boron recovery. For creek samples, 20–50 mL of these waters were used for the ion exchange separation experiment due to their very low boron concentrations. Boron concentrations of the eluted fractions from the ion exchange separation experiment indicate that negligible boron was lost during chemistry.
The boron isotopic compositions were measured by multi-collector inductively coupled plasma mass spectrometry (Nu Plasma II MC-ICP-MS). Unknowns and NIST SRM 951 standard were bracketed by analyses of the 2% nitric acid that was used for chemistry and dilution, and the bracketing 2% nitric acid signals for the 11B and 10B were subtracted from the NIST SRM 951 and the unknowns. The corrected NIST SRM 951 that bracketed the unknowns are averaged, and the δ11B of unknowns is referenced to that value. Samples were run in duplicate or triplicate, when possible, to confirm the reliability of the results, and most of the samples were put through chemistry twice as a further check. The equation used to calculate the per mil deviation from NIST SRM 951 is:
Repeat analyses of non-acidified, pH 9 adjusted seawater from Smith Point, New York (Atlantic Ocean of Long Island) give an average isotopic ratio of +39.8 ± 0.67‰ (2σ), well within the uncertainty of the accepted value of +39.61 ± 0.04‰ [36]. The mean measured 11B/10B of NIST SRM 951 from these analyses was 4.5533 ± 0.0034 (2σ), while the recommended value for NIST SRM 951 is 4.04367 [56]. We assume the samples were fractionated the same way as the standard and use the measured values of NIST SRM 951 without correcting for mass fractionation to calculate the δ11B of the unknown
4. Results
The element concentrations and δ11B of water samples and tufa are listed in Table 2. In addition, the arithmetic mean value is reported for the samples collected at the same location in different field surveys since the results do not show temporal variability in the isotope values (e.g., WC_99s, WC_99f, and WC_00u).
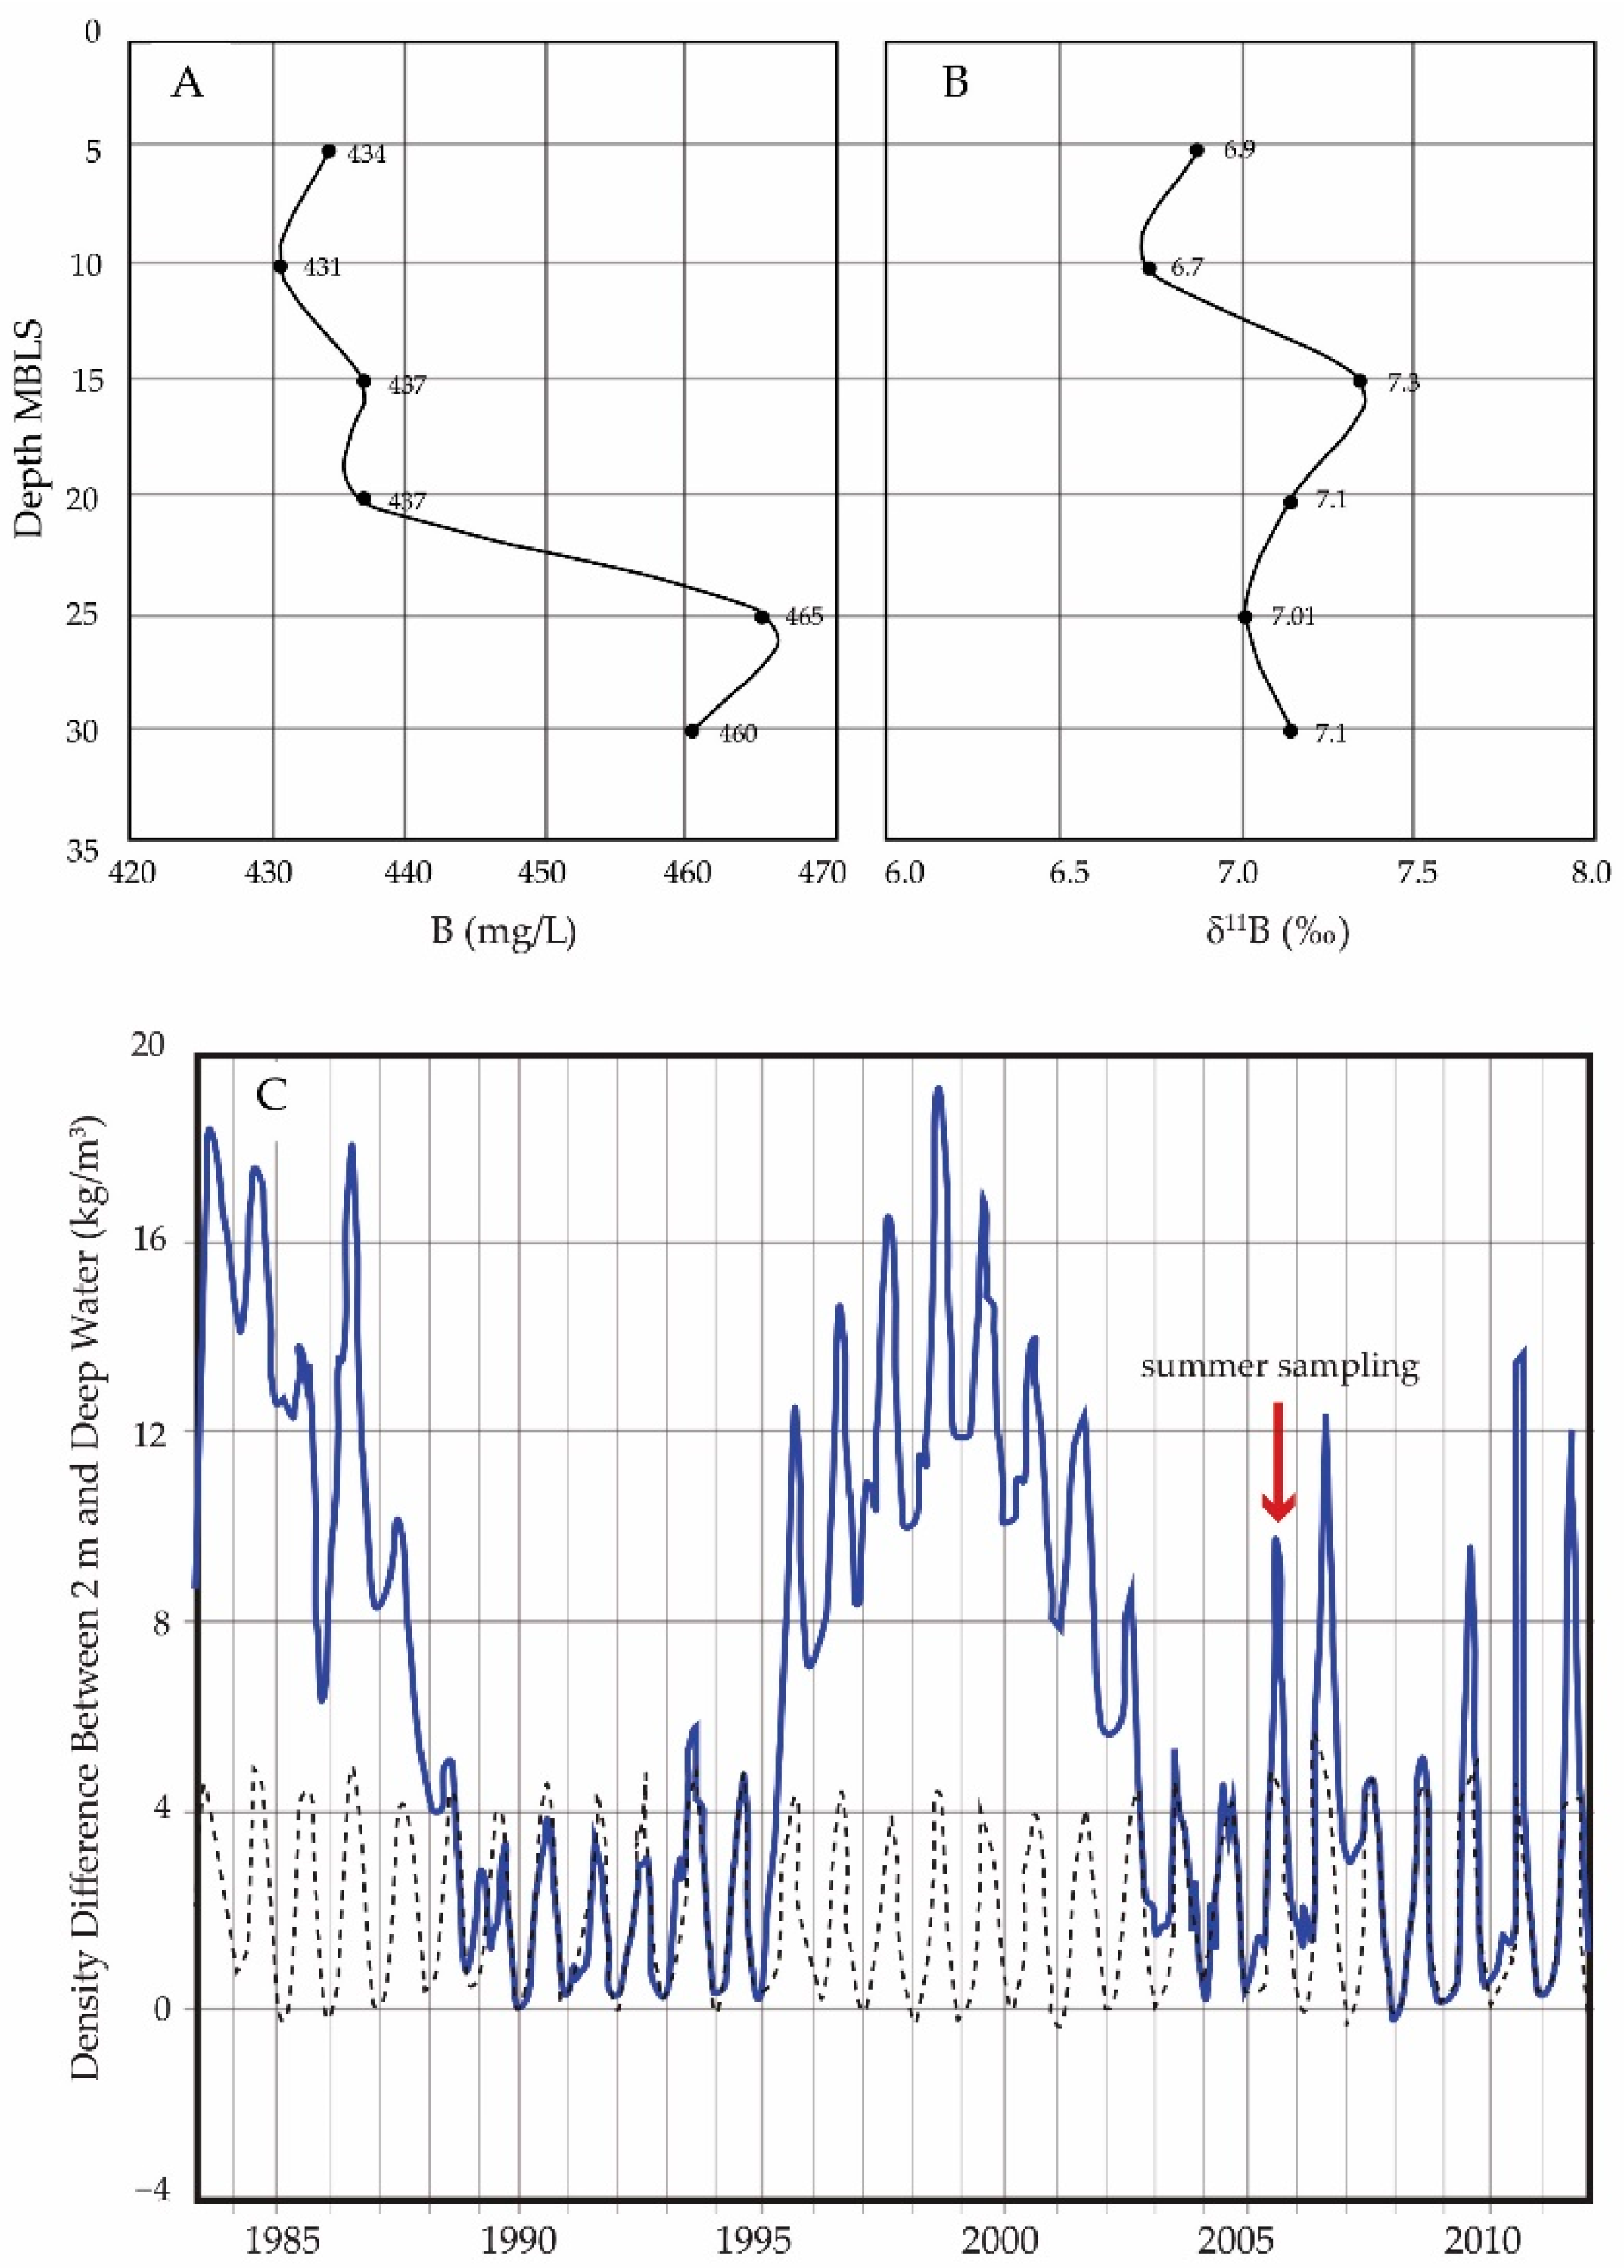
The concentrations of Li, B, and Na from creeks, warm springs, and cold springs are variable but generally low compared to the Mono Lake water. Mono Lake has extremely high boron concentrations, whereas creeks, the principal water source to Mono Lake, have the lowest boron concentrations of <0.01 mg/L. Boron concentrations of springs vary significantly. Cold springs along the Mono Lake shoreline have concentrations of ~0.2 mg/L; warm springs surrounding the northern shoreline (i.e., WS and DSC) have boron concentration at 7~8 mg/L, whereas the warm springs on the southern shoreline have boron concentration of about 80 mg/L. In addition, both cold and warm springs on Paoha Island have the highest boron concentrations of each spring type: ~1 mg/L in the cold spring (PCS) and ~158 mg/L in the warm spring (PWS). One sample from the Mono Lake shoreline surface water has a much lower B concentration (~58 mg/L) than the deeper water resulting from dilution by water inflow into the lake water. Mono Lake water from 5 to 10 m depth has a boron concentration of ~430 mg/L, increasing to 465 mg/L below the pycnocline (10 to 20 m).
Water samples from Mono Lake taken at different depths below the surface show analytically indistinguishable boron isotopic compositions (ranging from +6.7‰ to +7.3‰) with an average value of +7.04‰. While the same within error, there is evidence of a trend in δ11B from the shallow lake to the lake bottom. The δ11B is heavier at depths of about 15 m, which generally corresponds with the pycnocline layer of the lake (Figure 3). Additionally, the boron concentrations are about 7% more concentrated below the pycnocline (Figure 3).
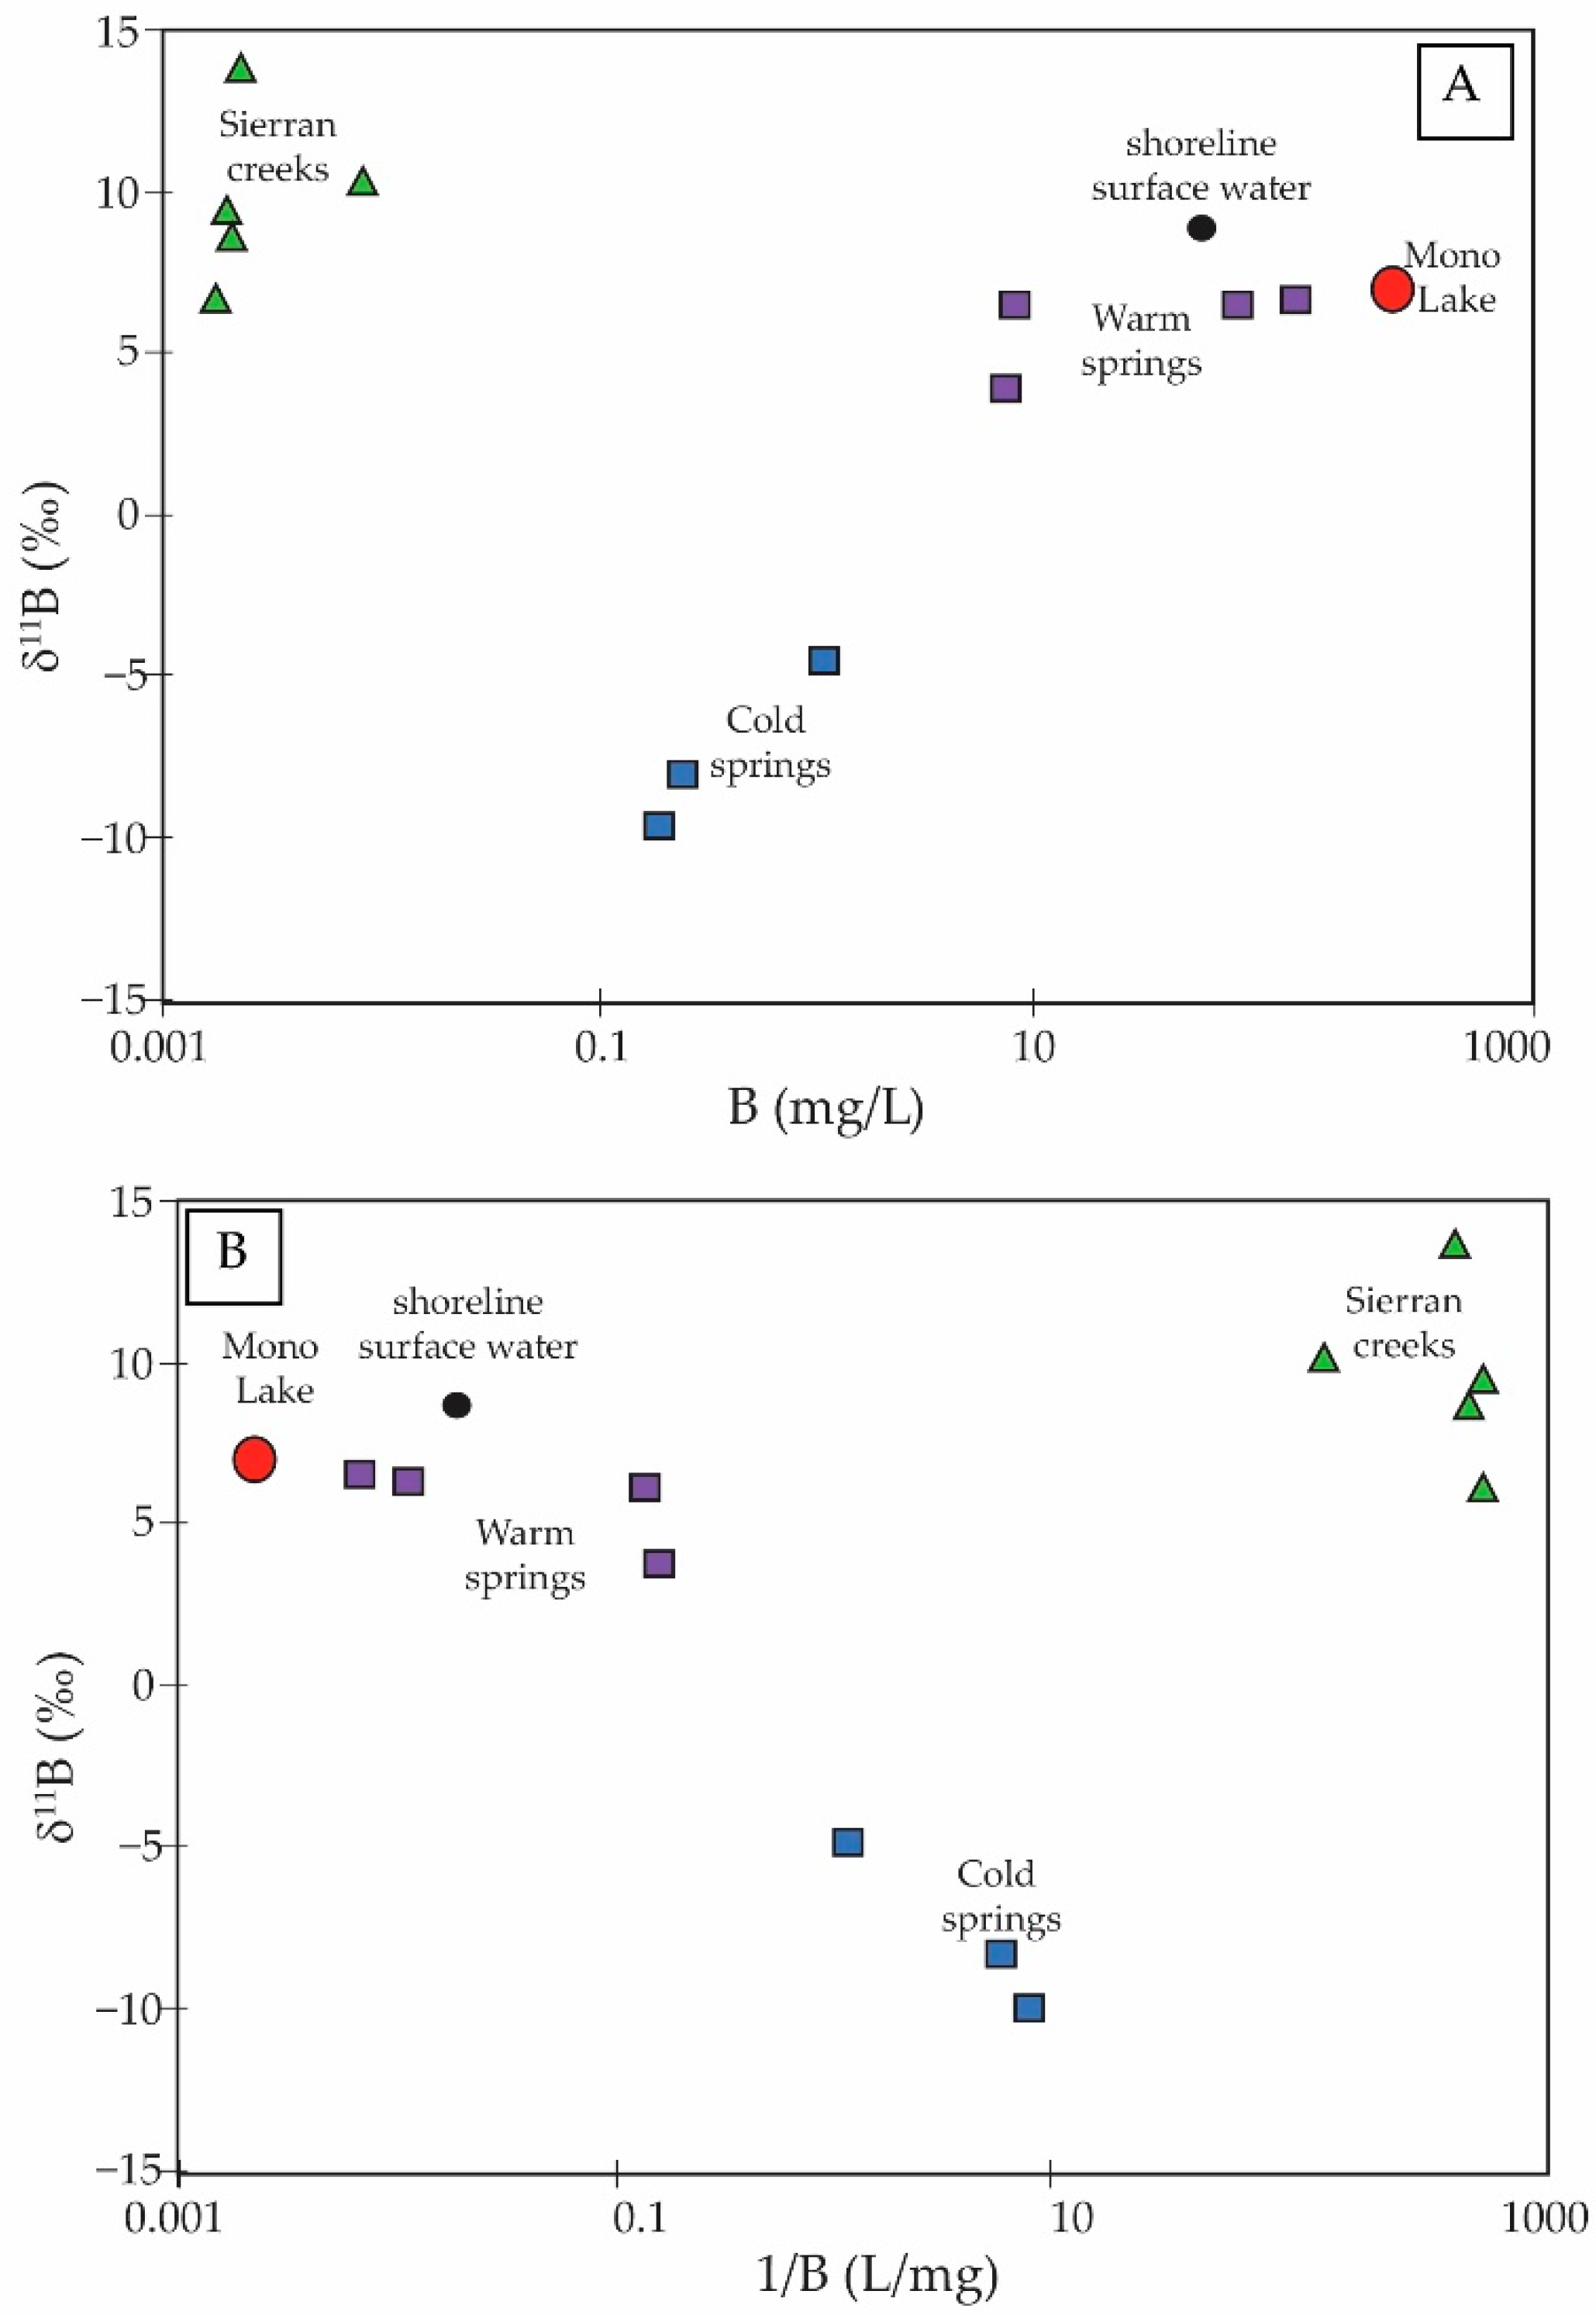
Cold springs have negative δ11B ranging from −9.6‰ to −4.4‰. Warm springs have positive δ11B, mostly isotopically lighter than Mono Lake (Table 2, Figure 3). An exception is Warm Springs from Pahoa Island which is not analytically distinguishable from that of Mono Lake (δ11B = +6.7‰). Creeks that drain into Mono Lake have δ11B that is heavier than the lake (+8.6‰ to +13.8‰), with Wilson Creek as an exception (δ11B = +6.7‰). However, the δ11B of the various contributors to Mono Lake is distinguishable, especially when coupled with concentrations (Figure 4).
Samples from two other lakes in the Great Basin were analyzed for δ11B, Pyramid Lake and Walker Lake (Table 3). These lake waters have much lower boron concentrations and are isotopically heavier than Mono Lake (δ11B = +8.5‰ and +10.8‰, respectively). Travertine Hot Spring near the Bridgeport Reservoir (THS), about 17 miles from Mono Lake, has a boron concentration of about 10 mg/L and an isotopic composition of +2.6‰. Hot Tub (HTT), a warm spring at the Bridgeport Reservoir, has a boron concentration of 9.1 mg/L and an isotopic composition of about −0.8‰.
5. Discussion
5.1. Incomplete Mixing in Mono Lake
We find a slight increase in the δ11B and the B concentration through the Mono Lake depth profile (Figure 3). This increase at a depth consistent with the pycnocline (~15 m) shows that the stratification from the recent meromictic period (1994 to 2004) may not have been completely erased by the time when lake water samples were collected (1 July 2005). This is consistent with the previous study [53] that the vertical stratification decreased and initiated monomixis in the late summer of 2005 (Figure 3).
5.2. Geochemistry of Waters Going into Mono Lake
Mono Lake, Pyramid Lake, and Walker Lake show distinctly light δ11B, while the boron concentrations in Pyramid Lake and Walker Lake are far lower (Table 3). Altogether, B data from Great Basin Lakes point to a source from the local igneous rocks, which do not have reported δ11B but, based on similar settings, are expected to be isotopically light. Mono Basin creeks drain the Sierra Nevada, comprised of Mesozoic granitic rocks and locally significant Paleozoic metasediments and metavolcanics [7,16]. These creeks have B concentrations between 0.0017 to 0.0083 mg/L and a range of δ11B of +6.7‰ to +13.8‰ [57]. Among the studied creeks, Lee Vining Creek and Rush Creek represent 75% of the creek water inflow to the lake. Based on a weighted average, the creek end-member is 0.0043 mg/L B with a δ11B of +9.85‰. Together with the estimated creek flux of 1.75 × 10¹¹ L/yr, the creeks deliver 7.5 × 10⁵ g of boron annually.
The springs have much more variable boron concentrations. Coupled with the likelihood of temporal variability of the warm spring flows, accurate estimation of the B input from springs is questionable. The estimated average spring flow is 4.5 × 10¹⁰ L/yr with the ratio of cold spring flow to warm spring flow at about 36:1, yielding a cold spring discharge of 4.38 × 10¹⁰ L/yr and warm springs discharge of 1.22 × 10⁹ L/yr into Mono Lake. The springs with the most elevated concentrations are on Paoha Island, but they appear to have a lake source and, therefore, would not represent new B to the lake. Lithium in warm springs on Paoha island also shows evidence of a source from the lake [16].
The estimated volume in Mono Lake in 2003 was 3.15 × 10¹² L; with an average concentration of 450 mg/L, the lake contains about 1450 × 106 kg of boron. With these boron concentrations and isotopic compositions, we can calculate the geochemical budget for boron in the Mono Lake system.
5.3. Mixing Calculations
We evaluate four scenarios for boron residence time estimation based on the estimated water flux from [16]. It should be noted that, in all scenarios, the same creek end-member boron concentration and isotopic composition estimated in Section 5.2 was used. In contrast, different cold spring and warm spring end-members were used for calculations to account for uncertainties in flux. For scenario 1, we use the average of all measured cold and warm springs as the endmembers (Table 4, scenario 1), and this gives a residence time of 14 ka with a δ11B of 3.08‰. Since the flux of springs (either cold spring or warm spring) is unclear, the simple average without weights was applied here. In scenario 2, to estimate the minimum boron residence time, we use the highest boron concentrations from Paoha Cold Spring (1 mg/L) and Paoha Warm Spring (158 mg/L), which gives a residence time of 5.83 ka, and δ11B of 4.54‰. However, given that the Paoha Warm Spring has δ11B that is barely distinguishable from Mono Lake water, we hypothesize that it could represent recirculated lake water diluted by local groundwater. In Scenario 3, we considered a more realistic estimate of the warm spring contribution using that of Navy Beach Hot Spring (85 mg/L), even though this spring has been modified and used as a recreational area which could result in dilution or contamination. This lower concentration endmember gives a residence time of 9.28 ka and a δ11B of 3.12‰. In Scenario 4, we use the lowest measured boron concentration spring waters, New Spring and DeChambeau Hot Spring, as cold and warm spring endmembers, respectively. In this case, creeks can provide at most 4.34% of the total boron to Mono Lake, and the calculated residence time is 80.5 ka with δ11B of −1.9‰. Overall, the total mass balanced input δ11B has a range from −1.9‰ to +4.54‰, and the residence time of B in Mono Lake is between 5.83 ka to 80.5 ka, consistent with estimates from Li isotope mass balance [16]. We cannot select the most likely scenario but favor Scenario 3.
Regarding the isotope composition, the most conservative estimate is the Scenario that gives values closest to the lake water values. Mono Lake has a δ11B of ~+7‰. Therefore, an offset of a least 2.5‰ between inflows and the lake water remains to be explained.
Numerous tufa towers are exposed along the shoreline of Mono Lake. These tufa deposits are a physical expression of the chemical delta where fresh water with Ca entering the extreme alkalinity of the lake leads to immediate carbonate precipitation. Two tufa deposits show very different concentrations and compositions, although this was not a direct measurement of the process as the tufa samples were not modern (Table 2). The B concentration of tufa sample ML 05-17 (45 mg/L) indicates that the formation of this tufa may derive from the mixing of small amounts of Mono Lake water and warm spring water (if lake water dominated, the concentrations should be much greater than measured), and δ11B of +2.5‰ shows that the lake must have been an essential source of boron. The second tufa sample ML 05-07 (2.45 mg/L) has a δ11B of −1‰, and the lower concentration and isotope ratio is consistent with a smaller influence from the lake water. The pH and δ11B of the mixture or precipitating event is unknown, so we cannot know how different the isotope offsets from the fluid might have been, but we can consider the possible range of scenarios. The pH values of the creeks are ~7, the cold springs are ~8, and the warm springs are ~6.5 [7], while the lake water has a pH of 9.6. It seems clear that the boron in ML 05-17, with a δ11B of +2.4‰ must be dominated by the δ11B of the lake or warm springs because, at any pH, borate is equal to or less than the parent fluid (Figure 1). We can also estimate the fraction of lake water because if it were entirely the lake, the carbonate precipitate would have thousands of mg/L boron (based on the fact that seawater at pH 8.2 and 4.45 mg/L boron yields calcite with approximately 30 mg/L boron), whereas this tufa is only 45 mg/L boron. This suggests that the fluid responsible for tufa formation has a much lower boron concentration than the lake. Since the concentration is similar to that of marine carbonates, it is reasonable to estimate that the parent fluid is more likely to be 5 mg/L boron, similar to what we see in the warm springs (Table 3). Boron isotope and concentration analyses of modern tufa from various settings would test this hypothesis in future studies. For Mono Lake, the main flux out is through co-precipitation in carbonates. Because Mono Lake is so alkaline, carbonates form when any influx of sources brings Ca in contact with lake water [1]. This ‘chemical delta’ not only removes significant B, but it can also alter the isotope composition of the water as it reaches the lake since borate is the species that interact with surfaces. If the pH and isotope composition of this mix were like the lake, the isotope composition of the borate would not be very different from the lake, with an estimated δ11B of about +5‰ (Figure 1). Alternatively, if the pH of the solution that forms the carbonates is lower, it would exert a stronger control on the input δ11B. The modest offset between the inputs and Mono Lake suggests that the pH at the precipitation site is high, according to the δ11B of borate vs. pH curve in Figure 1. This is consistent with the observation from Ca and Sr isotopes that showed strong fractionation due to significant lake water influence in the precipitation of carbonates [15].
The large difference in boron isotopic composition between Mono Lake and the ocean is emblematic of the large variability of terrestrial settings, and it is not anomalous. For example, modern volcanic-crater lakes in South Australia show δ11B values as heavy as +59‰ [28], Dead Sea δ11B values as heavy as +57.4‰, and hot springs near the Dead Sea have δ11B values as heavy as +55.7‰ [58].
6. Conclusions
Mono Lake has one of the highest reported boron concentrations in terrestrial waters (~450 mg/L). Sierran creeks have the most dilute boron concentration of all inputs to the lake (<0.01 mg/L) and generally have heavier δ11B than Mono Lake. Cold springs and warm springs are distinct, with cold springs having concentrations of 1 mg/L or less and negative δ11B, and warm springs having much higher boron concentrations and isotopic compositions that are positive but lighter than the Mono Lake water.
Our study suggests: (1) creeks have minimal potential to control the boron isotopic composition of Mono Lake because they can only provide up to 4% of the total boron; (2) there is a δ11B offset of at least +2.5‰ between Mono Lake and its input waters, suggesting the composition is controlled by coprecipitation of borate in carbonates which we argue must happen as the inflow enters the lake and forms tufa towers and other precipitates; and (3) based on assumptions about the various fluxes to the lake, the residence time of boron has a range of ~5 to 80 ka. Since water from two other lakes in the Great Basin (Pyramid Lake and Walker Lake) also have light δ11B values of +8‰ to +11‰, we infer that the Great Basin waters appear to be mainly controlled by the composition of the igneous rocks that are being weathered.
Author Contributions
Conceptualization, M.H., E.T.R., S.R.H. and P.B.T.; Investigation, M.H., E.T.R. and N.G.H.; Methodology, M.H., E.T.R. and N.G.H.; Resources, E.T.R., N.G.H., S.R.H. and P.B.T.; Supervision, E.T.R.; Writing—original draft, M.H.; Writing—review & editing, M.H., E.T.R., N.G.H., S.R.H. and P.B.T. All authors have read and agreed to the published version of the manuscript.
Funding
This research received no external funding. However, the waters were collected by PT and GH when PT was an NSF post-doc at Lamont.
Data Availability Statement
Acknowledgments
We thank the technical and intellectual support from Facility for Isotope Research & Student Training (FIRST) lab at Stony Brook University, especially Katie Wooton and Carrie Wright. We also thank the editor and three anonymous reviewers for suggestions and comments that strengthened the contribution.
Conflicts of Interest
The authors declare no conflict of interest.
References
- Bischoff, J.L.; Stine, S.; Rosenbauer, R.J.; Fitzpatrick, J.A.; Stafford, T.W. Ikaite Precipitation by Mixing of Shoreline Springs and Lake Water, Mono Lake, California, USA. Geochim. Cosmochim. Acta 1993, 57, 3855–3865. [Google Scholar] [CrossRef]
- Stine, S. Geomorphic, Geographic, and Hydrographic Basis for Resolving the Mono Lake Controversy. Environ. Geol. Water Sci. 1991, 17, 67–83. [Google Scholar] [CrossRef]
- Melack, J.M.; Jellison, R. Limnological Conditions in Mono Lake: Contrasting Monomixis and Meromixis in the 1990s. Hydrobiologia 1998, 384, 21–39. [Google Scholar] [CrossRef]
- Blevins, M.L.; Coufal, E.L.; Pagan, R.J.; Haw, R.D.; Smith, V.J.; McKeown, D.S.; Garcia, M.R.; Edwards, B.R. Background Report on Mono Basin Geology and Hydrology; Los Angeles Department of Water and Power, Aqueduct Division: Los Angeles, CA, USA, 1984. [Google Scholar]
- Connell, T.L.; Dreiss, S.J. Chemical Evolution of Shallow Groundwater along the Northeast Shore of Mono Lake, California. Water Resour. Res. 1995, 31, 3171–3182. [Google Scholar] [CrossRef]
- Rogers, D.B.; Dreiss, S.J. Saline Groundwater in Mono Basin, California: 2. Long-Term Control of Lake Salinity by Groundwater. Water Resour. Res. 1995, 31, 3151–3169. [Google Scholar] [CrossRef]
- Neumann, K.; Dreiss, S. Strontium 87/Strontium 86 Ratios as Tracers in Groundwater and Surface Waters in Mono Basin, California. Water Resour. Res. 1995, 31, 3183–3193. [Google Scholar] [CrossRef]
- Rogers, D.B.; Dreiss, S.J. Saline Groundwater in Mono Basin, California: 1. Distribution. Water Resour. Res. 1995, 31, 3131–3150. [Google Scholar] [CrossRef]
- Oxburgh, R.; Broecker, W.S.; Wanninkhof, R.H. The Carbon Budget of Mono Lake. Glob. Biogeochem. Cycles 1991, 5, 359–372. [Google Scholar] [CrossRef]
- Council, T.C.; Bennett, P.C. Geochemistry of Ikaite Formation at Mono Lake, California: Implications for the Origin of Tufa Mounds. Geology 1993, 21, 971. [Google Scholar] [CrossRef]
- Johannesson, K.H.; Lyons, W.B. The Rare Earth Element Geochemistry of Mono Lake Water and the Importance of Carbonate Complexing. Limnol. Oceanogr. 1994, 39, 1141–1154. [Google Scholar] [CrossRef]
- Johannesson, K.H.; Lyons, W.B.; Bird, D.A. Rare Earth Element Concentrations and Speciation in Alkaline Lakes from the Western U.S.A. Geophys. Res. Lett. 1994, 21, 773–776. [Google Scholar] [CrossRef]
- Phillips, F.M.; Rogers, D.B.; Dreiss, S.J.; Jannik, N.O.; Elmore, D. Chlorine 36 in Great Basin Waters: Revisited. Water Resour. Res. 1995, 31, 3195–3204. [Google Scholar] [CrossRef]
- Newton, M.S. Holocene Fluctuations of Mono Lake, California: The Sedimentary Record. In Sedimentology and Geochemistry of Modern and Ancient Saline Lakes; Renaut, R.W., Last, W.M., Eds.; SEPM (Society for Sedimentary Geology): Los Angeles, CA, USA, 1994; pp. 143–157. [Google Scholar]
- Nielsen, L.C.; DePaolo, D.J. Ca Isotope Fractionation in a High-Alkalinity Lake System: Mono Lake, California. Geochim. Cosmochim. Acta 2013, 118, 276–294. [Google Scholar] [CrossRef]
- Tomascak, P.B.; Hemming, N.G.; Hemming, S.R. The Lithium Isotopic Composition of Waters of the Mono Basin, California. Geochim. Cosmochim. Acta 2003, 67, 601–611. [Google Scholar] [CrossRef]
- Steiman, R.; Ford, L.; Ducros, V.; Lafond, J.-L.; Guiraud, P. First Survey of Fungi in Hypersaline Soil and Water of Mono Lake Area (California). Antonie Van Leeuwenhoek 2004, 85, 69–83. [Google Scholar] [CrossRef]
- Hemming, N.G.; Reeder, R.J.; Hanson, G.N. Mineral-Fluid Partitioning and Isotopic Fractionation of Boron in Synthetic Calcium Carbonate. Geochim. Cosmochim. Acta 1995, 59, 371–379. [Google Scholar] [CrossRef]
- Palmer, M.R.; Spivack, A.J.; Edmond, J.M. Temperature and PH Controls over Isotopic Fractionation during Adsorption of Boron on Marine Clay. Geochim. Cosmochim. Acta 1987, 51, 2319–2323. [Google Scholar] [CrossRef]
- Hemming, N.G.; Hanson, G.N. Boron Isotopic Composition and Concentration in Modern Marine Carbonates. Geochim. Cosmochim. Acta 1992, 56, 537–543. [Google Scholar] [CrossRef]
- Dickson, A.G. Thermodynamics of the Dissociation of Boric Acid in Synthetic Seawater from 273.15 to 318.15 K. Deep Sea Res. Part Oceanogr. Res. Pap. 1990, 37, 755–766. [Google Scholar] [CrossRef]
- Klochko, K.; Kaufman, A.J.; Yao, W.; Byrne, R.H.; Tossell, J.A. Experimental Measurement of Boron Isotope Fractionation in Seawater. Earth Planet. Sci. Lett. 2006, 248, 276–285. [Google Scholar] [CrossRef]
- Williams, L.B.; Hervig, R.L. Boron Isotope Composition of Coals: A Potential Tracer of Organic Contaminated Fluids. Appl. Geochem. 2004, 19, 1625–1636. [Google Scholar] [CrossRef]
- Hogan, J.F.; Blum, J.D. Boron and Lithium Isotopes as Groundwater Tracers: A Study at the Fresh Kills Landfill, Staten Island, New York, USA. Appl. Geochem. 2003, 18, 615–627. [Google Scholar] [CrossRef]
- Swihart, G.H.; Moore, P.B.; Callis, E.L. Boron Isotopic Composition of Marine and Nonmarine Evaporite Borates. Geochim. Cosmochim. Acta 1986, 50, 1297–1301. [Google Scholar] [CrossRef]
- Swihart, G.H.; McBay, E.H.; Smith, D.H.; Siefke, J.W. A Boron Isotopic Study of a Mineralogically Zoned Lacustrine Borate Deposit: The Kramer Deposit, California, U.S.A. Chem. Geol. 1996, 127, 241–250. [Google Scholar] [CrossRef]
- Oi, T.; Nomura, M.; Musashi, M.; Ossaka, T.; Okamoto, M.; Kakihana, H. Boron Isotopic Compositions of Some Boron Minerals. Geochim. Cosmochim. Acta 1989, 53, 3189–3195. [Google Scholar] [CrossRef]
- Vengosh, A.; Chivas, A.R.; McCulloch, M.T.; Starinsky, A.; Kolodny, Y. Boron Isotope Geochemistry of Australian Salt Lakes. Geochim. Cosmochim. Acta 1991, 55, 2591–2606. [Google Scholar] [CrossRef]
- Vengosh, A.; Chivas, A.R.; Starinsky, A.; Kolodny, Y.; Baozhen, Z.; Pengxi, Z. Chemical and Boron Isotope Compositions of Non-Marine Brines from the Qaidam Basin, Qinghai, China. Chem. Geol. 1995, 120, 135–154. [Google Scholar] [CrossRef]
- Farber, E.; Vengosh, A.; Gavrieli, I.; Marie, A.; Bullen, T.D.; Mayer, B.; Holtzman, R.; Segal, M.; Shavit, U. The Origin and Mechanisms of Salinization of the Lower Jordan River. Geochim. Cosmochim. Acta 2004, 68, 1989–2006. [Google Scholar] [CrossRef]
- Wei, H.-Z.; Jiang, S.-Y.; Tan, H.-B.; Zhang, W.-J.; Li, B.-K.; Yang, T.-L. Boron Isotope Geochemistry of Salt Sediments from the Dongtai Salt Lake in Qaidam Basin: Boron Budget and Sources. Chem. Geol. 2014, 380, 74–83. [Google Scholar] [CrossRef]
- Han, J.; Han, F.; Hussain, S.-A.; Liu, W.; Nian, X.; Mao, Q. Origin of Boron and Brine Evolution in Saline Springs in the Nangqen Basin, Southern Tibetan Plateau. Geofluids 2018, 2018, 1985784. [Google Scholar] [CrossRef]
- Godfrey, L.V.; Herrera, C.; Gamboa, C.; Mathur, R. Chemical and Isotopic Evolution of Groundwater through the Active Andean Arc of Northern Chile. Chem. Geol. 2019, 518, 32–44. [Google Scholar] [CrossRef]
- Zhang, W.; Tan, H.; Xu, W.; Huang, J. Boron Source and Evolution of the Zabuye Salt Lake, Tibet: Indication from Boron Geochemistry and Isotope. Appl. Geochem. 2023, 148, 105516. [Google Scholar] [CrossRef]
- Zhang, X.; Li, Q.; Qin, Z.; Fan, Q.; Du, Y.; Wei, H.; Gao, D.; Shan, F. Boron Isotope Geochemistry of a Brine-Carbonate System in the Qaidam Basin, Western China. Sediment. Geol. 2019, 383, 293–302. [Google Scholar] [CrossRef]
- Foster, G.L.; Pogge von Strandmann, P.A.E.; Rae, J.W.B. Boron and Magnesium Isotopic Composition of Seawater: DATA BRIEF. Geochem. Geophys. Geosyst. 2010, 11, 1–10. [Google Scholar] [CrossRef]
- Lemarchand, D.; Gaillardet, J.; Lewin, É.; Allègre, C.J. The Influence of Rivers on Marine Boron Isotopes and Implications for Reconstructing Past Ocean PH. Nature 2000, 408, 951–954. [Google Scholar] [CrossRef]
- Lemarchand, D.; Gaillardet, J.; Lewin, É.; Allègre, C.J. Boron Isotope Systematics in Large Rivers: Implications for the Marine Boron Budget and Paleo-PH Reconstruction over the Cenozoic. Chem. Geol. 2002, 190, 123–140. [Google Scholar] [CrossRef]
- Chetelat, B.; Gaillardet, J.; Freydier, R.; Negrel, P. Boron Isotopes in Precipitation: Experimental Constraints and Field Evidence from French Guiana. Earth Planet. Sci. Lett. 2005, 235, 16–30. [Google Scholar] [CrossRef]
- Barth, S. Boron Isotope Variations in Nature—A Synthesis. Geol. Rundsch. 1993, 82, 640–651. [Google Scholar]
- Bassett, R.L.; Buszka, P.M.; Davidson, G.R.; Chong-Diaz, D. Identification of Groundwater Solute Sources Using Boron Isotopic Composition. Environ. Sci. Technol. 1995, 29, 2915–2922. [Google Scholar] [CrossRef]
- Schwarcz, H.P.; Agyei, E.K.; McMullen, C.C. Boron Isotopic Fractionation during Clay Adsorption from Sea-Water. Earth Planet. Sci. Lett. 1969, 6, 1–5. [Google Scholar] [CrossRef]
- Spivack, A.J.; Edmond, J.M. Boron Isotope Exchange between Seawater and the Oceanic Crust. Geochim. Cosmochim. Acta 1987, 51, 1033–1043. [Google Scholar] [CrossRef]
- Gilbert, C.M.; Christensen, M.N.; Al-Rawi, Y.; Lajoie, K.R. Structural and Volcanic History of Mono Basin, California-Nevada. In Geological Society of America Memoirs; Geological Society of America: Boulder, CO, USA, 1968; Volume 116, pp. 275–330. [Google Scholar]
- Christensen, M.N.; Gilbert, C.M.; Lajoie, K.R.; Al-Rawi, Y. Geological-Geophysical Interpretation of Mono Basin, California-Nevada. J. Geophys. Res. 1969, 74, 5221–5239. [Google Scholar] [CrossRef]
- Ali, G.A.H.; Lin, K.; Hemming, S.R.; Cox, S.E.; Ruprecht, P.; Zimmerman, S.R.H.; Stine, S.; Wang, X. Emergence of Wet Conditions in the Mono Basin of the Western USA Coincident with Inception of the Last Glaciation. GSA Bull. 2022, 134, 2267–2279. [Google Scholar] [CrossRef]
- Benson, L. Carbonate Deposition, Pyramid Lake Subbasin, Nevada: 1. Sequence of Formation and Elevational Distribution of Carbonate Deposits (Tufas). Palaeogeogr. Palaeoclimatol. Palaeoecol. 1994, 109, 55–87. [Google Scholar] [CrossRef]
- Vorster, P. Hydrology of the Mono Basin. In The Mono Basin Ecosystem: Effects of Changing Lake Level; National Research Council, Division on Engineering and Physical Sciences, Board on Environmental Studies and Toxicology, Commission on Physical Sciences, Mathematics, and Applications, Mono Basin Ecosystem Study Committee, Eds.; National Academy Press: Washington, DC, USA, 1987; pp. 22–49. [Google Scholar]
- Mason, D.T. Limnology of Mono Lake, California; University of California Press: Berkeley and Los Angeles, CA, USA, 1967; Volume 83. [Google Scholar]
- Melack, J.M. Large, Deep Salt Lakes: A Comparative Limnological Analysis. Hydrobiologia 1983, 105, 223–230. [Google Scholar] [CrossRef]
- Oremland, R.S.; Stolz, J.F.; Hollibaugh, J.T. The Microbial Arsenic Cycle in Mono Lake, California. FEMS Microbiol. Ecol. 2004, 48, 15–27. [Google Scholar] [CrossRef]
- Phillips, A.A.; Speth, D.R.; Miller, L.G.; Wang, X.T.; Wu, F.; Medeiros, P.M.; Monteverde, D.R.; Osburn, M.R.; Berelson, W.M.; Betts, H.L.; et al. Microbial Succession and Dynamics in Meromictic Mono Lake, California. Geobiology 2021, 19, 376–393. [Google Scholar] [CrossRef]
- Melack, J.M.; Jellison, R.; MacIntyre, S.; Hollibaugh, J.T. Mono Lake: Plankton Dynamics over Three Decades of Meromixis or Monomixis. In Ecology of Meromictic Lakes; Gulati, R.D., Zadereev, E.S., Degermendzhi, A.G., Eds.; Springer International Publishing: Cham, Switzerland, 2017; pp. 325–351. ISBN 978-3-319-49143-1. [Google Scholar]
- Hemming, N.G.; Hanson, G.N. A Procedure for the Isotopic Analysis of Boron by Negative Thermal Ionization Mass Spectrometry. Chem. Geol. 1994, 114, 147–156. [Google Scholar] [CrossRef]
- Wei, H.-Z.; Jiang, S.-Y.; Gary Hemming, N.; Yang, J.-H.; Yang, T.; Wu, H.-P.; Yang, T.-L.; Yan, X.; Pu, W. An Improved Procedure for Separation/Purification of Boron from Complex Matrices and High-Precision Measurement of Boron Isotopes by Positive Thermal Ionization and Multicollector Inductively Coupled Plasma Mass Spectrometry. Talanta 2014, 123, 151–160. [Google Scholar] [CrossRef]
- Catanzaro, E.J. Boric Acid: Isotopic and Assay Standard Reference Materials; National Bureau of Standards, Institute for Materials Researchs: Washington, DC, USA, 1970; Special Volume 260.
- Cai, Y.; Rasbury, E.T.; Wooton, K.M.; Jiang, X.; Wang, D. Rapid Boron Isotope and Concentration Measurements of Silicate Geological Reference Materials Dissolved through Sodium Peroxide Sintering. J. Anal. At. Spectrom. 2021, 36, 2153–2163. [Google Scholar] [CrossRef]
- Vengosh, A.; Starinsky, A.; Kolodny, Y.; Chivas, A.R. Boron Isotope Geochemistry as a Tracer for the Evolution of Brines and Associated Hot Springs from the Dead Sea, Israel. Geochim. Cosmochim. Acta 1991, 55, 1689–1695. [Google Scholar] [CrossRef]
Figure 1.
The figure shows the distribution of aqueous boron species vs. pH (black solid curve and black dashed curve) and δ11B of borate vs. pH (yellow solid curve) in the Mono Lake environment (salinity = 80.8 g/L, T = 25 °C). The horizontal dotted black line near the top of the diagram is the δ11B of Mono Lake water. The vertical dotted line shows the pH of Mono Lake. Modified after [20] using the updated dissociation constant of boric acid value KB [21] and the updated fractionation factor (i.e., equilibrium constant) 11−10KB [22].

Figure 2.
Simplified geologic map of Mono Basin and sample locations within it. The closed circle, open circle, and triangle symbols represent samples collected from cold springs, warm springs, and creeks, respectively. The sample dates and sites are listed in Table 1.
Figure 2.
Simplified geologic map of Mono Basin and sample locations within it. The closed circle, open circle, and triangle symbols represent samples collected from cold springs, warm springs, and creeks, respectively. The sample dates and sites are listed in Table 1.

Figure 3.
(A). The plot of boron concentration (ppm) versus depth. (B). The plot of δ11B with depth. (C). The density difference between 2 m and deeper water at 28 m (1983–1990) and 32 m (1991–2011) at one monitor station showing the lake water stratification (blue bold curve: temperature and chemical; gray dash curve: temperature only) (modified from [53]). The red arrow shows this study’s sampling date of lake water samples.

Figure 4.
(A). The plot of boron concentration (mg/L) versus δ11B (‰) (in logarithmic scale) showing Mono Lake waters and sources to the lake. (B). A companion plot with 1/B (L/mg) versus δ11B (‰).
Figure 4.
(A). The plot of boron concentration (mg/L) versus δ11B (‰) (in logarithmic scale) showing Mono Lake waters and sources to the lake. (B). A companion plot with 1/B (L/mg) versus δ11B (‰).


Table 1.
List of the sample type, sample name, collection date and collection site of each sample.
| Sample Types | Name | Date | Site |
|---|---|---|---|
| Sierran creeks | MC_96 | 9/30/1996 | Mill Creek |
| MC_99s | 4/18/1999 | Mill Creek | |
| MC_99f | 9/21/1999 | Mill Creek | |
| MC_00u | 8/8/2000 | Mill Creek | |
| WC_99s | 4/18/1999 | Wilson Creek | |
| WC_99f | 9/21/1999 | Wilson Creek | |
| WC_00u | 8/8/2000 | Wilson Creek | |
| POC_99s | 4/18/1999 | Post Office Creek | |
| LVC_99f | 9/21/1999 | Lee Vining Creek | |
| LVC_00u | 8/11/2000 | Lee Vining Creek | |
| RC_99s | 4/18/1999 | Rush Creek | |
| RC_99f | 9/21/1999 | Rush Creek | |
| RC_00u | 8/11/2000 | Rush Creek | |
| Cold springs | GS_00u | 8/5/2000 | Gerard Spring |
| PCS | 7/1/2005 | Paoha Island | |
| NS | 7/6/2005 | New Spring | |
| Warm springs | WS | 6/25/2005 | Warm Springs |
| WS_2 | 6/14/2007 | Warm Springs | |
| PWS | 7/1/2005 | Paoha Island | |
| DCS | 6/16/2005 | Dechambeau Hot Spring | |
| DCS 2 | 6/16/2005 | Dechambeau Hot Spring | |
| DCS 3 | 6/8/2007 | Dechambeau Hot Spring | |
| NBS_00f | 11/17/2000 | Navy Beach Hot Spring | |
| THS | 6/13/2007 | Travertine Hot Spring | |
| THS2 | 6/13/2007 | Travertine Hot Spring | |
| THS3 | 6/13/2007 | Travertine Hot Spring | |
| HTT | 6/13/2007 | Hot Tub (Bridgeport) | |
| Mono Lake | MONOSS | 6/13/2007 | Mono Lake (shoreline surface) |
| MONO5 | 7/1/2005 | Mono Lake (5 m depth) | |
| MONO10 | 7/1/2005 | Mono Lake (10 m depth) | |
| MONO15 | 7/1/2005 | Mono Lake (15 m depth) | |
| MONO20 | 7/1/2005 | Mono Lake (20 m depth) | |
| MONO25 | 7/1/2005 | Mono Lake (25 m depth) | |
| MONO30 | 7/1/2005 | Mono Lake (30 m depth) | |
| Other Lakes | PYL1 | 6/17/2005 | Pyramid Lake |
| PYL2 | 6/17/2005 | Pyramid Lake | |
| PYL3 | 6/17/2005 | Pyramid Lake | |
| WKL | 6/17/2005 | Walker Lake | |
| WKL2 | 7/4/2005 | Walker Lake | |
| WKL3 | 7/4/2005 | Walker Lake |
Table 2.
Elemental data and B isotopic compositions of samples from Mono Basin region.
| Water Type | Symbol | Li (mg/L) | B (mg/L) | Na (mg/L) | B/Li (mol.) | Na/B (mol.) | δ11B (‰) |
|---|---|---|---|---|---|---|---|
| Sierran creeks | LVC | 0.0014 | 0.0019 | 1.28 | 0.86 | 311.32 | +9.4 |
| POC | 0.001 | 0.0022 | 2.92 | 1.40 | 623.07 | +13.8 | |
| MLC | 0.001 | 0.002 | 1.79 | 1.32 | 429.89 | +8.6 | |
| WLC | 0.001 | 0.0017 | 1.49 | 1.11 | 420.86 | +6.7 | |
| RC | 0.002 | 0.0083 | 1.63 | 3.40 | 92.80 | +10.4 | |
| Cold springs | PCS | 0.3474 | 1.0736 | 80.79 | 1.99 | 35.37 | −4.4 |
| NS | 0.0382 | 0.1786 | 76.25 | 3.00 | 200.86 | −9.6 | |
| GS | 0.14 | 0.24 | 30.66 | 1.10 | 61.12 | −8.0 | |
| Warm springs | WS | 0.6861 | 8.02 | 684.98 | 7.51 | 40.14 | +6.5 |
| PWS | 3.26 | 158.42 | 9192 | 31.19 | 27.27 | +6.7 | |
| DCS | 0.4408 | 7.27 | 455.93 | 10.60 | 29.49 | +3.9 | |
| NBS | 3.83 | 84.89 | 7629 | 14.24 | 42.20 | +6.5 | |
| Mono Lake | MONOSS | 6.37 | 57.8 | 24,892 | 5.83 | 202.42 | +8.9 |
| MONO5 | 15.95 | 434 | 34,875 | 17.49 | 37.74 | +6.9 | |
| MONO10 | 15.06 | 431 | 33,439 | 18.39 | 36.48 | +6.7 | |
| MONO15 | 16.4 | 437 | 33,496 | 17.11 | 36.06 | +7.3 | |
| MONO20 | 16.51 | 437 | 32,917 | 17.00 | 35.43 | +7.1 | |
| MONO25 | 18.04 | 465 | 35,763 | 16.57 | 36.14 | +7 | |
| MONO30 | 17.41 | 460 | 34,979 | 16.99 | 35.72 | +7.1 | |
| Tufa | ML05-07 | … | 2.45 | … | … | … | −1.0 |
| ML05-17 | … | 45.27 | … | … | … | +2.4 |
Note: ∙∙∙ = not analyzed.
Table 3.
Elemental data and B isotopic compositions of samples from other lakes and springs elsewhere in the Great Basin.
Table 3.
Elemental data and B isotopic compositions of samples from other lakes and springs elsewhere in the Great Basin.
| Water Type | Symbol | Li (mg/L) | B (mg/L) | Na (mg/L) | B/Li (mol.) | Na/B (mol.) | δ11B (‰) |
|---|---|---|---|---|---|---|---|
| PYL | 1.03 | 11.64 | 1828.7 | 7.29 | 73.92 | +8.5 | |
| Other lakes | WKL | 2.38 | 36.55 | 6338.8 | 9.88 | 81.63 | +10.8 |
| WKL 2 | 2.43 | 35.67 | 6501.2 | 9.42 | 85.66 | +10.8 | |
| Other | THS | 3.48 | 9.95 | 1253.9 | 1.84 | 59.20 | +2.6 |
| warm springs | HTT | 2.93 | 9.10 | 426.3 | 2.00 | 22.01 | −0.8 |
Table 4.
Mono Basin boron fluxes and residence time under different scenarios.
| Scenario | Cold Spring | Warm Spring | Creek | |
|---|---|---|---|---|
| Flow (L/yr) * | 4.38 × 10¹⁰ | 1.22 × 10⁹ | 1.75 × 10¹¹ | |
| 1 | B (mg/L) | 0.50 | 64.65 | 0.0043 |
| cold: PCS + NS + GS | Boron flux (g/yr) | 2.18 × 10⁷ | 7.86 × 10⁷ | 7.55 × 10⁵ |
| warm: WS + DCS + NBS + PWS | δ11B (‰) | −7.33 | +5.90 | +9.85 |
| δ11B of total influx (‰) | +3.08 | |||
| residence time (years) | 1.39 × 10⁴ | |||
| 2 | B (mg/L) | 1.07 | 158.42 | 0.0043 |
| cold: PCS | Boron flux (g/yr) | 4.70 × 10⁷ | 1.93 × 10⁸ | 7.55 × 10⁵ |
| warm: PWS | δ11B (‰) | −4.40 | +6.70 | +9.85 |
| δ11B of total influx (‰) | +4.54 | |||
| residence time (years) | 5.83 × 10³ | |||
| 3 | B (mg/L) | 1.07 | 84.89 | 0.0043 |
| cold: PCS | Boron flux (g/yr) | 4.70 × 10⁷ | 1.03 × 10⁸ | 7.55 × 10⁵ |
| warm: NBS | δ11B (‰) | −4.40 | +6.50 | +9.85 |
| δ11B of total influx (‰) | +3.12 | |||
| residence time (years) | 9.28 × 10³ | |||
| 4 | B (mg/L) | 0.18 | 7.27 | 0.0043 |
| cold: NS | Boron flux (g/yr) | 7.82 × 10⁶ | 8.84 × 10⁶ | 7.55 × 10⁵ |
| warm: DCS | δ11B (‰) | −9.60 | +3.90 | +9.85 |
| δ11B of total influx (‰) | −1.90 | |||
| residence time (years) | 8.05 × 10⁴ | |||
Note: * Estimated spring and average creek flow from [16].
Disclaimer/Publisher’s Note: The statements, opinions and data contained in all publications are solely those of the individual author(s) and contributor(s) and not of MDPI and/or the editor(s). MDPI and/or the editor(s) disclaim responsibility for any injury to people or property resulting from any ideas, methods, instructions or products referred to in the content. |
© 2023 by the authors. Licensee MDPI, Basel, Switzerland. This article is an open access article distributed under the terms and conditions of the Creative Commons Attribution (CC BY) license (https://creativecommons.org/licenses/by/4.0/).
Share and Cite
MDPI and ACS Style
Han, M.; Rasbury, E.T.; Hemming, N.G.; Hemming, S.R.; Tomascak, P.B. The Boron Budget in Waters of the Mono Basin, California. Hydrology 2023, 10, 122. https://doi.org/10.3390/hydrology10060122
AMA Style
Han M, Rasbury ET, Hemming NG, Hemming SR, Tomascak PB. The Boron Budget in Waters of the Mono Basin, California. Hydrology. 2023; 10(6):122. https://doi.org/10.3390/hydrology10060122
Chicago/Turabian StyleHan, Mengqu, E. Troy Rasbury, N. Gary Hemming, Sidney R. Hemming, and Paul B. Tomascak. 2023. "The Boron Budget in Waters of the Mono Basin, California" Hydrology 10, no. 6: 122. https://doi.org/10.3390/hydrology10060122
Note that from the first issue of 2016, this journal uses article numbers instead of page numbers. See further details here.